Securitisation Data Report - sifma.org · 1.2 US and Australia Historical Issuance ... 7.4 Markit...
36
Association for Financial Markets in Europe www.afme.eu Prepared in partnership with Securitisation Data Report European Structured Finance Q4: 2017
Transcript of Securitisation Data Report - sifma.org · 1.2 US and Australia Historical Issuance ... 7.4 Markit...

Association for Financial Markets in Europe www.afme.eu Prepared in partnership with
Securitisation Data Report European Structured Finance Q4: 2017

Table of Contents
Securitisation Data Report Page 2
Table of Contents Table of Contents ......................................................................................................................................................................... 2 Market Highlights and Commentary ........................................................................................................................................... 4 Major upcoming regulatory, legislative and policy initiatives .................................................................................................. 4 1 Issuance ........................................................................................................................................................................................................ 7
1.1 Issuance European Historical Issuance .......................................................................................................................................................................................................... 7 1.2 US and Australia Historical Issuance ............................................................................................................................................................................................................... 7 1.3 European Issuance by Collateral ....................................................................................................................................................................................................................... 7 1.4 European Issuance by Retention ...................................................................................................................................................................................................................... 7 1.5 Australia Issuance by Collateral ........................................................................................................................................................................................................................ 7 1.6 US Issuance by Collateral ..................................................................................................................................................................................................................................... 7 1.7 Issuance by Country of Collateral ..................................................................................................................................................................................................................... 8 1.8 Issuance by Collateral Type and Country of Collateral: 4Q 2017 ......................................................................................................................................................... 8 1.9 European Issuance by Rating ............................................................................................................................................................................................................................. 9 1.10 Australia Issuance by Rating .............................................................................................................................................................................................................................. 9 1.11 US Issuance by Rating ........................................................................................................................................................................................................................................... 9 1.12 Securitisation Issuance by Deal Size: 4Q 2017 ......................................................................................................................................................................................... 10
2 Outstanding ................................................................................................................................................................................................ 11 2.1 European Outstandings by Collateral .......................................................................................................................................................................................................... 11 2.2 Australia Outstandings by Collateral ............................................................................................................................................................................................................ 11 2.3 US Outstandings by Collateral ......................................................................................................................................................................................................................... 11 2.4 Outstandings by Country of Collateral: 2015-2016 ................................................................................................................................................................................ 12 2.5 European Outstandings by Moody’s Investors Service Ratings ........................................................................................................................................................ 13 2.6 Australia Outstandings by Standard and Poor’s Ratings ...................................................................................................................................................................... 13 2.7 US Outstandings by Moody’s Investors Service Ratings ....................................................................................................................................................................... 13 2.8 Australian Outstandings by Vintage ............................................................................................................................................................................................................. 14 2.9 European Outstandings by Vintage .............................................................................................................................................................................................................. 14 2.10 European Outstandings by Country and Collateral: 3Q 2017 ............................................................................................................................................................ 15 4Q 2017 15
3 Credit Quality – Rating Changes ............................................................................................................................................................... 16 3.1 DBRS.......................................................................................................................................................................................................................................................................... 16 3.2 Fitch Ratings .......................................................................................................................................................................................................................................................... 16 3.3 Moody’s Investors Service ................................................................................................................................................................................................................................ 16 3.4 Standard & Poor’s ................................................................................................................................................................................................................................................ 16 3.5 DBRS - Europe ....................................................................................................................................................................................................................................................... 17 3.6 Fitch Ratings - Europe ........................................................................................................................................................................................................................................ 17 3.7 Moody’s Investors Service - Europe ............................................................................................................................................................................................................. 17 3.8 Standard & Poor’s - Europe .............................................................................................................................................................................................................................. 17 3.9 DBRS - US ................................................................................................................................................................................................................................................................ 18 3.10 Fitch Ratings - US ................................................................................................................................................................................................................................................. 18 3.11 Moody’s Investors Service - US ....................................................................................................................................................................................................................... 18 3.12 Standard & Poor’s - US ....................................................................................................................................................................................................................................... 18
4 CMBS Spreads ........................................................................................................................................................................................... 19 4.1 European 3-5 Yr AAA, AA, A CMBS Spreads (bps) .................................................................................................................................................................................. 19 4.2 European 3-5 Yr BBB CMBS Spreads (bps) ............................................................................................................................................................................................... 19 4.3 US 3 & 5 Yr AAA CMBS Spreads (bps) .......................................................................................................................................................................................................... 19 4.4 US 3 & 5 Yr BBB CMBS Spreads (bps) .......................................................................................................................................................................................................... 19
5 RMBS Spreads ........................................................................................................................................................................................... 20 5.1 European 3-5 Yr AAA RMBS Spreads (bps) ............................................................................................................................................................................................... 20 5.2 European 3-5 Yr BBB RMBS Spreads (bps) ............................................................................................................................................................................................... 20 5.3 UK 3-5 Yr AAA RMBS Spreads (bps) ............................................................................................................................................................................................................. 20 5.4 UK 3-5 Yr BBB RMBS Spreads (bps) ............................................................................................................................................................................................................. 20
6 ABS Spreads .............................................................................................................................................................................................. 21 6.1 European 1-4 Yr AAA ABS Spreads (bps) ................................................................................................................................................................................................... 21 6.2 European 1-4 Yr BBB Spreads (bps) ............................................................................................................................................................................................................ 21 6.3 US 3 Yr AAA ABS Spreads (bps) ..................................................................................................................................................................................................................... 21 6.4 US 3 Yr BBB - AA ABS Spreads (bps) ............................................................................................................................................................................................................ 21
7 RMBS Prices ............................................................................................................................................................................................... 22 7.1 European 3-5 Yr AAA RMBS Prices ............................................................................................................................................................................................................... 22 7.2 European 3 - 5 Yr BBB RMBS Prices ............................................................................................................................................................................................................. 22 7.3 UK 3-5 Yr AAA RMBS Prices............................................................................................................................................................................................................................. 22 7.4 Markit RMBS iBoxx .............................................................................................................................................................................................................................................. 22
8 CMBS and ABS Prices ............................................................................................................................................................................... 23 8.1 Pan-European 3-5 Yr AAA CMBS Prices ...................................................................................................................................................................................................... 23 8.2 Pan-European 3-5 Yr BBB CMBS Prices ...................................................................................................................................................................................................... 23 8.3 Pan-European 1-4 AAA ABS Prices ............................................................................................................................................................................................................... 23
9 Indices Data ................................................................................................................................................................................................ 24 9.1 Securitised Index Option-Adjusted Spreads (bps) .................................................................................................................................................................................. 24

Table of Contents
Securitisation Data Report Page 3
9.2 Barclays PanEurope Fixed and Floating Prices ........................................................................................................................................................................................ 24 9.3 Australia AAA (tranche margin for WAL >1.9 & 2.1 yrs) (bps) .......................................................................................................................................................... 24 9.4 Australia AA (tranche margin for WAL >4.75 & 5.3 yrs) (bps) .......................................................................................................................................................... 24 9.5 CMBX 6 AAA Prices.............................................................................................................................................................................................................................................. 24
10 Total Return Benchmark Data ................................................................................................................................................................... 25 10.1 European Total Return ...................................................................................................................................................................................................................................... 25 10.2 UK Total Return .................................................................................................................................................................................................................................................... 25 10.3 Europe ex UK RMBS AAA .................................................................................................................................................................................................................................. 25
11 Asset-Backed Commercial Paper .............................................................................................................................................................. 26 11.1 European ABCP Historical Issuance ............................................................................................................................................................................................................. 26 11.2 European ABCP Issuance by Nationality of Issuer .................................................................................................................................................................................. 26 11.3 European ABCP Issuance by Programme Type ........................................................................................................................................................................................ 26 11.4 ABCP Outstandings by Nationality of Issuer ............................................................................................................................................................................................. 26 11.5 European ABCP Outstandings by Programme Type .............................................................................................................................................................................. 27 11.6 US ABCP Outstandings by Programme Type ............................................................................................................................................................................................. 27 11.7 US ABCP to AA Non-financial CP Spread ..................................................................................................................................................................................................... 27
12 Global Comparative Data ........................................................................................................................................................................... 28 12.1 Global High Grade Corporate Bond Issuance ............................................................................................................................................................................................ 28 12.2 Global Government Bond Issuance ............................................................................................................................................................................................................... 28
Summary of the Methodologies Adopted for this Report ....................................................................................................... 29 Annex ........................................................................................................................................................................................... 35

Table of Contents
Securitisation Data Report Page 4
European Securitisation Issuance (EUR mn)
Sources: AFME/SIFMA Members, AFME, Bloomberg, Dealogic, Thomson Reuters, SIFMA
“In Q4 2017, EUR 73.1 billion of securitised product was issued in Europe, an increase of 48.7% from Q3 2017 and an increase of 21.5% from Q4 2016.” European Securitisation Placed Issuance
Sources: Bloomberg, AFME & SIFMA Member Firms, Dealogic, AFME, SIFMA
Market Highlights and Commentary Market Environment Economic conditions According to Eurostat, GDP rose 0.6% quarter-over-quarter (QoQ) in the Euro zone (EU19) and the EU28 during the fourth quarter of 2017. The unemployment rate stood at 8.7% (EU19) and 7.3% (EU28) as of the end of December 2017, the lowest rate recorded since January 2009 (EU19) and October 2008 (EU28).
Term Issuance and Outstanding Volumes In Q4 2017, EUR 73.1 billion of securitised product was issued in Europe, an increase of 48.7% from Q3 2017 and an increase of 21.5% from Q4 2016. Of the EUR 73.1 billion issued, EUR 31.6 billion was placed, representing 43.2% of issuance, compared to the 47.3% of issuance in Q3 2017 and the 52.0% of issuance in Q4 2016.
CLO refinancing (“refis”) activity continued in the fourth quarter of 2017, resulting in the asset class leading EUR volumes among placed asset classes in Q4 2017. According to Bank of America-Merrill Lynch, a little over half (55.6%) of all CLO issues in 2017 were in the form of a refi or reset.
Outstanding volumes rose slightly to EUR 1.22 trillion outstanding at the end of Q4 2017, an increase of 1.3% QoQ but a decline of 4.3% YoY.
Credit Quality In Europe, upgrades outpaced downgrades in Q4 2017, with upgrades concentrated in European CMBS and prime RMBS.
ABCP Trends European asset backed commercial paper (ABCP) issuance was EUR 75.0 billion in Q4 2017, an increase of 11.6% QoQ (from €67.2 billion in Q3 2017) and a 20.3% decline YoY (from €94.1 billion in Q4 2016). Multiseller conduits continue to dominate as the largest category of issuer in the ABCP market, particularly from France. European ABCP outstandings increased slightly from the previous quarter, ending the fourth quarter at EUR 16.7 billion, up by 6.5% from Q3 2017.
Major upcoming regulatory, legislative and policy initiatives The STS framework
The STS Regulation, establishing the “Simple Transparent and Standardised” (STS) securitisation framework, and the related CRR Amendment, which form the new STS Securitisation Package, have been published in the Official Journal of the EU on 28 December 2017. Both texts entered into force on 18 January 2018, however, the date of application of both the STS Regulation and CRR Amendment is 1 January 2019. Attention has turned now to the implementation and development of the related secondary legislation, including technical standards and guidelines.
0%
10%
20%
30%
40%
50%
60%
70%
80%
90%
100%
-
5
10
15
20
25
30
35
Jan-17 Apr-17 Jul-17 Oct-17
PlacedRetained% Retained (Trailing 12 Month) (RHS)
PanEuropean CLO43%
UK Other14%
UK RMBS7%
German Auto5%
Other31%

Market Highlights and Commentary
Securitisation Data Report Page 5
“The STS Regulation (…) and the related CRR Amendment (…) have been published in the Official Journal of the EU on 28 December 2017. Both texts entered into force on 18 January 2018, however, the date of application of both the STS Regulation and CRR Amendment is 1 January 2019”
EBA and ESMA Consultations on the Level 2 legislation
In December 2017, the EBA and ESMA published five consultations on key parts of the recently agreed STS Securitisation reform. The consultations included:
EBA draft RTS on risk retention for securitisation transactions. The draft regulatory technical standards are setting the requirements for originators, sponsors and original lenders related to risk retention. The RTS will replace the current Commission Delegated Regulation on risk retention.
EBA draft RTS on the homogeneity of underlying exposures in securitisation. The RTS outline the criteria for the underlying exposures in securitisation in order to be deemed homogeneous. The RTS are applicable to both asset-backed commercial paper (ABCP) and to term securitisations. The issue of homogeneity will likely remain a challenging area.
The EBA consultations closed on 15 March 2019. AFME responded to both consultation papers.
ESMA draft RTS third-party firms providing STS verification services, which specifies the information to be provided to the competent authorities by companies applying for the authorisation to become a third party securtisation verification service.
ESMA draft RTS and ITS on disclosure requirements, operational standards, and access conditions, which covers the securitisation disclosure requirements, operational standards for handling disclosures, and the terms and conditions of access for users of securitisation disclosures.
ESMA draft RTS/ITS technical standards on content and format of the STS notification, which specifies the information that the originator, sponsor and SSPE are required to provide in order to comply with their STS notification requirements.
The ESMA consultations closed on 19 March 2019. AFME responded to the Consultation Papers on Disclosures and on STS Notification.
Commission’s proposals on EMIR Refit
The European Commission’s proposals under the European Market Infrastructure Regulation (EMIR)—which require swaps entered by securitisation special purpose entities (SSPEs) to post initial and variation margin and to be admitted to clearing— are now being discussed in the European Parliament, where the most recent drafts show weakening support. AFME remains engaged.
EBA significant risk transfer consultation
On 19 December 2017 AFME responded to the EBA public consultation on its discussion paper on the significant risk transfer in securitisation. The paper put forward proposals to strengthen the regulation and supervision framework of significant risk transfer and sought stakeholders’ views on how to further harmonise the regulation and supervision of risk transfer through securitisations. The EBA's proposals are based on the

Major upcoming regulatory, legislative and policy initiatives
Securitisation Data Report Page 6
newly agreed European securitisation legislation. A further round of consultations on this subject is expected later in 2018.
Review of European Supervisory Authorities
The final AFME response to the Commission’s proposal on the ESAs review was submitted on 23 January via the European Commission’s Better Regulation portal. AFME abstained from commenting on the issue of whether the ESAs shall have the powers to effective coordinate the NCAs’ supervision of the outsourcing, delegation and risk transfer arrangements in third countries both ex-ante and on an on-going basis (Article 31a of the EC’s proposal).
Libor and benchmark rates
Following announcements on the phasing-out of Libor by 2021, AFME continues to be engaged in a transition to an alternative base rate after that date. Pending a final determination on what the replacement for Libor will be, AFME is working with several other trade associations to coordinate the industry’s efforts on Libor replacement. We also work on draft Model Wording to create uniform transitional language for new securitisation transactions.
Liquidity Coverage Ratio (LCR)
On the 24 January 2018, the EC opened a short consultation on the draft Delegated Act on the LCR. With regard to securitisation, the proposal aligns the LCR eligibility criteria with the STS requirements, however it does not promote the STS to Level 2A. STS securitisations remain as Level 2B assets. In our response, AFME stated that all STS securitisations, whether term or ABCP, should be classified as Level 2A assets with maximum allocations and minimum haircuts equivalent to the current treatment of covered bonds of Credit Quality Step (CQS) 2. The EC is expected to publish the final text of the LCR revision at the end of Q1 or in Q2 2018.

Issuance
Securitisation Data Report Page 7
1 Issuance € BILLIONS
1.1 Issuance European Historical Issuance 1.2 US and Australia Historical Issuance
Sources: Bloomberg, Citigroup, Dealogic, Bank of America-Merrill Lynch, Deutsche Bank, JP Morgan, Macquarie, Thomson Reuters, Unicredit, AFME, SIFMA
1.3 European Issuance by Collateral
1.4 European Issuance by Retention
1.5 Australia Issuance by Collateral
1.6 US Issuance by Collateral
Sources: Bank of America Merrill-Lynch, Bloomberg, Citigroup, Dealogic, Deutsche Bank, JP Morgan, Macquarie, Thomson Reuters, Unicredit, AFME, SIFMA
Q1 Q2 Q3 Q4 TOTAL US AU2008 47.3 194.7 157.5 419.2 818.7 2008 967.3 6.62009 131.0 83.8 113.3 95.8 423.9 2009 1,447.2 9.72010 75.5 32.6 110.7 159.2 378.0 2010 1,245.9 15.52011 115.2 67.3 57.1 137.2 376.8 2011 1,068.9 20.42012 64.3 67.7 62.0 63.9 257.8 2012 1,609.0 14.82013 32.8 53.2 38.4 56.4 180.8 2013 1,565.1 22.42014 20.0 99.5 37.8 59.8 217.1 2014 1,190.9 22.12015 35.7 50.3 57.8 72.8 216.6 2015 1,744.5 19.92016 57.0 75.8 46.6 60.1 239.6 2016 1,860.4 16.42017 39.8 73.0 49.1 73.1 235.0 2017 1,712.5 29.2
2017:Q1 2017:Q2 2017:Q3 2017:Q4 TOTAL 2016:Q1 2016:Q2 2016:Q3 2016:Q4 TOTALABS 7.7 10.0 12.4 22.6 52.7 10.5 28.5 13.7 18.2 70.9CDO/CLO 6.6 14.0 14.8 13.8 49.2 2.8 4.8 4.7 9.3 21.7CMBS 0.3 0.54 0.9 0.3 0.5 2.8 0.0 3.7RMBS 23.1 41.8 21.6 31.6 118.1 38.8 39.7 20.2 22.0 120.6SME 2.0 7.2 0.4 4.5 14.1 4.6 0.7 4.8 9.8 19.9WBS/PFI 0.0 1.6 0.5 0.8 2.9Total 39.8 73.0 49.1 73.1 235.0 57.0 75.8 46.6 60.1 239.6
2017:Q1 2017:Q2 2017:Q3 2017:Q4 TOTAL 2016:Q1 2016:Q2 2016:Q3 2016:Q4 TOTALPlaced 17.3 39.6 23.3 31.6 111.7 14.5 29.8 21.6 31.3 97.2Retained 22.5 33.5 25.9 41.5 123.3 42.5 46.0 25.0 28.8 142.4Total2 39.8 73.0 49.1 73.1 235.0 57.0 75.8 46.6 60.1 239.6
2017:Q1 2017:Q2 2017:Q3 2017:Q4 TOTAL 2016:Q1 2016:Q2 2016:Q3 2016:Q4 TOTALABS 2.4 0.3 1.0 0.8 4.6 0.6 1.7 0.0 0.7 3.0RMBS 5.1 6.1 6.3 6.6 24.1 2.3 2.6 2.1 5.9 13.0CMBS 0.3 0.1 0.4 0.3 0.2 0.5Total 7.5 6.4 7.7 7.6 29.2 2.9 4.3 2.4 6.8 16.4
2017:Q1 2017:Q2 2017:Q3 2017:Q4 TOTAL 2016:Q1 2016:Q2 2016:Q3 2016:Q4 TOTALABS 54.7 54.8 40.8 48.7 199.1 41.4 49.2 48.1 47.5 186.2CDO 17.9 36.8 23.0 21.3 99.1 6.9 16.7 23.3 60.8 107.7Agency MBS 326.3 280.7 311.2 305.1 1,223.3 251.2 322.7 402.9 439.8 1,416.6Non-Agency CMBS 14.4 20.2 23.5 25.6 83.7 17.5 10.2 17.6 25.5 70.8Non-Agency RMBS 26.3 34.4 20.9 25.7 107.4 13.2 19.5 25.2 21.2 79.1Total 439.6 426.9 419.5 426.5 1,712.5 330.2 418.3 517.1 594.8 1,860.4

Issuance
Securitisation Data Report Page 8
€ BILLIONS
1.7 Issuance by Country of Collateral
1.8 Issuance by Collateral Type and Country of Collateral: 4Q 2017
Sources: Bloomberg, Citigroup, Dealogic, Bank of America-Merrill Lynch, Deutsche Bank, JP Morgan, Macquarie, Thomson Reuters, Unicredit, AFME, SIFMA
2017:Q1 2017:Q2 2017:Q3 2017:Q4 TOTAL 2016:Q1 2016:Q2 2016:Q3 2016:Q4 TOTALBelgium 11.7 0.6 12.3 3.6 3.6 Denmark 0.0 - France 8.6 12.6 13.9 1.8 36.9 8.2 10.2 2.7 21.0 Germany 0.5 3.4 3.6 5.4 12.9 2.2 5.8 4.4 5.2 17.6 Greece 0.0 0.6 0.7 1.3 Ireland 0.7 0.9 2.8 4.4 2.0 0.0 0.6 2.0 4.6 Italy 6.7 2.5 2.9 17.4 29.5 11.8 9.1 9.2 11.2 41.3 Netherlands 6.6 3.2 6.0 15.9 9.6 17.4 3.4 3.1 33.4 Portugal 0.3 0.8 1.1 0.6 0.7 1.3 Spain 4.4 2.7 3.0 15.5 25.6 17.3 3.6 4.2 8.9 34.0 UK 4.8 21.3 7.5 13.6 47.2 11.0 20.6 8.2 15.3 55.1 Other EU 0.6 0.2 0.7 1.5 0.2 0.2 0.4 0.6 Other Europe 0.3 0.1 0.6 1.3 2.3 0.1 1.6 0.0 0.2 2.0 PanEurope 6.6 14.2 10.8 13.8 45.4 2.6 5.2 4.7 9.6 22.1 Multinational 0.0 0.0 - European Total 39.8 73.0 49.1 73.1 235.0 57.0 75.3 46.5 60.0 238.9 Australia Total 7.5 6.4 7.7 7.6 29.2 2.9 4.3 2.4 6.8 16.4 US Total 439.6 426.9 419.5 426.5 1,712.5 330.2 418.3 517.1 594.8 1,860.4
ABS CDO/CLO CMBS RMBS SME WBS/PFI TOTALBelgium - Denmark - France 1.7 0.1 1.8 Germany 2.9 2.5 5.4 Greece - Ireland 0.0 2.8 2.8 Italy 7.1 0.1 9.4 0.8 17.4 Netherlands - Portugal 0.8 0.8 Spain 0.8 10.9 3.8 15.5 UK 8.0 0.0 0.4 5.2 13.6 Other EU 0.7 0.7 Other Europe 0.5 0.8 1.3 PanEurope 0.1 13.7 13.8 Multinational - European Total 22.6 13.8 0.5 31.6 4.5 - 73.1
ABS CDOAGENCY
MBS
NON-AGENCY
CMBS
NON-AGENCY
RMBS TOTALAustralia Total 0.8 0.1 6.6 7.6 US Total 48.7 21.3 305.1 25.6 25.7 426.5

Issuance
Securitisation Data Report Page 9
€ BILLIONS
1.9 European Issuance by Rating
1.10 Australia Issuance by Rating
1.11 US Issuance by Rating
Sources: Bank of America-Merrill Lynch, Bloomberg, Citigroup, Dealogic, Deutsche Bank, JP Morgan, Macquarie, Thomson Reuters, Unicredit, AFME, SIFMA
2017:Q1 2017:Q2 2017:Q3 2017:Q4 TOTAL 2016:Q1 2016:Q2 2016:Q3 2016:Q4 TOTALAAA 20.3 50.1 23.5 19.3 113.3 21.7 47.7 18.6 26.2 114.1 AA 8.6 6.7 13.5 23.3 52.3 4.5 7.2 5.2 9.8 26.7 A 4.6 3.9 4.9 13.7 27.1 20.0 6.0 9.6 9.2 44.8 BBB & Below 1.8 3.1 2.5 4.8 12.3 4.7 3.0 3.2 3.8 14.7 Not Rated 4.4 9.1 4.7 11.8 30.1 6.2 11.9 10.0 11.1 39.3 European Total2 39.8 73.0 49.1 73.1 235.0 57.0 75.8 46.6 60.1 239.6
2017:Q1 2017:Q2 2017:Q3 2017:Q4 TOTAL 2016:Q1 2016:Q2 2016:Q3 2016:Q4 TOTALAAA 6.6 6.1 7.0 6.5 26.2 2.3 3.7 2.2 6.0 14.2 AA 0.4 0.1 0.3 0.5 1.4 0.4 0.3 0.1 0.4 1.2 A 0.2 0.1 0.1 0.2 0.6 0.1 0.1 0.1 0.1 0.3 BBB & Below 0.2 0.0 0.1 0.2 0.6 0.0 0.1 0.1 0.1 0.3 Not Rated 0.1 0.0 0.1 0.1 0.4 0.1 0.2 0.0 0.1 0.4 US Total 7.5 6.4 7.7 7.6 29.2 2.9 4.3 2.4 6.8 16.4
2017:Q1 2017:Q2 2017:Q3 2017:Q4 TOTAL 2016:Q1 2016:Q2 2016:Q3 2016:Q4 TOTALAAA 56.2 73.5 57.6 61.3 248.6 35.3 44.2 56.6 73.1 209.4 AA 7.2 10.6 8.4 8.5 34.7 4.8 4.3 5.4 11.0 25.5 A 7.1 11.0 7.0 8.1 33.3 5.6 6.0 6.3 12.5 30.5 BBB & Below 9.1 15.0 12.4 11.1 47.6 8.2 10.6 8.6 15.3 42.6 Not Rated 33.8 36.1 22.9 32.4 125.1 25.1 30.4 37.3 43.0 135.7 Agency MBS 326.3 280.7 311.2 305.1 1,223.3 251.2 322.7 402.9 439.8 1,416.6 US Total 439.6 426.9 419.5 426.5 1,712.5 330.2 418.3 517.1 594.8 1,860.4
Issuance
Securitisation Data Report Page 10
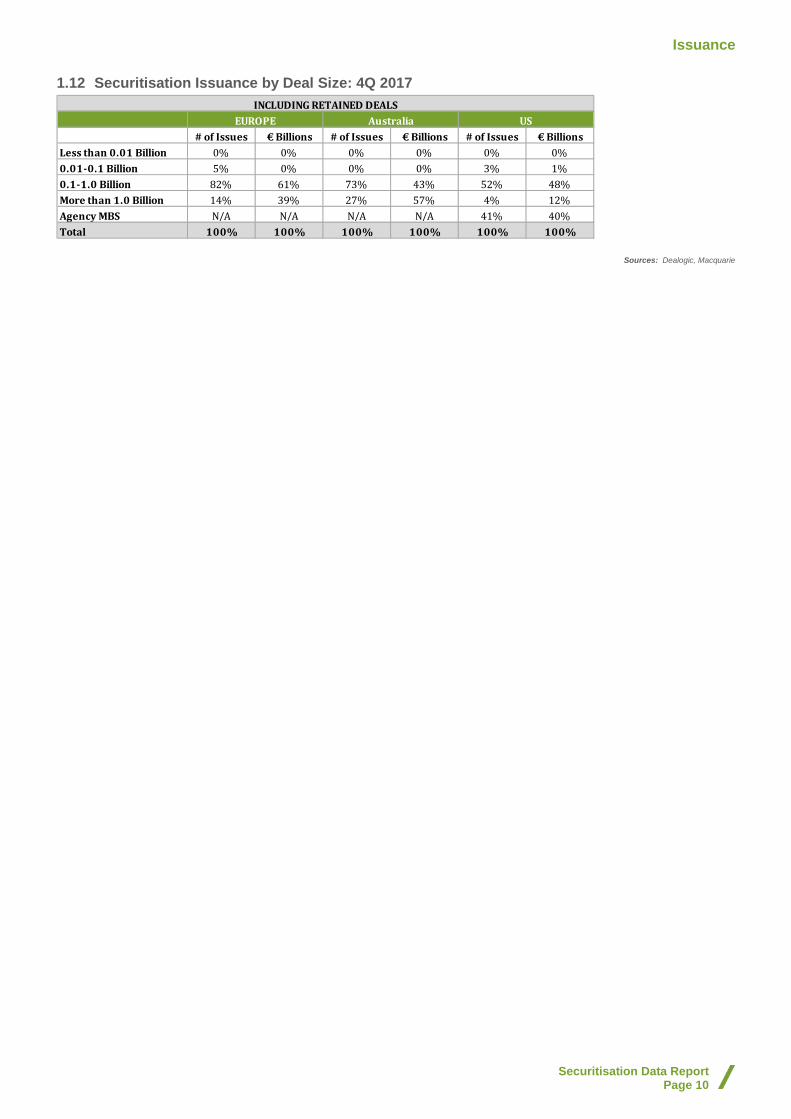
1.12 Securitisation Issuance by Deal Size: 4Q 2017
Sources: Dealogic, Macquarie
# of Issues € Billions # of Issues € Billions # of Issues € BillionsLess than 0.01 Billion 0% 0% 0% 0% 0% 0%0.01-0.1 Billion 5% 0% 0% 0% 3% 1%0.1-1.0 Billion 82% 61% 73% 43% 52% 48%More than 1.0 Billion 14% 39% 27% 57% 4% 12%Agency MBS N/A N/A N/A N/A 41% 40%Total 100% 100% 100% 100% 100% 100%
INCLUDING RETAINED DEALSEUROPE Australia US
Outstanding
Securitisation Data Report Page 11
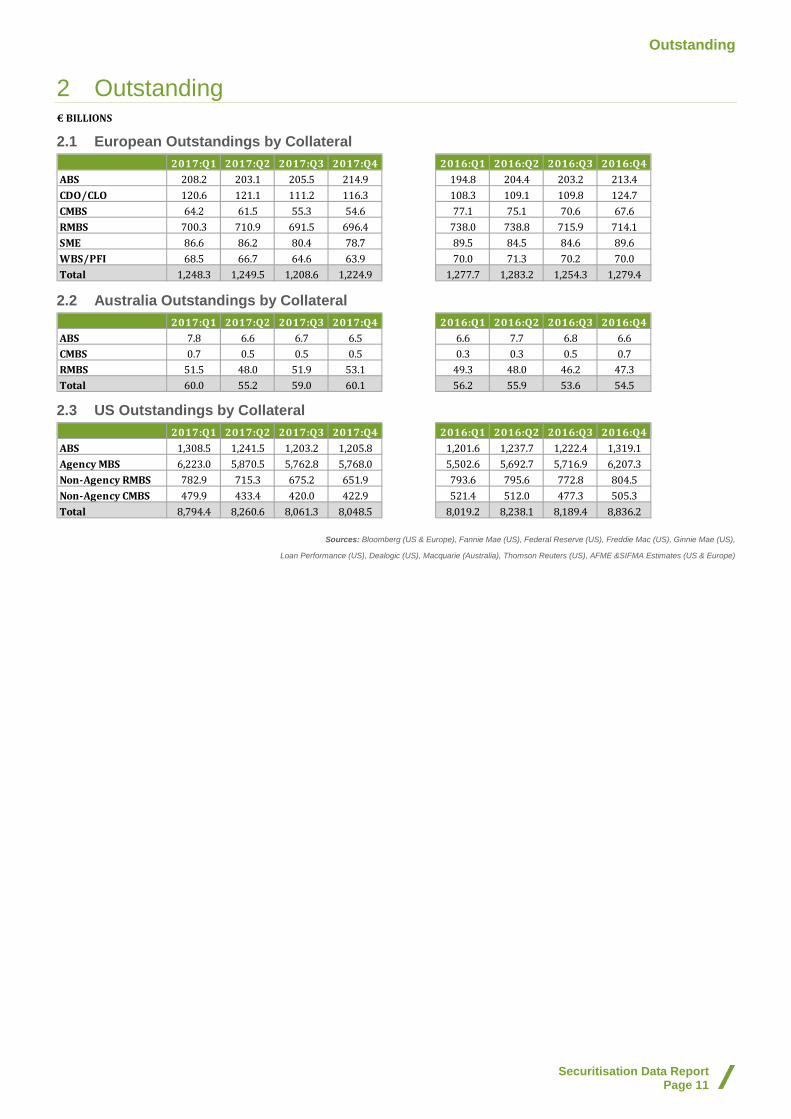
2 Outstanding € BILLIONS
2.1 European Outstandings by Collateral
2.2 Australia Outstandings by Collateral
2.3 US Outstandings by Collateral
Sources: Bloomberg (US & Europe), Fannie Mae (US), Federal Reserve (US), Freddie Mac (US), Ginnie Mae (US),
Loan Performance (US), Dealogic (US), Macquarie (Australia), Thomson Reuters (US), AFME &SIFMA Estimates (US & Europe)
2017:Q1 2017:Q2 2017:Q3 2017:Q4 2016:Q1 2016:Q2 2016:Q3 2016:Q4ABS 208.2 203.1 205.5 214.9 194.8 204.4 203.2 213.4CDO/CLO 120.6 121.1 111.2 116.3 108.3 109.1 109.8 124.7CMBS 64.2 61.5 55.3 54.6 77.1 75.1 70.6 67.6RMBS 700.3 710.9 691.5 696.4 738.0 738.8 715.9 714.1SME 86.6 86.2 80.4 78.7 89.5 84.5 84.6 89.6WBS/PFI 68.5 66.7 64.6 63.9 70.0 71.3 70.2 70.0Total 1,248.3 1,249.5 1,208.6 1,224.9 1,277.7 1,283.2 1,254.3 1,279.4
2017:Q1 2017:Q2 2017:Q3 2017:Q4 2016:Q1 2016:Q2 2016:Q3 2016:Q4ABS 7.8 6.6 6.7 6.5 6.6 7.7 6.8 6.6CMBS 0.7 0.5 0.5 0.5 0.3 0.3 0.5 0.7RMBS 51.5 48.0 51.9 53.1 49.3 48.0 46.2 47.3Total 60.0 55.2 59.0 60.1 56.2 55.9 53.6 54.5
2017:Q1 2017:Q2 2017:Q3 2017:Q4 2016:Q1 2016:Q2 2016:Q3 2016:Q4ABS 1,308.5 1,241.5 1,203.2 1,205.8 1,201.6 1,237.7 1,222.4 1,319.1Agency MBS 6,223.0 5,870.5 5,762.8 5,768.0 5,502.6 5,692.7 5,716.9 6,207.3Non-Agency RMBS 782.9 715.3 675.2 651.9 793.6 795.6 772.8 804.5Non-Agency CMBS 479.9 433.4 420.0 422.9 521.4 512.0 477.3 505.3Total 8,794.4 8,260.6 8,061.3 8,048.5 8,019.2 8,238.1 8,189.4 8,836.2

Outstanding
Securitisation Data Report Page 12
€ BILLIONS
2.4 Outstandings by Country of Collateral: 2015-2016
2017
Sources: Bloomberg (US & Europe), Fannie Mae (US), Federal Reserve (US), Freddie Mac (US), Ginnie Mae (US),
Loan Performance (US), Dealogic (US), Macquarie (Australia), Thomson Reuters (US), AFME &SIFMA Estimates (US & Europe)
2016:Q1 2016:Q2 2016:Q3 2016:Q4 2015:Q1 2015:Q2 2015:Q3 2015:Q4Austria 2.1 2.0 1.9 1.9 2.2 1.9 1.8 2.1Belgium 64.5 66.6 65.2 62.1 69.8 67.7 65.8 65.7Finland 1.1 1.0 0.9 1.4 1.1 1.0 1.0 1.2France 76.7 81.2 85.0 85.4 70.3 70.4 69.6 78.6Germany 84.2 83.2 81.7 85.1 71.2 68.5 88.7 88.1Greece 20.4 20.4 19.0 19.6 24.2 24.2 21.4 20.6Ireland 33.4 32.5 30.9 30.8 35.9 34.7 33.5 32.0Italy 145.8 140.2 141.7 145.5 157.5 158.3 155.2 150.7Netherlands 207.3 216.0 212.7 202.3 247.1 243.7 240.4 222.3Portugal 29.8 29.2 29.0 28.8 34.5 34.0 32.1 32.1Russia 1.5 1.7 1.4 1.5 0.9 1.2 1.5 1.4Spain 171.0 169.8 166.2 168.9 170.4 170.5 163.7 161.8Turkey 1.4 1.2 1.2 1.1 1.6 1.5 1.5 1.5UK 326.7 325.7 305.1 318.3 375.5 366.8 349.0 336.3Other 4.8 5.5 5.2 5.1 4.4 4.7 4.4 5.0PanEurope 66.3 69.4 72.2 90.0 52.3 55.7 56.1 61.5Multinational 40.6 37.9 34.9 31.8 54.3 50.6 44.7 41.7European Total 1,277.7 1,283.2 1,254.3 1,279.4 1,373.1 1,355.4 1,330.4 1,302.6Australia Total 56.2 55.9 53.6 54.5 65.4 62.7 56.4 57.8US Total 8,019.2 8,238.1 8,189.4 8,836.2 8,384.7 8,137.6 8,138.0 8,397.7
2017:Q1 2017:Q2 2017:Q3 2017:Q4Austria 1.9 1.8 1.8 1.7Belgium 60.8 66.4 65.8 64.5Finland 1.3 1.2 1.1 1.6France 85.0 95.8 102.5 100.9Germany 76.0 73.6 73.7 76.1Greece 19.3 19.2 17.5 18.6Ireland 30.3 27.4 26.3 28.6Italy 144.8 136.9 133.0 142.0Netherlands 201.1 194.4 179.0 173.1Portugal 27.7 26.6 25.9 25.8Russia 1.4 1.4 1.1 1.9Spain 168.6 165.2 161.1 165.9Turkey 1.1 1.1 1.1 1.3UK 306.7 315.6 303.8 304.8Other 5.6 5.1 5.4 5.6PanEurope 89.7 93.6 88.6 94.1Multinational 27.1 24.4 20.8 18.5European Total 1,248.3 1,249.5 1,208.6 1,224.9Australia Total 60.0 55.2 59.0 60.1US Total 8,794.4 8,260.6 8,061.3 8,048.5
Outstanding
Securitisation Data Report Page 13
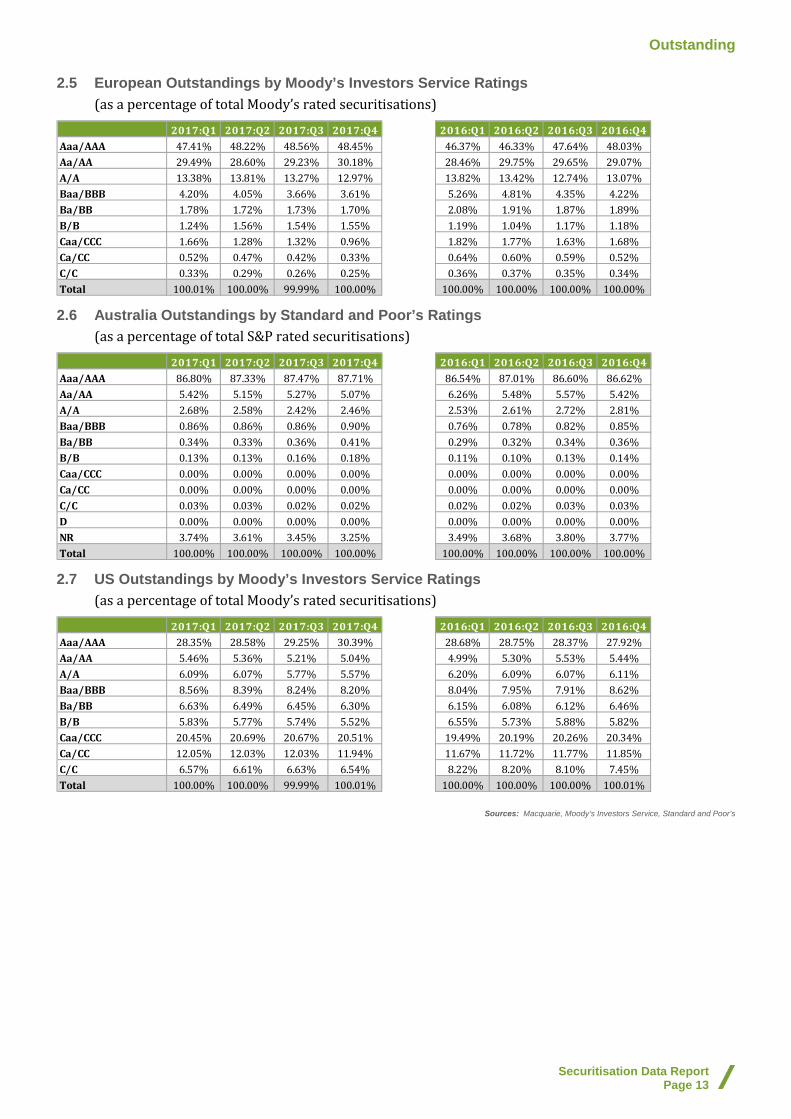
2.5 European Outstandings by Moody’s Investors Service Ratings (as a percentage of total Moody’s rated securitisations)
2.6 Australia Outstandings by Standard and Poor’s Ratings
(as a percentage of total S&P rated securitisations)
2.7 US Outstandings by Moody’s Investors Service Ratings
(as a percentage of total Moody’s rated securitisations)
Sources: Macquarie, Moody’s Investors Service, Standard and Poor’s
2017:Q1 2017:Q2 2017:Q3 2017:Q4 2016:Q1 2016:Q2 2016:Q3 2016:Q4Aaa/AAA 47.41% 48.22% 48.56% 48.45% 46.37% 46.33% 47.64% 48.03%Aa/AA 29.49% 28.60% 29.23% 30.18% 28.46% 29.75% 29.65% 29.07%A/A 13.38% 13.81% 13.27% 12.97% 13.82% 13.42% 12.74% 13.07%Baa/BBB 4.20% 4.05% 3.66% 3.61% 5.26% 4.81% 4.35% 4.22%Ba/BB 1.78% 1.72% 1.73% 1.70% 2.08% 1.91% 1.87% 1.89%B/B 1.24% 1.56% 1.54% 1.55% 1.19% 1.04% 1.17% 1.18%Caa/CCC 1.66% 1.28% 1.32% 0.96% 1.82% 1.77% 1.63% 1.68%Ca/CC 0.52% 0.47% 0.42% 0.33% 0.64% 0.60% 0.59% 0.52%C/C 0.33% 0.29% 0.26% 0.25% 0.36% 0.37% 0.35% 0.34%Total 100.01% 100.00% 99.99% 100.00% 100.00% 100.00% 100.00% 100.00%
2017:Q1 2017:Q2 2017:Q3 2017:Q4 2016:Q1 2016:Q2 2016:Q3 2016:Q4Aaa/AAA 86.80% 87.33% 87.47% 87.71% 86.54% 87.01% 86.60% 86.62%Aa/AA 5.42% 5.15% 5.27% 5.07% 6.26% 5.48% 5.57% 5.42%A/A 2.68% 2.58% 2.42% 2.46% 2.53% 2.61% 2.72% 2.81%Baa/BBB 0.86% 0.86% 0.86% 0.90% 0.76% 0.78% 0.82% 0.85%Ba/BB 0.34% 0.33% 0.36% 0.41% 0.29% 0.32% 0.34% 0.36%B/B 0.13% 0.13% 0.16% 0.18% 0.11% 0.10% 0.13% 0.14%Caa/CCC 0.00% 0.00% 0.00% 0.00% 0.00% 0.00% 0.00% 0.00%Ca/CC 0.00% 0.00% 0.00% 0.00% 0.00% 0.00% 0.00% 0.00%C/C 0.03% 0.03% 0.02% 0.02% 0.02% 0.02% 0.03% 0.03%D 0.00% 0.00% 0.00% 0.00% 0.00% 0.00% 0.00% 0.00%NR 3.74% 3.61% 3.45% 3.25% 3.49% 3.68% 3.80% 3.77%Total 100.00% 100.00% 100.00% 100.00% 100.00% 100.00% 100.00% 100.00%
2017:Q1 2017:Q2 2017:Q3 2017:Q4 2016:Q1 2016:Q2 2016:Q3 2016:Q4Aaa/AAA 28.35% 28.58% 29.25% 30.39% 28.68% 28.75% 28.37% 27.92%Aa/AA 5.46% 5.36% 5.21% 5.04% 4.99% 5.30% 5.53% 5.44%A/A 6.09% 6.07% 5.77% 5.57% 6.20% 6.09% 6.07% 6.11%Baa/BBB 8.56% 8.39% 8.24% 8.20% 8.04% 7.95% 7.91% 8.62%Ba/BB 6.63% 6.49% 6.45% 6.30% 6.15% 6.08% 6.12% 6.46%B/B 5.83% 5.77% 5.74% 5.52% 6.55% 5.73% 5.88% 5.82%Caa/CCC 20.45% 20.69% 20.67% 20.51% 19.49% 20.19% 20.26% 20.34%Ca/CC 12.05% 12.03% 12.03% 11.94% 11.67% 11.72% 11.77% 11.85%C/C 6.57% 6.61% 6.63% 6.54% 8.22% 8.20% 8.10% 7.45%Total 100.00% 100.00% 99.99% 100.01% 100.00% 100.00% 100.00% 100.01%
Outstanding
Securitisation Data Report Page 14
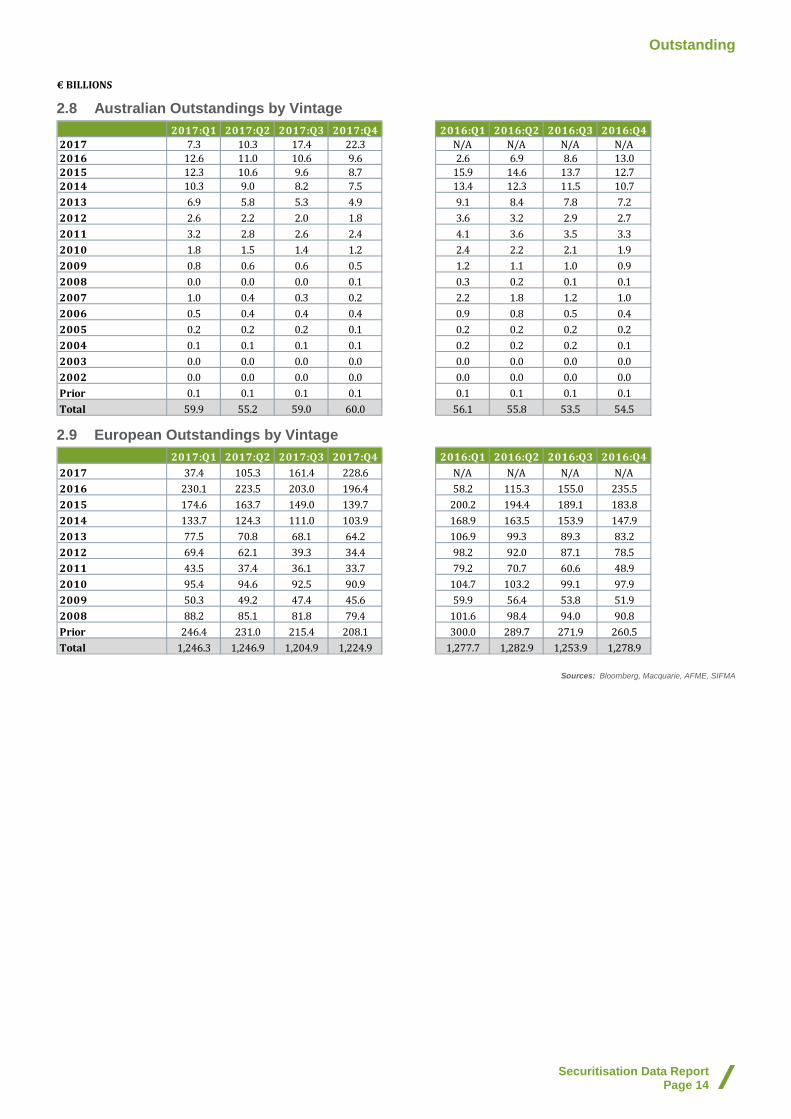
€ BILLIONS
2.8 Australian Outstandings by Vintage
2.9 European Outstandings by Vintage
Sources: Bloomberg, Macquarie, AFME, SIFMA
2017:Q1 2017:Q2 2017:Q3 2017:Q4 2016:Q1 2016:Q2 2016:Q3 2016:Q42017 7.3 10.3 17.4 22.3 N/A N/A N/A N/A2016 12.6 11.0 10.6 9.6 2.6 6.9 8.6 13.02015 12.3 10.6 9.6 8.7 15.9 14.6 13.7 12.72014 10.3 9.0 8.2 7.5 13.4 12.3 11.5 10.72013 6.9 5.8 5.3 4.9 9.1 8.4 7.8 7.22012 2.6 2.2 2.0 1.8 3.6 3.2 2.9 2.72011 3.2 2.8 2.6 2.4 4.1 3.6 3.5 3.32010 1.8 1.5 1.4 1.2 2.4 2.2 2.1 1.92009 0.8 0.6 0.6 0.5 1.2 1.1 1.0 0.92008 0.0 0.0 0.0 0.1 0.3 0.2 0.1 0.12007 1.0 0.4 0.3 0.2 2.2 1.8 1.2 1.02006 0.5 0.4 0.4 0.4 0.9 0.8 0.5 0.42005 0.2 0.2 0.2 0.1 0.2 0.2 0.2 0.22004 0.1 0.1 0.1 0.1 0.2 0.2 0.2 0.12003 0.0 0.0 0.0 0.0 0.0 0.0 0.0 0.02002 0.0 0.0 0.0 0.0 0.0 0.0 0.0 0.0Prior 0.1 0.1 0.1 0.1 0.1 0.1 0.1 0.1Total 59.9 55.2 59.0 60.0 56.1 55.8 53.5 54.5
2017:Q1 2017:Q2 2017:Q3 2017:Q4 2016:Q1 2016:Q2 2016:Q3 2016:Q42017 37.4 105.3 161.4 228.6 N/A N/A N/A N/A2016 230.1 223.5 203.0 196.4 58.2 115.3 155.0 235.52015 174.6 163.7 149.0 139.7 200.2 194.4 189.1 183.82014 133.7 124.3 111.0 103.9 168.9 163.5 153.9 147.92013 77.5 70.8 68.1 64.2 106.9 99.3 89.3 83.22012 69.4 62.1 39.3 34.4 98.2 92.0 87.1 78.52011 43.5 37.4 36.1 33.7 79.2 70.7 60.6 48.92010 95.4 94.6 92.5 90.9 104.7 103.2 99.1 97.92009 50.3 49.2 47.4 45.6 59.9 56.4 53.8 51.92008 88.2 85.1 81.8 79.4 101.6 98.4 94.0 90.8Prior 246.4 231.0 215.4 208.1 300.0 289.7 271.9 260.5Total 1,246.3 1,246.9 1,204.9 1,224.9 1,277.7 1,282.9 1,253.9 1,278.9
Outstanding
Securitisation Data Report Page 15
€ BILLIONS
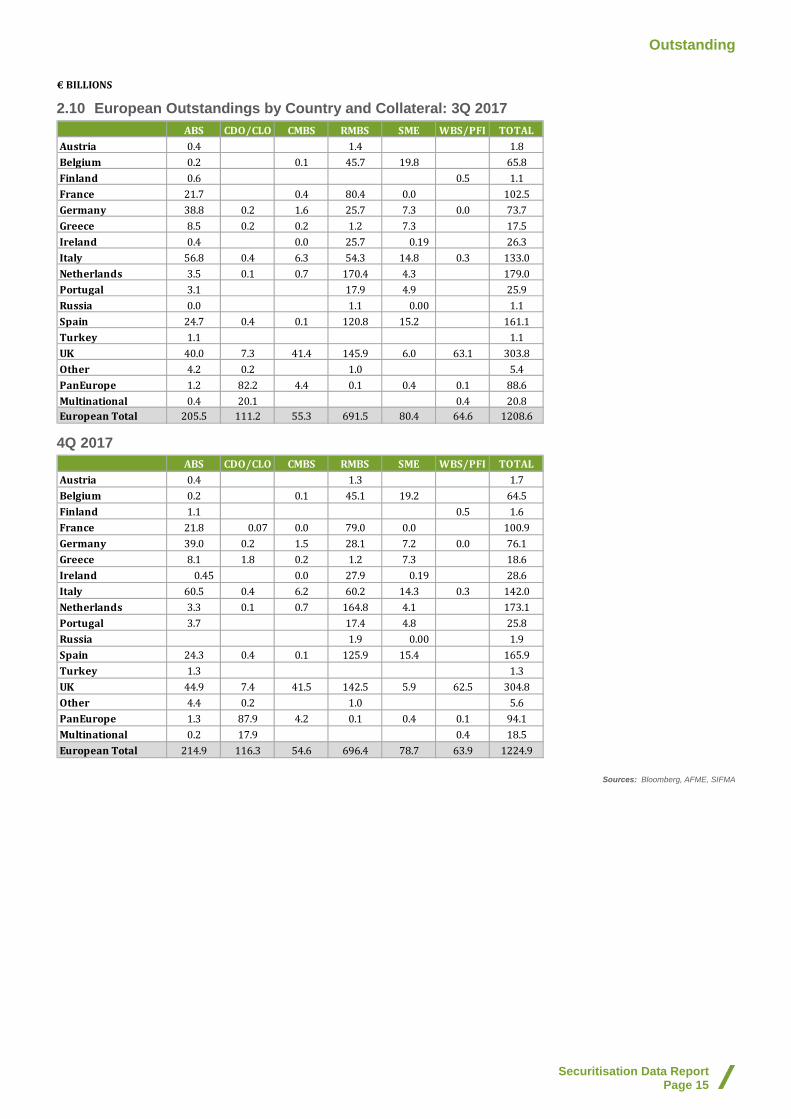
2.10 European Outstandings by Country and Collateral: 3Q 2017
4Q 2017
Sources: Bloomberg, AFME, SIFMA
ABS CDO/CLO CMBS RMBS SME WBS/PFI TOTALAustria 0.4 1.4 1.8Belgium 0.2 0.1 45.7 19.8 65.8Finland 0.6 0.5 1.1France 21.7 0.4 80.4 0.0 102.5Germany 38.8 0.2 1.6 25.7 7.3 0.0 73.7Greece 8.5 0.2 0.2 1.2 7.3 17.5Ireland 0.4 0.0 25.7 0.19 26.3Italy 56.8 0.4 6.3 54.3 14.8 0.3 133.0Netherlands 3.5 0.1 0.7 170.4 4.3 179.0Portugal 3.1 17.9 4.9 25.9Russia 0.0 1.1 0.00 1.1Spain 24.7 0.4 0.1 120.8 15.2 161.1Turkey 1.1 1.1UK 40.0 7.3 41.4 145.9 6.0 63.1 303.8Other 4.2 0.2 1.0 5.4PanEurope 1.2 82.2 4.4 0.1 0.4 0.1 88.6Multinational 0.4 20.1 0.4 20.8European Total 205.5 111.2 55.3 691.5 80.4 64.6 1208.6
ABS CDO/CLO CMBS RMBS SME WBS/PFI TOTALAustria 0.4 1.3 1.7Belgium 0.2 0.1 45.1 19.2 64.5Finland 1.1 0.5 1.6France 21.8 0.07 0.0 79.0 0.0 100.9Germany 39.0 0.2 1.5 28.1 7.2 0.0 76.1Greece 8.1 1.8 0.2 1.2 7.3 18.6Ireland 0.45 0.0 27.9 0.19 28.6Italy 60.5 0.4 6.2 60.2 14.3 0.3 142.0Netherlands 3.3 0.1 0.7 164.8 4.1 173.1Portugal 3.7 17.4 4.8 25.8Russia 1.9 0.00 1.9Spain 24.3 0.4 0.1 125.9 15.4 165.9Turkey 1.3 1.3UK 44.9 7.4 41.5 142.5 5.9 62.5 304.8Other 4.4 0.2 1.0 5.6PanEurope 1.3 87.9 4.2 0.1 0.4 0.1 94.1Multinational 0.2 17.9 0.4 18.5European Total 214.9 116.3 54.6 696.4 78.7 63.9 1224.9

Credit Quality – Rating Changes
Securitisation Data Report Page 16
3 Credit Quality – Rating Changes Upgrades/Downgrades by Country 3.1 DBRS
3.2 Fitch Ratings
3.3 Moody’s Investors Service
3.4 Standard & Poor’s
Sources: DBRS, Fitch Ratings, Moody’s Investors Service, Standard & Poor’s
2017:Q1 2017:Q2 2017:Q3 2017:Q4 TOTAL 2016:Q1 2016:Q2 2016:Q3 2016:Q4 TOTALFrance 0/0 2/0 11 / 0 7/0 20/0 0/0 1/0 1/0 2/0 4/0Germany 3/0 4/0 11 / 0 7/0 25/0 2/0 6/0 6/0 5/0 19/0Italy 4/3 30/4 18 / 1 14/0 66/8 9/0 14/1 14/1 9/2 46/4Netherlands 1/0 0/0 0 / 0 1/4 2/4 0/0 0/0 0/0 0/0 0/0Spain 0/1 23/4 1 / 0 5/0 29/5 3/1 41/3 41/3 2/0 87/7UK 0/0 0/1 0 / 0 19/3 19/4 0/0 2/1 2/1 0/0 4/2Multinational 2/11 6/3 4 / 0 7/0 19/14 2/0 6/0 6/0 7/0 21/0European Total 10/15 65/12 45 / 1 60/7 180/35 16/1 70/5 70/5 25/2 181/13US 518/286 593/37 338 / 7 352/24 1801/354 413/3 538/5 538/5 277/2 1766/15
2017:Q1 2017:Q2 2017:Q3 2017:Q4 TOTAL 2016:Q1 2016:Q2 2016:Q3 2016:Q4 TOTALFrance 0/1 5/2 3/0 8/4 16/7 1/0 3/0 3/0 17/4 24/4Germany 7/8 3/16 2/0 7/9 19/33 8/6 4/13 7/8 21/4 40/31Italy 12/6 15/125 12/1 3/0 42/132 3/0 14/0 15/5 3/2 35/7Netherlands 2/24 10/9 2/13 16/1 30/47 1/2 9/1 1/13 9/11 20/27Spain 30/14 37/8 23/7 15/5 105/34 4/7 33/1 41/17 8/5 86/30UK 154/17 71/10 29/2 60/25 314/54 51/11 92/12 19/5 41/20 203/48Multinational 0/0 7/0 1/0 0/0 8/0 0/1 0/0 0/0 2/0 2/1European Total 208/119 158/172 81/23 125/45 572/359 69/27 157/31 97/48 118/50 441/156US 852/438 369/171 314/991 1589/642 3124/2242 436/400 512/132 443/770 2714/692 4105/1994
2017:Q1 2017:Q2 2017:Q3 2017:Q4 TOTAL 2016:Q1 2016:Q2 2016:Q3 2016:Q4 TOTALFrance 1/0 0/0 4/0 4/0 9/0 4/0 2/0 0/0 6/0 12/0Germany 4/1 1/1 7/0 7/0 19/2 0/2 5/3 4/1 0/1 9/7Italy 1/0 14/0 9/0 9/0 33/0 0/0 0/0 13/1 0/1 13/2Netherlands 3/0 6/0 1/1 1/1 11/2 2/0 25/0 0/4 1/0 28/4Spain 33/0 6/1 30/3 30/3 99/7 0/0 203/0 4/2 0/0 207/2UK 1/2 11/1 126/14 126/14 264/31 0/9 10/3 11/7 10/1 31/20Multinational 29/3 32/2 60/1 60/1 181/7 152/2 65/7 56/3 44/9 317/21European Total 78/8 73/0 291/0 461/0 903/8 167/13 337/15 112/19 66/12 682/59US 612/82 694/0 694/0 694/0 2694/82 1562/628 1182/301 1472/745 1322/236 5538/1910
2017:Q1 2017:Q2 2017:Q3 2017:Q4 TOTAL 2016:Q1 2016:Q2 2016:Q3 2016:Q4 TOTALFrance 2/0 0/0 0/0 0/0 2/0 0/0 1/0 0/0 0/0 1/0Germany 5/4 2/4 7/0 2/1 16/9 1/5 2/4 6/9 4/1 13/19Italy 5/4 1/1 8/0 91/3 105/8 0/1 3/0 4/0 0/2 7/3Netherlands 13/3 3/0 9/4 3/0 28/7 17/7 32/16 8/6 0/1 57/30Spain 41/5 23/3 10/2 5/2 79/12 52/7 1/6 2/0 2/0 57/13UK 44/8 33/12 50/12 206/1 333/33 33/5 47/33 123/17 51/17 254/72Multinational 63/16 72/15 37/22 9/8 181/61 161/19 53/13 110/14 77/26 401/72European Total 173/40 134/35 121/40 316/15 744/130 264/44 139/72 253/46 134/47 790/209US 385/308 437/206 268/468 336/235 1426/1217 394/381 569/588 750/269 662/475 2375/1713

Credit Quality – Rating Changes
Securitisation Data Report Page 17
Upgrades/Downgrades by Collateral 3.5 DBRS - Europe
3.6 Fitch Ratings - Europe1
3.7 Moody’s Investors Service - Europe
3.8 Standard & Poor’s - Europe
Sources: DBRS, Fitch Ratings, Moody’s Investors Service, Standard & Poor’s
1 The European totals may not match the constituent parts as a small number of European RMBS transactions are not categorised as either Prime or Non-conforming.
2017:Q1 2017:Q2 2017:Q3 2017:Q4 TOTAL 2016:Q1 2016:Q2 2016:Q3 2016:Q4 TOTALAuto 5/0 9/0 12/0 12/0 38/0 2/0 9/0 9/0 9/0 29/0CDO 0/10 13/3 10/0 10/0 33/13 8/0 12/0 12/0 0/2 32/2CMBS 0/2 0/4 0/0 0/4 0/10 0/0 1/1 1/1 0/0 2/2Credit Card 1/1 18/1 2/0 10/0 31/2 0/0 5/0 5/0 6/0 16/0RMBS (prime) 3/1 20/4 18/1 24/3 65/9 5/1 33/4 33/4 10/0 81/9RMBS (non-prime) 0/1 1/0 3/0 3/0 7/1 1/0 5/0 5/0 0/0 11/0Other ABS 1/0 4/0 0/0 1/0 6/0 0/0 5/0 5/0 0/0 10/0Total 10/15 65/12 45/1 60/7 180/35 16/1 70/5 70/5 25/2 181/13
2017:Q1 2017:Q2 2017:Q3 2017:Q4 TOTAL 2016:Q1 2016:Q2 2016:Q3 2016:Q4 TOTALAuto 1/0 5/7 10/0 9/0 25/7 0/0 7/0 11/0 12/1 30/1Credit Card 0/0 3/0 0/0 10/0 13/0 0/0 0/0 0/0 0/0 0/0Other ABS 7/48 10/19 9/0 9/3 35/70 9/1 4/0 18/0 2/3 33/4CDO 21/10 40/27 21/0 48/1 130/38 5/3 19/8 22/0 68/4 114/15CMBS 6/12 8/25 8/2 0/14 22/53 4/11 15/14 3/6 0/13 22/44RMBS (prime) 36/40 33/88 30/21 41/8 140/157 16/12 35/0 35/17 31/10 117/39RMBS (non-conforming) 125/0 57/6 3/0 6/19 191/25 35/0 75/5 0/14 4/18 114/37Other RMBS 12/9 2/0 0/0 2/0 16/9 8/5 2/0 8/1 1/1 19/7Total 208/119 158/172 81/23 125/45 572/359 69/27 157/31 97/48 118/50 441/156
2017:Q1 2017:Q2 2017:Q3 2017:Q4 TOTAL 2016:Q1 2016:Q2 2016:Q3 2016:Q4 TOTALAuto 11/0 0/1 0/5 9/8 20/14 0/0 7/0 1/0 0/0 8/0CDO 29/2 32/1 60/1 130/1 251/5 152/2 65/3 56/3 41/9 314/17CMBS 0/4 2/4 0/15 5/15 7/38 0/2 0/7 1/8 1/2 2/19Credit Card 0/0 0/0 2/0 2/0 4/0 0/0 0/0 0/0 0/0 0/0RMBS (prime) 33/2 29/6 100/7 133/50 295/65 14/1 238/4 40/3 11/1 303/9RMBS (non-conforming) 5/0 10/1 129/4 182/6 326/11 1/8 27/1 14/5 13/0 55/14Total 78/8 73/13 291/32 461/80 903/133 167/13 337/15 112/19 66/12 682/
2017:Q1 2017:Q2 2017:Q3 2017:Q4 TOTAL 2016:Q1 2016:Q2 2016:Q3 2016:Q4 TOTALAuto 6/0 2/0 3/0 1/0 12/0 2/0 2/0 5/0 3/0 12/0CDO 69/9 78/14 51/16 20/8 218/47 191/15 64/3 128/11 86/22 469/51CMBS 2/18 0/16 7/22 5/2 14/58 1/13 0/37 6/27 0/16 7/93Credit Card 0/0 0/0 0/0 0/0 0/0 0/0 2/0 0/0 2/6 4/6RMBS (prime) 61/10 24/4 27/2 92/5 204/21 68/14 26/20 21/6 2/2 117/42RMBS (non-conforming) 35/3 30/1 33/0 198/0 296/4 2/2 45/12 93/2 41/1 181/17Total 173/40 134/35 121/40 316/15 744/130 264/44 139/72 253/46 134/47 790/209

Credit Quality – Rating Changes
Securitisation Data Report Page 18
Upgrades/Downgrades by Collateral 3.9 DBRS - US
3.10 Fitch Ratings - US
3.11 Moody’s Investors Service - US
3.12 Standard & Poor’s - US
Sources: DBRS, Fitch Ratings, Moody’s Investors Service, Standard & Poor’s
2017:Q1 2017:Q2 2017:Q3 2017:Q4 TOTAL 2016:Q1 2016:Q2 2016:Q3 2016:Q4 TOTALAuto 17/0 54/0 70/0 20/0 161/0 40/0 2/0 2/0 28/0 72/0CDO 17/0 2/28 5/0 9/15 33/43 0/0 5/0 5/0 30/0 40/0CMBS 56/271 36/7 23/3 45/3 160/284 13/3 52/2 52/2 23/2 140/9Credit Card 2/0 8/0 0/0 0/0 10/0 0/0 0/0 0/0 0/0 0/0RMBS 418/13 463/2 204/0 265/6 1350/21 339/0 476/2 476/2 187/0 1478/4Other ABS 8/2 30/0 36/4 13/0 87/6 21/0 3/1 3/1 9/0 36/2Total 518/286 593/37 338/7 352/24 1801/354 413/3 538/5 538/5 277/2 1766/15
2017:Q1 2017:Q2 2017:Q3 2017:Q4 TOTAL 2016:Q1 2016:Q2 2016:Q3 2016:Q4 TOTALAuto 33/0 22/0 16/0 34/0 105/0 0/0 21/0 29/0 18/0 68/0Credit Card 0/0 0/0 11/0 0/0 11/0 0/0 0/0 0/0 0/0 0/0Other ABS 37/68 27/6 61/14 45/31 170/119 26/70 93/41 20/11 19/88 158/210CDO 26/9 92/8 21/5 10/2 149/24 22/15 55/12 20/10 22/2 119/39CMBS 58/87 78/35 38/51 30/36 204/209 148/115 93/27 31/72 41/46 313/260RMBS (prime) 3/71 41/45 162/602 15/53 221/771 0/93 80/1 282/636 20/47 382/777RMBS (subprime) 28/21 0/27 0/214 1101/400 1129/662 20/24 5/2 0/0 2281/160 2306/186Other RMBS 667/182 109/50 5/105 354/120 1135/457 220/83 165/49 61/41 313/349 759/522Total 852/438 369/171 314/991 1589/642 3124/2242 436/400 512/132 443/770 2714/692 4105/1994
2017:Q1 2017:Q2 2017:Q3 2017:Q4 TOTAL 2016:Q1 2016:Q2 2016:Q3 2016:Q4 TOTALAuto 48/0 36/0 80/0 154/0 318/0 101/0 4/0 48/0 61/2 214/2CDO 74/7 69/0 115/5 168/10 426/22 132/28 44/16 145/8 98/4 419/56CMBS 59/34 50/0 119/81 165/117 393/232 210/85 139/41 193/100 153/64 695/290Credit Card 0/0 0/0 0/0 0/0 0/0 13/0 0/0 0/0 0/0 13/0RMBS 431/41 539/0 276/50 975/112 2221/203 1106/515 995/244 1086/637 1010/166 4197/1562Total 612/82 694/0 590/136 1462/239 3358/457 1562/628 1182/301 1472/745 1322/236 5538/1910
2017:Q1 2017:Q2 2017:Q3 2017:Q4 TOTAL 2016:Q1 2016:Q2 2016:Q3 2016:Q4 TOTALAuto 38/0 101/0 106/0 74/0 319/0 9/0 88/0 56/0 190/0 343/0CDO 105/16 76/7 37/4 34/10 252/37 235/13 153/20 166/18 95/7 649/58CMBS 59/51 139/33 69/32 61/37 328/153 63/13 123/49 116/35 138/52 440/149Credit Card 0/0 0/0 0/0 12/0 12/0 0/0 0/0 0/0 1/0 1/0RMBS (prime) 116/162 38/113 32/316 43/100 229/691 36/244 117/271 130/143 147/277 430/935RMBS (subprime) 67/79 83/53 24/116 112/88 286/336 51/111 88/248 282/73 91/139 512/571Total 385/308 437/206 268/468 336/235 1426/1217 394/381 569/588 750/269 662/475 2375/1713

CMBS Spreads
Securitisation Data Report Page 19
4 CMBS Spreads
4.1 European 3-5 Yr AAA, AA, A CMBS Spreads (bps)
4.2 European 3-5 Yr BBB CMBS Spreads (bps)
Sources: Markit Sources: Markit.
4.3 US 3 & 5 Yr AAA CMBS Spreads (bps) 4.4 US 3 & 5 Yr BBB CMBS Spreads (bps)
Sources: Trepp LLC Sources: Trepp LLC
0
200
400
600
800
1000
1200
Dec-
11
Jun-
12
Dec-
12
Jun-
13
Dec-
13
Jun-
14
Dec-
14
Jun-
15
Dec-
15
Jun-
16
Dec-
16
Jun-
17
Dec-
17
AAA
AA
A
150350550750950
11501350155017501950
Dec-
11
Jun-
12
Dec-
12
Jun-
13
Dec-
13
Jun-
14
Dec-
14
Jun-
15
Dec-
15
Jun-
16
Dec-
16
Jun-
17
Dec-
17
0
50
100
150
200
250
300
350
Dec-
11
Jun-
12
Dec-
12
Jun-
13
Dec-
13
Jun-
14
Dec-
14
Jun-
15
Dec-
15
Jun-
16
Dec-
16
Jun-
17
Dec-
17
CMBS 3 YrCMBS 5 Yr
0
500
1000
1500
2000
2500
3000
3500
Dec-
11
Jun-
12
Dec-
12
Jun-
13
Dec-
13
Jun-
14
Dec-
14
Jun-
15
Dec-
15
Jun-
16
Dec-
16
Jun-
17
Dec-
17
CMBS 3 YrCMBS 5 Yr

RMBS Spreads
Securitisation Data Report Page 20
5 RMBS Spreads
5.1 European 3-5 Yr AAA RMBS Spreads (bps)
5.2 European 3-5 Yr BBB RMBS Spreads (bps)
Sources: Markit Sources: Markit
5.3 UK 3-5 Yr AAA RMBS Spreads (bps) 5.4 UK 3-5 Yr BBB RMBS Spreads (bps)
Sources: Markit Sources: Markit
0
100
200
300
400
500
600
700
Dec-
11
Jun-
12
Dec-
12
Jun-
13
Dec-
13
Jun-
14
Dec-
14
Jun-
15
Dec-
15
Jun-
16
Dec-
16
Jun-
17
Dec-
17
SpainNetherlandsItalyFrance
0
500
1000
1500
2000
2500
Dec-
11
Jun-
12
Dec-
12
Jun-
13
Dec-
13
Jun-
14
Dec-
14
Jun-
15
Dec-
15
Jun-
16
Dec-
16
Jun-
17
Dec-
17
SpainFranceItaly
0
100
200
300
400
500
600
Dec-
11
Jun-
12
Dec-
12
Jun-
13
Dec-
13
Jun-
14
Dec-
14
Jun-
15
Dec-
15
Jun-
16
Dec-
16
Jun-
17
Dec-
17
UK RMBS (Prime)UK RMBS (Non-conforming)
0200400600800
100012001400160018002000
Dec-
11
Jun-
12
Dec-
12
Jun-
13
Dec-
13
Jun-
14
Dec-
14
Jun-
15
Dec-
15
Jun-
16
Dec-
16
Jun-
17
Dec-
17
UK RMBS (Prime)
UK RMBS (Non-conforming)

ABS Spreads
Securitisation Data Report Page 21
6 ABS Spreads
6.1 European 1-4 Yr AAA ABS Spreads (bps)
6.2 European 1-4 Yr BBB Spreads (bps)
Sources: Markit Sources: Markit
6.3 US 3 Yr AAA ABS Spreads (bps) 6.4 US 3 Yr BBB ABS Spreads (bps)
Sources: JP Morgan Sources: JP Morgan
020406080
100120140160180200
Dec-
11
Jun-
12
Dec-
12
Jun-
13
Dec-
13
Jun-
14
Dec-
14
Jun-
15
Dec-
15
Jun-
16
Dec-
16
Jun-
17
Dec-
17
Auto 1-4 Yr
Credit Card 1-4 Yr
0100200300400500600700800900
1000
Dec-
11
Jun-
12
Dec-
12
Jun-
13
Dec-
13
Jun-
14
Dec-
14
Jun-
15
Dec-
15
Jun-
16
Dec-
16
Jun-
17
Dec-
17
Credit Card 1-4 Yr
0
10
20
30
40
50
Dec-
11
Jun-
12
Dec-
12
Jun-
13
Dec-
13
Jun-
14
Dec-
14
Jun-
15
Dec-
15
Jun-
16
Dec-
16
Jun-
17
Dec-
17
Credit Card 3 Yr AAAAuto 3 Yr AAA
405060708090
100110120130140
Dec-
11
Jun-
12
Dec-
12
Jun-
13
Dec-
13
Jun-
14
Dec-
14
Jun-
15
Dec-
15
Jun-
16
Dec-
16
Jun-
17
Dec-
17
Credit Card 3 Yr BBB

RMBS Prices
Securitisation Data Report Page 22
7 RMBS Prices
7.1 European 3-5 Yr AAA RMBS Prices 7.2 European 3 - 5 Yr BBB RMBS Prices
Sources: Markit
1. Spanish AAA RMBS provided: IM Pastor 3, Fondo de Titulizacion Hipotecaria, Class A, Series 3. ISIN# ES0347862007. EUR-denominated.
2. Italian AAA RMBS provided: Vela Home S.r.l. 3, Class A, Series 3. ISIN# IT0003933998. EUR-denominated.
3. French AAA RMBS provided: FCC Loggias Compartment 2003, Class A, Series 1. ISIN# FR0010029231. EUR-denominated.
4. Dutch AAA RMBS provided: Storm 2016-I BV, Class A2, Series 2016-I ISIN# XS1336738221. EUR-denominated.
Sources: Markit
1. Spanish BBB RMBS provided: Hipocat 8, Fondo de Titulizacion Activos, Class D, Series 1: ISIN# ES0345784047. EUR-denominated.
2. Dutch BBB RMBS provided: Holland Mortgage-Backed Securities (HERMES) X B.V., Class C, Series 10. ISIN# XS0228806831. EUR-denominated. From 2016 onwards: Storm 2016-I B.V, Class A2, Series 2016-I, ISIN# XS1336738221.
3. Italian BBB RMBS provided: Vela Home S.r.l. 4, Class A2, Series 4, ISIN# IT0004102007. EUR-denominated.
7.3 UK 3-5 Yr AAA RMBS Prices 7.4 Markit RMBS iBoxx
Sources: Markit
1. UK AAA prime RMBS provided: GREAT HALL MORTGAGES No1 PLC, Class Aa, Series 2007-02, ISIN# XS0308354504.
2. UK AAA non-conforming RMBS provided: First Flexible No. 4 PLC, Class A, Series 4. ISIN# XS0132692384. GBP-denominated.
Sources: Markit
6065707580859095
100105
Dec-
11
Jun-
12
Dec-
12
Jun-
13
Dec-
13
Jun-
14
Dec-
14
Jun-
15
Dec-
15
Jun-
16
Dec-
16
Jun-
17
Dec-
17
Spain Netherlands Italy France
102030405060708090
100110
Dec-
11
Jun-
12
Dec-
12
Jun-
13
Dec-
13
Jun-
14
Dec-
14
Jun-
15
Dec-
15
Jun-
16
Dec-
16
Jun-
17
Dec-
17
SpainItaly Netherlands
75
80
85
90
95
100
105
Dec-
11
Jun-
12
Dec-
12
Jun-
13
Dec-
13
Jun-
14
Dec-
14
Jun-
15
Dec-
15
Jun-
16
Dec-
16
Jun-
17
Dec-
17
UK RMBS (Prime) UK RMBS (Non-conforming)
100%
120%
140%
160%
180%
200%
Dec-
12
Jun-
13
Dec-
13
Jun-
14
Dec-
14
Jun-
15
Dec-
15
Jun-
16
Dec-
16
Jun-
17
Dec-
17
Non-Agency RMBS Non-Agency Prime RMBS Non-Agency Alt-A RMBS Non-Agency Option ARM RMBS Non-Agency Subprime RMBS

CMBS and ABS Prices
Securitisation Data Report Page 23
8 CMBS and ABS Prices
8.1 Pan-European 3-5 Yr AAA CMBS Prices 8.2 Pan-European 3-5 Yr BBB CMBS Prices
Sources: Markit
1. Pan-European AAA CMBS provided: German Residential Funding, Class A, Series 2013-1. ISIN# XS0944452563 (paid off in 2H 16, kept in the chart for reference), EUR-denominated. and Westfield Stratford City Finance PLC, WSCF14 1 Note, GBP-denominated, ISIN# XS1093970751.
Sources: Markit
1. Pan-European BBB CMBS provided: German Residential Funding, Class D, Series 2013-1. ISIN# XS0944454858 (paid off in 2H 16, kept in the chart for reference). EUR-denominated, and CPUK Finance Limited, Class A2, GBP-denominated, ISIN# XS0749350798.
8.3 Pan-European 1-4 AAA ABS Prices
Sources: Markit
1. Pan-European AAA Auto ABS provided: Driver Three GmbH, Class A, Series 3. ISIN# XS0270108573. EUR-denominated and Driver Twelve GmbH, DRV12 12 A, Class A, Series 12. EUR denominated, ISIN# XS1055190950.
2. Pan-European AAA Credit Card ABS provided: Chester Asset Receivables DGS 2004-1, Class A, Series UK2004-1. ISIN# XS0188611783. GBP-denominated. And Penarth Master Issuer PLC Series 2015-2, Class A1, ISIN# XS1237348823.
8587899193959799
101103105
Dec-
11
Jun-
12
Dec-
12
Jun-
13
Dec-
13
Jun-
14
Dec-
14
Jun-
15
Dec-
15
Jun-
16
Dec-
16
Jun-
17
Dec-
17
CMBS 3-5 Yr (German ResidentialFunding)CMBS 3-5 Yr (Westfield Stratford City)
5060708090
100110120130140150
Dec-
11
Jun-
12
Dec-
12
Jun-
13
Dec-
13
Jun-
14
Dec-
14
Jun-
15
Dec-
15
Jun-
16
Dec-
16
Jun-
17
Dec-
17
CMBS 3-5Yr (German Residential Funding)CMBS 3-5Yr (CPUK Finance)
9596979899
100101102103104
Dec-
11
Jun-
12
Dec-
12
Jun-
13
Dec-
13
Jun-
14
Dec-
14
Jun-
15
Dec-
15
Jun-
16
Dec-
16
Jun-
17
Dec-
17
Auto 1-4 Yr (Driver Three GmbH)Auto 1-4 Yr (Driver Twelve GmbH)Credit Card 1-4 Yr (Chester Asset Receivables)

Indices Data
Securitisation Data Report Page 24
9 Indices Data
9.1 Securitised Index Option-Adjusted Spreads (bps)
9.2 Barclays PanEurope Fixed and Floating Prices
Sources: Barclays Capital Sources: Barclays Capital
9.3 Australia AAA (tranche margin for WAL >1.9 & 2.1 yrs) (bps)
9.4 Australia AA (tranche margin for WAL >4.75 & 5.3 yrs) (bps)
Sources: Macquarie Sources: Macquarie
9.5 CMBX 6 AAA Prices
Sources: Markit
0
50
100
150
200
250
Dec-
11
Jun-
12
Dec-
12
Jun-
13
Dec-
13
Jun-
14
Dec-
14
Jun-
15
Dec-
15
Jun-
16
Dec-
16
Jun-
17
Dec-
17
US Securitised OAS
Pan-Euro Securitised OAS
80859095
100105110115120125
Dec-
11
Jun-
12
Dec-
12
Jun-
13
Dec-
13
Jun-
14
Dec-
14
Jun-
15
Dec-
15
Jun-
16
Dec-
16
Jun-
17
Dec-
17
Barclays Fixed PanEurope Barclays FRN PanEurope
020406080
100120140160180200
Dec-
11
Jun-
12
Dec-
12
Jun-
13
Dec-
13
Jun-
14
Dec-
14
Jun-
15
Dec-
15
Jun-
16
Dec-
16
Jun-
17
Dec-
17
0
100
200
300
400
500
600De
c-11
Jun-
12
Dec-
12
Jun-
13
Dec-
13
Jun-
14
Dec-
14
Jun-
15
Dec-
15
Jun-
16
Dec-
16
Jun-
17
Dec-
17
93949596979899
100101102
Dec-
12
Jun-
13
Dec-
13
Jun-
14
Dec-
14
Jun-
15
Dec-
15
Jun-
16
Dec-
16
Jun-
17
Dec-
17

Total Return Benchmark Data
Securitisation Data Report Page 25
10 Total Return Benchmark Data
10.1 European Total Return 10.2 UK Total Return
Sources: Markit Sources: Markit. Benchmark price not available for 2017 onwards for UK
nonconforming RMBS AAA
10.3 Europe ex UK RMBS AAA
Sources: Markit
60
80
100
120
140
160
Dec-
11
Jun-
12
Dec-
12
Jun-
13
Dec-
13
Jun-
14
Dec-
14
Jun-
15
Dec-
15
Jun-
16
Dec-
16
Jun-
17
Dec-
17
All Europe RMBS (EUR) All Europe CMBS (EUR) All Europe ABS (EUR) All Europe ABS (GBP) 50
70
90
110
130
150
170
Dec-
11
Jun-
12
Dec-
12
Jun-
13
Dec-
13
Jun-
14
Dec-
14
Jun-
15
Dec-
15
Jun-
16
Dec-
16
Jun-
17
Dec-
17
UK CMBS AA (GBP) UK PRMBS AAA (GBP) UK Nonconforming RMBS AAA (GBP)
75
85
95
105
115
125
135
145
Dec-
11
Jun-
12
Dec-
12
Jun-
13
Dec-
13
Jun-
14
Dec-
14
Jun-
15
Dec-
15
Jun-
16
Dec-
16
Jun-
17
Dec-
17
Netherlands RMBSAAA (EUR) Spanish RMBS AA(EUR)
Asset-Backed Commercial Paper
Securitisation Data Report Page 26
11 Asset-Backed Commercial Paper € BILLIONS
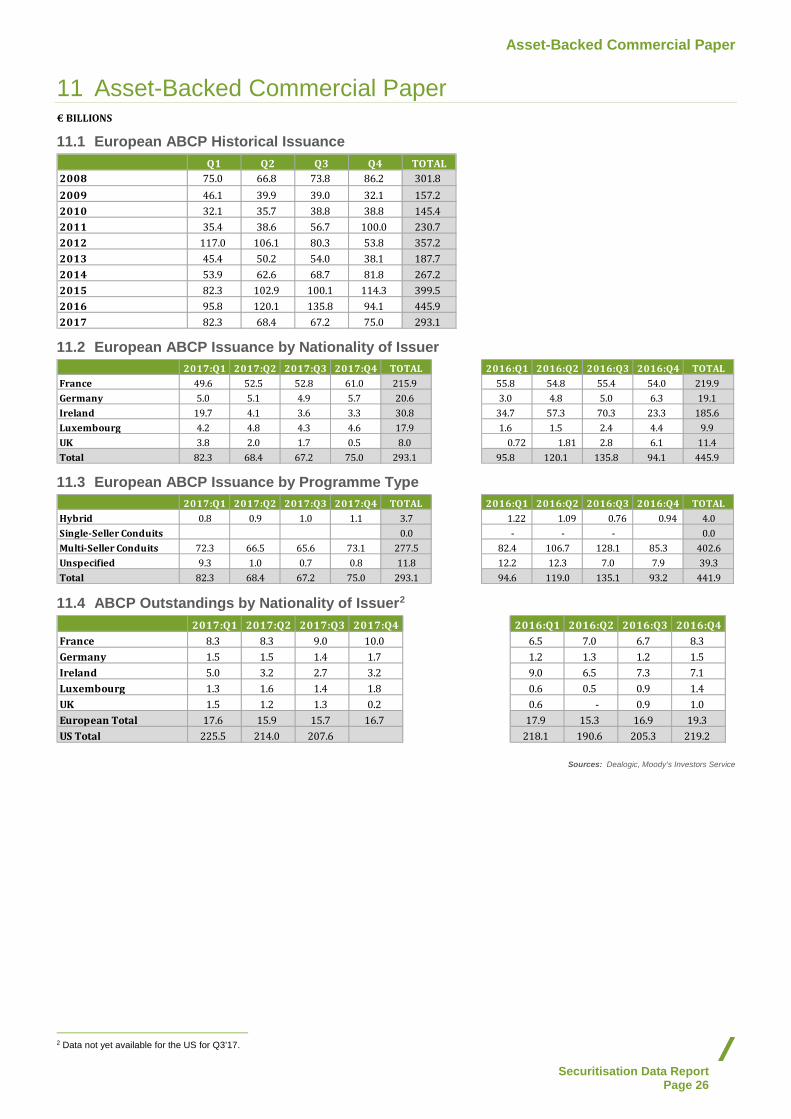
11.1 European ABCP Historical Issuance
11.2 European ABCP Issuance by Nationality of Issuer
11.3 European ABCP Issuance by Programme Type
11.4 ABCP Outstandings by Nationality of Issuer2
Sources: Dealogic, Moody’s Investors Service
2 Data not yet available for the US for Q3’17.
Q1 Q2 Q3 Q4 TOTAL2008 75.0 66.8 73.8 86.2 301.82009 46.1 39.9 39.0 32.1 157.22010 32.1 35.7 38.8 38.8 145.42011 35.4 38.6 56.7 100.0 230.72012 117.0 106.1 80.3 53.8 357.22013 45.4 50.2 54.0 38.1 187.72014 53.9 62.6 68.7 81.8 267.22015 82.3 102.9 100.1 114.3 399.52016 95.8 120.1 135.8 94.1 445.92017 82.3 68.4 67.2 75.0 293.1
2017:Q1 2017:Q2 2017:Q3 2017:Q4 TOTAL 2016:Q1 2016:Q2 2016:Q3 2016:Q4 TOTALFrance 49.6 52.5 52.8 61.0 215.9 55.8 54.8 55.4 54.0 219.9Germany 5.0 5.1 4.9 5.7 20.6 3.0 4.8 5.0 6.3 19.1Ireland 19.7 4.1 3.6 3.3 30.8 34.7 57.3 70.3 23.3 185.6Luxembourg 4.2 4.8 4.3 4.6 17.9 1.6 1.5 2.4 4.4 9.9UK 3.8 2.0 1.7 0.5 8.0 0.72 1.81 2.8 6.1 11.4Total 82.3 68.4 67.2 75.0 293.1 95.8 120.1 135.8 94.1 445.9
2017:Q1 2017:Q2 2017:Q3 2017:Q4 TOTAL 2016:Q1 2016:Q2 2016:Q3 2016:Q4 TOTALHybrid 0.8 0.9 1.0 1.1 3.7 1.22 1.09 0.76 0.94 4.0Single-Seller Conduits 0.0 - - - 0.0Multi-Seller Conduits 72.3 66.5 65.6 73.1 277.5 82.4 106.7 128.1 85.3 402.6Unspecified 9.3 1.0 0.7 0.8 11.8 12.2 12.3 7.0 7.9 39.3Total 82.3 68.4 67.2 75.0 293.1 94.6 119.0 135.1 93.2 441.9
2017:Q1 2017:Q2 2017:Q3 2017:Q4 2016:Q1 2016:Q2 2016:Q3 2016:Q4France 8.3 8.3 9.0 10.0 6.5 7.0 6.7 8.3Germany 1.5 1.5 1.4 1.7 1.2 1.3 1.2 1.5Ireland 5.0 3.2 2.7 3.2 9.0 6.5 7.3 7.1Luxembourg 1.3 1.6 1.4 1.8 0.6 0.5 0.9 1.4UK 1.5 1.2 1.3 0.2 0.6 - 0.9 1.0European Total 17.6 15.9 15.7 16.7 17.9 15.3 16.9 19.3US Total 225.5 214.0 207.6 218.1 190.6 205.3 219.2

Asset-Backed Commercial Paper
Securitisation Data Report Page 27
11.5 European ABCP Outstandings by Programme Type
11.6 US ABCP Outstandings by Programme Type3
Sources: Dealogic, Moody’s Investors Service
11.7 US ABCP to AA Non-financial CP Spread
Sources: US Federal Reserve
3 Data not yet available for the US for Q3’17.
2017:Q1 2017:Q2 2017:Q3 2017:Q4 2016:Q1 2016:Q2 2016:Q3 2016:Q4Hybrid 0.8 0.6 0.6 0.9 1.0 0.7 0.6 0.7Multi-Seller 15.7 14.8 14.7 15.4 14.2 16.0 15.4 16.3Unspecified 1.1 0.5 0.4 0.4 2.7 2.3 0.9 2.3Total 17.6 15.9 15.7 16.7 17.9 19.0 16.9 19.3
2017:Q1 2017:Q2 2017:Q3 2017:Q4 2016:Q1 2016:Q2 2016:Q3 2016:Q4Loan-Backed - - - SIVs - - - Single-Seller 8.4 7.9 7.6 6.6 7.0 7.3 7.9Multi-Seller 175.8 167.1 161.8 176.5 177.6 171.5 176.0Other 41.3 39.0 38.2 32.7 36.8 37.9 40.4Total 225.5 214.0 207.6 215.8 221.3 216.7 224.3
0
10
20
30
40
50
60
70
1/17 5/17 9/17
Basis Points
Global Comparative Data
Securitisation Data Report Page 28
12 Global Comparative Data € BILLIONS
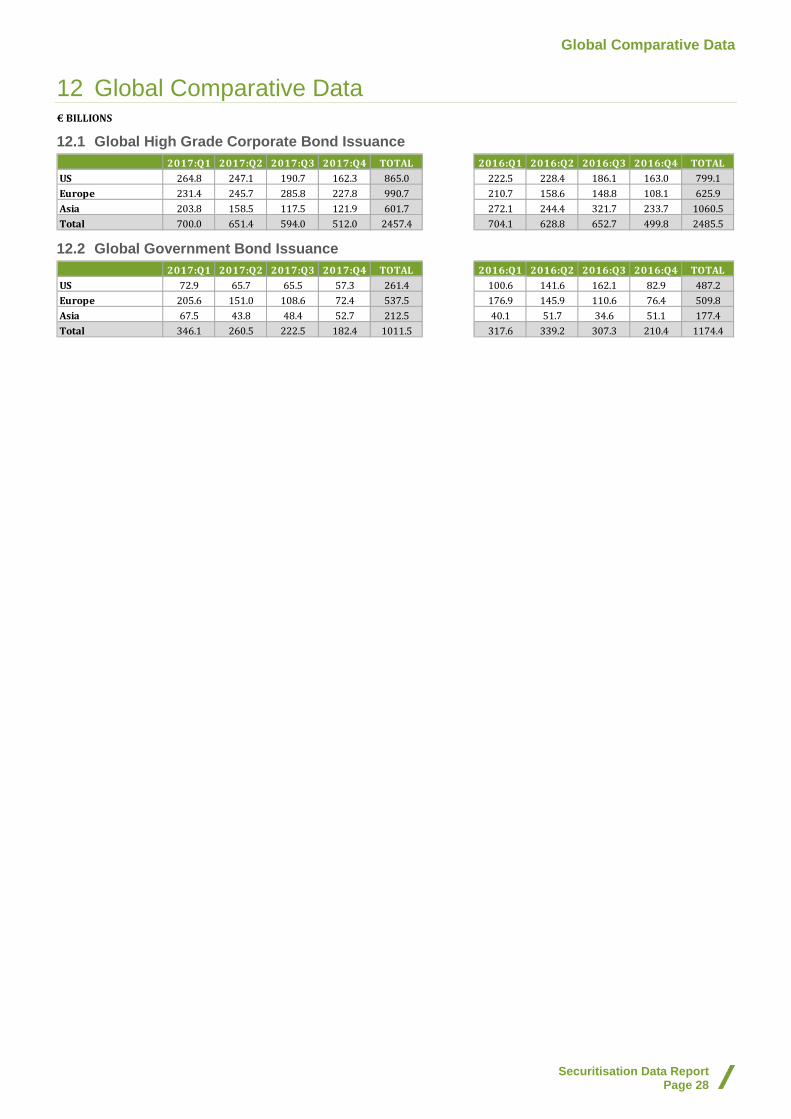
12.1 Global High Grade Corporate Bond Issuance
12.2 Global Government Bond Issuance
2017:Q1 2017:Q2 2017:Q3 2017:Q4 TOTAL 2016:Q1 2016:Q2 2016:Q3 2016:Q4 TOTALUS 264.8 247.1 190.7 162.3 865.0 222.5 228.4 186.1 163.0 799.1Europe 231.4 245.7 285.8 227.8 990.7 210.7 158.6 148.8 108.1 625.9Asia 203.8 158.5 117.5 121.9 601.7 272.1 244.4 321.7 233.7 1060.5Total 700.0 651.4 594.0 512.0 2457.4 704.1 628.8 652.7 499.8 2485.5
2017:Q1 2017:Q2 2017:Q3 2017:Q4 TOTAL 2016:Q1 2016:Q2 2016:Q3 2016:Q4 TOTALUS 72.9 65.7 65.5 57.3 261.4 100.6 141.6 162.1 82.9 487.2Europe 205.6 151.0 108.6 72.4 537.5 176.9 145.9 110.6 76.4 509.8Asia 67.5 43.8 48.4 52.7 212.5 40.1 51.7 34.6 51.1 177.4Total 346.1 260.5 222.5 182.4 1011.5 317.6 339.2 307.3 210.4 1174.4

Summary of the Methodologies Adopted for this Report
Securitisation Data Report Page 29
Summary of the Methodologies Adopted for this Report 1. Issuance 1.1. – 1.2. European, Australian, and US Historical Issuance The tables covering historical issuance in Europe and the US are denominated in EUR billions. Historical issuance volumes are calculated by adding all transactions in different asset classes including, among others, asset-backed securities (ABS), collateralised debt obligations/collateralised loan obligations (CDOs/CLOs), commercial mortgage-backed securities (CMBS), and residential mortgage-back securities (RMBS). Please note that numbers may not add due to independent rounding and that historical or prior period numbers are revised to reflect changes in classification, refined selection methodology, or information submitted to our data sources after the prior period cut-off dates.
Australian data are contributed by Macquarie.
1.3. -1.6. Issuance by Collateral The European issuance volumes are determined based on the review of several data sources: Bloomberg, JP Morgan, Thomson Reuters, and UniCredit starting from Q1 2009; and Deutsche Bank starting from Q1 2010; Citigroup from Q2 2010; and Dealogic from Q1 2011. In prior quarters our sources were Bloomberg, JP Morgan, Merrill Lynch, RBS, and Thomson Reuters. RMBS, CMBS and ABS are defined as European by having underlying assets located in a European country. European securities included in the calculation are the ones for which there is a specific match in terms of size, name, country of collateral and collateral type from at least two sources. Securities that fail to meet these criteria are excluded. With respect to CDOs/CLOs, securities are designated as European if they are issued in any European currency, regardless of their country of collateral. A substantial percentage of CDOs/CLOs are backed by multi-jurisdictional collateral. Historical CDO/CLO issuance totals have been revised due to periodic updates of the sector.
European ABS issuance includes auto, credit card, leases, loans, receivables and other.
European whole business securitisation (“WBS”) are securitisations where cashflows derive from the whole operating revenues generated by an entire business or segmented part of a larger business. Certain WBS deals may be bucketed in the ABS or CMBS class based on deal specifics. As of 2013 Q4, certain public finance initaitves (“PFI”) have been
moved from ABS to WBS and the category renamed “PFI/WBS”.
Placed and retained European issuance collateral are sourced from AFME and/or SIFMA dealer member research, Dealogic, Bloomberg, and Thomson Reuters. Placed issuance includes all tranches placed in the public market, private placements, and preplacements. Partial issuance of a tranche is considered to be placed if half or more by euro amount of the tranche is reported placed. Placed and retained issuance will not retroactively consider securities originally issued retained and then placed in the marketplace, and are estimates.
The US non-agency RMBS, CMBS, ABS and CDO/CLO issuance data sources are Dealogic and Thomson Reuters. Agency mortgage-backed securities (MBS) are defined as securities issued by Fannie Mae, Freddie Mac, and Ginnie Mae and are acquired from company statements. US issuance data are generally based on the sum of securities with US collateral; agency issuance numbers do not include securitisations of existing agency securities. US CDO/CLO data are defined as USD-denominated CDOs/CLOs regardless of the country of collateral.
Australian securitisation volumes are contributed by Macquarie.
The US and Australia issuance data are converted to Euros based on the exchange rate at each quarter-end indicated below.
Quarter USD to EUR AUD to EUR Q1 2015 0.9318 0.7088 Q2 2015 0.8979 0.6917 Q3 2015 0.8947 0.6278 Q4 2015 0.9210 0.6711 Q1 2016 0.8787 0.6729 Q2 2016 0.9004 0.6708 Q3 2016 0.8901 0.6813 Q4 2016 0.9506 0.6843 Q1 2017 0.9385 0.7160 Q2 2017 0.8752 0.6727 Q3 2017 0.8464 0.6631 Q4 2017 0.8330 0.6506
These same conversion rates, sourced from Bloomberg, are used on all US issuance and outstanding volume data.
US ABS issuance includes auto, credit card, home equity, student loan, equipment leases, manufactured housing, and other. Historical ABS issuance totals have been revised due to periodic updates of the sector.
US CDO issuance numbers only include US-denominated issuance regardless of the country of

Summary of the Methodologies Adopted for this Report
Securitisation Data Report Page 30
collateral and may include European transactions which are denominated in US dollars. Historical CDO issuance totals have been revised due to periodic updates of the sector.
1.7. Issuance by Country of Collateral The tables covering issuance in the US and Europe are presented in EUR billions. For Europe the information is segmented by country of collateral.
The European issuance is segmented by country to the extent that a determination can be made. Securities with the underlying collateral originating from more than one jurisdiction are categorised as Multinational. Almost all CDOs/CLOs are classified under this Multinational group due to the complexity involved in identifying origin of collateral for each specific tranche. The European issuance volumes are determined based on the review of multiple data sources: Deutsche Bank and Bank of America-Merrill Lynch as of Q1 2010, Bloomberg, JP Morgan, Thomson Reuters and UniCredit starting from Q1 2009; and RBS starting from Q3 2009. In prior quarters the sources were Bloomberg, JP Morgan, Thomson Reuters and Merrill Lynch.
US CDO/CLO data are defined as USD-denominated issues regardless of country of collateral.
Other includes countries with outstanding securities that are too small to be displayed, such as Georgia, Iceland, Ukraine, Swit-zerland, Sweden, and Hungary.
PanEurope has been pulled out of the Multinational parent category and will be retroactively displayed for Euro-pean outstandings.
Multinational includes all deals in which assets originate from a variety of jurisdictions. This includes the majority of CDOs/CLOs denominated in a European currency.
Australian data are contributed by Macquarie.
1.8. Issuance by Collateral Type and Country of Collateral Issuance information is further specified by country of collateral for European issuance only and by asset class. CDO/CLO classification is the same as above.
1.9. – 1.11. Issuance by Rating Issuance is presented by credit rating classification (AAA; AA; A; BBB and below; and Not Rated) on a quarterly basis. The credit rating assigned is the lowest of the ratings provided by Fitch Ratings, Moody’s Investors Service and/or Standard & Poor’s. These ratings are intended to represent
their corresponding equivalent at each agency; e.g., an AAA rating is equal to an Aaa Moody’s rating, AA equal to Aa1, etc. Securities are classified ‘Not Rated’ if none of the credit rating agencies have provided an opinion on the underlying credit quality of a particular tranche, or if the ratings are unknown. US agency MBS issues are generally not rated and therefore grouped separately under Agency MBS.
Australian securitisation data are contributed by Macquarie.
1.12. Issuance by Deal Size European and US securitisation issuance volume is segmented by transaction size based on data provided by Dealogic. The European data covers all asset classes and EUR-denominated CDOs/CLOs. US non-Agency data includes ABS, non-agency CMBS and RMBS, and USD-denominated CDOs/CLOs. US agency MBS, which includes agency CMBS and RMBS, is shown separately.
All data, except for CDOs/CLOs, are included according to the country of collateral. The number of issues refers to the number of deals, not the number of tranches within each deal.
Australian securitisation issuance volumes are contributed by Macquarie.
2. Balances Outstanding 2.1. – 2.3. Outstandings by Collateral The outstanding volumes are reported by asset class. Subtotals may not add to totals due to independent rounding and historical or prior period numbers are continuously revised to reflect changes in classification, refined selection methodology, or information submitted to our data sources after the prior period cut-off dates. For Europe, balances outstanding are calculated by the principal balance outstanding on structured product transactions including public, private, rated, unrated, listed and unlisted securities provided by Bloomberg. Balances outstanding are determined by multiplying eligible securities by their pool factor for the quarter and sorted accordingly. Tranches that are non-EUR-denominated are converted to EUR by Bloomberg based on the exchange rate at the time of the pricing date (as specified by the lead manager/arranger), or, if missing, the issue date as specified in each security’s original offering documentation. Securities included in the calculations, except for CDOs/CLOs, have collateral originated from at least one European country to the extent that a determination can be made. However, for ABS and MBS securities with collateral originated in multiple

Summary of the Methodologies Adopted for this Report
Securitisation Data Report Page 31
countries, or where the origin of the underlying collateral is undefined, the following selection criteria apply: securities are considered eligible as European only if they are denominated in a European currency, as defined below, and the country of issuer (considered to be the country in which the issuing SPV is incorporated) is within Europe. In certain limited cases, the Channel Islands and the Cayman Islands are considered eligible as European jurisdictions for ABS and MBS products if underlying collateral is derived from a variety of jurisdictions and the original currency of issue is EUR only.
For our selection criteria, European currencies include the euro (EUR) and all predecessor currencies, as well as the Turkish lira (TRY), the Danish kroner (DKK), the Swedish krona (SEK), the Swiss franc (CHF), the Polish zloty (PLN), the British pound (GBP), and the Russian ruble (RUB).
Furthermore, our selection criteria consider Europe to include all European Economic Area (EEA) countries and certain non-EEA countries located on the geographic European continent. We have included Turkey, Kazakhstan, Iceland, Georgia and the Russian Federation in these criteria.
European ABS outstanding collateral types include auto loans, credit cards, loans (consumer and student), and other.
For the CDO/CLO sector, only issuance denominated in a European currency (as specified above) is included, regardless of the country of collateral.
Beginning in Q2 2010, the CDO/CLO asset class has been further broken down into the CDO/CLO and SME asset classes. SME securities follow the same criteria application as non-CDOs/CLOs. Revisions during this quarter were retroactively applied and balances outstanding from prior quarters have all been restated accordingly.
The US outstanding calculations are based on information derived from Bloomberg for ABS, non-agency RMBS, and non-agency CMBS; agency balance statements for agency MBS. The following asset classes are segmented: agency MBS, non-agency RMBS, non-agency CMBS, and ABS. The agency MBS figures include both agency RMBS and agency CMBS (i.e., multifamily). US ABS outstanding collateral types include auto loans, credit cards, loans (equipment and student loans), CDOs, and other. CDOs outstanding are included in ABS outstandings and represents dollar-denominated tranches. As of 2013 Q4 home equity and certain
other mortgage-related debt has been moved into Non-Agency RMBS.
Australian outstanding figures are contributed by Macquarie. Reverse mortgages are included in RMBS figures, while small balance CMBS are included in CMBS figures.
2.4. Outstandings by Country of Collateral The European outstanding volumes are segmented by country of collateral based on the above methodology. For our selection criteria, Europe is considered to include all European Economic Area (EEA) countries and certain non-EEA countries located on the geographic European continent (Georgia, Iceland, Turkey, Kazakhstan and the Russian Federation). In certain limited cases, the Channel Islands and the Cayman islands are considered eligible for ABS and MBS products if underlying collateral is derived from a variety of jurisdictions and the original currency of issue is European. CDOs/CLOs issued in a European currency with either collateral from multiple jurisdictions or for which the underlying location of collateral is undefined are categorized under ‘Multinational’ for the purpose of determining outstanding balances by country. Collateral from multiple European countries is now categorised under ‘PanEurope’ unless collateral is predominantly (over 90%) from one country.
The US outstandings include both agency and non-agency securities.
2.5. – 2.7. Outstandings by Moody’s Rating The percentage rating distribution for Europe and the US is based on Moody’s Investors Service data for balances outstanding, and from Standard and Poor’s for Australian data. The data provides current ratings as of the end of the quarter. The data presented are based on original issuance volumes for European, US, and Australian securities, and therefore do not reflect amortised balances. Information on current ratings by outstanding volumes is not currently available. Moody’s and Standard and Poor’s data have been converted to percentages based on the original issuance size to make it easily comparable with the outstanding volumes provided in this report. Defaulted and unrated issues are excluded from these data.
2.8. - 2.9. Outstandings by Vintage Outstanding volumes by vintage are determined by year of original pricing date. Restructurings are counted from original pricing date rather than remarketed date.

Summary of the Methodologies Adopted for this Report
Securitisation Data Report Page 32
2.10. Outstandings by Country and Collateral European outstanding volumes are segmented by country and collateral based on above methodology.
3. Credit Quality – Rating Changes 3.1. – 3.4. Upgrades/Downgrades by Country These tables present the aggregate number of upgrades and downgrades for securitisation (including CDOs/CLOs) by country of collateral for European deals and in total for US deals. The information is based on data provided by DBRS, Fitch Ratings, Moody’s Investors Service and Standard & Poor’s. The upgrade number is shown first followed by the downgrade number. The upgrades and downgrades of each of credit rating agency is shown in separate tables and presented as the number of rating changes. Because the credit rating agencies track different securities and apply different credit rating methodologies, these numbers are not directly comparable.
According to Moody’s Investors Service, a security is classified as European or American based on if it is monitored out of Moody’s office in Europe or the US. More specifically, European securities are classified within a particular country if all of its assets are located within that country.
Fitch's US category may contain non-US issues (e.g., Canada) from the North American continent.
The Multinational category includes CDOs/CLOs and all other cross-jurisdictional securitisations for both Moody’s Investors Service and Standard & Poor’s. The Fitch Ratings Multinational classification includes cross-jurisdictional CMBS as well as the aggregated sum of rating actions in other countries including Austria, Belgium, Greece, Ireland, Portugal and the Russian Federation. Fitch Ratings assigns CDO issues to the country in which the majority of the underlying assets are located.
DBRS' "ABS Other" category may include student loans, equipment lease and other securities.
3.5. – 3.12. Upgrades/Downgrades by Collateral These tables present aggregate upgrades and downgrades for securitisation and CDO/CLO issues by securitised product type for Europe and the US. The upgrade number is shown first followed by the downgrade number. The upgrades and downgrades of each agency are shown in separate tables and presented by number rating changes. For Fitch Ratings, the category Other RMBS includes other categories of RMBS transactions such as ALT-A, reverse mortgage, government RMBS, etc. The
category ‘Other ABS’ may include student loans and the whole business securitisations/public finance initiatives (WBS/PFI). For Moody’s Investors Service and Standard & Poor’s, the total number of European upgrades/downgrades reported by collateral type are not always comparable with the upgrades/downgrades presented by country because there may be securities that experience rating migrations that are backed by collateral originated from a country outside of those specified and will not be captured under the “Multinational” category.
4 - 6 Spreads 4.1. - 4.4. CMBS Spreads These graphs present credit spread data for European and US AAA and BBB 3-5 Yr CMBS. European 3-5 year AAA & BBB CMBS data are provided by Markit. Composite spread levels are calculated from dealer contributions which have been subjected to multiple cleaning algorithms. Spread levels are equivalent to the discount margin. The discount margin is defined as the effective spread to maturity of a floating rate security after discounting the yield value of a price other than par over the life of the security. The spread calculation is based on data provided by dealer trading desks.
US CMBS 3 and 5 year spreads are provided by Trepp LLC. US CMBS spreads are quoted as fixed rate bonds based on the yield of US treasury bonds with the same average life.
5.1. - 5.4. RMBS Spreads European RMBS credit spreads are provided for 3-5 year AAA and BBB securities based on data provided by Markit. European credit spreads cover Spain, Netherlands, Italy, Germany and France. UK RMBS spreads are provided for both prime and non-conforming transactions. Markit spread calculations are based on data provided by dealer trading desks.
As of April 2012, Italian AAA has been replaced with Italian AA due to downgrades. Spanish RMBS 3-5 year AAA and BBB spreads have been replaced with AA 3-5 years and BBB 5-8 years respectively due to lack of bonds.
As of November 2012, UK non-conforming AAA has been replaced with non-conforming AA due to downgrades, while BBB UK Prime RMBS are no longer available.
6.1. - 6.4. ABS Spreads European ABS credit spreads are provided for 1-4 year AAA and BBB securities based on data

Summary of the Methodologies Adopted for this Report
Securitisation Data Report Page 33
provided by Markit based on the same calculations described above.
US spreads reflect levels for AAA autos, AAA credit cards, and BBB credit cards; spreads are fixed against swaps and are provided by JP Morgan. US 3 Yr Auto ABS BBB spreads are not available.
7 - 8 Prices 7.1. – 7.4. RMBS Prices These graphs represent price data for specific European and UK RMBS selected as benchmarks in the respective jurisdictions. The price calculations are provided by Markit and are based on data provided by dealer trading desks.
8.1. – 8.3. CMBS and ABS Prices The graphs represent price data for specific pan-European CMBS and ABS selected as benchmarks. The price calculations provided by Markit and are based on data provided by dealer trading desks.
9.1. - 9.5. Indices Data The first graph presents daily option-adjusted spreads provided by Barclays Capital for Europe from a cross-section of securitised products. The second graph, provided by Barclays Capital, presents daily fixed and floating prices of pan-European deals.
The third and fourth graphs present daily tranche margins, quoted in bps, provided by Macquarie for the Australian AAA and AA securitised market.
The fifth graph present daily prices provided by Markit for the US synthetic CMBS indices.
10 Total Return Benchmark Data 10.1. – 10.3. Total Return Data These graphs represent historical return composites generated by tracking the aggregate asset value on an underlying portfolio of single name bonds. Data are provided by Markit and are preliminary.
11. Asset-Backed Commercial Paper (ABCP) 11.1. – 11.2. ABCP Historical Issuance; ABCP Issuance by Nationality of Issuer European issuance is provided by Dealogic, which identifies the issuer’s nationality as the country in which the SPV is domiciled. These data do not represent the seller-servicers of the underlying assets or the bank conduits for the ABCP deals. The US data are provided by Moody’s Investors Service. The volumes are converted from dollar to euro based on the end-of-quarter exchange rate.
11.3. European ABCP Issuance by Programme Type ABCP data by programme type is provided by Dealogic. The programme type classifications included are: SIVs, single-seller conduit, multi-seller conduit and ‘unspecified’.
Dealogic provides the issuer’s nationality as the country in which the SPV is domiciled. This data does not represent the seller-servicers of the underlying assets or the bank conduits for ABCP deals.
11.4. ABCP Outstandings by Nationality of Issuer The European outstanding is provided by country through the Dealogic database, and the US data are provided by Moody’s Investors Service. Dealogic identifies the issuer’s nationality as the country in which the SPV is domiciled. The dollar volumes were converted to euro based on the end-of-quarter exchange rate.
US ABCP figures are based on programmes rated by Moody’s NY office ABCP Program Index, regardless of market; some euro-denominated ABCP may be included in volume totals.
11.5. – 11.6. ABCP Outstandings by Programme Type Outstanding quarterly data are provided for Europe and the US by, respectively, Dealogic and Moody’s Investor Service. The volumes are converted from dollars to euro based on the end-of-quarter exchange rate. The programme type classifications included are: loan-backed, SIVs, single-seller conduit, multi-seller conduit and ‘unspecified’.
Unspecified programme types within the US data contain both arbitrage and hybrid programme types.
11.7. ABCP Spreads The US ABCP spread information is based on data collected and developed by the Federal Reserve. The spread is defined as the difference between AA ABCP and AA nonfinancial CP.
12. Global Comparative Data 12.1. - 12.2. Global Corporate Bond and Government Bond Issuance These statistics are provided by Dealogic and present issuance volumes for corporate bonds and government bonds in Asia, the US and Europe. Government bond and corporate bond figures represent gross, not net issuance. In terms of geographical description, Europe represents the European, the Middle East and African (EMEA)

Summary of the Methodologies Adopted for this Report
Securitisation Data Report Page 34
countries while Asia includes the Pacific countries and Japan.
Global corporate bond issuance is for investment grade bonds, public placements only. Global government bond issuance includes all agency and non-agency issuances and does not include supranationals.

Annex
Securitisation Data Report Page 35
Annex Disclaimer The AFME Securitisation Data Report (the “Report”) is intended for general information only, and is not intended to be and should not be relied upon as being legal, financial, investment, tax, regulatory, business or other professional advice. Neither AFME nor SIFMA represents or warrants that it is accurate, suitable or complete and neither of AFME nor SIFMA or their respective employees or consultants shall have any liability arising from, or relating to, the use of this Report or its contents.
Your receipt of the Report is subject to paragraphs 3, 4, 5, 9, 10, 11 and 13 of the Terms of Use which are applicable to AFME’s website (available at http://www.afme.eu/Legal/Terms-of-Use.aspx) and, for the purposes of such Terms of Use, the Report shall be considered a “Material” (regardless of whether you have received or accessed it via AFME’s website or otherwise).

Securitisation Data Report Page 36
London Office 39th Floor 25 Canada Square London E14 5LQ United Kingdom
Brussels Office Rue de la Loi, 82 1040 Brussels Belgium
Frankfurt Office Skyper Villa Taunusanlage 1 60329 Frankfurt am Main Germany
Switchboard: +44 (0)20 3828 2700
Switchboard: +32 (0) 2 788 3971
Switchboard: +49 (0) 69 5050 60 590
AFME Richard Hopkin - Managing Director, Head of Fixed Income Anna Bak – Associate Director, Securitisation Julio Suarez – Associate Director, Research
SIFMA Kyle Brandon - Managing Director, Director of Research Sharon Sung – Vice President, Research
www.afme.eu
www.sifma.org
AFME is registered on the EU Transparency Register, registration number 65110063986-76