SECURITIES AND EXCHANGE COMMISSION Form...
51
SECURITIES AND EXCHANGE COMMISSION Washington, D.C. 20549 Form 10-K (Mark One) ≤ ANNUAL REPORT PURSUANT TO SECTION 13 OR 15(d) OF THE SECURITIES EXCHANGE ACT OF 1934 For the Ñscal year ended May 31, 2001 OR n TRANSITION REPORT PURSUANT TO SECTION 13 OR 15(d) OF THE SECURITIES EXCHANGE ACT OF 1934 For the transition period from to . Commission File No. 1-10635 NIKE, Inc. (Exact name of Registrant as speciÑed in its charter) OREGON 93-0584541 (State or other jurisdiction of (IRS Employer IdentiÑcation No.) incorporation) One Bowerman Drive Beaverton, Oregon 97005-6453 (Address of principal executive oÇces) (Zip Code) (503) 671-6453 (Registrant's Telephone Number, Including Area Code) Securities registered pursuant to Section 12(b) of the Act: (Title of each class) (Name of each exchange on which registered) Class B Common Stock New York Stock Exchange PaciÑc Stock Exchange Securities registered pursuant to Section 12(g) of the Act: None Indicate by check mark whether the Registrant (1) has Ñled all reports required to be Ñled by Section 13 or 15(d) of the Securities Exchange Act of 1934 during the preceding 12 months (or for such shorter period that the Registrant was required to Ñle such reports), and (2) has been subject to such Ñling requirements for the past 90 days. Yes ≤ No n As of July 25, 2001, the aggregate market value of the Registrant's Class A Common Stock held by nonaÇliates of the Registrant was $150,509,504 and the aggregate market value of the Registrant's Class B Common Stock held by nonaÇliates of the Registrant was $7,801,584,944. As of July 25, 2001, the number of shares of the Registrant's Class A Common Stock outstanding was 99,126,334 and the number of shares of the Registrant's Class B Common Stock outstanding was 170,114,060. DOCUMENTS INCORPORATED BY REFERENCE: Parts of Registrant's Proxy Statement dated August 10, 2001 for the annual meeting of shareholders to be held on September 17, 2001 are incorporated by reference into Part III of this Report. Indicate by check mark if disclosure of delinquent Ñlers pursuant to Item 405 of Regulation S-K (229.405 of this chapter) is not contained herein, and will not be contained to the best of Registrant's knowledge, in deÑnitive proxy or information statements incorporated by reference in Part III of this Form 10-K or any amendment to this Form 10-K. n
Transcript of SECURITIES AND EXCHANGE COMMISSION Form...
SECURITIES AND EXCHANGE COMMISSIONWashington, D.C. 20549
Form 10-K
(Mark One)
≤ ANNUAL REPORT PURSUANT TO SECTION 13 OR 15(d) OF THESECURITIES EXCHANGE ACT OF 1934
For the Ñscal year ended May 31, 2001
OR
n TRANSITION REPORT PURSUANT TO SECTION 13 OR 15(d) OF THESECURITIES EXCHANGE ACT OF 1934
For the transition period from to .
Commission File No. 1-10635
NIKE, Inc.(Exact name of Registrant as speciÑed in its charter)
OREGON 93-0584541(State or other jurisdiction of (IRS Employer IdentiÑcation No.)
incorporation)
One Bowerman DriveBeaverton, Oregon 97005-6453
(Address of principal executive oÇces) (Zip Code)
(503) 671-6453(Registrant's Telephone Number, Including Area Code)
Securities registered pursuant to Section 12(b) of the Act:
(Title of each class) (Name of each exchange on which registered)
Class B Common Stock New York Stock ExchangePaciÑc Stock Exchange
Securities registered pursuant to Section 12(g) of the Act:None
Indicate by check mark whether the Registrant (1) has Ñled all reports required to be Ñled by Section 13or 15(d) of the Securities Exchange Act of 1934 during the preceding 12 months (or for such shorter periodthat the Registrant was required to Ñle such reports), and (2) has been subject to such Ñling requirements forthe past 90 days. Yes ≤ No n
As of July 25, 2001, the aggregate market value of the Registrant's Class A Common Stock held bynonaÇliates of the Registrant was $150,509,504 and the aggregate market value of the Registrant's Class BCommon Stock held by nonaÇliates of the Registrant was $7,801,584,944.
As of July 25, 2001, the number of shares of the Registrant's Class A Common Stock outstanding was99,126,334 and the number of shares of the Registrant's Class B Common Stock outstanding was 170,114,060.
DOCUMENTS INCORPORATED BY REFERENCE:
Parts of Registrant's Proxy Statement dated August 10, 2001 for the annual meeting of shareholders to beheld on September 17, 2001 are incorporated by reference into Part III of this Report.
Indicate by check mark if disclosure of delinquent Ñlers pursuant to Item 405 of Regulation S-K(229.405 of this chapter) is not contained herein, and will not be contained to the best of Registrant'sknowledge, in deÑnitive proxy or information statements incorporated by reference in Part III of thisForm 10-K or any amendment to this Form 10-K. n
NIKE, INC.ANNUAL REPORT ON FORM 10-K
TABLE OF CONTENTS
Page
PART I
Item 1. Business ÏÏÏÏÏÏÏÏÏÏÏÏÏÏÏÏÏÏÏÏÏÏÏÏÏÏÏÏÏÏÏÏÏÏÏÏÏÏÏÏÏÏÏÏÏÏÏÏÏÏÏÏÏÏÏÏÏÏÏÏÏÏÏÏÏÏÏÏ 1
General ÏÏÏÏÏÏÏÏÏÏÏÏÏÏÏÏÏÏÏÏÏÏÏÏÏÏÏÏÏÏÏÏÏÏÏÏÏÏÏÏÏÏÏÏÏÏÏÏÏÏÏÏÏÏÏÏÏÏÏÏÏÏÏÏÏÏÏÏÏ 1
Products ÏÏÏÏÏÏÏÏÏÏÏÏÏÏÏÏÏÏÏÏÏÏÏÏÏÏÏÏÏÏÏÏÏÏÏÏÏÏÏÏÏÏÏÏÏÏÏÏÏÏÏÏÏÏÏÏÏÏÏÏÏÏÏÏÏÏÏÏ 1
Sales and Marketing ÏÏÏÏÏÏÏÏÏÏÏÏÏÏÏÏÏÏÏÏÏÏÏÏÏÏÏÏÏÏÏÏÏÏÏÏÏÏÏÏÏÏÏÏÏÏÏÏÏÏÏÏÏÏÏÏÏÏ 2
United States Market ÏÏÏÏÏÏÏÏÏÏÏÏÏÏÏÏÏÏÏÏÏÏÏÏÏÏÏÏÏÏÏÏÏÏÏÏÏÏÏÏÏÏÏÏÏÏÏÏÏÏÏÏÏÏÏÏÏ 2
International Markets ÏÏÏÏÏÏÏÏÏÏÏÏÏÏÏÏÏÏÏÏÏÏÏÏÏÏÏÏÏÏÏÏÏÏÏÏÏÏÏÏÏÏÏÏÏÏÏÏÏÏÏÏÏÏÏÏÏ 3
SigniÑcant Customers ÏÏÏÏÏÏÏÏÏÏÏÏÏÏÏÏÏÏÏÏÏÏÏÏÏÏÏÏÏÏÏÏÏÏÏÏÏÏÏÏÏÏÏÏÏÏÏÏÏÏÏÏÏÏÏÏÏ 3
Orders ÏÏÏÏÏÏÏÏÏÏÏÏÏÏÏÏÏÏÏÏÏÏÏÏÏÏÏÏÏÏÏÏÏÏÏÏÏÏÏÏÏÏÏÏÏÏÏÏÏÏÏÏÏÏÏÏÏÏÏÏÏÏÏÏÏÏÏÏÏÏ 3
Product Research and Development ÏÏÏÏÏÏÏÏÏÏÏÏÏÏÏÏÏÏÏÏÏÏÏÏÏÏÏÏÏÏÏÏÏÏÏÏÏÏÏÏÏÏÏÏÏ 4
Manufacturing ÏÏÏÏÏÏÏÏÏÏÏÏÏÏÏÏÏÏÏÏÏÏÏÏÏÏÏÏÏÏÏÏÏÏÏÏÏÏÏÏÏÏÏÏÏÏÏÏÏÏÏÏÏÏÏÏÏÏÏÏÏÏÏ 4
Trade Legislation ÏÏÏÏÏÏÏÏÏÏÏÏÏÏÏÏÏÏÏÏÏÏÏÏÏÏÏÏÏÏÏÏÏÏÏÏÏÏÏÏÏÏÏÏÏÏÏÏÏÏÏÏÏÏÏÏÏÏÏÏÏ 5
Competition ÏÏÏÏÏÏÏÏÏÏÏÏÏÏÏÏÏÏÏÏÏÏÏÏÏÏÏÏÏÏÏÏÏÏÏÏÏÏÏÏÏÏÏÏÏÏÏÏÏÏÏÏÏÏÏÏÏÏÏÏÏÏÏÏÏ 6
Trademarks and Patents ÏÏÏÏÏÏÏÏÏÏÏÏÏÏÏÏÏÏÏÏÏÏÏÏÏÏÏÏÏÏÏÏÏÏÏÏÏÏÏÏÏÏÏÏÏÏÏÏÏÏÏÏÏÏÏ 7
Employees ÏÏÏÏÏÏÏÏÏÏÏÏÏÏÏÏÏÏÏÏÏÏÏÏÏÏÏÏÏÏÏÏÏÏÏÏÏÏÏÏÏÏÏÏÏÏÏÏÏÏÏÏÏÏÏÏÏÏÏÏÏÏÏÏÏÏ 7
Executive OÇcers of the Registrant ÏÏÏÏÏÏÏÏÏÏÏÏÏÏÏÏÏÏÏÏÏÏÏÏÏÏÏÏÏÏÏÏÏÏÏÏÏÏÏÏÏÏÏÏÏ 7
Item 2. Properties ÏÏÏÏÏÏÏÏÏÏÏÏÏÏÏÏÏÏÏÏÏÏÏÏÏÏÏÏÏÏÏÏÏÏÏÏÏÏÏÏÏÏÏÏÏÏÏÏÏÏÏÏÏÏÏÏÏÏÏÏÏÏÏÏÏÏÏ 9
Item 3. Legal Proceedings ÏÏÏÏÏÏÏÏÏÏÏÏÏÏÏÏÏÏÏÏÏÏÏÏÏÏÏÏÏÏÏÏÏÏÏÏÏÏÏÏÏÏÏÏÏÏÏÏÏÏÏÏÏÏÏÏÏÏÏÏ 9
Item 4. Submission of Matters to a Vote of Security HoldersÏÏÏÏÏÏÏÏÏÏÏÏÏÏÏÏÏÏÏÏÏÏÏÏÏÏÏÏÏÏÏ 10
PART II
Item 5. Market for Registrant's Common Equity and Related Stockholder Matters ÏÏÏÏÏÏÏÏÏÏÏÏ 10
Item 6. Selected Financial Data ÏÏÏÏÏÏÏÏÏÏÏÏÏÏÏÏÏÏÏÏÏÏÏÏÏÏÏÏÏÏÏÏÏÏÏÏÏÏÏÏÏÏÏÏÏÏÏÏÏÏÏÏÏÏÏ 11
Item 7. Management's Discussion and Analysis of Financial Condition and Results of Operations ÏÏÏ 12
Item 7A. Quantitative and Qualitative Disclosures about Market RiskÏÏÏÏÏÏÏÏÏÏÏÏÏÏÏÏÏÏÏÏÏÏÏÏÏ 18
Item 8. Financial Statements and Supplemental Data ÏÏÏÏÏÏÏÏÏÏÏÏÏÏÏÏÏÏÏÏÏÏÏÏÏÏÏÏÏÏÏÏÏÏÏÏÏ 22
Item 9. Changes in and Disagreements with Accountants on Accounting and FinancialDisclosure ÏÏÏÏÏÏÏÏÏÏÏÏÏÏÏÏÏÏÏÏÏÏÏÏÏÏÏÏÏÏÏÏÏÏÏÏÏÏÏÏÏÏÏÏÏÏÏÏÏÏÏÏÏÏÏÏÏÏÏÏÏÏÏÏÏÏÏ 44
PART III
(Except for the information set forth under ""Executive OÇcers of the Registrant'' inItem I above, Part III is incorporated by reference from the Proxy Statement for theNIKE, Inc. 2001 annual meeting of shareholders.)
Item 10. Directors and Executive OÇcers of the Registrant ÏÏÏÏÏÏÏÏÏÏÏÏÏÏÏÏÏÏÏÏÏÏÏÏÏÏÏÏÏÏÏÏÏ 44
Item 11. Executive CompensationÏÏÏÏÏÏÏÏÏÏÏÏÏÏÏÏÏÏÏÏÏÏÏÏÏÏÏÏÏÏÏÏÏÏÏÏÏÏÏÏÏÏÏÏÏÏÏÏÏÏÏÏÏÏÏ 44
Item 12. Security Ownership of Certain BeneÑcial Owners and Management ÏÏÏÏÏÏÏÏÏÏÏÏÏÏÏÏÏÏ 44
Item 13. Certain Relationships and Related Transactions ÏÏÏÏÏÏÏÏÏÏÏÏÏÏÏÏÏÏÏÏÏÏÏÏÏÏÏÏÏÏÏÏÏÏÏ 44
PART IV
Item 14. Exhibits, Financial Statement Schedules and Reports on Form 8-K ÏÏÏÏÏÏÏÏÏÏÏÏÏÏÏÏÏÏ 45
SIGNATURESÏÏÏÏÏÏÏÏÏÏÏÏÏÏÏÏÏÏÏÏÏÏÏÏÏÏÏÏÏÏÏÏÏÏÏÏÏÏÏÏÏÏÏÏÏÏÏÏÏÏÏÏÏÏÏÏÏÏÏÏÏÏÏÏÏÏÏÏÏÏÏÏ S-1
i
PART I
Item 1. Business
General
NIKE, Inc. was incorporated in 1968 under the laws of the state of Oregon. As used in this report, theterms ""we'', ""us'', ""NIKE'' and the ""Company'' refer to NIKE, Inc. and its predecessors, subsidiaries andaÇliates, unless the context indicates otherwise.
Our principal business activity involves the design, development and worldwide marketing of high qualityfootwear, apparel, equipment, and accessory products. NIKE is the largest seller of athletic footwear andathletic apparel in the world. We sell our products to approximately 17,000 retail accounts in the UnitedStates and through a mix of independent distributors, licensees and subsidiaries in approximately 140 coun-tries around the world. Virtually all of our products are manufactured by independent contractors. Virtually allfootwear products are produced outside the United States, while apparel products are produced both in theUnited States and abroad.
Products
NIKE's athletic footwear products are designed primarily for speciÑc athletic use, although a largepercentage of the products are worn for casual or leisure purposes. We place considerable emphasis on highquality construction and innovative design. Running, basketball, children's, cross-training and women's shoesare currently our top-selling product categories and we expect them to continue to lead in product sales in thenear future. However, we also market shoes designed for outdoor activities, tennis, golf, soccer, baseball,football, bicycling, volleyball, wrestling, cheerleading, aquatic activities, hiking, and other athletic andrecreational uses.
We sell active sports apparel covering most of the above categories, athletically inspired lifestyle apparel,as well as athletic bags and accessory items. NIKE apparel and accessories are designed to complement ourathletic footwear products, feature the same trademarks and are sold through the same marketing anddistribution channels. We often market footwear, apparel and accessories in ""collections'' of similar design orfor speciÑc purposes. We also market apparel with licensed college and professional team and league logos.
We sell a line of performance equipment under the NIKE brand name, including sport balls, timepieces,eyewear, skates, bats, gloves, and other equipment designed for sports activities. We also have agreements forlicensees to produce and sell NIKE brand swimwear, women's sports bras, cycling apparel, children's clothing,posters, school supplies, and electronic media devices.
We also sell a line of dress and casual footwear and accessories for men, women and children under thebrand name Cole Haan» through our wholly-owned subsidiary, Cole Haan Holdings Incorporated, headquar-tered in Maine. We also sell small amounts of various plastic products to other manufacturers through ourwholly-owned subsidiary, NIKE IHM, Inc.
Our wholly-owned subsidiary, Bauer NIKE Hockey Inc., headquartered in Greenland, New Hampshire,manufactures and distributes ice skates, skate blades, in-line roller skates, protective gear, hockey sticks, andhockey jerseys and accessories under the Bauer» and NIKE» brand names. Bauer also oÅers a full selection ofproducts for street, roller and Ñeld hockey.
1

Sales and Marketing
The table below shows certain information regarding NIKE's United States and international (non-U.S.)revenues for the last three Ñscal years.
May 31, 2001 2000 % CHG 1999 % CHG
(in millions)
USA Region
Footwear ÏÏÏÏÏÏÏÏÏÏÏÏÏÏÏÏÏÏÏÏÏÏÏÏÏÏÏÏÏÏÏ $3,208.9 $3,351.2 (4.2)% $3,244.6 3.3%
Apparel ÏÏÏÏÏÏÏÏÏÏÏÏÏÏÏÏÏÏÏÏÏÏÏÏÏÏÏÏÏÏÏÏ 1,260.3 1,154.4 9.2% 1,293.4 (10.7)%
Equipment and other ÏÏÏÏÏÏÏÏÏÏÏÏÏÏÏÏÏÏÏÏÏ 349.8 226.5 54.4% 212.7 6.5%
Total USAÏÏÏÏÏÏÏÏÏÏÏÏÏÏÏÏÏÏÏÏÏÏÏÏ 4,819.0 4,732.1 1.8% 4,750.7 (0.4)%
Europe, Middle East & Africa (EMEA) Region
Footwear ÏÏÏÏÏÏÏÏÏÏÏÏÏÏÏÏÏÏÏÏÏÏÏÏÏÏÏÏÏÏÏ 1,422.8 1,309.4 8.7% 1,207.3 8.5%
Apparel ÏÏÏÏÏÏÏÏÏÏÏÏÏÏÏÏÏÏÏÏÏÏÏÏÏÏÏÏÏÏÏÏ 976.3 933.9 4.5% 917.7 1.8%
Equipment and other ÏÏÏÏÏÏÏÏÏÏÏÏÏÏÏÏÏÏÏÏÏ 185.7 163.7 13.4% 168.8 (3.0)%
Total Europe ÏÏÏÏÏÏÏÏÏÏÏÏÏÏÏÏÏÏÏÏÏÏ 2,584.8 2,407.0 7.4% 2,293.8 4.9%
Asia PaciÑc Region
Footwear ÏÏÏÏÏÏÏÏÏÏÏÏÏÏÏÏÏÏÏÏÏÏÏÏÏÏÏÏÏÏÏ 632.4 557.0 13.5% 455.3 22.3%
Apparel ÏÏÏÏÏÏÏÏÏÏÏÏÏÏÏÏÏÏÏÏÏÏÏÏÏÏÏÏÏÏÏÏ 374.8 321.0 16.8% 319.8 0.4%
Equipment and other ÏÏÏÏÏÏÏÏÏÏÏÏÏÏÏÏÏÏÏÏÏ 102.8 77.1 33.3% 69.4 11.1%
Total Asia PaciÑc ÏÏÏÏÏÏÏÏÏÏÏÏÏÏÏÏÏÏ 1,110.0 955.1 16.2% 844.5 13.1%
Americas Region
Footwear ÏÏÏÏÏÏÏÏÏÏÏÏÏÏÏÏÏÏÏÏÏÏÏÏÏÏÏÏÏÏÏ 359.6 343.9 4.6% 311.2 10.5%
Apparel ÏÏÏÏÏÏÏÏÏÏÏÏÏÏÏÏÏÏÏÏÏÏÏÏÏÏÏÏÏÏÏÏ 152.2 137.7 10.5% 146.2 (5.8)%
Equipment and other ÏÏÏÏÏÏÏÏÏÏÏÏÏÏÏÏÏÏÏÏÏ 27.3 12.5 118.4% 11.7 6.8%
Total Americas ÏÏÏÏÏÏÏÏÏÏÏÏÏÏÏÏÏÏÏÏ 539.1 494.1 9.1% 469.1 5.3%
Total NIKE brand ÏÏÏÏÏÏÏÏÏÏÏÏÏÏÏÏÏÏÏÏÏÏÏÏÏ 9,052.9 8,588.3 5.4% 8,358.1 2.8%
Other brands ÏÏÏÏÏÏÏÏÏÏÏÏÏÏÏÏÏÏÏÏÏÏÏÏÏÏÏÏÏÏ 435.9 406.8 7.2% 418.8 (2.9)%
Total Revenues ÏÏÏÏÏÏÏÏÏÏÏÏÏÏÏÏÏÏÏÏÏÏÏÏÏÏÏÏ $9,488.8 $8,995.1 5.5% $8,776.9 2.5%
Financial information about geographic and segment operations appears in Note 16 of the consolidatedÑnancial statements on page 41.
We experience moderate Öuctuations in aggregate sales volume during the year. However, the mix ofproduct sales may vary considerably from time to time as a result of changes in seasonal and geographicdemand for particular types of footwear, apparel, and equipment.
Because NIKE is a consumer products company, the relative popularity of various sports and Ñtnessactivities and changing design trends aÅect the demand for our products. We must therefore respond to trendsand shifts in consumer preferences by adjusting the mix of existing product oÅerings, developing new products,styles and categories, and inÖuencing sports and Ñtness preferences through aggressive marketing. This is acontinuing risk. Failure to timely and adequately respond could have a material adverse aÅect on our sales andproÑtability.
United States Market
During Ñscal 2001, sales in the United States accounted for approximately 54 percent of total revenues,compared to 56 percent in Ñscal 2000 and 57 percent in Ñscal 1999. We sell to approximately 17,000 retailaccounts in the United States. The NIKE brand domestic retail account base includes a mix of departmentstores, footwear stores, sporting goods stores, skating, tennis and golf shops, and other retail accounts. DuringÑscal year 2001, our three largest customers accounted for approximately 29 percent of NIKE brand sales inthe United States, and 27 percent of total sales in the United States.
2
We make substantial use of our ""futures'' ordering program, which allows retailers to order Ñve to sixmonths in advance of delivery with the guarantee that 90 percent of their orders will be delivered within a settime period at a Ñxed price. In Ñscal year 2001, 86 percent of our U.S. footwear shipments (excluding ColeHaan and Bauer) were made under the futures program, compared to 90 percent in Ñscal 2000 and 91 percentin Ñscal 1999. In Ñscal 2001, 78 percent of our U.S. apparel shipments were made under the futures program,compared to 82 percent in Ñscal 2000, and 80 percent in 1999.
We utilize 16 NIKE sales oÇces to solicit sales in the United States. We also utilize 30 independent salesrepresentatives to sell specialty products for golf, cycling, water sports and outdoor activities. In addition, weoperate the following retail outlets in the United States:
Retail Stores Number
NIKE factory stores (which carry primarily B-grade and close-outmerchandise)ÏÏÏÏÏÏÏÏÏÏÏÏÏÏÏÏÏÏÏÏÏÏÏÏÏÏÏÏÏÏÏÏÏÏÏÏÏÏÏÏÏÏÏÏÏÏÏÏÏÏÏÏÏÏ 81
NIKE stores ÏÏÏÏÏÏÏÏÏÏÏÏÏÏÏÏÏÏÏÏÏÏÏÏÏÏÏÏÏÏÏÏÏÏÏÏÏÏÏÏÏÏÏÏÏÏÏÏÏÏÏÏÏÏÏÏ 2
NIKETOWNs (designed to showcase NIKE products) ÏÏÏÏÏÏÏÏÏÏÏÏÏÏÏÏÏÏÏÏ 13
Employee-only stores ÏÏÏÏÏÏÏÏÏÏÏÏÏÏÏÏÏÏÏÏÏÏÏÏÏÏÏÏÏÏÏÏÏÏÏÏÏÏÏÏÏÏÏÏÏÏÏÏÏ 4
Cole Haan stores (including factory and employee stores) ÏÏÏÏÏÏÏÏÏÏÏÏÏÏÏÏÏÏ 57
Total ÏÏÏÏÏÏÏÏÏÏÏÏÏÏÏÏÏÏÏÏÏÏÏÏÏÏÏÏÏÏÏÏÏÏÏÏÏÏÏÏÏÏÏÏÏÏÏÏÏÏÏÏÏÏÏ 157
NIKE's domestic distribution centers for footwear are located in Beaverton, Oregon, Wilsonville, Oregon,Memphis, Tennessee, and Greenland, New Hampshire. Apparel products are shipped from the Memphisdistribution center. Cole Haan footwear and Bauer NIKE Hockey products are distributed primarily fromGreenland, New Hampshire, and licensed team apparel is shipped from Foothill Ranch, California.
International Markets
We currently market our products in approximately 140 countries outside of the United States throughindependent distributors, licensees, subsidiaries and branch oÇces. Non-U.S. sales accounted for 46 percent oftotal revenues in Ñscal 2001, compared to 44 percent in Ñscal 2000 and 43 percent in Ñscal 1999. We operate19 distribution centers in Europe, Asia, Australia, Latin America, and Canada, and also distribute throughindependent distributors and licensees. We estimate that our products are sold through more than 30,000 retailaccounts outside the United States. In many countries and regions, including Japan, Canada, Asia, LatinAmerica, and Europe, we have a futures ordering program for retailers similar to the United States futuresprogram described above. NIKE's three largest customers outside of the U.S. accounted for approximately10 percent of non-U.S. sales.
We operate 111 retail outlets outside the United States, which are comprised of NIKETOWNs, factorystores, employee stores, and Cole Haan stores.
International branch oÇces and subsidiaries of NIKE are located in Argentina, Australia, Austria,Belgium, Brazil, Canada, Chile, Croatia, Czech Republic, Denmark, Finland, France, Germany, Hong Kong,Hungary, Indonesia, India, Ireland, Italy, Japan, Korea, Malaysia, Mexico, New Zealand, The Netherlands,Norway, Peoples Republic of China, The Philippines, Poland, Portugal, Singapore, Slovenia, South Africa,Spain, Sweden, Switzerland, Taiwan, Thailand, Turkey, the United Kingdom, and Vietnam.
SigniÑcant Customers
Venator Group Inc., which operates a chain of retail stores specializing in athletic footwear and apparel,accounted for approximately 12 percent of global net sales of NIKE brand products during Ñscal 2001. Noother customer accounted for 10 percent or more of our net sales during Ñscal 2001.
Orders
As of May 31, 2001, our worldwide futures orders for NIKE brand athletic footwear and apparel totaled$4.3 billion, compared to $4.2 billion as of May 31, 2000. These orders are scheduled for delivery from June
3
through November of 2001. Based upon historical data, we expect that approximately 95 percent of theseorders will be Ñlled in that time period, although the orders may be cancelable.
Product Research and Development
We believe that our research and development eÅorts are a key factor in our past and future success.Technical innovation in the design of footwear, apparel, and athletic equipment receive continued emphasis asNIKE strives to produce products that reduce or eliminate injury, aid athletic performance and maximizecomfort.
In addition to NIKE's own staÅ of specialists in the areas of biomechanics, exercise physiology,engineering, industrial design and related Ñelds, we also utilize research committees and advisory boards madeup of athletes, coaches, trainers, equipment managers, orthopedists, podiatrists and other experts who consultwith us and review designs, materials and concepts for product improvement. Employee athletes wear-test andevaluate products during the design and development process.
Manufacturing
In Ñscal 2001, approximately Ñve percent of total NIKE brand apparel production for sale to the UnitedStates market was manufactured in the United States by independent contract manufacturers, most of whichare located in the southern states. The remainder was manufactured by independent contractors located in28 countries. Most of this apparel production occurred in Bangladesh, China, Hong Kong, India, Indonesia,Malaysia, Mexico, Pakistan, The Philippines, Sri Lanka, Taiwan, and Thailand. Substantially all of ourapparel production for sale to the international market was manufactured outside the U.S. Our largest singleapparel supplier accounted for approximately eight percent of total Ñscal 2001 apparel production.
Virtually all of our footwear is produced outside of the United States. In Ñscal 2001, contract suppliers inthe following countries manufactured the following percentages of total NIKE brand footwear:
Country Percent
People's Republic of China ÏÏÏÏÏÏÏÏÏÏÏÏÏÏÏÏÏÏÏÏÏÏÏÏÏÏÏÏÏÏÏÏÏÏÏÏÏÏÏÏÏÏÏÏ 40
Indonesia ÏÏÏÏÏÏÏÏÏÏÏÏÏÏÏÏÏÏÏÏÏÏÏÏÏÏÏÏÏÏÏÏÏÏÏÏÏÏÏÏÏÏÏÏÏÏÏÏÏÏÏÏÏÏÏÏÏÏÏ 31
Vietnam ÏÏÏÏÏÏÏÏÏÏÏÏÏÏÏÏÏÏÏÏÏÏÏÏÏÏÏÏÏÏÏÏÏÏÏÏÏÏÏÏÏÏÏÏÏÏÏÏÏÏÏÏÏÏÏÏÏÏÏÏ 13
Thailand ÏÏÏÏÏÏÏÏÏÏÏÏÏÏÏÏÏÏÏÏÏÏÏÏÏÏÏÏÏÏÏÏÏÏÏÏÏÏÏÏÏÏÏÏÏÏÏÏÏÏÏÏÏÏÏÏÏÏÏÏ 13
ItalyÏÏÏÏÏÏÏÏÏÏÏÏÏÏÏÏÏÏÏÏÏÏÏÏÏÏÏÏÏÏÏÏÏÏÏÏÏÏÏÏÏÏÏÏÏÏÏÏÏÏÏÏÏÏÏÏÏÏÏÏÏÏÏÏ 1
Taiwan ÏÏÏÏÏÏÏÏÏÏÏÏÏÏÏÏÏÏÏÏÏÏÏÏÏÏÏÏÏÏÏÏÏÏÏÏÏÏÏÏÏÏÏÏÏÏÏÏÏÏÏÏÏÏÏÏÏÏÏÏÏ 1
South KoreaÏÏÏÏÏÏÏÏÏÏÏÏÏÏÏÏÏÏÏÏÏÏÏÏÏÏÏÏÏÏÏÏÏÏÏÏÏÏÏÏÏÏÏÏÏÏÏÏÏÏÏÏÏÏÏÏÏ 1
We also have manufacturing agreements with independent factories in Argentina, Brazil, Mexico, SouthAfrica, and Zimbabwe, to manufacture footwear for sale within those countries. Our largest single footwearsupplier accounted for approximately 6 percent of total Ñscal 2001 footwear production.
The principal materials used in our footwear products are natural and synthetic rubber, plasticcompounds, foam cushioning materials, nylon, leather, canvas, and polyurethane Ñlms used to make AIR-SOLE cushioning components. NIKE IHM, Inc., a wholly-owned subsidiary of NIKE, is our sole supplier ofthe AIR-SOLE cushioning components used in footwear. The principal materials used in our apparel productsare natural and synthetic fabrics and threads, plastic and metal hardware, and specialized performance fabricsdesigned to repel rain, retain heat, or eÇciently transport body moisture. NIKE and its contractors andsuppliers buy raw materials in bulk. Most raw materials are available in the countries where manufacturingtakes place. We have thus far experienced little diÇculty in satisfying our raw material requirements.
Our international operations are subject to the usual risks of doing business abroad, such as possiblerevaluation of currencies, export duties, quotas, restrictions on the transfer of funds and, in certain parts of theworld, political instability. See ""Trade Legislation'' below. We have not, to date, been materially aÅected byany such risk, but cannot predict the likelihood of such developments occurring. We believe that we have theability to develop, over a period of time, adequate alternative sources of supply for the products obtained from
4
our present suppliers outside of the United States. If events prevented us from acquiring products from oursuppliers in a particular country, our footwear operations could be temporarily disrupted and we couldexperience an adverse Ñnancial impact. However, we believe that we could eliminate any such disruptionwithin a period of no more than 12 months, and that any adverse impact would, therefore, be of a short-termnature. We believe that our principal competitors are subject to similar risks.
All of our products manufactured overseas and imported into the United States and other countries aresubject to duties collected by customs authorities. Customs information submitted by us is routinely subject toreview by customs authorities. We are unable to predict whether additional customs duties, quotas or otherrestrictions may be imposed on the importation of our products in the future. The enactment of any suchduties, quotas or restrictions could result in increases in the cost of our products generally and might adverselyaÅect the sales or proÑtability of NIKE and the imported footwear and apparel industry as a whole.
Since 1972, Nissho Iwai American Corporation (""NIAC''), a subsidiary of Nissho Iwai Corporation, alarge Japanese trading company, has performed signiÑcant import-export Ñnancing services for us. Currently,NIAC provides such Ñnancing services with respect to more than 80 percent of the NIKE products soldoutside of the United States, Europe and Japan. Any failure of NIAC to provide these services could disruptour ability to acquire products from our suppliers and to deliver products to our customers outside of theUnited States, Europe and Japan. If prolonged, such a disruption could result in cancelled orders that wouldadversely aÅect sales and proÑtability. We believe that any such disruption would be short term in durationdue to the ready availability of alternative sources of Ñnancing at competitive rates. Our current agreementswith NIAC expire on May 31, 2003.
Trade Legislation
Our non-U.S. operations are subject to the usual risks of doing business abroad, such as the imposition ofimport quotas or anti-dumping duties. In 1994, the European Union (""EU'') Commission imposed quotas oncertain types of footwear manufactured in China. These quotas replaced national quotas that had previously beenin effect in several Member States. Footwear designed for use in sporting activities, meeting certain technicalcriteria and having a CIF (cost, insurance and freight) price above 9 euros (""Special Technology AthleticFootwear'' or ""STAF''), is excluded from the quotas. As a result of the STAF exclusion, and the amount ofquota made available to us, the quotas have not, to date, had a material effect on our business.
In 1995, the EU Commission, at the request of European footwear manufacturers, initiated two anti-dumping investigations covering footwear imported from the People's Republic of China, Indonesia andThailand. As a result, in October 1997 the Commission imposed deÑnitive anti-dumping duties on certaintextile upper footwear imported from China and Indonesia. In February 1998, the Commission imposeddeÑnitive anti-dumping duties on certain synthetic and leather upper footwear originating in China, Indonesiaand Thailand. In the case of textile upper footwear, the anti-dumping duties do not cover sports footwear. Inthe case of synthetic and leather upper footwear, the anti-dumping duties do not cover footwear meeting theSTAF technical criteria and with a CIF price above 5.7 euros. As a result, the anti-dumping duties forsynthetic and leather upper footwear apply only to low cost footwear. In our case, these duties primarily aÅectchildren's shoes and low cost sandals. While the exclusions are subject to some interpretation by customsauthorities, we believe that most of our footwear sourced in the target countries for sale in the EU Ñts withinthe exclusions. We have also shifted the production of these types of footwear to other countries. Accordingly,the anti-dumping duties have not had a material eÅect on our business.
While we have no reason to believe that the sports footwear exclusions from the quotas (which willremain in place through 2004) and anti-dumping duties will be eliminated, the EU Commission in June 2000issued an amendment to the explanatory notes to the EU's customs nomenclature (""CN''). The amendment,which is not legally binding, interprets some of the technical criteria for the STAF exclusion and the footweartypes that can be classiÑed as for use in sporting activity. The amendment could restrict the scope of theSTAF exclusion from the quotas and also the sports footwear exclusions from the two EU anti-dumpingmeasures. In addition, the Commission has altered its administration of the quota system in a manner that
5
would preclude national customs authorities from opting to grant the exclusion to certain other footwear types,notably sandals.
We cannot assess the full impact of the amendment to the CN explanatory notes until the nationalcustoms administrations clarify their national application of its non-binding provisions. In the meantime, weare assessing the legal issues relating to both the Commission's action in issuing the amendment and itsrelated administrative action concerning other footwear originating in China. We will closely monitor furtherdevelopments and will seek, by individual action and through relevant trade associations, to preventinterpretations and administrative measures that would subject a greater portion of our products to the quotasand anti-dumping duties.
If the EU trade measures become substantially more restrictive as a result of the recent Commissionmeasures, we would recommend that our European subsidiaries consider, in addition to possible legalremedies, shifting the production of such footwear to other countries in order to maintain competitive pricing.We believe that we are prepared to deal eÅectively with any such change of circumstances and that anyadverse impact would be of a temporary nature. We continue to closely monitor international restrictions andmaintain our multi-country sourcing strategy and contingency plans. We believe that our major competitorsstand in much the same position regarding these trade measures.
The People's Republic of China (""China'') is a material source of footwear production for NIKE. Aspart of China's bid to join the World Trade Organization (""WTO''), and after the United States and Chinareached a comprehensive trade agreement, former President Clinton submitted legislation to Congress whichwould grant permanent non-discriminatory ""normal trade relations'' (""NTR'', formerly ""most favorednation'') trading status to China. In 2000, Congress approved the legislation, but because China had notÑnished its accession negotiations with the WTO, in June 2001 President Bush extended NTR to China on anannual basis. That decision was recently supported by Congress. Once China completes the terms of accessionto the WTO, Congress has provided the President with the authority to grant China permanent NTR.Bringing China into the WTO and providing permanent NTR to China will eventually reduce barriers toproducing products in, exporting products from, and marketing and selling products within China.
We are also currently sourcing footwear and apparel products from factories in Vietnam. From 1995 to1998, former President Clinton took several steps to normalize economic and diplomatic relations between theUnited States and Vietnam. The President's actions were steps toward restoration of full trade relations whichincludes the United States granting non-discriminatory NTR trading status to Vietnam which would result inlower tariÅs between the two countries. In July 2000, the United States and Vietnam signed a comprehensivebilateral trade agreement, which would, among other things, provide reciprocal NTR between the twocountries. In June 2001, that agreement was submitted to Congress for consideration. If approved by theU.S. Congress and the Vietnamese National Assembly, the United States will grant an annual extension ofNTR to Vietnam. This grant must be renewed annually by the President and reviewed by the Congress. Wecurrently believe that Congress will consider the trade agreement by the end of this calendar year. If Congressapproves the trade agreement, the grant of NTR trading status for Vietnam could expand our production andmarketing opportunities in Vietnam and allow for Vietnamese sourced product to enter the United States atNTR tariÅ rates.
Competition
The athletic footwear, apparel and equipment industry is keenly competitive in the United States and ona worldwide basis. We compete internationally with an increasing number of athletic and leisure shoecompanies, athletic and leisure apparel companies, sports equipment companies, and large companies havingdiversiÑed lines of athletic and leisure shoes, apparel and equipment, including Reebok, Adidas and others.The intense competition and the rapid changes in technology and consumer preferences in the markets forathletic and leisure footwear and apparel, and athletic equipment, constitute signiÑcant risk factors in ouroperations.
NIKE is the largest seller of athletic footwear and athletic apparel in the world. Performance andreliability of shoes, apparel, and equipment, new product development, price, product identity through
6
marketing and promotion, and customer support and service are important aspects of competition in theathletic footwear, apparel and equipment industry. To help market our products, we contract with prominentand inÖuential athletes, coaches, teams, colleges, and sports leagues to endorse our brands and use ourproducts, and we actively sponsor sporting events and clinics. We believe that we are competitive in all ofthese areas.
Trademarks and Patents
We utilize trademarks on nearly all of our products and believe that having distinctive marks that arereadily identiÑable is an important factor in creating a market for our goods, in identifying the Company, andin distinguishing our goods from the goods of others. We consider our NIKE» and Swoosh Design»trademarks to be among our most valuable assets and we have registered these trademarks in over100 countries. In addition, we own many other trademarks which we utilize in marketing our products. Wecontinue to vigorously protect our trademarks against infringement.
NIKE has an exclusive, worldwide license to make and sell footwear using patented ""Air'' technology.The process utilizes pressurized gas encapsulated in polyurethane. Some of the early NIKE AIR» patentshave expired, which may enable competitors to use certain types of like technology. Subsequent NIKE AIRpatents will not expire for several years. We also have a number of patents covering components and featuresused in various athletic and leisure shoes. We believe that our success depends primarily upon skills in design,research and development, production and marketing rather than upon our patent position. However, we havefollowed a policy of Ñling applications for United States and foreign patents on inventions, designs andimprovements that we deem valuable.
Employees
We had approximately 22,700 employees at May 31, 2001. Management considers its relationship withemployees to be excellent. With the exception of Bauer NIKE Hockey Inc., our employees are notrepresented by a union. Of Bauer NIKE Hockey's North American employees, approximately 65 percent, orfewer than 450, are covered by three union collective bargaining agreements with three separate bargainingunits, and of Bauer NIKE Hockey's approximately 170 employees in Italy, approximately 30 percent, or fewerthan 50, are covered by three collective bargaining agreements. The collective bargaining agreements expireon various dates from 2001 through 2003. There has never been a material interruption of operations due tolabor disagreements.
Executive OÇcers of the Registrant
The executive oÇcers of NIKE as of July 25, 2001 are as follows:
Philip H. Knight, Chief Executive OÇcer, Chairman of the Board, and President Ì Mr. Knight, 63, adirector since 1968, is a co-founder of NIKE and, except for the period from June 1983 through September1984, served as its President from 1968 to 1990, and from June 2000 to present. Prior to 1968, Mr. Knight wasa certiÑed public accountant with Price Waterhouse and Coopers & Lybrand and was an Assistant Professorof Business Administration at Portland State University.
Donald W. Blair, Vice President and Chief Financial OÇcer Ì Mr. Blair, 43, joined NIKE in November1999. Prior to joining NIKE, he held a number of Ñnancial management positions with Pepsico, Inc.,including Vice President, Finance of Pepsi-Cola Asia, Vice President, Planning of PepsiCo's Pizza HutDivision, and Senior Vice President, Finance of The Pepsi Bottling Group, Inc. Prior to joining Pepsico,Mr. Blair was a certiÑed public accountant with Deloitte, Haskins, and Sells.
Thomas E. Clarke, President of New Ventures Ì Dr. Clarke, 50, a director since 1994, joined theCompany in 1980. He was appointed divisional Vice President in charge of marketing in 1987, electedcorporate Vice President in 1989, appointed General Manager in 1990, and served as President and ChiefOperating OÇcer from 1994 to 1999. Dr. Clarke previously held various positions with the Company,primarily in research, design, development and marketing. Dr. Clarke holds a doctorate degree inbiomechanics.
7

Charles D. Denson, President of the NIKE Brand Ì Mr. Denson, 45, has been employed by NIKE sinceFebruary 1979. Mr. Denson held several positions within the Company, including his appointments asDirector of USA Apparel Sales in 1994, divisional Vice President, US Sales in 1994, divisional Vice PresidentEuropean Sales in 1997, divisional Vice President and General Manager, NIKE Europe in 1998, VicePresident and General Manager of NIKE USA in June 2000, and President of the NIKE Brand in March2001.
Gary M. DeStefano, President of USA Operations Ì Mr. DeStefano, 44, has been employed by NIKEsince 1982, with primary responsibilities in sales and regional administration. Mr. DeStefano was appointedDirector of Domestic Sales in 1990, divisional Vice President in charge of domestic sales in 1992, VicePresident of Global Sales in 1996, Vice President and General Manager of Asia PaciÑc in March 1997, andPresident of USA Operations in March 2001.
Mindy F. Grossman, Vice President of Global Apparel Ì Ms. Grossman, 43, joined NIKE in October2000. Prior to joining NIKE, she was President and Chief Executive OÇcer of Polo Jeans Company/RalphLauren, a division of Jones Apparel Group, from 1995 to 2000. Prior to that, Ms. Grossman was VicePresident of New Business Development at Polo Ralph Lauren Corp. from 1994 to 1995, President of TheWarnaco Group Inc. Chaps Ralph Lauren division, and Senior Vice President of The Warnaco Group Inc.Menswear division from 1991 to 1994.
P. Eunan McLaughlin, Vice President, Asia PaciÑc Ì Mr. McLaughlin, 43, joined NIKE as VicePresident Sales, NIKE Europe in February 1999, was appointed Vice President Commercial Sales and Retailin February 2000. and became Vice President, Asia PaciÑc in June 2001. Prior to joining NIKE, he wasPartner and Vice President of Consumer & Retail Practices Division, Korn/Ferry International from 1996 to1999. From 1985 to 1996 Mr. McLaughlin held the following positions with Mars, Inc.: Finance Director,Sales Director, and Managing Director of Germany Drink Division; Operations Director of Pedigree PetFoods; and European Sales & Marketing Director. Mr. McLaughlin also worked for Reynolds McCarron(formerly Ernst & Young) in Ireland.
Mark G. Parker, President of the NIKE Brand Ì Mr. Parker, 44, has been employed by NIKE since1979 with primary responsibilities in product research, design and development. Mr. Parker was appointeddivisional Vice President in charge of development in 1987, corporate Vice President in 1989, GeneralManager in 1993, Vice President of Global Footwear in 1998, and President of the NIKE Brand in March2001.
Eric D. Sprunk, Vice President, Global Footwear Ì Mr. Sprunk, 37, joined the Company in 1993. Hewas appointed Finance Director and General Manager of the Americas in 1994, Finance Director, NIKEEurope in 1995, Regional General Manager, NIKE Europe Footwear in 1998, and Vice President & GeneralManager of the Americas in 2000. Mr. Sprunk was appointed Vice President, Global Footwear in June 2001.
Lindsay D. Stewart, Vice President and Chief of StaÅ, and Assistant Secretary Ì Mr. Stewart, 54, joinedNIKE as Assistant Corporate Counsel in 1981. Mr. Stewart became Corporate Counsel in 1983. He wasappointed Vice President and General Counsel in 1991, and Chief of StaÅ in March 2001. Prior to joiningNIKE, Mr. Stewart was in private practice and an attorney for Georgia-PaciÑc Corporation.
Frits D. van Paasschen, Vice President and General Manager, NIKE Europe Ì Mr. van Paasschen, 40,has been employed by NIKE since 1997. He served as Vice President, Strategic Planning, and was appointedVice President and General Manager, The Americas and Africa in 1998, and corporate Vice President andGeneral Manager, NIKE Europe in 2000. Mr. van Paasschen was formerly Vice President, Finance &Planning, Disney Consumer Products, The Walt Disney Company.
8
Item 2. Properties
Following is a summary of principal properties owned or leased by NIKE. Our leases expire at variousdates through the year 2017.
U.S. Administrative OÇces: Distribution Facilities:Beaverton, Oregon (9 locations) Ì 8 leased Greenland, New Hampshire Ì leasedWilsonville, Oregon Wilsonville, OregonMemphis, Tennessee (2 locations) Ì 1 leased Forest Park, GeorgiaYarmouth, Maine Memphis, Tennessee (2 locations) Ì 1 leasedCharlotte, North Carolina Ì leased Foothill Ranch, California Ì leased
Canada (2 locations) Ì leasedInternational Administrative OÇces:Europe (3 locations) Ì 2 leasedCanada (4 locations) Ì leasedAsia PaciÑc (12 locations) Ì 10 leasedEurope (18 locations) Ì leasedLatin America (2 locations) Ì leasedAsia PaciÑc (16 locations) Ì leased
Latin America (5 locations) Ì leased International Production OÇces:Africa (2 locations) Ì leased Europe (2 locations) Ì leased
Latin America (2 locations) Ì leasedSales OÇces and Showrooms:Asia PaciÑc (27 locations) Ì leasedUnited States (23 locations) Ì leased
Canada (4 locations) Ì leased Manufacturing Facilities:Europe (26 locations) Ì leased United States (3 locations) Ì 1 leasedAsia PaciÑc (17 locations) Ì leased Canada (3 locations) Ì 2 leasedLatin America (7 locations) Ì leased Europe (2 locations) Ì leasedAfrica (2 locations) Ì leased Asia PaciÑc (1 location) Ì owned
Retail Outlets:United States (157 locations) Ì 154 leasedCanada (7 locations) Ì leasedEurope (34 locations) Ì leasedAsia PaciÑc (57 locations) Ì leasedLatin America (13 locations) Ì leased
Item 3. Legal Proceedings
Except as described below, there are no material pending legal proceedings, other than ordinary routinelitigation incidental to our business, to which we are a party or of which any of our property is the subject.
The Company and certain of its oÇcers and directors were named as defendants in four substantiallyidentical securities class actions Ñled in the U.S. District Court for the District of Oregon on March 9, 14, 20,and April 4, 2001. On July 23, 2001, the cases were consolidated as In re NIKE, Inc. Securities Litigation,CV-01-332-K. The consolidated amended complaint seeks unspeciÑed damages on behalf of a purported classconsisting of purchasers of the Company's stock during the period December 20, 2000 through February 26,2001. PlaintiÅs allege that the defendants made false and misleading statements about the Company's actualand expected business and Ñnancial performance in violation of federal securities laws. PlaintiÅs further allegethat certain individual defendants sold Company stock while in possession of material non-public information.While the litigation is in a very preliminary stage, based on the available information we do not currentlyanticipate that the action will have a material Ñnancial impact. We believe the claims are without merit, andwe intend to vigorously defend them.
A related shareholder derivative lawsuit, Metivier v. Denunzio, et al., 0104-04339, was Ñled in theMultnomah County Circuit Court of the State of Oregon on April 26, 2001. The derivative suit was broughtby certain Company shareholders, allegedly on behalf of the Company, against certain directors and oÇcers ofthe Company. The derivative plaintiÅs allege that these oÇcers and directors breached their Ñduciary duties tothe Company by making or causing to be made alleged misstatements about the Company's actual andexpected Ñnancial performance while certain oÇcers and directors sold Company stock and by allowing theCompany to be sued in the shareholder class action. The derivative plaintiÅs seek compensatory and other
9
damages, and disgorgement of compensation received. On July 25, 2001, the Court entered a stipulation andorder abating the action until further notice.
In accordance with the Company's Articles of Incorporation and Bylaws, and in accordance withindemnity agreements between the Company and the directors and oÇcers named in the legal actions, theCompany has agreed to indemnify these individuals and assume their defense in the actions.
Item 4. Submission of Matters to a Vote of Security Holders
No matter was submitted during the fourth quarter of the 2001 Ñscal year to a vote of security holders,through the solicitation of proxies or otherwise.
PART II
Item 5. Market for Registrant's Common Equity and Related Stockholder Matters
NIKE's Class B Common Stock is listed on the New York Stock Exchange and the PaciÑc StockExchange and trades under the symbol NKE. At July 25, 2001, there were approximately 19,500 holders ofrecord of our Class B Common Stock and 27 holders of record of our Class A Common Stock. These Ñguresdo not include beneÑcial owners who hold shares in nominee name. The Class A Common Stock is notpublicly traded but each share is convertible upon request of the holder into one share of Class B CommonStock.
We refer to the table entitled ""Selected Quarterly Financial Data'' in Item 6, which lists, for the periodsindicated, the range of high and low closing sales prices on the New York Stock Exchange. That table alsodescribes the amount and frequency of all cash dividends declared on our common stock for the 2001 and2000 Ñscal years.
10

Item 6. Selected Financial Data
FINANCIAL HISTORY(in millions, except per share data, Ñnancial ratios and number of shareholders)
2001 2000 1999 1998 1997 1996 1995 1994 1993 1992 1991
Year Ended May 31,
Revenues ÏÏÏÏÏÏÏÏÏÏÏÏÏÏÏÏÏÏÏÏÏÏ $ 9,488.8 $ 8,995.1 $ 8,776.9 $ 9,553.1 $ 9,186.5 $ 6,470.6 $4,760.8 $3,789.7 $3,931.0 $3,405.2 $3,003.6
Gross margin ÏÏÏÏÏÏÏÏÏÏÏÏÏÏÏÏÏÏ 3,703.9 3,591.3 3,283.4 3,487.6 3,683.5 2,563.9 1,895.6 1,488.2 1,544.0 1,316.1 1,153.1
Gross margin % ÏÏÏÏÏÏÏÏÏÏÏÏÏÏÏÏ 39.0% 39.9% 37.4% 36.5% 40.1% 39.6% 39.8% 39.3% 39.3% 38.7% 38.4%
Restructuring charge, net ÏÏÏÏÏÏÏÏ 0.1 (2.5) 45.1 129.9 Ì Ì Ì Ì Ì Ì Ì
Net incomeÏÏÏÏÏÏÏÏÏÏÏÏÏÏÏÏÏÏÏÏ 589.7 579.1 451.4 399.6 795.8 553.2 399.7 298.8 365.0 329.2 287.0
Basic earnings per commonshare ÏÏÏÏÏÏÏÏÏÏÏÏÏÏÏÏÏÏÏÏÏÏÏ 2.18 2.10 1.59 1.38 2.76 1.93 1.38 1.00 1.20 1.09 0.96
Diluted earnings per commonshare ÏÏÏÏÏÏÏÏÏÏÏÏÏÏÏÏÏÏÏÏÏÏÏ 2.16 2.07 1.57 1.35 2.68 1.88 1.36 0.99 1.18 1.07 0.94
Average common sharesoutstanding ÏÏÏÏÏÏÏÏÏÏÏÏÏÏÏÏÏÏ 270.0 275.7 283.3 288.7 288.4 286.6 289.6 298.6 302.9 301.7 300.4
Diluted average common sharesoutstanding ÏÏÏÏÏÏÏÏÏÏÏÏÏÏÏÏÏÏ 273.3 279.4 288.3 295.0 297.0 293.6 294.0 301.8 308.3 306.4 304.3
Cash dividends declared percommon share ÏÏÏÏÏÏÏÏÏÏÏÏÏÏÏ 0.48 0.48 0.48 0.46 0.38 0.29 0.24 0.20 0.19 0.15 0.13
Cash Öow from operationsÏÏÏÏÏÏÏÏ 656.5 699.6 941.4 517.5 323.1 339.7 254.9 576.5 265.3 435.8 11.1
Price range of common stock
HighÏÏÏÏÏÏÏÏÏÏÏÏÏÏÏÏÏÏÏÏÏÏÏÏ 59.438 64.125 65.500 64.125 76.375 52.063 20.156 18.688 22.563 19.344 13.625
Low ÏÏÏÏÏÏÏÏÏÏÏÏÏÏÏÏÏÏÏÏÏÏÏÏ 35.188 26.563 31.750 37.750 47.875 19.531 14.06 3 10.781 13.750 8.781 6.500
At May 31,
Cash and equivalents ÏÏÏÏÏÏÏÏÏÏÏÏ $ 304.0 $ 254.3 $ 198.1 $ 108.6 $ 445.4 $ 262.1 $ 216.1 $ 518.8 $ 291.3 $ 260.1 $ 119.8
InventoriesÏÏÏÏÏÏÏÏÏÏÏÏÏÏÏÏÏÏÏÏÏ 1,424.1 1,446.0 1,170.6 1,396.6 1,338.6 931.2 629.7 470.0 593.0 471.2 586.6
Working capital ÏÏÏÏÏÏÏÏÏÏÏÏÏÏÏÏ 1,838.6 1,456.4 1,818.0 1,828.8 1,964.0 1,259.9 938.4 1,208.4 1,165.2 964.3 662.6
Total assets ÏÏÏÏÏÏÏÏÏÏÏÏÏÏÏÏÏÏÏÏ 5,819.6 5,856.9 5,247.7 5,397.4 5,361.2 3,951.6 3,142.7 2,373.8 2,186.3 1,871.7 1,707.2
Long-term debt ÏÏÏÏÏÏÏÏÏÏÏÏÏÏÏÏ 435.9 470.3 386.1 379.4 296.0 9.6 10.6 12.4 15.0 69.5 30.0
Redeemable Preferred Stock ÏÏÏÏÏ 0.3 0.3 0.3 0.3 0.3 0.3 0.3 0.3 0.3 0.3 0.3
Shareholders' equityÏÏÏÏÏÏÏÏÏÏÏÏÏ 3,494.5 3,136.0 3,334.6 3,261.6 3,155.9 2,431.4 1,964.7 1,740.9 1,642.8 1,328.5 1,029.6
Year-end stock price ÏÏÏÏÏÏÏÏÏÏÏÏ 41.100 42.875 60.938 46.000 57.500 50.188 19.719 14.750 18.125 14.500 9.938
Market capitalization ÏÏÏÏÏÏÏÏÏÏÏÏ 11,039.5 11,559.1 17,202.2 13,201.1 16,633.0 14,416.8 5,635.2 4,318.8 5,499.3 4,379.6 2,993.0
Financial Ratios:
Return on equity ÏÏÏÏÏÏÏÏÏÏÏÏÏÏÏ 17.8% 17.9% 13.7% 12.5% 28.5% 25.2% 21.6% 17.7% 24.5% 27.9% 31.7%
Return on assets ÏÏÏÏÏÏÏÏÏÏÏÏÏÏÏÏ 10.1% 10.4% 8.5% 7.4% 17.1% 15.6% 14.5% 13.1% 18.0% 18.4% 20.5%
Inventory turns ÏÏÏÏÏÏÏÏÏÏÏÏÏÏÏÏÏ 4.0 4.1 4.3 4.4 4.8 5.0 5.2 4.3 4.5 3.9 4.1
Current ratio at May 31 ÏÏÏÏÏÏÏÏÏ 2.0 1.7 2.3 2.1 2.1 1.9 1.8 3.2 3.6 3.3 2.1
Price/Earnings ratio at May 31(Diluted)ÏÏÏÏÏÏÏÏÏÏÏÏÏÏÏÏÏÏÏÏ 19.0 20.7 38.8 34.1 21.5 26.6 14.5 14.9 15.3 13.5 10.5
Geographic Revenues:
United States ÏÏÏÏÏÏÏÏÏÏÏÏÏÏÏÏÏÏ $ 5,144.2 $ 5,017.4 $ 5,042.6 $ 5,460.0 $ 5,538.2 $ 3,964.7 $2,997.9 $2,432.7 $2,528.8 $2,270.9 $2,141.5
EuropeÏÏÏÏÏÏÏÏÏÏÏÏÏÏÏÏÏÏÏÏÏÏÏÏ 2,584.8 2,407.0 2,293.8 2,096.1 1,789.8 1,334.3 980.4 927.3 1,085.7 919.8 664.7
Asia/PaciÑc ÏÏÏÏÏÏÏÏÏÏÏÏÏÏÏÏÏÏÏ 1,110.0 955.1 844.5 1,253.9 1,241.9 735.1 515.6 283.4 178.2 75.7 56.2
Americas (exclusive of UnitedStates)ÏÏÏÏÏÏÏÏÏÏÏÏÏÏÏÏÏÏÏÏÏÏ 649.8 615.6 596.0 743.1 616.6 436.5 266.9 146.3 138.3 138.8 141.2
Total Revenues ÏÏÏÏÏÏÏÏÏÏÏÏÏÏÏÏ $ 9,488.8 $ 8,995.1 $ 8,776.9 $ 9,553.1 $ 9,186.5 $ 6,470.6 $4,760.8 $3,789.7 $3,931.0 $3,405.2 $3,003.6
11

All per common share data has been adjusted to reÖect the 2-for-1 stock splits paid October 23, 1996,October 30, 1995 and October 5, 1990. The Company's Class B Common Stock is listed on the New York andPaciÑc Exchanges and trades under the symbol NKE. At May 31, 2001, there were approximately141,000 shareholders of Class A and Class B common stock.
FINANCIAL HIGHLIGHTS(in millions, except per share data and Ñnancial ratios)
Year Ended May 31,
2001 2000 % CHG
Revenues ÏÏÏÏÏÏÏÏÏÏÏÏÏÏÏÏÏÏÏÏÏÏÏÏÏÏÏÏÏÏÏÏÏÏÏÏÏÏÏÏÏÏÏÏÏÏÏÏÏÏÏÏÏ $9,488.8 $8,995.1 5.5%
Gross margin ÏÏÏÏÏÏÏÏÏÏÏÏÏÏÏÏÏÏÏÏÏÏÏÏÏÏÏÏÏÏÏÏÏÏÏÏÏÏÏÏÏÏÏÏÏÏÏÏÏÏ 3,703.9 3,591.3 3.1%
Gross margin %ÏÏÏÏÏÏÏÏÏÏÏÏÏÏÏÏÏÏÏÏÏÏÏÏÏÏÏÏÏÏÏÏÏÏÏÏÏÏÏÏÏÏÏÏÏÏÏÏ 39.0% 39.9%
Net income ÏÏÏÏÏÏÏÏÏÏÏÏÏÏÏÏÏÏÏÏÏÏÏÏÏÏÏÏÏÏÏÏÏÏÏÏÏÏÏÏÏÏÏÏÏÏÏÏÏÏÏ 589.7 579.1 1.8%
Basic earnings per common share ÏÏÏÏÏÏÏÏÏÏÏÏÏÏÏÏÏÏÏÏÏÏÏÏÏÏÏÏÏÏÏÏÏ 2.18 2.10 3.8%
Diluted earnings per common share ÏÏÏÏÏÏÏÏÏÏÏÏÏÏÏÏÏÏÏÏÏÏÏÏÏÏÏÏÏÏÏ 2.16 2.07 4.3%
Return on equity ÏÏÏÏÏÏÏÏÏÏÏÏÏÏÏÏÏÏÏÏÏÏÏÏÏÏÏÏÏÏÏÏÏÏÏÏÏÏÏÏÏÏÏÏÏÏÏ 17.8% 17.9%
Stock price at May 31. ÏÏÏÏÏÏÏÏÏÏÏÏÏÏÏÏÏÏÏÏÏÏÏÏÏÏÏÏÏÏÏÏÏÏÏÏÏÏÏÏÏÏ 41.100 42.875 (4.1)%
SELECTED QUARTERLY FINANCIAL DATA (UNAUDITED)(in millions, except per share data and Ñnancial ratios)
1st Quarter 2nd Quarter 3rd Quarter 4th Quarter
2001 2000 2001 2000 2001 2000 2001 2000
Revenues ÏÏÏÏÏÏÏÏÏÏÏÏÏÏÏÏÏÏÏÏÏ $2,636.7 $2,501.1 $2,198.7 $2,059.7 $2,170.1 $2,161.6 $2,483.3 $2,272.7
Gross marginÏÏÏÏÏÏÏÏÏÏÏÏÏÏÏÏÏÏ 1,067.5 966.4 871.4 821.7 828.6 875.2 936.4 928.0
Gross margin % ÏÏÏÏÏÏÏÏÏÏÏÏÏÏÏ 40.5% 38.6% 39.6% 39.9% 38.2% 40.5% 37.7% 40.8%
Net income ÏÏÏÏÏÏÏÏÏÏÏÏÏÏÏÏÏÏÏ 210.2 200.2 119.4 107.5 97.4 145.3 162.7 126.1
Basic earnings per commonshare ÏÏÏÏÏÏÏÏÏÏÏÏÏÏÏÏÏÏÏÏÏÏ 0.78 0.71 0.44 0.39 0.36 0.53 0.60 0.47
Diluted earnings per commonshare ÏÏÏÏÏÏÏÏÏÏÏÏÏÏÏÏÏÏÏÏÏÏ 0.77 0.70 0.44 0.38 0.35 0.52 0.60 0.46
Average common sharesoutstanding ÏÏÏÏÏÏÏÏÏÏÏÏÏÏÏÏÏ 269.9 281.1 269.8 277.3 270.9 276.1 269.3 270.2
Diluted average common sharesoutstanding ÏÏÏÏÏÏÏÏÏÏÏÏÏÏÏÏÏ 273.8 285.5 273.2 281.2 274.6 276.9 271.5 273.9
Cash dividends declared percommon share ÏÏÏÏÏÏÏÏÏÏÏÏÏÏ 0.12 0.12 0.12 0.12 0.12 0.12 0.12 0.12
Price range of common stockHighÏÏÏÏÏÏÏÏÏÏÏÏÏÏÏÏÏÏÏÏÏÏÏ 48.000 64.125 44.500 58.750 59.438 52.813 45.090 46.563
Low ÏÏÏÏÏÏÏÏÏÏÏÏÏÏÏÏÏÏÏÏÏÏÏ 35.188 46.750 36.375 44.250 39.050 26.563 36.300 26.750
Item 7. Management's Discussion and Analysis of Financial Condition and Results of Operations
Highlights
‚ Fiscal year 2001 revenues increased 5.5% to $9.5 billion, compared to $9.0 billion in Ñscal year 2000.
‚ Net income increased in Ñscal year 2001 to $589.7 million from $579.1 million in the prior year.
‚ Fiscal year 2001 diluted earnings per share increased by 4.3%, from $2.07 to $2.16.
‚ Gross margins declined as a percentage of revenues to 39.0% from 39.9% in Ñscal year 2000.
‚ Selling and administrative expenses also declined as a percentage of revenues to 28.3% from 29.0% inÑscal year 2000.
12

Results of Operations
Fiscal 2001 Compared to Fiscal 2000
Net income increased 1.8% over Ñscal 2000, from $579.1 million to $589.7 million. Although consoli-dated revenues increased 5.5% over Ñscal 2000, income before income taxes was essentially Öat as pretax proÑtmargins decreased due to a lower gross margin percentage, higher interest expense, and increased otheroperating expenses, partially oÅset by lower selling and administrative expenses as a percent of revenue.Despite Öat income before income taxes, net income increased due to a lower eÅective tax rate. Dilutedearnings per share increased 4.3%, from $2.07 to $2.16. The percentage increase in earnings per share washigher than that of net income primarily due to share repurchases in Ñscal years 2000 and 2001.
NIKE brand revenues in the United States region increased 1.8% as compared to Ñscal 2000, whileNIKE brand revenues in our international regions increased 9.8%. Had the U.S. dollar remained constant withthe prior year, these international revenues would have increased 18.6%, and consolidated revenues would haveadvanced 9.3%. In the United States region, our largest market segment, the 1.8% increase in revenuesreÖected a 9.2% increase in apparel sales and a 54.4% increase in equipment sales, oÅset by a 4.2% decrease infootwear sales. The increases in apparel and equipment reÖected stronger demand for in-line products. Theincrease in the equipment product line reÖected increases in a variety of sports equipment categories, includinggolf, football, and baseball products as well as socks, bags and eyewear. The decrease in footwear reÖectedlower demand, particularly in the mid-range price segment, and supply chain disruptions resulting from theimplementation of a new global demand and supply planning system. The supply chain disruptions resulted inproduct excesses as well as product shortages and late deliveries in the second half of the Ñscal year.
In Ñscal 2001, NIKE brand revenues from our international regions continued to grow, both as apercentage of total company revenues and in total dollars as compared to Ñscal 2000. These revenuesrepresented 44.6% of total company revenues as compared to 42.9% in Ñscal 2000. Revenues from ourinternational regions were $4.2 billion as compared to $3.9 billion in Ñscal 2000. Revenues in our Europe,Middle East, and Africa (EMEA) region increased for the seventh consecutive year. Fiscal 2001 revenues inEMEA increased over Ñscal 2000 by 7.4% to $2,584.8 million, a 19.3% increase in constant dollars. In ourAsia PaciÑc region, revenues grew 16.2%, a 20.8% increase in constant dollars. The Americas region grewrevenues 9.1%, an 11.4% increase in constant dollars.
In Ñscal 2001, revenue from other brands increased 7.2% to $435.9 million.
Worldwide futures and advance orders for NIKE brand athletic footwear and apparel scheduled fordelivery from June through November 2001 were 3% higher than such orders booked in the comparable periodof Ñscal 2000. The percentage growth in these orders is not necessarily indicative of our expectation of revenuegrowth in subsequent periods. This is because the mix of orders can shift between advance/futures and at-onceorders. In addition, exchange rate Öuctuations as well as diÅering levels of order cancellations can causediÅerences in the comparisons between future orders and actual revenues. Finally, a signiÑcant portion of ourrevenues are not derived from futures orders, including those from our equipment product line, U.S. licensedteam apparel product line, retail operations, and other brands, including Bauer NIKE Hockey and Cole Haan.
13
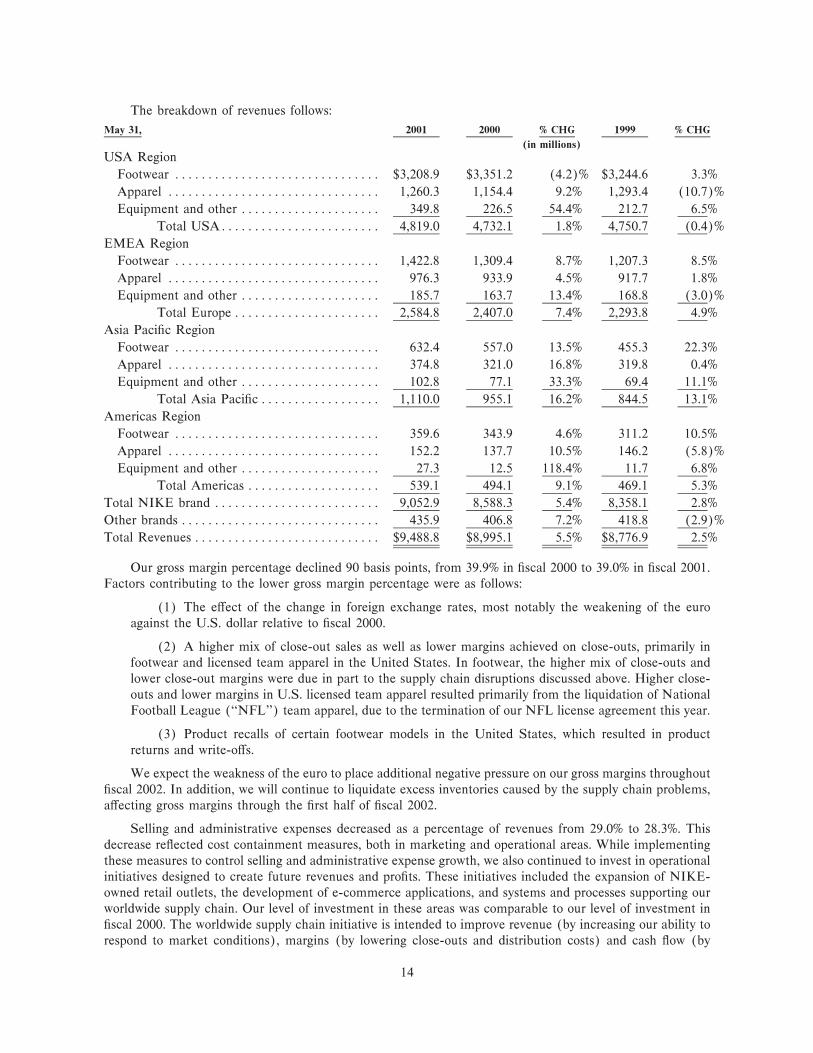
The breakdown of revenues follows:
May 31, 2001 2000 % CHG 1999 % CHG
(in millions)
USA Region
Footwear ÏÏÏÏÏÏÏÏÏÏÏÏÏÏÏÏÏÏÏÏÏÏÏÏÏÏÏÏÏÏÏ $3,208.9 $3,351.2 (4.2)% $3,244.6 3.3%
Apparel ÏÏÏÏÏÏÏÏÏÏÏÏÏÏÏÏÏÏÏÏÏÏÏÏÏÏÏÏÏÏÏÏ 1,260.3 1,154.4 9.2% 1,293.4 (10.7)%
Equipment and other ÏÏÏÏÏÏÏÏÏÏÏÏÏÏÏÏÏÏÏÏÏ 349.8 226.5 54.4% 212.7 6.5%
Total USAÏÏÏÏÏÏÏÏÏÏÏÏÏÏÏÏÏÏÏÏÏÏÏÏ 4,819.0 4,732.1 1.8% 4,750.7 (0.4)%
EMEA Region
Footwear ÏÏÏÏÏÏÏÏÏÏÏÏÏÏÏÏÏÏÏÏÏÏÏÏÏÏÏÏÏÏÏ 1,422.8 1,309.4 8.7% 1,207.3 8.5%
Apparel ÏÏÏÏÏÏÏÏÏÏÏÏÏÏÏÏÏÏÏÏÏÏÏÏÏÏÏÏÏÏÏÏ 976.3 933.9 4.5% 917.7 1.8%
Equipment and other ÏÏÏÏÏÏÏÏÏÏÏÏÏÏÏÏÏÏÏÏÏ 185.7 163.7 13.4% 168.8 (3.0)%
Total Europe ÏÏÏÏÏÏÏÏÏÏÏÏÏÏÏÏÏÏÏÏÏÏ 2,584.8 2,407.0 7.4% 2,293.8 4.9%
Asia PaciÑc Region
Footwear ÏÏÏÏÏÏÏÏÏÏÏÏÏÏÏÏÏÏÏÏÏÏÏÏÏÏÏÏÏÏÏ 632.4 557.0 13.5% 455.3 22.3%
Apparel ÏÏÏÏÏÏÏÏÏÏÏÏÏÏÏÏÏÏÏÏÏÏÏÏÏÏÏÏÏÏÏÏ 374.8 321.0 16.8% 319.8 0.4%
Equipment and other ÏÏÏÏÏÏÏÏÏÏÏÏÏÏÏÏÏÏÏÏÏ 102.8 77.1 33.3% 69.4 11.1%
Total Asia PaciÑc ÏÏÏÏÏÏÏÏÏÏÏÏÏÏÏÏÏÏ 1,110.0 955.1 16.2% 844.5 13.1%
Americas Region
Footwear ÏÏÏÏÏÏÏÏÏÏÏÏÏÏÏÏÏÏÏÏÏÏÏÏÏÏÏÏÏÏÏ 359.6 343.9 4.6% 311.2 10.5%
Apparel ÏÏÏÏÏÏÏÏÏÏÏÏÏÏÏÏÏÏÏÏÏÏÏÏÏÏÏÏÏÏÏÏ 152.2 137.7 10.5% 146.2 (5.8)%
Equipment and other ÏÏÏÏÏÏÏÏÏÏÏÏÏÏÏÏÏÏÏÏÏ 27.3 12.5 118.4% 11.7 6.8%
Total Americas ÏÏÏÏÏÏÏÏÏÏÏÏÏÏÏÏÏÏÏÏ 539.1 494.1 9.1% 469.1 5.3%
Total NIKE brand ÏÏÏÏÏÏÏÏÏÏÏÏÏÏÏÏÏÏÏÏÏÏÏÏÏ 9,052.9 8,588.3 5.4% 8,358.1 2.8%
Other brands ÏÏÏÏÏÏÏÏÏÏÏÏÏÏÏÏÏÏÏÏÏÏÏÏÏÏÏÏÏÏ 435.9 406.8 7.2% 418.8 (2.9)%
Total Revenues ÏÏÏÏÏÏÏÏÏÏÏÏÏÏÏÏÏÏÏÏÏÏÏÏÏÏÏÏ $9,488.8 $8,995.1 5.5% $8,776.9 2.5%
Our gross margin percentage declined 90 basis points, from 39.9% in Ñscal 2000 to 39.0% in Ñscal 2001.Factors contributing to the lower gross margin percentage were as follows:
(1) The eÅect of the change in foreign exchange rates, most notably the weakening of the euroagainst the U.S. dollar relative to Ñscal 2000.
(2) A higher mix of close-out sales as well as lower margins achieved on close-outs, primarily infootwear and licensed team apparel in the United States. In footwear, the higher mix of close-outs andlower close-out margins were due in part to the supply chain disruptions discussed above. Higher close-outs and lower margins in U.S. licensed team apparel resulted primarily from the liquidation of NationalFootball League (""NFL'') team apparel, due to the termination of our NFL license agreement this year.
(3) Product recalls of certain footwear models in the United States, which resulted in productreturns and write-oÅs.
We expect the weakness of the euro to place additional negative pressure on our gross margins throughoutÑscal 2002. In addition, we will continue to liquidate excess inventories caused by the supply chain problems,aÅecting gross margins through the Ñrst half of Ñscal 2002.
Selling and administrative expenses decreased as a percentage of revenues from 29.0% to 28.3%. Thisdecrease reÖected cost containment measures, both in marketing and operational areas. While implementingthese measures to control selling and administrative expense growth, we also continued to invest in operationalinitiatives designed to create future revenues and proÑts. These initiatives included the expansion of NIKE-owned retail outlets, the development of e-commerce applications, and systems and processes supporting ourworldwide supply chain. Our level of investment in these areas was comparable to our level of investment inÑscal 2000. The worldwide supply chain initiative is intended to improve revenue (by increasing our ability torespond to market conditions), margins (by lowering close-outs and distribution costs) and cash Öow (by
14
reducing inventories). The ultimate level of beneÑt to revenues, margins, and cash Öows, if any, will not beknown until the new systems and processes have been implemented worldwide over the next few years.
Interest expense increased 30.4%, from $45.0 million to $58.7 million, due to higher average debt levels inÑscal 2001 versus Ñscal 2000. During Ñscal 2000, we increased debt to fund capital expenditures and higherworking capital requirements and to repurchase common stock. Although our debt balance decreased duringÑscal 2001, the average debt balance for Ñscal 2001 remained above the prior year.
Other income/expense was a net expense of $34.2 million versus a net expense of $23.2 million in Ñscal2000. SigniÑcant amounts included in other income/expense were interest income, proÑt sharing expense,goodwill amortization, certain foreign currency conversion gains and losses, and asset disposal gains and losses.
Our Ñscal 2001 eÅective tax rate was 36.0% as compared to 37.0% in Ñscal 2000. Factors contributing tothis decrease included lower taxes on a portion of foreign earnings that have been permanently investedoutside of the U.S. and additional research tax credits.
Fiscal 2000 Compared to Fiscal 1999
Net income increased 28.3% in Ñscal 2000 over Ñscal 1999, from $451.4 million to $579.1 million.Excluding the impact of restructuring charge activity in Ñscal 1999, net income advanced $100.4 million, or21.0%. Income before income taxes increased due to increased revenues and an improved gross margin,partially oÅset by higher selling and administrative expenses. The increased selling and administrativeexpenses in large part reÖected signiÑcant investments in new supply chain systems, e-commerce initiatives,and new retail stores, discussed further below. The increase in net income primarily reÖected the improvedincome before income taxes, but also reÖected a lower eÅective tax rate. Diluted earnings per share increased31.8%, more rapidly than net income, as a result of share repurchases during Ñscal 2000. Excluding the impactof restructuring charges, diluted earnings per share increased 24.7%.
Total NIKE revenues increased by 2.5% in Ñscal 2000. NIKE brand revenues in the United States regionwere Öat as compared to Ñscal 1999 while NIKE brand revenues in our international regions increased 6.9%.Had the U.S. dollar remained constant with the prior year, these international revenues would have increased11.9%, and consolidated revenues would have advanced 4.5%. Revenue growth in the United States wasslowed by a contraction of athletic sportswear retail space.
In Ñscal 2000, NIKE brand revenues from our international regions represented 42.9% of total companyrevenues and grew signiÑcantly during the year. Fiscal 2000 revenues in EMEA increased over Ñscal 1999 by4.9% to $2,407.0 million, 15.5% in constant dollars. In our Asia PaciÑc region, revenues grew 13.1%, a 4.7%increase in constant dollars. The Americas region grew revenues 5.3%, 7.2% in constant dollars.
In Ñscal 2000, our gross margin percentage improved 250 basis points, from 37.4% to 39.9%. The keyfactors in the improvement of margins were as follows:
(1) Increased margins on in-line products, particularly in apparel and equipment.
(2) Reduced levels of lower margin close-out sales, reÖecting lower inventories of close-out, out-of-season product.
(3) Higher margins on close-out sales, driven by the expansion of our network of outlet stores.
Selling and administrative expenses increased 7.4% in Ñscal 2000 to $2,606.4 million. Much of theincrease was driven by investments designed to create future revenues and proÑts, including opening newNIKE-owned retail outlets, development of e-commerce capability, initiatives to streamline our supply chain,and the conversion of certain international markets from independent distributorships to direct NIKEownership. Higher bad debt expense due to the bankruptcy Ñling of one of our U.S. customers, also increasedselling and administrative expenses in Ñscal 2000 versus Ñscal 1999.
Interest expense increased by 2.0% during Ñscal 2000 to $45.0 million. This increase reÖectedincremental interest costs due to signiÑcantly higher average debt balances than in Ñscal 1999. (Much of thisincrease was oÅset by the eÅect of lower interest rates outside of the U.S. and the eÅect of our restructuredoperating agreement with NIAC, which reduced the interest rate on product purchases Ñnanced by NIAC.)
15

Other income/expense was a net expense of $23.2 million in Ñscal 2000 as compared to a net expense of$21.5 million in Ñscal 1999. SigniÑcant amounts included in other income/expense were interest income,proÑt sharing expense, goodwill amortization, certain foreign exchange conversion gains and losses, and assetdisposal gains and losses. In Ñscal 1999, other income/expense also included a $15.0 million credit related tothe change in accounting for substantially all inventories in the U.S. from the last-in, Ñrst-out (LIFO) methodto the Ñrst-in, Ñrst-out (FIFO) method. The change was not suÇciently material to require presentation of thecumulative eÅect or to restate comparable income statements as dictated by Accounting Principles BoardOpinion No. 20.
Our eÅective tax rate was 37.0% in Ñscal 2000, signiÑcantly lower than the prior year rate of 39.5% inÑscal 1999. This decrease was primarily due to reduced state taxes and the utilization of tax loss carryforwardsin certain recently proÑtable foreign operations, where our eÅective rate is lower than in the U.S.
Fiscal 1999 Restructuring Charge
During Ñscal 1999, the Company incurred a $60.1 million restructuring charge as a result of certainactions taken to better align our cost structure with expected revenue growth rates. As a result of therestructuring actions, we were able to remove approximately $36 million from our cost structure.
The charge (shown below in tabular format) was primarily for costs of severing employees, includingseverance packages, lease abandonments and the write down of assets no longer in use. Two major areas thatwere aÅected by the reduction in force include our information technology functions, primarily in the U.S., aswe shifted to an outsource agreement for certain areas of our operations, and European customer service andaccounting, where we have been consolidating functions from individual countries to our European headquar-ters. Outside of these two areas, employees were terminated from various other areas around the Company,including our Asia PaciÑc region. The original number of employees to be terminated was 1,291. As ofMay 31, 2001, 71 employees have found positions elsewhere in the Company and 1,200 have left theCompany, leaving 20 still to be terminated.
The second major component of the 1999 charge was a write-oÅ of certain equipment, hardware andsoftware development costs at one of our U.S. distribution centers due to a change in strategy around how weÖow product for a speciÑc type of business.
Due to the change in the number of employees that will be terminated, $0.1 million and $1.4 million ofthe reserve was reversed during Ñscal 2001 and Ñscal 2000, respectively. The remaining accrual balance as ofMay 31, 2001 of $1.5 million will be relieved as leases expire and severance payments are completed.
Detail of the restructuring charge is as follows:
FY99 Reserve Reserve ReserveCash/ Restructuring FY99 Balance at FY00 Balance at FY01 Balance at
Description Non-Cash Charge Activity 5/31/99 Activity 5/31/00 Activity 5/31/01
(in millions)
Elimination of JobResponsibilities $(39.9) $21.9 $(18.0) $14.5 $(3.5) $1.8 $(1.7)
Severance packages ÏÏÏÏÏÏÏÏÏÏ cash (28.0) 11.7 (16.3) 12.9 (3.4) 1.8 (1.6)
Lease cancellations &commitments ÏÏÏÏÏÏÏÏÏÏÏÏÏ cash (2.4) 1.6 (0.8) 0.7 (0.1) Ì (0.1)
Write-down of assetsÏÏÏÏÏÏÏÏÏ non-cash (7.8) 7.8 Ì Ì Ì Ì Ì
Other ÏÏÏÏÏÏÏÏÏÏÏÏÏÏÏÏÏÏÏÏÏ cash/non-cash (1.7) 0.8 (0.9) 0.9 Ì Ì Ì
Change in warehouse distributionstrategy ÏÏÏÏÏÏÏÏÏÏÏÏÏÏÏÏÏÏÏÏ $(20.2) $20.2 Ì Ì Ì Ì Ì
Write-down of assetsÏÏÏÏÏÏÏÏÏ non-cash (20.2) 20.2 Ì Ì Ì Ì Ì
EÅect of foreign currencytranslationÏÏÏÏÏÏÏÏÏÏÏÏÏÏÏÏÏÏ Ì $ 0.1 $ 0.1 $(0.1) Ì $0.2 $ 0.2
Total ÏÏÏÏÏÏÏÏÏÏÏÏÏÏÏÏ $(60.1) $42.2 $(17.9) $14.4 $(3.5) $2.0 $(1.5)
16

Euro Conversion
On January 1, 1999, eleven of the Ñfteen member countries of the European Union establishedpermanent, Ñxed conversion rates between their existing currencies and the European Union's new commoncurrency, the euro. In January 2001, an additional country, Greece, also established a Ñxed conversion rate tothe euro. During the transition period ending December 31, 2001, public and private parties may pay for goodsand services using either the euro or the participating country's legacy currency. Beginning January 1, 2002,euro denominated bills and coins will be issued, and the legacy currencies will be completely withdrawn fromcirculation on June 30, 2002.
We have had a dedicated project team working on the euro transition strategy since January 1998. Wehave made modiÑcations to information technology systems supporting marketing, order management,purchasing, invoicing, payroll, and cash management functions, in order to make them euro compliant. Allmajor systems have been converted and are euro compliant, well ahead of the end of the transitional period.
We believe the introduction of the euro may create a move towards a greater level of wholesale priceharmonization, although diÅering country costs and value added tax rates will continue to result in pricediÅerences at the retail level. Over the past three years, we have been actively working to assess and, wherenecessary, adjust pricing practices to operate eÅectively in this new environment.
The costs of adapting our systems and practices to the implementation of the euro were generally relatedto the modiÑcation of existing systems and totaled approximately $8 million. These costs were expensed asincurred, primarily in Ñscal 2000. We believe that the conversion to the euro will not have a material impacton our Ñnancial condition or results of operations.
Recently Issued Accounting Standards
EÅective June 1, 2001, we will adopt Statement of Financial Accounting Standards (""SFAS'') No. 133,""Accounting for Derivative Instruments and Hedging Activities,'' as amended by SFAS No. 138, ""Account-ing for Certain Derivative Instruments and Certain Hedging Activities'' (FAS 133).
As required upon adoption of FAS 133, a one-time transition adjustment will be recorded as of June 1,2001 on both our consolidated statement of income and consolidated balance sheet. We estimate that thetransition adjustment on the consolidated statement of income to be a charge of approximately $5.1 million,net of tax eÅect. This amount relates to an investment that will be adjusted to fair value in accordance withFAS 133. The transition adjustment on the consolidated balance sheet represents the initial recognition of thefair values of hedge derivatives outstanding on the adoption date and realized gains and losses on eÅectivehedges for which the underlying exposure has not yet aÅected earnings. The transition adjustment on theconsolidated balance sheet is estimated to be an increase in current assets of $118.5 million, an increase innoncurrent assets of $87.0 million, an increase in current liabilities of $151.6 million, and an increase in othercomprehensive income of approximately $59.0 million, net of tax eÅects.
In July 2001, the Financial Accounting Standards Board issued SFAS No. 142 (FAS 142), ""Goodwilland Other Intangible Assets.'' Our adoption date is expected to be June 1, 2002. As required by FAS 142, wewill perform an impairment test on goodwill and other intangible assets as of the adoption date. Thereafter, wewill perform impairment tests annually and whenever events or circumstances occur indicating that goodwillor other intangible assets might be impaired. Amortization of goodwill and certain other intangible assets,including those recorded in past business combinations, will cease. We have not yet determined what theimpact of FAS 142 will be on our results of operations and Ñnancial position.
Liquidity and Capital Resources
Cash provided by operations was $656.5 million in Ñscal 2001, compared to $699.6 million in Ñscal 2000.Our primary source of operating cash Öow was net income earned during the year of $589.7 million. Thecompany also generated cash Öow by utilizing tax loss carryforwards, which resulted in a decrease in deferredincome tax assets during the year, and from income tax beneÑts from stock option exercises. These cash
17
inÖows were partially oÅset by a slight increase in operating working capital, which reÖected a higher level ofoperating activity in the current Ñscal year.
Cash used by investing activities during Ñscal 2001 was $342.3 million, compared to $440.0 millioninvested during Ñscal 2000. The total for Ñscal 2001 related primarily to capital expenditures for computerequipment and software, driven by our supply chain initiative; investments in new retail outlets; the expansionof our world headquarters; and the development of new distribution facilities in Japan. During Ñscal 2002, wewill continue to incur expenditures related to the supply chain initiative and retail expansion, although wecurrently expect total capital expenditures to be less than the total for Ñscal 2001.
Cash used by Ñnancing activities in Ñscal year 2001 was $349.9 million, up from $252.1 million in theprior year. This amount included uses of cash for dividends to shareholders, a net reduction of short-term debt,payment of a maturing note payable, and share repurchases. These uses of cash were partially oÅset byproceeds from the exercise of employee stock options.
The share repurchases were part of a $1.0 billion share repurchase program that began in Ñscal 2001, aftercompletion of a four-year, $1.0 billion program in Ñscal 2000. To date, under the new program we havepurchased a total of 4.0 million shares of NIKE's Class B common stock for $157.0 million. We expect tofund the current program largely from operating cash Öow. The timing and the amount of shares purchasedwill be dictated by our capital needs and stock market conditions.
We have Ñled a shelf registration with the Securities and Exchange Commission (SEC) under which$500.0 million in debt securities are available to be issued. Our long-term debt rating is A2 and A by Moody'sInvestor Service and Standard and Poor's Corporation, respectively.
Liquidity is also provided by our commercial paper program, under which there was $710.0 million and$691.9 million outstanding at May 31, 2001 and May 31, 2000, respectively. Our issuances of commercialpaper are required to be supported by committed lines of credit and/or cash. During Ñscal 2001, we enteredinto a new $1.25 billion committed credit facility with a group of banks: $750 million has a maturity of364 days from the facility date and $500 million has a maturity of Ñve years from the facility date. To date, wehave not borrowed under this facility. Each year, the $750 million, 364 day facility can be extended 364 days,and the $500 million, Ñve year facility can be extended one year. Our ratings for the issuance of commercialpaper are P1 and A1 by Moody's Investor Service and Standard and Poor's Corporation, respectively. We alsomaintain signiÑcant uncommitted short and long-term lines of credit with banks. At May 31, 2001 and 2000,we had letters of credit outstanding totaling $851.8 million and $678.2 million, respectively. These letters ofcredit were issued for the purchase of inventory.
Management currently believes that cash generated by operations, together with access to externalsources of funds, will be suÇcient to meet our operating and capital needs.
Dividends per share of common stock for Ñscal 2001 were $0.48, the same as in Ñscal 2000. We have paida dividend for every quarter since February 1984. Consistent with our practice in prior years, we will reviewour dividend policy at the meeting of our Board of Directors in November; however, based upon currentprojected earnings and cash Öow requirements, we anticipate continuing to pay a quarterly dividend.
Item 7A. Quantitative and Qualitative Disclosures about Market Risk
In the normal course of business and consistent with established policies and procedures, we employ avariety of Ñnancial instruments to manage exposure to Öuctuations in the value of foreign currencies andinterest rates. It is our policy to utilize these Ñnancial instruments only where necessary to Ñnance our businessand manage such exposures; we do not enter into these transactions for speculative purposes.
We are exposed to foreign currency Öuctuation as a result of our international sales, production andfunding activities. Our foreign currency risk management objective is to protect cash Öows from the adverseimpact of exchange rate movements. We use forward exchange contracts and purchased options to hedgecertain Ñrm commitments and the related receivables and payables, including third party or intercompanytransactions, and use purchased currency options to hedge certain anticipated but not yet Ñrmly committed
18
transactions. When we begin hedging exposures depends on the nature of the exposure and market conditions.Generally, all Ñrmly committed and anticipated transactions that are hedged are to be recognized withintwelve months. In addition, we use cross-currency swaps to hedge foreign currency denominated paymentsunder intercompany loan agreements. Hedged transactions are principally denominated in European curren-cies, Japanese yen, Australian dollars, Canadian dollars, and Korean won.
Our Ñnancial performance is also exposed to movements in short and long-term market interest rates.Our objective in managing this interest rate exposure is to limit the impact of interest rate changes on earningsand cash Öows, and to reduce overall borrowing costs. To achieve these objectives, we maintain a mix ofmedium and long-term Ñxed rate debt, commercial paper, bank loans and trade Ñnancing from NIAC.
Market Risk Measurement
We monitor foreign exchange risk, interest rate risk and related derivatives using a variety of techniquesincluding a review of market value, sensitivity analysis, and Value-at-Risk (VaR). Our market-sensitivederivative and other Ñnancial instruments, as deÑned by the SEC, are foreign currency forward contracts,foreign currency option contracts, cross-currency swaps, intercompany loans denominated in foreign curren-cies, Ñxed interest rate U.S. dollar denominated debt and Ñxed interest rate Japanese yen denominated debt.
We use VaR to monitor the foreign exchange risk of our foreign currency forward and foreign currencyoption derivative instruments only. The VaR determines the maximum potential one-day loss in the fair valueof these foreign exchange rate-sensitive Ñnancial instruments. The VaR model estimates assume normalmarket conditions and a 95% conÑdence level. There are various modeling techniques that can be used in theVaR computation. Our computations are based on interrelationships between currencies and interest rates (a""variance/co-variance'' technique). We determined these interrelationships by observing foreign exchangecurrency market changes and interest rate changes over the preceding one year. The value of foreign currencyoptions does not change on a one-to-one basis with changes in the underlying currency rate. We adjusted thepotential loss in option value for the estimated sensitivity (the ""delta'' and ""gamma'') to changes in theunderlying currency rate. We have excluded anticipated transactions, Ñrm commitments, cash balances andaccounts receivable and payable denominated in foreign currencies from the VaR calculation, which certain ofthese instruments are intended to hedge.
The VaR model is a risk analysis tool and does not purport to represent actual losses in fair value that wewill incur, nor does it consider the potential eÅect of favorable changes in market rates. It also does notrepresent the full extent of the possible loss that may occur. Actual future gains and losses will diÅer fromthose estimated because of changes or diÅerences in market rates and interrelationships, hedging instrumentsand hedge percentages, timing and other factors.
The estimated maximum one-day loss in fair value on NIKE's foreign currency sensitive Ñnancialinstruments, derived using the VaR model, was $18.9 million and $9.5 million at May 31, 2001 and May 31,2000, respectively. Such a hypothetical loss in fair value of our derivatives would be oÅset by increases in thevalue of the underlying transactions being hedged.
Details of all other market-sensitive derivative and other Ñnancial instruments, including their fair values,are included in the table below. These instruments include intercompany loans denominated in foreigncurrencies, Ñxed interest rate Japanese yen denominated debt, Ñxed interest rate U.S. dollar denominateddebt, and cross-currency swaps. For debt obligations, the table presents principal cash Öows and relatedweighted average interest rates by expected maturity dates. We have excluded the cross-currency swaps fromthe foreign exchange risk category because these instruments eliminate all foreign currency exposure in thecash Öows of a Dutch guilder denominated inter-company loan. We have included these cross-currency swapsin the interest rate risk category but excluded the related intercompany loan from this category because theintercompany interest eliminates in consolidation. For the cross-currency swaps the table presents both theDutch guilder swap payable and U.S. dollar swap receivable and the respective pay and receive interest rates.All information is presented in U.S. dollar equivalents, in millions, except interest rates.
19

EXPECTED MATURITY DATEYear Ended May 31,
2002 2003 2004 2005 2006 Thereafter Total Fair Value
Foreign Exchange Risk
Euro Functional Currency
Intercompany loan Ì U.S. dollardenominated Ì Fixed rate
Principal paymentsÏÏÏÏÏÏÏÏÏÏÏÏÏÏÏÏÏÏ $133.7 Ì Ì Ì Ì Ì $133.7 $133.7
Average interest rate ÏÏÏÏÏÏÏÏÏÏÏÏÏÏÏÏ 7.4% Ì Ì Ì Ì Ì 7.4%
U.S. Dollar Functional Currency
Intercompany loans Ì Eurodenominated Ì Fixed rate
Principal paymentsÏÏÏÏÏÏÏÏÏÏÏÏÏÏÏÏÏÏ $257.3 Ì Ì Ì Ì Ì $257.3 $257.3
Average interest rate ÏÏÏÏÏÏÏÏÏÏÏÏÏÏÏÏ 5.0% Ì Ì Ì Ì Ì 5.0%
Intercompany loan Ì Japanese yendenominated Ì Fixed rate
Principal paymentsÏÏÏÏÏÏÏÏÏÏÏÏÏÏÏÏÏÏ $213.0 Ì Ì Ì Ì Ì $213.0 $213.0
Average interest rate ÏÏÏÏÏÏÏÏÏÏÏÏÏÏÏÏ 0% Ì Ì Ì Ì Ì 0%
Intercompany loan Ì British pounddenominated Ì Fixed rate
Principal paymentsÏÏÏÏÏÏÏÏÏÏÏÏÏÏÏÏÏÏ $ 20.6 Ì Ì Ì Ì Ì $ 20.6 $ 20.6
Average interest rate ÏÏÏÏÏÏÏÏÏÏÏÏÏÏÏÏ 6.5% Ì Ì Ì Ì Ì 6.5%
Korean Won Functional Currency
Intercompany loan Ì U.S. dollardenominated Ì Fixed rate
Principal paymentsÏÏÏÏÏÏÏÏÏÏÏÏÏÏÏÏÏÏ $ 22.6 Ì Ì Ì Ì Ì $ 22.6 $ 22.6
Average interest rate ÏÏÏÏÏÏÏÏÏÏÏÏÏÏÏÏ 6.9% Ì Ì Ì Ì Ì 6.9%
Japanese Yen Functional Currency
Long-term Japanese yen debt-Fixedrate
Principal paymentsÏÏÏÏÏÏÏÏÏÏÏÏÏÏÏÏÏÏ $ 5.4 5.4 5.4 5.4 5.4 $164.0 $191.0 $181.1
Average interest rate ÏÏÏÏÏÏÏÏÏÏÏÏÏÏÏÏ 3.3% 3.3% 3.3% 3.4% 3.4% 3.4% 3.3%
Interest Rate Risk
Japanese Yen Functional Currency
Long-term Japanese yen debt-Fixedrate
Principal Payments ÏÏÏÏÏÏÏÏÏÏÏÏÏÏÏÏÏ $ 5.4 5.4 5.4 5.4 5.4 $164.0 $191.0 $181.1
Average interest rate ÏÏÏÏÏÏÏÏÏÏÏÏÏÏÏÏ 3.3% 3.3% 3.3% 3.4% 3.4% 3.4% 3.3%
U.S. Dollar Functional Currency
Long-term U.S. dollar debt-Fixed rate
Principal paymentsÏÏÏÏÏÏÏÏÏÏÏÏÏÏÏÏÏÏ $ Ì 50.0 199.6 Ì Ì Ì $249.6 $256.2
Average interest rate ÏÏÏÏÏÏÏÏÏÏÏÏÏÏÏÏ 6.4% 6.4% 6.4% Ì Ì Ì 6.4%
Cross-currency swapsÓ
Fixed Dutch guilder for Ñxed U.S.dollar
Dutch guilder swap payable ÏÏÏÏÏÏÏÏÏÏ $ Ì 37.8 134.8 Ì Ì Ì $172.6 $179.4
U.S. dollar swap receivableÏÏÏÏÏÏÏÏÏÏÏ $ Ì 50.0 200.0 Ì Ì Ì $250.0 $266.4
Average pay rate (Dutch guilder) ÏÏÏÏÏ 5.5% 5.6% 5.6% Ì Ì Ì 5.6%
Average receive rate (U.S. dollars)ÏÏÏÏ 6.5% 6.5% 6.5% Ì Ì Ì 6.5%
Intercompany loans and related interest amounts eliminate in consolidation. Intercompany loans aregenerally hedged against foreign exchange risk through the use of forward contracts and swaps with thirdparties.
20
The Ñxed interest rate Japanese yen denominated debts were issued by and are accounted for by two ofNIKE's Japanese subsidiaries. Accordingly, the monthly remeasurement of these instruments due to changesin foreign exchange rates is recognized in accumulated other comprehensive income upon the consolidation ofthese subsidiaries.
There was not a signiÑcant change in debt or cross-currency swap market risks during Ñscal 2001. TheU.S. dollar fair values of intercompany loans denominated in foreign currencies was $692.8 million at May 31,2000, which is the same as the carrying values of the loans prior to their elimination. The U.S. dollar fair valueof the Ñxed rate Japanese yen denominated debt that was outstanding at May 31, 2000 was $220.4 millionversus a carrying value of $219.8 million at that date. The U.S. dollar fair values of the Ñxed rate U.S. dollardenominated debt, the Dutch guilder swap payable and the U.S. dollar swap receivable as of May 31, 2000were $288.4 million, $226.6 million and $288.8 million, respectively, versus carrying values of $299.6 million,$227.6 million and $300 million, respectively, at that date.
Special Note Regarding Forward-Looking Statements and Analyst Reports.
Certain written and oral statements, other than purely historical information including estimates,projections, statements relating to NIKE's business plans, objectives and expected operating results, and theassumptions upon which those statements are based, made or incorporated by reference from time to time byNIKE or its representatives in this report, other reports, Ñlings with the Securities and Exchange Commission,press releases, conferences, or otherwise, are ""forward-looking statements'' within the meaning of the PrivateSecurities Litigation Reform Act of 1995 and Section 21E of the Securities Exchange Act of 1934. Forward-looking statements include, without limitation, any statement that may predict, forecast, indicate, or implyfuture results, performance, or achievements, and may contain the words ""believe,'' ""anticipate,'' ""expect,''""estimate,'' ""project,'' ""will be,'' ""will continue,'' ""will likely result,'' or words or phrases of similar meaning.Forward-looking statements involve risks and uncertainties which may cause actual results to diÅer materiallyfrom the forward-looking statements. The risks and uncertainties are detailed from time to time in reports Ñledby NIKE with the S.E.C., including Forms 8-K, 10-Q, and 10-K, and include, among others, the following:international, national and local general economic and market conditions; the size and growth of the overallathletic footwear, apparel, and equipment markets; intense competition among designers, marketers, distribu-tors and sellers of athletic footwear, apparel, and equipment for consumers and endorsers; demographicchanges; changes in consumer preferences; popularity of particular designs, categories of products, and sports;seasonal and geographic demand for NIKE products; diÇculties in anticipating or forecasting changes inconsumer preferences, consumer demand for NIKE products, and the various market factors described above;diÇculties in implementing, operating, and maintaining NIKE's increasingly complex information systemsand controls, including, without limitation, the systems related to demand and supply planning, and inventorycontrol; Öuctuations and diÇculty in forecasting operating results, including, without limitation, the fact thatadvance ""futures'' orders may not be indicative of future revenues due to the changing mix of futures andat-once orders; the ability of NIKE to sustain, manage or forecast its growth and inventories; the size, timingand mix of purchases of NIKE's products; new product development and introduction; the ability to secureand protect trademarks, patents, and other intellectual property performance and reliability of products;customer service; adverse publicity; the loss of signiÑcant customers or suppliers; dependence on distributors;business disruptions; increased costs of freight and transportation to meet delivery deadlines; changes inbusiness strategy or development plans; general risks associated with doing business outside the United States,including, without limitation, import duties, tariÅs, quotas and political and economic instability; changes ingovernment regulations; liability and other claims asserted against NIKE; the ability to attract and retainqualiÑed personnel; and other factors referenced or incorporated by reference in this report and other reports.
The risks included here are not exhaustive. Other sections of this report may include additional factorswhich could adversely aÅect NIKE's business and Ñnancial performance. Moreover, NIKE operates in a verycompetitive and rapidly changing environment. New risk factors emerge from time to time and it is notpossible for management to predict all such risk factors, nor can it assess the impact of all such risk factors onNIKE's business or the extent to which any factor, or combination of factors, may cause actual results to diÅer
21

materially from those contained in any forward-looking statements. Given these risks and uncertainties,investors should not place undue reliance on forward-looking statements as a prediction of actual results.
Investors should also be aware that while NIKE does, from time to time, communicate with securitiesanalysts, it is against NIKE's policy to disclose to them any material non-public information or otherconÑdential commercial information. Accordingly, shareholders should not assume that NIKE agrees withany statement or report issued by any analyst irrespective of the content of the statement or report.Furthermore, NIKE has a policy against issuing or conÑrming Ñnancial forecasts or projections issued byothers. Thus, to the extent that reports issued by securities analysts contain any projections, forecasts oropinions, such reports are not the responsibility of NIKE.
Item 8. Financial Statements and Supplemental Data
Management of NIKE, Inc. is responsible for the information and representations contained in thisreport. The Ñnancial statements have been prepared in conformity with the generally accepted accountingprinciples we considered appropriate in the circumstances and include some amounts based on our bestestimates and judgments. Other Ñnancial information in this report is consistent with these Ñnancialstatements.
Our accounting systems include controls designed to reasonably assure that assets are safeguarded fromunauthorized use or disposition and which provide for the preparation of Ñnancial statements in conformitywith generally accepted accounting principles. These systems are supplemented by the selection and trainingof qualiÑed Ñnancial personnel and an organizational structure providing for appropriate segregation of duties.
An Internal Audit department reviews the results of its work with the Audit Committee of the Board ofDirectors, presently consisting of three outside directors. The Audit Committee is responsible for recom-mending to the Board of Directors the appointment of the independent accountants and reviews with theindependent accountants, management and the internal audit staÅ, the scope and the results of the annualexamination, the eÅectiveness of the accounting control system and other matters relating to the ÑnancialaÅairs of NIKE as they deem appropriate. The independent accountants and the internal auditors have fullaccess to the Committee, with and without the presence of management, to discuss any appropriate matters.
22
REPORT OF INDEPENDENT ACCOUNTANTS
To the Board of Directors andShareholders of NIKE, Inc.
In our opinion, the consolidated Ñnancial statements listed in the index appearing under Item 14(A)(1)on page 45 present fairly, in all material respects, the Ñnancial position of NIKE, Inc. and its subsidiaries atMay 31, 2001 and 2000, and the results of their operations and their cash Öows for each of the three years inthe period ended May 31, 2001 in conformity with accounting principles generally accepted in the UnitedStates of America. In addition, in our opinion, the Ñnancial statement schedule listed in the index appearingunder Item 14(A)(2) on page 45 presents fairly, in all material respects, the information set forth thereinwhen read in conjunction with the related consolidated Ñnancial statements. These Ñnancial statements andÑnancial statement schedule are the responsibility of the Company's management; our responsibility is toexpress an opinion on these Ñnancial statements and Ñnancial statement schedule based on our audits. Weconducted our audits of these statements in accordance with auditing standards generally accepted in theUnited States of America, which require that we plan and perform the audit to obtain reasonable assuranceabout whether the Ñnancial statements are free of material misstatement. An audit includes examining, on atest basis, evidence supporting the amounts and disclosures in the Ñnancial statements, assessing theaccounting principles used and signiÑcant estimates made by management, and evaluating the overall Ñnancialstatement presentation. We believe that our audits provide a reasonable basis for our opinion.
/s/ PRICEWATERHOUSECOOPERS LLP
PricewaterhouseCoopers LLPPortland, OregonJune 27, 2001
23

NIKE, INC.
CONSOLIDATED STATEMENTS OF INCOME
Year Ended May 31,
2001 2000 1999
(in millions, except per share data)
RevenuesÏÏÏÏÏÏÏÏÏÏÏÏÏÏÏÏÏÏÏÏÏÏÏÏÏÏÏÏÏÏÏÏÏÏÏÏÏÏÏÏÏÏÏÏÏÏÏÏÏÏÏÏ $9,488.8 $8,995.1 $8,776.9
Costs and expenses:
Cost of sales ÏÏÏÏÏÏÏÏÏÏÏÏÏÏÏÏÏÏÏÏÏÏÏÏÏÏÏÏÏÏÏÏÏÏÏÏÏÏÏÏÏÏÏÏÏÏÏ 5,784.9 5,403.8 5,493.5
Selling and administrativeÏÏÏÏÏÏÏÏÏÏÏÏÏÏÏÏÏÏÏÏÏÏÏÏÏÏÏÏÏÏÏÏÏÏÏÏ 2,689.7 2,606.4 2,426.6
Interest expense (Notes 4 and 5) ÏÏÏÏÏÏÏÏÏÏÏÏÏÏÏÏÏÏÏÏÏÏÏÏÏÏÏÏÏ 58.7 45.0 44.1
Other income/expense, net (Notes 1, 10 and 11)ÏÏÏÏÏÏÏÏÏÏÏÏÏÏÏÏ 34.2 23.2 21.5
Restructuring charge, net (Note 13)ÏÏÏÏÏÏÏÏÏÏÏÏÏÏÏÏÏÏÏÏÏÏÏÏÏÏÏ (.1) (2.5) 45.1
Total costs and expenses ÏÏÏÏÏÏÏÏÏÏÏÏÏÏÏÏÏÏÏÏÏÏÏÏÏÏÏÏÏÏÏÏÏÏÏÏÏÏÏ 8,567.4 8,075.9 8,030.8
Income before income taxes ÏÏÏÏÏÏÏÏÏÏÏÏÏÏÏÏÏÏÏÏÏÏÏÏÏÏÏÏÏÏÏÏÏÏÏÏ 921.4 919.2 746.1
Income taxes (Note 6) ÏÏÏÏÏÏÏÏÏÏÏÏÏÏÏÏÏÏÏÏÏÏÏÏÏÏÏÏÏÏÏÏÏÏÏÏÏÏÏÏ 331.7 340.1 294.7
Net incomeÏÏÏÏÏÏÏÏÏÏÏÏÏÏÏÏÏÏÏÏÏÏÏÏÏÏÏÏÏÏÏÏÏÏÏÏÏÏÏÏÏÏÏÏÏÏÏÏÏÏ $ 589.7 $ 579.1 $ 451.4
Basic earnings per common share (Notes 1 and 9) ÏÏÏÏÏÏÏÏÏÏÏÏÏÏÏÏ $ 2.18 $ 2.10 $ 1.59
Diluted earnings per common share (Notes 1 and 9)ÏÏÏÏÏÏÏÏÏÏÏÏÏÏÏ $ 2.16 $ 2.07 $ 1.57
The accompanying notes to consolidated Ñnancial statements are an integral part of this statement.
24
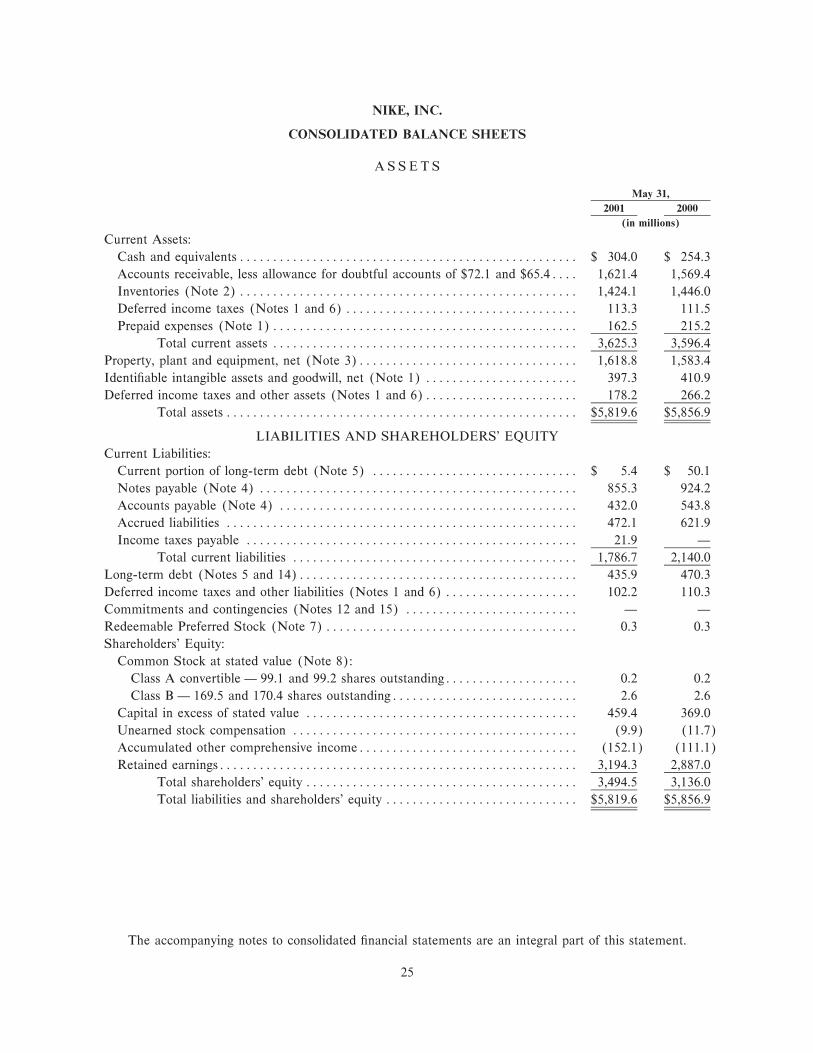
NIKE, INC.
CONSOLIDATED BALANCE SHEETS
A S S E T S
May 31,
2001 2000
(in millions)
Current Assets:
Cash and equivalentsÏÏÏÏÏÏÏÏÏÏÏÏÏÏÏÏÏÏÏÏÏÏÏÏÏÏÏÏÏÏÏÏÏÏÏÏÏÏÏÏÏÏÏÏÏÏÏÏÏÏÏ $ 304.0 $ 254.3
Accounts receivable, less allowance for doubtful accounts of $72.1 and $65.4ÏÏÏÏ 1,621.4 1,569.4
Inventories (Note 2) ÏÏÏÏÏÏÏÏÏÏÏÏÏÏÏÏÏÏÏÏÏÏÏÏÏÏÏÏÏÏÏÏÏÏÏÏÏÏÏÏÏÏÏÏÏÏÏÏÏÏÏ 1,424.1 1,446.0
Deferred income taxes (Notes 1 and 6) ÏÏÏÏÏÏÏÏÏÏÏÏÏÏÏÏÏÏÏÏÏÏÏÏÏÏÏÏÏÏÏÏÏÏÏ 113.3 111.5
Prepaid expenses (Note 1)ÏÏÏÏÏÏÏÏÏÏÏÏÏÏÏÏÏÏÏÏÏÏÏÏÏÏÏÏÏÏÏÏÏÏÏÏÏÏÏÏÏÏÏÏÏÏ 162.5 215.2
Total current assets ÏÏÏÏÏÏÏÏÏÏÏÏÏÏÏÏÏÏÏÏÏÏÏÏÏÏÏÏÏÏÏÏÏÏÏÏÏÏÏÏÏÏÏÏÏÏ 3,625.3 3,596.4
Property, plant and equipment, net (Note 3)ÏÏÏÏÏÏÏÏÏÏÏÏÏÏÏÏÏÏÏÏÏÏÏÏÏÏÏÏÏÏÏÏÏ 1,618.8 1,583.4
IdentiÑable intangible assets and goodwill, net (Note 1) ÏÏÏÏÏÏÏÏÏÏÏÏÏÏÏÏÏÏÏÏÏÏÏ 397.3 410.9
Deferred income taxes and other assets (Notes 1 and 6)ÏÏÏÏÏÏÏÏÏÏÏÏÏÏÏÏÏÏÏÏÏÏÏ 178.2 266.2
Total assets ÏÏÏÏÏÏÏÏÏÏÏÏÏÏÏÏÏÏÏÏÏÏÏÏÏÏÏÏÏÏÏÏÏÏÏÏÏÏÏÏÏÏÏÏÏÏÏÏÏÏÏÏÏ $5,819.6 $5,856.9
LIABILITIES AND SHAREHOLDERS' EQUITY
Current Liabilities:
Current portion of long-term debt (Note 5) ÏÏÏÏÏÏÏÏÏÏÏÏÏÏÏÏÏÏÏÏÏÏÏÏÏÏÏÏÏÏÏ $ 5.4 $ 50.1
Notes payable (Note 4) ÏÏÏÏÏÏÏÏÏÏÏÏÏÏÏÏÏÏÏÏÏÏÏÏÏÏÏÏÏÏÏÏÏÏÏÏÏÏÏÏÏÏÏÏÏÏÏÏ 855.3 924.2
Accounts payable (Note 4) ÏÏÏÏÏÏÏÏÏÏÏÏÏÏÏÏÏÏÏÏÏÏÏÏÏÏÏÏÏÏÏÏÏÏÏÏÏÏÏÏÏÏÏÏÏ 432.0 543.8
Accrued liabilities ÏÏÏÏÏÏÏÏÏÏÏÏÏÏÏÏÏÏÏÏÏÏÏÏÏÏÏÏÏÏÏÏÏÏÏÏÏÏÏÏÏÏÏÏÏÏÏÏÏÏÏÏÏ 472.1 621.9
Income taxes payable ÏÏÏÏÏÏÏÏÏÏÏÏÏÏÏÏÏÏÏÏÏÏÏÏÏÏÏÏÏÏÏÏÏÏÏÏÏÏÏÏÏÏÏÏÏÏÏÏÏÏ 21.9 Ì
Total current liabilities ÏÏÏÏÏÏÏÏÏÏÏÏÏÏÏÏÏÏÏÏÏÏÏÏÏÏÏÏÏÏÏÏÏÏÏÏÏÏÏÏÏÏÏ 1,786.7 2,140.0
Long-term debt (Notes 5 and 14)ÏÏÏÏÏÏÏÏÏÏÏÏÏÏÏÏÏÏÏÏÏÏÏÏÏÏÏÏÏÏÏÏÏÏÏÏÏÏÏÏÏÏ 435.9 470.3
Deferred income taxes and other liabilities (Notes 1 and 6) ÏÏÏÏÏÏÏÏÏÏÏÏÏÏÏÏÏÏÏÏ 102.2 110.3
Commitments and contingencies (Notes 12 and 15) ÏÏÏÏÏÏÏÏÏÏÏÏÏÏÏÏÏÏÏÏÏÏÏÏÏÏ Ì Ì
Redeemable Preferred Stock (Note 7)ÏÏÏÏÏÏÏÏÏÏÏÏÏÏÏÏÏÏÏÏÏÏÏÏÏÏÏÏÏÏÏÏÏÏÏÏÏÏ 0.3 0.3
Shareholders' Equity:
Common Stock at stated value (Note 8):
Class A convertible Ì 99.1 and 99.2 shares outstandingÏÏÏÏÏÏÏÏÏÏÏÏÏÏÏÏÏÏÏÏ 0.2 0.2
Class B Ì 169.5 and 170.4 shares outstandingÏÏÏÏÏÏÏÏÏÏÏÏÏÏÏÏÏÏÏÏÏÏÏÏÏÏÏÏ 2.6 2.6
Capital in excess of stated value ÏÏÏÏÏÏÏÏÏÏÏÏÏÏÏÏÏÏÏÏÏÏÏÏÏÏÏÏÏÏÏÏÏÏÏÏÏÏÏÏÏ 459.4 369.0
Unearned stock compensation ÏÏÏÏÏÏÏÏÏÏÏÏÏÏÏÏÏÏÏÏÏÏÏÏÏÏÏÏÏÏÏÏÏÏÏÏÏÏÏÏÏÏÏ (9.9) (11.7)
Accumulated other comprehensive incomeÏÏÏÏÏÏÏÏÏÏÏÏÏÏÏÏÏÏÏÏÏÏÏÏÏÏÏÏÏÏÏÏÏ (152.1) (111.1)
Retained earningsÏÏÏÏÏÏÏÏÏÏÏÏÏÏÏÏÏÏÏÏÏÏÏÏÏÏÏÏÏÏÏÏÏÏÏÏÏÏÏÏÏÏÏÏÏÏÏÏÏÏÏÏÏÏ 3,194.3 2,887.0
Total shareholders' equity ÏÏÏÏÏÏÏÏÏÏÏÏÏÏÏÏÏÏÏÏÏÏÏÏÏÏÏÏÏÏÏÏÏÏÏÏÏÏÏÏÏ 3,494.5 3,136.0
Total liabilities and shareholders' equity ÏÏÏÏÏÏÏÏÏÏÏÏÏÏÏÏÏÏÏÏÏÏÏÏÏÏÏÏÏ $5,819.6 $5,856.9
The accompanying notes to consolidated Ñnancial statements are an integral part of this statement.
25
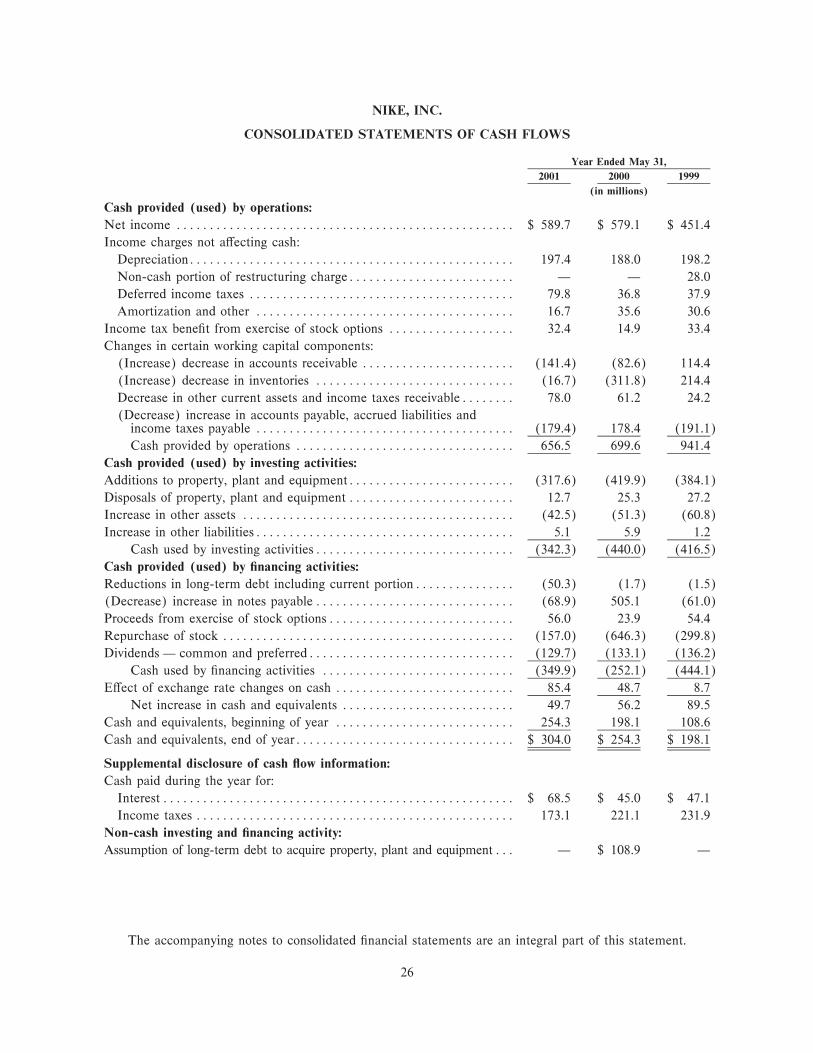
NIKE, INC.
CONSOLIDATED STATEMENTS OF CASH FLOWS
Year Ended May 31,
2001 2000 1999
(in millions)
Cash provided (used) by operations:
Net income ÏÏÏÏÏÏÏÏÏÏÏÏÏÏÏÏÏÏÏÏÏÏÏÏÏÏÏÏÏÏÏÏÏÏÏÏÏÏÏÏÏÏÏÏÏÏÏÏÏÏÏ $ 589.7 $ 579.1 $ 451.4
Income charges not aÅecting cash:
DepreciationÏÏÏÏÏÏÏÏÏÏÏÏÏÏÏÏÏÏÏÏÏÏÏÏÏÏÏÏÏÏÏÏÏÏÏÏÏÏÏÏÏÏÏÏÏÏÏÏÏ 197.4 188.0 198.2
Non-cash portion of restructuring chargeÏÏÏÏÏÏÏÏÏÏÏÏÏÏÏÏÏÏÏÏÏÏÏÏÏ Ì Ì 28.0
Deferred income taxes ÏÏÏÏÏÏÏÏÏÏÏÏÏÏÏÏÏÏÏÏÏÏÏÏÏÏÏÏÏÏÏÏÏÏÏÏÏÏÏÏ 79.8 36.8 37.9
Amortization and other ÏÏÏÏÏÏÏÏÏÏÏÏÏÏÏÏÏÏÏÏÏÏÏÏÏÏÏÏÏÏÏÏÏÏÏÏÏÏÏ 16.7 35.6 30.6
Income tax beneÑt from exercise of stock options ÏÏÏÏÏÏÏÏÏÏÏÏÏÏÏÏÏÏÏ 32.4 14.9 33.4
Changes in certain working capital components:
(Increase) decrease in accounts receivable ÏÏÏÏÏÏÏÏÏÏÏÏÏÏÏÏÏÏÏÏÏÏÏ (141.4) (82.6) 114.4
(Increase) decrease in inventories ÏÏÏÏÏÏÏÏÏÏÏÏÏÏÏÏÏÏÏÏÏÏÏÏÏÏÏÏÏÏ (16.7) (311.8) 214.4
Decrease in other current assets and income taxes receivableÏÏÏÏÏÏÏÏ 78.0 61.2 24.2
(Decrease) increase in accounts payable, accrued liabilities andincome taxes payable ÏÏÏÏÏÏÏÏÏÏÏÏÏÏÏÏÏÏÏÏÏÏÏÏÏÏÏÏÏÏÏÏÏÏÏÏÏÏÏ (179.4) 178.4 (191.1)
Cash provided by operations ÏÏÏÏÏÏÏÏÏÏÏÏÏÏÏÏÏÏÏÏÏÏÏÏÏÏÏÏÏÏÏÏÏ 656.5 699.6 941.4
Cash provided (used) by investing activities:
Additions to property, plant and equipmentÏÏÏÏÏÏÏÏÏÏÏÏÏÏÏÏÏÏÏÏÏÏÏÏÏ (317.6) (419.9) (384.1)
Disposals of property, plant and equipment ÏÏÏÏÏÏÏÏÏÏÏÏÏÏÏÏÏÏÏÏÏÏÏÏÏ 12.7 25.3 27.2
Increase in other assets ÏÏÏÏÏÏÏÏÏÏÏÏÏÏÏÏÏÏÏÏÏÏÏÏÏÏÏÏÏÏÏÏÏÏÏÏÏÏÏÏÏ (42.5) (51.3) (60.8)
Increase in other liabilitiesÏÏÏÏÏÏÏÏÏÏÏÏÏÏÏÏÏÏÏÏÏÏÏÏÏÏÏÏÏÏÏÏÏÏÏÏÏÏÏ 5.1 5.9 1.2
Cash used by investing activitiesÏÏÏÏÏÏÏÏÏÏÏÏÏÏÏÏÏÏÏÏÏÏÏÏÏÏÏÏÏÏ (342.3) (440.0) (416.5)
Cash provided (used) by Ñnancing activities:
Reductions in long-term debt including current portionÏÏÏÏÏÏÏÏÏÏÏÏÏÏÏ (50.3) (1.7) (1.5)
(Decrease) increase in notes payable ÏÏÏÏÏÏÏÏÏÏÏÏÏÏÏÏÏÏÏÏÏÏÏÏÏÏÏÏÏÏ (68.9) 505.1 (61.0)
Proceeds from exercise of stock optionsÏÏÏÏÏÏÏÏÏÏÏÏÏÏÏÏÏÏÏÏÏÏÏÏÏÏÏÏ 56.0 23.9 54.4
Repurchase of stock ÏÏÏÏÏÏÏÏÏÏÏÏÏÏÏÏÏÏÏÏÏÏÏÏÏÏÏÏÏÏÏÏÏÏÏÏÏÏÏÏÏÏÏÏ (157.0) (646.3) (299.8)
Dividends Ì common and preferredÏÏÏÏÏÏÏÏÏÏÏÏÏÏÏÏÏÏÏÏÏÏÏÏÏÏÏÏÏÏÏ (129.7) (133.1) (136.2)
Cash used by Ñnancing activities ÏÏÏÏÏÏÏÏÏÏÏÏÏÏÏÏÏÏÏÏÏÏÏÏÏÏÏÏÏ (349.9) (252.1) (444.1)
EÅect of exchange rate changes on cash ÏÏÏÏÏÏÏÏÏÏÏÏÏÏÏÏÏÏÏÏÏÏÏÏÏÏÏ 85.4 48.7 8.7
Net increase in cash and equivalents ÏÏÏÏÏÏÏÏÏÏÏÏÏÏÏÏÏÏÏÏÏÏÏÏÏÏ 49.7 56.2 89.5
Cash and equivalents, beginning of year ÏÏÏÏÏÏÏÏÏÏÏÏÏÏÏÏÏÏÏÏÏÏÏÏÏÏÏ 254.3 198.1 108.6
Cash and equivalents, end of yearÏÏÏÏÏÏÏÏÏÏÏÏÏÏÏÏÏÏÏÏÏÏÏÏÏÏÏÏÏÏÏÏÏ $ 304.0 $ 254.3 $ 198.1
Supplemental disclosure of cash Öow information:
Cash paid during the year for:
Interest ÏÏÏÏÏÏÏÏÏÏÏÏÏÏÏÏÏÏÏÏÏÏÏÏÏÏÏÏÏÏÏÏÏÏÏÏÏÏÏÏÏÏÏÏÏÏÏÏÏÏÏÏÏ $ 68.5 $ 45.0 $ 47.1
Income taxes ÏÏÏÏÏÏÏÏÏÏÏÏÏÏÏÏÏÏÏÏÏÏÏÏÏÏÏÏÏÏÏÏÏÏÏÏÏÏÏÏÏÏÏÏÏÏÏÏ 173.1 221.1 231.9
Non-cash investing and Ñnancing activity:
Assumption of long-term debt to acquire property, plant and equipmentÏÏÏ Ì $ 108.9 Ì
The accompanying notes to consolidated Ñnancial statements are an integral part of this statement.
26

NIKE, INC.
CONSOLIDATED STATEMENTS OF SHAREHOLDERS' EQUITY
Capital in AccumulatedCommon StockExcess of Unearned Other
Class A Class B Stated Stock Comprehensive RetainedShares Amount Shares Amount Value Compensation Income Earnings Total
(in millions)
Balance at May 31, 1998 ÏÏÏÏÏÏÏÏÏÏÏÏÏ 101.5 $0.2 185.5 $ 2.7 $262.5 $ Ì $ (47.2) $3,043.4 $3,261.6
Stock options exercised ÏÏÏÏÏÏÏÏÏÏÏÏÏÏÏ 2.7 80.5 80.5
Conversion to Class B Common Stock ÏÏ (0.8) 0.8
Repurchase of Class B Common StockÏÏ (7.4) (8.9) (292.7) (301.6)
Dividends on Common Stock ÏÏÏÏÏÏÏÏÏÏ (135.6) (135.6)
Comprehensive income:
Net income ÏÏÏÏÏÏÏÏÏÏÏÏÏÏÏÏÏÏÏÏÏÏÏ 451.4 451.4
Foreign currency translation (net oftax expense of $0.4)ÏÏÏÏÏÏÏÏÏÏÏÏÏÏ (21.7) (21.7)
Comprehensive income ÏÏÏÏÏÏÏÏÏÏÏÏÏÏÏ (21.7) 451.4 429.7
Balance at May 31, 1999 ÏÏÏÏÏÏÏÏÏÏÏÏÏ 100.7 0.2 181.6 2.7 334.1 Ì (68.9) 3,066.5 3,334.6
Stock options exercised ÏÏÏÏÏÏÏÏÏÏÏÏÏÏÏ 1.3 38.7 38.7
Conversion to Class B Common Stock ÏÏ (1.5) 1.5
Repurchase of Class B Common StockÏÏ (14.5) (0.1) (17.3) (627.1) (644.5)
Dividends on Common stock ÏÏÏÏÏÏÏÏÏÏ (131.5) (131.5)
Issuance of shares to employees ÏÏÏÏÏÏÏÏ 0.5 13.5 (13.5) Ì
Amortization of unearnedcompensation ÏÏÏÏÏÏÏÏÏÏÏÏÏÏÏÏÏÏÏÏÏ 1.8 1.8
Comprehensive income:
Net income ÏÏÏÏÏÏÏÏÏÏÏÏÏÏÏÏÏÏÏÏÏÏÏ 579.1 579.1
Foreign currency translation (net oftax expense of $1.2)ÏÏÏÏÏÏÏÏÏÏÏÏÏÏ (42.2) (42.2)
Comprehensive income ÏÏÏÏÏÏÏÏÏÏÏÏÏÏÏ (42.2) 579.1 536.9
Balance at May 31, 2000 ÏÏÏÏÏÏÏÏÏÏÏÏÏ 99.2 0.2 170.4 2.6 369.0 (11.7) (111.1) 2,887.0 3,136.0
Stock options exercised ÏÏÏÏÏÏÏÏÏÏÏÏÏÏÏ 2.9 91.0 91.0
Conversion to Class B Common Stock ÏÏ (0.1) 0.1 Ì
Repurchase of Class B Common StockÏÏ (4.0) (4.8) (152.2) (157.0)
Dividends on Common Stock ÏÏÏÏÏÏÏÏÏÏ (129.6) (129.6)
Issuance of shares to employees ÏÏÏÏÏÏÏÏ 0.1 6.7 (6.7) Ì
Amortization of unearnedcompensation ÏÏÏÏÏÏÏÏÏÏÏÏÏÏÏÏÏÏÏÏÏ 7.3 7.3
Forfeiture of shares from employees ÏÏÏÏ (2.5) 1.2 (0.6) (1.9)
Comprehensive income:
Net income ÏÏÏÏÏÏÏÏÏÏÏÏÏÏÏÏÏÏÏÏÏÏÏ 589.7 589.7
Foreign currency translation and other(net of tax beneÑt of $0.2) ÏÏÏÏÏÏÏÏ (41.0) (41.0)
Comprehensive income ÏÏÏÏÏÏÏÏÏÏÏÏÏÏÏ (41.0) 589.7 548.7
Balance at May 31, 2001 ÏÏÏÏÏÏÏÏÏÏÏÏÏ 99.1 $0.2 169.5 $ 2.6 $459.4 $ (9.9) $(152.1) $3,194.3 $3,494.5
The accompanying notes to consolidated Ñnancial statements are an integral part of this statement.
27

NIKE, INC.
NOTES TO CONSOLIDATED FINANCIAL STATEMENTS
Note 1 Ì Summary of SigniÑcant Accounting Policies:
Basis of consolidation:
The consolidated Ñnancial statements include the accounts of NIKE, Inc. and its subsidiaries (theCompany). All signiÑcant intercompany transactions and balances have been eliminated.
Recognition of revenues:
Wholesale revenues are recognized when title passes and the risks and rewards of ownership have passedto the customer based on the terms of sale. Title passes generally upon shipment or upon receipt by thecustomer depending on the country of the sale and the agreement with the customer. Retail store revenues arerecorded at the time of sale. Provisions for sales discounts and returns are made at the time of sale.
Advertising and promotion:
Advertising production costs are expensed the Ñrst time the advertisement is run. Media (TV and print)placement costs are expensed in the month the advertising appears. The majority of the Company'spromotional expenses result from payments under endorsement contracts. Accounting for endorsementpayments is based upon speciÑc contract provisions. Generally, endorsement payments are expensed uniformlyover the term of the contract after giving recognition to periodic performance compliance provisions of thecontracts. Prepayments made under contracts are included in prepaid expenses or other assets depending onthe length of the contract. Total advertising and promotion expenses were $1,000.5 million, $978.2 million and$978.6 million for the years ended May 31, 2001, 2000 and 1999, respectively. Included in prepaid expensesand other assets was $122.3 million and $158.7 million at May 31, 2001 and 2000, respectively, relating toprepaid advertising and promotion expenses.
Cash and equivalents:
Cash and equivalents represent cash and short-term, highly liquid investments with original maturities ofthree months or less.
Inventory valuation:
Inventories are stated at the lower of cost or market. Inventories are valued on a Ñrst-in, Ñrst-out (FIFO)basis. During the year ended May 31, 1999, the Company changed its method of determining cost forsubstantially all of its U.S. inventories from last-in, Ñrst-out (LIFO) to FIFO. See Note 11.
Property, plant and equipment and depreciation:
Property, plant and equipment are recorded at cost. Depreciation for Ñnancial reporting purposes isdetermined on a straight-line basis for buildings and leasehold improvements over 2 to 40 years and principallyon a declining balance basis for machinery and equipment over 2 to 15 years. Computer software isdepreciated on a straight-line basis over 3 to 10 years.
IdentiÑable intangible assets and goodwill:
At May 31, 2001 and 2000, the Company had patents, trademarks and other identiÑable intangible assetsrecorded at a cost of $218.6 million and $215.2 million, respectively. The Company's excess of purchase costover the fair value of net assets of businesses acquired (goodwill) was $322.5 million and $323.5 million atMay 31, 2001 and 2000, respectively.
IdentiÑable intangible assets and goodwill are being amortized over their estimated useful lives on astraight-line basis over Ñve to forty years. Accumulated amortization was $143.8 million and $127.8 million at
28

NIKE, INC.
NOTES TO CONSOLIDATED FINANCIAL STATEMENTS Ì (Continued)
May 31, 2001 and 2000, respectively. Amortization expense, which is included in other income/expense, was$15.6 million, $18.5 million and $19.4 million for the years ended May 31, 2001, 2000 and 1999, respectively.
Impairment of long-lived assets:
When events or circumstances indicate the carrying value of a long-lived asset may be impaired, theCompany uses an estimate of the future undiscounted cash Öows to be derived from the remaining useful lifeof the asset to assess whether or not the asset is recoverable. If the future undiscounted cash Öows to bederived over the life of the asset do not exceed the asset's net book value, the Company then considersestimated fair market value versus carrying value in determining any potential impairment.
Foreign currency translation and foreign currency transactions:
Adjustments resulting from translating foreign functional currency Ñnancial statements into U.S. dollarsare included in the foreign currency translation adjustment, a component of accumulated other comprehensiveincome in shareholders' equity. Gains and losses resulting from transactions that are made in a currencydiÅerent from the functional currency of the applicable Company entity are recognized in earnings as theyoccur or, for hedging contracts, when the underlying hedged transaction aÅects earnings. Foreign currencytransaction gains and losses were a $129.6 million gain, a $36.1 million gain, and a $32.3 million loss for theyears ended May 31, 2001, 2000, and 1999, respectively.
Derivatives:
The Company enters into foreign currency contracts in order to reduce the impact of certain foreigncurrency Öuctuations. Firmly committed transactions and the related receivables and payables may be hedgedwith forward exchange contracts or purchased options. Anticipated, but not yet Ñrmly committed, transactionsmay be hedged through the use of purchased options. Premiums paid on purchased options and any realizedgains are included in prepaid expenses or accrued liabilities and are recognized in earnings when thetransaction being hedged is recognized. Gains and losses arising from foreign currency forward and optioncontracts and cross-currency swap transactions are recognized in income or expense as oÅsets of gains andlosses resulting from the underlying hedged transactions. Hedge eÅectiveness is determined by evaluatingwhether gains and losses on hedges will oÅset gains and losses on the underlying exposures. This evaluation isperformed at inception of the hedge and periodically over the life of the hedge. Occasionally, hedges maycease to be eÅective and are thus terminated prior to recognition of the underlying transaction. Gains andlosses on these hedges are deferred until the point in time ineÅectiveness is determined and will be included inthe basis of the underlying transaction. Hedges will also be terminated if the underlying transaction is nolonger expected to occur. When this occurs, all related deferred gains and losses are recognized in earningsimmediately. Cash Öows from hedging activities are classiÑed in the same category as the cash Öows from therelated foreign exchange transaction activity. See Note 15 for further discussion.
Income taxes:
United States income taxes are provided currently on Ñnancial statement earnings of non-U.S. subsidiaries expected to be repatriated. The Company determines annually the amount of undistributednon-U.S. earnings to invest indeÑnitely in its non-U.S. operations. The Company accounts for income taxesusing the asset and liability method. This approach requires the recognition of deferred tax assets andliabilities for the expected future tax consequences of temporary diÅerences between the carrying amounts andthe tax bases of other assets and liabilities. See Note 6 for further discussion.
29
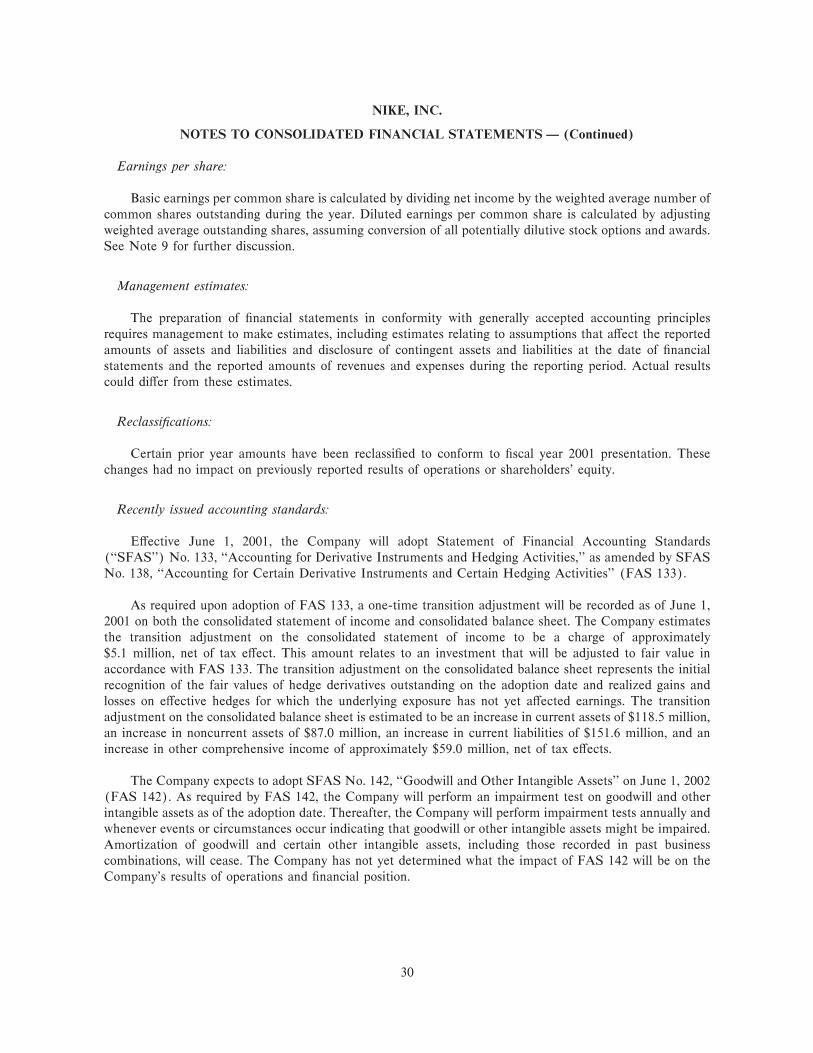
NIKE, INC.
NOTES TO CONSOLIDATED FINANCIAL STATEMENTS Ì (Continued)
Earnings per share:
Basic earnings per common share is calculated by dividing net income by the weighted average number ofcommon shares outstanding during the year. Diluted earnings per common share is calculated by adjustingweighted average outstanding shares, assuming conversion of all potentially dilutive stock options and awards.See Note 9 for further discussion.
Management estimates:
The preparation of Ñnancial statements in conformity with generally accepted accounting principlesrequires management to make estimates, including estimates relating to assumptions that aÅect the reportedamounts of assets and liabilities and disclosure of contingent assets and liabilities at the date of Ñnancialstatements and the reported amounts of revenues and expenses during the reporting period. Actual resultscould diÅer from these estimates.
ReclassiÑcations:
Certain prior year amounts have been reclassiÑed to conform to Ñscal year 2001 presentation. Thesechanges had no impact on previously reported results of operations or shareholders' equity.
Recently issued accounting standards:
EÅective June 1, 2001, the Company will adopt Statement of Financial Accounting Standards(""SFAS'') No. 133, ""Accounting for Derivative Instruments and Hedging Activities,'' as amended by SFASNo. 138, ""Accounting for Certain Derivative Instruments and Certain Hedging Activities'' (FAS 133).
As required upon adoption of FAS 133, a one-time transition adjustment will be recorded as of June 1,2001 on both the consolidated statement of income and consolidated balance sheet. The Company estimatesthe transition adjustment on the consolidated statement of income to be a charge of approximately$5.1 million, net of tax eÅect. This amount relates to an investment that will be adjusted to fair value inaccordance with FAS 133. The transition adjustment on the consolidated balance sheet represents the initialrecognition of the fair values of hedge derivatives outstanding on the adoption date and realized gains andlosses on eÅective hedges for which the underlying exposure has not yet aÅected earnings. The transitionadjustment on the consolidated balance sheet is estimated to be an increase in current assets of $118.5 million,an increase in noncurrent assets of $87.0 million, an increase in current liabilities of $151.6 million, and anincrease in other comprehensive income of approximately $59.0 million, net of tax eÅects.
The Company expects to adopt SFAS No. 142, ""Goodwill and Other Intangible Assets'' on June 1, 2002(FAS 142). As required by FAS 142, the Company will perform an impairment test on goodwill and otherintangible assets as of the adoption date. Thereafter, the Company will perform impairment tests annually andwhenever events or circumstances occur indicating that goodwill or other intangible assets might be impaired.Amortization of goodwill and certain other intangible assets, including those recorded in past businesscombinations, will cease. The Company has not yet determined what the impact of FAS 142 will be on theCompany's results of operations and Ñnancial position.
30

NIKE, INC.
NOTES TO CONSOLIDATED FINANCIAL STATEMENTS Ì (Continued)
Note 2 Ì Inventories:
Inventories by major classiÑcation are as follows:
May 31,
2001 2000
(in millions)
Finished goods ÏÏÏÏÏÏÏÏÏÏÏÏÏÏÏÏÏÏÏÏÏÏÏÏÏÏÏÏÏÏÏÏÏÏÏÏÏÏÏÏÏÏ $1,399.4 $1,416.6
Work-in-progress ÏÏÏÏÏÏÏÏÏÏÏÏÏÏÏÏÏÏÏÏÏÏÏÏÏÏÏÏÏÏÏÏÏÏÏÏÏÏÏÏ 15.1 17.3
Raw materialsÏÏÏÏÏÏÏÏÏÏÏÏÏÏÏÏÏÏÏÏÏÏÏÏÏÏÏÏÏÏÏÏÏÏÏÏÏÏÏÏÏÏÏ 9.6 12.1
$1,424.1 $1,446.0
Note 3 Ì Property, Plant and Equipment:
Property, plant and equipment includes the following:
May 31,
2001 2000
(in millions)
Land ÏÏÏÏÏÏÏÏÏÏÏÏÏÏÏÏÏÏÏÏÏÏÏÏÏÏÏÏÏÏÏÏÏÏÏÏÏÏÏÏÏÏÏÏÏÏÏÏÏÏ $ 177.2 $ 180.6
Buildings ÏÏÏÏÏÏÏÏÏÏÏÏÏÏÏÏÏÏÏÏÏÏÏÏÏÏÏÏÏÏÏÏÏÏÏÏÏÏÏÏÏÏÏÏÏÏÏ 695.4 503.4
Machinery and equipment ÏÏÏÏÏÏÏÏÏÏÏÏÏÏÏÏÏÏÏÏÏÏÏÏÏÏÏÏÏÏÏÏ 1,117.3 981.9
Leasehold improvementsÏÏÏÏÏÏÏÏÏÏÏÏÏÏÏÏÏÏÏÏÏÏÏÏÏÏÏÏÏÏÏÏÏÏ 391.9 279.6
Construction in process ÏÏÏÏÏÏÏÏÏÏÏÏÏÏÏÏÏÏÏÏÏÏÏÏÏÏÏÏÏÏÏÏÏÏÏ 171.0 448.3
2,552.8 2,393.8
Less accumulated depreciationÏÏÏÏÏÏÏÏÏÏÏÏÏÏÏÏÏÏÏÏÏÏÏÏÏÏÏÏÏ 934.0 810.4
$1,618.8 $1,583.4
Capitalized interest expense incurred was $8.4 million, $4.8 million and $6.9 million for the years endedMay 31, 2001, 2000 and 1999, respectively.
Note 4 Ì Short-Term Borrowings and Credit Lines:
Commercial paper outstanding, notes payable to banks and interest-bearing accounts payable to NisshoIwai American Corporation (NIAC) are summarized below:
May 31,
2001 2000
Interest InterestBorrowings Rate Borrowings Rate
(in millions) (in millions)
Notes payable and commercial paper:
U.S. operations ÏÏÏÏÏÏÏÏÏÏÏÏÏÏÏÏÏÏÏÏÏÏÏÏÏÏÏÏ $710.0 4.07% $691.9 6.42%
Non-U.S. operations ÏÏÏÏÏÏÏÏÏÏÏÏÏÏÏÏÏÏÏÏÏÏÏÏ 145.3 6.50% 232.3 3.72%
$855.3 $924.2
NIAC:
U.S. and Europe operations ÏÏÏÏÏÏÏÏÏÏÏÏÏÏÏÏÏÏ $ Ì Ì $ 12.6 6.36%
Rest of world operationsÏÏÏÏÏÏÏÏÏÏÏÏÏÏÏÏÏÏÏÏÏ 30.4 5.14% 47.3 7.15%
$ 30.4 $ 59.9
The Company has outstanding loans at interest rates at various spreads above the banks' cost of funds forÑnancing non-U.S. operations. Certain of these loans are secured by accounts receivable and inventory.
31

NIKE, INC.
NOTES TO CONSOLIDATED FINANCIAL STATEMENTS Ì (Continued)
U.S. operations were funded principally with commercial paper. At May 31, 2001 there was $710.0 millionoutstanding and at May 31, 2000 there was $691.9 million outstanding under these arrangements, net ofdiscounting.
The Company purchases through NIAC certain athletic footwear and apparel it acquires from non-U.S. suppliers. These purchases are for the Company's operations outside of the U.S. and Europe. Accountspayable to NIAC are generally due up to 60 days after shipment of goods from the foreign port. The intereston such accounts payable accrues at the 60 day London Interbank OÅered Rate (LIBOR) as of the beginningof the month of the invoice date, plus 0.75%.
At May 31, 2001, the Company had no outstanding borrowings under its $1.25 billion committed creditfacility with a group of 20 banks. This credit facility has a 364-day revolver (due 364 days from the borrowingdate) for $750.0 million and a Ñve-year revolver (due Ñve years from the borrowing date) for $500.0 million.Each year, the $750 million, 364-day facility can be extended 364 days, and the $500 million, Ñve-year facilitycan be extended one year. Based on the Company's current senior unsecured debt ratings, the interest ratecharged on any outstanding borrowings on the $750.0 million revolver would be the prevailing LIBOR rateplus 0.24%, and the interest rate charged on any outstanding borrowings on the $500.0 million revolver wouldbe the prevailing LIBOR rate plus 0.22%. The facility fees for the $750.0 million and the $500.0 millionrevolvers are 0.06% and 0.08%, respectively, of the total commitment. Under these agreements, the Companymust maintain, among other things, certain minimum speciÑed Ñnancial ratios with which the Company wasin compliance at May 31, 2001.
Note 5 Ì Long-Term Debt:
Long-term debt includes the following:
May 31,
2001 2000
(in millions)
6.51% Medium term notes, payable June 16, 2000 ÏÏÏÏÏÏÏÏÏÏÏÏÏÏÏÏÏÏÏÏÏÏÏÏÏÏÏÏÏÏÏ $ Ì $ 50.0
6.69% Medium term notes, payable June 17, 2002 ÏÏÏÏÏÏÏÏÏÏÏÏÏÏÏÏÏÏÏÏÏÏÏÏÏÏÏÏÏÏÏ 50.0 50.0
6.375% Medium term notes, payable December 1, 2003 ÏÏÏÏÏÏÏÏÏÏÏÏÏÏÏÏÏÏÏÏÏÏÏÏÏÏ 199.7 199.6
4.3% Japanese yen notes, payable June 26, 2011ÏÏÏÏÏÏÏÏÏÏÏÏÏÏÏÏÏÏÏÏÏÏÏÏÏÏÏÏÏÏÏÏÏ 85.3 98.2
2.6% Japanese yen notes, maturing August 20, 2001 through November 20, 2020 ÏÏÏÏÏ 73.2 84.2
2.0% Japanese yen notes, maturing August 20, 2001 through November 20, 2020 ÏÏÏÏ 32.5 37.4
Other ÏÏÏÏÏÏÏÏÏÏÏÏÏÏÏÏÏÏÏÏÏÏÏÏÏÏÏÏÏÏÏÏÏÏÏÏÏÏÏÏÏÏÏÏÏÏÏÏÏÏÏÏÏÏÏÏÏÏÏÏÏÏÏÏÏÏÏÏÏ .6 1.0
Total ÏÏÏÏÏÏÏÏÏÏÏÏÏÏÏÏÏÏÏÏÏÏÏÏÏÏÏÏÏÏÏÏÏÏÏÏÏÏÏÏÏÏÏÏÏÏÏÏÏÏÏÏÏÏÏÏÏÏÏÏÏ 441.3 520.4
Less current maturities ÏÏÏÏÏÏÏÏÏÏÏÏÏÏÏÏÏÏÏÏÏÏÏÏÏÏÏÏÏÏÏÏÏÏÏÏÏÏÏÏÏÏÏÏÏÏÏÏÏÏÏÏÏÏ 5.4 50.1
$435.9 $470.3
In December 1996, the Company Ñled a $500.0 million shelf registration with the Securities andExchange Commission (SEC) and issued $200 million seven-year notes, maturing December 1, 2003. In June1997, the Company issued an additional $100 million in medium-term notes under this program withmaturities of June 16, 2000 and June 17, 2002. The note that matured on June 16, 2000 was repaid. Intereston the remaining note outstanding is paid semi-annually. The proceeds from all three issues were subsequentlyexchanged for Dutch guilders and loaned to a European subsidiary. The Company entered into swaptransactions to hedge the foreign currency exposure related to the repayment of these intercompany loans.(See Note 15.) In February 1999, the Company Ñled a shelf registration with the SEC for the sale of up to$500 million in debt securities, of which $200 million had been previously registered but not issued under theDecember 1996 registration.
32

NIKE, INC.
NOTES TO CONSOLIDATED FINANCIAL STATEMENTS Ì (Continued)
In June 1996, one of the Company's Japanese subsidiaries borrowed 10,500 million Japanese yen in aprivate placement with a maturity of June 26, 2011. Interest is paid semi-annually. The agreement provides forearly retirement after year ten.
In July 1999, another of the Company's Japanese subsidiaries assumed 13,000 million in Japanese yenloans as part of its agreement to purchase a distribution center in Japan, which serves as collateral for theloans. These loans mature in equal quarterly installments during the period August 20, 2001 throughNovember 20, 2020. Interest is also paid quarterly.
Amounts of long-term debt maturities in each of the years ending May 31, 2002 through 2006 are$5.4 million, $55.5 million, $205.2 million, $5.5 million and $5.6 million, respectively.
Note 6 Ì Income Taxes:
Income before income taxes and the provision for income taxes are as follows:
Year Ended May 31,
2001 2000 1999
(in millions)
Income before income taxes:
United StatesÏÏÏÏÏÏÏÏÏÏÏÏÏÏÏÏÏÏÏÏÏÏÏÏÏÏÏÏÏÏÏÏÏÏÏÏÏÏÏÏÏÏÏ $470.7 $530.4 $598.7
Foreign ÏÏÏÏÏÏÏÏÏÏÏÏÏÏÏÏÏÏÏÏÏÏÏÏÏÏÏÏÏÏÏÏÏÏÏÏÏÏÏÏÏÏÏÏÏÏÏÏ 450.7 388.8 147.4
$921.4 $919.2 $746.1
Provision for income taxes:
Current:
United States
Federal ÏÏÏÏÏÏÏÏÏÏÏÏÏÏÏÏÏÏÏÏÏÏÏÏÏÏÏÏÏÏÏÏÏÏÏÏÏÏÏÏÏÏÏÏÏÏ $158.5 $205.0 $210.2
State ÏÏÏÏÏÏÏÏÏÏÏÏÏÏÏÏÏÏÏÏÏÏÏÏÏÏÏÏÏÏÏÏÏÏÏÏÏÏÏÏÏÏÏÏÏÏÏÏ 31.6 30.6 34.3
Foreign ÏÏÏÏÏÏÏÏÏÏÏÏÏÏÏÏÏÏÏÏÏÏÏÏÏÏÏÏÏÏÏÏÏÏÏÏÏÏÏÏÏÏÏÏÏÏÏÏ 76.2 58.8 50.1
266.3 294.4 294.6
Deferred:
United States
Federal ÏÏÏÏÏÏÏÏÏÏÏÏÏÏÏÏÏÏÏÏÏÏÏÏÏÏÏÏÏÏÏÏÏÏÏÏÏÏÏÏÏÏÏÏÏÏ 64.2 32.7 (7.6)
State ÏÏÏÏÏÏÏÏÏÏÏÏÏÏÏÏÏÏÏÏÏÏÏÏÏÏÏÏÏÏÏÏÏÏÏÏÏÏÏÏÏÏÏÏÏÏÏÏ 2.6 1.6 4.0
Foreign ÏÏÏÏÏÏÏÏÏÏÏÏÏÏÏÏÏÏÏÏÏÏÏÏÏÏÏÏÏÏÏÏÏÏÏÏÏÏÏÏÏÏÏÏÏÏÏÏ (1.4) 11.4 3.7
65.4 45.7 0.1
$331.7 $340.1 $294.7
The Company has indeÑnitely reinvested approximately $81.0 million of the cumulative undistributedearnings of certain foreign subsidiaries, of which $25.0 million was earned in the year ended May 31, 2001.Such earnings would be subject to U.S. taxation if repatriated to the U.S. The amount of unrecognizeddeferred tax liability associated with the undistributed earnings was approximately $19.9 million.
A beneÑt was recognized for foreign loss carryforwards of $118.6 million at May 31, 2001, of which$4.0 million, $6.0 million, $31.6 million, $8.3 million and $8.1 million expire in the years ended May 31, 2004,2005, 2006, 2007, and 2008, respectively. Foreign loss carryforwards of $60.6 million do not expire.
As of May 31, 2001 the Company had utilized all foreign tax credits.
33

NIKE, INC.
NOTES TO CONSOLIDATED FINANCIAL STATEMENTS Ì (Continued)
Deferred tax liabilities (assets) are comprised of the following:
May 31,
2001 2000
(in millions)
Undistributed earnings of foreign subsidiaries ÏÏÏÏÏÏÏÏÏÏÏÏÏÏÏÏÏÏÏÏÏÏÏÏÏ $ 53.9 $ 24.9
Depreciation ÏÏÏÏÏÏÏÏÏÏÏÏÏÏÏÏÏÏÏÏÏÏÏÏÏÏÏÏÏÏÏÏÏÏÏÏÏÏÏÏÏÏÏÏÏÏÏÏÏÏÏÏÏ 18.4 4.9
Other ÏÏÏÏÏÏÏÏÏÏÏÏÏÏÏÏÏÏÏÏÏÏÏÏÏÏÏÏÏÏÏÏÏÏÏÏÏÏÏÏÏÏÏÏÏÏÏÏÏÏÏÏÏÏÏÏÏÏÏ 20.5 14.9
Gross deferred tax liabilities ÏÏÏÏÏÏÏÏÏÏÏÏÏÏÏÏÏÏÏÏÏÏÏÏÏÏÏÏÏÏÏÏÏÏÏÏÏÏ 92.8 44.7
Allowance for doubtful accounts ÏÏÏÏÏÏÏÏÏÏÏÏÏÏÏÏÏÏÏÏÏÏÏÏÏÏÏÏÏÏÏÏÏÏÏÏ (16.3) (16.0)
Inventory reserves ÏÏÏÏÏÏÏÏÏÏÏÏÏÏÏÏÏÏÏÏÏÏÏÏÏÏÏÏÏÏÏÏÏÏÏÏÏÏÏÏÏÏÏÏÏÏÏÏ (17.2) (16.3)
Sales return reserves ÏÏÏÏÏÏÏÏÏÏÏÏÏÏÏÏÏÏÏÏÏÏÏÏÏÏÏÏÏÏÏÏÏÏÏÏÏÏÏÏÏÏÏÏÏÏ (18.4) (20.8)
Deferred compensation ÏÏÏÏÏÏÏÏÏÏÏÏÏÏÏÏÏÏÏÏÏÏÏÏÏÏÏÏÏÏÏÏÏÏÏÏÏÏÏÏÏÏÏÏ (40.1) (36.2)
Reserves and accrued liabilities ÏÏÏÏÏÏÏÏÏÏÏÏÏÏÏÏÏÏÏÏÏÏÏÏÏÏÏÏÏÏÏÏÏÏÏÏÏ (40.1) (33.1)
Tax basis inventory adjustment ÏÏÏÏÏÏÏÏÏÏÏÏÏÏÏÏÏÏÏÏÏÏÏÏÏÏÏÏÏÏÏÏÏÏÏÏÏ (16.8) (14.7)
Depreciation ÏÏÏÏÏÏÏÏÏÏÏÏÏÏÏÏÏÏÏÏÏÏÏÏÏÏÏÏÏÏÏÏÏÏÏÏÏÏÏÏÏÏÏÏÏÏÏÏÏÏÏÏÏ (25.7) (33.3)
Foreign loss carryforwardsÏÏÏÏÏÏÏÏÏÏÏÏÏÏÏÏÏÏÏÏÏÏÏÏÏÏÏÏÏÏÏÏÏÏÏÏÏÏÏÏÏÏ (33.2) (72.2)
Other ÏÏÏÏÏÏÏÏÏÏÏÏÏÏÏÏÏÏÏÏÏÏÏÏÏÏÏÏÏÏÏÏÏÏÏÏÏÏÏÏÏÏÏÏÏÏÏÏÏÏÏÏÏÏÏÏÏÏÏ (21.5) (18.4)
Gross deferred tax assetsÏÏÏÏÏÏÏÏÏÏÏÏÏÏÏÏÏÏÏÏÏÏÏÏÏÏÏÏÏÏÏÏÏÏÏÏÏÏÏÏÏ (229.3) (261.0)
Net deferred tax assets ÏÏÏÏÏÏÏÏÏÏÏÏÏÏÏÏÏÏÏÏÏÏÏÏÏÏÏÏÏÏÏÏÏÏÏÏÏÏÏÏÏÏ $(136.5) $(216.3)
A reconciliation from the U.S. statutory federal income tax rate to the eÅective income tax rate follows:
Year EndedMay 31,
2001 2000
U.S. federal statutory rateÏÏÏÏÏÏÏÏÏÏÏÏÏÏÏÏÏÏÏÏÏÏÏÏÏÏÏÏÏÏÏÏÏÏÏÏÏÏÏÏÏÏÏÏÏÏÏÏ 35.0% 35.0%
State income taxes, net of federal beneÑt ÏÏÏÏÏÏÏÏÏÏÏÏÏÏÏÏÏÏÏÏÏÏÏÏÏÏÏÏÏÏÏÏÏÏÏ 2.4 2.3
Other, net ÏÏÏÏÏÏÏÏÏÏÏÏÏÏÏÏÏÏÏÏÏÏÏÏÏÏÏÏÏÏÏÏÏÏÏÏÏÏÏÏÏÏÏÏÏÏÏÏÏÏÏÏÏÏÏÏÏÏÏÏÏ (1.4) (0.3)
EÅective income tax rate ÏÏÏÏÏÏÏÏÏÏÏÏÏÏÏÏÏÏÏÏÏÏÏÏÏÏÏÏÏÏÏÏÏÏÏÏÏÏÏÏÏÏÏÏÏÏÏÏ 36.0% 37.0%
Note 7 Ì Redeemable Preferred Stock:
NIAC is the sole owner of the Company's authorized Redeemable Preferred Stock, $1 par value, whichis redeemable at the option of NIAC or the Company at par value aggregating $0.3 million. A cumulativedividend of $0.10 per share is payable annually on May 31 and no dividends may be declared or paid on thecommon stock of the Company unless dividends on the Redeemable Preferred Stock have been declared andpaid in full. There have been no changes in the Redeemable Preferred Stock in the three years ended May 31,2001. As the holder of the Redeemable Preferred Stock, NIAC does not have general voting rights but doeshave the right to vote as a separate class on the sale of all or substantially all of the assets of the Company andits subsidiaries, on merger, consolidation, liquidation or dissolution of the Company or on the sale orassignment of the NIKE trademark for athletic footwear sold in the United States.
Note 8 Ì Common Stock:
The authorized number of shares of Class A Common Stock no par value and Class B Common Stock nopar value are 110 million and 350 million, respectively. Each share of Class A Common Stock is convertibleinto one share of Class B Common Stock. Voting rights of Class B Common Stock are limited in certaincircumstances with respect to the election of directors.
In 1990, the Board of Directors adopted, and the shareholders approved, the NIKE, Inc. 1990 StockIncentive Plan (the ""1990 Plan''). The 1990 Plan provides for the issuance of up to 37.5 million shares of
34
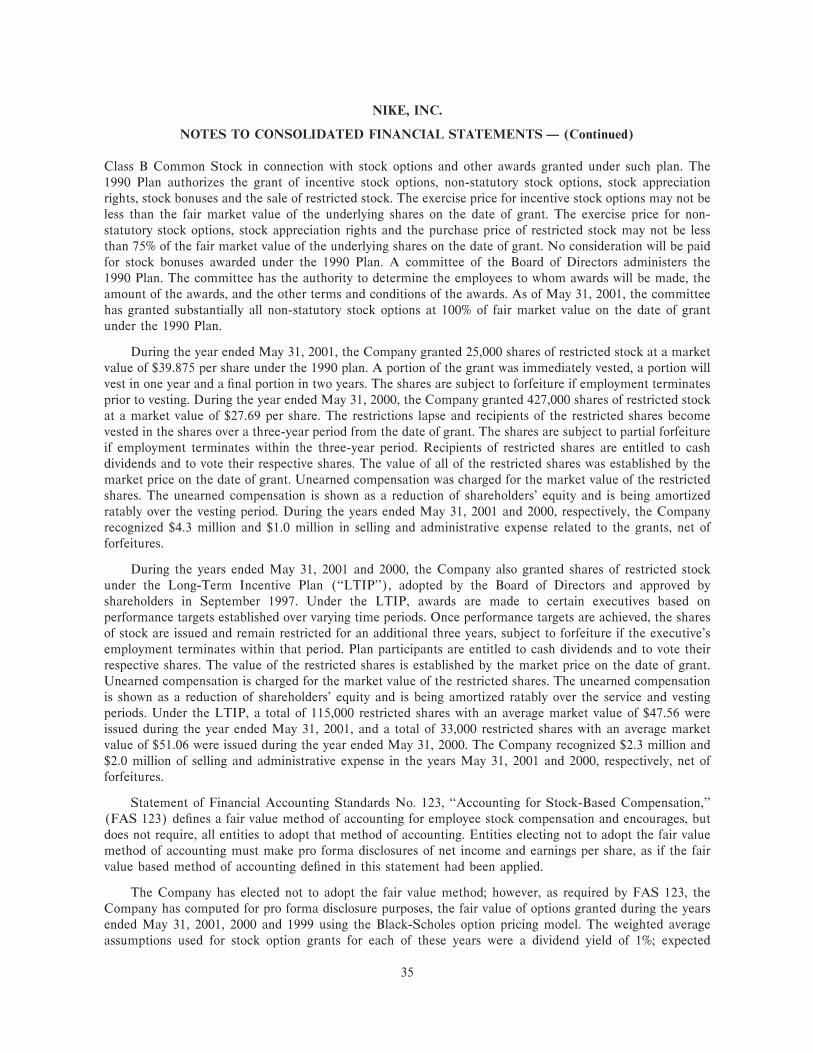
NIKE, INC.
NOTES TO CONSOLIDATED FINANCIAL STATEMENTS Ì (Continued)
Class B Common Stock in connection with stock options and other awards granted under such plan. The1990 Plan authorizes the grant of incentive stock options, non-statutory stock options, stock appreciationrights, stock bonuses and the sale of restricted stock. The exercise price for incentive stock options may not beless than the fair market value of the underlying shares on the date of grant. The exercise price for non-statutory stock options, stock appreciation rights and the purchase price of restricted stock may not be lessthan 75% of the fair market value of the underlying shares on the date of grant. No consideration will be paidfor stock bonuses awarded under the 1990 Plan. A committee of the Board of Directors administers the1990 Plan. The committee has the authority to determine the employees to whom awards will be made, theamount of the awards, and the other terms and conditions of the awards. As of May 31, 2001, the committeehas granted substantially all non-statutory stock options at 100% of fair market value on the date of grantunder the 1990 Plan.
During the year ended May 31, 2001, the Company granted 25,000 shares of restricted stock at a marketvalue of $39.875 per share under the 1990 plan. A portion of the grant was immediately vested, a portion willvest in one year and a Ñnal portion in two years. The shares are subject to forfeiture if employment terminatesprior to vesting. During the year ended May 31, 2000, the Company granted 427,000 shares of restricted stockat a market value of $27.69 per share. The restrictions lapse and recipients of the restricted shares becomevested in the shares over a three-year period from the date of grant. The shares are subject to partial forfeitureif employment terminates within the three-year period. Recipients of restricted shares are entitled to cashdividends and to vote their respective shares. The value of all of the restricted shares was established by themarket price on the date of grant. Unearned compensation was charged for the market value of the restrictedshares. The unearned compensation is shown as a reduction of shareholders' equity and is being amortizedratably over the vesting period. During the years ended May 31, 2001 and 2000, respectively, the Companyrecognized $4.3 million and $1.0 million in selling and administrative expense related to the grants, net offorfeitures.
During the years ended May 31, 2001 and 2000, the Company also granted shares of restricted stockunder the Long-Term Incentive Plan (""LTIP''), adopted by the Board of Directors and approved byshareholders in September 1997. Under the LTIP, awards are made to certain executives based onperformance targets established over varying time periods. Once performance targets are achieved, the sharesof stock are issued and remain restricted for an additional three years, subject to forfeiture if the executive'semployment terminates within that period. Plan participants are entitled to cash dividends and to vote theirrespective shares. The value of the restricted shares is established by the market price on the date of grant.Unearned compensation is charged for the market value of the restricted shares. The unearned compensationis shown as a reduction of shareholders' equity and is being amortized ratably over the service and vestingperiods. Under the LTIP, a total of 115,000 restricted shares with an average market value of $47.56 wereissued during the year ended May 31, 2001, and a total of 33,000 restricted shares with an average marketvalue of $51.06 were issued during the year ended May 31, 2000. The Company recognized $2.3 million and$2.0 million of selling and administrative expense in the years May 31, 2001 and 2000, respectively, net offorfeitures.
Statement of Financial Accounting Standards No. 123, ""Accounting for Stock-Based Compensation,''(FAS 123) deÑnes a fair value method of accounting for employee stock compensation and encourages, butdoes not require, all entities to adopt that method of accounting. Entities electing not to adopt the fair valuemethod of accounting must make pro forma disclosures of net income and earnings per share, as if the fairvalue based method of accounting deÑned in this statement had been applied.
The Company has elected not to adopt the fair value method; however, as required by FAS 123, theCompany has computed for pro forma disclosure purposes, the fair value of options granted during the yearsended May 31, 2001, 2000 and 1999 using the Black-Scholes option pricing model. The weighted averageassumptions used for stock option grants for each of these years were a dividend yield of 1%; expected
35

NIKE, INC.
NOTES TO CONSOLIDATED FINANCIAL STATEMENTS Ì (Continued)
volatility of the market price of the Company's common stock of 39%, 37%, and 34% for the years endedMay 31, 2001, 2000, and 1999, respectively; a weighted-average expected life of the options of approximatelyÑve years; and interest rates of 5.4% for the year ended May 31, 2001, 5.8%, 6.2% and 6.6% for the year endedMay 31, 2000 and 5.5% and 4.9% for the year ended May 31, 1999. These interest rates are reÖective of optiongrant dates throughout the year.
Options were assumed to be exercised over the 5 year expected life for purposes of this valuation.Adjustments for forfeitures are made as they occur. For the years ended May 31, 2001, 2000 and 1999, thetotal value of the options granted, for which no previous expense has been recognized, was computed asapproximately $5.0 million, $129.8 million and $61.6 million, respectively, which would be amortized on astraight line basis over the vesting period of the options. The weighted average fair value per share of theoptions granted in the years ended May 31, 2001, 2000 and 1999 are $17.27, $15.81 and $17.33, respectively.
If the Company had accounted for these stock options issued to employees in accordance with FAS 123,the Company's pro forma net income and pro forma earnings per share (EPS) would have been reported asfollows:
2001 2000 1999
Net Diluted Basic Net Diluted Basic Net Diluted BasicIncome EPS EPS Income EPS EPS Income EPS EPS
(in millions, except per share data)
As reported ÏÏÏÏÏÏÏÏÏÏÏÏÏÏÏÏÏ $589.7 $2.16 $2.18 $579.1 $2.07 $2.10 $451.4 $1.57 $1.59
Pro Forma ÏÏÏÏÏÏÏÏÏÏÏÏÏÏÏÏÏÏ 559.0 2.05 2.07 551.2 1.97 2.00 434.3 1.51 1.53
The pro forma eÅects of applying FAS 123 may not be representative of the eÅects on reported netincome and earnings per share for future years since options vest over several years and additional awards aremade each year.
The following summarizes the stock option transactions under plans discussed above (adjusted for allapplicable stock splits):
WeightedAverageOption
Shares Price
(in thousands)
Options outstanding May 31, 1998ÏÏÏÏÏÏÏÏÏÏÏÏÏÏÏÏÏÏÏÏÏÏÏÏÏÏÏÏÏÏÏ 11,373 $26.30
ExercisedÏÏÏÏÏÏÏÏÏÏÏÏÏÏÏÏÏÏÏÏÏÏÏÏÏÏÏÏÏÏÏÏÏÏÏÏÏÏÏÏÏÏÏÏÏÏÏÏÏÏ (2,665) 15.25
SurrenderedÏÏÏÏÏÏÏÏÏÏÏÏÏÏÏÏÏÏÏÏÏÏÏÏÏÏÏÏÏÏÏÏÏÏÏÏÏÏÏÏÏÏÏÏÏÏÏÏ (399) 46.70
Granted ÏÏÏÏÏÏÏÏÏÏÏÏÏÏÏÏÏÏÏÏÏÏÏÏÏÏÏÏÏÏÏÏÏÏÏÏÏÏÏÏÏÏÏÏÏÏÏÏÏÏÏ 3,556 48.76
Options outstanding May 31, 1999ÏÏÏÏÏÏÏÏÏÏÏÏÏÏÏÏÏÏÏÏÏÏÏÏÏÏÏÏÏÏÏ 11,865 34.97
ExercisedÏÏÏÏÏÏÏÏÏÏÏÏÏÏÏÏÏÏÏÏÏÏÏÏÏÏÏÏÏÏÏÏÏÏÏÏÏÏÏÏÏÏÏÏÏÏÏÏÏÏ (1,237) 18.23
SurrenderedÏÏÏÏÏÏÏÏÏÏÏÏÏÏÏÏÏÏÏÏÏÏÏÏÏÏÏÏÏÏÏÏÏÏÏÏÏÏÏÏÏÏÏÏÏÏÏÏ (852) 52.86
Granted ÏÏÏÏÏÏÏÏÏÏÏÏÏÏÏÏÏÏÏÏÏÏÏÏÏÏÏÏÏÏÏÏÏÏÏÏÏÏÏÏÏÏÏÏÏÏÏÏÏÏÏ 8,294 40.94
Options outstanding May 31, 2000ÏÏÏÏÏÏÏÏÏÏÏÏÏÏÏÏÏÏÏÏÏÏÏÏÏÏÏÏÏÏÏ 18,070 38.02
ExercisedÏÏÏÏÏÏÏÏÏÏÏÏÏÏÏÏÏÏÏÏÏÏÏÏÏÏÏÏÏÏÏÏÏÏÏÏÏÏÏÏÏÏÏÏÏÏÏÏÏÏ (2,944) 19.24
SurrenderedÏÏÏÏÏÏÏÏÏÏÏÏÏÏÏÏÏÏÏÏÏÏÏÏÏÏÏÏÏÏÏÏÏÏÏÏÏÏÏÏÏÏÏÏÏÏÏÏ (1,302) 44.80
Granted ÏÏÏÏÏÏÏÏÏÏÏÏÏÏÏÏÏÏÏÏÏÏÏÏÏÏÏÏÏÏÏÏÏÏÏÏÏÏÏÏÏÏÏÏÏÏÏÏÏÏÏ 341 40.71
Options outstanding May 31, 2001ÏÏÏÏÏÏÏÏÏÏÏÏÏÏÏÏÏÏÏÏÏÏÏÏÏÏÏÏÏÏÏ 14,165 $41.28
Options exercisable at May 31,
1999 ÏÏÏÏÏÏÏÏÏÏÏÏÏÏÏÏÏÏÏÏÏÏÏÏÏÏÏÏÏÏÏÏÏÏÏÏÏÏÏÏÏÏÏÏÏÏÏÏÏÏÏÏÏÏ 5,991 $22.13
2000 ÏÏÏÏÏÏÏÏÏÏÏÏÏÏÏÏÏÏÏÏÏÏÏÏÏÏÏÏÏÏÏÏÏÏÏÏÏÏÏÏÏÏÏÏÏÏÏÏÏÏÏÏÏÏ 6,655 28.72
2001 ÏÏÏÏÏÏÏÏÏÏÏÏÏÏÏÏÏÏÏÏÏÏÏÏÏÏÏÏÏÏÏÏÏÏÏÏÏÏÏÏÏÏÏÏÏÏÏÏÏÏÏÏÏÏ 6,626 39.70
36
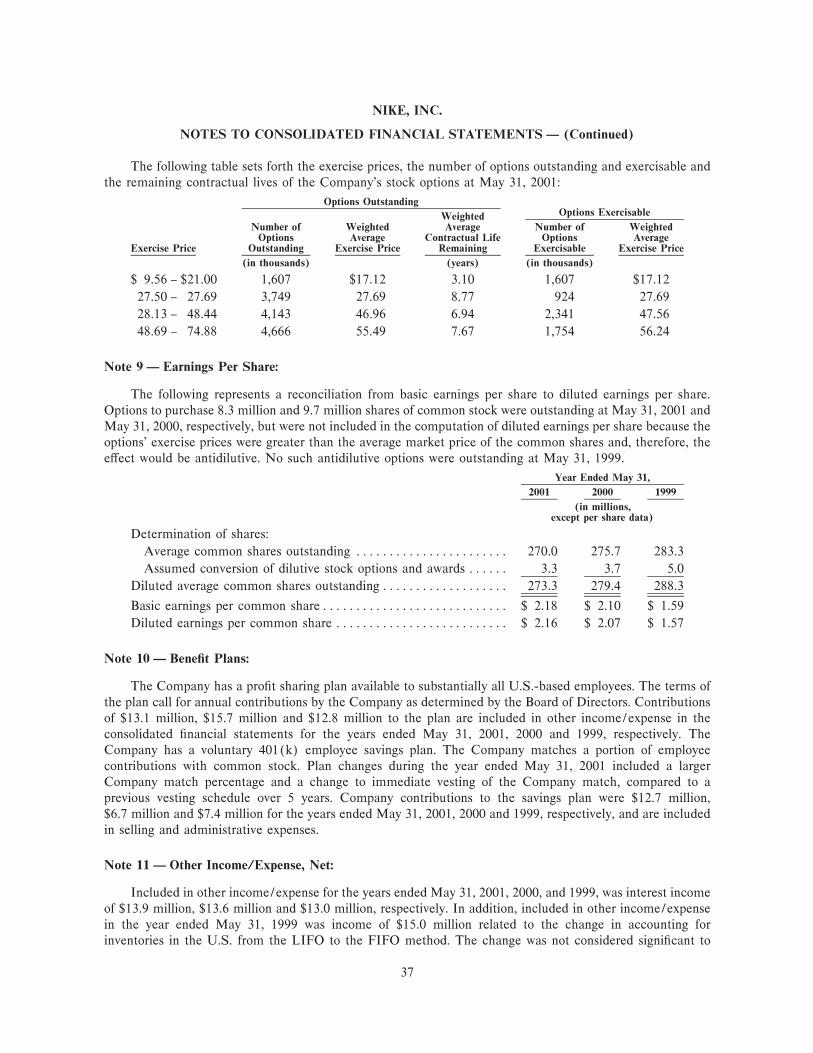
NIKE, INC.
NOTES TO CONSOLIDATED FINANCIAL STATEMENTS Ì (Continued)
The following table sets forth the exercise prices, the number of options outstanding and exercisable andthe remaining contractual lives of the Company's stock options at May 31, 2001:
Options OutstandingOptions ExercisableWeighted
Number of Weighted Average Number of WeightedOptions Average Contractual Life Options Average
Exercise Price Outstanding Exercise Price Remaining Exercisable Exercise Price
(in thousands) (years) (in thousands)
$ 9.56 Ó $21.00 1,607 $17.12 3.10 1,607 $17.12
27.50 Ó 27.69 3,749 27.69 8.77 924 27.69
28.13 Ó 48.44 4,143 46.96 6.94 2,341 47.56
48.69 Ó 74.88 4,666 55.49 7.67 1,754 56.24
Note 9 Ì Earnings Per Share:
The following represents a reconciliation from basic earnings per share to diluted earnings per share.Options to purchase 8.3 million and 9.7 million shares of common stock were outstanding at May 31, 2001 andMay 31, 2000, respectively, but were not included in the computation of diluted earnings per share because theoptions' exercise prices were greater than the average market price of the common shares and, therefore, theeÅect would be antidilutive. No such antidilutive options were outstanding at May 31, 1999.
Year Ended May 31,
2001 2000 1999
(in millions,except per share data)
Determination of shares:
Average common shares outstanding ÏÏÏÏÏÏÏÏÏÏÏÏÏÏÏÏÏÏÏÏÏÏÏ 270.0 275.7 283.3
Assumed conversion of dilutive stock options and awards ÏÏÏÏÏÏ 3.3 3.7 5.0
Diluted average common shares outstandingÏÏÏÏÏÏÏÏÏÏÏÏÏÏÏÏÏÏÏ 273.3 279.4 288.3
Basic earnings per common shareÏÏÏÏÏÏÏÏÏÏÏÏÏÏÏÏÏÏÏÏÏÏÏÏÏÏÏÏ $ 2.18 $ 2.10 $ 1.59
Diluted earnings per common share ÏÏÏÏÏÏÏÏÏÏÏÏÏÏÏÏÏÏÏÏÏÏÏÏÏÏ $ 2.16 $ 2.07 $ 1.57
Note 10 Ì BeneÑt Plans:
The Company has a proÑt sharing plan available to substantially all U.S.-based employees. The terms ofthe plan call for annual contributions by the Company as determined by the Board of Directors. Contributionsof $13.1 million, $15.7 million and $12.8 million to the plan are included in other income/expense in theconsolidated Ñnancial statements for the years ended May 31, 2001, 2000 and 1999, respectively. TheCompany has a voluntary 401(k) employee savings plan. The Company matches a portion of employeecontributions with common stock. Plan changes during the year ended May 31, 2001 included a largerCompany match percentage and a change to immediate vesting of the Company match, compared to aprevious vesting schedule over 5 years. Company contributions to the savings plan were $12.7 million,$6.7 million and $7.4 million for the years ended May 31, 2001, 2000 and 1999, respectively, and are includedin selling and administrative expenses.
Note 11 Ì Other Income/Expense, Net:
Included in other income/expense for the years ended May 31, 2001, 2000, and 1999, was interest incomeof $13.9 million, $13.6 million and $13.0 million, respectively. In addition, included in other income/expensein the year ended May 31, 1999 was income of $15.0 million related to the change in accounting forinventories in the U.S. from the LIFO to the FIFO method. The change was not considered signiÑcant to
37

NIKE, INC.
NOTES TO CONSOLIDATED FINANCIAL STATEMENTS Ì (Continued)
show the cumulative eÅect or to restate comparable income statements as dictated by Accounting PrinciplesBoard Opinion No. 20.
Note 12 Ì Commitments and Contingencies:
The Company leases space for certain of its oÇces, warehouses and retail stores under leases expiringfrom one to sixteen years after May 31, 2001. Rent expense aggregated $152.0 million, $145.5 million and$129.5 million for the years ended May 31, 2001, 2000 and 1999, respectively. Amounts of minimum futureannual rental commitments under non-cancelable operating leases in each of the Ñve years ending May 31,2002 through 2006 are $108.9 million, $101.3 million, $88.0 million, $78.4 million, $70.1 million, respectively,and $298.8 million in later years.
As of May 31, 2001 and 2000, the Company had letters of credit outstanding totaling $851.8 million and$678.2 million, respectively. These letters of credit were issued for the purchase of inventory.
In the ordinary course of its business, the Company has pending various cases involving contractualmatters, employee-related matters, distribution questions, product liability claims, trademark infringementand other matters. The Company does not believe there are any pending legal proceedings that will have amaterial impact on the Company's Ñnancial position or results of operations.
Note 13 Ì Restructuring Charges:
During the year ended May 31, 1999, a $60.1 million charge was taken to better align the Company's coststructure with expected revenue growth rates. The charge (shown below in tabular format) was primarily forcosts of severing employees, including severance packages, lease abandonments and the write down of assetsno longer in use. Employees were terminated in Europe, Asia PaciÑc, and in the United States, and includedemployees aÅected by the Company's shift to outsourcing certain of its information technology functions. Theoriginal number of employees to be terminated was 1,291. As of May 31, 2001, 71 employees have foundpositions elsewhere in the Company and 1,200 have left the Company, leaving 20 still to be terminated. Due tothe change in the number of employees that will be terminated, $0.1 million and $1.4 million of the reservewas reversed during the years ended May 31, 2001 and 2000, respectively.
Also included in the charge was a $20.2 million write-oÅ of certain assets related to the change instrategies around the Company's warehouse distribution facilities in the United States.
The remaining accrual balance as of May 31, 2001 of $1.5 million will be relieved as leases expire andseverance payments are completed.
38

NIKE, INC.
NOTES TO CONSOLIDATED FINANCIAL STATEMENTS Ì (Continued)
Detail of the restructuring charge is as follows:
FY99 Reserve Reserve ReserveCash/ Restructuring FY99 Balance at FY00 Balance at FY01 Balance at
Description Non-Cash Charge Activity 5/31/99 Activity 5/31/00 Activity 5/31/01
(in millions)Elimination of Job
Responsibilities $(39.9) $21.9 $(18.0) $14.5 $(3.5) $1.8 $(1.7)
Severance packagesÏÏÏÏÏÏÏÏÏ cash (28.0) 11.7 (16.3) 12.9 (3.4) 1.8 (1.6)
Lease cancellations &commitments ÏÏÏÏÏÏÏÏÏÏÏÏ cash (2.4) 1.6 (0.8) 0.7 (0.1) Ì (0.1)
Write-down of assetsÏÏÏÏÏÏÏÏ non-cash (7.8) 7.8 Ì Ì Ì Ì Ì
Other ÏÏÏÏÏÏÏÏÏÏÏÏÏÏÏÏÏÏÏÏ cash/non-cash (1.7) 0.8 (0.9) 0.9 Ì Ì Ì
Change in warehousedistribution strategyÏÏÏÏÏÏÏÏÏ $(20.2) $20.2 Ì Ì Ì Ì Ì
Write-down of assetsÏÏÏÏÏÏÏÏ non-cash (20.2) 20.2 Ì Ì Ì Ì Ì
EÅect of foreign currencytranslationÏÏÏÏÏÏÏÏÏÏÏÏÏÏÏÏÏ Ì $ 0.1 $ 0.1 $(0.1) Ì $0.2 $ 0.2
Total ÏÏÏÏÏÏÏÏÏÏÏÏÏÏÏÏÏÏÏÏÏÏÏ $(60.1) $42.2 $(17.9) $14.4 $(3.5) $2.0 $(1.5)
During the year ended May 31, 2000, a $1.1 million reserve established as part of a restructuring chargein the year ended May 31, 1998 was reversed due to changes in outstanding lease commitments.
Note 14 Ì Fair Value of Financial Instruments:
The carrying amounts reÖected in the consolidated balance sheet for cash and equivalents and notespayable approximate fair value due to the short maturities. The fair value of long-term debt is estimated usingdiscounted cash Öow analyses, based on the Company's incremental borrowing rates for similar types ofborrowing arrangements. The fair value of the Company's long-term debt, including current portion, isapproximately $437.8 million, compared to a carrying value of $441.3 million at May 31, 2001 and$509.9 million, compared to a carrying value of $520.4 million at May 31, 2000. See Note 15 for fair value ofderivatives.
Note 15 Ì Financial Risk Management and Derivatives:
The purpose of the Company's foreign currency hedging activities is to protect the Company from therisk that the eventual cash Öows resulting from the sale and purchase of products in foreign currencies will beadversely aÅected by changes in exchange rates. In addition, the Company seeks to manage the impact offoreign currency Öuctuations related to the repayment of intercompany transactions, including intercompanyborrowings. The Company does not hold or issue Ñnancial instruments for trading purposes. It is theCompany's policy to utilize derivative Ñnancial instruments to reduce foreign exchange risks where internalnetting strategies cannot be eÅectively employed. Fluctuations in the value of hedging instruments are oÅsetby Öuctuations in the value of the underlying exposures being hedged.
The Company uses forward exchange contracts and purchased options to hedge certain Ñrm purchasesand sales commitments and the related payables and receivables, including other third party or intercompanyforeign currency transactions, and uses purchased currency options to hedge certain anticipated but not yetÑrmly committed transactions. Cross-currency swaps are used to hedge foreign currency denominatedpayments related to intercompany loan agreements. Hedged transactions are denominated primarily inEuropean currencies, Japanese yen, Australian dollars, Canadian dollars, and Korean won. Premiums paid onpurchased options and any realized gains are included in prepaid expenses or accrued liabilities and recognizedin earnings when the underlying transaction is recognized. Deferred option premium cost, net of realized gains,was $6.1 million of net cost at May 31, 2001. Deferred option premium cost, net of realized gains, was
39

NIKE, INC.
NOTES TO CONSOLIDATED FINANCIAL STATEMENTS Ì (Continued)
$3.8 million of net beneÑt at May 31, 2000. Results related to hedges of Ñrmly committed transactions and therelated receivables and payables are deferred and are recognized in earnings or as adjustments of carryingamounts when the oÅsetting results are recognized on the underlying transaction. Net realized and unrealizedgains on forward contracts deferred at May 31, 2001 and 2000 were $15.8 million and $42.8 million,respectively.
The estimated fair values of derivatives used to hedge the Company's risks will Öuctuate over time. Thefair value of the forward exchange contracts and cross-currency swaps are estimated by obtaining quotedmarket prices. The fair value of option contracts is estimated using option pricing models widely used in theÑnancial markets. These fair value amounts should not be viewed in isolation, but rather in relation to the fairvalues of the underlying hedged transactions and the overall reduction in the Company's exposure to adverseÖuctuations in foreign exchange rates. The notional amounts of derivatives summarized below do notnecessarily represent amounts exchanged by the parties and, therefore, are not a direct measure of theexposure to the Company through its use of derivatives. The amounts exchanged are calculated on the basis ofthe notional amounts and the other terms of the derivatives, which relate to interest rates, exchange rates orother Ñnancial indices.
The following table presents the aggregate notional principal amounts, carrying values and fair values ofthe Company's derivative Ñnancial instruments outstanding at May 31, 2001 and 2000.
May 31,
2001 2000
Notional NotionalPrincipal Carrying Fair Principal Carrying FairAmounts Values Values Amounts Values Values
(in millions)
Currency Swaps ÏÏÏÏÏÏÏÏÏÏÏÏÏÏÏÏÏÏ $ 250.0 $ 77.4 $ 87.0 $ 300.0 $ 72.4 $ 62.2
Forward Contracts ÏÏÏÏÏÏÏÏÏÏÏÏÏÏÏÏ 2,428.3 17.8 51.7 2,430.5 33.0 62.1
Purchased Options ÏÏÏÏÏÏÏÏÏÏÏÏÏÏÏÏ 727.5 17.7 20.4 265.4 8.9 5.7
Total ÏÏÏÏÏÏÏÏÏÏÏÏÏÏÏÏÏÏÏ $3,405.8 $112.9 $159.1 $2,995.9 $114.3 $130.0
Carrying values primarily represent amounts recognized for unrealized gains and losses on contractswhich do not meet the criteria for deferral accounting and unamortized premiums paid on option contracts.
The net fair value of outstanding forward contracts of $51.7 million as of May 31, 2001 was comprised ofunrealized fair value losses of $22.9 million and unrealized fair value gains of $74.6 million. The net fair valueof outstanding forward contracts of $62.1 million as of May 31, 2000 was comprised of unrealized fair valuelosses of $16.4 million and unrealized fair value gains of $78.5 million.
The normal term of foreign exchange forward and option contracts entered into is one year or less. Thecurrency swaps have maturity dates consistent with the maturity dates of the related intercompany loan whichmatures partially during the year ending May 31, 2003 and during the year ending May 31, 2004. All realizedresults deferred at May 31, 2001 will be recorded in earnings within one year.
The Company is exposed to credit-related losses in the event of non-performance by counterparties tohedging instruments. The counterparties to derivative transactions are major Ñnancial institutions with highinvestment grade credit ratings and, additionally, counterparties to derivatives three years or greater are AA°or better rated. However, this does not eliminate the Company's exposure to credit risk with these institutions.This credit risk is generally limited to the unrealized gains in such contracts should any of these counterpartiesfail to perform as contracted. To manage this risk, the Company has established strict counterparty creditguidelines which are continually monitored and reported to senior management according to prescribedguidelines. The Company utilizes a portfolio of Ñnancial institutions either headquartered or operating in the
40

NIKE, INC.
NOTES TO CONSOLIDATED FINANCIAL STATEMENTS Ì (Continued)
same countries the Company conducts its business. As a result of the above considerations, the Companyconsiders the risk of counterparty default to be minimal.
In addition to hedging instruments, the Company is subject to concentrations of credit risk associatedwith cash and equivalents and accounts receivable. The Company places cash and equivalents with Ñnancialinstitutions with investment grade credit ratings and, by policy, limits the amount of credit exposure to any oneÑnancial institution. The Company considers its concentration risk related to accounts receivable to bemitigated by the Company's credit policy, the signiÑcance of outstanding balances owed by each individualcustomer at any point in time and the geographic dispersion of these customers.
Note 16 Ì Operating Segments and Related Information:
Operating Segments. For subsidiaries participating in NIKE brand sales activity, the Company's majoroperating segments are deÑned by geographic regions. Other brands as shown below represent activity for oursubsidiaries Cole Haan Holdings, Inc., Bauer NIKE Hockey Inc., and NIKE IHM, Inc., and are consideredimmaterial for individual disclosure. In prior years, the Company's operations in Africa were included in theAmericas region, but eÅective June 1, 2000, these operations are included in the EMEA (Europe, MiddleEast, and Africa) region. Africa information and certain other prior year segment information has beenreclassiÑed to conform with current year presentation. Where applicable, ""Corporate'' represents itemsnecessary to reconcile to the consolidated Ñnancial statements; these items generally include corporate activityand corporate eliminations. The segments are evidence of the structure of the Company's internal organiza-tion. Each NIKE brand geographic segment operates predominantly in one industry: the design, production,marketing and selling of sports and Ñtness footwear, apparel, and equipment.
Net revenues as shown below represent sales to external customers for each segment. Intercompanyrevenues have been eliminated and are immaterial for separate disclosure. The Company centrally managesinterest expense. Operating segment interest is primarily the result of intercompany lending, which iseliminated for consolidated purposes. The Company evaluates performance of individual operating segmentsbased on Contribution ProÑt before Corporate Allocations and Income Taxes (referred to as management pre-tax income). On a consolidated basis, this amount represents Income Before Taxes as shown in theConsolidated Statements of Income. Reconciling items for management pre-tax income represent corporatecosts that are not allocated to the operating segments for management reporting and intercompanyeliminations for speciÑc income statement items.
Additions to long-lived assets predominantly represent capital expenditures, which are shown below byoperating segment. Other additions to long-lived assets represent additions to identiÑable intangibles andgoodwill, which are immaterial for disclosure. Amortization of identiÑable intangible assets and goodwill isconsidered a corporate expense and is not attributable to any speciÑc operating segment. See Note 1 forfurther discussion on identiÑable intangible assets and goodwill.
41

NIKE, INC.
NOTES TO CONSOLIDATED FINANCIAL STATEMENTS Ì (Continued)
Accounts receivable, inventory and property, plant and equipment for operating segments are regularlyreviewed by management and are therefore provided below.
Year Ended May 31,
2001 2000 1999
(in millions)
Net Revenue
United States ÏÏÏÏÏÏÏÏÏÏÏÏÏÏÏÏÏÏÏÏÏÏÏÏÏÏÏÏÏÏÏÏÏÏÏÏÏÏ $4,819.0 $4,732.1 $4,750.7
EMEAÏÏÏÏÏÏÏÏÏÏÏÏÏÏÏÏÏÏÏÏÏÏÏÏÏÏÏÏÏÏÏÏÏÏÏÏÏÏÏÏÏÏÏÏ 2,584.8 2,407.0 2,293.8
Asia/PaciÑc ÏÏÏÏÏÏÏÏÏÏÏÏÏÏÏÏÏÏÏÏÏÏÏÏÏÏÏÏÏÏÏÏÏÏÏÏÏÏÏ 1,110.0 955.1 844.5
AmericasÏÏÏÏÏÏÏÏÏÏÏÏÏÏÏÏÏÏÏÏÏÏÏÏÏÏÏÏÏÏÏÏÏÏÏÏÏÏÏÏÏÏ 539.1 494.1 469.1
Other brandsÏÏÏÏÏÏÏÏÏÏÏÏÏÏÏÏÏÏÏÏÏÏÏÏÏÏÏÏÏÏÏÏÏÏÏÏÏÏÏ 435.9 406.8 418.8
$9,488.8 $8,995.1 $8,776.9
Management Pre-tax Income
United States ÏÏÏÏÏÏÏÏÏÏÏÏÏÏÏÏÏÏÏÏÏÏÏÏÏÏÏÏÏÏÏÏÏÏÏÏÏÏ $ 919.6 $ 924.3 $ 873.7
EMEAÏÏÏÏÏÏÏÏÏÏÏÏÏÏÏÏÏÏÏÏÏÏÏÏÏÏÏÏÏÏÏÏÏÏÏÏÏÏÏÏÏÏÏÏ 386.3 376.9 294.8
Asia/PaciÑc ÏÏÏÏÏÏÏÏÏÏÏÏÏÏÏÏÏÏÏÏÏÏÏÏÏÏÏÏÏÏÏÏÏÏÏÏÏÏÏ 206.1 146.0 68.2
AmericasÏÏÏÏÏÏÏÏÏÏÏÏÏÏÏÏÏÏÏÏÏÏÏÏÏÏÏÏÏÏÏÏÏÏÏÏÏÏÏÏÏÏ 81.6 63.7 48.3
Other brandsÏÏÏÏÏÏÏÏÏÏÏÏÏÏÏÏÏÏÏÏÏÏÏÏÏÏÏÏÏÏÏÏÏÏÏÏÏÏÏ 41.4 68.9 15.8
Corporate ÏÏÏÏÏÏÏÏÏÏÏÏÏÏÏÏÏÏÏÏÏÏÏÏÏÏÏÏÏÏÏÏÏÏÏÏÏÏÏÏÏ (713.6) (660.6) (554.7)
$ 921.4 $ 919.2 $ 746.1
Capital Expenditures
United States ÏÏÏÏÏÏÏÏÏÏÏÏÏÏÏÏÏÏÏÏÏÏÏÏÏÏÏÏÏÏÏÏÏÏÏÏÏÏ $ 45.2 $ 29.0 $ 50.1
EMEAÏÏÏÏÏÏÏÏÏÏÏÏÏÏÏÏÏÏÏÏÏÏÏÏÏÏÏÏÏÏÏÏÏÏÏÏÏÏÏÏÏÏÏÏ 26.2 46.1 88.8
Asia/PaciÑc ÏÏÏÏÏÏÏÏÏÏÏÏÏÏÏÏÏÏÏÏÏÏÏÏÏÏÏÏÏÏÏÏÏÏÏÏÏÏÏ 52.9 269.7 43.7
AmericasÏÏÏÏÏÏÏÏÏÏÏÏÏÏÏÏÏÏÏÏÏÏÏÏÏÏÏÏÏÏÏÏÏÏÏÏÏÏÏÏÏÏ 5.1 4.8 11.4
Other brandsÏÏÏÏÏÏÏÏÏÏÏÏÏÏÏÏÏÏÏÏÏÏÏÏÏÏÏÏÏÏÏÏÏÏÏÏÏÏÏ 26.3 32.4 28.4
Corporate ÏÏÏÏÏÏÏÏÏÏÏÏÏÏÏÏÏÏÏÏÏÏÏÏÏÏÏÏÏÏÏÏÏÏÏÏÏÏÏÏÏ 161.9 146.8 161.7
$ 317.6 $ 528.8 $ 384.1
Depreciation
United States ÏÏÏÏÏÏÏÏÏÏÏÏÏÏÏÏÏÏÏÏÏÏÏÏÏÏÏÏÏÏÏÏÏÏÏÏÏÏ $ 51.2 $ 50.8 $ 22.8
EMEAÏÏÏÏÏÏÏÏÏÏÏÏÏÏÏÏÏÏÏÏÏÏÏÏÏÏÏÏÏÏÏÏÏÏÏÏÏÏÏÏÏÏÏÏ 38.9 39.9 41.0
Asia/PaciÑc ÏÏÏÏÏÏÏÏÏÏÏÏÏÏÏÏÏÏÏÏÏÏÏÏÏÏÏÏÏÏÏÏÏÏÏÏÏÏÏ 20.5 19.4 20.8
AmericasÏÏÏÏÏÏÏÏÏÏÏÏÏÏÏÏÏÏÏÏÏÏÏÏÏÏÏÏÏÏÏÏÏÏÏÏÏÏÏÏÏÏ 6.3 7.1 6.4
Other brandsÏÏÏÏÏÏÏÏÏÏÏÏÏÏÏÏÏÏÏÏÏÏÏÏÏÏÏÏÏÏÏÏÏÏÏÏÏÏÏ 23.5 23.7 33.9
Corporate ÏÏÏÏÏÏÏÏÏÏÏÏÏÏÏÏÏÏÏÏÏÏÏÏÏÏÏÏÏÏÏÏÏÏÏÏÏÏÏÏÏ 57.0 47.1 73.3
$ 197.4 $ 188.0 $ 198.2
Accounts Receivable, net
United States ÏÏÏÏÏÏÏÏÏÏÏÏÏÏÏÏÏÏÏÏÏÏÏÏÏÏÏÏÏÏÏÏÏÏÏÏÏÏ $ 622.5 $ 564.7 $ 578.6
EMEAÏÏÏÏÏÏÏÏÏÏÏÏÏÏÏÏÏÏÏÏÏÏÏÏÏÏÏÏÏÏÏÏÏÏÏÏÏÏÏÏÏÏÏÏ 512.5 529.9 560.2
Asia/PaciÑc ÏÏÏÏÏÏÏÏÏÏÏÏÏÏÏÏÏÏÏÏÏÏÏÏÏÏÏÏÏÏÏÏÏÏÏÏÏÏÏ 194.8 200.8 141.5
AmericasÏÏÏÏÏÏÏÏÏÏÏÏÏÏÏÏÏÏÏÏÏÏÏÏÏÏÏÏÏÏÏÏÏÏÏÏÏÏÏÏÏÏ 144.7 123.0 110.6
Other brandsÏÏÏÏÏÏÏÏÏÏÏÏÏÏÏÏÏÏÏÏÏÏÏÏÏÏÏÏÏÏÏÏÏÏÏÏÏÏÏ 118.6 121.0 104.6
Corporate ÏÏÏÏÏÏÏÏÏÏÏÏÏÏÏÏÏÏÏÏÏÏÏÏÏÏÏÏÏÏÏÏÏÏÏÏÏÏÏÏÏ 28.3 30.0 44.6
$1,621.4 $1,569.4 $1,540.1
42

NIKE, INC.
NOTES TO CONSOLIDATED FINANCIAL STATEMENTS Ì (Continued)
Year Ended May 31,
2001 2000 1999
(in millions)
Inventory, net
United States ÏÏÏÏÏÏÏÏÏÏÏÏÏÏÏÏÏÏÏÏÏÏÏÏÏÏÏÏÏÏÏÏÏÏÏÏÏÏ $ 744.2 $ 736.5 $ 525.3
EMEAÏÏÏÏÏÏÏÏÏÏÏÏÏÏÏÏÏÏÏÏÏÏÏÏÏÏÏÏÏÏÏÏÏÏÏÏÏÏÏÏÏÏÏÏ 298.3 357.4 320.1
Asia/PaciÑc ÏÏÏÏÏÏÏÏÏÏÏÏÏÏÏÏÏÏÏÏÏÏÏÏÏÏÏÏÏÏÏÏÏÏÏÏÏÏÏ 125.8 115.9 81.5
AmericasÏÏÏÏÏÏÏÏÏÏÏÏÏÏÏÏÏÏÏÏÏÏÏÏÏÏÏÏÏÏÏÏÏÏÏÏÏÏÏÏÏÏ 72.4 65.5 69.2
Other brandsÏÏÏÏÏÏÏÏÏÏÏÏÏÏÏÏÏÏÏÏÏÏÏÏÏÏÏÏÏÏÏÏÏÏÏÏÏÏÏ 156.4 141.4 137.5
Corporate ÏÏÏÏÏÏÏÏÏÏÏÏÏÏÏÏÏÏÏÏÏÏÏÏÏÏÏÏÏÏÏÏÏÏÏÏÏÏÏÏÏ 27.0 29.3 37.0
$1,424.1 $1,446.0 $1,170.6
Property, Plant and Equipment, net
United States ÏÏÏÏÏÏÏÏÏÏÏÏÏÏÏÏÏÏÏÏÏÏÏÏÏÏÏÏÏÏÏÏÏÏÏÏÏÏ $ 263.5 $ 271.7 $ 294.1
EMEAÏÏÏÏÏÏÏÏÏÏÏÏÏÏÏÏÏÏÏÏÏÏÏÏÏÏÏÏÏÏÏÏÏÏÏÏÏÏÏÏÏÏÏÏ 208.2 240.4 272.1
Asia/PaciÑc ÏÏÏÏÏÏÏÏÏÏÏÏÏÏÏÏÏÏÏÏÏÏÏÏÏÏÏÏÏÏÏÏÏÏÏÏÏÏÏ 403.5 426.4 148.0
AmericasÏÏÏÏÏÏÏÏÏÏÏÏÏÏÏÏÏÏÏÏÏÏÏÏÏÏÏÏÏÏÏÏÏÏÏÏÏÏÏÏÏÏ 15.4 18.1 20.8
Other brandsÏÏÏÏÏÏÏÏÏÏÏÏÏÏÏÏÏÏÏÏÏÏÏÏÏÏÏÏÏÏÏÏÏÏÏÏÏÏÏ 113.4 114.4 111.7
Corporate ÏÏÏÏÏÏÏÏÏÏÏÏÏÏÏÏÏÏÏÏÏÏÏÏÏÏÏÏÏÏÏÏÏÏÏÏÏÏÏÏÏ 614.8 512.4 419.1
$1,618.8 $1,583.4 $1,265.8
Revenues by Major Product Lines. Revenues to external customers for NIKE brand products areattributable to sales of footwear, apparel, and equipment. Revenues to external customers for Other brandsinclude external sales by Cole Haan Holdings, Inc. and Bauer NIKE Hockey Inc..
Year Ended May 31,
2001 2000 1999
(in millions)
Footwear ÏÏÏÏÏÏÏÏÏÏÏÏÏÏÏÏÏÏÏÏÏÏÏÏÏÏÏÏÏÏÏÏÏÏÏÏÏÏÏÏÏÏÏÏ $5,623.7 $5,561.5 $5,218.4
Apparel ÏÏÏÏÏÏÏÏÏÏÏÏÏÏÏÏÏÏÏÏÏÏÏÏÏÏÏÏÏÏÏÏÏÏÏÏÏÏÏÏÏÏÏÏÏ 2,763.6 2,547.0 2,677.1
Equipment ÏÏÏÏÏÏÏÏÏÏÏÏÏÏÏÏÏÏÏÏÏÏÏÏÏÏÏÏÏÏÏÏÏÏÏÏÏÏÏÏÏÏ 665.6 479.8 462.6
Other brandsÏÏÏÏÏÏÏÏÏÏÏÏÏÏÏÏÏÏÏÏÏÏÏÏÏÏÏÏÏÏÏÏÏÏÏÏÏÏÏÏÏ 435.9 406.8 418.8
$9,488.8 $8,995.1 $8,776.9
Revenues and Long-Lived Assets by Geographic Area. Geographical area information is similar to thatshown previously under operating segments with the exception that Other brand activity is derivedpredominantly from activity in the U.S. and Americas. Revenues derived in the U.S. were $5,144.2 million$5,017.4 million, $5,042.6 million, during the years ended May 31, 2001, 2000, and 1999, respectively. Long-lived assets, which are comprised of net property, plant & equipment and net identiÑable intangible assets andgoodwill, attributable to operations in the U.S. were $1,201.5 million $1,222.5 million, and $1,112.3 million atMay 31, 2001, 2000, and 1999, respectively.
Major Customers. During the years ended May 31, 2001, 2000 and 1999, revenues derived from onecustomer represented 11.8%, 12.4% and 10.3%, respectively of the Company's consolidated revenues. Sales tothis customer are included in all segments of the Company.
43
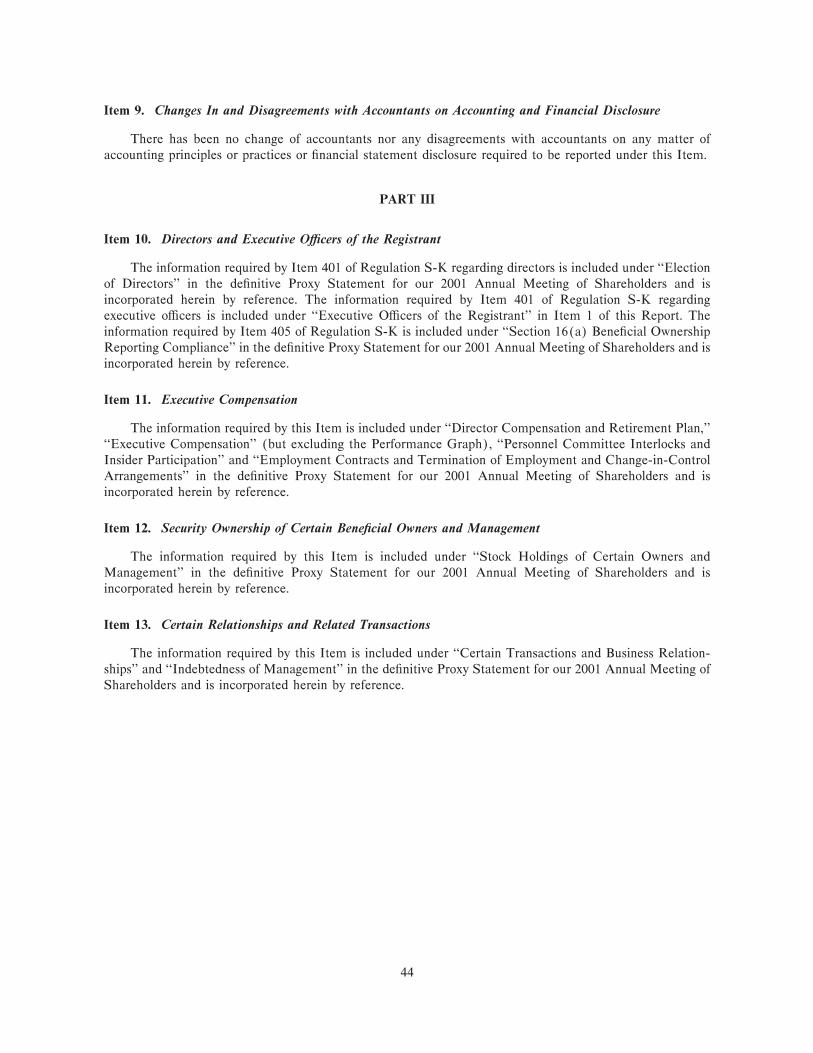
Item 9. Changes In and Disagreements with Accountants on Accounting and Financial Disclosure
There has been no change of accountants nor any disagreements with accountants on any matter ofaccounting principles or practices or Ñnancial statement disclosure required to be reported under this Item.
PART III
Item 10. Directors and Executive OÇcers of the Registrant
The information required by Item 401 of Regulation S-K regarding directors is included under ""Electionof Directors'' in the deÑnitive Proxy Statement for our 2001 Annual Meeting of Shareholders and isincorporated herein by reference. The information required by Item 401 of Regulation S-K regardingexecutive oÇcers is included under ""Executive OÇcers of the Registrant'' in Item 1 of this Report. Theinformation required by Item 405 of Regulation S-K is included under ""Section 16(a) BeneÑcial OwnershipReporting Compliance'' in the deÑnitive Proxy Statement for our 2001 Annual Meeting of Shareholders and isincorporated herein by reference.
Item 11. Executive Compensation
The information required by this Item is included under ""Director Compensation and Retirement Plan,''""Executive Compensation'' (but excluding the Performance Graph), ""Personnel Committee Interlocks andInsider Participation'' and ""Employment Contracts and Termination of Employment and Change-in-ControlArrangements'' in the deÑnitive Proxy Statement for our 2001 Annual Meeting of Shareholders and isincorporated herein by reference.
Item 12. Security Ownership of Certain BeneÑcial Owners and Management
The information required by this Item is included under ""Stock Holdings of Certain Owners andManagement'' in the deÑnitive Proxy Statement for our 2001 Annual Meeting of Shareholders and isincorporated herein by reference.
Item 13. Certain Relationships and Related Transactions
The information required by this Item is included under ""Certain Transactions and Business Relation-ships'' and ""Indebtedness of Management'' in the deÑnitive Proxy Statement for our 2001 Annual Meeting ofShareholders and is incorporated herein by reference.
44
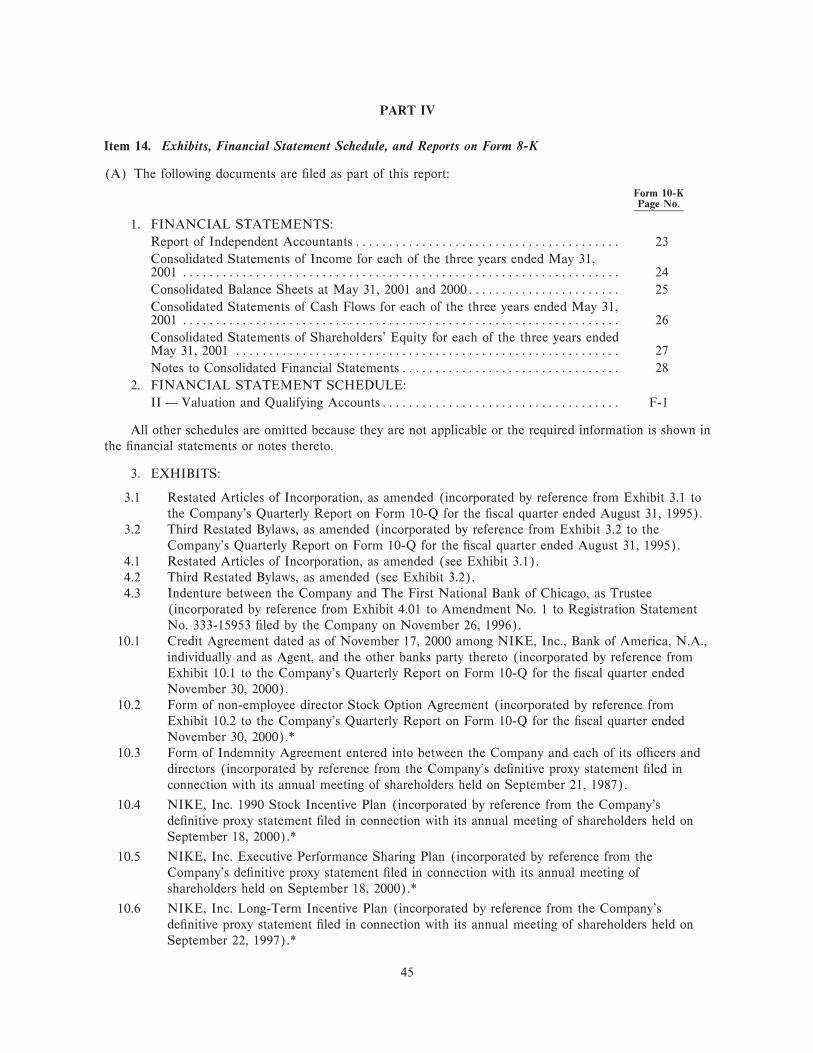
PART IV
Item 14. Exhibits, Financial Statement Schedule, and Reports on Form 8-K
(A) The following documents are Ñled as part of this report:
Form 10-KPage No.
1. FINANCIAL STATEMENTS:
Report of Independent AccountantsÏÏÏÏÏÏÏÏÏÏÏÏÏÏÏÏÏÏÏÏÏÏÏÏÏÏÏÏÏÏÏÏÏÏÏÏÏÏÏÏ 23
Consolidated Statements of Income for each of the three years ended May 31,2001 ÏÏÏÏÏÏÏÏÏÏÏÏÏÏÏÏÏÏÏÏÏÏÏÏÏÏÏÏÏÏÏÏÏÏÏÏÏÏÏÏÏÏÏÏÏÏÏÏÏÏÏÏÏÏÏÏÏÏÏÏÏÏÏÏÏÏ 24
Consolidated Balance Sheets at May 31, 2001 and 2000ÏÏÏÏÏÏÏÏÏÏÏÏÏÏÏÏÏÏÏÏÏÏÏ 25
Consolidated Statements of Cash Flows for each of the three years ended May 31,2001 ÏÏÏÏÏÏÏÏÏÏÏÏÏÏÏÏÏÏÏÏÏÏÏÏÏÏÏÏÏÏÏÏÏÏÏÏÏÏÏÏÏÏÏÏÏÏÏÏÏÏÏÏÏÏÏÏÏÏÏÏÏÏÏÏÏÏ 26
Consolidated Statements of Shareholders' Equity for each of the three years endedMay 31, 2001 ÏÏÏÏÏÏÏÏÏÏÏÏÏÏÏÏÏÏÏÏÏÏÏÏÏÏÏÏÏÏÏÏÏÏÏÏÏÏÏÏÏÏÏÏÏÏÏÏÏÏÏÏÏÏÏÏÏÏ 27
Notes to Consolidated Financial StatementsÏÏÏÏÏÏÏÏÏÏÏÏÏÏÏÏÏÏÏÏÏÏÏÏÏÏÏÏÏÏÏÏÏ 28
2. FINANCIAL STATEMENT SCHEDULE:
II Ì Valuation and Qualifying AccountsÏÏÏÏÏÏÏÏÏÏÏÏÏÏÏÏÏÏÏÏÏÏÏÏÏÏÏÏÏÏÏÏÏÏÏÏ F-1
All other schedules are omitted because they are not applicable or the required information is shown inthe Ñnancial statements or notes thereto.
3. EXHIBITS:
3.1 Restated Articles of Incorporation, as amended (incorporated by reference from Exhibit 3.1 tothe Company's Quarterly Report on Form 10-Q for the Ñscal quarter ended August 31, 1995).
3.2 Third Restated Bylaws, as amended (incorporated by reference from Exhibit 3.2 to theCompany's Quarterly Report on Form 10-Q for the Ñscal quarter ended August 31, 1995).
4.1 Restated Articles of Incorporation, as amended (see Exhibit 3.1).4.2 Third Restated Bylaws, as amended (see Exhibit 3.2).4.3 Indenture between the Company and The First National Bank of Chicago, as Trustee
(incorporated by reference from Exhibit 4.01 to Amendment No. 1 to Registration StatementNo. 333-15953 Ñled by the Company on November 26, 1996).
10.1 Credit Agreement dated as of November 17, 2000 among NIKE, Inc., Bank of America, N.A.,individually and as Agent, and the other banks party thereto (incorporated by reference fromExhibit 10.1 to the Company's Quarterly Report on Form 10-Q for the Ñscal quarter endedNovember 30, 2000).
10.2 Form of non-employee director Stock Option Agreement (incorporated by reference fromExhibit 10.2 to the Company's Quarterly Report on Form 10-Q for the Ñscal quarter endedNovember 30, 2000).*
10.3 Form of Indemnity Agreement entered into between the Company and each of its oÇcers anddirectors (incorporated by reference from the Company's deÑnitive proxy statement Ñled inconnection with its annual meeting of shareholders held on September 21, 1987).
10.4 NIKE, Inc. 1990 Stock Incentive Plan (incorporated by reference from the Company'sdeÑnitive proxy statement Ñled in connection with its annual meeting of shareholders held onSeptember 18, 2000).*
10.5 NIKE, Inc. Executive Performance Sharing Plan (incorporated by reference from theCompany's deÑnitive proxy statement Ñled in connection with its annual meeting ofshareholders held on September 18, 2000).*
10.6 NIKE, Inc. Long-Term Incentive Plan (incorporated by reference from the Company'sdeÑnitive proxy statement Ñled in connection with its annual meeting of shareholders held onSeptember 22, 1997).*
45
10.7 Collateral Assignment Split-Dollar Agreement between NIKE, Inc. and Philip H. Knight datedMarch 10, 1994 (incorporated by reference from Exhibit 10.7 to the Company's Annual Reporton Form 10-K for the Ñscal year ended May 31, 1994).*
12.1 Computation of Ratio of Earnings to Fixed Charges.
21 Subsidiaries of the Registrant.
23 Consent of PricewaterhouseCoopers LLP, independent accountants (set forth on page F-2 ofthis Annual Report on Form 10-K).
* Management contract or compensatory plan or arrangement.
Upon written request to Investor Relations, NIKE, Inc., One Bowerman Drive, Beaverton, Oregon97005-6453, NIKE will furnish shareholders with a copy of any Exhibit upon payment of $.10 per page, whichrepresents our reasonable expenses in furnishing Exhibits.
(B) The following reports on Form 8-K were Ñled by NIKE during the last quarter of Ñscal 2001:
Date Item Subject
March 10, 2001 Item 5. Other Events Earnings release for third quarter of Ñscal year 2001
April 26, 2001 Item 5. Other Events FAS 133 eÅect on Ñrst quarter of Ñscal year 2002
46

SCHEDULE II
VALUATION AND QUALIFYING ACCOUNTS(in millions)
Balance at Charged to Charged to Write-OÅs Balance atBeginning Costs and Other Net of End of
Description of Period Expenses Accounts Recoveries Period
For the year ended May 31, 1999:
Allowance for doubtful accounts ÏÏÏÏÏÏÏÏÏÏÏÏÏÏ $71.4 $ 7.8 $1.8 $ (7.8) $73.2
For the year ended May 31, 2000:
Allowance for doubtful accounts ÏÏÏÏÏÏÏÏÏÏÏÏÏÏ $73.2 $26.0 $1.8 $(35.6) $65.4
For the year ended May 31, 2001:
Allowance for doubtful accounts ÏÏÏÏÏÏÏÏÏÏÏÏÏÏ $65.4 $32.7 $2.8 $(28.8) $72.1
F-1

CONSENT OF INDEPENDENT ACCOUNTANTS
We hereby consent to the incorporation by reference in the documents listed below of our report datedJune 27, 2001 relating to the Ñnancial statements and Ñnancial statement schedule of NIKE, Inc., whichappears in this Form 10-K:
1. Registration Statement on Form S-8 (No. 2-81419) of NIKE, Inc.;
2. Registration Statement on Form S-3 (No. 33-43205) of NIKE, Inc.;
3. Registration Statement on Form S-3 (No. 33-48977) of NIKE, Inc.;
4. Registration Statement on Form S-3 (No. 33-41842) of NIKE, Inc.;
5. Registration Statement on Form S-8 (No. 33-63995) of NIKE, Inc.;
6. Registration Statement on Form S-3 (No. 333-15953) of NIKE, Inc.;
7. Registration Statement on Form S-8 (No. 333-63581) of NIKE, Inc.;
8. Registration Statement on Form S-8 (No. 333-63583) of NIKE, Inc.; and
9. Registration Statement on Form S-3 (No. 333-71975) of NIKE, Inc.
/s/ PRICEWATERHOUSECOOPERS LLP
PricewaterhouseCoopers LLPPortland, OregonAugust 9, 2001
F-2

SIGNATURES
Pursuant to the requirements of Section 13 or 15(d) of the Securities Exchange Act of 1934, theregistrant has duly caused this report to be signed on its behalf by the undersigned, thereunto duly authorized.
Date: August 9, 2001 NIKE, INC.
By: /s/ PHILIP H. KNIGHT
Philip H. KnightChairman of the Board, Chief Executive OÇcer
and President
Pursuant to the requirements of the Securities Exchange Act of 1934, this report has been signed belowby the following persons on behalf of the registrant and in the capacities and on the dates indicated.
Signature Title Date
Principal Executive OÇcer and Director:
/s/ PHILIP H. KNIGHT Chairman of the Board, Chief August 9, 2001Executive OÇcer, and PresidentPhilip H. Knight
Principal Financial and Accounting OÇcer:
/s/ DONALD W. BLAIR Chief Financial OÇcer August 9, 2001
Donald W. Blair
Directors:
/s/ THOMAS E. CLARKE Director August 9, 2001
Thomas E. Clarke
/s/ JILL K. CONWAY Director August 9, 2001
Jill K. Conway
/s/ RALPH D. DENUNZIO Director August 9, 2001
Ralph D. DeNunzio
/s/ RICHARD K. DONAHUE Director August 9, 2001
Richard K. Donahue
/s/ DELBERT J. HAYES Director August 9, 2001
Delbert J. Hayes
/s/ DOUGLAS G. HOUSER Director August 9, 2001
Douglas G. Houser
/s/ JOHN E. JAQUA Director August 9, 2001
John E. Jaqua
/s/ CHARLES W. ROBINSON Director August 9, 2001
Charles W. Robinson
/s/ A. MICHAEL SPENCE Director August 9, 2001
A. Michael Spence
/s/ JOHN R. THOMPSON, JR. Director August 9, 2001
John R. Thompson, Jr.
S-1