SECURITIES AND EXCHANGE COMMISSION - Aboitizdisclosures.aboitiz.com/20110419042104.pdf · Renewable...
280
COVER SHEET C E 0 2 5 3 6 S.E.C. Registration Number A B O I T I Z E Q U I T Y V E N T U R E S , I N C . ( Company's Full Name ) A B O I T I Z C O R P O R A T E C E N T E R G O V . M A N U E L C U E N C O A V E . K A S A M B A G A N , C E B U C I T Y ( Business Address: No. Street City / Town / Province ) LEAH I. GERALDEZ (032) 411-1800 Contact Person Company Telephone Number 1 2 3 1 1 7 - A 0 5 1 6 Month Day FORM TYPE Month Day Fiscal Year Annual Meeting Secondary License Type, if Applicable S E C Dept. Requiring this Doc Amended Articles Number/Section x Total No. of Stockholders Domestic Foreign - - - - - - - - - - - - - - - - - - - - - - - - - - - - - - - - - - - - - - - - - - - - - - - - - - - - - - - - - - - - - - - - - - - - - - To be accomplished by SEC Personnel concerned File Number LCU Document I.D. Cashier S T A M P S Remarks = pls. Use black ink for scanning purposes Annual Report 2010
Transcript of SECURITIES AND EXCHANGE COMMISSION - Aboitizdisclosures.aboitiz.com/20110419042104.pdf · Renewable...

COVER SHEET
C E 0 2 5 3 6S.E.C. Registration Number
A B O I T I Z E Q U I T Y V E N T U R E S , I N C .
( Company's Full Name )
A B O I T I Z C O R P O R A T E C E N T E R
G O V . M A N U E L C U E N C O A V E .
K A S A M B A G A N , C E B U C I T Y( Business Address: No. Street City / Town / Province )
LEAH I. GERALDEZ (032) 411-1800Contact Person Company Telephone Number
1 2 3 1 1 7 - A 0 5 1 6Month Day FORM TYPE Month Day
Fiscal Year Annual Meeting
Secondary License Type, if Applicable
S E CDept. Requiring this Doc Amended Articles Number/Section
xTotal No. of Stockholders Domestic Foreign
- - - - - - - - - - - - - - - - - - - - - - - - - - - - - - - - - - - - - - - - - - - - - - - - - - - - - - - - - - - - - - - - - - - - - -
To be accomplished by SEC Personnel concerned
File Number LCU
Document I.D. Cashier
S T A M P S
Remarks = pls. Use black ink for scanning purposes
Annual Report 2010

Annual Report 2010 29
SEC FORM 20 - IS (INFORMATION STATEMENT)
Aboitiz Group ACO and the companies or entities in which ACO has a beneficial interest and, directly or indirectly, exercises management control, including, without limitation, Aboitiz Equity Ventures, Inc., Aboitiz Power Corporation, Union Bank of the Philippines and their respective Subsidiaries and Affiliates
Aboitiz Jebsen Group
The Company’s joint venture with the Jebsen Group of Norway and is composed of Aboitiz Jebsen Bulk Transport Corporation, Aboitiz Jebsen Manpower Solutions, Inc., Jebsen Maritime, Inc. and their affiliated companies.
AboitizLand or ALI Aboitiz Land, Inc.
AboitizPower or AP
Aboitiz Power Corporation
Abovant or AHI Abovant Holdings, Inc.
ACO Aboitiz & Company, Inc.
Accuria Accuria, Inc.
ACGI Aboitiz Construction Group, Inc.
Adventenergy Adventenergy, Inc.
AESI Aboitiz Energy Solutions, Inc.
AEV AV AEV Aviation, Inc.
AEV, the Company, the Issuer, or the Registrant
Aboitiz Equity Ventures, Inc.
AEV Group, or The Group
AEV and its Subsidiaries
Affiliate With respect to any Person, any other Person directly or indirectly Controlled or is under common Control by such Person
AJMAN or AJMSI Aboitiz Jebsen Manpower Solutions, Inc.
Ambuklao-Binga Hydroelectric Power Complex
Refers to the 75 MW Ambuklao Hydroelectric Power Plant of SNAP-Benguet located in Bokod, Benguet and the 100 MW Binga Hydroelectric Power Plant of SNAP-Benguet located at Itogon, Benguet
AP Group Aboitiz Power Corporation and its Subsidiaries
APRI AP Renewables, Inc.
ARI Aboitiz Renewables, Inc. (formerly Philippine Hydropower Corporation)
ATS Aboitiz Transport System (ATSC) Corporation
BEZ Balamban Enerzone Corporation
BIR Bureau of Internal Revenue
BOI The Philippine Board of Investments
Bunker C A term used to designate the thickest of the residual fuels that is produced by blending any oil remaining at the end of the oil-refining process with lighter oil
CEDC Cebu Energy Development Corporation
Chevron Chevron Geothermal Philippines Holdings, Inc.
CitySavings or CSB City Savings Bank
Cleanergy or CI Cleanergy, Inc. (formerly Northern Mini-Hydro Corporation)
Cotabato Light or CLP
Cotabato Light & Power Company
COC Certificate of Compliance
DEFINITION OF TERMS

Aboit iz Equity Ventures, Inc.30
SEC FORM 20 - IS (INFORMATION STATEMENT)
CPDC Cebu Praedia Development Corporation
CPCN Certificate of Public Convenience and Necessity
CPPC Cebu Private Power Corporation
Davao Light or DLP
Davao Light &Power Company, Inc.
DOE Department of Energy
DOLE Department of Labor and Employment
Distribution Companies or Distribution Utilities
Refers to BEZ, CLP, DLP, MEZ, SEZ, SFELAPCO, and VECO collectively
Distribution Company
Any of BEZ, Cotabato Light, Davao Light, MEZ, SEZ, SFELAPCO and VECO
EAUC East Asia Utilities Corporation
El Paso Philippines El Paso Philippines Energy Company, Inc.
EPIRA RA No. 9136, otherwise known as the “Electric Power Industry Reform Act of 2001”, as amended from time to time, and including the rules and regulations issued thereunder
Enerzone Companies
A term collectively referring to BEZ, MEZ and SEZ - the Company’s distribution utilities operating within special economic zones.
ERC Energy Regulatory Commission
Generation Companies
Refers to APRI, CPPC, DLP, EAUC, Hedcor, Hedcor Sibulan, Hedcor Tamugan, LHC, SNAP-Magat, SNAP-Benguet, SPPC, STEAG Power, WMPC, RP Energy, and CEDC collectively
Global Formosa Global Formosa Power Holdings, Inc.,
Global Power Global Business Power Corporation of the Metrobank Group
Government The Government of the Republic of the Philippines
Greenfield Power generation projects that are developed from inception on previously undeveloped sites
GWh Gigawatt-hour, or one million kilowatt-hours
HEDC Hydro Electric Development Corporation
Hedcor or HI Hedcor, Inc.
Hedcor Consortium
The consortium comprised of ARI, Hedcor, Hedcor Sibulan and Hedcor Tamugan with an existing PSA with DLP for the supply of new capacity to DLP
Hedcor Sibulan or HSI
Hedcor Sibulan, Inc.
Hedcor Tamugan or HTI
Hedcor Tamugan, Inc.
Hijos Hijos De F. Escaño, Inc.
IPPA Independent Power Producer Administrator
JMI Jebsens Maritime, Inc.
kV Kilovolt, or one thousand volts
kW Kilowatt, or one thousand watts
kWh Kilowatt-hour, the standard unit of energy used in the electric power industry. One kilowatt-hour is the amount of energy that would be produced by a generator producing one thousand watts for one hour
LHC Luzon Hydro Corporation

Annual Report 2010 31
SEC FORM 20 - IS (INFORMATION STATEMENT)
Magat Plant The 360 MW Magat Hydroelectric Power Plant of SNAP-Magat located at the border of Isabela and Ifugao provinces
MEPZ I Mactan Export Processing Zone I
MEPZ II Mactan Export Processing Zone II
MEZ Mactan Enerzone Corporation
MORE Manila-Oslo Renewable Enterprise, Inc.
MW Megawatt, or one million watts
MWh Megawatt-hour
MVA Megavolt Ampere
NEA National Electrification Administration
NIA National Irrigation Authority
NPC National Power Corporation
NWRB National Water Resources Board
PBR Performance-based rate-setting regulation
PEMC Philippine Electricity Market Corporation
PHBI Pacific Hydro Bakun, Inc., a wholly owned subsidiary of Pacific Hydro and the joint venture partner of ARI in LHC
Philippine Pesos or π
The lawful currency of the Philippines
PHPL or Pacific Hydro
Pacific Hydro Pty. Ltd., an Australian Company which specializes in developing and operating renewable energy projects. It is the parent company of PHBI.
Pilmico or PFC Pilmico Foods Corporation
PPA Power Purchase Agreement
PSA Power Supply Agreement
PSALM Power Sector Assets and Liabilities Management Corporation
PSE Philippine Stock Exchange
PSPA Power Supply and Purchase Agreement
RA Republic Act
Renewable Energy Act or RE Law
RA No. 9513, otherwise known as the Renewable Energy Act of 2008
RORB Return-on-rate base rate setting system
RP Energy Redondo Peninsula Energy, Inc.
Run-of-river hydroelectric plant
Hydroelectric power plant that generates electricity from the natural flow and elevation drop of a river
SBFZ Subic Bay Freeport Zone
SBMA Subic Bay Metropolitan Authority
SEC The Securities and Exchange Commission of the Philippines
SEZ or SEZC Subic Enerzone Corporation
Sibulan Project Two run-of-river hydropower generating facilities tapping the Sibulan and Baroring rivers in Sibulan, Santa Cruz, Davao del Sur
SFELAPCO San Fernando Electric Light and Power Co., Inc.
SNAP - Benguet SN Aboitiz Power – Benguet, Inc. (formerly, SN Aboitiz Power Hydro, Inc.)
SNAP - Magat SN Aboitiz Power – Magat, Inc.

Aboit iz Equity Ventures, Inc.32
SEC FORM 20 - IS (INFORMATION STATEMENT)
SPPC Southern Philippine Power Corporation
SN Power Statkraft Norfund Power Invest AS of Norway
STEAG Power STEAG State Power, Inc.
Subsidiary In respect of any Person, any entity (i) over fifty percent (50.0%) of whose capital is owned directly by that Person; or (ii) for which that Person may nominate or appoint a majority of the members of the board of directors or such other body performing similar functions
TCIC Taiwan Cogeneration International Corporation
Team Philippines Team Philippines Industrial Power II Corporation (formerly, Mirant (Phils.) Industrial Power II Corp.)
Therma Marine or TMI
Therma Marine, Inc.
Therma Mobile Therma Mobile, Inc.
Therma South, Inc. New name of Therma Pagbilao, Inc.
Tiwi-MakBan Tiwi-MakBan Geothermal Complex, composed of eight geothermal plants and one binary plant, located in the provinces of Batangas, Laguna and Albay.
TLI Therma Luzon, Inc.
TPC Toledo Power Company
TPI Therma Power, Inc.
TPVI Therma Power-Visayas, Inc.
Transco National Transmission Corporation and, as applicable, the National Grid Corporation of the Philippines or NGCP which is the Transco concessionaire
US$ or USD The lawful currency of the United States of America
UnionBank or UBP Union Bank of the Philippines
VECO Visayan Electric Company, Inc.
VAT Value Added Tax
WCIP West Cebu Industrial Park
WESM Philippine Wholesale Electricity Spot Market
WMPC Western Mindanao Power Corporation

1 • SEC FORM 17-A (ANNUAL REPORT)
SECURITIES AND EXCHANGE COMMISSION
SEC FORM 17-A
ANNUAL REPORT PURSUANT TO SECTION 17 OF THE SECURITIES REGULATION CODE AND SECTION 141
OF THE CORPORATION CODE OF THE PHILIPPINES 1. For the year ended 2010 2. SEC Identification Number CEO2536 3. BIR TIN 003-828-269-V 4. Exact name of registrant as specified in its charter Aboitiz Equity Ventures, Inc. 5. Cebu City, Philippines 6.
Province, country or other jurisdiction Industry Classification Code of incorporation 7. Aboitiz Corporate Center, Gov. Manuel A. Cuenco Ave., Kasambagan, Cebu City 6000
Address of principal office Postal Code 8. (032) 411-1800 Issuer’s telephone number, including area code 9. NA Former name or former address, if changed since last report 10. Securities registered pursuant to Sections 8 and 12 of the SRC, or Section 4 and 8 of the
RSA. Title of Each Class Number of Shares of Common Stock Outstanding and Amount of Debt Outstanding Common (as of December 31, 2010) 5,521,871,821 Total Debt (as of December 31, 2010) π96,649,844,765 11. Are any or all of the securities listed on a Stock Exchange? Yes ( ) No ( )
If yes, state the name of such stock exchange and the classes of securities listed therein: Philippine Stock Exchange Common
12. Check whether the registrant:
(a) has filed all reports required to be filed by Section 17 of the Securities Regulation Code (SRC) and SRC Rule 17.1 thereunder or Section 11 of the RSA and RSA Rule 11 (a)-1 thereunder, and Sections 26 and 141 of the Corporation Code of the Philippines, during the preceding 12 months (or for such shorter period that the registrant was required to file such reports);
Yes ( ) No ( )

2 • SEC FORM 17-A (ANNUAL REPORT)
(b) has been subject to such filing requirements for the past 90 days.
Yes ( ) No ( )
13. State the aggregate market value of the voting stock held by non-affiliates of the registrant. The aggregate market value shall be computed by reference to the price at which the stock was sold, or the average bid and asked prices of such stock, as of a specified date within sixty (60) days prior to the date of filing. If a determination as to whether a particular person or entity is an affiliate cannot be made without involving unreasonable effort and expense, the aggregate market value of the common stock held by non-affiliates may be calculated on the basis of assumptions reasonable under the circumstances, provided the assumptions are set forth in this Form.
For 2010, aggregate voting stock of registrant held outside of its affiliates and/or officers and employees totaled 2,921,889,000 shares (for details please refer to the attached notes to financial statements and Schedule K of this report) while its average market price per share was π23.73.
Based on this data, total market value of registrant’s voting stock not held by its affiliates and/or officers and employees was computed to be π69,336,425,970.00.
APPLICABLE ONLY TO REGISTRANTS INVOLVED IN
INSOLVENCY/SUSPENSION OF PAYMENTS PROCEEDINGS DURING THE PRECEDING FIVE YEARS:
14. Check whether the registrant has filed all documents and reports required to be filed by
Section 17 of the RSA subsequent to the distribution of securities under a plan confirmed by a court or the SEC.
Yes ( ) No ( )
DOCUMENTS INCORPORATED BY REFERENCE
If any of the following documents are incorporated by reference, briefly describe them and identify the part of SEC Form 17-A into which the document is incorporated:
(a) Any annual report to security holders;
(b) Any information statement filed pursuant to SRC Rule 20;
(c) Any prospectus filed pursuant to SRC Rule 8.1.
PART 1 – BUSINESS AND GENERAL INFORMATION Item 1. Business (1) Business Development
The registrant, Aboitiz Equity Ventures, Inc. (AEV), is the public holding and management company of the Aboitiz Group, one of the largest conglomerates in the Philippines. Incorporated on September 11, 1989, the company was originally known as Cebu Pan Asian Holdings, Inc. Its name was changed to Aboitiz Equity Ventures, Inc. on December 29, 1993, and its ownership was opened to the general public through an Initial Public Offering (IPO) of its stocks in 1994.

3 • SEC FORM 17-A (ANNUAL REPORT)
Neither AEV nor any of its subsidiaries has ever been the subject of any bankruptcy, receivership or similar proceedings.
(2) Business of Issuer (i) Products
Until December 28, 2010, AEV’s core businesses, conducted through its various subsidiaries and affiliates, can be grouped into five main categories as follows: (a) power distribution and generation, (b) financial services, (c) food manufacturing, (d) transport, and (e) portfolio investments (parent company/others). On December 1, 2010, AEV together with its major shareholder Aboitiz & Company, Inc. (ACO) entered into a Securities Purchase Agreement with Negros Navigation Company, Inc. (NENACO) for the purchase by NENACO of the entire equity stake of AEV and ACO in AEV’s transport subsidiary Aboitiz Transport System (ATSC) Corporation (ATS). The sale included all the logistics and shipping businesses of ATS except the ship management, manning and crew management, and bulk transport businesses of ATS’s joint venture companies with the Jebsen Group of Norway. The sale of ATS to NENACO was consummated on December 28, 2010 following the completion of the closing conditions provided under the Securities Purchase Agreement. Based on the Securities and Exchange Commission (SEC) parameters of what constitutes a significant subsidiary under Item XX of Annex “B” (SRC Rule 12), the following are AEV’s significant subsidiaries at present: Aboitiz Power Corporation and subsidiaries, and Pilmico Foods Corporation and subsidiary. (Please see Annex “A” hereof to see which companies fall under the different business segments).
POWER GENERATION AND DISTRIBUTION Aboitiz Power Corporation (AboitizPower) Incorporated in 1998, AboitizPower is a publicly listed holding company that, through its subsidiaries and affiliates, is a leader in the Philippine power industry and has interests in a number of privately-owned generation companies and distribution utilities. AEV owns 76.40% of the outstanding capital stock of AboitizPower as of February 28, 2011. The Aboitiz Group’s involvement in the power industry began when members of the Aboitiz family acquired a 20% ownership interest in Visayan Electric Company, Inc. (VECO) in the early 1900s. The Aboitiz Group’s direct and active involvement in the power distribution industry can be traced to the 1930s, when Aboitiz & Company, Inc. (ACO) acquired the Ormoc Electric Light Company and its accompanying ice plant, the Jolo Power Company and Cotabato Light & Power Company (Cotabato Light). In July 1946, the Aboitiz Group strengthened its position in power distribution in the Southern Philippines when it acquired Davao Light & Power Company, Inc. (Davao Light), which is now the third-largest privately-owned electric utility in the Philippines in terms of customers and annual gigawatt-hour (GWh) sales. In December 1978, ACO divested its ownership interests in the Ormoc Electric Light Company and the Jolo Power Company to allow these companies to be converted into electric cooperatives, which was the policy being promoted by the government of then-President Ferdinand Marcos. ACO sold these two companies and scaled down its participation in the power distribution business in order to focus on the more lucrative franchises held by Cotabato Light, Davao Light and VECO. In response to the Philippines’ pressing need for adequate power supply, the Aboitiz Group became involved in power generation, becoming a pioneer and industry leader in hydroelectric energy. In 1978 the Aboitiz Group incorporated Hydro Electric Development Corporation (HEDC). HEDC carried

4 • SEC FORM 17-A (ANNUAL REPORT)
out feasibility studies (including hydrological and geological studies) and hydroelectric power installation and maintenance and also developed hydroelectric projects in and around Davao City. The Aboitiz Group also incorporated Northern Mini-Hydro Corporation (now Cleanergy, Inc.) on June 26, 1990, which focused on the development of mini-hydroelectric projects in Benguet province in Northern Luzon. By 1990 HEDC and Cleanergy had commissioned and were operating 14 plants with a combined installed capacity of 36 megawatts (MW). In 1996 the Aboitiz Group led the consortium that entered into a build-operate-transfer (BOT) agreement with the National Power Corporation (NPC) to develop and operate the 70 MW Bakun AC hydroelectric plant in Ilocos Sur province. AboitizPower was incorporated on February 13, 1998 as a holding company for the Aboitiz Group’s investments in power generation and distribution. However, in order to prepare for growth in the power generation industry, AboitizPower was repositioned in the third quarter of 2003 as a holding company that owned power generation assets only. The divestment by AboitizPower of its power distribution assets was achieved through a property dividend declaration in the form of AboitizPower’s ownership interests in the different power distribution companies. The property dividend declaration effectively transferred direct control over the Aboitiz Group’s power distribution business to AEV. Further, in 2005 AboitizPower consolidated its investments in mini-hydroelectric plants in a single company by transferring all of HEDC’s and Cleanergy’s mini-hydroelectric assets into Hedcor, Inc. In December 2006, the Company and its partner, SN Power Invest AS (SN Power) of Norway, through SN Aboitiz Power-Magat, Inc. (SNAP-Magat) submitted the highest bid for the 360 MW Magat hydroelectric plant auctioned by PSALM. The price offered was USD530 mn. PSALM turned over possession and control of the Magat Plant to SNAP-Magat on April 26, 2007. In a share swap agreement with AEV last January 20, 2007, AboitizPower issued a total of 2,889,320,292 of its common shares in exchange for AEV’s ownership interests in the following distribution companies, as follows:
• An effective 55% ownership interest in VECO, which is the second largest privately-owned distribution utility in the Philippines in terms of customers and annual GWh sales and is the largest distribution utility in the Visayas region;
• A 100% equity interest in each of Davao Light and Cotabato Light. Davao Light is the third largest privately owned distribution utility in the Philippines in terms of customers and annual GWh sales;
• An effective 64% ownership interest in Subic Enerzone Corporation (SEZ), which manages the Power Distribution System (PDS) of the Subic Bay Metropolitan Authority (SBMA); and
• An effective 44% ownership interest in San Fernando Electric Light and Power Company (SFELAPCO), which holds the franchise to distribute electricity in the city of San Fernando, Pampanga, in Central Luzon, and its surrounding areas.
In February 2007, the Company entered into a memorandum of agreement with Taiwan Cogeneration International Corporation to collaborate in the building and operation of an independent coal-fired power plant in the Subic Bay Freeport Zone. In May 2007 Redondo Peninsula Energy, Inc. (RP Energy) was incorporated as the project company that will undertake the Subic Coal Project. On April 20, 2007, the Company acquired 50% of the outstanding capital stock of East Asia Utilities Corporation (EAUC) from El Paso Philippines Energy Company, Inc. (El Paso). EAUC operates a Bunker C-fired plant with a capacity of 50 MW within the Mactan Export Processing Zone I (MEPZ I) in Mactan Island, Cebu. On the same date, the Company also acquired from EAUC 60% of the outstanding common shares of Cebu Private Power Corporation (CPPC). CPPC operates a 70 MW Bunker C-fired plant in Cebu City. On June 8, 2007, as part of the reorganization of the power-related assets of the Aboitiz Group, the Company agreed to acquire from its affiliate, Aboitiz Land, Inc. (AboitizLand) a 100% interest in

5 • SEC FORM 17-A (ANNUAL REPORT)
Mactan Enerzone Corporation (MEZ), which owns and operates the PDS in the MEPZ II in Mactan Island in Cebu, and a 60% interest in Balamban Enerzone Corporation (BEZ), which owns and operates the PDS in the West Cebu Industrial Park-Special Economic Zone (WCIP-SEZ) in Balamban town in the western part of Cebu. The Company also consolidated its ownership interest in SEZ by acquiring the combined 25% interest in SEZ held by AEV, SFELAPCO, Okeelanta Corporation (Okeelanta) and Pampanga Sugar Development Corporation (PASUDECO). These acquisitions were made through a share swap agreement which involved the issuance of a total of 170,940,307 common shares of the Company issued at the initial public offering price of π5.80 per share in exchange for the foregoing equity interests in MEZ, BEZ and SEZ. In August 2007, the Company, together with Vivant Energy Corporation of the Garcia Group, signed a memorandum of agreement with Global Business Power Corporation (Global Power) of the Metrobank Group for the construction and operation of a 3x82 MW coal-fired power plant in Toledo City, Cebu. The Company, together with the Garcia Group, formed Abovant Holdings, Inc. (Abovant). The Company owns 60% of Abovant. The project, which is being undertaken by Cebu Energy Development Corporation (CEDC), a joint venture company among Global Power, Formosa Heavy Industries and Abovant, broke ground last January 2008 and is expected to be completed and start full commercial operations by first quarter of 2011. The Company has an effective participation of 26.40% in the project. On November 15, 2007, AboitizPower closed the sale and purchase of a 34% equity ownership in STEAG State Power, Inc. (STEAG), owner and operator of a 232 MW coal-fired power plant located in the PHIVIDEC Industrial Estate in Misamis Oriental, Northern Mindanao. The Company won the competitive bid to buy the 34% equity from Evonik Steag GmbH (formerly known as Steag GmbH) in August 2007. The total purchase price for the 34% equity in STEAG is USD102 mn, inclusive of interests. On November 28, 2007, SN Aboitiz Power-Benguet, Inc. (SNAP-Benguet), a consortium between AboitizPower and SN Power, submitted the highest bid for the Ambuklao-Binga Hydroelectric Power Complex consisting of the 75 MW Ambuklao Hydroelectric Power Plant located at Bokod, Benguet and the 100 MW Binga Hydroelectric Power Plant located at Itogon, Benguet. The price offered amounted to USD325 mn. In 2007, AboitizPower entered into an agreement to buy the 20% equity of Team Philippines in SEZ for π92 mn. Together with the 35% equity in SEZ of AboitizPower’s subsidiary Davao Light, this acquisition brings AboitizPower’s total equity in SEZ to 100%. In 2008, AboitizPower bought the 40% equity ownership of Tsuneishi Holdings (Cebu), Inc. (THI) in BEZ for approximately π178 mn. The acquisition brought AboitizPower’s total equity in BEZ to 100%. Last May 26, 2009, AP Renewables, Inc., (APRI), a wholly owned subsidiary of AboitizPower, took over the ownership and operations of the 289 MW Tiwi geothermal power plant facility in Albay and the 458 MW Makiling-Banahaw geothermal power plant facility in Laguna (collectively referred to as the “Tiwi-MakBan geothermal facilities”) after winning the competitive bid conducted by PSALM on July 30, 2008. The Tiwi-MakBan geothermal facilities have a sustainable capacity of approximately 462 MW. Therma Luzon, Inc. (TLI), a wholly owned subsidiary of AboitizPower, won the competitive bid for the appointment of the Independent Power Producer (IPP) Administrator of the 700 MW Contracted Capacity of the Pagbilao Coal Fired Power Plant (the Pagbilao IPPA) last August 28, 2009. It assumed dispatch control of the Pagbilao power plant last October 1, 2009, becoming the first IPP Administrator in the country. As IPP Administrator, TLI is responsible for procuring the fuel requirements of, and for selling the electricity generated by, the Pagbilao power plant. The Pagbilao power plant is located in Pagbilao, Quezon. AboitizPower, through its wholly owned subsidiary, Therma Marine, Inc. (TMI), assumed ownership over Power Barge (PB) 118 and PB 117 last February 6, 2010 and March 1, 2010, respectively, after

6 • SEC FORM 17-A (ANNUAL REPORT)
acquiring the two power barges from PSALM for USD30 mn through a negotiated bid concluded last July 31, 2009. Each of the barge mounted diesel powered generation plants has a generating capacity of 100 MW. PB 117 and PB 118 are moored at Nasipit, Agusan del Norte and Barangay San Roque, Maco, Compostela Valley, respectively. Ownership in AboitizPower was opened to the public through an initial public offering of its common shares in July 2007. Its common shares were officially listed in the Philippine Stock Exchange (PSE) on July 16, 2007. The Company is in the process of implementing a corporate reorganization that will put all its renewable energy assets under Aboitiz Renewables, Inc. (ARI) (formerly Philippine Hydropower Corporation), and all its non-renewable generation assets under Therma Power, Inc. (TPI). Neither AboitizPower nor any of its subsidiaries has ever been the subject of any bankruptcy, receivership or similar proceedings. Aboitiz Renewables, Inc. (ARI) AboitizPower, one of the leading providers of renewable energy in the country, holds all its investments in renewable energy through its wholly owned subsidiary, ARI. ARI owns equity interests in the following generation companies:
• 100% equity interest in APRI which owns the Tiwi-MakBan geothermal facilities. • 100% equity interest in Hedcor, Inc., which operates 15 mini-hydroelectric plants (plants
with less than 10 MW in installed capacity) in Benguet province in Northern Luzon and in Davao City in Southeastern Mindanao with a total installed capacity of 38.2 MW.
• 50% equity interest in LHC, which operates the 70 MW Bakun AC hydroelectric plant in Ilocos Sur province in northern Luzon.
• 50% effective interest in SNAP-Magat, which operates the 360 MW Magat hydroelectric plant in Isabela in northern Luzon.
• 50% effective interest in SNAP-Benguet, which operates the 175 MW Ambuklao-Binga Hydroelectric Power Plant Complex in Northern Luzon.
• 100% equity interest in Hedcor Sibulan, Inc. (Hedcor Sibulan), which owns the 42.5 MW Sibulan hydropower project in Santa Cruz, Davao del Sur.
• 100% equity interest in Hedcor Tamugan, Inc. (Hedcor Tamugan), which proposes to build a 11.5 MW Tamugan hydropower project along the Tamugan River in Davao City.
• 100% equity interest in Hedcor Tudaya, Inc. (Hedcor Tudaya), which proposes to build the 6.6 MW Tudaya 1 and7 MW Tudaya 2 run-of-river hydropower projects in Santa Cruz, Davao del Sur.
• 100% equity interest in Hedcor Sabangan, Inc. (Hedcor Sabangan), which proposes to build the 13.2 MW Sabangan run-of-river hydropower project in Sabangan, Mountain Province.
Since beginning operations in 1998, the Company has been committed to developing expertise in renewable energy technologies. The Company’s management believes that due to growing concerns on the environmental impact of power generation using traditional fossil fuel energy sources, greater emphasis will be placed on providing adequate, reliable, and reasonably priced energy through innovative and renewable energy technologies such as hydroelectric and geothermal technologies. As such, a significant component of the Company’s future projects are expected to focus on those projects that management believes will allow the Company to leverage its experience in renewable energy and help maintain the Company’s position as a leader in the Philippine renewable energy industry. AP Renewables, Inc. (APRI) APRI is one of the country’s leading power generation companies. It is a wholly-owned subsidiary of ARI that acquired the Tiwi-MakBan geothermal facilities located at Tiwi, Albay, Bay and Calauan,

7 • SEC FORM 17-A (ANNUAL REPORT)
Laguna and Sto. Tomas, Batangas from PSALM in May 2009. The two complexes have a total capacity of 485 MW. As geothermal power plants, Tiwi and Makban produce clean energy that is reasonable in cost, efficient in operation and environment-friendly. With the continuous advancement in technology, APRI is setting its vision to operate and maintain the Tiwi and Makban geothermal complexes in accordance with the highest professional standards of world-class independent power producers operating in a merchant market. The Asset Purchase Agreement (APA) between APRI and PSALM requires APRI to rehabilitate units 5 and 6 of the Makban Geothermal Power Plant at its own cost and expense, which must be accomplished and completed within four years from closing of the APA last May 2009. APRI is currently in the midst of rehabilitation and refurbishment process. Based on initial estimates, the rehabilitation and refurbishment costs could reach USD140-150 mn over a period of two to three years. This rehabilitation and refurbishment plan is expected to improve the geothermal plant’s operating capacities. APRI is a Board of Investment (BOI) registered enterprise as New Operator of the Tiwi-Makban geothermal complex, on pioneer status with six years income tax holiday starting on June 19, 2009. SN Aboitiz Power – Magat, Inc. (SNAP-Magat) SNAP-Magat is ARI’s joint venture company with SN Power, a leading Norwegian hydropower company with projects and operations in Asia, Africa and Latin America. On December 14, 2006, SNAP-Magat participated in and won the bid for the 360- MW Magat hydroelectric power plant (the Magat Plant) conducted by PSALM for a bid price of USD530 mn. The Magat Plant, which is located at the border of Isabela and Ifugao provinces in northern Luzon, was completed in 1983. As a hydroelectric facility that can be started up in a short period of time, the Magat Plant is ideally suited to act as a peaking plant with opportunities to capture the significant upside potential that can arise during periods of high demand. The Magat Plant has the ability to store water equivalent to one month of generating capacity, allowing for the generation and sale of electricity at the peak hours of the day, which command premium prices. Magat’s source of upside, water as a source of fuel and the ability to store it, is also its source of limited downside. This hydroelectric asset has minimal marginal costs, granting it competitive advantage in terms of economic dispatch order versus other fuel-fired power plants that have significant marginal cash costs. SNAP-Magat sells most of the electricity generated by the Magat Plant through the Wholesale Electricity Spot Market (WESM). It is also a provider of much needed ancillary services to the Luzon grid. SNAP-Magat obtained Board of Investments (BOI) approval of its application as new operator of the Magat plant with a pioneer status, which entitles it to an income tax holiday until July 12, 2013. A portion of the land underlying the Magat plant is in the name of the National Irrigation Administration (NIA). This portion is being leased by SNAP-Magat from NIA under terms and conditions provided under their O&M Agreement for the operations and maintenance of the non-power component of the Magat hydroelectric plant. On March 23, 2007, President Arroyo issued a presidential proclamation reserving and granting NPC ownership over certain parcels of public land in Isabela province and instructing the Department of Environment and Natural Resources to issue a special patent over the untitled public land on which a portion of the Magat plant is situated. This portion of land, which was titled in 2007, was eventually bought by SNAPMagat. In September 2007, SNAP-Magat obtained a USD380 mn loan from a consortium of international and domestic financial institutions which include the International Finance Corporation, Nordic Investment Bank, BDO–EPCI, Inc., Bank of the Philippine Islands, China Banking Corporation, Development Bank of the Philippines, The Hong Kong and Shanghai Banking Corporation Limited,

8 • SEC FORM 17-A (ANNUAL REPORT)
Philippine National Bank and Security Bank Corporation. The USD380 mn loan consists of a dollar tranche of up to USD152 mn, and a peso tranche of up to π10.1 bn. The financing agreement was hailed as the region’s first-ever project finance debt granted to a merchant power plant. It won Project Finance International’s Power Deal of the Year and Asset’s Best Project Finance Award as well as Best Privatization Award. The loan was used to partially finance the deferred balance of the purchase price of the Magat Plant under the Asset Purchase Agreement with PSALM. Part of the loan proceeds was also used to refinance SNAP-Magat’s USD159 mn loan from AEV and its advances from its shareholders used to acquire the Magat Plant. As a hallmark of innovation in revenue generation, SNAP-Magat garnered an ancillary services contract on October 12, 2009 with the National Grid Corporation of the Philippines (NGCP), a first for a privately owned plant. These services are necessary to maintain power quality, reliability and security of the grid. After 25 years of operations without any major rehabilitation works done on the generating units and considering the age and results of technical assessments, SNAP-Magat has embarked on a four-year refurbishment program for all major plant equipment starting 2009 to 2013. The main objective is to put back the lost efficiency and address operational difficulties due to obsolescence. The project will preserve the remaining life and the continuance of its availability for the next 25 years. In December 2010, SNAP-Magat announced it will proceed with the feasibility study for the expansion of the Magat hydroelectric plant from 360 MW to up to 540 MW. The conduct of the feasibility study was formalized on December 15, 2010 upon the signing of a Memorandum of Understanding (MOU) between SNAP-Magat and the NIA. The MOU facilitates the gathering of information to determine the feasibility of expanding the capacity of the Magat plant for an additional 90 to 180 MW. The existing Magat plant was designed for two additional units. The study will also include the feasibility of installing a pumped-storage system. The result of the feasibility study will enable SNAP-Magat to evaluate whether to proceed with the construction phase of the project. SN Aboitiz Power – Benguet, Inc. (SNAP-Benguet) On November 28, 2007, SNAP-Benguet, also a consortium between ARI and SN Power, submitted the highest bid to PSALM for the Ambuklao-Binga Hydroelectric Power Complex, which consists of the 75-MW Ambuklao Hydroelectric Power Plant (Ambuklao Plant) located in Bokod, Benguet and the 100-MW Binga Hydroelectric Power Plant (Binga Plant) located in Itogon, Benguet. The price offered amounted to USD325 mn. The Ambuklao-Binga Hydroelectric Power Complex was turned over to SNAP-Benguet on July 10, 2008. In August 2008, SNAP-Benguet signed a USD375 mn loan agreement with a consortium of local and foreign banks where USD160 mn was taken up as USD financing and USD215 mn as peso financing. Proceeds from the facility were used to partially finance the purchase price, rehabilitate the power plant complex and refinance SNAP-Benguet’s existing advances from shareholders with respect to the acquisition of the assets. SNAP-Benguet obtained BOI approval of its application as new operator of the Ambuklao and Binga plants with a pioneer status, which entitles it to an income tax holiday commencing from date of registration. Binga’s approval is effective until August 12, 2014, while that of Ambuklao lasts until July 2016.

9 • SEC FORM 17-A (ANNUAL REPORT)
Ambuklao Plant has been under preservation since 1999 due to damage from the 1990 earthquake. Rehabilitation of the Ambuklao Plant commenced in late 2008. The initial attempt to close the old headrace tunnel using concrete plug has proven difficult due to the unexpected volume of sediments (silt and clay) in the tunnel compounded by the effects of Typhoon Pepeng (international name: Parma) that hit the province in October 2009. Instead, SNAP-Benguet is now extending the new headrace tunnel and building new penstocks up to the main inlet valves to allow water to flow through to the new turbines; consequently, it has abandoned the old tunnel plugging solution. With the extension of the new headrace tunnel and building of new penstocks, the first unit of Ambuklao plant is expected to be completed by second quarter of 2011 with all three units operational by third quarter of 2011, instead of end 2010 as earlier reported. The refurbishment of the Binga Plant commenced in 2010. Headrace tunnel and intake excavation is 80% completed. Construction of the new intake structure is on-going and target completion of the project is in 2014. The projects are expected to increase the capacity of the Ambuklao Plant to 105 MW and of the Binga Plant to 120 MW. In 2010, SNAP-Benguet also entered into a contract with the NGCP for the Binga plant to provide ancillary services. This hallmark of business innovation has resulted in a new stream of revenue for the company. Hedcor, Inc. (Hedcor) Hedcor was originally incorporated on October 10, 1986 by ACO as the Baguio-Benguet Power Development Corporation. ARI acquired its 100% ownership interest in Hedcor in 1998. In 2005, ARI consolidated all of its mini-hydroelectric generation assets, including those developed by HEDC and NORMIN, in Hedcor. Hedcor currently owns, operates and/or manages 15 run–of–river hydropower plants in northern Luzon and Davao City with a combined installed capacity of 38.2 MW. All the electricity generated from Hedcor’s hydro plants are taken up by NPC, APRI, Davao Light, and Benguet Electric Cooperative (BENECO) pursuant to power purchase agreements with the said offtakers. During the full years 2009 and 2010, Hedcor’s hydropower plants generated a total of 171.4 GWh and 155.5 GWh of electricity, respectively. Northern Luzon’s climate is classified as having two pronounced season--dry from November to April and wet for the rest of the year. Due to this classification, generation levels of Hedcor’s plants, particularly those located in Northern Luzon, are typically lower during the first five months of each year. Hedcor used to have a 50% equity interest in LHC until it transferred its equity stake to its parent company, ARI, through a property dividend declaration in September 2007. Luzon Hydro Corporation (LHC) LHC is ARI’s joint venture company with Pacific Hydro Bakun, Inc. (PHBI), a wholly owned subsidiary of Pacific Hydro Pty. Ltd. (Pacific Hydro) of Australia. Pacific Hydro is a privately-owned Australian company that specializes in developing and operating power projects that use renewable energy sources, principally water and wind power. LHC owns and operates the 70 MW Bakun run-of-river hydropower plant, which is located within the 13,213 hectare watershed area of the Bakun River in Ilocos Sur province in Northern Luzon. The USD150 mn project was constructed and is being operated under the government’s build–operate–transfer scheme. Energy produced by the plant is delivered and taken up by NPC pursuant to a power purchase agreement (the Bakun PPA) and dispersed to NPC’s Luzon Power Grid. Under the terms of the Bakun PPA, all of the electricity generated by the Bakun plant will be purchased by NPC for a

10 • SEC FORM 17-A (ANNUAL REPORT)
period of 25 years from February 2001. The Bakun PPA also requires LHC to transfer the Bakun plant to NPC in February 2026, free from liens and without the payment of any compensation by NPC. Amlan Power Holdings Corporation was awarded the IPP Administrator contract for the 70-MW Bakun hydropower facility following a competitive bidding process conducted by PSALM. On March 31, 2011, ARI signed a Memorandum of Agreement (MOA) with PHBI and LHC to give ARI full ownership over LHC upon fulfillment of certain conditions in the MOA. Hedcor Sibulan, Inc. (Hedcor Sibulan) Hedcor Sibulan, a wholly owned subsidiary of ARI, is the project company of the Sibulan hydropower project. Sibulan, which broke ground on June 25, 2007, entailed the construction of two run-of-river hydropower plants, Sibulan A and Sibulan B harnessing the Sibulan and Baroring rivers in Santa Cruz, Davao del Sur. The 26 MW Sibulan B started commercial operations in March 2010. The 16.5 MW Sibulan A was completed in July 2010. Hedcor Sibulan is part of a consortium that won the competitive bidding for the 12-year power supply agreement to supply new capacity to Davao Light. The bid price for the contracted energy was π4.0856/kWh, subject to adjustment based on changes to the Philippine consumer price index. All the energy generated by the Hedcor Sibulan power plants will be supplied to Davao Light pursuant to a power supply agreement signed on March 7, 2007. The Sibulan Project is registered as a clean development mechanism project with the United Nations Framework Convention on Climate Change under the Kyoto Protocol. This allows Hedcor Sibulan to sell the plants’ generated carbon credits. Hedcor Tamugan, Inc. (Hedcor Tamugan) Hedcor Tamugan, a wholly owned subsidiary of ARI, is the project company organized to build the proposed Tamugan run-ofriver hydropower project. In 2010, Hedcor entered into a compromise agreement with the Davao City Water District (DCWD) as a settlement to the dispute in connection with the Tamugan water rights. Originally planned as a 27.5 MW run-of-river facility, Hedcor Tamugan proposed the the construction of 11.5 MW run-of-river hydropower plant. After Hedcor Tamugan secures all required permit, the two-year construction period will commence. Hedcor Sabangan, Inc. (Hedcor Sabangan) Hedcor Sabangan, a wholly owned subsidiary of ARI, is the project company organized to build the proposed 13.2 MW runof- river hydropower project in Sabangan, Mountain Province. As part of the Free and Prior Informed Consent (FPIC) process for the project as required under the Indigenous Peoples’ Rights Act of 1997 (IPRA), Hedcor Sabangan signed Memoranda of Agreement with the indigenous peoples of Barangays Namatec and Napua and the municipality of Sabangan, Mountain Province in February and March 2011, respectively. With the completion of the FPIC process, Hedcor Sabangan is awaiting the issuance of the Certificate of Precondition by the National Commission on Indigenous Peoples. The other permits required for the project, such as the environmental compliance certificate (ECC) and water rights, are currently being processed. The two-year construction period is expected to commence in the first quarter of 2012 assuming that the required permits are secured by then. Hedcor Tudaya, Inc. (Hedcor Tudaya) Hedcor Tudaya, a wholly owned subsidiary of ARI, is the project company organized to build the proposed 6.6 MW Tudaya 1 and 7 MW Tudaya 2 run-of-river hydropower projects in Tudaya, Santa Cruz, Davao del Sur. In February 2011, Hedcor Tudaya signed a Memorandum of Agreement with the of Bagobo-Tagabawa indigenous peoples as a result of the FPIC process conducted for the Tudaya 1 as required under the IPRA. With the completion of the FPIC process, Hedcor Tudaya is awaiting the

11 • SEC FORM 17-A (ANNUAL REPORT)
issuance of the Certificate of Precondition by the National Commission on Indigenous Peoples. The proposed construction of Tudaya 2 does not require a FPIC process as there are no indigenous peoples in the area. The other permits required for the project, such as the ECC and water rights, are currently being processed. The two-year construction period is expected to commence in July 2011 assuming that the required permits are secured by then. Therma Power, Inc. (TPI) TPI, a wholly owned holding company of AboitizPower, owns equity interests in the following generation companies:
• 100% equity interest in TLI, the IPP Administrator of the 700 MW contracted capacity of the Pagbilao power plant.
• 100% equity interest in TMI, owner and operator of PB 117 and PB 118, barge-mounted power plants, each with a generating capacity of 100 MW.
• 26% effective interest in CEDC, which is currently constructing a 3x82 MW coal-fired power plant in Toledo City, Cebu.
• 50% equity interest in RP Energy, the project company that proposes to build and operate a 300 MW coal-fired power plant in Redondo Peninsula in the Subic Bay Freeport Zone (SBFZ).
• 100% equity interest in Therma South, Inc., the project company that proposes to build a 300 MW circulating fluidized bed coal-fired plant in Toril, Davao.
AboitizPower is in the process of implementing a corporate reorganization that will put all its non-renewable generation assets under TPI. If completed, TPI will hold AboitizPower’s ownership interest in STEAG Power, EAUC, CPPC, Southern Philippines Power Corporation (SPPC) and Western Mindanao Power Corporation (WMPC). Therma Luzon, Inc. (TLI) TLI, a wholly owned subsidiary of AboitizPower, submitted the highest offer in the competitive bid conducted by PSALM for the appointment of the IPP Administrator of the 700 MW Contracted Capacity of the Pagbilao Coal Fired Thermal Power Plant located in Pagbilao, Quezon. The offer by TLI resulted in a bid price of USD691 mn as calculated in accordance with bid rules. This value represents the present value of a series of monthly payments to PSALM from October 2009 to August 2025 using PSALM discount rates. On October 1, 2009, TLI became the first IPP Administrator in the country when it assumed dispatch control of the said contracted capacity of the Pagbilao Plant. As IPP Administrator, TLI is responsible for procuring the fuel requirements of and selling the electricity generated by the Pagbilao Plant. The Pagbilao Plant is being operated by TEAM Energy under a buildoperate- transfer scheme. Therma Marine, Inc. (TMI) TMI, a wholly owned subsidiary of AboitizPower, owns and operates PB 117 and 118, two power barges each with a generating capacity of 100 MW. TMI assumed ownership of PB 118 and 117 from PSALM last February 6, 2010 and March 1, 2010, respectively. The acquisition followed the successful conclusion of a USD30 mn negotiated bid for the two power barges last July 31, 2009. PB 117 is moored in Bgy. San Roque, Maco, in Compostella Valley, while PB 118 is moored in Nasipit, Agusan del Norte. TMI signed Ancillary Services Procurement Agreements (ASPA) with the National Grid Corporation of the Philippines (NGCP) for a supply by each of PB 117 and 118 of 50 MW of ancillary services

12 • SEC FORM 17-A (ANNUAL REPORT)
consisting of contingency reserve, dispatchable reserve, reactive power support and blackstart capacity for the Mindanao Grid. The ERC issued a provisional authority for the PB 118 ASPA on March 8, 2010 and made it retroactive to February 6, 2010 in consideration of the ongoing power crisis in Mindanao. PB 117 likewise got its provisional authority on March 24, 2010 with retroactive effect to March 1, 2010. On October 4, 2010, ERC issued its final approval on the ASPA application for both barges but with a 55% reduction in the capital recovery fee rates and also a reduction on the fuel consumption rates. A Motion for Reconsideration was filed by TMI and is still pending before the ERC. The ASPA between NGCP and TMI for the supply of 50 MW each of ancillary services by PB 117 and PB 118 with expiry dates of February 6, 2011 and March 1, 2011, respectively, were extended to June 25, 2011 for both barges under the same terms and conditions. STEAG State Power Inc. (STEAG) AboitizPower closed the sale and purchase of the 34% equity ownership in STEAG from Evonik Steag GmbH (Evonik Steag) last November 15, 2007 following a successful bid in August 2007. The total purchase price for the 34% equity in STEAG was USD102 mn, inclusive of interests. Incorporated on December 19, 1995, STEAG is the owner and operator of a 232 MW (gross) coal-fired power plant located in the PHIVIDEC Industrial Estate in Misamis Oriental, Northern Mindanao. The coal plant was built under a BOT arrangement and started commercial operations on November 15, 2006. The coal plant is subject of a 25-year power purchase agreement with the NPC, which agreement is backed by a Performance Undertaking issued by the Republic of the Philippines. STEAG currently enjoys a 6-year income tax holiday from the BOI. With its 34% stake in STEAG, AboitizPower is equity partner with majority stockholder Evonik Steag, Germany’s fifth largest power generator, which currently holds 51% equity in STEAG. La Filipina Uy Gongco Corporation holds the remaining 15% equity in STEAG. On June 28, 2010, AboitizPower and its partners in STEAG firmed up their collective intention to develop a third unit of approximately 150 MW capacity adjacent to the existing facility. AboitizPower and its partners agreed to maintain their shareholdings in the same proportions in the new corporation to be established for the planned additional capacity. Certain essential facilities, such as the jetty, coal handling facilities and stockyards and the 138-kV interconnection with the Mindanao Grid are to be shared with the existing facilities. Depending on the interest the market demonstrates, the agreement contemplates the possibility of another unit. East Asia Utilities Corporation (EAUC) On April 20, 2007, AboitizPower acquired a 50% ownership interest in EAUC from El Paso Philippines, which still owns the other 50% of EAUC. EAUC was incorporated on February 18, 1993 and since 1997 has operated a Bunker C-fired power plant with an installed capacity of 50 MW within the MEPZ I in Mactan Island, Cebu. Pursuant to the Power Supply and Purchase Agreement (PSPA), as amended, with the Philippine Economic Zone Authority (PEZA), PEZA shall be entitled to buy electric power from the spot market, other electric power suppliers and/or generation companies in excess of the contracted demand of 42,500 kW that shall be sourced from EAUC solely or blended with other suppliers. The amended PSPA shall be effective up to April 25, 2011, with the option to renew under mutually acceptable conditions. EAUC and PEZA are currently negotiating for the renewal/extension of the PSPA. With the start of WESM operations in the Visayas Region, EAUC is also capable of selling power to the spot market.

13 • SEC FORM 17-A (ANNUAL REPORT)
Cebu Private Power Corporation (CPPC) Incorporated on July 13, 1994, CPPC owns and operates a 70 MW Bunker-C fired power plant in Cebu City, one of the largest power plants in the island of Cebu. Commissioned in 1998, the CPPC plant was constructed pursuant to a BOT contract to supply 62 MW of power to VECO. The CPPC plant will revert to VECO in November 2013. On April 20, 2007, AboitizPower acquired from EAUC 60% of the outstanding common shares of CPPC. The remaining 40% of the outstanding common shares is owned by Vivant Energy Corporation of the Garcia family of Cebu, who together with AboitizPower, are the major shareholders of VECO. VECO owns all of the outstanding preferred shares of CPPC, which comprises approximately 20% of the total outstanding capital stock of CPPC. Abovant Holdings, Inc. (Abovant) and Cebu Energy Development Corporation (CEDC) Incorporated on November 28, 2007, Abovant is a joint venture company formed by TPI, a wholly-owned subsidiary of AboitizPower, and Vivant Integrated Generation Corporation (VIGC) of the Garcia Group, to hold their investments in a new power plant to be built in Barangay Daanlungsod, Toledo City, Cebu. Abovant is 60% owned by AboitizPower, through TPI, and 40% owned by VIGC. Abovant and Global Formosa Power Holdings, Inc., a joint venture between Global Business Power Corporation of the Metrobank Group and Formosa Heavy Industries, Inc. formed CEDC. CEDC is the owner of a new 3x82 MW coal-fired power plant in the existing Toledo Power Station complex in Barangay Daanlungsod, Toledo City, Cebu. With Abovant’s 44% stake in the project (Global Formosa owns the remaining 56%), AboitizPower’s effective interest in the new power plant, which broke ground in January 2008, is approximately 26.40%. The first 82 MW unit was commissioned in February 2010, while the second and third units in the second and fourth quarter of 2010, respectively. The power generated from the new power plant provides much needed security to the power supply of the province of Cebu in the coming years. Additional power will be needed with the influx of business process outsourcing companies and new hotels in the province and the presence in the Toledo-Balamban area of large industries such as Carmen Copper Corporation, the shipbuilding facility of Tsuneishi Heavy Industries (Cebu) Inc. (THI) and the modular fabrication facility of Metaphil International. The power plant, which will cost approximately USD450 mn, is expected to be completed and will start full commercial operations by first quarter of 2011. CEDC had signed an Electric Power Purchase Agreement (EPPA) with VECO for the supply of 105 MW for 25 years. To date, it also has an EPPA with PEZA-MEPZ I; Mactan Electric Company, Inc. (MECO); BEZ; Cebu I Electric Cooperative, Inc.; Cebu II Electric Cooperative, Inc.; Cebu III Electric Cooperative, Inc.; and Bohol Electric I Cooperative, Inc. All its EPPAs will provide contracted minimum energy offtake with fuel as pass through. Southern Philippines Power Corporation (SPPC) SPPC is a joint venture among AboitizPower, Alsing Power Holdings, Inc. and Tomen Power (Singapore), Pte Ltd. AboitizPower has a 20% equity interest in SPPC, which owns and operates a 55 MW bunker-C fired power plant in Alabel, Sarangani just outside General Santos City in Southern Mindanao. The SPPC power plant was developed on a build-own-operate basis by SPPC under the terms of an Energy Conversion Agreement (ECA) with the NPC. Under the ECA, NPC is required to deliver and supply to SPPC the fuel necessary to operate the SPPC power plant during an 18-year cooperation period, which ends in 2016. NPC is also required to take all the electricity generated by the SPPC power plant during the cooperation period and pay SPPC on a monthly basis capital recovery, energy, fixed operations and maintenance (O&M) and infrastructure fees as specified in the ECA. During this cooperation period, SPPC is responsible, at its own cost, for the management, operation, maintenance and repair of the SPPC power plant.

14 • SEC FORM 17-A (ANNUAL REPORT)
Aside from providing much needed capacity to the Southwestern Mindanao Area, the SPPC power plant also performs the role of voltage regulator for General Santos City, ensuring the availability, reliability, and quality of power supply in the area. Western Mindanao Power Corporation (WMPC) Like SPPC, WMPC is also a joint venture among AboitizPower, Alsing Power Holdings, Inc. and Tomen Power (Singapore), Pte Ltd. AboitizPower has a 20% equity interest in WMPC, which owns and operates a 100 MW bunker-C fired power station located in Zamboanga City, Zamboanga del Sur in Western Mindanao. The WMPC power plant was developed on a build-ownoperate basis by WMPC under the terms of an ECA with NPC. Under the ECA, NPC is required to deliver and supply to WMPC the fuel necessary to operate the WMPC Plant during an 18-year cooperation period which ends in 2015. NPC is also required to take all the electricity generated by the WMPC Plant during the cooperation period and pay WMPC on a monthly basis capital recovery, energy, fixed O&M and infrastructure fees as specified in the ECA. During this cooperation period, WMPC is responsible, at its own cost, for the management, operation, maintenance and repair of the WMPC Plant. Aside from providing much needed capacity to the Zamboanga Peninsula, the WMPC power plant also performs the role of voltage regulator for Zamboanga City, ensuring the availability, reliability, and quality of power supply in the area. Redondo Peninsula Energy, Inc. (RP Energy) Incorporated on May 30, 2007, RP Energy is a joint venture company owned equally by AboitizPower and Taiwan Cogeneration International Corporation. It is the project company that proposes to build and operate a 300-MW coal-fired power plant in Redondo Peninsula in the SBFZ with a planned phase two expansion for another 300 MW unit. In April 2008, RP Energy issued a letter of award to Formosa Heavy Industries for the supply of the boiler, steam turbine, generator, and related services that will be used for the construction of the power plant. The award serves to fix the price and delivery time of the equipment amidst an environment of rising prices and longer delivery period of raw materials. The project is estimated to cost approximately USD500 mn. In view of increasing power demand in the Luzon Grid, RP Energy is re-evaluating the plant configuration of the plant from 2x150 MW units to a 1x300 MW unit. RP Energy has signed a Lease Development Agreement with SBMA and has paid its first five year lease for the site. It has secured an Environmental Clearance Certificate and its related amendments as well as the Special Land Use Permit from the DENR. RP Energy has also completed the relocation of all affected residents in the site in accordance with existing rules and regulations and is now the in the final stages of negotiations with a site development contractor for the site development works on site. Therma South, Inc Therma South, Inc., is a wholly owned subsidiary of TPI and the project company for the proposed 300 MW circulating fluidized bed coal-fired plant in Toril, Davao. The project is in the planning and governmental approval stage and as such does not have any contracts to sell its power as of yet. If approved within the expected timeframe, the plant should be operational in early 2014. Other Generation Assets AboitizPower’s distribution utilities, Davao Light and Cotabato Light, each has its own stand-by plant. Davao Light currently maintains the 53 MW Bunker C-fired Bajada stand-by plant, which is capable of supplying 19% of Davao Light’s requirements. Cotabato Light maintains a stand-by 7 MW Bunker C-fired plant capable of supplying approximately 30.50% of its requirements.

15 • SEC FORM 17-A (ANNUAL REPORT)
Future Projects Before undertaking a new power generation project, the Company conducts an assessment of the proposed project. Factors taken into consideration by the Company include the proposed project’s land use requirements, access to a power grid, fuel supply arrangements (if relevant), availability of water (for hydroelectric projects), local requirements for permits and licenses, the ability of the plant to generate electricity at a competitive cost and the presence of potential offtakers to purchase the electricity generated. For the development of a new power plant, the Company, its partners and suppliers are required to obtain the necessary permits required before commencement of commercial operations, including permits related to project site, construction, the environment and planning, operation licenses and similar approvals. Notwithstanding the review and evaluation process that the Company’s management conducts in relation to any proposed project, acquisition or business, there can be no assurance that the Company will eventually develop a particular project, acquire a particular generating facility or that projects will be implemented or acquisitions made or businesses conducted in the manner planned or at or below the cost estimated by the Company. In addition, there can be no assurance that a project, if implemented, or an acquisition, if undertaken, will be successful. DISTRIBUTION OF ELECTRICITY The Aboitiz Group has more than 70 years of experience in the Philippine power distribution sector and has been known for innovation and efficient operations. Through the years, AboitizPower has managed to build strong working relationship with the industry’s regulatory agencies. With ownership interests in seven distribution utilities, AboitizPower is currently one of the largest electricity distributors in the Philippines. AboitizPower’s distribution utilities collectively supply electricity to franchise areas covering a total of 18 cities and municipalities in Central Luzon, Visayas and Mindanao, with an aggregate land area of approximately 5,095 square kilometers. Collectively, AboitizPower’s distribution utilities contributed approximately 7% of its net income for 2010. The distribution utilities had a total customer base of 714, 600 in 2010, 685,378 in 2009, and 658,318 in 2008. The table below summarizes the key operating statistics of the distribution untilities for 2010 and the previous two years.
Electricity Sold (MWh) Peak Demand (MWh)
No. of Customers Company
2010 2009 2008 2010 2009 2008 2010 2009 2008 VECO 1,994,237 1,829,500 1,766,059 378 336 326 316,845 304,002 296,003Davao Light
1,548,155 1,459,161 1,370,951 293 276 248 281,234 268,708 257,101
SFELAPCO 446,513 421,139 406,022 83 80 75 81,891 79,669 73,600Cotabato Light
129,788 120,186 118,450 24 24 23 31,611 30,171 28,927
SEZ 405,038 372,391 298,050 83 97 64 2,734 2,724 2,585MEZ 138,128 117,014 141,225 22 23 23 77 76 74BEZ 90,174 60,376 63,329 27 21 15 31 28 28Total 4,752,033 4,379,768 4,164,086 910 857 774 714,423 685,378 658,318

16 • SEC FORM 17-A (ANNUAL REPORT)
Visayan Electric Company, Inc. (VECO) VECO is the second largest privately owned distribution utility in the Philippines in terms of customers and annual MWh sales. VECO supplies electricity to a region covering 672 square kilometers in the island of Cebu with a population of approximately 1.5 mn. Its franchise area includes the cities of Cebu, Mandaue, Talisay and Naga, and the municipalities of Minglanilla, San Fernando, Consolacion and Liloan. To date, VECO has 13 substations located in different areas around the cities of Cebu, Mandaue, Naga and the municipality of Consolacion. VECO, directly and through its predecessors-in-interest, has been in the business of distributing electricity in Cebu Island since 1905. In the early 1900s, the predecessors-in-interest of the Aboitiz Group acquired a 20% interest in VECO’s predecessorin- interest, the Visayan Electric Company, S.A. Since that time, the Aboitiz Group’s ownership interest in VECO has increased from 20% to the current beneficial ownership interest of 55.19% held by AboitizPower. In 1928, Visayan Electric Company, S.A. was granted a 50-year distribution franchise by the Philippine Legislature. The term of this franchise was extended by Republic Act 6454 for an additional 25 years beginning in 1978 and was conditionally renewed for another 25 years from December 2003, subject to the resolution of an intra-corporate dispute at that time involving AEV, AboitizPower’s parent company, and Vivant Corporation. In September 2005, the Philippine Congress passed Republic Act 9339, which extended VECO’s franchise to September 2030. VECO’s application for the extension of its Certificate of Public Convenience and Necessity (CPCN) was approved by the ERC last January 26, 2009. In April 2004, AEV and Vivant, which is the holding company of the Garcia family, entered into a Shareholders’ Cooperation Agreement that sets out guidelines for VECO’s day-to-day operations and the relationship among VECO’s shareholders, including: restrictions on share transfers (including the grant of rights of first refusal in the event of a transfer to a third party and rights to transfer to affiliates, subject to certain conditions), board composition and structure, proceedings of directors and shareholders, minority shareholder rights, dividend policy, termination, and non-compete obligations. Under the terms of the agreement, day-to-day operations and management of VECO were initially assumed by AEV and, after AboitizPower acquired AEV’s ownership interest in VECO in January 2007, by AboitizPower. AboitizPower and Vivant are each required to place in escrow 5% of the shares in VECO registered in their respective names to guarantee compliance with their respective obligations under the Shareholders’ Cooperation Agreement. The escrow shares will be forfeited in the event a shareholder group violates the terms of the Shareholders’ Cooperation Agreement. The Shareholders’ Cooperation Agreement was adopted as a result of a dispute between AEV and Vivant regarding the management of VECO. Relations between the shareholders of VECO are amicable. VECO is part of the third group (Group C) of private distribution utilities to shift to PBR. The ERC issued its final determination on VECO’s application for approval of its annual revenue requirements and performance incentive scheme under the PBR for the regulatory period July 1, 2010 to June 30, 2014. Such final determination became final in May 2010. Also in May 2010, VECO filed with the ERC its application for approval of the translation into distribution rates of its different customer classes for the first regulatory year of the ERC-approved Annual Revenue Requirement (ARR) under the PBR for the regulatory period July 1, 2010 to June 30, 2014. The application was approved on June 28, 2010 and the approved distribution, supply and metering charges were implemented by VECO effective August 1, 2010. Davao Light & Power Company, Inc. (Davao Light) Davao Light is the third largest privately-owned electric distribution utility in the country in terms of customers and annual kilowatt-hour (kWh) sales.

17 • SEC FORM 17-A (ANNUAL REPORT)
With a franchise covering Davao City and Davao del Norte areas of Panabo City and the Municipalities of Carmen, Dujali and Santo Tomas, Davao Light services a population of approximately 1,777,926 and a total area of 3,561 square kilometers. Although Davao Light was organized on October 11, 1929, the Aboitiz Group acquired its ownership interest in the company in 1946. Currently, the AboitizPower owns 99.93% of the shares in Davao Light. Davao Light’s original franchise, which covered Davao City, was granted in November 1930 by the Philippine Legislature and was for a period of 50 years. In 1976, the National Electrification Administration (NEA) extended Davao Light’s franchise for Davao City to November 2005 and granted Davao Light franchises for the City of Panabo and the municipalities of Carmen and Santo Tomas in Davao del Norte province. In September 2000, the Philippine Congress passed Republic Act 8960, which granted Davao Light a franchise over its current franchise area for a period of 25 years, or until September 2025. Davao Light has a 150-MVA and a 2x50-MVA substation drawing power at 138 kV. In 1998 it entered into a 10-year power purchase agreement with NPC, which had been extended until 2015 by a separate contract signed in 2005 by the parties. Davao Light’s power purchase agreement with the NPC allows the delivery of most of Davao Light’s power requirements through Davao Light’s 138- kV lines. As a result, in taking delivery of electricity from NPC, Davao Light is able to bypass the NGCP connection assets and avoid having to pay corresponding wheeling fees to NGCP, thereby allowing Davao Light to cut its operating costs. In February 2007, Davao Light awarded to the Hedcor Consortium (composed of Hedcor, ARI, Hedcor Sibulan, and Hedcor Tamugan) a 12-year supply contract of new capacity. The price differential between the Hedcor Consortium’s winning bid price of π4.0856 per kWh and the next lowest bid was approximately π1.0129 per kWh. Over the life of the supply contract, the differential will amount to approximately π4.9 bn at current peso value, representing significant savings for Davao Light customers. Davao Light decided to secure the new supply contract in anticipation of the full utilization of the existing contracted energy supply under the 10-year contract with the NPC for 1,363,375 MWH and the 12-year contract with Hedcor. In 2010, amidst the power crisis in Mindanao during the first semester, Davao Light’s franchise area was spared of the long daily rotating brownouts of up to 8 to 12 hours experienced in other areas. The shorter service interruptions of up to a maximum of three hours were attributed to Davao Light’s implementation of its contingency plans which include operation of its 54.8-MW Bunker C-fired standby plant or an average of 40 MW on a sustaining basis. The standby plant is capable of supplying 19% of Davao Light’s electricity requirement. The power from Hedcor Sibulan’s 42.5 MW and Hedcor, Inc.’s Mintal 4 MW hydroelectric plants likewise augmented power supply in the Davao Light franchise area. The Bunker C-fired plant and the Sibulan and Mintal hydroelectric plants are embedded in the Davao Light franchise. Thus, the power generated from these facilities are dispatched directly into the Davao Light distribution network without passing through the NGCP transmission lines. To further alleviate the impact of the brownouts on small consumers, Davao Light instituted the Interruptible Load Program (ILP) with the cooperation of its large industrial customers. These customers volunteered either to run their own generators or shutdown their operation during power shortage so that the available power can be made available to small customers. Despite the load curtailment issued by NGCP during the power crisis, Davao Light registered 1.548 bn kWh sales, representing 6.10% growth versus 2009.

18 • SEC FORM 17-A (ANNUAL REPORT)
All sectors of customers, residential, commercial and industrial posted rise in sales revenues, with the bulk coming from the banana, manufacturing and refrigeration businesses in the industrial sector. Influx of other medium business ventures such as retail shopping centers, beverage and cold storage gave a boost in the commercial electricity sales. Peak demand hit 291 MW for a 5.41% increase versus last year. New service connections grew by 4.66% increasing the number of customers to 281,234 by year-end. Fast development of new subdivisions and condominiums drove an upscale of 5% in residential consumers. As required by EPIRA, Davao Light filed with the ERC its distribution wheeling rates in order to enter into the PBR rate methodology. Based on Davao Light’s approved annual revenue requirements for the regulatory period July 1, 2010 to June 30, 2014, the ERC adjusted its average distribution related charges by π0.08 from π1.08 per kWhr to π1.16 for the first year. Davao Light operates its distribution system at a systems loss level lower than the government mandated 8.5% cap set for private distribution utilities. From 7.94% in 2009 the company further reduced its systems loss figure by 0.53% to 7.41% by the end of December 2010. Constantly innovating on services to add convenience to paying customers, Davao Light’s partnership with the country’s top payment service providers, EC Pay and CIS Bayad Center, added a combined 99 payment centers. Aside from payment centers in its own offices, Davao Light also engages the services of third party collection agents, such as mall payment centers, authorized banks and convenience stores. Customers now have 129 different payment venues to choose from, 61 of which are convenience stores that have been commissioned to receive bill payments 24/7. To improve service reliability, a total of 19 circuit kilometers of 69 kV Sub-transmission and 13.8 kV were upgraded. Ten 138 kV transmission line structures were also converted from wood to steel. In order to maintain the standby Bunker C-fired plant’s dependability, four of its machines with a total generating capability of 20 MW were overhauled. On substation operations, comprehensive maintenance and servicing on five distribution facilities were undertaken. At the same time three control rooms were completed. Following VECO, Davao Light rolled out Project Pearl, the project name for the Customer Care and Billing (CC & B) system developed by Oracle being implemented among AboitizPower’s distribution utilities. The π100 mn CC&B is an integrated customer care software that will replace the various in–house developed systems currently used. Cotabato Light and Power Company (Cotabato Light) Cotabato Light supplies electricity to Cotabato City and portions of the municipalities of Datu Odin Sinsuat and Sultan Kudarat, both in Maguindanao province in Mindanao. Its franchise area covers approximately 191 square kilometers and has a population of approximately 350,692. In 2010, it has a manpower complement of 74 full-time employees and a number of contractual employees serving a customer base of 31,611, composed of residential, commercial, industrial and flat rate customers. Cotabato Light was formally incorporated in April 1938. Its original 25-year franchise was granted in June 1939 by the Philippine Legislature. In 1961, the Philippine Congress passed Republic Act 3217 which was further amended by Republic Act 3341 extending Cotabato Light’s franchise until June 1989. In August 1989, NEA extended Cotabato Light’s franchise for anothern25 years, which will expire in August 2014. AboitizPower owns 99.93% of Cotabato Light. As of 2010, Cotabato Light has three substations of 10 MVA, 12 MVA and 15 MVA and is served by two 69-kV transmissionnlines, which provide redundancy in case one transmission line fails.

19 • SEC FORM 17-A (ANNUAL REPORT)
Cotabato Light’s distribution voltage is 13.8 kV. To furthernboost its systems’ reliability and efficiency, the construction of the new Malagapas ten MVA Substation is ongoing and is expected to be operational by May 2011. Cotabato Light maintains a standby 7-MW Bunker C-fired plant capable of supplying approximately 30.50% of its franchisenarea requirements. The existence of a standby power plant, which is capable of supplying electricity in cases of supply problemsnwith NPC and for the stability of voltage whenever necessary, is another benefit to Cotabato Light’s customers. During the recent Mindanao power crisis, Cotabato Light’s franchise area experienced one of the lowest rotating power outages due to its back-up power plant. In 2010 Cotabato Light posted a modest kWh growth of 7.99% compared to 2009 basically because of increase in number of nonresidential customers and increase of industrial consumptions. Although a relatively small utility, Cotabato Light’s corporate relationship with its affiliate, Davao Light, allows the former to immediately implement benefits from the latter’s system developments. Keeping pace with world class standards, Cotabato Light adopted a new computerized accounting system called ERP from Oracle. Also, it is now in the process of implementing the Oracle’s CC& B system, which is the standard billing, collection and customer service related systems utilized by other distribution utilities of AboitizPower. The CC & B system is expected to be onstream by mid-2011. Managing its systems loss is a challenge for Cotabato Light. With system losses capped by ERC at 8.5%, Cotabato Light aims to lower systems losses through various measures most of which are aimed to address pilferage, the primary cause of its higher-than-cap systems losses. The implementation of Meter on Post (MOP) or Elevated Metering System project contributed much to the reduction of its systems loss to 9.1% in December 2010 from as high as 10.8% at the start of the year. This project will continue to be implemented in 2011 to further reduce the systems loss to 8.5%. The ERC issued its final determination on Cotabato Light’s application for approval of its Annual Revenue Requirement and performance incentive scheme under the PBR scheme covering a four-year regulatory period which commenced on April 1, 2009 until March 30, 2013. On April 15, 2009, the ERC approved Cotabato Light’s application for translation of its approved Annual Revenue Requirement for the first regulatory year into applicable rates per customer class. Cotabato Light implemented the approved rates last May 1, 2009 – a month after the start of the first regulatory year. The resulting under recovery from the one-month lag was reflected and recovered in the next regulatory year’s rate translation application which was approved by ERC on February 22, 2010. The resulting new rates were implemented in April 2010. Cotabato Light filed on December 15, 2010 the third regulatory year MAP recalculation and rate translation to be implemented from April 2011 to March 2012. ERC is scheduled to release its decision on the third regulatory year rates before the end of March 2011. San Fernando Electric Light and Power Co., Inc. (SFELAPCO) SFELAPCO supplies electricity to approximately 32 barangays in San Fernando City, 29 barangays in the municipality of Floridablanca, five barangays in the municipality of Bacolor and two barangays in the municipality of Guagua, a portion of Lubao and Santo Tomas, all located within Pampanga province in Central Luzon. Its franchise area covers 204 square kilometers and has a population of approximately 372,753.

20 • SEC FORM 17-A (ANNUAL REPORT)
SFELAPCO was incorporated on May 17, 1927. In 1961, the Philippine Congress passed Republic Act 3207, which granted SFELAPCO a franchise to distribute electricity for a period of 50 years or until June 2011 within the franchise area described above. Republic Act 9967 extending SFELAPCO’s franchise for another 25 years from the date of its approval lapsed into law last February 6, 2010. On November 11, 2009, SFELAPCO signed a Power Supply Agreement (PSA) with APRI. Under the PSA, APRI will supply the additional energy required by SFELAPCO that cannot be supplied by NPC from December 25, 2009 to September 25, 2010. Thereafter, APRI will then become the sole provider of power to SFELAPCO until December 25, 2012. SFELAPCO is part of the fourth batch of private utilities to enter PBR, and is expected to enter its four-year regulatory period by October 1, 2011. AboitizPower has an effective interest of 43.78% in SFELAPCO. Subic Enerzone Corporation (SEZ) In May 2003, the consortium of AEV and Davao Light won the competitive bid to provide distribution management services to the SBMA and to operate the SBFZ power distribution system for a period of 25 years. On June 3, 2003, SEZ was incorporated as a joint venture company owned by a consortium comprised of Davao Light, AEV, SFELAPCO, Team Philippines, Okeelanta and PASUDECO to undertake the management and operation of the SBFZ power distribution system. SEZ was formally awarded the contract to manage the SBFZ’s power distribution system on October 25, 2003 and officially took over the operations of the power distribution system on the same day. SEZ’s authority to operate the SBFZ power distribution system was granted by the SBMA pursuant to the terms of Republic Act 7227 (The Bases Conversion and Development Act of 1992), as amended. As a company operating within the SBFZ, SEZ is not required to pay the regular corporate income tax of 30% and instead pays a preferential tax of 5% on its gross income in lieu of all national and local taxes. Following the acquisition of AboitizPower in January 2007 of the 64.3% effective ownership interest of AEV in SEZ, AboitizPower entered into another agreement on June 8, 2007 to acquire the combined 25% equity stake in SEZ of AEV, SFELAPCO, Okeelanta, and PASUDECO. On December 17, 2007, AboitizPower bought the 20% equity of Team Philippines in SEZ for π92 mn. Together with the 35% equity in SEZ of AboitizPower’s subsidiary DavaoLight, this acquisition brought AboitizPower’s total equity in SEZ to 100%. In September 2008, SEZ acquired the 100-MVA Subic Substation from the NGCP. The substation has a 230/69/13.8kV power transformer supplying power to the Subic Bay Industrial Park, Binictican and Kalayaan housing areas, Cubi, Naval Magazine, and Grande Island in the SBFZ. In November 2008, SEZ implemented a rate increase as per approved unbundled rates. In 2010, SEZ acquired more advanced equipment to further enhance the company’s service to its customers. In January, the company purchased a Meter Test Equipment (MTE) 5-Position Test Bench from Germany to improve its meter calibration services. As a result, meter calibration improved from 25 meters to 130 meters a day. In July 2010, SEZ procured a Megger Fault Locator for underground power cable trouble-shooting. With this new equipment, SEZ can determine electrical underground faults more quickly, thus reducing power outage time. SEZ is part of the fourth batch of private utilities to enter PBR. The ERC is expected to release by the end of June 2011 its final determination on SEZ’s application for approval of its MAP, annual revenue requirements, and performance incentive scheme for the period covering October 2011 to September 2015. The approved MAP will then be translated into new per customer class rates and will be implemented starting October 2011.

21 • SEC FORM 17-A (ANNUAL REPORT)
Mactan Enerzone Corporation (MEZ) MEZ was incorporated in January 2007 when AboitizLand spun off the power distribution system of its MEPZ II project. The MEPZ II project, which was launched in 1995, is operated by AboitizLand under a BOT agreement entered into with the Mactan-Cebu International Airport Authority (MCIAA). On June 8, 2007, AboitizPower entered into an agreement to acquire AboitizLand’s 100% equity stake in MEZ represented by 8,754,443 common shares of MEZ. Pursuant to the agreement, AboitizPower acquired AboitizLand’s ownership interest in MEZ valued at π609.5 mn in exchange for AP’s common shares issued at the initial public offering price of π5.80 per share. MEZ sources its power from NPC pursuant to a Contract to Supply Electric Energy. Under the supply contract, NPC is required to provide power to MEZ up to the amount of contracted load, which is based on the projections provided by MEPZ II locators under their respective Power Service Contracts with MEZ. In 2010, MEZ mounted two sets of Automatic Voltage Regulator (AVR) to its old substation to improve voltage levels to locators. To further provide world-class customer service, MEZ constructed their main administration office within the zone where they operate, MEPZ II. The MEZ control room was also renovated and expanded to improve the efficiency of operation. To avail of the opportunities in the competitive electricity market, MEZ decided to register as a direct participant of the Wholesale Electricity Spot Market (WESM) during the end of 2010. For the 2011 operating period, MEZ plans to transfer its NGCP metering to its substation in order to minimize line losses and further improve the voltage quality by the addition of two more sets of AVR. Balamban Enerzone Corporation (BEZ) BEZ was incorporated in January 2007 when CIPDI, a joint venture between AboitizLand and Tsuneishi Holdings (Cebu), Inc., spun off the power distribution system of the WCIP-SEZ. WCIP-SEZ is a special economic zone for light and heavy industries owned and operated by CIPDI. The park, which is located in Balamban, Cebu, is home to the shipbuilding and ship repair facilities of THI as well as the modular fabrication facility of Metaphil International. On May 4, 2007, CIPDI declared property dividend to its stockholders in the form of its equity in BEZ. On June 8, 2007, AboitizPower entered into an agreement to acquire AboitizLand’s 60% equity stake in BEZ represented by 4,301,766 common shares of BEZ. Pursuant to the agreement, AboitizPower acquired AboitizLand’s ownership interest in BEZ valued at π266.9 mn in exchange for AboitizPower’s common shares issued at the initial public offering price of π5.80 per share. On March 7, 2008, AboitizPower purchased Tsuneishi Holdings’ 40% equity in BEZ for approximately π178 mn. The acquisition brought AboitizPower’s total equity in BEZ to 100%. During the early months of 2010, BEZ completed the construction of the 33 MVA on-load tap changer substation, including the control room with 15kV metal-clad switchgear, as well as the two-kilometer 69kV line from Arpili to Buanoy substations. BEZ also erected their fast and slow moving warehouses within their Buanoy and Arpili Substations respectively. Supervisory Control and Data Acquisition (SCADA) will be implemented starting first quarter of 2011 to raise the quality of operation in BEZ’s Arpili and Buanoy substations. To ensure continuous supply of power, BEZ decided to register as a direct participant of WESM during the end of 2010.

22 • SEC FORM 17-A (ANNUAL REPORT)
RETAIL ELECTRICITY AND OTHER RELATED SERVICES One of the objectives of electricity reform in the Philippines is to ensure the competitive supply of electricity at the retail level. In particular, when Open Access and Retail Competition under the Rules and Regulations to Implement the EPIRA is fully implemented, large-scale customers will be allowed to obtain electricity from Retail Electricity Suppliers (RES) licensed by the ERC. Aboitiz Energy Solutions, Inc. (AESI) AESI, a wholly owned subsidiary of AboitizPower, holds a license to act as a RES (issued on November 9, 2009) and a license to act as a Wholesale Aggregator (issued on January 26, 2007). AESI intends to take advantage of its affiliation with the Aboitiz Group in marketing its power to Open Access customers. AESI also provides a range of value added technical services to the various customers of the AboitizPower generation group, including power quality analysis, thermal scanning and power factor evaluation and correction. These technical services allow power supply customers to properly assess their power consumption profile leading to a more efficient power consumption management. Aside from providing technical assistance in power quality analysis, AESI is also involved in project management services for transmission lines and substations. These products - from power supply to technical support - allow AESI to provide a one stop shop convenience to AboitizPower customers for all their power requirements. As the era of Open Access begins, these same services currently enjoyed by existing AboitizPower generation customers, from distribution utilities to large manufacturing firms, will be made available by AESI to new retail supply customers. This will positively impact the efficiency and use of power in these industrial and residential customers in the years ahead. FINANCIAL SERVICES AEV’s financial services group is composed of two companies: (1) Union Bank of the Philippines (UnionBank), a leading universal bank in the country, and (2) City Savings Bank (CitySavings), a thrift bank based in Cebu City. Union Bank of the Philippines (UnionBank) UnionBank was founded in 1968 as a savings bank and was granted its commercial banking license by the Bangko Sentral ng Pilipinas (BSP) in 1982. In 1992, UnionBank received its license to operate as a universal bank. In 1994, it successfully acquired and merged with the International Corporate Bank, widening its business scope and presence in the Philippines. That same year, UnionBank embarked on a comprehensive corporate restructuring program through investments in technology, creation of new products and the development of online banking capabilities, all of which have become the bank’s competitive strengths. As part of its growth strategy, UnionBank acquired the International Exchange Bank (iBank) in June 2006. The acquisition and merger of iBank catapulted UnionBank to being the 7th largest in terms of assets, 7th largest in terms of loans and 9th largest in terms of deposits among private domestic commercial banks per BSP data as of September 2006. The merger strengthened its position as a top-tier universal bank with the necessary scale and enhanced product offerings to compete in the industry. UnionBank issued 10-year unsecured subordinated notes eligible as Lower Tier 2 capital at 7.375% per annum in October 2009. It capped its offering at π3.75 bn following its strong performance on the first nine months of 2009. Proceeds of the offering were used to increase and strengthen capital base, and to support business expansion plans. Business expansion would be coming principally from growth in retail assets. Customer reach would be enhanced not only through expansion of brick and mortar presence but through the Bank’s program of “Bringing the Bank to Customers”, building and

23 • SEC FORM 17-A (ANNUAL REPORT)
deepening relationships, connecting and enabling communities. Furthermore, fund sourcing would focus on low cost Current and Savings Account (CASA). As a universal bank, UnionBank provides a broad range of services such as commercial, retail and corporate banking products and services such as loan and deposit products, cash management services, trust banking services, consumer finance, treasury activities and electronic banking products to high-end corporate segments, middle market, retail customers, and major government institutions. UnionBank is focused on meeting changes in customer needs through technological advancements and seeks to remain at the forefront of technology-based banking in the Philippines. UnionBank believes that the use of technology and its operational structure has enabled it to capture and secure a loyal customer base as well as to achieve high levels of efficiency and productivity. As part of its future growth strategy, UnionBank aims to establish itself as a leading multi-product financial services bank in the Philippines by increasing its share of the banking business for all market segments by providing a full range of financial products and services. UnionBank has received various awards for its achievements. In 2008, UnionBank received the Financial Insights Innovation Award from Financial Insights for its Business-to-Government (B2G) Payments, in recognition to the bank’s leadership in technology renovations. That same year, UnionBank was awarded the ISO 9001:2000 Quality Management System (QMS) Certification for its entire centralized backroom operations by TUV Rheinland, as a testament to the Bank’s commitment to maintain compliant, accurate, timely and problem-free service delivery. For three years in a row since 2007, UnionBank received various distinctions from Visa International for its exemplary achievements in its credit and debit card businesses. In October 2009, UnionBank was awarded the Best Credit Card Product Innovation for its Omnipass Visa and Best Debit Card for EON CyberCard, both under the National Awards Category, at the Lafferty Group’s Southeast Asian Payment Card Awards. Both awards reflect the voice of the consumer, having been based on cardholders’ experience in terms of the cards’ features and benefits, services, product conditions and brand value. In December 2009, UnionBank received a Product Innovation Partnership award from J.P. Morgan Chase Bank for its active participation in its auto-convert product, an innovation of J.P. Morgan’s FX remittance worldwide payment service. In 2010, UnionBank obtained recognition from a number of institutions. Visa International granted UnionBank as the “Highest Average Spend Growth for Visa Card and Highest Transaction Count Growth for Visa Gold Card”, as well as “Highest Payment Growth and Highest Transaction Count Growth for Visa Debit Card”. Thomson Reuters-Lipper recognized UnionBank for displaying consistently strong risk-adjusted returns in Philippines Peso Bond Portfolio. According to the 10th Annual Finance Polls, UnionBank is the only bank among top 10 Philippine companies that was cited in three categories such as Best Corporate Governance, Best Corporate Social Responsibility and Most Committed to a Strong Dividend Policy. Based on Bloomberg Fund Performance Chart for 5 Year Return, UnionBank ranked number 1 in Large Capital Philippine Equity Portfolio among 23 peso equity funds and in Philippine Peso Bond Portfolio from a total of 84 bond funds. Union Bank of the Philippines ranks among the silver awardees for Good Corporate Governance as awarded by the Institute of Corporate Directors. According to BusinessMirror, UnionBank is one of four local banks included in the top 25 Philippine companies for achieving a high ranking in the latest Wealth-Added Index (WAI) developed by New York based Stern Stewart & Co. Further, UnionBank is the first and only Philippine bank to be certified for the SWIFT Workers’ Remittance Service (WRS). In 2010, UnionBank obtained ISO 9001:2008 certification, an upgrade from its previous ISO 9001:2000 Quality Management System (QMS) Certification obtained in 2008. UnionBank is also certified as having ZERO Non-Conformance during its quality audit in 2009 and 2010. UnionBank started preparations for the rollout of the ISO 27001 Security Certification and added Six Sigma Certification from Motorola. To strengthen its customer service, UnionBank piloted an ATM Sprint Terminal in selected Cebu branches to enable a selfservice and queue management system. With the advance use of SMS

24 • SEC FORM 17-A (ANNUAL REPORT)
technology, important notices and information are relayed through SMS Messaging to promote customer convenience and improve customer service. To enhance employee relations, UnionBank activated Workplace Health, Safety and Security Council to manage awareness, training and preparation of related contingency process necessary to manage employees’ welfare and well being. As of December 2010, AEV beneficially owns 40.91% of UnionBank. AEV acquired 14,431,788 UnionBank shares in 2010, bringing its total number of UnionBank shares to 262,384,273. Other major shareholders of UnionBank are Insular Life Assurance Company, Ltd. and the Social Security System. City Savings Bank (CitySavings) CitySavings, a thrift bank, was incorporated on December 9, 1965 and was originally known as Cebu City Savings and Loan Association. It was the first of its kind to be organized under the “Savings and Loan Association Act”, otherwise known as Republic Act 3779. CitySavings began its business with a mission to serve ordinary working men and women in the areas where it operates. From one branch built in 1966, CitySavings now has 25 branches and extension offices in the Visayas and Mindanao. CitySavings recently opened a branch in Luzon where there are opportunities to scale up its operations and tap into new sources of revenue. Three full branches and three extension offices are located in the Cebu province while other branches and extension offices are located in the cities and municipalities of Iloilo, Davao, Tagum, Roxas, Ormoc, Tacloban, Calbayog, Bacolod, San Carlos, Kabankalan, Cagayan de Oro, Dumaguete, Antique, Tanjay, Tagbilaran, Ubay, Sogod in Southern Leyte, Catarman in Northern Samar, and Calamba, Laguna in Southern Luzon. The Dumaguete and Calamba, Laguna branches, which opened in 2010, were the latest addition to CitySavings’s growing network of branches. The opening of the Calamba, Laguna branch marked CitySavings’s entry into the Luzon market. CitySavings offers traditional deposit products such as savings, current and time deposits. Such products include the regular savings accounts, student savings accounts, Kaugmaon savings accounts and its 5-year high interest time deposit accounts. The regular savings account allows minimum deposits for as low as π500, while the student savings is intended primarily to encourage students to save money and learn the value of saving. In 2009, CitySavings launched its CitySavings ACCESS which is the new ATM product under the BANCNET network. This has allowed the CitySavings to enhance its payroll facility offered to valued clients. CitySavings also extends loans which are normally too small for commercial banks to handle. Majority of its loans are intended for public school teachers and government employees. CitySavings carries with it over 44 years of experience in teachers’ lending, with salary loans for public school teachers as its main loan product since its incorporation. The salary loan is pursuant to the Department of Education’s (DepEd) Automatic Payroll Deduction System (APDS). CitySavings currently employs over 300 employees serving over 99,000 borrowers, and counts on the strong patronage of its more than 59,000 depositors all over the Philippines. It has total capital funds of over π1 bn and total resources of over π8 bn. It also has one of the best operating efficiencies and the lowest past due ratio in the thrift banking industry. Its capital adequacy ratio has always been above the BSP requirement of 10%. From an ownership of 34%, AEV offered to acquire an additional 26% of the equity of CitySavings in March 2010 to bring up its direct ownership to 60%. Meanwhile, its wholly owned subsidiary Pilmico Foods Corporation (Pilmico) offered to acquire the remaining 40% of CitySavings. The combined acquisition by AEV and Pilmico was valued at approximately π1.36 bn.

25 • SEC FORM 17-A (ANNUAL REPORT)
On November 17, 2010, the Bangko Sentral ng Pilipinas (BSP) approved AEV’s and Pilmico’s proposed acquisition of CitySavings. As of December 31, 2010, AEV’s beneficial ownership in CitySavings is 99.25%. FOOD MANUFACTURING AEV’s food manufacturing group is presently made up of Pilmico and its subsidiary, Pilmico Animal Nutrition Corporation (PANC). Pilmico Foods Corporation (Pilmico) Pilmico is one of the country’s largest manufacturers of flour and is ranked among the top three domestic flour producers in terms of sales. Incorporated on August 8, 1958, Pilmico started out as a joint venture among the Aboitiz Group, the Lu Do Group, the Soriano Group and the Pillsbury Group of the United States. The Lu Do, Soriano and Pillsbury Groups eventually sold off their holdings to AEV. Pilmico is primarily engaged in the manufacture of wheat flour and wheat by-products. As a flour miller, Pilmico brings into the market a variety of brands such as “Sun Moon Star”, “Sunshine”, “Glowing Sun”, “Kutitap”, “Gold Star” and “Megastar”. Aside from these basic all-purpose baking flour brands, Pilmico also offers a high-end cake flour under the “Wooden Spoon” brand. Pilmico products are distributed nationwide through external distributors and dealers located in major cities like Manila, Davao, Iloilo, Bacolod, Iligan and Cebu. These distributors handle sales to bakeries, restaurant chains, hotels, and other large end-users. It imports both soft and hard wheat, the main raw materials for its products, from the United States and Canada. On September 1, 2008, Pilmico commenced commercial operations of its new 115,000 metric ton (MT) feedmill located within its flour mill complex in Iligan City, Lanao del Norte. New grains silos with capacity of 27,000 MT were also completed in September 2008. In July 2010, Pilmico completed the expansion of its Iligan feedmill, doubling its capacity to produce high quality feeds. This allowed the company to not only meet the growing demand for animal feeds in the Visayas and Mindanao regions, but also achieve operating cost efficiencies and yield improvements. Pilmico Animal Nutrition Corporation (formerly Fil-Am Foods, Inc.) (PANC) To diversify from the cyclical nature of its existing products, Pilmico also entered the swine production and animal feeds businesses in 1997 through Fil-Am Foods, formerly a joint venture with Tyson International Holding Company, a subsidiary of Tyson Foods, Inc., and PM Nutrition Company, Inc., an affiliate of Purina Mills, Inc. In January 1999, Fil-Am Foods began commercial operations of its feed milling plant, and started its swine operations in the second half of that year. In October 2002, Fil-Am Foods became a wholly owned subsidiary of Pilmico following Pilmico’s acquisition of its partners’ equity. This strengthened Pilmico’s focus and core competence in the feed milling industry. In November 2008, PANC began the construction of a biogas system in its breeder, nucleus and new grower-finisher farm facilities in Tarlac. Construction has been completed and the system is undergoing test runs. Once operational, PANC expects to make its farms’ operations almost power self-sufficient with the conversion of hog waste to electricity. Registration of the project under the Renewable Energy Act (“RE Act”) is underway. Once approved, the biogas operation will be eligible to avail of fiscal incentives as provided by the RE Act.

26 • SEC FORM 17-A (ANNUAL REPORT)
In 2009, the company refreshed its brand and changed its corporate name to Pilmico Animal Nutrition Corporation (PANC) to continue on its brand promise and establish a platform for future business growth. PANC’s grower-finisher farm in Aranguren, Tarlac started commercial operations in January 2009. This increased the initial company-owned farm capacity by 67% to 12,000 heads of market hogs. Since then, the company’s swine operations experienced continuous growth through the expansion of its various finisher farms and an additional nucleus multiplier facility. These led the company to achieve its current sow level of 6,500 heads. In January 2010, PANC expanded its product portfolio by venturing into the gamefowl industry through its newest brand of feed-SALTO. Salto offers a complete feed line from Chick Booster, Baby Stag Developer, Stag Developer, Maintenance and Conditioner for a round up of protection and stamina from brooding to ranging to conditioning stage. Moving forward, PANC aims to continue maximizing and growing its existing business while looking at opportunities to diversify into other segments of the food business that will complement its existing product lines. To ensure its competiveness in the market and further increase customer satisfaction, PANC is in the process of completing requirements for an ISO certification of both its Iligan and Tarlac feedmills. It aims to obtain said certification by March 2011. PANC also aims to build a new storage warehouse and increase the capacity of its unloaders. Farm 5 for PANC’s swine business is also under construction and will be operational by June 2011. This will allow the company to increase its sow level to 8,500 heads from the current 6,500 heads. OTHER INVESTMENTS AEV’s other investments include holdings in integrated maritime services through the Aboitiz Jebsen Group of Companies, real estate through Cebu Praedia Development Corporation (CPDC) and aviation through AEV Aviation, Inc. (AAI). Aboitiz Jebsen Group The Aboitiz Jebsen Group, a joint venture with the Jebsen Group of Norway, is primarily engaged in ship management, manning and crew management, and bulk transport businesses. It is composed of Aboitiz Jebsen Bulk Transport Corporation, Aboitiz Jebsen Manpower Solutions, Inc., Jebsen Maritime, Inc. and their affiliated companies. In December 2010, AEV acquired from its then transport subsidiary ATS the latter’s interest in the Aboitiz Jebsen companies pursuant to the Share Purchase Agreement with NENACO for the sale of AEV’s and ACO’s equity interests in ATS. AEV Aviation Inc. (AAI) AAI holds AEV’s aviation assets, including the corporate aircraft and accompanying support facilities. Incorporated on October 9, 1990, it was originally known as Spin Realty Corporation, and was reorganized in late 1998 when the newly acquired AEV corporate aircraft was placed under its holdings. To date, AAI has five employees, one pilot-in-command, one co-pilot, one aircraft mechanic supervisor, and two aircraft mechanics. Their task is to provide air transport for AEV’s corporate officers within the Philippine archipelago.

27 • SEC FORM 17-A (ANNUAL REPORT)
Cebu Praedia Development Corporation (CPDC) CPDC is the holding company for AEV’s real estate properties. Incorporated on October 13, 1997, CPDC is engaged in leasing of properties located in the cities of Makati and Cebu. To date, its major property holdings include the commercial building block located at 110 Legaspi Street, Makati City that serves as the office of AEV and its subsidiaries and associates in Metro Manila, and AEV’s corporate headquarters located at Gov. Manuel Cuenco Avenue in Cebu City. ii) Sales Comparative amounts of consolidated revenues and profitability of continuing operations, and assets are as follows:
2010 20091 20082 Gross Income 74,551 34,925 23,462 Operating Income 28,869 7,142 2,528 Total Assets 174,967 143,281 75,715
Note: Values in the above table are in Million Pesos. The operations of AEV and its subsidiaries are based largely in the Philippines. Comparative amounts of revenue contribution by business grouping3 are as follows:
2010 2009 2008 Power Distribution & Generation 59,546 79% 23,174 66% 12,243 51%
Food Manufacturing 12,880 17% 11,048 31% 10,689 45%Banking 1,471 2% - - - -Transport 452 1% 458 1% 408 2%Parent & Portfolio 629 1% 541 2% 523 2%Total Revenues 74,997 100% 35,221 100% 23,862 100%Less: Eliminations 427 296 400 Net Revenues 74,551 34,925 23,462
Note: Values in the above table are in Million Pesos.
1 2009 and 2008 Profit & Loss figures are re-presented to consider the sale of ATS investment in 2010. The results of operations of the disposal group, which comprises ATS group except AJBTC, AJMSI and JMI, are no longer consolidated on a line-by-line basis. The disposal group's net income or loss is reflected under "Net Income (Loss) form Discontinued Operations" in the AEV consolidated income statements. 2 Id. 3 Percentages refer to the business group’s share in net revenue for a given year. Under financial services group, only CSB’s revenues are reflected starting 2010 when CSB became a subsidiary. Prior to 2010, CSB was an associate. To date, UBP remains an associate. The revenues of associates do not form part of AEV’s consolidated revenues. UBP’s 2010, 2009 and 2008 and CSB’s 2009 and 2008 contributions to registrant’s net income are reported under the account “Share in Net Earnings of Associates”. For additional details on the income contribution of all business segments/groups to AEV, please refer to Business Segment Information of the Notes to the Consolidated Financial Statement.

28 • SEC FORM 17-A (ANNUAL REPORT)
(iii) Distribution Methods of the Products or Services POWER GENERATION AND DISTRIBUTION The Generation Companies sell their electricity either through the WESM or through bilateral power supply agreements with NPC, private distribution utilities or other large end-users. Currently, SNAP-Magat and SNAP-Benguet have ASPAs with NGCP as ancillary service providers to the Luzon Grid. As ancillary service providers, SNAP-Magat and SNAP-Benguet nominate their available capacity for ancillary service to NGCP (System Operator). If NGCP accepts the nominated ancillary capacity, it will then provide a notice of ancillary service schedule to SNAP-Magat and SNAP-Benguet. TMI also has an ASPA with NGCP for a supply by each of PB 117 and 118 of 50 MW of ancillary services consisting of contingency reserve, dispatchable reserve, reactive power support and blackstart capacity for the Mindanao Grid. Majority of AboitizPower’s Generation Companies have transmission service agreements with NGCP for the transmission of electricity to the designated delivery points of their customers, while others built their own transmission lines to directly connect with their customers. In some instances, where the offtaker is NPC, NPC takes delivery of the electricity from the generation facility itself On the other hand, AboitizPower’s Distribution Utilities have exclusive distribution franchises in the areas where they operate. These utilities own distribution lines with voltage levels ranging from 220 volts to 23 kV and 69 kV backbone and subtransmission lines. These lines distribute electricity to the distribution utilities’ customers in their respective franchise areas. All customers that connect to these distribution lines are required to pay a tariff for using the system. Each of the Distribution Companies has a distribution network consisting of a widespread network of predominantly overhead lines and substations. Customers are classified in different voltage levels based on their electricity consumption. Large industrial and commercial consumers receive electricity at distribution voltages of 13.8 kV to 23 kV while smaller industrial, commercial and residential customers receive electricity at 240 or 480 volts. All of AboitizPower’s Distribution Utilities have entered into transmission service contracts with NGCP for the use of NGCP’s transmission facilities in the distribution of electric power from the grid to their respective customers. FINANCIAL SERVICES UnionBank delivers its products and services through multiple channels: 186 branches and 214 ATMs nationwide as of December 31, 2010, a call center and Internet bank at www.unionbankph.com. CitySavings has 25 branches and extension offices all over the Philippines serving over 99,000 borrowers and more than 59,000 depositors. CitySavings also has 13 ATMs under the BANCNET network. FOOD MANUFACTURING Pilmico products are distributed nationwide through external distributors and dealers located in major cities like Manila, Davao, Iloilo, Bacolod, Iligan and Cebu. (iv) New Products/Services FINANCIAL SERVICES UnionBank launched in 2010 eleven New Co-Brand/Affinity Credit Card Partnerships such as Burgoo Visa, Racks Visa, Cebu Parklane Visa, Home Depot Visa, People Management of the Philippines Visa,

29 • SEC FORM 17-A (ANNUAL REPORT)
Philippine Academy of Opthalmologists Visa, Adamson Visa, Haribon Foundation Visa, MetroGas Visa, Rivera Golf Visa and Alpha Phi Omega Visa. For consumer finance, UnionBank launched Auto Loans with 0% Interest on Balloon Payment Schemes with premium car partners in July 2010 to make Auto Loans enticing to affluent individuals who do not need means of financing their hefty purchases. In September 2010, UnionBank pioneered the UnionBank Corporate Card, the first corporate card product in the country allowing companies to have their logo or corporate theme in the card design. For transaction banking, UnionBank introduced two products namely ePayout Portal, a single online system for domestic and international payouts and ePayroll with ePayslip, a system that allows for full outsourced payroll processing, enabling employees to view their pay slips through their company’s intranet connection. (v) Competition On the parent company level, AEV has no direct competitor. However, for reference purposes, other holding and management companies listed in the PSE can be used for comparison. On the subsidiary and affiliate level, competition may be described as follows: Generation Business With the privatization of NPC-owned power generation facilities and the establishment of WESM, AboitizPower’s generation facilities located in Luzon, the Visayas and Mindanao will face competition from other power generation plants that supply electricity to the Luzon, Visayas and Mindanao Grids. In particular, SNAP-Magat, SNAP-Benguet, APRI and TLI are expected to face competition from leading multinationals such as Marubeni Corporation and Korea Electric Power Corporation, as well as Filipino-owned IPPs such as First Gen Corporation, DMCI Holdings, Inc. and San Miguel Energy Corporation. AboitizPower will face competition in both the development of new power generation facilities and the acquisition of existing power plants, as well as competition for financing these activities. Factors such as the performance of the Philippine economy and the potential for a shortfall in the Philippines’ energy supply have attracted many potential competitors, including multinational development groups and equipment suppliers, to explore opportunities in the development of electric power generation projects in the Philippines. Accordingly, competition for and from new power projects may increase in line with the expected long-term economic growth of the Philippines. Distribution Business Each of AboitizPower’s Distribution Utilities currently has an exclusive franchise to distribute electricity in the areas covered by each franchise. Under Philippine law, the franchises of the distribution utilities may be renewed by the Congress of the Philippines, provided that certain requirements related to the rendering of public services are met. The Company intends to apply for the extension of each franchise upon its expiration. The Company may face competition or opposition from third parties in connection with the renewal of these franchises. It should be noted that under Philippine law, a party wishing to secure a franchise to distribute electricity must first obtain a Certificate of Public Convenience and Necessity from the ERC, which requires that such party prove that it has the technical and financial competence to operate a distribution franchise, as well as the need for such franchise. Ultimately, the Philippine Congress has absolute discretion over whether to issue new franchises or to renew existing franchises, and the acquisition by competitors of any of the Distribution Utilities’ franchises could adversely affect the Company’s results of operations.

30 • SEC FORM 17-A (ANNUAL REPORT)
FINANCIAL SERVICES UnionBank intends to grow its lending business as it accesses more collateral business and builds its consumer business. The Bank continues to apply appropriate risk management techniques to different types of risk exposures. It also plans to expand its branch network from its total of 186 operational branches as of end-December 2010, with the opening of six new branches in key strategic areas in the next ten months, with a total of 192 branches to end the year 2011. It continues to leverage on its leading position in technology-driven products and services. CitySavings competes with other similar thrift banks and rural banks, such as First Consolidated Bank of Bohol and One Network Bank of Mindanao, that operate in Cebu and the neighboring islands of Bohol, Samar, Leyte, Panay, Negros, and Mindanao. In Luzon, the Manila Teachers Mutual Aid System (MTMAS) is CitySavings’s major competitor. It also competes with private lending institutions accredited by the DepEd on APDS that offer the same products and services. CitySavings’s strategy is to strengthen its capabilities as the preferred provider of financial services to people of moderate means, such as the public school teachers, other public servants, and the ordinary working class. It also aims to solidify its leadership position in the Visayas and Mindanao by protecting and developing its existing market and pursuing branch expansions. As part of its diversification strategy, CitySavings has expanded its market for salary loans to cover civil servants and employees of private companies. This is an existing market of the bank since CitySavings has been extending loans to selected local government units and employees of its affiliates. In 2010, it has expanded its operations in Luzon through the opening of its Calamba, Laguna branch. FOOD MANUFACTURING There is a relatively high degree of competition in the domestic flour milling industry. However, because of freight and distribution costs within the Philippine archipelago, flour companies have a competitive advantage in the areas proximate to their milling plants. Pilmico’s flourmill is located in Iligan City in Northern Mindanao. The only other flour miller operating in Mindanao is Universal Robina, which has a plant in Davao. (vi) Purchase of Raw Materials and Supplies As a holding company, AEV’s primary business is not dependent on the availability of certain raw materials or supplies. Acquisition and/or purchases of raw material requirements are done at the subsidiary or affiliate level. Generation Companies AboitizPower’s hydroelectric facilities utilize water from rivers located near the facilities to generate electricity. Thehydroelectric companies, on their own or through NPC in the case of LHC, possess water permits issued by the National Water Resources Board (NWRB), which allow them to use a certain volume of water from the applicable source of the water flow. Under the APA between APRI and PSALM for the Tiwi-MakBan geothermal complex, the management and operation of the steam fields which supply steam to Tiwi-MakBan remains with Chevron Geothermal Philippines Holdings, Inc. (Chevron). The steam supply arrangement between APRI and Chevron is currently governed by a Transition Agreement which provides for the reimbursement of capital expenditures and operating expenses, as well as payment of service fees, by APRI to Chevron. The Transition Agreement is to be effective no more than four years from the date of the turnover of Tiwi-MakBan to APRI and will be replaced by a Geothermal Resource Service Contract (GRSC) when Chevron becomes a Philippine corporation and after the rehabilitation of MakBan units 5 and 6. Under the GRSC, APRI will no longer pay service fees or reimburse Chevron for capital expenditures and operating expenses. Instead, the price of steam shall be linked to the

31 • SEC FORM 17-A (ANNUAL REPORT)
Barlow Jonker and Japanese Public Utilities (JPU) coal price indices. As a result, the steam cost structure under GRSC will shift from a largely fixed to a full variable cost. AboitizPower’s oil-fired plants use Bunker C fuel to generate electricity. EAUC and CPPC each have a fuel supply agreement with Petron, while SPPC and WMPC get fuel supplies from NPC pursuant to their respective ECAs with NPC. TMI has existing fuel supply agreements with Shell and Petron for PB 117 and 118, respectively, which peg fuel prices based on Mean of Platts Singapore (MOPS). STEAG has an existing long-term coal supply agreement with PT. Jorong Barutama Greston of Indonesia and Samtan Co. Ltd. of Korea. TLI has entered into long-term coal supply contracts for the Pagbilao plant’s annual coal requirements. With the tight coal supply situation in the market as a result of weather disturbances in coal producing countries, TLI is looking at and evaluating alternative sources other than Indonesia to ensure security of supply. Distribution Companies The bulk of volume of electricity the Distribution Utilities sell is purchased from NPC, rather than from the Generation Companies. The following Distribution Utilities purchase electricity from the Generation Companies: Davao Light from Hedcor, SFELAPCO from APRI and VECO from CPPC and CEDC. Most of AboitizPower’s Distribution Utilities have bilateral agreements in place with NPC for the purchase of electricity, which set the rates for the purchase of NPC’s electricity. The following table sets out material terms of each Distribution Company’s bilateral agreements with NPC:
Distribution Company
Term of Agreement with
NPC
Contract Energy (MWh per year)
Take or Pay Pricing Formula
VECO NPC - (extended) expiring in December 25, 2011
870,481 Yes ERC approved NPC rate + ERC approved adjustments
Davao Light NPC - 10 years; expiring in December 2015
1,238,475 Yes ERC approved NPC rate + ERC approved adjustments
Cotabato Light NPC - 10 years; expiring in December 2015
116,906 Yes ERC approved NPC rate + ERC approved adjustments
MEZ NPC - 10 years; expiring in September 2015
114,680 Yes ERC approved NPC rate + ERC approved adjustments
The rates at which Davao Light and SFELAPCO purchase electricity from AboitizPower’s Generation Companies are established pursuant to the bilateral agreements that are executed after the relevant Generation Company has successfully bid for the right to enter into a PPA with either Davao Light or SFELAPCO. These agreements are entered into on an arm’s-length basis and on commercially reasonable terms and must be reviewed and approved by the ERC. In addition, ERC regulations currently restrict AboitizPower’s Distribution Utilities from purchasing more than 50% of their electricity requirements from affiliated Generation Companies. Hedcor Sibulan supplies Davao Light with electricity generated from its Sibulan plants pursuant to the Hedcor Consortium’s 12-year power supply agreement to supply new capacity to Davao Light.

32 • SEC FORM 17-A (ANNUAL REPORT)
VECO has PPAs pursuant to which it purchases a minimum of 18,000,000 kWh per month on a take-or-pay basis from Toledo Power Corporation, and approximately 61.72 MW of dispatchable capacity from CPPC (with no minimum energy off-take requirement). In September 2009, VECO entered into an Electric Power Purchase Agreement (EPPA) with CEDC for the supply of 105 MW for 25 years to address VECO’s long-term power supply requirement. Meanwhile, to mitigate the power supply shortage in 2010, VECO’s largest customer, CEMEX Philippines, agreed to supply 10 MW to VECO during peak hours for one year. CEMEX Philippines’ last delivery of power supply to VECO was on November 2010. The provisions of the Distribution Utilities’ PPAs are governed by ERC regulations. The main provisions of each contract relate to the amount of electricity purchased, the price, including adjustments for various factors such as inflation indexes, and theduration of the contract. Under current ERC regulations, the Distribution Utilities can purchase up to 90% of their electricity requirements using bilateral contracts. Meanwhile, Davao Light and Cotabato Light each has its own stand-by plant. Davao Light currently maintains the 53 MW Bunker C-fired Bajada stand-by plant which is capable of supplying 19% of Davao Light’s requirements. Cotabato Light maintains a stand-by 7 MW Bunker C-fired power plant capable of supplying approximately 30.5% of its requirements. Food Companies AEV’s food subsidiaries import wheat, soybean meal, and other grains mostly from various suppliers in the United States and Canada. (vii) C ustomers As a holding company providing management services, AEV’s principal customers are its subsidiaries and associates. Power Generation and Distribution Close to 70% of the total electricity generated by the Generation Companies are either sold to private distribution utilities or the NPC pursuant to long-term bilateral agreements. The bilateral agreements with NPC are supported by NPC’s credit, which in turn is backed by the Philippine government. The remaining 30% of the total electricity generated by AboitizPower’s Generation Companies is sold through the WESM. Most of AboitizPower’s Distribution Utilities, on the other hand, have wide and diverse customer bases. As such, the loss of any one customer will have no material adverse impact on AboitizPower. The Distribution Utilities’ customers are categorized into four principal categories:
(a) Industrial customers. Industrial customers generally consist of large-scale consumers of electricity within a franchise area, such as factories, plantations and shopping malls.
(b) Residential customers. Residential customers are those who are supplied electricity for
use in a structure utilized for residential purposes. (c) Commercial customers. Commercial customers include service-oriented businesses,
universities and hospitals. (d) Other customers. Other customers include public and municipal services such as street
lighting.

33 • SEC FORM 17-A (ANNUAL REPORT)
Financial Services CitySavings is highly dependent on its salary loan product offered to public school teachers. As of December 31, 2010, CitySavings’s total salary loans to teachers amounted 99% of its total loan portfolio. As an institution engaged in lending to public school teachers for over 45 years, CitySavings has developed an in-depth understanding and expertise in teachers’ lending. It has established an efficient collection system and maintains a low NPL ratio of 0.76% as of December 2010. Consequently, the BSP has provided CitySavings with a CAMELS rating of 4 in the last five years in a scale of 1 to 5, with 5 being the highest. The composite rating of 4 indicates a stable bank capable of withstanding unfavorable outside factors or influences. Certain weaknesses are well within the capability of the Board or senior management to correct in the normal course of operation. Risk management policies are satisfactory relative to the institution’s size, complexity and risk profile. In addition, CitySavings is protected under the Thrift Banks Act of 1995, otherwise known as Republic Act No. 7906. Thrift banks are allowed to extend loans to government employees and collect the same through automatic or direct payroll deductions. This reduces the risk of default on salary loans extended to this sector. Other Subsidiaries and Affiliates AEV’s other subsidiaries and affiliates have a wide and diverse customer base. As such, the loss of any one customer will have no material adverse impact on its subsidiaries and affiliates. (viii) Transactions With and/or Dependence on Related Parties AEV and its subsidiaries and associates (the Group), in their regular conduct of business, have entered into related party transactions consisting of advances, professional fees and rental fees. These are made on an arm’s length basis and at current market prices at the time of the transactions. AEV has service contracts with its subsidiaries and affiliates for corporate center services rendered such as human resources, internal audit, legal, treasury and corporate finance, among others. These services are shared to enable the Group to realize cost synergies. AEV maintains a pool of highly qualified professionals with business expertise specific to the businesses of the AEV Group. Transactions are priced on a cost recovery basis. In addition, transaction costs are always benchmarked on third party rates to ensure competitive pricing. Service Level Agreements are in place to ensure quality of service. The Group extends and/or avails of temporary interest-bearing advances to and from ACO and certain associates for working capital requirements. These are made to enhance the parent companies’ yield on their cash balances. Interest rates are determined by comparing prevailing market rates at the time of the transaction. ACO and certain associates are leasing office spaces from CPDC, a subsidiary of AEV. Rental rates are comparable with prevailing market prices. These transactions are covered with lease contracts for a period of three years. No other transaction, without proper disclosure, was undertaken by the Company in which any director or executive officer, any nominee for election as director, any beneficial owner (direct or indirect), or any member of his immediate family was involved or had a direct or indirect material interest. AEV employees are required to promptly disclose any business and family-related transactions with the Company to ensure that potential conflicts of interest surface and brought to the attention of management.

34 • SEC FORM 17-A (ANNUAL REPORT)
(ix) Patents, Copyrights, Franchises and Government Approvals As a holding company, AEV does not own or possess patents, copyrights, franchises, or other similar rights. However, the businesses of AEV’s power subsidiaries are dependent on government franchises granted them. AEV’s power distribution subsidiaries either have congressional franchises and certificate/s of public convenience issued by the ERC or its predecessor, or Philippine Economic Zone Authority (PEZA) licenses for the distribution companies operating within special economic zones. AboitizPower’s Generation Companies, as well as Davao Light and Cotabato Light, which own generation facilities, are required under the EPIRA to obtain a Certificate of Compliance (COC) from the ERC for its generation facilities. They are also required to comply with technical, financial, and environmental standards provided in existing laws and regulations in their operations. The business of supplying electricity is currently being undertaken solely by franchised distribution utilities. However, once Retail Competition and Open Access starts, the supply function will become competitive. Like power generation, the business of supplying electricity is not considered a public utility operation under the EPIRA. However, it is considered a business affected with public interest. As such, the EPIRA requires all suppliers of electricity to end-users in the Contestable Market, other than distribution utilities within their franchise areas, to obtain a license from the ERC in accordance with the ERC’s rules and regulations. In preparation for the implementation of Retail Competition and Open Access, AboitizPower’s wholly owned subsidiary AESI obtained a license to act as a Retail Electricity Supplier (issued on December 6, 2006) and a license to act as a Wholesale Aggregator (issued on January 26, 2007). As banking institutions, the business operations of UnionBank and CitySavings are regulated by the BSP, the SEC, and the Philippine Deposit Insurance Commission (PDIC). CitySavings, as an accredited lender institution under DepEd’s APDS, also has to comply with the policies issued by the DepEd with regard to the setting of interest rate and other fees on loans being lent out to public school teachers. AEV’s food subsidiary Pilmico owns the trademarks for its various flour products such as “Wooden Spoon”, “Sun Moon Star”, “Sunshine”, “Glowing Sun”, “Kutitap”, and “Megastar”. PANC owns the trademarks for products such as “Pork Solutions” and “Poultry Solutions”. As of the date of this report, these subsidiaries and affiliates have the necessary government approvals, franchises, permits or licenses necessary to operate their respective businesses. The Group always strives to maintain a track record of quality services, and comply with government regulations to justify and ensure renewal of such franchises or accreditations. (x) E ffect of Existing or Probable Governmental Regulations Since the enactment of the EPIRA in 2001, the Philippine power industry has undergone, and continues to undergo, significant restructuring. Through the EPIRA, the Government has begun to institute major reforms with the goal of fully privatizing all sectors of the power industry. Among the provisions of the EPIRA which have or will have considerable impact on AboitizPower’s businesses are the following: Wholesale Electricity Spot Market The WESM, a spot market for the buying and selling of electricity, is a mechanism established by the EPIRA to facilitate competition in the production and consumption of electricity. It aims to: (a) provide incentives for the cost-efficient dispatch of power through an economic merit order; (b) create reliable price signals to assist participants in weighing investment options; and (c) protect a fair and level playing field for suppliers and buyers of electricity, wherein prices are driven by market forces.
35 • SEC FORM 17-A (ANNUAL REPORT)
The WESM provides a venue whereby generators may sell power, and at the same time suppliers and wholesale consumers can purchase electricity where no bilateral contract exists between the two. Although generators are allowed under the WESM to transact through bilateral contracts, these contracts will have to be “offered” to the market for the purpose of determining the appropriate merit order of generators. Settlement for bilateral contracts will, however, occur outside the market between the contracting parties. Traded electricity, not covered by bilateral contracts, will be settled through the market on the basis of the market clearing prices for each of the trading periods. Open Access and Retail Competition The EPIRA likewise provides for a system of Open Access to transmission and distribution wires, whereby Transco, its concessionaire NGCP and any distribution utility may not refuse use of their wires by qualified persons, subject to the payment of transmission and distribution retail wheeling charges. Conditions for the commencement of the Open Access system are as follows:
(a) Establishment of the WESM;
(b) Approval of unbundled transmission and distribution wheeling charges; (c) Initial implementation of the cross subsidy removal scheme; (d) Privatization of at least 70% of the total capacity of generating assets of NPC in Luzon
and Visayas; and (e) Transfer of the management and control of at least 70% of the total energy output of
power plants under contract with NPC to the IPP administrators.
The Government expects Retail Competition and Open Access to be implemented in phases. As far as Luzon is concerned, the WESM began operations in June 2006 and end-users who comprise the contestable market have already been identified. The WESM for the Visayas began trial operations sometime in 2007. Open Access in Luzon and the Visayas will commence once preconditions thereto as provided under the EPIRA have been complied with. In Mindanao, a truly competitive environment required by Retail Competition is not expected to exist prior to at least 2011 because the largest generating asset owned by NPC in Mindanao cannot by law be privatized for at least ten years from the passage of EPIRA. Upon implementation of Open Access, the various contracts entered into by utilities or suppliers may potentially be “stranded.” Stranded contract costs refer to the excess of the contracted costs of electricity under eligible contracts over the actual selling price of the contracted energy under such contracts in the market. On February 18, 2011, the ERC issued an Order in ERC Case No. 2011-004RM entitled “In the Matter of the Declaration of the Retail Competition and Open Access Pursuant to Section 31 of Republic Act No. 9136, Otherwise known as the Electric Power Industry Reform Act of 2001, and Sections 3 and 4 of its Implementing Rules and Regulations,” setting public hearings to determine whether or not Retail Competition and Open Access may already be declared. In the said Order, the ERC motu propio initiated the proceedings to determine whether or not Retail Competition and Open Access may already be declared. The ERC scheduled the public hearings on March 7 to 11, 2011 in ERC, Pasig City. Unbundling of Rates and Removal of Subsidies The EPIRA mandates the unbundling of distribution and wheeling charges from retail rates with such unbundled rates reflecting the respective costs of providing each service. The EPIRA also states that cross subsidies shall be phased out within a period not exceeding three years from the establishment by the ERC of a universal charge, which shall be collected from all electricity end-users. However, the ERC may extend the period for the removal of the cross-subsidies for a maximum of one year if it

36 • SEC FORM 17-A (ANNUAL REPORT)
determines there will be material adverse effect upon the public interest or an immediate, irreparable, and adverse financial effect on a distribution utility. The EPIRA likewise provides for a socialized pricing mechanism called a lifeline rate set by the ERC for low-income, captive electricity consumers who cannot afford to pay the full cost of electricity. These end-users are exempt from the cross-subsidy removal for a period of ten years, unless extended by law. Implementation of the Performance-Based Rate-Setting Regulation (PBR) On December 13, 2006, the ERC issued the Rules for Setting Distribution Wheeling Rates (RDWR) for privately-owned distribution utilities entering PBR for the second and later entry points that set out the manner in which this new PBR rate setting mechanism for distribution-related charges will be implemented. PBR is intended to replace the RORB that has historically determined the distribution charges paid by the Distribution Companies’ customers. Under PBR, the distribution related charges that distribution utilities can collect from customers over a 4-year regulatory period will be set by reference to projected revenues which are reviewed and approved by the ERC and used by the ERC to determine a distribution utility’s efficiency factor. For each year during the regulatory period, a distribution utility’s distribution charges are adjusted upwards or downwards taking into consideration the utility’s efficiency factor set against changes in overall consumer prices in the Philippines. The ERC has also implemented a performance incentive scheme whereby annual rate adjustments under PBR will also take into consideration the ability of a distribution utility to meet or exceed service performance targets set by the ERC, such as the average duration of power outages, the average time of restoration to customers and the average time to respond to customer calls, with utilities being rewarded or penalized depending on their ability to meet these performance targets. The ERC issued its final determination on Cotabato Light’s application for approval of its annual revenue requirement and performance incentive scheme under the PBR scheme covering a 4-year regulatory period which commenced on April 1, 2009 until March 30, 2013. On April 15, 2009, the ERC approved Cotabato Light’s application for translation of its approved annual revenue requirement for the first regulatory year into applicable rates per customer class. Cotabato Light implemented the approved rates last May 1, 2009 – a month after the start of the first regulatory year. The resulting under recovery from the one-month lag was reflected in Cotabato Light’s second regulatory year MAP recalculation and rate translation application which was approved by the ERC on February 22, 2010. The resulting new rates were implemented on April 2010. Cotabato Light filed on December 15, 2010 the third regulatory year MAP recalculation and rate translation to be implemented from April 2011 to March 2012. ERC is scheduled to release its decision on the third regulatory year rates before the end of March 2011. VECO and Davao Light filed on May 2010 their respective first regulatory year rate design applications based on the ERC’s final determinations on their annual revenue requirements for the 4-year regulatory period from July 2010 to June 2014. The proposals were approved by ERC on June 2010 and the new rates were implemented on August 2010. The second regulatory year MAP recalculation and rate translation for both Davao Light and VECO are scheduled to be filed before the end of March 2011 and ERC is expected to release the new rates by June 2011. For SFELAPCO and SEZ, the regulatory reset process is on its final stages and ERC is scheduled to release before the end of March 2011 its draft determination on the applications for annual revenue requirements and performance incentive schemes for the regulatory period October 2011 to September 2015. The draft determination will be subjected to public consultations before ERC

37 • SEC FORM 17-A (ANNUAL REPORT)
releases its final determination on June 2011. Thereafter, SFELAPCO and SEZ will be filing their respective rate design applications for the first regulatory year to be implemented from October 2011 to September 2012. Reduction of Taxes and Royalties on Indigenous Energy Resources To equalize prices between imported and indigenous fuels, the EPIRA mandates the President of the Philippines to reduce the royalties, returns and taxes collected for the exploitation of all indigenous sources of energy, including but not limited to, natural gas and geothermal steam, so as to effect parity of tax treatment with the existing rates for imported coal, crude oil, bunker fuel and other imported fuels. Following the promulgation of the implementing rules and regulations, President Arroyo enacted Executive Order No. 100 to equalize the taxes among fuels used for power generation. Proposed Amendments to the EPIRA Since the enactment of the EPIRA, members of the Philippine Senate and House of Representatives have proposed amendments to the EPIRA. Some of the proposed amendments are discussed below.
(a) Disallow recovery of Stranded Contract costs; (b) Require transmission charges, wheeling charges, connection fees, and retail rates to be
approved by the ERC only after due notice and public hearing participated in by all interested parties;
(c) Exclude from the rate base the following items that Transco and the distribution
utilities charge the public: corporate income tax, value of the franchise, value of real or personal property held for possible future growth, costs of over-adequate assets and facilities, and amount of all deposits as a condition for rendition and continuation of service;
(d) Prohibit cross-ownership between Generation Companies and distribution utilities or
any of their subsidiaries, affiliates, stockholders, officials, or directors, or the officials, directors, or other stockholders of such subsidiaries or affiliates, including the relatives of such stockholders, officials, or directors within the fourth civil degree of consanguinity;
(e) Prohibit distribution utilities under a bilateral electric power supply contract from
sourcing more than 33% of its total electric power supply requirements from a single generation company or from a group of generating companies wholly owned or controlled by the same interests. On the effectiveness of the proposed law, any distribution utility that has contracts which exceed the allowable 33% limit will be directed to desist from further awarding additional electric power supply contracts with any generation company or group of generating companies wholly owned or controlled by the same interests, until its present electric power supply requirements, when added to the proposed additional electric power supply contract or contracts with any generation company or group of generating companies wholly owned or controlled by the same interests shall comply with the 33% limit;
(f) Add the following exceptions under Section 45 of EPIRA (Cross Ownership, Market
Power Abuse and Anti- Competitive Behavior): (1) generating companies utilizing or producing power from site-specific indigenous and renewable energy source such as hydro, geothermal and wind power and (2) if the breach in market share limits is due to the temporary or permanent shutdown or non-operation of other generating facilities;
(g) Exempt or defer some assets of NPC from privatization, such as the Unified Leyte
(Tongonan) Geothermal Complexes, Agus and Polangui Complexes, and the Angat Dam;

38 • SEC FORM 17-A (ANNUAL REPORT)
(h) Expand the definition of host communities to include all barangays, municipalities and
provinces or regions that protect and maintain watersheds that provide water supply to the dam or hydroelectric power generating facility; and
(i) Distribution utilities to pay a franchise tax equivalent to 3% of the distribution utility’s
gross income in lieu of all taxes. The Renewable Energy Act of 2008 Republic Act No. 9513, the Renewable Energy Act of 2008 (RE Law), is a landmark legislation and is said to be the most comprehensive renewable energy law in Southeast Asia. The RE Law was signed into law by President Gloria M. Arroyo in December 16, 2008 but took effect on January 31, 2009. The RE Law’s declared policy is to encourage and develop the use of renewable energy resources of the country to reduce the country’s dependence on fossil fuels and reduce overall costs of energy, and reduce, if not prevent harmful emissions into the environment to promote health and sustainable environment. The RE Law imposes a government share on existing and new RE development projects at a rate of 1% of gross income from sale of renewable energy and other incidental income from generation, transmission and sale of electric power and a rate of 1.5% of gross income for indigenous geothermal energy. Micro-scale projects for communal purposes and non-commercial operations with capacity not exceeding 100 kW will not be subject to the government share. More importantly, the RE Law offers fiscal and non-fiscal incentives to RE developers of RE facilities, including hybrid systems, subject to a certification from Department of Energy (DOE), in consultation with the BOI. These incentives include income tax holiday for the first seven years of operation; duty-free importations of RE machinery, equipment and materials effective within ten years upon issuance of certification, provided, said machinery, equipment and materials are directly, exclusively and actually used in RE facilities; special realty tax rates on equipment and machinery not exceeding 1.5% of the net book value; net operating loss carry-over (NOLCO); corporate tax rate of 10% after the seventh year; accelerated depreciation; zero percent value-added tax on sale of fuel or power generated from emerging energy sources and purchases of local supply of goods, properties and services of RE facilities; cash incentives for RE developers for missionary electrification; tax exemption on carbon emission credits; and tax credit on domestic capital equipment and services. All fiscal incentives apply to all RE capacities upon effectivity of the RE Law. RE producers are also given the option to pay Transco transmission and wheeling charges on a per kilowatt-hour basis and are given priority dispatch. RE producers are likewise exempted from universal charge imposed under the EPIRA. In addition, the RE Law provides a financial assistance program from government financial institutions for the development, utilization and commercialization of renewable energy projects, as may be recommended and endorsed by the DOE. According to Department Circular No. DO2009-05-0008 dated May 25, 2009 (Rules Implementing the Renewable Energy Act of 2008), the DOE, Bureau of Internal Revenue (BIR) and the Department of Finance (DOF) shall, within six (6) months from the issuance of the implementing rules of the RE law, formulate the necessary mechanisms/guidelines to implement the entitlement of the general incentives and privileges to qualified RE developers. However, as of this date, no specific guidelines or regulations has been issued yet by the relevant implementing agencies. Such being the case, the renewable energy companies of AboitizPower, such as APRI, Luzon Hydro, Hedcor Sibulan, Hedcor Tamugan, SNAP-Magat and SNAP Benguet filed last August 6, 2010 a request for ruling before the BIR Law Division on the application of zero-rated valueadded tax on all its local purchases of goods and services needed for the development of the RE plant facilities, whole process of exploration and development of RE sources up to their conversion into power and the services of subcontractors and contractors. To date, the said request is still pending with the BIR Law Division.

39 • SEC FORM 17-A (ANNUAL REPORT)
New ERC Regulation on Systems Loss Cap Reduction Under ERC Resolution No. 17, Series of 2008, which amends the systems loss caps adopted by Republic Act No. 7832 (Anti-Pilferage of Electricity and Theft of Electric Transmission Lines/Materials Act of 1994), the actual recoverable systems losses of distribution utilities was reduced from 9.5% to 8.5%. The new system loss cap was implemented in January 2010. Under the new regulation, actual company use of electricity shall be treated as an expense of the distribution utilities in accordance with the following rules: for distribution utilities that are yet to enter PBR, the actual use shall be treated as Operation and Maintenance in their PBR applications; and for distribution utilities that are already under PBR, the actual use shall be treated as Operation and Maintenance in their subsequent reset. (xi) Research and Developmental Activities AEV and its subsidiaries do not allocate specific amounts or fixed percentages for research and development. All research and developmental activities are done by its subsidiaries and affiliates on a per project basis. The allocation for such activities may vary depending on the nature of the project. (xii) Compliance with Environmental Laws Businesses under AEV are subject to extensive, evolving and increasingly stringent safety, health and environmental laws and regulations. These laws and regulations, such as the Clean Air Act (Republic Act No. 8749), address, among other things, air emissions, wastewater discharges, the generation, handling, storage, transportation, treatment and disposal of toxic or hazardous chemicals, materials and waste, workplace conditions and employee exposure to hazardous substances. These said companies have incurred, and are expected to continuously incur operating costs to comply with such laws and regulations. However, these costs and expenses cannot be segregated or itemized as these are embedded in, and are part and parcel of the companies’ overall system, in compliance with both industry standards and the government’s regulatory requirements. AboitizPower companies continue to take the lead in conforming to standards of quality and environmental management. Hedcor earned the Occupational Health and Safety Standard (OHSAS 18001) issued by Certification International. APRI Tiwi earned certifications for ISO 9001 (Quality Standard), ISO 14001 (Environmental Management Standard) and OHSAS 18001 (Occupational Health and Safety Standard). It also earned recognition for Perfect Safety Record by the Safety Organization of the Philippines (SOPI). APRI Makban was recognized by SOPI for Perfect Safety Record and Outstanding Safety Practitioner 2010. As a signatory of the Kyoto Protocol, the Philippines can participate in greenhouse gas emission reduction through the Clean Development Mechanism (CDM). The Sibulan Project of Hedcor Sibulan is a registered CDM project, able to prevent carbon emissions measured in tons of CO2. The project is expected to generate carbon credits that can eventually be traded in the carbon market. In 2010, SNAP earned the letter of approval from the Department of Environment and Natural Resources (DENR) for CDM enlistment. DENR is the Designated National Authority (DNA) that must issue the letter of approval before a project can register for carbon trading. The Ambuklao facility is expected to yield 155,000 carbon emission reduction (CER) credits. The Binga plant is expected to generate an additional 23,000 tons CER. The Aboitiz Group continues to do a greenhouse gas inventory. While there are no specific laws on carbon emissions in the Philippines, the climate change issue is slowly gaining ground as a priority concern for the government. The group wide inventory information can help the group identify ways to manage emissions. The group continues to pursue mitigating measures such the annual simultaneous tree planting activity which was started in 2009. In 2010 the simultaneous tree planting activity was participated

40 • SEC FORM 17-A (ANNUAL REPORT)
in by 20 companies and with 2,000 employee volunteers nationwide. A total of 35,000 trees were planted and this is estimated to sequester 700 tons of carbon dioxide annually. In some areas, the trees will be used by some Aboitiz companies to comply with the stipulations of the environmental impact statements for the projects and conform to the requirements under the environmental compliance certificate. This was the case for the VECO Reforestation Park, a 530 hectare area in upland Cebu. Each of the hydroelectric power projects of AP is subject to a mandated watershed management plan intended to maintain the integrity of the renewable resource used to generate electricity. This plan enables a company to adopt a watershed with the commitment to reforest and sustain its healthy vegetative state. The hydroelectric companies also continue to monitor the quality of water systems that they tap. Watershed management is also a serious consideration for geothermal power given its location and the ecosystem that exist therein. In the food sector, Pilmico Foods Iligan earned the Cleanest and Most Orderly Private Port Award given by SOPI, PPA, the Bureau of Fire Protection and the Coast Guard. Pilmico Foods also earned certification for ISO 9001, Halal and HACCP. (xiii) Employees As of February 28, 2011, AEV has a total of 211 employees composed of executives, managers, supervisors, administrative, and clerical staff. There is no existing collective bargaining agreement covering AEV employees.
Business Unit
Number of Employees Aboitiz Equity
Ventures, Inc. City Savings
Bank, Inc.
Pilmico Foods
Corporation & Subsidiary
Aboitiz Power Corporation & Subsidiaries
Executives 37 21 14 91Manager 27 56 35 147Supervisors 21 56 77 416Rank & File 115 221 236 1,616Contractual 11 0 0 0TOTAL 211 354 362 2,722Unionized Employees
N/A 207 20 (Pilmico) 764
Expiry of CBA N/A May 31, 2015 May 31, 2015(Pilmico)
APRI - Negotiations for a new CBA with a newly organized union is about to start CotabatoLight - June 30, 2014 DavaoLight - June 15, 2011 Hedcor - September 19, 2011 VECO - December 31, 2011 SFELAPCO - May 9, 2011
Sometime in 2007, CitySavings and its incumbent labor union, National Union of Bank Employees – City Savings Bank Chapter (NUBE-CSB), renegotiated the economic provisions of their 3-year collective bargaining agreement (CBA). A bargaining deadlock occurred with respect to certain benefits. The Secretary of the Department of Labor and Employment (DOLE) assumed jurisdiction over the labor dispute to avoid a strike. The majority of the employees in the bargaining unit

41 • SEC FORM 17-A (ANNUAL REPORT)
petitioned the DOLE Secretary to allow them to sign the CBA claiming that NUBE-CSB was not representing the voice of the majority. The union leaders of NUBE-CSB refused to sign the CBA despite the overwhelming demand by the majority of the union members. The DOLE Secretary resolved the bargaining deadlock by adopting in substance the benefits proposed by CitySavings. The NUBE-CSB President signed the CBA on behalf of the union and paved the way for the union members to receive the CBA benefits as per decision of the DOLE Secretary. The NUBE Federation President however, filed a Motion for Partial Reconsideration to contest the order of the DOLE Secretary. During the pendency of the appeal, the majority of the rank-and-file employees organized a new union called United Employees of City Savings Bank (UECSB) and filed for a petition for certification election with the DOLE Regional Office. NUBE-CSB opposed the petition on the ground that there is a bargaining deadlock between NUBE-CSB and CSB which bars the holding of a certification election. UECSB, on the other hand, claims that the petition for certification election was filed within the freedom period and that the deadlock was already resolved by the Secretary of DOLE. The Mediator-Arbiter ruled in favor of UECSB and ordered the holding of the certification election. UECSB obtained the majority of the votes cast during the certification election and was certified as the sole and exclusive bargaining agent of the members of the rank-and-file bargaining unit of CSB. The DOLE Regional Office and the Secretary of DOLE affirmed the Mediator-Arbiter’s decision. NUBE-CSB then filed a Petition for Certiorari in the Court of Appeals to question the Secretary of DOLE’s dismissal of its appeal. However, the Court of Appeals dismissed NUBE-CSB’s petition for its failure to pay the docket fees required by law. (xiv) Major Risk/s Involved in the Business of AEV and its Significant Subsidiaries Through prudent management and investment decisions, AEV constantly strives to minimize the risks it might encounter in the businesses in which it is involved. However, certain risks are inherent to specific industries that are not within the direct control of AEV or its investee companies. Of note are the following: Reputational Risk AEV recognizes its reputation as both its major asset and source of competitive advantage and its primary source of vulnerability in view of the increasing presence of AEV and its business units throughout the Philippines. Media and communication have also reached a point where scrutiny from stakeholders and the general public have become more stringent than ever. Regulators are a vital stakeholder in the power and banking businesses and it is imperative for AEV businesses in these sectors to keep their reputation levels high. A Reputation Management Department was established in 2009 to ensure the protection and enhancement of this vital asset. Corporate social responsibility programs undertaken mainly through Aboitiz Foundation Inc. and sustainability efforts are given full management support, these being important sources of reputational gain for AEV. Competition Risk As with other businesses, AEV and its subsidiaries operate in different competitive environments. As such, failure to properly consider changes in its markets and the actions of competitors can greatly diminish this advantage. To further this advantage and enable AEV and the business units to maximize opportunities, a more robust and comprehensive strategic planning process has been put in place to formalize the process and focus efforts on maximizing our businesses’ strengths and addressing weaknesses.

42 • SEC FORM 17-A (ANNUAL REPORT)
Regulatory Risk Several of AEV’s major investments particularly in the power and banking sectors are subject to more stringent regulations. To manage this risk, the Company plans ahead and prepares for expected changes in regulation, rather than wait for regulations to be imposed. Trying to respond to new regulatory standards in a short space of time can be difficult, especially in a climate where forbearance may be scarce. To respond proactively to such fundamental changes may require companies to take a long view on possible regulations and consider alternate scenarios. Business Interruption Due to Natural Calamities and Critical Equipment Breakdown Loss of critical functions caused by natural calamities such as earthquakes, windstorms, typhoons and floods could result in a significant interruption of the businesses. Interruption may also be caused by other factors such as major equipment failures, fires and explosions, hazardous waste spills, workplace fatalities, product tampering, terrorism, and other serious risks. In order to prevent and manage the risk of business interruption, regular preventive maintenance of the facilities arebeing strictly observed and loss prevention controls are continually being evaluated and strengthened. In addition, to ensure the continuity of operations in the event of a business interruption, a Business Continuity and Crisis Management Plan will be developed and implemented in 2011. Business interruption insurance has also been procured to cover the potential loss in gross profits of the group’s critical operations and assets. Financial Risks In the course of AEV’s and its business units’ operations, the Company is exposed to financial risks namely, interest rate risk resulting from movements in interest rates that may have an impact on outstanding long-term debt; credit risk involving possible exposure to counter-party default on its cash and cash equivalents, AFS investments and trade and other receivables; liquidity risk in terms of the proper matching of the type of financing required for specific investments; and foreign exchange risk in terms of foreign exchange fluctuations that may significantly affect its foreign currency denominated placements and borrowings. Details of the above risks including measure to mitigate them are discussed in the notes to the financial statements. Commodity Price Risk Certain investee companies, specifically Pilmico and TLI, are engaged in businesses whose raw material and fuel requirementsare subject to price, freight and foreign exchange volatility factors. Fluctuation in any of these volatile elements individually or combined will result to the increase in the operating cost of these companies. To address the exposure, management has taken a more active role in understanding the markets, including entering into contracts and hedge positions with the different suppliers of these commodities. Political and Economic Factors AEV is a holding company that, through its investee companies, is engaged in power generation and distribution, banking and financial services, integrated maritime services, and food production, among other business activities. The results of operations of the investee companies have historically been influenced to a certain extent by the political and economic situation in the Philippines. In the past, the country experienced periods of slow or negative economic growth. Any future political or economic instability may have an adverse effect on the business and results of operations of the Company or its investee companies. Working Capital For 2010, AEV derived its working capital mainly from the steady cash flow generated and contributed by its subsidiaries and associates.

43 • SEC FORM 17-A (ANNUAL REPORT)
Item 2. Properties The office space occupied by AEV belongs to a wholly-owned subsidiary. As a holding company, AEV does not utilize significant amounts of office space. On a consolidated basis, total property, plant and equipment of AEV were valued at π77.44 bn and π80.56 bn as of December 31, 2010 and 2009, respectively, broken down as follows:
2010 2009 Power, Plant & Equipment 73,370,137 P66,628,765 Transmission & Distribution Equipment 4,998,903 4,553,427 Machinery & Equipment 3,857,808 3,664,635 Buildings, Warehouses and Improvements 2,433,942 2,914,865 Office Furniture, Fixtures and Equipment 625,181 1,004,250 Transportation Equipment 643,719 795,628 Land 347,260 369,100 Leasehold Improvements 397,616 570,596 Ships in Operation and Improvements - 5,879,220 Containers - 1,473,737 Handling Equipment 111,525 1,288,727 Flight Equipment 301,364 351,988 Ships Under Refurbishment and Construction in Progress
1,722,190 4,827,987
Others 424,212 366,428 89,233,857 94,689,351 Less: Accumulated Depreciation and Amortization
11,789,578 14,124,359
TOTALS 77,444,279 P80,564,992 Note: Values for the above table are in Thousand pesos Locations of Principal Properties and Equipment of AEV subsidiaries are as follows:
SUBSIDIARY DESCRIPTION LOCATION/ADDRESS CONDITION
Cotabato Light & Power Company
Industrial land, buildings/plants, eqpt. & machineries
Sinsuat Avenue, Cotabato City In use for operations
Davao Light & Power Co., Inc.
Industrial land, buildings/plants, eqpt. & machineries
P. Reyes Street, Davao City; Bajada, Davao City
In use for operations
Pilmico Foods Corporation
Industrial land, buildings/plants, eqpt. & machineries
Kiwalan cove, Dalipuga, Iligan City In use for operations
Hedcor, Inc. Hydropower plants
Kivas, Banengneng, Benguet; Beckel, La Trinidad, Benguet; Bineng, La Trinidad, Benguet; Sal-angan, Ampucao, Itogon, Benguet; Bakun, Benguet
In use for operations
Hedcor Sibulan, Inc. Hydropower plant Santa Cruz, Sibulan, Davao del Sur In use for operations
Cebu Private Power Corporation
Bunker C thermal power plant
Cebu City, Cebu In use for operations
East Asia Utilities Corporation Bunker C thermal plant Lapu-lapu City, Mactan, Cebu In use for
operations

44 • SEC FORM 17-A (ANNUAL REPORT)
SUBSIDIARY DESCRIPTION LOCATION/ADDRESS CONDITION
AP Renewables, Inc. Geothermal power plants
Tiwi, Albay Caluan, Laguna Sto. Tomas, Batangas
In use for operations
Therma Marine, Inc. Barge-mounted diesel power plants
Nasipit, Agusan del Norte Barangay San Roque, Maco, Compostela Valley
In use for operations
Aboitiz Transport System Corp.
Cargo handling equipment
Eva Macapagal Super Terminal, Manila South Harbor; Cebu International Port
In use for operations
Pilmico Animal Nutrition Corporation
Industrial land, building/plant equipment & machineries
Barangay Sto. Domingo II, Capas, Tarlac
In use for operations
Item 3. Legal Proceedings Material Pending Legal Proceedings AEV and its subsidiaries and affiliates are involved in various legal actions, most of which occur in the ordinary course of business. However, AEV does not expect that the results of any of these actions will have a material effect on Company’s financial position. Pursuant to the Securities Purchase Agreement for the sale of the equity holdings of AEV and ACO in ATS to NENACO, AEV and ACO shall be responsible for generally all existing cases of ATS, including the prosecution or defense thereof, and the payment of any liability and cost that may arise therefrom. The potential amount of liability from the cases is approximately π73 mn according to latest estimates. AEV and ACO shall be responsible for the cases in accordance with their respective equity holdings in ATS prior to the sale to NENACO. Item 4. Submission of Matters to a Vote of Security Holders There were no matters submitted to a vote of security holders during the fourth quarter of the fiscal year covered by this report.
PART II - OPERATIONAL AND FINANCIAL INFORMATION Item 5. Market for Issuer’s Common Equity and Related Stockholder Matters (1) Market Information AEV’s common shares are traded on the Philippine Stock Exchange. The high and low stock prices of AEV’s common shares for each quarter within the past two years and first quarter of 2011 were as follows:
2011 2010 2009 High Low High Low High Low First Quarter 47.00 33.30 14.00 9.00 6.40 5.30 Second Quarter NA NA 21.00 13.75 6.90 5.50 Third Quarter NA NA 25.25 19.50 7.50 6.10 Fourth Quarter NA NA 40.50 24.50 9.30 7.50

45 • SEC FORM 17-A (ANNUAL REPORT)
As of February 28, 2011, AEV has 10, 581 shareholders. Common shares outstanding as of the same date totaled 5,521,871,821. The closing price of AEV common shares as of March 31, 2011 is π41.10 per share. (2) Holder The top 20 stockholders of AEV as of 28 February 2011 are as follows:
STOCKHOLDERS NATIONALITY COMMON SHARES
PREFERRED SHARES TOTAL SHARES
% TO TOTAL COMMON SHARES ISSUED
1 Aboitiz & Company, Inc. Filipino 2,735,600,915 2,735,600,915 49.54%
2 PCD Nominee Corporation Filipino 644,656,703 644,656,703 11.67%
3 Ramon Aboitiz Foundation Inc. Filipino 420,915,863 420,915,863 7.62%
4 PCD Nominee Corporation Other Alien 153,658,453 153,658,453 2.78%
5 Sanfil Management Corporation Filipino 116,790,211 116,790,211 2.12%
6 Lekeitio & Company, Inc. Filipino 91,876,977 91,876,977 1.66%
7 Tricanaya Development Corporation Filipino 82,099,033 82,099,033 1.49%
8 INXS Holdings Corporation Filipino 78,595,677 78,595,677 1.42%
9 Midcita Management & Development Corporation
Filipino 62,176,225 62,176,225 1.13%
10 Chanton Management & Development Corporation Filipino 62,118,484 62,118,484 1.12%
11 Windemere Management Corporation Filipino 47,666,352 47,666,352 0.86%
12 Unionbank TISG as Investment Manager for IMA #4B1-166-10
Filipino 44,916,639 44,916,639 0.81%
13 Donya 1 Management Corporation Filipino 43,136,359 43,136,359 0.78%
14 Aboitiz Equity Ventures, Inc. Retirement Fund
Filipino 40,930,592 40,930,592 0.74%
15 Morefund Management & Development Corporation
Filipino 40,000,000 40,000,000 0.72%
16 Anso Management Corporation Filipino 34,369,707 34,369,707 0.62%
17 Carcovich, Teresita or John Filipino 33,463,510 33,463,510 0.61%
18 Bauhinia Management, Inc. Filipino 32,643,799 32,643,799 0.59%
19 Carcovich, John Filipino 29,708,268 29,708,268 0.54%
20 Emetasi Holdings, Inc. Filipino 29,093,985 29,093,985 0.53%
SUBTOTAL 4,824,417,752 0 4,824,417,752 87.37%
Other Stockholders 697,454,069 150,000,000 847,454,069 12.63%
TOTAL SHARES 5,521,871,821 150,000,000 5,671,871,821 100.00%
NET ISSUED AND OUTSTANDING SHARES
5,521,871,821 0 5,671,871,821

46 • SEC FORM 17-A (ANNUAL REPORT)
(3) Dividends The cash dividends declared by AEV to common stockholders from fiscal year 2010 to the first quarter of 2011 are shown in the table below:
Year Cash Dividend Per Share
Total Declared Record Date
2011 P1.58 P8.7 bn 3/17/2011 2010 P0.52 P2.9 bn 3/24/2010 2009 P0.27 P1.5 bn 2/26/2009
In a special meeting held on January 11, 2007, the AEV Board of Directors approved the policy of distributing at least one-third of its previous year’s earnings as cash dividends to its stockholders for subsequent years. (4) Recent Sales of Unregistered or Exempt Securities, Including Recent Issuance of Securities
Constituting an Exempt Transaction
(a) On November 28, 2006, AEV signed an Issue Management and Underwriting Agreement with BPI Capital Corporation (BPI Capital) as Issue Manager for the issuance of 150 mn cumulative, non-voting, nonparticipating, non-convertible, 5-year (Series “E”) and 7-year (Series “F”) redeemable preferred shares at the offer price of π10.00 per share, or for a total offering price of π1.5 bn. BPI Capital was the lead underwriter, PCI Capital Corporation, co-lead underwriter and First Metro Investment Corporation, BDO Capital & Investment Corporation, Multinational Investment Bancorporation, Citicorp Capital Philippines, Inc. and Union Bank of the Philippines were underwriters for the offer. AEV paid the amount of π7.5 mn as underwriting commission, excluding taxes for the issuance of the preferred shares.
Series “A” and “D” were redeemed on December 6 and 13, 2009, respectively. On December 6, 2006, AE V exercised its early redemption option over its Series “B” and “C” preferred shares at 105% of the face value plus accrued interest, and simultaneously issued new Series “E” and “F” preferred shares. Part of the proceeds from the issuance of new Series “E” and “F” preferred shares were used to finance the redemption of the Series “B” and “C” preferred shares. The Series “E” with fixed dividend rate of 8.25% per annum, and “F” with fixed dividend rate of 8.5% per annum preferred shares were issued to qualified buyers only pursuant to Section 10.1 (l) of the Securities Regulation Code. Below is the list of subscribers to the Series “E” and “F” preferred shares as of February 28, 2011:
Subscriber's Name Purchaser
Qualification Shares Purchased
% to Total Preferred
Shares Issued
SERIES E First Metro Investment Corporation Qualified Buyer 6,400,000 4.27%
Metrobank Trust Banking as Trustee Qualified Buyer 600,000 0.40%
Metrobank Trust Banking as Investment Manager for Private Education Retirement Annuity
Qualified Buyer 500,000 0.33%
Pioneer Life, Inc. Qualified Buyer 300,000 0.20%BPI AMTG as Investment Manager for Ayala Fixed Income Fund, Inc. Qualified Buyer 3,500,000 2.33%Congregation of the Most Holy Redeemer Qualified Buyer 1,080,000 0.72%Equitable PCI Bank Trust as Trustee for Various Accounts Qualified Buyer 7,500,000 5.00%
UCPB Trust Banking Division FAO Various Trust Accounts Qualified Buyer 1,000,000 0.67%Perla Compania de Seguros, Inc. Qualified Buyer 200,000 0.13%
Cibeles Insurance Corporation Qualified Buyer 300,000 0.20%

47 • SEC FORM 17-A (ANNUAL REPORT)
Subscriber's Name Purchaser
Qualification Shares Purchased
% to Total Preferred
Shares Issued
Mapfre Insular Insurance Corporation Qualified Buyer 5,000,000 3.33%SM Prime Holdings, Inc. Qualified Buyer 10,000,000 6.67%The Insular Life Assurance Co., Ltd. Qualified Buyer 10,000,000 6.67%BPI AMTG as Investment Manager for PERAA Qualified Buyer 10,000,000 6.67%
BPI AMTG as Trustee for Various Trust Accounts Qualified Buyer 21,400,000 14.27%BPI AMTG as Investment Manager for Ayala Fixed Income Fund, Inc. Qualified Buyer 4,100,000 2.73%PCI Capital Corporation Qualified Buyer 7,000,000 4.67%
Knights of Columbus Fraternal Association of the Philippines Qualified Buyer 3,000,000 2.00%Beneficial PNB Life Insurance Co., Inc. Qualified Buyer 3,000,000 2.00%BDO Capital & Investment Corp. Qualified Buyer 5,000,000 3.33%Landbank of the Philippines Qualified Buyer 120,000 0.08%
TOTAL (SERIES E) 100,000,000
Subscriber's Name Purchaser
Qualification Shares Purchased
% to Total Preferred
Shares Issued
SERIES F PCI Capital Corporation Qualified Buyer 7,000,000 4.67%
Knights of Columbus Fraternal Association of the Philippines Qualified Buyer 3,000,000 2.00%
Beneficial PNB Life Insurance Co., Inc. Qualified Buyer 3,000,000 2.00%
BDO Capital & Investment Corp. Qualified Buyer 5,000,000 3.33%Landbank of the Philippines Qualified Buyer 120,000 0.08%
TOTAL (SERIES F) 50,000,000
TOTAL 150,000,000
AEVshall redeem the preferred shares at the end of the corresponding agreed periods from issue dates (final redemption dates) regardless of the existence of unrestricted retained earnings or other amounts legally available for the payment of dividends in such period, provided that the issuer has, after redemption, sufficient assets in the books to cover debts and liabilities inclusive of capital stock, and subject to the Issuer’s compliance with the applicable laws, rules and regulations, and SEC requirements. The final redemption dates are, as follows: (1) December 2011 for series “E”; and (2) December 2013 for series “F”. The preferred shares shall be redeemed through cash payment of 100% of the issue price plus all accrued and unpaid cash dividends on the final redemption date.
(b) On May 14, 2010, AEV signed a Notes Facility Agreement with a consortium of primary institutional lenders for the issuance of 6-year peso-denominated corporate fixed rate notes (“Notes”) in the principal aggregate amount of up to π2.5 bn through a private placement to not more than 19 institutional investors pursuant to SRC Rule 9.2 (2) (B). First Metro Investment Corporation and Metropolitan Bank & Trust Company – Trust Banking Group acted as the Arranger and Notes Facility Agent respectively. The proceeds of the Notes were used to fund AEV’s investments in various projects, including capital expenditures and acquisitions.

48 • SEC FORM 17-A (ANNUAL REPORT)
The corporate notes were issued to the following institutional investors:
NOTEHOLDERS AMOUNT DUE
The Insular Life Assurance Co., Ltd. 700,000,000Metropolitan Bank & Trust Company - Trust Banking Group as Investment Manager for 3011-00131-10
50,000,000
Metropolitan Bank & Trust Company - Trust Banking Group as Investment Manager for 3011-00011-10
50,000,000
Metropolitan Bank & Trust Company - Trust Banking Group as Investment Manager for 3011-00133-10
50,000,000
Metropolitan Bank & Trust Company - Trust Banking Group as Investment Manager for 3011-00132-10
50,000,000
Metropolitan Bank & Trust Company - Trust Banking Group as Investment Manager for 3011-00141-09
20,000,000
Metropolitan Bank & Trust Company - Trust Banking Group as Investment Manager for 3011-00001-09
50,000,000
Metropolitan Bank & Trust Company - Trust Banking Group as Investment Manager for 3015-00064-06
145,000,000
Metropolitan Bank & Trust Company - Trust Banking Group as Investment Manager for 3011-00064-09
35,000,000
The Philippine American Life & General Insurance Co. 440,000,000Social Security System 250,000,000Metropolitan Bank & Trust Company - Trust Banking Group as Investment Manager for De La Salle University
50,000,000
Metropolitan Bank & Trust Company - Trust Banking Group as Investment Manager for Xavier School
50,000,000
Metropolitan Bank & Trust Company - Trust Banking Group as Investment Manager for The Government Service Insurance System
50,000,000
First Metro Investment Corporation 200,000,000Metropolitan Bank & Trust Company 200,000,000Philippine Savings Bank 110,000,000
TOTAL 2,500,000,000
(c) On November 23, 2010, AEV signed a Notes Facility Agreement with a consortium of primary institutional lenders for the issuance of 5-year and 1 day peso-denominated corporate fixed rate notes (“Notes”) in the principal aggregate amount of up to π1.5 bn through a private placement to not more than 19 institutional investors pursuant to SRC Rule 9.2 (2) (B). BPI Capital Corporation and Bank of the Philippine Islands - Asset Management and Trust Group acted as the Arranger and Notes Facility Agent respectively. The proceeds of the Notes were used for refinancing and for general corporate use of AEV.
NOTEHOLDERS AMOUNT DUE
Bank of the Philippine Islands 500,000,000BPI AMTG as Investment Manager for ALFM Peso Bond 700,000,000BPI AMTG as Trustee 300,000,000
TOTAL 1,500,000,000 The underwriting fees paid to the Arrangers of the π2.5 bn and π1.5 bn corporate notes were π10.7 mn and π4 mn, respectively.

49 • SEC FORM 17-A (ANNUAL REPORT)
Item 6. Management’s Discussion and Analysis or Plan of Action Year ended December 31, 2010 vs. Year ended December 31, 2009 The following discussion and analysis of the Company’s consolidated financial condition and results of operations should be read in conjunction with the consolidated financial statements and accompanying schedules and disclosures set forth elsewhere in this report. With the sale of the Company’s investment in Aboitiz Transport System Corp. (ATS) in December, 2010, the 2010 net loss of ATS Group, except Aboitiz Jebsen Bulk Transport Corp, (AJBTC), Jebsen Maritime, Inc. (JMI) and Aboitiz Jebsen Manpower Solutions, Inc. (AJMSI), is reported separately under the item “Net Income (Loss) from Discontinued Operations” in the AEV consolidated income statement. ATS’s 2010 profit and loss (P&L) items are no longer reported on a line-by-line consolidation. To be comparative with the 2010 presentation, the AEV consolidated income statements for 2009 and 2008 are re-presented to also deconsolidate ATS’s P&L accounts, and instead, reflect its net income under “Net Income (Loss) from Discontinued Operations”. The 2010 AEV consolidated balance sheet no longer includes the ATS Group accounts as a consequence of the sale of ATS. This results in the substantial decrease in certain AEV balance sheet items when 2010 account balances are compared with those of 2009, considering that ATS was still consolidated in 2009. On the other hand, with the Group’s step-acquisition of almost the entire stake in City Savings Bank (CSB) during the 4th quarter of 2010, CSB is now treated as a subsidiary, and consequently, is consolidated in AEV’s financial statements starting 2010. The first-time consolidation of CSB accounts causes the upward movements of certain income statement and balance sheet items in 2010 when compared to 2009, considering that CSB, formerly an associate, was still not consolidated in 2009. Top Five Key Performance Indicators Management uses the following indicators to evaluate the performance of registrant Aboitiz Equity Ventures, Inc. (“AEV” or the “Company” or the “Parent Company”) and its subsidiaries (the Company and its subsidiaries are hereinafter collectively referred to as the “Group”): Key Performance Indicators (Amounts in thousands except financial ratio data)
DEC 31/2010 DEC 31/2009
EQUITY IN NET EARNINGS OF INVESTEES 6,843,156 4,264,551
EBITDA 40,030,498 15,639,274
CASH FLOW GENERATED: Net cash provided by operating activities 29,550,862 11,338,049 Net cash used in investing activities (5,719,575) (26,373,366) Net cash provided by (used in) financing activities (3,254,452) 4,471,161 Net Increase (Decrease) in Cash & Cash Equivalents 20,576,835 (10,294,155) Cash & Cash Equivalent, Beginning 5,582,228 16,037,473 Cash & Cash Equivalent, End 26,097,203 5,582,228
CURRENT RATIO 2.36 0.79
DEBT-TO-EQUITY RATIO 1.23 1.62

50 • SEC FORM 17-A (ANNUAL REPORT)
Description of Key Performance Indicators:
1. EQUITY IN NET EARNINGS OF INVESTEES. Equity in net earnings (losses) of investees represents the group’s share in the undistributed earnings or losses of its investees for each reporting period subsequent to acquisition of said investment, net of goodwill impairment cost, if any. Goodwill is the difference between the purchase price of an investment and the investor’s share in the value of the net identifiable assets of investee at the date of acquisition. Equity in net earnings (losses) of investees indicates profitability of the investments and investees’ contribution to the Group’s consolidated net income.
Manner of Computation: Investee’s Net Income (Loss) x Investor’s % Ownership - Goodwill Impairment Cost
2. EARNINGS BEFORE INTEREST, TAXES, DEPRECIATION & AMORTIZATION (EBITDA). The
Company computes EBITDA as earnings before extra-ordinary items, net finance expense, income tax provision, depreciation and amortization. It provides management and investors with a tool for determining the ability of the Group to generate cash from operations to cover financial charges and income taxes. It is also a measure to evaluate the Group’s ability to service its debts and to finance its capital expenditure and working capital requirements.
3. CASH FLOW GENERATED. Using the Statement of Cash Flows, management determines
the sources and usage of funds for the period and analyzes how the Group manages its profit and uses its internal and external sources of capital. This aids management in identifying the impact on cash flow when the Group’s activities are in a state of growth or decline, and in evaluating management’s efforts to control the impact.
4. CURRENT RATIO. Current ratio is a measurement of liquidity, calculated by dividing
total current assets by total current liabilities. It is an indicator of the Group’s short-term debt paying ability. The higher the ratio, the more liquid the Group.
5. DEBT-TO-EQUITY RATIO. Debt-to-Equity ratio gives an indication of how leveraged
the Group is. It compares assets provided by creditors to assets provided by shareholders. It is determined by dividing total debt by stockholders’ equity.
Discussion on Key Performance Indicators: 2010 is another record year for AEV, and again, all the key performance indicators exceeded management’s expectations. Equity in net earnings of investees registered a 60.5% year-on-year (“YoY”) increase. This improvement was attributed to the strong performance of Union Bank of the Philippines (UBP) and the majority of the power associates. Bulk of the increase was coming from the growth in the combined income contributions of VECO, SNAP-Magat and SNAP-Benguet due to significant upsurge in revenues. Likewise, UBP contributed higher earnings during the current year on the back of higher net interest margins and trading gains. The 156% increase in EBITDA was attributable to the rise in equity earnings of associates and the robust gross profit generated by the group as a result of higher revenues and effectively-controlled costs and expenses. The full year gross margin contributions of Aboitiz Power Renewable Inc. (“APRI”) and Therma Luzon, Inc. (“TLI”) which started commercial operations in June, 2009 and October, 2009, respectively, the fresh gross profit contributions of Therma Marine, Inc. (“TMI”) and Hedcor Sibulan, Inc. (“HSI”) which commenced commercial operations in February, 2010, and March, 2010, respectively, and the first time consolidation of CSB gross income also significantly enhanced this growth in EBITDA.

51 • SEC FORM 17-A (ANNUAL REPORT)
The improvement in both current and debt-to-equity ratios from year-end 2009 levels was mainly due to the combined effect of the increase in current assets and the decline in current liabilities, and the increase in equity which more than offset the increase in consolidated liabilities, respectively. The higher level of current assets was mainly attributed to the movement in cash and trade and other receivables which correspondingly rose with the higher volume of revenues generated during the period in review. Equity attributable to equity holders of the parent also registered a commendable growth with the π21.86 billion net income recorded during the current year, net of the π2.87 billion cash dividends paid by AEV parent. Operating in a challenging economic environment and dealing with external market volatilities, management teams across the Group strive to effectively handle and monitor their respective operating performances and financial requirements. This results in the generation of positive cash inflows from operations and raising of the needed funds to finance various investments and projects, and still registering healthy financial ratios in the process. This strong financial position enables the Group to deliver higher value directly to its shareholders while continuing to invest in its growth opportunities. Period ended December 31, 2010 Results of Operations For the year ended December 31, 2010, AEV and subsidiaries posted a consolidated net income of π21.86 billion, a 163% YoY increase, which translated to a π3.96 in earnings per share. This impressive operating performance was driven by robust income contributions of the majority of the industry groups, with the power group still accounting for the lion’s share at 85% and followed by the banking and food groups at 12% and 7% each, offsetting transport group’s negative share. The group recorded a non-recurring net gain of π30 million (versus π961 million in 2009), attributable to the π786 million foreign-exchange gains recognized in the revaluation of dollar-denominated liabilities under an appreciating Philippine peso scenario, net of its π304 million share in one of the power associate’s refinancing cost and the π456 million loss recognized on the sale of ATS. Sans one-off items, AEV’s core net income grew at a very healthy rate of 197% YoY, from π7.34 billion to π21.84 billion. Power Aboitiz Power Corp. (“AP”) and its subsidiaries ended the current year with an income contribution of π19.13 billion, a 342% jump YoY. The power generation group recorded a 424% YoY surge in earnings contribution to AEV, from π3.56 billion to π18.63 billion, mainly due to the 111% increase in total attributable power sales, from 4,619 GWh to 9,762 GWh. This revenue growth substantially resulted from the fresh contributions of Therma Marine, Inc. (“TMI”), the owner of the two power barges, and Hedcor Sibulan, Inc. (“HSI”), the owner of the Sibulan plant. Aboitiz Power Renewable Inc. (“APRI”), the owner of the Tiwi- Makban geothermal power plants which were turned over in May 2009, and Therma Luzon, Inc. (“TLI”), the IPP administrator of the Pagbilao plant starting October, 2009, also contributed to the growth with their respective full year contributions in 2010. As at December 31, 2010, AP’s attributable capacity was at 2,051 MW, posting an 18% YoY increase, with the takeover of the two 100 MW power barges in the first quarter of 2010 and the start of operations of the 42.5 MW Sibulan hydro power and the 26%-owned 246-MW Cebu coal-fired power plant in 2010. This remarkable performance of the generation group could also be attributed to: a.) improved pricing and volume sales as average selling prices for bilateral contracts and transactions in the spot market significantly grew by 42% and 183% YoY, respectively; and b.) the spike in ancillary revenues generated by Magat and Binga hydropower plants. The power distribution group likewise posted a 23% YoY improvement in earnings contribution to AEV, from π1.2 billion to π1.48 billion. Its attributable electricity sales rose by 9% YoY, from 3,322

52 • SEC FORM 17-A (ANNUAL REPORT)
GWh to 3,606 GWh, as power consumption of the residential, commercial and industrial customers increased by 6%, 5% and 11%, respectively. Customer base still grew, with the residential and non-residential segments increasing by 4% and 3%, respectively. The growth in GWh sales, coupled with the implementation of the rate increase (under a Performance Based Regulation scheme) by two power distribution utilities in August, 2010 and the full year effect of a rate increase (under the Return on Rate Base scheme) effected by one of these two firms, more than compensated for the higher expenses incurred during the first half of 2010. These higher expenses resulted from the operation of the back-up power plant of a Davao-based distribution utility to provide the much-needed power to the Mindanao grid, and the reduction in the systems loss allowance in January 1, 2010, from 9.5% to 8.5%. Financial Services Income contribution from the financial services group registered a 45% YoY improvement, from previous year’s π1.81 billion to π2.63 billion. UBP ended the current year with an earnings contribution of π2.31 billion, up by 35% YoY, while CSB’s share in earnings was P315 million, up 228% YOY. The main drivers of this growth were the impressive operating performances of both banks and AEV’s increased ownership in both. UBP’s 2010 net income increased to π5.35 billion (vs π4.32 billion in 2009) mainly due to the 9% YoY expansion in net interest income to π7.07 billion. This improvement was attributable to the 13% YoY reduction in the bank’s interest expense, which more than offset the 1% YoY decrease in interest income mainly resulting from lower average asset yields. The 4% increase in trading gains and other non-interest revenues and the 73% decline in provision for loan impairment losses also added to the bank’s bottomline growth. The 78% YoY increase in CSB’s net income, from π280 million in 2009 to π499 million in 2010, was attributed mainly to the 40% growth in its interest income on loans and service fees as total loan booked during the year was up by π1.6 billion to π6.5 billion. Transport The transport group ended the current year with a net loss contribution of π821 million, in contrast to last year’s net income contribution of π387 million. This was mainly attributable to the substantial increase in operating expenses brought about by higher international charter rates and fuel costs. Food For the period under review, income contribution from Pilmico Foods Corporation (“PFC”) and its subsidiaries amounted to π1.53 billion, up 25% YoY. In the flour division, increase in sales volume more than offset the decline in average selling price, resulting to a 79% YoY improvement in its income contribution. The swine business’ earnings contribution likewise improved by 34% YoY due to higher margins coming from increases in both sales volume and selling prices, complemented by lower input costs and enhanced operating efficiencies. These increases more than offset the 9% dip in feeds division’s income contribution resulting from lower average selling price and higher input costs. Material Changes in Line Items of Registrant’s Statements of Income and Comprehensive Income For full year 2010, AEV’s consolidated net income attributable to equity holders registered a 163% growth, reachingπ.86 billion from π8.31 billion posted in 2009. From continuing operations, operating profit for the current year amounted to π28.87 billion, a 304% increase from the π7.14 billion generated in 2009. This improvement was brought about by the π39.62 billion increase in consolidated revenues, which more than offset the π17.9 billion increase in costs and expenses. All the industry groups recorded higher operating margins during the year under review.

53 • SEC FORM 17-A (ANNUAL REPORT)
Power subsidiaries reported a combined 381% YoY increase in operating margins resulting from the 157% growth in consolidated revenues which surpassed the corresponding hike in costs and expenses. Improvement in revenues (π59.55 billion in 2010 vs π23.17 billion in 2009) was largely due to the full year contributions of APRI and TLI which started commercial operations in May and October, 2009, respectively, and the new contributions TMI and HSI which commenced operations in February and March, 2010, respectively. The 88% rise in consolidated costs and expenses (π33.28 billion in 2010 vs π17.72 bllion in 2009) was mainly due to the operating costs of these same companies which accounted for 76% of the total increase. Food group reported a 38% YoY increase in operating margins as the π1.83 billion increase in revenues more than compensated for the π1.29 billion rise in costs and expenses. The 16% rise in sales (π12.88 billion in 2010 vs π11.05 billion in 2009) was largely attributed to the higher sales volume of flour, feeds and swine and better selling prices of swine. The 13% increase in costs (π10.92 billion in 2010 vs π9.63 billion in 2009) was mainly attributed to the higher cost of raw materials for feeds, which was partially tempered by the lower average wheat costs for flour and the decrease in operating costs for swine resulting from enhanced operating efficiencies of the company-owned farms. The newly-consolidated operating margins of CSB amounting to π652 million also contributed to the growth in AEV consolidated operating profit. Share in net earnings of associates registered a 60.5% YoY improvement (π6.84 billion in 2010 vs π4.26 billion in 2009) primarily due to the strong performances of the majority of the power associates and UBP. Bulk of the increase was coming from the growth in the combined income contributions of VECO, SNAP-Magat and SNAP-Benguet due to rise in revenues. UBP contributed higher earnings during the current year on the back of higher net interest margins and trading gains, coupled with the increased ownership of AEV in said bank. The growth in consolidated operating profit and equity earnings was enhanced by the increase in other income and partially offset by the rise in net interest expense and provision for income tax. Other income increased by 14% (π2.06 billion in 2010 vs π1.81 billion in 2009) as foreign exchange gains inched up by π827 million mainly due to the restatement of the dollardenominated debt of the power group under an appreciating peso scenario as of year-end 2010. Said increase was partially offset by the Company’s non-duplication in 2010 of the reversal made in 2009 of a π575 million impairment provision that was set up in 2008 on its ATS investment. The π4.14 billion increase in net interest expense (π6.87 billion in 2010 vs π2.74 billion in 2009) was due to higher average debt level in 2010, which included the finance lease obligation booked by TLI in October, 2009. This finance lease obligation generated π5.12 billion in accreted interest expense in 2010 (vs π1.23 billion in 2009). The π586 million increase in provision for income tax (π1.62 billion in 2010 vs π1.04 billion in 2009) was mainly due to the π290 million rise in power group’s tax provision resulting from higher taxable income, and the newly-consolidated π212 million tax provision of CSB. The discontinued operations posted a π1.47 billion net loss in 2010, a 388% decline from the π510 million net income in 2009. The 2010 net loss contribution consisted of the π734 million net loss of ATS and some of its subsidiaries (also referred to as Disposal Group), the π276 million eliminated gain on sale of Aboitiz Jebsen shares, and the π456 million loss recorded by AEV parent on its sale of ATS. The disposal group registered a net loss in 2010 mainly due to the decrease in operating margins. This drop in operating margins resulted from the increase in costs and expenses which was principally attributed to higher international charter rates and fuel costs. The 261% increase in net income attributable to minority interests was mainly due to the significant surge in power group’s net income, 24% of which, belongs to minority shareholders, and the first-time consolidation of π184 million minority interest’s share in CSB net income.

54 • SEC FORM 17-A (ANNUAL REPORT)
AEV’s consolidated comprehensive income attributable to equity holders rose by 157%, from π8.65 billion in 2009 to π22.21 billion in 2010. This was mainly due to the increase in net income (π21.86 billion in 2010 vs π8.31 billion in 2009) as other comprehensive income registered a very minimal decline. Changes in Registrant’s Resources, Liabilities and Shareholders Equity Assets Compared to year-end 2009 levels, consolidated assets increased 22% to π174.97 billion as of December 31, 2010, due to the following:
a. Cash & Cash Equivalents increased by π20.51 billion mainly due to higher funds held by AEV parent and power group. For AEV parent, the increase was due to unused proceeds from the additional debt availed and the sale of its ATS investment in 2010. For power group, the upsurge in its EBITDA translated to higher excess cash at year-end 2010.
b. Trade and Other Receivables rose by 106% from π7.63 billion to π15.7 billion, primarily
due to the newlyconsolidated receivables of CSB amounting to π6.97 billion and the fresh receivables of TMI and HSI, and the rise in trade receivables of APRI and TLI resulting from higher sales, which accounted for π2.32 billion of the increase. This growth was partially offset by the π1.88 billion deconsolidated receivables of ATS.
c. Inventories increased by 25% (π4.08 billion vs π3.27 billion) mainly due to the π735
million spike in power group’s inventory resulting from higher cost of coal of TLI and the newly-consolidated fuel and spare parts inventory ofTMI, and the π638 million rise in wheat inventory of the food group. Said increase was partially offset by the π567 million deconsolidated inventory of ATS.
d. Intangible Asset - Service Concession Rights increased by π55 million due to the capital
expenditures incurred by one of AP’s ecozone subsidiaries. e. Investment Properties increased by π96 million due to the newly-consolidated
properties of CSB.
f. Investments and Advances totalled π44.85 billion, up by 16% from year-end 2009 level of π38.57 billion. This increase was mainly attributed to the following: (1) π647 million purchase of additional UBP shares; (2) π1.0 billion capital infusion into SNAP-Benguet to finance the on-going Ambuklao plant rehabilitation; (3) P1.09 billion stockholder’s advances given to LHC and RP Energy; (4) recognition of a π387 million share in unrealized valuation gains on UBP’s AFS investments; and (5) increase in accumulated equity earnings coming from the π6.88 billion share in associates’ net earnings recorded during the year, reduced by the π2.14 billion cash dividends received from certain associates. The π1.26B redemption of EAUC preferred shares and the π279 million step-acquisition of CSB to a subsidiary partially offset the increase.
g. Pension Asset increased by π74 million resulting from the one-time funding of power
group’s past service liabilities in 2010. The above increases were tempered by the following decreases in:
a. Property, Plant & Equipment (PPE) which declined by π3.12 billion primarily due to the deconsolidation of π4.76 billion PPE of ATS. Said reduction was partially offset by the π1.74 billion increase attributed to the purchase of two power barges by TMI and the additional costs in the construction of Sibulan hydro-power plant.

55 • SEC FORM 17-A (ANNUAL REPORT)
b. Goodwill which dipped by 10% (π1.64 billion vs π1.81 billion) mainly due to the deconsolidated goodwill of the disposal group totalling π817 million, partially offset by the π644 million new goodwill generated from the stepacquisition of CSB in 2010.
c. Deferred Income Tax Assets which reduced by 51% (π251 million vs π514 million) mainly
due to the deconsolidation of ATS’s π245M account in 2010. d. Other Noncurrent Assets which declined by 30% (π1.43 billion vs π2.04 billion) mainly
due to: a.) the deconsolidation of ATS’s π307M account in 2010; and b.) the release of AP’s restricted cash that was used to secure a long-term loan of an associate when said loan was paid off in 2010.
Liabilities Consolidated short-term bank loans decreased by 37% (π5.67 billion in 2010 vs π9.04 billion in 2009) while long-term liabilities went up by 11% (π74.06 billion in 2010 vs π66.46 billion in 2009). The decline in short-term was mainly due to the prepayments made by power group using internally-generated funds. The upward movement in long term debt was principally due to the: a.) π4.0 billion fixed-rate notes issuance by AEV parent, proceeds of which were used to preterminate an expensive π1 billion long-term debt and the balance kept as cash over the yearend; b.) π2.69 billion net increase in the finance lease obligation of TLI resulting from interest accretion, net of the monthly payments made and foreign exchange adjustments; c.) π800 million loan availment by power subsidiary Cebu Private Power Corp., and d.) π2.13B first-time consolidated CSB long-term loans. Said increase was partially offset by the π974 million amortization payments of existing loans. The π3.68 billion increase in deposit liabilities was due to the first-time consolidation of CSB’s accounts. Income tax payable decreased by 34% mainly due to the lower levels maintained by the power group resulting from the availment of income tax holiday incentive by certain subsidiaries. Customer deposits was higher by 13% mainly due to the growth in the customer base of DLP as well as the new deposits recorded in APRI and TLI from their bilateral contracts. Deferred income tax liabilities increased by π279 million mainly due to TLI’s recognition of the corresponding income tax provision on the unrealized foreign exchange gains booked during the current period. Equity Equity attributable to equity holders of the parent increased by 44% from year-end 2009 level of π44.70 billion to π64.31 billion, mainly due to (1) the π18.99 billion increase in Retained Earnings, resulting from π21.86 billion net income recorded during current year and offset by the π2.87 billion cash dividends paid to common stockholders; and (2) the π380 million increase in Share in Unrealized Valuation Gains on AFS Investments and Underwriting Accounts of an associate resulting from the improvement in the market prices of these financial instruments as of the end of the current period. Material Changes in Liquidity and Cash Reserves of Registrant For the year ended 2010, the group continued to support its liquidity mainly from cash generated from operations and dividends received from associates. External borrowings were also a source of liquidity. Compared to the cash inflow in 2009, consolidated cash generated from operating activities in 2010 increased by π18.21 billion to π29.55 billion. This improvement was largely a result of the higher EBITDA generated during the current period, partially offset by the rise in trade receivables and inventories.

56 • SEC FORM 17-A (ANNUAL REPORT)
Net cash used in investing activities was lower at Pπ.72 billion, versus π26.37 billion in 2009, as business acquisitions slowed down during the period under review. The current year posted a π3.25 billion net cash used in financing activities, compared to the π4.74 billion net cash provided by long-term loan availments in 2009. As against last year, short-term loan prepayments and cash dividend distribution using funds generated from operations were higher while long-term loan availments were lower. For the current period, net cash inflows surpassed cash outflows, resulting to a 368% increase in cash and cash equivalents, from π5.58 billion in December, 2009 to π26.10 billion in December, 2010. Financial Ratios The improvement in current ratio, from 0.79:1 as of Dec. 2009 to 2.36:1 as of Dec. 2010, was due to the sharp increase in current assets, complemented by the decline in current liabilities. The growth in current assets was mainly attributed to the movement in cash and trade receivables which correspondingly rose with the higher volume of revenues generated during the period in review. Current liabilities dipped due to prepayment of bank loans using internally-generated funds. Likewise, debt-to-equity ratio improved, from 1.62:1 as of Dec. 2009 to 1.23:1 as of Dec. 2010, and net debt-to-equity ratio stood at 0.7x (versus year-end 2009’s 1.3x), as the increase in equity outpaced the increase in consolidated liabilities. The rise in equity attributable to equity holders of the parent was substantially the result of the π21.86 billion net income recorded during the current year. Outlook for the Upcoming Year/ Known Trends, Events, Uncertainties which may have Material Impact on Registrant Notwithstanding external and uncontrollable economic and business factors that affect its businesses, AEV believes that it is in a good position to benefit from the opportunities that may arise in the current year. Its sound financial condition, coupled with a number of industry and company specific developments, should bode well for AEV and its investee companies. These developments are as follows: Power (Generation Business) 1. Continued growth in the Company’s attributable capacity AboitizPower ended the year 2010 with an 18% YoY expansion in its total attributable generating capacity from 1,745 MW to 2,051 MW. The capacity growth was mainly due to the following: – Takeover of the two barge-mounted diesel-powered generation plants, each with a
generating capacity of 100 MW
AboitizPower, through wholly owned subsidiary TMI assumed ownership of PB 118 and PB 117 on February 6, 2010 and March 1, 2010, respectively. PB 118 is a power barge with a 100 MW bunker-fired generating facility moored at Bgy. San Roque, Maco, in Compostella Valley, Mindanao, while PB 117 is a power barge with a 100 MW bunker-fired generating facility moored at Bgy. Sta. Ana, Nasipit, Agusan del Norte, Mindanao.
AboitizPower acquired both power barges on July 31, 2009 via a successfully concluded negotiated bid with PSALM. The total purchase price for both barges is USD30 million. TMI has Ancillary Services Procurement Agreements with the NGCP. In 2010, TMI signed bilateral contracts with various distribution utilities covering approximately 75 MW in contracted capacity. These contracts are awaiting ERC approval.
– Completion of Greenfield power plant developments

57 • SEC FORM 17-A (ANNUAL REPORT)
42.5 MW Hedcor Sibulan Hydro Power Plant Project. This is a Greenfield run-of-river hydro power plant located in Barangay Sibulan, Sta. Cruz, Davao del Sur by AboitizPower’s 100% owned subsidiary, Hedcor Sibulan. The facilities, which comprise two cascading hydropower generating facilities tapping the Sibulan and Baroring rivers, are expected to generate an estimated 212 million kWh of clean and emissions-free energy annually. Plant B, which has a capacity of 26 MW, commenced its operations in May 2010, while Plant A, which has a capacity of 16.5 MW, was completed in July 2010.
246 MW Cebu Coal-fired Power Plant. The 3x82 MW coal-fired power plant in Toledo City, Cebu, which is a joint venture with Metrobank Group’s Global Business Power Corporation and Cebu-based Vivant Energy Corporation of the Garcia Group, was completed in 2010. Two units with a capacity of 82 MW each have started generating and feeding power into the Visayas Grid in February and May 2010. Construction of the last unit was completed in the fourth quarter of 2010. AboitizPower has an effective participation of 26% in the project.
Moving forward, AboitizPower’s attributable capacity is seen to further increase as the following events take place: – Rehabilitation of the Ambuklao-Binga hydropower facilities
The Company, together with its partner SN Power, is pursuing the programmed rehabilitation of both the 75 MW Ambuklao and 100 MW Binga hydro facilities. Completion of the rehabilitation of the former has been delayed due to the construction of a new headrace tunnel (“HRT”). Difficulties were encountered in completing the plugging of the existing plant HRT due to the unexpectedly larger quantity of sediments (silt and clay) in the facility compounded by the effect of Typhoon Pepeng that hit the country in 2009. The plant’s rehabilitation works are expected to be completed by the third quarter of 2011, when all three (3) units are operating, instead of end-2010 as earlier estimated. After the rehabilitation, the Ambuklao plant will have a capacity of 105 MW of renewable energy that will significantly augment supply of electrical power to the Luzon Grid. Rehabilitation works on Binga will commence in 2011, performing works on one unit per year. Completion of rehabilitation of all four units is expected by 2014, which should enhance generating capacity by 20%, to 120 MW.
– Completion of the rehabilitation of the Tiwi-Makban geothermal power facilities
100%-owned APRI is currently undertaking the rehabilitation of several units of the Tiwi-Makban geothermal power plant complex. Once completed, generation capacity and plant availability are expected to improve. At present, the Tiwi-Makban geothermal power plants have a combined estimated generation capacity of 467 MW, which is based on the plants’ peak generation in 2009. AboitizPower reckons that after completion of the rehabilitation works, generation capacity could increase to approximately 484 MW, which takes into account current steam supply and decline rates. Completion of works will be in stages, with Tiwi plants estimated to be finished by second quarter of 2011, while Makban plants by first quarter of 2012.
– Greenfield and Brownfield developments
300 MW Coal-fired Power Plant in Subic. After revisiting the power demand and supply situation in the Luzon Grid, AboitizPower’s 50%-owned RP Energy has decided to pursue its 300 MW coal-fired power plant project in the Subic Bay Freeport Zone (the “Subic Coal Project”). After re-evaluating the project, RP Energy is contemplating of increasing the planned generating capacity of the Subic Coal Project to 600 MW. The company is in talks with prospective turnkey contractors for the Engineering, Procurement and Construction contract for the project. Construction period is estimated at 36 months.

58 • SEC FORM 17-A (ANNUAL REPORT)
300 MW Coal-fired Power Plant in Davao. AboitizPower is planning to put up a 2x150MW coal-fired power plant in Davao, which is the biggest load center in the island of Mindanao. The Company is in the process of obtaining the necessary permits and government clearances. AboitizPower has already identified a location in Davao and has successfully negotiated a lease with an option to purchase. The Company has engaged engineering and environmental consultants that have initiated physical and environmental data collection. Once completed, together with all the necessary permits and approvals, construction is expected to be completed in 36 months.
150 MW Coal-fired Power Plant in Misamis Oriental. On June 28, 2010, AboitizPower and its partners in STEAG Power, owner of the 232 MW coal plant located at the Phividec Industrial Estate in Villanueva, Misamis Oriental, firmed up their collective intention to develop a third unit of approximately 150 MW capacity adjacent to the existing facility. AboitizPower and its partners agreed to maintain their shareholdings in the same proportions in the new corporation to be established for the planned additional capacity. Certain essential facilities, such as the jetty, coal handling facilities and stockyards and the 138-kV interconnection with the Mindanao Grid are to be shared with the existing facilities. Depending on the interest the market demonstrates, the agreement contemplates the possibility of another unit.
13.6 MW Tudaya 1 and 2 Hydro Power Plant Project. Wholly owned subsidiary Hedcor Tudaya will implement a Greenfield project involving the construction of run-of-river power plants to be located in the upper and downstream sections of the existing Sibulan hydro power plant, tapping the same water resource, which are the Sibulan and Baroring rivers. The two plants will have a combined capacity of 13.6 MW. Hedcor Tudaya is currently working on obtaining the water permits and environmental clearances. Target groundbreaking is by third quarter of 2011. Construction is estimated to be completed in 20 months.
11.5 MW Hedcor Tamugan Hydro Power Plant Project. In 2010, wholly owned subsidiary, Hedcor Tamugan, has reached an agreement with the Davao City Water District (DCWD) on the use of the Tamugan river. Originally planned as a 27.5 MW run-of-river facility, Hedcor Tamugan submitted a new proposal, which involves the construction of an 11.5 MW hydropower plant. Hedcor Tamugan is waiting for the City council to approve the project. Once approval and permits are secured, the two-year construction period will commence.
Other Greenfield and Brownfield developments. AboitizPower, together with its subsidiaries and associate company, is conducting feasibility studies for potential Greenfield and Brownfield projects.
• The SN Aboitiz Power Group (SNAP Group) is in the process of evaluating several
hydropower plant projects. A Brownfield project is being evaluated for its Magat hydropower plant, which involves the construction of a pumped storage that could potentially increase its capacity by at least 90 MW. The SNAP Group is likewise evaluating several Greenfield hydropower plant projects that have at least 70 MW of potential capacity each.
• 100%-owned subsidiary Hedcor, Inc. (Hedcor) is conducting feasibility studies for
potential hydropower projects located in both Luzon and Mindanao. Based on current findings, Hedcor sees the potential of building 5-50 MW plants in the identified areas. The feasibility studies are expected to be completed in two years. Once permits are secured, another two years will be needed for the actual construction of the hydro facilities.
2. Participation in the Government’s Privatization Program for its Power Assets The Company continues to closely evaluate the investment viability of the remaining power generation assets that PSALM intends to auction off.

59 • SEC FORM 17-A (ANNUAL REPORT)
AboitizPower is also keen on participating in PSALM’s public auction for the Independent Power Producer (IPP) Administrator contracts, which involves the transfer of the management and control of total energy output of power plants under contract with NPC to the IPP administrators. Distribution Business The Company remains optimistic that it will realize modest growth on its existing distribution utilities. It continually seeks efficiency improvements in its operations to maintain healthy margins. The implementation of the rate adjustment formula for the distribution companies under the performance-based regulation (PBR) is on a staggered basis. In addition to annual adjustments, PBR allows for rate adjustments in between the reset periods to address extraordinary circumstances. There is also a mandatory rate-setting every four years wherein possible adjustments to the rate take into account current situations. Cotabato Light’s 4-year regulatory period commenced on April 1, 2009 and ends on March 30, 2013. The ERC issued its final determination on Cotabato Light’s application for approval of its annual revenue requirement and performance incentive scheme under the PBR scheme covering the second year of the 4-year regulatory period. Last December 2010, Cotabato Light submitted for ERC approval its rate translation adjustments covering the third year of its regulatory period. Cotabato Light is the first distribution utility in the AboitizPower group to implement this incentive-based scheme. VECO and Davao Light are part of the third group (Group C) of private distribution utilities to shift to PBR. Both VECO and Davao Light started to implement their PBR approved rate structures in August 2010. Both companies are now preparing to file with the ERC for their rate translation adjustments for the second year of its 4 year regulatory period. SFELAPCO and SEZ are part of the fourth batch (Group D) of private distribution utilities to enter PBR. For SFELAPCO and SEZ, the regulatory reset process is on its final stages and ERC is scheduled to release before the end of March 2011 its draft determination on the applications for annual revenue requirements and performance incentive schemes for the regulatory period October 2011 to September 2015. The draft determination will be subjected to public consultations before ERC releases its final determination on June 2011. Thereafter, SFELAPCO and SEZ will be filing their respective rate design applications for the first regulatory year to be implemented from October 2011 to September 2012. The Company’s strategy in running its utilities is one of providing world-class service at the least possible cost. Providing value to its customers allows the Company credibility and the ability to successfully implement justified rate increases. This, along with a transparent and open relationship of over 70 years with the regulators, ensures the Company’s continued ability to successfully apply and implement rate increases. Market and Industry Developments Open Access and Retail Competition Per EPIRA, the conditions for the commencement of the Open Access and Retail Competition are as follows:
(a) Establishment of the WESM; (b) Approval of unbundled transmission and distribution wheeling charges; (c) Initial implementation of the cross subsidy removal scheme; (d) Privatization of at least 70% of the total capacity of generating assets of NPC in Luzon
and Visayas; and (e) Transfer of the management and control of at least 70% of the total energy output of
power plants under contract with NPC to the IPP administrators.

60 • SEC FORM 17-A (ANNUAL REPORT)
As of date, the government was able to comply with the first four conditions for the implementation of Open Access and Retail Competition. Privatized NPC generating assets in Luzon and Visayas have reached approximately 92%. The only remaining condition that has to be met is the privatization of at least 70% of NPC’s IPP contracts, which currently stands at approximately 68%. Under the Open Access and Retail Competition, an eligible contestable customer, which is defined as an end-user with a monthly average peak demand of at least 1 MW for the preceding 12 months, will have the option to source their electricitynfrom eligible suppliers that have secured a Retail Electricity Supplier license from the ERC. Eligible suppliers shall include the following:
– Generation companies that own, operate or control 30% or less of the installed generating capacity in a grid and/ or 25% or less of the national installed capacity
– NPC-Independent Power Producers with respect to capacity which is not covered by
contracts – IPP Administrators with respect to the uncontracted energy which is subject to their
administration and management – Retail Electricity Suppliers (RES) duly licensed by the ERC
The implementation of the Open Access presents a big opportunity for AP, as it has two wholly owned subsidiaries (i.e. Aboitiz Energy Solutions, Inc. and AdventEnergy, Inc.) that are licensed retail suppliers, which can enter into contracts with the eligible contestable customers. Moreover, AboitizPower’s generation assets that have uncontracted capacity will be able to have direct access to eligible contestable customers through AboitizPower’s licensed RES. Financial Services UnionBank’s initiatives on strengthening its customer franchise will continue to be at the forefront as it prioritizes customer satisfaction through enhanced retail focus and stronger sales management approach. UnionBank will continue to invest in technology, partnerships and continue to rationalize, redeploy and expand its branch network in strategic areas to maximize growth channels with respect to both deposits and loan accounts. In 2011, the bank aims to add six new branches to its end- 2010 network of 186 branches. UnionBank will continue to focus on improving the performance of its earning assets portfolio, with loan asset acquisition in the corporate, commercial and consumer sectors. It will implement a disciplined asset allocation built on good governance and effective risk management to ensure momentum of recurrent income stream. At the same time, UnionBank is focusing on improving its deposit liabilities mix by targeting low-cost funds (i.e. CASA). UnionBank will likewise continue to enhance operating efficiencies through cost containment efforts and improvements in its business processes. CitySavings will continue to strengthen its market position in its present niche by improving its products and services further. Other government employees, aside from public school teachers, and private company employees will be tapped. CitySavings plans to expand its branch network by putting up new branches and extension offices in areas outside of its present coverage. To support its expansion program, CitySavings is in the process of putting in place a new core banking system called Finacle, which is designed to improve processes and systems to better serve the bank’s growing clientele. With this system, operating efficiencies are seen to be enhanced as branch processes will be standardized and backroom operations will be automated. On March 10, 2010, the Board of Directors of AEV approved the proposal to acquire up to 60% ownership of CitySavings, with the remaining 40% equity to be acquired by Pilmico. The combined

61 • SEC FORM 17-A (ANNUAL REPORT)
purchase by AEV and Pilmico is valued at approximately P1.36 billion. The Monetary Board of the Bangko Sentral ng Pilipinas approved the transaction in November 2010. As of end- 2010, AEV’s effective ownership in CitySavings was 99.25%. Food Manufacturing In line with the company’s logistics initiatives to mitigate higher freight cost, Pilmico has implemented dredging works in its harbor in Iligan to enable it to accommodate higher tonnage vessels. Completion is estimated by end of 2011. The company will likewise invest in a pneumatic unloader to improve its unloading capacity. The expansion of Pilmico’s Iligan feedmill was completed in July 2010, which involved the construction of a second production line. Commercial operation began in October 2010. The new production line has an estimated annual capacity of 115,000 metric tons, effectively doubling the total production capacity of the Iligan facility. In 2011, Pilmico is planning to construct silos to support the storage requirements of the second production line. Completion is expected after one year. The company is in the process of completing the documentation for the ISO certification of its Iligan feedmill. It aims to obtain said certification by 2011. The same is being done for PANC’s Tarlac feedmill. PANC is a wholly owned subsidiary of Pilmico. For its swine business, investments were largely made in expanding its breeding herds starting in 2009 where benefits were reaped starting in 2010. PANC aims to continue this expansion phase and plans to construct a nursery farm which will increase the take-off age of piglets, thereby improving mortality. The company also plans to build additional company-owned finisher farms given the efficiencies of the newly completed finisher farms that became operational in 2010. Transport On December 28, 2010, Negros Navigation Co. purchased the entire shareholdings of AEV and ACO in ATS at an equity valuation of USD105 million, or USD0.043 per share. Using agreed spot exchange rate, this translated to a P1.8813 per share acquisition price. With AEV’s 77% stake in ATS, AEV received approximately P3.55 billion. The sale includes all the logistics and shipping businesses of ATS, except its interest in its joint venture companies with the Jebsen Group of Norway. AEV acquired, prior to closing, the 62.5 % equity stake of ATS in the ship management, manning and crew management and bulk transport. Year ended December 31, 2009 vs. Year ended December 31, 2008 Key Performance Indicators for 2009 and 2008 are as follows:
Dec 31/2009
Dec 31/2008
EQUITY IN NET EARNINGS OF INVESTEES 4,264,551 3,631,338
EBITDA 15,639,274 8,607,000
CASH FLOW GENERATED: Net cash provided by operating activities 11,785,904 2,027,018 Net cash used in investing activities (26,735,726) (7,402,511) Net cash provided by (used in) financing activities 4,655,667 2,961,164 Net Decrease in Cash & Cash Equivalents (10,294,155) (2,414,329) Cash & Cash Equivalent, Beginning 16,037,473 17,986,518 Cash & Cash Equivalent, End 5,582,228 16,037,473

62 • SEC FORM 17-A (ANNUAL REPORT)
CURRENT RATIO 0.79 1.90
DEBT-TO-EQUITY RATIO 1.62 0.62 Note: Amounts in thousands except financial ratio data. All the key performance indicators exceeded management’s expectations during the year under review. Despite the anticipated downward trend of LHC net income as a result of its declining capacity fee rate structure and the non-recurrence of 2008 provision reversals, and the lower income contribution of STEAG Power due to the decrease in coal margins, equity in net earnings of investees registered a 19% year-on-year (YOY) increase. This improvement was attributed to the strong performance of the bank associates which generated higher net interest margins, trading gains and other non-interest revenues during the current year. The spike in their income contributions more than offset the decrease in equity earnings from the two power associates. The 82% increase in EBITDA was attributable to the rise in equity earnings of associates and the robust gross profit generated by the Group as a result of higher revenues and effectively-controlled costs and expenses. The fresh gross margin contributions of the newly-acquired subsidiaries, APRI and Therma Luzon, also significantly enhanced this growth in EBITDA. Current ratio declined and debt-to-equity ratio increased from year-end 2008 levels mainly due to AP’s deployment of funds and issuance of additional fixed-rate notes and retail bonds to finance its various investing activities in 2009. Despite today’s challenging economic environment and external market volatilities, management teams across the Group continue to effectively handle and monitor their respective operating performances and financial requirements. This results in the generation of positive cash inflows from operations and raising of the needed funds to finance various investments and projects, and still registering healthy financial ratios in the process. This strong financial position enables the Group to deliver higher value directly to its shareholders while continuing to invest in its growth opportunities. Results of Operations For the year 2009, AEV posted a consolidated net income of π8.31 billion, a 102% YOY increase, which translated to a π1.49 in earnings per share. This record performance was driven by robust income contributions of all the industry groups, with the power group still accounting for the lion’s share at 56%, followed by the banks at 23%, the food group at 16% and the transport group at 5%. In 2009, the group generated a non-recurring income of π961 million, which includes (1) a foreign exchange net gain of π380 million at the parent and subsidiary levels; (2) a π575 million reversal of impairment provision and a π58 million revenue from the forfeited option money booked by AEV parent in consideration of the aborted sale of its investment in ATS; (3) a π78 million share in the reversal of NPC charges for ancillary services to two of AP’s generation companies, and (4) an P84 million share in the gains booked by ATS on the sale of a vessel and its logistics business, net of the π178 million one-off costs incurred in the acquisition of the Tiwi-Makban geothermal power plants and the Pagbilao IPP Administrator contract, and the π36 million goodwill impairment in one of transport group’s investments. Sans one-off gains, AEV’s consolidated recurring net income was still strong at π7.34 billion, up 50% YOY from π4.9 billion. For the year 2009, income contribution by AP and its subsidiaries amounted to π4.32 billion, recording a 30% YOY increase.

63 • SEC FORM 17-A (ANNUAL REPORT)
The power generation business recorded a 68% YOY expansion in earnings contribution to AEV, from π2.11 billion to π3.56 billion. This strong showing was mainly due to the 167% YOY increase in total attributable power sales, from 1,728 GWh to 4,619 GWh. The expansion mainly came from the improved generation of the hydro assets, which resulted from the higher rainfall during the year and the full-year operation of the 100-MW Binga hydro power plant. In addition, the Tiwi-Makban geothermal power plants, which were turned over in May 2009, and the Pagbilao coal-fired power plant, which AP took over its dispatch control on October 1, 2009, contributed a combined energy sales of 2,653 GWh, accounting for 58% of the total sales for the year. As of yearend 2009, AP’s attributable capacity was at 1,745 MW, posting a 202% YOY increase. The growth was due to the turnover of the Tiwi-Makban geothermal plants in May 2009, which recorded peak generation of 467 MW during the year, and the turnover of the dispatch control over the 700-MW contracted capacity of the Pagbilao plant. Likewise, the power distribution business posted a 5% YOY increase in its income contribution, from π1.14 billion to π1.2 billion. Electricity sales for the year grew by 6% YOY, from 3,142 GWh to 3,322 GWh. Improvement in electricity consumption growth rates, complemented with enhancements in operating efficiencies, offset the impact of the under recovery of cost of purchased power by these distribution utilities in March 2009. The attributable power consumption of residential and non-residential customers improved by 7% and 5%, respectively. The group’s customer base still grew with the residential segment increasing by 5% and the non-residential inching up by 1%. Income contribution from the financial services group registered a hefty 106% YOY improvement, from previous year’s π880 million to π1.81 billion. UBP ended the period with an earnings contribution of P1.71 billion, up by 103% YOY, while CSB contributed earnings of π96 million, up by 163% YOY. A 109% YOY increase in UBP’s net income from π2.07 billion in 2008 to π4.32 billion in 2009, coupled with the increase in AEV’s equity ownership to 38.66%, led to the higher contribution. Interest income for the year increased by 14% YOY to π11.89 billion, mainly due to the 30% YOY expansion in interest earnings on loans and receivables to π6.99 billion. The bank’s loan portfolio recorded an 11% YOY increase to π100.7 billion, as lending to all market segments, i.e. corporate, middle market and consumer, expanded. With the additional interest earnings from investments and trading securities improving by 13% YOY to π3.96 billion, net interest income rose by 10% YOY, from π5.88 billion to π6.46 billion, despite the 20% increase in interest expense brought about by the hike in deposit liabilities and bills payable. Higher net securities trading and foreign exchange gains led to a 95% YOY increase in other income from π3.01 billion to π5.88 billion. Meanwhile, other expenses only grew by 16% YOY as UBP continued to implement cost containment and efficiency improvements. The 163% YOY increase in CSB’s contributed earnings of π96 million was attributed mainly to the bank’s loan volumes expansion for the period which translated to a 67% spike in interest income. It ended the year with a total loan book of π4.9 billion, up by 41% from π3.5 billion in 2008. The transport group shored in an income contribution of π387 million, a marked improvement over last year’s π81 million. This was mainly attributed to the π2 billion reductions in ATS’s consolidated operating expenses that resulted from lower fuel costs, its single largest expense. The average fuel price in 2009 was lower by 36% YOY. The decrease in operating expenses more than made up for the π1 billion drop in consolidated revenues resulting from the loss of one of its ships and the subsequent temporary suspension of all its roro-passenger vessels in September 2009, the typhoons which negatively affected operations during the last quarter of the year, and the decline in its international chartering business. Income contribution from Pilmico and its subsidiaries, amounted to π1.2 billion, up by 168% YOY. Increase in sales volume in the flour business more than offset the decline in its average selling prices, resulting to a 25% YOY improvement in income contribution. Growth in operating margins, resulting from higher sales volume and lower freight and raw material costs, led to the 2707% YOY

64 • SEC FORM 17-A (ANNUAL REPORT)
jump in the feeds business’ income contribution. The swine business’ earnings contribution likewise improved by 13% YOY due to operating efficiencies that resulted to higher margins, despite the 11% YOY decline in sales volume. Material Changes in Line Items of Registrant’s Statements of Income and Comprehensive Income For the year 2009, AEV’s consolidated net income attributable to equity holders registered a 102% growth, reaching π8.31 billion from π4.12 billion in 2008. Operating profit for the current year amounted to π7.53 billion, a 222% increase from the π2.34 billion generated in 2008. This improvement was brought about by the π10.37 billion increase in consolidated revenues, which more than offset the π5.18 billion increase in costs and expenses. All the industry groups recorded higher operating margins during year under review. The power subsidiaries reported a combined 230% YOY increase in operating margins resulting from the 89% growth in consolidated revenues which surpassed the corresponding hike in costs and expenses. Improvement in revenues (π23.2 billion vs π12.2 billion) was largely due to the fresh contributions of APRI, which took over operations of the Tiwi-MakBan geothermal power plants in May 2009, and Therma Luzon, which assumed dispatch control of the Pagbilao plant as an Independent Power Producer (IPP) Administrator. The combined revenues from these plants accounted for almost 90% of the increase in AP’s consolidated revenues. The rest of the increase could be attributed to the spike in revenues of the distribution utilities brought about by kWhr sales growth and higher passed-on costs of purchased power. The 67% rise in consolidated costs and expense (π17.7 billion vs π10.6 billion) was mainly due to the incremental operating costs of APRI and Therma Luzon the higher costs of purchased power of distribution subsidiaries resulting from the approved NPC rate increase in March 2009. The food group reported a 94% YOY increase in operating margins as the π360 million increase in revenues was complemented by a π503 million decrease in costs and expenses. The 3% rise in sales (π11.0 billion vs π10.7 billion) was largely attributed to the improved selling prices of feeds and higher sales volume of both flour and feeds. The 5% decline in costs and expenses (π9.7 billion vs π10.2 billion) was brought about by the decrease in raw material and freight costs of feeds and the operating efficiencies of the swine business. Share in net earnings of associates registered a 19% YOY improvement (π4.32 billion vs π3.62 billion) primarily due to the substantial increase in the income contribution of the bank associates. The banks generated higher net interest margins, trading gains and other non-interest revenues during the current year. The increase in AEV’s equity ownership in UBP from 36.34% to 38.66% also contributed to the growth. This improvement more than made up for the decline in earnings contribution of certain power associates brought about by the drop in the Japanese Power Utilities Index (JPU) which resulted in the decrease of STEAG’s JPU-indexed coal margins, and LHC’s declining capacity fee rate structure and the non-recurrence of 2008 provision reversals that negatively affected its 2009 bottomline. The overall growth in consolidated operating profit was further boosted by the 395% increase in other income (π2.11 billion vs π426 million) resulting from (1) the Company’s reversal in the first quarter 2009 of the π575 million impairment provision set up in 2008 to adjust the carrying amount of the assets of ATS and the recognition as revenue of the π83 million forfeited option money resulting from the termination of the planned sale of its ATS investment in April 2009, and the (2) π560 million net foreign exchange gains, the bulk of which was recognized by Therma Luzon in the restatement of its future minimum dollar payments to PSALM as part of its IPPA agreement. This increase in other income was offset by the (1) 20% decrease in interest income (π517 million vs π645 million) due to lower cash balances; (2) the 335% spike in finance expense (π3.31 billion vs π761 million) attributed to higher average debt level in 2009; and (3) the 23% rise in provision for income tax (π1.2 billion vs π978 million) resulting from higher taxable income generated during the current year.

65 • SEC FORM 17-A (ANNUAL REPORT)
Net income from disposal group represents the net earnings of the ATS Group, except AJBTC, AJMSI and JMI. Net income from the discontinued operations registered a 1962% increase, from π25 million during the previous year to π510 million for 2009. This turnaround performance was achieved on the back of a 12% drop in costs and expenses (π11.3 billion vs π12.9 billion), which more than compensated for the 8% decline in revenues (π11.8 billion vs π12.9 billion). The decrease in costs and expenses was mainly due to the drop in fuel prices. The dip in consolidated revenues was due to lower freight and passage revenues resulting from the slowdown of its international charter business, the loss of one ship and the temporary suspension of vessels in September 2009, and the devastating typhoons which hampered operations in the fourth quarter. The 40% increase in net income attributable to minority interests was mainly due to the growth in the power and transport groups’ net income, 24% and 23%, respectively. AEV’s consolidated comprehensive income attributable to equity holders rose by 111%, from π4.09 billion in 2008 to π8.65 billion in 2009. This was mainly due to the increase in both net income (π8.31 billion vs π4.12 billion) and other comprehensive income (π346 million income vs π29 million loss). The rise in other comprehensive income was a result of the π235 million share in net unrealized gains on AFS investments of UBP, a significant improvement from the π434 million share in net unrealized losses booked in 2008, as market conditions favorably affected the bank’s mark-to-market valuation of its investment securities. This was partially offset by the decline in the share of cumulative translation adjustments (π102 million in 2009 vs π409 million in 2008) of power associates using functional currency accounting. With the US dollar depreciation in 2009, these power associates recognized lower foreign currency translation adjustments in 2009 compared to those in 2008 when the US dollar appreciated. Changes in Registrant’s Resources, Liabilities and Shareholders Equity Assets Compared to yearend 2008 levels, consolidated assets increased by 89% to π143.28 billion as of December 31, 2009, due to the following: a. Inclusive those of the disposal group as of yearend 2008, Trade and Other Receivables
increased by 70% from π4.49 billion to π7.63 billion, primarily due to the newly-consolidated receivables of APRI and Therma Luzon and the higher non-trade receivables of the transport group.
b. Inclusive those of the disposal group as of yearend 2008, Property, Plant & Equipment (PPE)
registered an increase of 512%, from π13.15 billion to π80.56 billion, primarily due to the π19.35 billion purchase of the Tiwi-MakBan geothermal power plants, the π44.52 billion finance lease acquisition of the Pagbilao coal-fired power plant, and the additional π1.91 billion costs incurred in the ongoing construction of the 42.5-MW Sibulan hydropower plant in Davao del Sur. The transport group’s PPE also increased with the purchase of two freighters, two fast crafts and one roro-passenger vessel totalling π1.94 billion, reduced by the disposal of certain assets with a combined book value of π410 million.
c. Inclusive those of the disposal group as of yearend 2008, Investments and Advances
totalled π38.57 billion, up by 18% from yearend 2008 level of π32.64 billion. This increase was mainly attributed to the following: (1) purchase of π297 million worth of UBP shares; (2) capital infusion into CEDC, the project company for the 3X82-MW coal plant in Toledo City, Cebu, and into MORE, the holding company of SNAP-Magat and SNAP-Benguet, amounting to π1.34 billion and P353 million, respectively; (3) recognition of a π235 million share in unrealized valuation gains on UBP’s AFS investments and a π347 million increase in gain on dilution resulting from the purchase of additional UBP shares; and (4) increase in accumulated equity earnings resulting from the recording of a π4.32 billion share in associates’ net earnings and the receipt of π1.12 billion cash dividends from certain associates.

66 • SEC FORM 17-A (ANNUAL REPORT)
d. Inclusive those of the disposal group as of yearend 2008, pension asset was up 111% to
P106 million mainly due to actuarial adjustments that increased the pension asset of one of AP’s distribution subsidiaries.
e. Inclusive those of the disposal group as of yearend 2008, Deferred Income Tax Assets
increased by 19% (P514 million vs π433 million) mainly due to the unrealized foreign exchange losses on dollar cash holdings and net operating loss carryover (NOLCO) recognized by AP parent during the current year, both of which required a corresponding deferred income tax asset set up.
f. Inclusive those of the disposal group as of yearend 2008, goodwill increased by 45%, from
π1.25 billion to π1.81 billion, due to the reversal in 2009 of the π575 million impairment provision recorded by AEV parent on its ATS investment in 2008. Said reversal was made to adjust the carrying amount of the transport assets in consideration of the terminated sale of ATS. With this reversal, the π560 million goodwill in ATS was effectively reinstated in 2009.
g. Inclusive those of the disposal group as of yearend 2008, Other Noncurrent Assets
increased by 72% to π2.04 billion mainly due to the prepaid rental recorded by APRI on its advance lot rental payment to PSALM and the build-up of unused VAT inputs generated from the Sibulan plant construction.
The above increases were partially offset by the following decreases: a. Cash & Cash Equivalents stood at π5.58 billion, 65% lower than the π16.04 billion reported
as at yearend 2008 which was inclusive of the disposal group’s funds amounting to π860 million. This decrease was mainly due to AEV’s purchase of π297 million worth of UBP shares and AP’s π1.34 billion capital infusion into Abovant to fund its Cebu coal project and π9.1 billion extension of stockholder’s advances to APRI to fund the purchase of the Tiwi-Makban geothermal plants.
b. Inclusive those of the disposal group as of yearend 2008, Inventories decreased by 2%
(π3.27 billion vs π3.34 billion) mainly due to lower wheat inventory carried by Pilmico as of end of year under review, partially offset by the increase in power group’s supplies & materials and coal inventories resulting from the first-time consolidation of the inventories of APRI and TLI.
Liabilities Inclusive of the π551 million loan of the disposal group as of yearend 2008, consolidated short-term bank loans increased by 11% (π9.04 billion vs π8.16 billion) while long-term liabilities increased by 435% (P66.46 billion vs π12.41 billion). This substantial surge in debt was due to (1) AP parent’s net availment of π952 million short-term loans and its issuance of additional π8.0 billion fixed-rate bonds and notes to fund the purchase of the Tiwi-Makban geothermal plants for π19.5 billion, π11.6 billion of which was financed through debt; (2) Therma Luzon’s recording of a π45.59 billion obligation under finance lease related to the acquisition of the Pagbilao plant; (3) Hedcor Sibulan’s additional π1.85 billion loan draw down to finance the construction of its 42-MW hydro plant, and (4) the Transport group’s incremental short-term borrowings of π562 million to finance its capital expenditures. These increases were partially offset by the payment of close to π1.25 billion long-term loan amortizations due in 2009 and the food group’s π739 million prepayment of its short-term loans using internally-generated funds. Inclusive of the π3.02 billion payables of the disposal group as of yearend 2008, trade and other payables increased by 61% from π6.68 billion to π10.74 billion, mainly due to the first-time consolidation of APRI and Therma Luzon trade payables and accruals.

67 • SEC FORM 17-A (ANNUAL REPORT)
The first-time recognition of a π16.48 million derivative liability represented the booking of the unrealized mark-to-market losses on the foreign currency forwards entered into by AP parent and Therma Marine. Income tax payable increased by 366% due to the higher current income tax provisions recorded by subsidiaries during the year under review. Customer deposits was higher by 13% mainly due to the growth in the customer base of DLP as well as the new deposits recorded in APRI from its bilateral contracts. Deferred income tax liabilities decreased by π16 million, mainly due to the reversal of a portion of this liability that was set up on previous year’s unrealized foreign exchange gains that were realized during the current year. Equity Equity attributable to equity holders of the parent increased by 18% from yearend 2008 level of π37.79 billion to π44.70 billion, mainly due to (1) the π6.80 billion increase in Retained Earnings, resulting from the π8.31 billion net income recorded and offset by the π1.51 billion cash dividends paid to common stockholders; (2) the π235 million increase in Share in Unrealized Gains on AFS Investments and Underwriting Accounts of an associate resulting from the improvement in the market prices of these financial instruments as of the end of the current year; and (3) π353 million increase in Gain on Dilution account resulting from AEV’s recognition of its additional share in UBP’s accumulated prior periods’ earnings as it increased its ownership in UBP. These increases were partially offset by the additional π464 million worth of treasury shares acquired by the Company in 2009. Material Changes in Liquidity and Cash Reserves of Registrant In 2009, the group continued to support its liquidity mainly from cash generated from operations and dividends received from associates. External borrowings were also a source of liquidity. Compared to the cash inflow in 2008, consolidated cash generated from operating activities in 2009 increased by π9.76 billion to π11.78 billion. This increase was largely a result of a higher net income generated during the current year, the lower funds used in financing food group’s inventory build-up and the rise in trade payables. Net cash used in investing activities reached π26.74 billion (versus π7.40 billion last year) as business acquisitions were higher in 2009. Net cash provided by financing activities during the current year was π4.66 billion, compared to the π2.96 billion in 2008. This increase in generated cash was mainly from the proceeds of the loans availed by the power group, partially offset by the cash used in the payment of cash dividends and interest. For the year ended 2009, net cash outflows were higher than cash inflows, resulting to a 65% decrease in cash and cash equivalents, from π16.04 billion in December 2008 to π5.58 billion in December 2009. Financial Ratios Lower cash balances and higher short-term debt accounted for the decrease in current ratio, from 1.9:1 as of Dec. 2008 to 0.8:1 as of Dec. 2009. Higher total debt level in 2009 resulted in the increase in debt-to-equity ratio from 0.6:1 as of Dec. 2008 to 1.6:1 as of Dec. 2009, and in net debt-to-equity ratio at 1.3x (versus yearend 2008’s 0.1x).

68 • SEC FORM 17-A (ANNUAL REPORT)
Year ended December 31, 2008 vs. Year ended December 31, 2007 Key Performance Indicators for 2008 and 2007 (Restated) are as follows:
Dec 31/2008
Restated
Dec 31/2007
EQUITY IN NET EARNINGS OF INVESTEES 3,631,338 3,987,803
EBITDA 8,607,000 9,369,083
CASH FLOW GENERATED: Net cash provided by operating activities 2,027,018 4,492,855 Net cash used in investing activities (7,402,511) (7,052,267) Net cash provided by (used in) financing activities 2,961,164 13,335,684 Net Increase (Decrease) in Cash & Cash Equivalents (2,414,329) 10,776,272 Cash & Cash Equivalent, Beginning 17,986,518 8,009,957 Cash & Cash Equivalent, End 16,037,473 18,568,226
CURRENT RATIO 1.90 2.47
DEBT-TO-EQUITY RATIO 0.62 0.40 Note: Amounts in thousands except financial ratio data.
All the key performance indicators were within management’s expectations during the period under review. 2008 equity in net earnings of investees registered a 9% YOY drop mainly due to the anticipated decline in earnings of the banking associates. Lower trading gains and other non-interest revenues of UBP and decrease in the profit margins of CSB resulted in the decline of their income contributions. The decline in the 2008 EBITDA was attributable to the decrease in the operating margins of subsidiaries and in the share of net earnings of associates. Increase in cost of power purchased or generated for AP, higher fuel prices for transport, and rise in costs of raw materials and freight for food resulted in the decrease of the operating margins of these industry groups. Despite the challenging economic environment and external market volatilities, the Group has consistently managed its cashflows and operations effectively, generating positive cash inflows from operations and registering healthy financial ratios. This strong financial position enables the Group to deliver higher value directly to its shareholders, while continuing to invest in its growth opportunities. The government, through NPC and the PSALM, is expected to continue to auction off power generation assets. AEV’s power subsidiary, AP, is currently evaluating the investment viability of these assets and intends to participate in the upcoming bidding process. Results of Operations AEV and subsidiaries posted a consolidated net income of π4.12 billion, a 29% decline from the previous year’s restated net income of π5.82 billion. This translates to an earnings per share of π0.73 for 2008. Ownership dilution in AP and lower earnings contributions of parent and its operating units accounted for the marginal decline in earnings performance for the year. On a recurring basis, the Group registered a consolidated net income of P4.90 billion, a 3% decrease from last year’s π5.04 billion. For 2008, the Group recorded a non-recurring net loss of π775 million, which includes (1) a foreign exchange net loss of π403 million at parent and subsidiary levels; (2) a

69 • SEC FORM 17-A (ANNUAL REPORT)
π575 million loss due to a booked asset impairment provision in anticipation of the sale of ATS in 2009; (3) a π198 million share in the reversal of provisions made by a power associate due to an arbitration settlement; (4) a π43 million share in a subsidiary’s project cost write-off, and (5) a π48 million share in gains on asset sale and insurance claims made by ATS. AP accounted for the bulk of AEV’s income at 70%. This was followed by the banking, food and transport groups with contributions of 18.6%, 9.7% and 1.7% of total, respectively. Despite AEV’s ownership dilution in AP, the power group continued to be AEV’s main earnings contributor for the year with its income contribution of π3.32 billion, recording a slight marginal decline from last year’s π3.35 billion. When adjusted for non-recurring items, the group recorded a 30% YOY income growth, from π2.74 billion in 2007 to π3.57 billion in 2008. The power generation business shored in the bulk of AP’s income contribution to AEV. The business ended the period with net earnings contribution of π2.11 billion, up by 3% YOY. With adjustments for one-offs, net income contribution grew by 72% YOY, from π1.42 billion in 2007 to π2.43 billion in 2008. This strong showing can be mainly attributed to the incremental earnings contributions from 2007 acquisitions, with major contributions coming from the 232-MW STEAG coal power plant. Total power sold for the period recorded a 70% YOY expansion, from 1,018 GWh to 1,728 GWh. The increase was brought on by the full-year contributions of the 2007 acquisitions. The takeover and operation of the 100-MW Binga hydro power plant in July 2008 has likewise resulted to the increase in the Group’s generation output. Higher rainfall during the year resulted to higher capacity factors for most of the hydro plants as well. On the other hand, the power distribution group’s kilowatt-hour electricity sales for the period grew by 13% YOY, from 2,790 GWh to 3,142 GWh. Aside from the incremental volume sales from the 2007 acquisitions, expansion in SEZ’s industrial segment accounted for the strong growth of the distribution group, with power demand increasing mainly due to the operation of the Hanjin shipyard. On an organic basis, the group recorded a growth of 7% YOY. Despite robust volume growth recorded, the power distribution business contributed net earnings of π1.14 billion to AEV, a 12% YOY decline. This decrease in income contribution was mainly due to AEV’s ownership dilution in AP, coupled with increasedfixed operating expenses resulting from 2008’s high inflationary environment. The financial services group contributed net earnings of π880 million in 2008, recording a 29% YOY decline from previous year’s π1.24 billion. UBP ended the period with an earnings contribution of π843 million, 28% lower than the previous year’s π1.18 billion, while CSB contributed earnings of π37 million, down by 42% from the same period last year. Considering both continuing and discontinued operations, the transport group ended the year with an income contribution of π81 million, vis-à-vis last year’s earnings contribution of π318 million. On a recurring basis, stripping off AEV’s share of ATS’s non-recurring gains amounting to π313 million and π48 million in 2007 and 2008, respectively, the transport group’s earnings performance expanded by more than six times, from π5 million in 2007 to π33 million in 2008. The strong showing of its freight revenues and improved value-added business accounted for the growth in recurring income. Income contribution from AEV’s non-listed food subsidiary, Pilmico, amounted to π458 million, a 13% decrease from the previous year. Despite a 23% increase in revenues, the flour business recorded a 27% YOY decline in earnings contribution. In the meantime, the company’s swine and feeds business recorded a 62% YOY earnings expansion, which resulted from favorable prices and robust volume sales. Material Changes in Line Items of Registrant’s Income Statement Consolidated net income attributable to equity holders decreased by 29%, from the restated π5.82 billion in 2007 to π4.12 billion in 2008.

70 • SEC FORM 17-A (ANNUAL REPORT)
Gross profit for the year from continuing operations amounted to π2.51 billion, a 20% decline from the π3.13 billion posted last year. The 16% or π3.27 billion hike in costs and expenses more than offset the 11.5% or π2.66 billion growth in consolidated revenues. All the industry groups registered YOY decreases in gross profit. Power subsidiaries reported a combined 12% or π247 million decrease in operating margins resulting from an increase in costs and expenses which more than offset the increase in revenues. The π931 million spike in revenues generated mostly by the Enerzone companies and CPPC was offset by the π1.18 billion hike in costs and expenses resulting from higher cost of CPPC’s generated power and of power purchased by SEZ, MEZ and BEZ. The food group reported a 24% drop in margins (π729 million vs π957 million) as revenues increased only by π2.06 billion while costs and expenses rose by π2.29 billion. The 24% boost in sales was attributed to better selling prices in its flour business, strong volume sales for its swine business and favorable prices for both swine and feeds businesses. Higher costs of raw materials and freight resulted in a 30% increase in operating costs. Share in net earnings of associates registered a 9% decrease (π3.63 billion vs π3.99 billion) primarily due to the decrease in income contribution of the banking group. UBP ended the period with an earnings contribution of π843 million, 28% lower than the previous year’s π1.18 billion. Other income decreased by 21% (π3.01 billion vs π3.82 billion) substantially due to the extraordinarily huge income generated from trading and sale of assets in 2007 which was not duplicated in 2008. Provision for impairment losses also increased by 127% (π860 million vs π380 million) as the bank continues to build-up its provisioning this year. The drop in other income and the increase in provisions more than offset the 21.63% or π1.05 billion increase in net interest income resulting from higher asset yields and lower funding costs. Likewise, CSB reported a 42% YOY decrease in income contributions from π63 million in 2007 to π37 million in 2008 mainly due to lower net interest margins and increased manpower costs. The overall decline in consolidated gross profit from continuing operations was further driven by the 38% decrease (π632 million vs π1.02 billion) in interest income. The Company generated lower interest earnings in 2008 as its cash balances dipped due to payment of higher cash dividends. This increase in interest income was offset by the 15% decrease in finance expense, from π844 million in 2007 to π721 million in 2008, resulting from lower average debt level in 2008. The provision for income tax decreased by 8% as a result of the lower taxable income reported by the Group. Net income from disposal group represents the net earnings of the ATS Group, except the Aboitiz Jebsen Group. AEV’s share in the net income of the disposal group decreased by 91%, from π337 million in 2007 to π31 million in 2008. This decline was mainly due to lower non-recurring gains generated during the year under review. AEV’s share of the group’s one-off gains amounted to π48 million in 2008, an 85% decrease from last year’s π313 million gains from sale of three vessels. At the operating level, the disposal group recorded negative margins of π173 million in 2008, a 24% improvement from last year’s π227 million. While the group still generated negative margins due to the rise in the cost of fuel, its single biggest expense, it recorded an improvement in 2008 as a result of the π2 billion increase in revenues. The strong showing of the company’s freight revenues and improved value-added business accounted for this topline growth. The π231 million increase in net income attributable to minority interests was mainly due to AEV’s ownership dilution in AP, from 100% during the first semester of 2007 and 73% during the second half of 2007 to 76% in 2008, as a result of AP’s initial public offering in July 2007 and the additional purchase of AP shares by AEV in 2008.

71 • SEC FORM 17-A (ANNUAL REPORT)
Changes in Registrant’s Resources, Liabilities and Shareholders Equity Assets Compared to yearend 2007 levels, consolidated assets increased 15% to π75.71 billion as of December 31, 2008, due to the following:
a. Trade and other receivables decreased by 32% from π4.25 billion to π2.88 billion due to the reclassification made in 2008 of the disposal group’s receivables, amounting to π1.62 billion, from this account to “Assets of disposal group classified as held for sale” account. Adding back the disposal group’s receivables, the 2008 trade and other receivables registered a 6% increase over the 2007 level, primarily due to higher trade receivables resulting from the spike in revenues of the transport and food groups.
b. Inclusive of the disposal group, inventories increased by 117% (π3.34 billion vs π1.54
billion) mainly due to higher wheat inventory carried by Pilmico as of yearend 2008. c. Other Current Assets decreased by 22% from π1.64 billion to π1.28 billion due to the
reclassification made in 2008 of the disposal group’s similar assets, amounting to π628 million, from this account to “Assets of disposal group classified as held for sale” account. Inclusive of the disposal group, 2008’s other current assets registered a 17% increase over the 2007 level, substantially due to higher unapplied VAT input taxes and accumulation of unutilized prepaid taxes. These prepaid taxes represent creditable taxes withheld by customers and can be used as payment of future income taxes.
d. Property, plant & equipment (PPE) registered a decrease of 13% from π10.31 billion to
π8.96 billion due to the reclassification made in 2008 of the disposal group’s PPE, amounting to π4.19 billion, from this account to “Assets of disposal group classified as held for sale” account. Inclusive of the disposal group, the 2008 PPE increased by 28% over the 2007 level, primarily due to the power group’s acquisition of utility equipment and the ongoing construction of the 42.5-MW Sibulan hydropower plant in Davao del Sur. The food group’s PPE also registered a substantial increase in 2008 due to the construction of the Iligan feedmill plant, additional silos and the nucleus and grower-finisher farms in Tarlac.
e. Intangible asset - service concession right increased by 29% from π662 million to π854
million, mainly due to new capital expenditures incurred by SEZ and MEZ. These capex are now recorded under this account following their adoption of IFRIC 12.
f. Investment properties increased by 25% from π245 million to π307 million,
substantially due to the acquisition of a piece of land and additional commercial condominium units by CPDC.
g. Inclusive of the disposal group, investments and advances totalled π32.64 billion, up by
26% from the yearend 2007 level of π25.98 billion. This increase was mainly attributed to the following: i) infusion of π3.39 billion for additional equity in Manila-Oslo Renewable Enterprise, Inc. (MORE), which was in turn invested into SNAP-Benguet for the acquisition of the Ambuklao-Binga hydropower complex; ii) infusion of π279 million in equity into RP Energy; iii) extension of stockholder’s advance amounting to π1.47 billion to CEDC, the project company for the 3X82-MW coal plant in Toledo City, Cebu; and iv) increase in accumulated equity earnings resulting from the recording of π3.62 billion share in associates’ net earnings, and the receipt of π2.59 billion cash dividends from associates.
h. Other non-current assets decreased by 47% to π275 million due to the reclassification
made in 2008 of the disposal group’s similar assets, amounting to π341 million, from this account to “Assets of disposal group classified as held for sale” account. Inclusive

72 • SEC FORM 17-A (ANNUAL REPORT)
those of the disposal group, 2008’s other non-current assets registered a 17% increase over the 2007 level, substantially due to higher refundable deposits made in 2008.
The above increases were partially offset by the following decreases:
a. Cash & cash equivalents stood at π15.76 billion, 15% lower than the π18.57 billion reported at yearend 2007 due to the reclassification made in 2008 of disposal group’s funds, amounting to π860 million, from this account to “Assets of disposal group classified as held for sale” account. Adding back those of the disposal group, the 2008 cash and cash equivalents registered a decrease of only 11% over the 2007 level. This decrease was mainly due to the Company’s payment of a higher cash dividend to common shareholders in 2008.
b. Inclusive of the disposal group, available-for-sale investments decreased by 21% to
π81 million mainly due to the sale of certain investments in 2008. c. Inclusive of the disposal group, goodwill decreased by 20%, from π1.57 billion to π1.25
billion. The reduction was due to the π575 million impairment provision recorded by AEV parent on its ATS investment in 2008. This decline was partially offset by the additional π235 million goodwill recognized in 2008 on the acquisition of a new transport subsidiary, ScanAsia Overseas, Inc.
Liabilities Inclusive of the π551 million loan of the disposal group, consolidated short-term bank loans increased by π4.52 billion due to the additional loan availment by the following: 1) transport group with an availment of π570 million to finance its working capital requirements; 2) power group with an increase of π1.45 billion due to the availment of loans to fund working capital requirements and the upward restatement of AP parent’s dollar-denominated debt as a result of the weakening of the peso; and 3) food group with an availment of π1.45 billion mainly to finance its inventory build-up. Likewise, long-term liabilities increased by 70% or π5.12 billion compared to the 2007 yearend level, principally due to the following: 1) issuance of π3.89 billion fixed-rate notes by AP parent in December 2008; 2) Hedcor Sibulan’s availment of a π1.72 billion long-term debt to finance the construction of its 42.5-MW hydropower project; and 3) SEZ’s refinancing of its long-term debt. This increase was partially offset by the prepayment of debt at the AEV parent level and the loan amortization payments by the transport and food groups. Inclusive of the π3.02 billion payables of the disposal group, trade and other payables increased by 7% to π6.68 billion. This rise in payables was mainly due to advances made by subsidiary Abovant from other shareholders to fund infusions into CEDC. Customers’ deposits posted an increase of 14% or π199 million from last year mainly due to new connections in the CLP, DLP, and SEZ franchise areas. Income tax payable decreased by 41% due to lower income tax provisions recorded by subsidiaries during the current year. Equity Equity attributable to equity holders of the parent decreased by 1% from the yearend 2007 level of π38.28 billion to π37.79 billion, due to the following:
a. Share in unrealized gains on AFS investments and underwriting accounts decreased by π434 million due to the decline in the market prices of these financial instruments as of the end of the current year.

73 • SEC FORM 17-A (ANNUAL REPORT)
b. Acquisition of minority interest decreased by π287 million, representing the premium paid by the group in acquiring the additional 40% interest in BEZ.
c. Treasury shares increased by π831 million as AEV parent started buying back its own
shares in 2008. The above decreases were partially offset by the following increases:
a. Retained earnings increased by π647 million as at December 31, 2008, mainly due to the recording of the π4.12 billion net income for the year, offset by the payment of π3.47 billion in cash dividends by AEV parent to its common shareholders.
b. Share in cumulative translation adjustments of associates improved by 97% due to the
depreciation of the Philippine peso in December 2008, from π41.28 as of December 31, 2007 to π47.52. The power generating associates, which adopt the US dollar functional currency financial reporting, recorded considerable foreign exchange adjustments in generating their 2008 financial statements under the peso presentation currency. These foreign exchange adjustments are booked under the Cumulative Translation Adjustments account.
Financial Ratios Lower cash balances accounted for the decrease in current ratio, from 2.47:1 as of December 2007 to 1.93:1 as of December 2008. Higher debt level in 2008 resulted to increases in debt-to-equity ratio from 0.40:1 as of December 2007 to 0.62:1 as of December 2008, and in net debt-to-equity ratio from -0.15:1 as of December 2007 to 0.15:1 as of December 2008. Material Changes in Liquidity and Cash Reserves of Registrant For the year ended 2008, the Group continues to support its liquidity mainly from cash generated from operations and dividends received from associates. External borrowings are also a source of liquidity. When opportunity arises, the group raises capital or disposes of certain assets to strengthen its cash position and be financially prepared to partake in major investment projects. Consolidated cash generated from operating activities decreased by 55%, from π4.49 billion in 2007 to π2.03 billion in 2008. This decrease was largely a result of lower net income generated during the current year and to higher funds used in financing the food group’s inventory build-up. The current year ended with a π7.54 billion net cash used in investing activities, compared to the π7.05 billion used during the previous year. The increase was mainly due to higher capital expenditures made in 2008. Net cash provided by financing activities in 2008 was π3.1 billion, compared to the π13.33 billion in 2007. The treasury share sale made by the AEV parent in January 2007 and the AP IPO proceeds in July 2007 added π5.94 billion and π9.96 billion, respectively, to cash. These transactions, net of the π1.14 billion cash dividends paid, resulted in a higher net cash generated in 2007. In 2008 the π9.28 billion short-and long-term loan proceeds, net of the π3.47 billion cash dividends and P831 million treasury shares acquisition, resulted in lower net cash generated. For the year ended 2008, net cash outflows were higher than cash inflows, resulting to a 11% decrease in cash and cash equivalents, from π18.57 billion in December 2007 to π16.62 billion in December 2008. Item 7. Financial Statements

74 • SEC FORM 17-A (ANNUAL REPORT)
The audited consolidated financial statements of AEV are incorporated herein by reference. The schedules listed in the accompanying Index to Supplementary Schedules are filed as part of this Form 17-A. Item 8. Information on Independent Accountant and other Related Matters (A) External Audit Fees and Services The external audit and consultancy fees of the Registrant for the years 2010 and 2009 were as follows:
Year ended December 31, 2010
Year ended December 31, 2009
Audit Fees π336,000.00 π336,000.00 Audit-Related Fees - - Tax Fees - - Consultancy Fees - - Total π336,000.00 π336,000.00
As a policy, the Board Audit Committee makes recommendations to the Board of Directors concerning the choice of external auditor and pre–approves audit plans, scope and frequency before the audit is conducted. Audit services of external auditors for the years 2010 and 2009 were pre–approved by the Board Audit Committee. The Committee had also reviewed the extent and nature of these services to ensure that the independence of the external auditors is preserved. (B) Changes in and Disagreements with Accountants on Accounting and Financial Disclosure The accounting firm of Sycip, Gorres, Velayo & Company (SGV) has been AEV’s Independent Public Accountant for the last 17 years. Mr. J. Carlitos G. Cruz serves as audit partner of AEV since 2009. He replaced Mr. Ladislao Z. Avila Jr. who served as audit partner for five years from 2004 to 2008. AEV shall comply with the requirements of Section 3(b)(iv) of SRC Rule 68 on the rotation of external auditors or signing partners. Representatives of SGV will be present during the annual meeting and will be given the opportunity to make a statement if they so desire. They are also expected to respond to appropriate questions if needed. There was no event in the past 17 years where AEV and SGV or the handling partner had any disagreement with regard to any matter relating to accounting principles or practices, financial statement disclosure or auditing scope or procedure. In its regular meeting last March 2, 2011, the Board Audit Committee of AEV approved a resolution to submit for the approval of the stockholders during the Annual Stockholders’ Meeting a proposal to delegate to the Board of Directors the authority to appoint the Company’s external auditors for 2011. The proposal is intended to give the Board Audit Committee sufficient time to evaluate the different auditing firms who have submitted engagement proposals to act as AEV’s external auditor for 2011.

75 • SEC FORM 17-A (ANNUAL REPORT)
PART III – CONTROL AND COMPENSATION INFORMATION Item 9. Directors and Executive Officers of the Issuer (a) (1) Directors for 2010-2011 Below is a list of AEV’s directors for 2010-2011 with their corresponding positions and offices held for the past five years. The directors assumed their directorship during AEV’s annual stockholders’ meeting in 2010, for a term of one year. JON RAMON ABOITIZ, Chairman – Board of Directors, Chairman – Board Corporate Governance Committee and Board Risk Management Committee Mr. Jon Ramon Aboitiz, 62 years old, Filipino, has been Chairman of the Board of Directors of AEV since January 2009. He was President/ Chief Executive Officer of AEV since 1994 until his retirement last December 2008. Mr. Aboitiz began his career with the Aboitiz Group in 1970. From a manager of the Aboitiz Shipping Corporation, Mr. Aboitiz was promoted to President of the company in 1976 and became President of Aboitiz & Company in 1991 until 2008. He is also Chairman of the Board of Directors of Aboitiz and Company, Inc., Aboitiz Jebsen Bulk Transport Corporation; Vice Chairman of Aboitiz Power Corporation; President of Aboitiz Foundation, Inc.; and Director of City Savings Bank and International Container Terminal Services, Inc. Mr. Aboitiz is also the Vice Chairman of the Board of Directors of Union Bank of the Philippines. He is Chairman of the bank’s Executive Committee, Risk Management Committee and Corporate Governance Committee, including the latter’s Compensation and Remuneration, and Nominations Sub-Committees. He is President of the Aboitiz Foundation, Inc., Trustee and Vice President of the Ramon Aboitiz Foundation, Inc.; Trustee of the Santa Clara University, California and The Philippine Business for Social Progress Foundation; and member of the Board of Advisors of the Association of Foundations as well as The Coca Cola Export Corporation in the Philippines. Mr. Aboitiz holds a B.S. Commerce degree with a major in Management from the Santa Clara University, California. ERRAMON I. ABOITIZ, President and Chief Executive Officer Mr. Erramon I. Aboitiz, 54 years old, Filipino, has served as President and Chief Executive Officer of AEV since January 2009. He has been a Director of AEV since 1994 and was its Executive Vice President and Chief Operating Officer from 1994 to December 2008. He is also President and Chief Executive Officer of Aboitiz and Company, Inc. and Aboitiz Power Corporation; Chairman of the Board of Directors of Davao Light & Power Company, Inc., San Fernando Electric Light and Power Company, Inc., Cotabato Light & Power Company, Subic Enerzone Corporation, SN Aboitiz Power-Magat, Inc. and SN Aboitiz Power-Benguet, Inc., Aboitiz Renewables, Inc., Therma Marine, Inc., Therma Power, Inc., Aboitiz Energy Solutions, Inc., and City Savings Bank; Vice Chairman of Visayan Electric Company, Inc.; and Director of STEAG State Power, Inc, Union Bank of the Philippines and Pilmico Foods Corporation. He is also Chairman of Aboitiz Foundation Inc. and a director of the Family Business Development Center (Ateneo de Manila University). He received a Bachelor of Science degree in Business Administration, major in Accounting and Finance from Gonzaga University, Spokane, U.S.A. ROBERTO E. ABOITIZ, Director, Member – Board Audit Committee and Board Corporate Governance Committee Mr. Roberto E. Aboitiz, 61 years old, Filipino, has been a Director of AEV since 1994. He served as Chairman of AEV from 2005 until December 2008. He is Chairman and Chief Executive Officer of Aboitiz Construction Group, Inc.; Chairman of the Board of Directors of Cebu Industrial Park Developers, Inc.; Propriedad Del Norte, Inc.; Director of City Savings Bank, Cotabato Light & Power Company, Davao Light & Power Company, Inc., Tsuneishi Heavy Industries (Cebu), Inc., Metaphil International, Inc., Aboitiz Land, Inc., Aboitiz & Company, Inc.; Trustee of the Aboitiz Foundation, Inc.; and Vice President and Trustee of Tsuneishi Foundation (Cebu) Inc., and West Cebu Foundation,

76 • SEC FORM 17-A (ANNUAL REPORT)
Inc. He graduated from Ateneo de Manila University with a Bachelor of Arts degree in Behavioral Science. ENRIQUE M. ABOITIZ, JR., Director, Member – Board Risk Management Committee, Senior Vice President Mr. Enrique M. Aboitiz, Jr., 57 years old, Filipino, has served as Director of AEV since 1994. He has recently been appointed as Senior Vice-President of Aboitiz Equity Ventures, Inc. (AEV). He is also the Chairman of the Board of Directors of Aboitiz Power Corporation and Aboitiz Land, Inc.; and Director of AP Renewables, Inc., Manila- Oslo Renewable Enterprise, Inc., and Therma Luzon Inc. He was President and Chief Executive Officer of Aboitiz Transport System (ATSC) Corporation before it was sold to Negros Navigation Co., Inc. (NENACO) in December 2010. Mr. Aboitiz graduated with a degree in Bachelor of Science in Business Administration (Major in Economics) from Gonzaga University, Spokane, Washington, U.S.A. JUSTO A. ORTIZ, Director, Member – Board Audit Committee and Board Risk Management Committee Mr. Justo A. Ortiz, 53 years old, Filipino, has served as Director of AE V since 1994. He is also Chairman and Chief Executive Officer of Union Bank of the Philippines, Director of MegaLink and LGU Guarantee Corporation, member of World Presidents Organization. Prior to his stint in UnionBank, he was Managing Partner for Global Finance and Country Executive for Investment Banking at Citibank N.A. He graduated magna cum laude with a degree in Economics from Ateneo de Manila. ANTONIO R. MORAZA, Director Mr. Antonio R. Moraza, 54 years old, Filipino, has served as Director of AEV since May 2009. He is currently a Director of Aboitiz Power Corporation and Executive Vice President and Chief Operating Officer of its Power Generation Group. He is also Chairman of the Board of Directors of AP Renewables, Inc., Pilmico Foods Corporation, Pilmico Animal Nutrition Corporation, and East Asia Utilities, Inc.; Chairman and Chief Executive Officer of Hedcor, Inc. and Hedcor Sibulan, Inc.; Vice Chairman of Propriedad Del Norte, Inc. and Aboitiz Land, Inc. He is likewise a Director and Senior Vice President of Aboitiz & Company, Inc.; President and Chief Executive Officer of Abovant Holdings, Inc. and Aboitiz Renewables, Inc., President of Manila-Oslo Renewable Enterprise, Inc.; and Director of SN Aboitiz Power-Benguet, Inc., SN Aboitiz Power-Magat, Inc., Therma Marine, Inc., Therma Power, Inc., Luzon Hydro Corporation, Southern Philippines Power Corporation, STEAG State Power, Inc., Therma Luzon, Inc., Western Mindanao Power Corporation, Metaphil International, Inc., and Cebu Private Power Corporation. He holds a degree in Business Management from Ateneo de Manila University. ROBERTO R. ROMULO, Independent Director, Member – Board Corporate Governance Committee, Board Strategy Committee and Board Audit Committee Mr. Roberto R. Romulo, 72 years old, Filipino, has served as Independent Director of AEV since 2002. He is the Chairman of Chartis Philippines Insurance, Inc. (formerly Philam Insurance, Inc.) PETNET, Inc., and Medilink Network Inc. He also holds various board positions in other corporations including A. Soriano Corporation, Philippine Long Distance Telephone Co. and Equicom Savings Bank. He graduated from Georgetown University in 1960 with a Bachelor of Arts in Political Science and completed his Bachelor of Laws degree in 1964 from Ateneo de Manila University. JOSE C. VITUG, Independent Director, Chairman – Board Audit Committee, Member – Board Corporate Governance Committee Justice Jose C. Vitug (ret.), 76 years old, Filipino, has served as Independent Director of AEV since 2005. He is a Senior Professor at the Philippine Judicial Academy and Consultant of the Committee on Revision of the Rules of the Supreme Court of the Philippines; Chairman of the Angeles University

77 • SEC FORM 17-A (ANNUAL REPORT)
Foundation Medical Center; Independent Director of ABS-CBN Corporation, Trustee of the Mission Communications Foundation, Inc; Dean of the Angeles University Foundation School of Law and a Graduate Professor of the Graduate School of Law of San Beda College. He was formerly an Associate Justice of the Supreme Court, Chairman of the House of Representatives Electoral Tribunal and senior member of the Senate Electoral Tribunal. STEPHEN CUUNJIENG, Independent Director, Member – Board Audit Committee, Board Corporate Governance Committee and Board Risk Management Committee Mr. Stephen CuUnjieng, 52 years old, Filipino, has served as Independent Director of AEV since 2010. He has a long and extensive experience in investment banking with a number of major international investment banks. He has led several high profile transactions in the Philippines and Asia and has won seven Deals of the Year awards since 2005. He is currently Senior Managing Director at Evercore Partners, a New York Stock Exchange listed investment bank and Adviser to the Board of SM Investments Corporation as well as Director of Manila North Tollways Corporation. He previously held managing director or director positions with Macquarie, Merrill Lynch and Salomon Brothers, among others. Nominations for Independent Directors and Procedure for Nomination The procedure for the nomination and election of the independent directors is in accordance with Rule 38 of the Securities Regulation Code (SRC Rule 38), AEV’s Amended By-laws and AEV’s Guidelines for the Constitution of the Nomination Committee and the Nomination and Election of Independent Directors (the Guidelines). These Guidelines were approved by the AEV Board on February 10, 2003 and disclosed to all stockholders. Nominations for independent directors were accepted starting January 1, 2011 as provided for in Section 2 of the Guidelines and the table for nominations was closed on February 15, 2011 as provided for in Section 3 of the Guidelines. SRC Rule 38 and the Guidelines further require that the Board Corporate Governance Committee shall meet to prescreen all nominees, and shall submit a Final List of Candidates to the Corporate Secretary no later than February 22, 2011 so that such list will be included in the Corporation’s Preliminary and Definitive Information Statements. Only nominees whose names appear on the Final List shall be eligible for election as independent directors. No other nominations shall be entertained after the Final List of Candidates has been prepared. The name of the person or group of persons who recommend the nomination of an independent director shall be identified in such report including any relationship with the nominee. All these procedures were complied with. In approving the nominations for independent directors, the Board Corporate Governance Committee considered the guidelines on the nominations of independent directors prescribed in SRC Rule 38, the Guidelines and AEV’s Revised Manual on Corporate Governance. No nominations for independent director shall be accepted at the floor during the stockholders’ meeting at which such nominee is to be elected. However, independent directors shall be elected in the stockholders’ meeting during which other members of the Board are to be elected. Mr. Roberto R. Romulo, Ret. Justice Jose C. Vitug and Mr. Stephen CuUnjieng are the nominees for Independent Directors of AEV. They are neither officers nor employees of the Company or any of its affiliates, and do not have any relationship with the Company which would interfere with the exercise of independent judgment in carrying out the responsibilities of an independent director. AEV stockholders Alma Casing, Regina Andoy and Lelia Balalilhi have recommended Mr. Roberto R. Romulo, Justice Jose C. Vitug and Mr. Stephen CuUnjieng, respectively, as the Company’s independent directors. None of the nominating stockholders have any relation to Mr. Romulo, Justice Vitug nor to Mr. CuUnjieng.

78 • SEC FORM 17-A (ANNUAL REPORT)
Other Nominees for Election as Members of the Board of Directors As conveyed to the Corporate Secretary, the following will also be nominated as members of the Board of Directors for the ensuing year 2011-2012: Jon Ramon Aboitiz Erramon I. Aboitiz Roberto E. Aboitiz Enrique M. Aboitiz, Jr. Justo A. Ortiz Antonio R. Moraza Pursuant to Section 1 (Paragraph 4), Article II of the Amended By-Laws of AEV, nominations for members of the Board of Directors must be submitted in writing to the Board of Directors at least 15 working days before the regular Annual Stockholders’ Meeting on May 16, 2011, or not later than April 25, 2011. All other information regarding the positions and offices held by the abovementioned nominees are integrated in Item 5 (a) (1) above: Officers for 2010 -2011 Below is a list of AEV officers for 2010-2011 with their corresponding positions and offices held for the past five years. Unless otherwise indicated hereunder, the officers assumed their positions during AEV’s annual organizational meeting in 2010 for a term of one year.
ERRAMON I. ABOITIZ, President and Chief Executive Officer Mr. Aboitiz, 54 years old, Filipino, has served as President and Chief Executive Officer of AEV since January 2009. He has been a Director of AEV since 1994 and was its Executive Vice President and Chief Operating Officer from 1994 to December 2008. He is also President and Chief Executive Officer of Aboitiz and Company, Inc. and Aboitiz Power Corporation; Chairman of the Board of Directors of Davao Light & Power Company, Inc., San Fernando Electric Light and Power Company, Inc., Cotabato Light & Power Company, Subic Enerzone Corporation, SN Aboitiz Power-Magat, Inc. and SN Aboitiz Power-Benguet, Inc., Aboitiz Renewables, Inc., Therma Marine, Inc., Therma Power, Inc., Aboitiz Energy Solutions, Inc., and City Savings Bank; Vice Chairman of Visayan Electric Company, Inc.; and Director of STEAG State Power, Inc, Union Bank of the Philippines and Pilmico Foods Corporation. He is also Chairman of Aboitiz Foundation Inc. and a director of the Family Business Development Center (Ateneo de Manila University). He received a Bachelor of Science degree in Business Administration, major in Accounting and Finance from Gonzaga University, Spokane, U.S.A. STEPHEN G. PARADIES, Senior Vice President/Chief Financial Officer/Corporate Information Officer/ Ex-Officio Member – Board Audit Committee and Board Risk Management Committee Mr. Paradies, 57 years old, Filipino, has been Senior Vice President/Chief Financial Officer/Corporate Information Officer of AE V since 2004. He was Compliance Officer of AE V until November 2005. From 2002 to 2004, he was Senior Vice President and Chief Audit Executive of AE V. He is also Senior Vice President for Finance and a member of the Board of Advisers of Aboitiz and Company, Inc.; Director and Senior Vice President/ Treasurer of Aboitiz Construction Group, Inc.; Director of Union Bank of the Philippines, Union Properties, Inc., International Container Terminal Services, Inc., Pilmico Foods Corporation and Pilmico Animal Nutrition Corporation, City Savings Bank, Inc., and Metaphil International, Inc.; Director and Vice President of AE V Aviation, Inc.; Trustee and Treasurer of Aboitiz Foundation, Inc.; and Treasurer of Cebu Industrial Park Developers, Inc. He obtained his Bachelor of Science in Business Management from Santa Clara University, California, U.S.A.

79 • SEC FORM 17-A (ANNUAL REPORT)
MIKEL A. ABOITIZ, Director, Senior Vice President/ Chief Information Officer/ Chief Strategy Officer Mr. Aboitiz, 56 years old, Filipino, has served as AEV’s Senior Vice President and Chief Information Officer since 2004 and its Chief Strategy Officer since 2009. He is also Senior Vice President – Strategy of Aboitiz and Company, Inc.; President and Chief Executive Officer of City Savings Bank, Inc.; and Director of Aboitiz Power Corporation, Aboitiz Construction Group, Inc., Aboitiz Land, Inc., Cotabato Light & Power Company, Davao Light & Power Company, Inc., Pilmico Foods Corporation, Pilmico Animal Nutrition Corporation, Metaphil International, Inc., AEV Aviation, Inc., Propriedad Del Norte, Inc., Cebu Praedia Development Corporation, Therma Power, Inc., AP Renewables Inc., Therma Luzon, Inc. and Visayan Electric Company, Inc.; and a Trustee and Treasurer of Ramon Aboitiz Foundation, Inc. He has a Bachelor of Science degree in Business Administration from Gonzaga University, Spokane, U.S.A. ENRIQUE M. ABOITIZ, JR., Director, Member – Board Risk Management Committee, Senior Vice President Mr. Aboitiz, Jr., 57 years old, Filipino, has served as Director of AEV since 1994. He has recently been appointed as Senior Vice-President of Aboitiz Equity Ventures, Inc. (AEV). He is also the Chairman of the Board of Directors of Aboitiz Power Corporation and Aboitiz Land, Inc.; and Director of AP Renewables, Inc., Manila-Oslo Renewable Enterprise, Inc., and Therma Luzon Inc. He was President and Chief Executive Officer of Aboitiz Transport System Corporation (ATSC) before it was sold to Negros Navigation Co., Inc. (NENACO) in December 2010. Mr. Aboitiz graduated with a degree in Bachelor of Science in Business Administration (Major in Economics) from Gonzaga University, Spokane, Washington, U.S.A. JUAN ANTONIO E. BERNAD, Senior Vice President Mr. Bernad, 54 years old, Filipino, is AEV’s Senior Vice President since 1995. He was AEV’s Senior Vice President – Electricity Regulatory Affairs from 2004 to 2007 and Senior Vice President - Chief Financial Officer from 1995 to 2004. He is Executive Vice President for Strategy and Regulation of Aboitiz Power Corporation. He is Executive Vice President-Regulatory Affairs of Davao Light & Power Company, Inc.; Director and the Senior Vice President of Visayan Electric Company, Inc.; Director of Cotabato Light & Power Company, AEV Aviation, Inc., AP Renewables Inc. and Union Bank of the Philippines; and Director and Vice President of Cebu Praedia Development Corporation. He has a degree in Economics from the Ateneo de Manila University and a master’s degree in Business Administration at The Wharton School, University of Pennsylvania, U.S.A. XAVIER J. ABOITIZ, Senior Vice President - Chief Human Resources Officer, Ex-Officio Member - Board Corporate Governance Committee Mr. Aboitiz, 51 years old, Filipino, has been Senior Vice President – Chief Human Resources Officer of AEV since 2004. He is also Senior Vice President for Human Resources and a member of the Board of Advisers of Aboitiz & Company, Inc.; and Director of Pilmico Foods Corporation and Trustee of Aboitiz Foundation, Inc. Mr. Aboitiz has worked in various capacities in different companies under the Aboitiz Group of companies since 1983. He took up Business Administration - Finance at Gonzaga University, Spokane, U.S.A. GABRIEL T. MAÑALAC, Senior Vice President - Group Treasurer Mr. Mañalac, 54 years old, Filipino, has been Senior Vice President - Group Treasurer of AEV since January 2009. He joined AEV as Vice President for Treasury Services in 1998 before he was promoted to First Vice President for Treasury Services in 2004. He is also Senior Vice President and Treasurer of Aboitiz Power Corporation; Vice President and Treasurer of Davao Light & Power Company, Inc.; and Treasurer of Cotabato Light & Power Company. Mr. Mañalac graduated cum laude with a degree of Bachelor of Science in Finance and Bachelor of Arts in Economics from De La Salle University. He obtained his Masters of Business Administration in Banking and Finance from the Asian Institute of Management and was awarded the Institute’s Scholarship for Merit.

80 • SEC FORM 17-A (ANNUAL REPORT)
LUIS MIGUEL O. ABOITIZ, First Vice President Mr. Aboitiz, 46 years old, Filipino, has been First Vice President of AEV since 2004. He joined AE V in 1995 as Vice President. He is also Senior Vice President - Power Marketing and Trading of Aboitiz Power Corporation; First Vice President and a member of the Board of Directors of Aboitiz & Company, Inc.; President and Chief Executive Officer of Aboitiz Energy Solutions, Inc.; Director and Senior Vice President – Business Development of Hedcor, Inc.; Director and Vice President - Treasurer of Aboitiz Renewables, Inc. and Therma Power, Inc.; Executive Vice President – Chief Operating Officer of Adventenergy, Inc.; Director and Treasurer of Redondo Peninsula Energy, Inc.; and Director of Therma Marine, Inc., Davao Light & Power Company, Inc., Pilmico Animal Nutrition Corporation, Pilmico Foods Corporation, Manila-Oslo Renewable Enterprise, Inc., SN Aboitiz Power-Magat, Inc., SN Aboitiz Power-Benguet, Inc., Therma Luzon, Inc., AP Renewables, Inc., Hedcor Sibulan, Inc. and Subic Enerzone Corporation. He graduated at Santa Clara University, California, U.S.A. with a degree of Bachelor of Science in Computer Science and Engineering and took his Masters in Business Administration from the University of California at Berkeley, U.S.A. M. JASMINE S. OPORTO, First Vice President – Chief Legal Officer, Corporate Secretary, Chief Compliance Officer, Ex-Officio Member – Board Corporate Governance Committee Ms. Oporto, 51 years old, Filipino, has been Corporate Secretary of AE V since 2004 and Chief Compliance Officer since November 2005. She is concurrently First Vice President - Chief Legal Officer of AE V. She is also Vice President for Legal Affairs of Davao Light & Power Company, Inc.; and Corporate Secretary of Aboitiz Power Corporation, Visayan Electric Company, Inc., Therma Power, Inc., Hijos de F. Escaño, Inc., Cebu Private Power Corporation and Luzon Hydro Corporation. Prior to joining AEV, she worked in various capacities at the Hong Kong office of Kelley Drye & Warren, LLP, a New York-based law firm, and the Singapore-based consulting firm Albi Consulting Pte. Ltd. She obtained her Bachelor of Laws from the University of the Philippines and is a member of both the Philippine and New York bars. HORACIO C. ELICANO, First Vice President - Chief Technology Officer Mr. Elicano, 51 years old, Filipino, has been First Vice President and Chief Technology Officer of AE V since 2009. Before he joined AEV, he was Managing Director of Catapult Communications. He was also Chief Technology Officer of Paysetter International Inc. from 2001 to 2007 and of Chikka Asia, Inc., from 2001 to 2005. Prior to that, he logged 20 years in the banking industry with Citibank and Union Bank of the Philippines. He is a B.S. Electrical Engineering graduate from the University of the Philippines. SEBASTIAN R. LACSON, First Vice President and Chief Reputation Officer Mr. Lacson, 40 years old, Filipino, has been First Vice President – Chief Reputation Officer since 2009. Mr. Lacson was previously the Vice President of Administration of AE V affiliate, Visayan Electric Company, Inc. Before joining the Aboitiz Group, he held various positions in the Philippines, Spain and Panama for the Union Fenosa Group of Spain from 1999 to 2008. He was concurrent Corporate Director of Union Fenosa Panama and Technical Secretary to the Chairman of Union Fenosa Central America in his last posting, prior to which he had worked as Financial Analyst in Management Control and Investments. He is a Trustee of the Aboitiz Foundation, Inc. He graduated from the Ateneo de Manila University with a degree in Interdisciplinary Studies and subsequently obtained his Masters in Business Administration and Economics from the IESE-University of Navarre in Barcelona, Spain.

81 • SEC FORM 17-A (ANNUAL REPORT)
ROLANDO C. CABRERA, First Vice President - Chief Risk Management Officer, Ex-Officio Member - Board Audit Committee and Board Risk Management Committee Mr. Cabrera, 64 years old, Filipino, has been First Vice President – Chief Risk Management Officer of A V since 2009. He was Director and Senior Risk Management and Corporate Governance Advisor of KPMG Philippines Manabat Sanagustin & Co. prior to his appointment in AE V. He was formerly the Executive Director and Principal Consultant of riskWAT CH International, Inc., a consulting company which provides risk management, risk assessment, risk treatment, and business continuity management services to various companies from 2001 to 2005, and Business Risk Manager of Fort Bonifacio Development Corporation from 1998 to 2001. He started his career in insurance and risk management at San Miguel Corporation, where he was Insurance Manager from 1981 to 1987, Risk Manager from 1987 to 1992, and Risk and Safety Manager from 1992 to 1995. He is the Chairman of the Board and Founding Director of Risk & Insurance Management Association of the Philippines (RIMAP). He was past Chairman of the Board of the Safety Organization of the Philippines (SO PI) in 1992 and in 1998. In 1991, he was awarded a Certificate of Merit in the Search for Risk Manager of the Year by CIGNA Europe in conjunction with Post Magazine. He graduated cum laude from San Beda College with a Bachelor in Commercial Science, major in Accounting and Auditing. He obtained his Masters in Business Administration (MBA) from the University of the Philippines, and is a Certified Public Accountant. He specializes in Enterprise Risk Management, Insurance, Safety Management, Corporate Governance and Business Continuity Management, having trained in the USA, Japan, Singapore and Hong Kong. PATRICK B. REYES, First Vice President - Corporate Finance Mr. Reyes, 39 years old, Filipino, has been First Vice President - Corporate Finance of AEV since 2009. Before joining AEV, he was President of Qbitron, a company that provides outsourcing services and management consulting to clients in the US and in the Philippines. He was a Senior Partner in The Ripples Group, a management consulting firm based in Newton, Massachusetts, from 2004 to 2006 and Chief Operating Officer of Citizens Health LLC, a healthcare company based in Boston, Massachusetts from 2002 to 2004. He was also a consultant with the international strategy-consulting firm, Bain & Company, Inc. from 1994 to 2002. Mr. Reyes earned his Bachelor of Science in Management, summa cum laude, from the Boston College Wallace E. Carroll School of Management and his MBA from Harvard University’s Graduate School of Business Administration. MELINDA RIVERA-BATHAN, Vice President - Controller Ms. Bathan, 51 years old, Filipino, has been Vice President-Controller of AEV since 2004. She was previously Assistant Vice President- Controller of AEV from 1997 until 2004. She graduated summa cum laude from St. Theresa’s College with a Bachelor of Science degree in Commerce, major in Accounting and obtained her license as a Certified Public Accountant. She completed her Masters in Management from the University of the Philippines with honors. NARCISA S. LIM, Vice President - Human Resources Ms. Lim, 47 years old, Filipino, has been Vice President for Human Resources of AEV since August 2008. She was Assistant Vice President for Human Resources of AEV from 2004 to 2008. She holds a degree in International Studies from Maryknoll College. JOSEPH TRILLANA T. GONZALES, Vice President - Legal and Corporate Services Mr. Gonzales, 44 years old, Filipino, has been Vice President – Legal of AEV since 2008. He is also Corporate Secretary of AP Renewables, Inc. and Assistant Corporate Secretary of Aboitiz Power Corporation. He was previously Special Counsel of SyCip Salazar Hernandez & Gatmaitan Law Offices until he joined the Aboitiz Group in 2007 as Assistant Vice President of the Corporate and Legal Services of Aboitiz & Company, Inc. He is a graduate of Bachelor of Arts in Economics and Bachelor of Laws from the University of the Philippines. He also has a Master of Laws degree from the University of Michigan.

82 • SEC FORM 17-A (ANNUAL REPORT)
MA. LUISA MOLINA-SALUD, Vice President - Branding Ms. Salud, 46 years old, Filipino, has been Vice President for Branding of AEV since 2011. Prior to joining AEV, she was previously connected with numerous advertising firms such as Hemisphere-Leo Burnett, McCann Erickson Philippines, Basic/Foote, Cone & Belding and Olbes, Ogilvy & Mather as Account Director. She is a graduate of Bachelor of Science in Commerce major in Marketing Management from St. Scholastica’s College, with some units in Master of Business Administration from De la Salle University. CAROLINE G. BALLESTEROS, Assistant Vice President - Corporate Communications Ms. Ballesteros, 48 years old, Filipino, has been Assistant Vice President for Corporate Communications of AEV since 2011. She joined AEV in 2005 as Assistant Vice President for Branding and Corporate Communications. Before joining AEV, she was Corporate Communications Officer – VISMIN at Etelecare Global Solutions, and a TV Host/News Anchor of ABS-CBN, Cebu Regional Station. She graduated summa cum laude, Bachelor of Science in Commerce, major in Accounting from the University of San Jose-Recoletos, Cebu City. RIELLA MAE CHRISTA B. GUIOGUIO, Assistant Vice President - Corporate Finance Ms. Guioguio, 33 years old, Filipino, has been Assistant Vice President for Corporate Finance of AEV since 2010. She has been with the Aboitiz Group for 12 years holding various accounting & finance positions. She was Accounting Manager of various companies including Aboitiz and Company, Inc. and Aboitiz Equity Ventures, Inc. from 2005 until her promotion to Assistant Vice President – Corporate Finance in 2010. A magna cum laude graduate of Bachelor of Science in Accountancy from the University of San Carlos, she obtained her Masters in Management major in Business Management from the University of the Philippines - Visayas, Cebu. STELLA OLIVE A. SUCALIT Assistant Vice President - Talent Management Ms. Sucalit, 48 years old, Filipino, has been Assistant Vice President- Talent Management since 2010. She was previously Assistant Vice President for Corporate Finance of AEV from 2004 until 2009. She obtained her Bachelor of Science degree in Business Administration and Accountancy from the University of the Philippines. RONALDO S. RAMOS, Assistant Vice President - Business Risk Management Mr. Ramos, 32 years old, Filipino, has been Assistant Vice President for Business Risk Management of AEV since 2009. He has extensive experience in risk management, internal and IT audits and business process reviews. Prior to joining AEV, he was Senior Manager for Risk Advisory Services of KPMG Philippines. He was an auditor of Petron Corporation handling Supply and Distribution Operations from 2002 to 2006, and Audit and Business Advisory Services associate of SGV & Co. from 1999 to 2002 handling audits of the country’s top manufacturing and airline companies. He is a graduate of Bachelor of Science in Accountancy from De La Salle University and is a Certified Public Accountant, Certified Internal Auditor and a Certified Information Systems Auditor. JACKSON O. SOTINGCO Assistant Vice President – Insurance Risk Management Mr. Sotingco, 40 years old, Filipino, has been Assistant Vice President for Insurance Risk Management of AEV since 2011. Before joining AEV, Mr. Sotingco was Risk Management Manager of the SN Aboitiz Power Group. He was Underwriting/Risk Management Manager of Unicon Insurance Brokers Corp. of the JG Summit Group of Companies and Risk Management Associate of San Miguel Corporation. He started his career in the field of insurance as a Risk Engineer with UCPB General Insurance Co., Inc. and has more than 15 years of experience in risk management and insurance. Mr. Sotingco is a graduate of Bachelor of Science in Civil Engineering from De La Salle University.

83 • SEC FORM 17-A (ANNUAL REPORT)
M. CARMELA N. FRANCO, Assistant Vice President – Investor Relations Ms. Franco, 39 years old, Filipino, has been Assistant Vice President for Investor Relations of AEV since 2008. Prior to her stint with AEV, she was connected with San Miguel Corporation as Investor Relations Officer of its Corporate Finance Group and later as Senior Project Analyst of its Corporate Planning Group. She was a Trader, Associate and Credit Analyst of Capital One Equities Corporation & Multinational Investment Bancorporation from 1992 to 1994 and was formerly an Investment Analyst of ING Barings (Phils), Inc. & Kim Eng Securities (Phils), Inc. from 1994 to 1997. She was also an Investment Officer of Standard Chartered Bank from 1998 to 2000 and went on to serve as Project Analyst of Newgate Management, Inc. from 2000 to 2002. She is a Bachelor of Science in Business Economics graduate (cum laude) from the University of the Philippines. LEAH I. GERALDEZ, Assistant Vice President - Legal & Corporate Services, Assistant Corporate Secretary Ms. Geraldez, 41 years old, Filipino, has been Assistant Vice President - Legal of AEV since 2008 and Assistant Corporate Secretary of AEV since 2006. She is also Corporate Secretary of various companies in the Aboitiz Group including Aboitiz & Company, Inc., City Savings Bank, Inc., Aboitiz Land, Inc., Hedcor, Inc., Hedcor Sibulan, Inc., Manila-Oslo Renewable Enterprise, Inc., Aboitiz Renewables, Inc., Pilmico Foods Corporation, Tsuneishi Heavy Industries (Cebu), Inc., SN Aboitiz Power-Benguet, Inc., SN Aboitiz Power-Magat, Inc., and Aboitiz Foundation, Inc. She earned her Bachelor of Arts in Anthropology and Bachelor of Laws from the University of San Carlos. JULIE ANN T. DIONGZON, Assistant Vice President - Treasury Ms. Diongzon, 41 years old, Filipino, has been Assistant Vice President for Treasury of AEV since 2009. A B.S. Commerce graduate from the University of San Carlos, she has been with the Aboitiz Group for more than 18 years, holding various accounting and finance positions. AYLMERITA C. PENALOZA, Assistant Vice President -Treasury Ms. Penaloza, 39 years old, Filipino, has been Assistant Vice President for Treasury of AEV since 2010. Prior to joining AEV, Ms. Penaloza was Senior Assistant Vice President for Coverage Corporate and Financial Institution of Credit Agricole CIB Manila Offshore Branch and Relationship Manager for Corporate Banking of Banco de Oro Universal Bank and Security Bank Corporation. She holds a Bachelor of Science degree in Commerce Major in Accounting from the University of Santo Tomas and an MBA from the Ateneo Graduate School of Business. She is also a licensed Trader for Money Market and Foreign Exchange under the Bankers Association of the Philippines Treasury Certification Program. IRIS LOUISE R. DORADO, Assistant Vice President - Audit Ms. Dorado, 30 years old, Filipino, has been Assistant Vice President for Audit since 2009. She joined the Aboitiz Group in 2007 as Corporate Audit Manager of Aboitiz & Company, Inc. She was previously Region Finance Officer of Monterey Foods Corp. from 2005 to 2007 and Senior Internal Auditor of San Miguel Corporation from 2002 to 2005. A magna cum laude graduate of B.S. Accountancy from the University of San Carlos, she is a Certified Public Accountant (Philippine Institute of Certified Public Accountants), a Certified Internal Auditor (The Institute of Internal Auditors, Inc. – U.S.A) and a Certified QA Validator (The Institute of Internal Auditors, Inc. – Philippines). MA. KRISTINA V. RIVERA, Assistant Vice President - Human Resources Ms. Rivera, 40 years old, Filipino, has been Assistant Vice President for Human Resources of AEV seconded to Aboitiz Power Corporation since 2009. She has 17 years experience in human resources management with a diverse background in human resource strategic planning, implementation and administration. Before joining the Aboitiz Group in 2003, she was with the PNOC-Energy

84 • SEC FORM 17-A (ANNUAL REPORT)
Development Corporation. She holds Bachelor of Science and Masters degrees in Psychology from the University of the Philippines. GERALDINE POLANCO-ONGANON, Assistant Vice President - Human Resources Ms. Onganon, 40 years old, Filipino, has been Assistant Vice President for Human Resources seconded to the Food Group of AEV since 2009. She has been with the Aboitiz Group for over 15 years, holding various positions in human resources in different Aboitiz companies. Before she was seconded to FBMA Marine, Inc. as Assistant Vice President – Human Resources in 2005, she was Manager for Human Resources of Aboitiz & Company, Inc. from 2001 to 2005. She is a graduate of A.B. Behavioral Science from the University of Santo Tomas. CHRISTOPHER M. CAMBA, Assistant Vice President - Human Resources Mr. Camba, 32 years old, Filipino, has been Assistant Vice President for Human Resources of AEV since 2009. He joined the Aboitiz Group in 2001 as Corporate Auditor of Aboitiz & Company, Inc. He was assigned to the Human Resources Department of Aboitiz & Company, Inc. in 2004, where he was seconded as Human Resources Manager of Aboitiz Construction Group, Inc. He is a graduate of B.S. Accountancy from the University of San Carlos. ROBIN PATRICK R. SARMIENTO, Assistant Vice President – Strategy Mr. Sarmiento, 31 years old, Filipino, has been Assistant Vice President for Strategy of AEV since 2010. Before joining AEV, Mr. Sarmiento was an Investment Analyst of ATR Kim Eng Securities. He was also Strategic Finance and Analysis Manager of American Golf Corporation in California. He earned his degree in Bachelor of Interdisciplinary Studies in Management and Communications from Ateneo de Manila University. Period in which the Directors and Executive Officers Should Serve The directors and executive officers should serve for a period of one year. Term of Office of a Director Pursuant to the Company’s By-laws, the directors are elected at each annual stockholders’ meeting by stockholders entitled to vote. Each director holds office until the next annual election for a term of one year and until his successor is duly elected unless he resigns, dies or is removed prior to such election. Any vacancy in the Board of Directors other than by removal or expiration of term may be filled by a majority vote of the remaining members thereof at a meeting called for that purpose, if they still constitute a quorum. The director so chosen shall serve for the unexpired term of his predecessor in office. (2) Significant Employees AEV considers the contribution of every employee important to the fulfillment of its goals. (3) Family Relationships
Messrs. Jon Ramon, Roberto and Mikel Aboitiz are brothers and are thus related to each other within the fourth civil degree of consanguinity. Messrs. Erramon, Enrique, Jr. and Xavier Jose Aboitiz are brothers and are thus related to each other within the fourth civil degree of consanguinity. They are also related within the fourth civil degree of consanguinity to Mr. Stephen G. Paradies, who is their first cousin.

85 • SEC FORM 17-A (ANNUAL REPORT)
(4) Involvement in Certain Legal Proceedings as of February 28, 2011 People of the Philippines vs. Renato Francisco et. al. (c/o Fuller O’ Brien Paint Company, Inc., Reliance St., Mandaluyong City) Criminal Case No. 35-5784 MTC Branch 66, Makati City July 19, 2007 On July 23, 2008, the Metropolitan Trial Court (MTC) of Makati issued an Order finding probable cause to hold the alleged directors/stockholders of Fuller O’Brien Paint Company, Inc. (Fuller O’Brien), including Erramon I. Aboitiz, liable for violation of PD No. 1752 or the Pag-Ibig Fund Law, as amended. Upon motion by Mr. Aboitiz, the MTC reconsidered its order finding probable cause against him. The MTC also directed the Office of the City Prosecutor of Makati to conduct a preliminary investigation against Mr. Aboitiz. In the preliminary investigation, Mr. Aboitiz alleged that he should be exonerated from the charges filed against him as he was no longer a director of Fuller O’Brien when the alleged violations of the Pag-Ibig Fund Law occurred.
The case is still pending resolution before the Office of the City Prosecutor of Makati. To the knowledge and/or information of AEV, other than as disclosed above, none of its nominees for election as directors, its present members of the Board of Directors or its executive officers, is presently or during the last five years, been involved in any legal proceeding in any court or government agency in the Philippines or elsewhere which would put to question their ability and integrity to serve AEV and its stockholders. To the knowledge and/or information of AEV, the above-said persons have not been convicted by final judgment of any offense punishable by the laws of the Republic of the Philippines or by the laws of any other nation or country.
(a) Parent Company The parent and the ultimate parent of AEV is Aboitiz & Company, Inc. (b) Resignation or Refusal to Stand for Re-election by Members of the Board of Directors
No director has resigned nor declined to stand for re-election to the Board of Directors since the date of AEV’s last annual meeting because of a disagreement with AEV on matters relating to its operations, policies and practices.
Item 10. Executive Compensation (1) Summary of Compensation Table Information as to the aggregate compensation paid or accrued to AEV’s Chief E xecutive Officer and other highly compensated executive officers, as well as other directors and officers during the last two completed fiscal years and the ensuing fiscal year are as follows:

86 • SEC FORM 17-A (ANNUAL REPORT)
Directors and Executive Officers Period Salary Bonus Other
Compensation Top Highly-Compensated Executives: Erramon I. Aboitiz - Chief Executive Officer Roberto E. Aboitiz - Director Stephen G. Paradies - SVP/Chief Financial Officer Xavier Jose Aboitiz - SVP/Chief Human Resources Officer Patrick B. Reyes - First Vice President/Corporate Finance M. Jasmine S. Oporto - First Vice President/Chief Legal officer
Actual 2010 P14,178,146 P1,085,000 P2,403,021 Actual 2009 P21,579,363 P1,685,000 P8,109,395 All above named officers as a group
Projected 2011 P14,636,650 P1,085,000 P2,411,905
Actual 2010 P18,499,851 P1,763,250 P13,889,848 Actual 2009 P17,979,577 P1,393,500 P9,973,948
All other directors and officers as a group unnamed Projected 2011 P23,786,243 P1,763,250 P24,572,522
(2) Compensation of Directors (i) Standard Arrangements In 2010, all of AEV’s directors received a monthly allowance of π80,000 except for the Chairman of the Board who received a monthly allowance of π120,000. In addition, each director and the Chairmen of the Board and the Board Committees received a per diem for every Board or Committee meeting attended as follows:
Type of Meeting Directors Chairman of the Board Board Meeting P60,000 P90,000
Type of Meeting Committee Members Chairman of the Committee
Committee Meeting P50,000 P60,000 For 2011 it is proposed that all of AEV’s directors shall receive a monthly allowance of π100,000, except for the Chairman of the Board who shall receive a monthly allowance of π150,000. In addition, each director and the Chairmen of the Board and the Board Committees shall receive a per diem for every Board or Committee meeting attended as follows:
Type of Meeting Directors Chairman of the Board Board Meeting P100,000 P150,000
Type of Meeting Committee Members Chairman of the Committee
Committee Meeting P80,000 P100,000

87 • SEC FORM 17-A (ANNUAL REPORT)
The proposed monthly allowance and per diem of the AEV directors for 2011 will be submitted for the approval of the stockholders during the 2011 Annual Stockholders’ Meeting. (ii) Other Arrangements Other than payment of a director’s allowance and per diem as stated, there are no standard arrangements pursuant to which directors of the Company are compensated, or are to be compensated, directly or indirectly, for any services provided as a director. (3) Employment Contracts and Termination of Employment and Change-in-Control Arrangements There is no compensatory plan or arrangement between AEV and any executive in case of resignation or any other termination of employment or from a change in the management control of AEV. (4) Warrants and Options Outstanding To date, AEV has not granted any stock option to its directors or officers. Item 11. Security Ownership of Certain Beneficial Owners and Management
(1) Security Ownership of Certain Record and Beneficial Owners (more than 5%) as of February 28,
2011
Title of Class
Name/Address of Stockholder and Beneficial Owner
Relationship with AEV Citizenship
No. of Shares and Nature of
Ownership (Record or Beneficial)
Percent of Class
Common
1. Aboitiz & Company, Inc.4 Aboitiz Corporate Center Gov. Manuel A. Cuenco Avenue, Kasambagan, Cebu City 6000
Stockholder
Filipino
2,735,600,915
(Record and Beneficial)
49.54%
Common
2. PCD Nominee Corp.
Stockholder
Filipino
644,656,703
(Record)
11.67%
Common
3. Ramon Aboitiz Foundation, Inc.5 35 Lopez Jaena St., Cebu City
Stockholder
Filipino
420,915,863 (Record and
Beneficial)
7.62%
Aboitiz & Company, Inc. (ACO) is a corporation wholly owned by the Aboitiz family. No single stockholder, natural or juridical, owns 5% or more of the shareholdings of ACO.
4 Mr. Erramon I. Aboitiz, ACO President and Chief Executive Officer, will vote for the shares of ACO in AEV in accordance with the directive of the ACO Board of Directors. 5 Mr. Roberto E. Aboitiz, President of the Ramon Aboitiz Foundation, Inc. (RAFI), will vote for the shares of RAFI in AEV in accordance with the directive of the RAFI Board of Trustees.

88 • SEC FORM 17-A (ANNUAL REPORT)
(2) Security Ownership of Management as of February 28, 2011 (Record and Beneficial)
Name of Beneficial Owner
and Position
Title of Class
No. of Shares and Nature of Ownership
(Record or Beneficial)
Citizenship
Percentage of Ownership
1,000 Direct 0.00%Erramon I. Aboitiz President and Chief Executive Officer
Common 33,364,099 Indirect
Filipino 0.60%
6,000 Direct 0.00%Enrique M. Aboitiz Jr. Senior Vice President/Director Common
2,898,000 Indirect Filipino
0.05%2,489,548 Direct 0.05%Roberto E. Aboitiz
Director Common
103,425,929 Indirect Filipino
1.87%Justo A. Ortiz Director
Common 1 Direct Filipino 0.00%
1,000 Direct 0.00%Antonio R, Moraza Director
Common 30,072,671 Indirect
Filipino 0.54%
Roberto R. Romulo Independent Director
Common 100 Direct Filipino 0.00%
100 Direct 0.00%Jose C. Vitug Independent Director
Common 72,020 Indirect
Filipino 0.00%
Stephen T. CuUnjieng Independent Director
Common 100 Direct Filipino 0.00%
Stephen G. Paradies Senior Vice President/Chief Financial Officer/Corporate Info. Officer
Common 22,380,003 Indirect Filipino 0.41%
Juan Antonio E. Bernad Senior Vice President
Common 730,351 Direct Filipino 0.01%
1,998,236 Direct 0.04%Xavier Jose Aboitiz Senior Vice President - Chief Human Resources
Common 9,790,810 Indirect
Filipino 0.18%
1,574,548 Direct 0.03%Mikel A. Aboitiz Senior Vice President/Chief Information Officer/Chief Strategy Officer
Common
90,053,888 Indirect
Filipino
1.63%
Gabriel T. Mañalac Senior Vice President - Group Treasurer
Common
10,000 Direct Filipino 0.00%
Luis Miguel Aboitiz First Vice President
Common 20,092,133 Direct Filipino 0.36%
M. Jasmine S. Oporto First Vice President - Chief Legal Officer/Corporate Secretary/Compliance Officer
Common 11,000 Direct Filipino 0.00%
Horacio C. Elicano First Vice President - Chief Technology Officer
Common 3,000 Direct Filipino 0.00%
Sebastian R. Lacson First Vice President - Chief Reputation Officer
Common 1,200 Direct Filipino 0.00%
Rolando C. Cabrera First Vice President - Chief Risk Management Officer
Common 5,000 Direct Filipino 0.00%
Patrick B. Reyes First Vice President - Corporate Finance
N/A 0 N/A Filipino 0.00%
Melinda R. Bathan Vice President - Controller
Common 12,829 Direct Filipino 0.00%
Narcisa S. Lim Vice President - Human Resources
Common 2,520 Direct Filipino 0.00%
Joseph Trillana T. Gonzales Vice President - Legal and Corporate Services
Common 20,000 Direct Filipino 0.00%

89 • SEC FORM 17-A (ANNUAL REPORT)
Name of Beneficial Owner
and Position
Title of Class
No. of Shares and Nature of Ownership
(Record or Beneficial)
Citizenship
Percentage of Ownership
Ma. Luisa Molina-Salud Vice President - Branding
N/A 0 N/A Filipino 0.00%
Caroline G. Ballesteros Assistant Vice President - Corporate Communications
N/A 0 N/A Filipino 0.00%
Riella Mae Christa B. Guioguio Assistant Vice President - Corporate Finance
N/A 0 N/A Filipino 0.00%
Stella Olive A. Sucalit Assistant Vice President - Talent Management
N/A 0 N/A Filipino 0.00%
Ronaldo S. Ramos Assistant Vice President - Business Risk Management
N/A 0 N/A Filipino 0.00%
Jackson A. Sotingco Assistant Vice President - Insurance Risk Management
N/A 0 N/A Filipino 0.00%
M. Carmela N. Franco Assistant Vice President - Investor Relations
Common 4,680 Direct Filipino 0.00%
Leah I. Geraldez Assistant Vice President - Legal and Corporate Services/Assistant Corporate Secretary
Common 10,000 Direct Filipino 0.00%
Julie Ann T. Diongzon Assistant Vice President - Treasury
N/A 0 N/A Filipino 0.00%
Aylmerita C. Peñaloza Assistant Vice President - Treasury
N/A 0 N/A Filipino 0.00%
Iris Louise R. Dorado Assistant Vice President - Audit
N/A 0 N/A Filipino 0.00%
Ma. Kristina V. Rivera Assistant Vice President - Human Resources
N/A 0 N/A Filipino 0.00%
Geraldine Polanco-Onganon Assistant Vice President - Human Resources
N/A 0 N/A Filipino 0.00%
Christopher M. Camba Assistant Vice President - Human Resources
N/A 0 N/A Filipino 0.00%
Robin Patrick R. Sarmiento Assistant Vice President -Strategy
N/A 0 N/A Filipino 0.00%
TOTAL 319,030,766 5.78%
(3) Voting Trust Holders of 5% or More of Common Equity No person holds more than 5% of AEV’s common equity under a voting trust or similar agreement. (4) Changes in Control There are no arrangements that may result in a change in control of AEV during the period covered by this report. Item 12. Certain Relationships and Related Transactions AEV and its subsidiaries (the Group), in their regular conduct of business, have entered into related party transactions consisting of temporary advances, professional services and rental fees. These are made on an arm’s length basis and at current market prices at the time of the transactions.

90 • SEC FORM 17-A (ANNUAL REPORT)
ACO, the parent company of AEV, and certain subsidiaries and associates have service contracts with AEV for corporate center services rendered, such as human resources, internal audit, legal, treasury and corporate finance, among others. These services are obtained from AEV to enable the Group to realize cost synergies. AEV maintains a pool of highly qualified professionals with business expertise specific to the businesses of the Group. Transactions are priced on a cost recovery basis. In addition, transaction costs are always benchmarked on third party rates to ensure competitive pricing. Service Level Agreements are in place to ensure quality of service. The Group extends to and/or avails of temporary interest-bearing advances from ACO and certain associates for working capital requirements. These are made to enhance the parent companies’ yield on their cash balances. Interest rates are determined by comparing prevailing market rates at the time of the transaction. ACO and certain associates are leasing office spaces from Cebu Praedia Development Corporation (CPDC), a subsidiary of AEV. Rental rates are comparable with prevailing market prices. These transactions are covered with lease contracts for a period of three years. No other transaction, without proper disclosure, was undertaken by the Company in which any director or executive officer, any nominee for election as director, any beneficial owner (direct or indirect) or any member of his immediate family was involved or had a direct or indirect material interest. AEV employees are required to promptly disclose any business and family-related transactions with the Company to ensure that potential conflicts of interest are determined and brought to the attention of management. Parent Company The parent and the ultimate parent of AEV is Aboitiz & Company, Inc.
PART IV – CORPORATE GOVERNANCE Item 13. Corporate Governance AEV has a Manual of Corporate Governance (the Manual) and Code of Ethics and Business Conduct (the Code) to guide the attainment of its corporate goals and strategies. To ensure compliance, copies of the Manual and the Code were disseminated to the Board of Directors, management and employees of AEV. Company-wide orientations on the Manual and the Code were conducted as well. AEV has in place a performance evaluation system for corporate governance. It also participated, and intends to participate in, the annual Corporate Governance Scorecard Survey of the SEC and the PSE to benchmark its corporate governance practices against best practices. The Compliance Officer regularly monitors and evaluates compliance by the Board of Directors, management and employees of the Manual and existing laws and regulations. Together with the Human Resources Department, the Compliance Officer also ensures the implementation of AEV’s rule against conflict of interests and the misuse of inside and proprietary information throughout the organization. The Compliance Officer regularly reports to the Board Governance Committee and the Board Audit Committee the Company’s compliance status with existing laws and regulations, as well as the Board’s and employees’ compliance with internal governance policies. Corporate governance is further fostered by the Board’s active role in reviewing and approving corporate goals and strategies set by management as well as in monitoring and evaluating management performance in meeting such corporate goals. The different Board committees, which report regularly to the Board, are crucial to maintaining Board oversight in key management areas.

91 • SEC FORM 17-A (ANNUAL REPORT)
The Board of Directors regularly reviews the Manual to ensure that the same remains relevant and is responsive to the needs of the organization. Board Attendance The Board’s primary objectives are to improve shareholder returns, to develop responsible long-term investors, and to achieve disciplined and sustainable growth. In 2010, the Board held eight regular and special meetings. Below is a summary of the attendance of the Directors:
REGULAR MEETING
REGULAR MEETING
SPECIAL EXECUTIVE STRATEGY SESSIONS
REGULAR MEETING
REGULAR MEETING
REGULAR MEETING
REGULAR MEETING
SPECIAL EXECUTIVE STRATEGY SESSIONS DIRECTORS
13-Jan 10-Mar 6-Apr 17-May 14-Jul 15-Sep 12-Nov 1-Dec
TOTAL NO. OF
MEETINGS ATTENDED
BY EACH
DIRECTOR
PERCENTAGE OF MEETINGS
ATTENDED BY EACH DIRECTOR
JON RAMON ABOITIZ
Present Present Present Present Present Present Present Present 8/8 100.0%
ERRAMON I. ABOITIZ
Present Present Present Present Present Present Present Present 8/8 100.0%
ENRIQUE M. ABOITIZ JR.
Present Present Present Present Present Present Present Present 8/8 100.0%
ROBERTO E. ABOITIZ
Present Present Present Absent Present Absent Present Present 6/8 75.0%
JUSTO A. ORTIZ Present Present Present Present Present Present Present Present 8/8 100.0%
ANTONIO R. MORAZA
Present Present Present Present Present Present Present Present 8/8 100.0%
JOSE C. VITUG (Independent Director)
Present Present Present Present Present Present Present Present 8/8 100.0%
ROBERTO R. ROMULO (Independent Director)
Present Present Absent Present Present Present Absent Present 6/8 75.0%
MIKEL A. ABOITIZ*
Present Present Present Present - - - - 4/4 100.0%
STEPHEN CUUNJIENG** (Independent Director)
- - - Present Present Absent Present Absent 4/5 80.0%
TOTAL NO. OF DIRECTORS PRESENT IN EACH MEETING
9/9 9/9 8/9 9/9 9/9 8/9 8/9 7/9
PERCENTAGE OF NO. OF DIRECTORS
100.0% 100.0% 88.9% 100.0% 100.0% 88.9% 88.9%
77.8%
Legend: P - Present; A - Absent *Mr. Mikel A. Aboitiz was Director until May 17, 2010 **Mr. Stephen CuUnjieng was elected as Independent Director on May 17, 2010.
Corporate Governance Initiatives During its regular meeting on February 11, 2009, the AEV Board of Directors approved the creation of additional Board committees and the consolidation of existing ones. The reorganization aims to (a) enhance the role of the Board of Directors in governance, (b) better represent and protect the interests of all stakeholders of the Company, (c) ensure compliance with regulatory standards and provide appropriate information and updates. In the Amended Manual on Corporate Governance submitted to the SEC on September 24, 2009, the Investor Relations Committee was dissolved and the Board Nominations and Compensation

92 • SEC FORM 17-A (ANNUAL REPORT)
Committee merged with the Board Corporate Governance Committee. It is now called the Board Corporate Governance Committee. On a regular meeting held on May 17, 2010, the Board approved an amendment to the Company’s Amended Manual on Corporate Governance consisting of the folding in of the responsibility of the Board Strategy Committee. As decided by the Board, the functions of the Board Strategy Committee are now subsumed under the functions of the Board of Directors. The mandate as well as the composition of each Board committee are described below:
• The Board Corporate Governance Committee shall represent the Board in discharging its responsibility relating to issues around the Group’s governance principles and guidelines, nomination of persons into Board and Group senior leadership roles and the various compensation matters. Independent Directors comprise majority of the voting members of the Board Corporate Governance Committee.
Chairman: Jon Ramon Aboitiz; Members: Roberto E. Aboitiz, Jose C. Vitug, Roberto R. Romulo, Stephen CuUnjieng; Ex-Officio Members: M. Jasmine S. Oporto, Sebastian R. Lacson, Xavier Jose Aboitiz.
• The Board Audit Committee shall represent the Board in discharging its responsibility
related to audit matters for the Group. Independent Directors comprise majority of the voting members of the Board Audit Committee.
Chairman: Joce C. Vitug; Members: Roberto R, Romulo, Stephen CuUnjieng, Roberto E. Aboitiz, Justo A. Ortiz; Ex-Officio Members: Stephen G. Paradies, Rolando C. Cabrera.
• The Board Risk Management Committee shall represent the Board in discharging its
responsibility relating to risk management related matters around the Group.
Chairman: Jon Ramon Aboitiz; Members: Justo A. Ortiz, Enrique M. Aboitiz Jr., Stephen CuUnjieng; Ex-Officio Members: Stephen G. Paradies, Rolando C. Cabrera.

Annual Report 2010 101
SEC FORM 20 - IS (INFORMATION STATEMENT)
Below is AEV’s Organizational Structure:
AEV
Org
aniz
atio
nal S
truc
ture
Chai
rman
Boar
d Co
rpor
ate
Gov
erna
nce
Com
mit
tee
Boar
d Ri
sk M
anag
emen
t Com
mit
tee
Boar
d A
udit
Com
mit
tee
Boar
d
Corp
orat
e Se
cret
ary
GRO
UP
CEO
CHIE
F FI
NA
NCI
AL
OFF
ICER
T
reas
ury
T
ax P
lann
ing
In
vest
or R
elat
ions
F
inan
cial
Ana
lysi
s
Pro
cure
men
t
Con
trol
ler
S
hare
d Se
rvic
es
O
rgan
izat
iona
l
Man
agem
ent
L
eade
rshi
p
Dev
elop
men
t
Tal
ent M
anag
emen
t
Per
form
ance
Rev
iew
C
orpo
rate
Pla
nnin
g
Cor
pora
te F
inan
ce
Res
earc
h
Inve
stm
ents
A
cqui
siti
on
D
ives
titu
res
B
rand
C
orpo
rate
Com
mun
iicat
ions
P
ublic
Rel
atio
ns
Fou
ndat
ion
C
orpo
rate
Soc
ial
Re
spon
sibi
lity
R
isk
Ass
essm
ent/
M
itig
atio
n
Insu
ranc
e
Cap
tive
Co.
O
ther
Ris
ks
G
roup
Inte
rnal
Aud
itCh
ief L
egal
Off
icer
C
orpo
rate
Sec
reta
ry
Reg
ulat
ory
L
itig
atio
n/Ta
x
C
orpo
rate
Adm
inis
trat
ion
F
acili
ties
Man
agem
ent
Chie
f Tec
hnol
ogy
Off
icer
T
echn
olog
y
ICT
Infr
astr
uctu
re
Busi
ness
Par
tner
s
CHIE
F H
UM
AN
RESO
URC
E O
FFIC
ERCH
IEF
STRA
TEG
YO
FFIC
ERCH
IEF
REPU
TATI
ON
OFF
ICER
CHIE
F RI
SKM
AN
AG
EMEN
TO
FFIC
ER
CEO
- P
OW
ER
CEO
- B
AN
KIN
G
CEO
- F
OO
D

94 • SEC FORM 17-A (ANNUAL REPORT)
PART V – EXHIBITS AND SCHEDULES Item 14. Exhibits and Reports on SEC Form 17-C (a) Exhibits.
None
(b) Reports on SEC Form 17-C Reports filed by the AEV on SEC Form 17-C from May 2010 to March 2011 are as follows:
Date Disclosure Details May 7, 2010 First quarter 2010 financial and operating results
May 14, 2010 Signing of a Notes Facility Agreement May 17, 2010 Amendment to the Manual on Corporate Governance May 17, 2010 Result of the 2010 annual stockholders' meeting
a) Election of the members of the Board of Directors b) Delegation of the authority to elect the Company's external auditors for 2010 to the Board of Directors. c) Approval of Directors, compensation and per diem
May 17, 2010 Appointment of officers and Board committee members June 28, 2010 Appointment of Mr. Robin Patrick Sarmiento as Assistant Vice President for
Strategy July 8, 2010 Appointment of Ms. Aylmerita Peñaloza as Assistant Vice President for
Treasury August 5, 2010 Purchase of 2.4 million UBP shares August 5, 2010 First half 2010 financial and operating results August 6, 2010 Purchase of 2.5 million UBP shares August 9, 2010 Purchase of 1.1 million UBP shares
August 12, 2010 Purchase of 3.6 million UBP shares August 13, 2010 Purchase of 780 ,000 UBP shares August 16, 2010 Apointment of Sycip Gorres Velayo & Company as AEV's external auditor August 17, 2010 Purchase of 3.9 million UBP shares
November 5, 2010 Third quarter 2010 financial and operating results November 12, 2010 Approval of the amendment to the Internal Audit Charter and By-Laws November 24, 2010 Approval by the Bangko Sentral ng Pilipinas the acquisition of City Savings
Bank shares December 1, 2010 Acceptance of the offer of Negros Navigation Co., Inc. (NENACO) to buy
AEV's shareholdings in Aboitiz Transport System (ATSC) Corporation December 2, 2010 Signing of the Securities Purchase Agreement with NENACO December 2, 2010 Sale of AEV shares by subsidiary, Aboitiz One, Inc.
December 28, 2010 Closing of the sale of the shareholdings of AEV and Aboitiz & Company, Inc. in ATS to NENACO
January 1, 2011 Appointment of Mr. Jackson Sotingco as Assistant Vice President for Insurance Risk Management
February 15, 2011 Appointment of Mr. Enrique M. Aboitiz, Jr. as Senior Vice President February 23, 2011 a. Final list of candidates qualified to be AEV's independent directors for the
2011 Annual Stockholders’ Meeting, namely: Mr. Roberto R. Romulo, Justice Jose C. Vitug (ret.) and Mr. Stephen CuUnjieng
b. List of other nominees for election as members of the Board of Directors for the 2011 Annual Stockholders’ Meeting.
March 3, 2011 Full year 2010 financial and operating results March 3, 2011 Matters approved by the Board:
a) Declaration of cash dividend in the amount of P1.58 per share to all stockholders of record as of the close of business hours on March 17, 2011

95 • SEC FORM 17-A (ANNUAL REPORT)
Date Disclosure Details and payable on April 5, 2011 b) Setting of March 31, 2011 as the record date for stockholders entitled to vote at the annual stockholders' meeting on May 16, 2011
c) 2011 remuneration of the Board of Directors for ratification during the annual stockholders' meeting on May 16, 2011
March 28, 2011 Appointment of Ms. Ma. Luisa Molina-Salud as Vice President for Branding


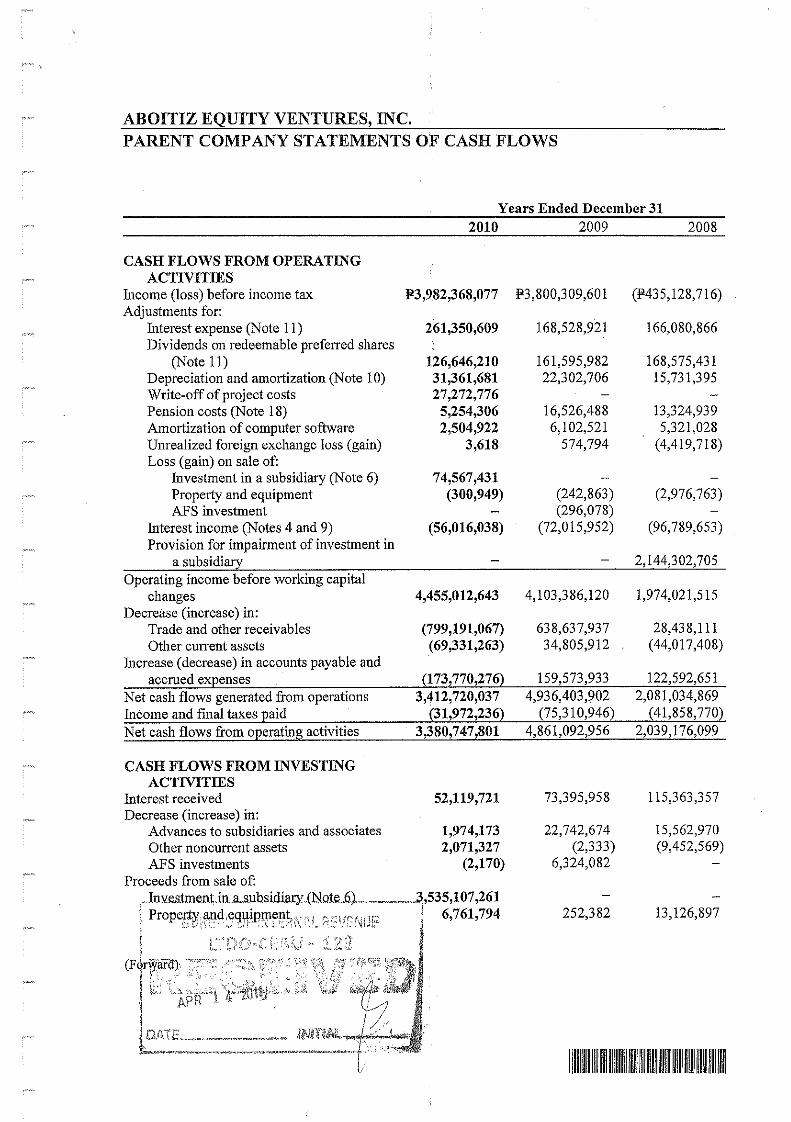


2
Amended and Revised Standards and Interpretations • PFRS 2, Share-based Payment (Amendment) - Group Cash-settled Share-based Payment
Transactions
• PFRS 3 (Revised), Business Combinations, and PAS 27 (Amended), Consolidated and Separate Financial Statements
• PAS 39, Financial Instruments: Recognition and Measurement (Amendment) - Eligible Hedged Items
• Philippine Interpretation IFRIC 17, Distribution of Non-cash Assets to Owners
Improvements to PFRS • PAS 1, Presentation of Financial Statements • PFRS 2, Share-based Payment • PFRS 5, Non-current Assets Held for Sale and Discontinued Operations
• PAS 7, Statement of Cash Flows
• PFRS 8, Operating Segments
• PAS 17, Leases • PAS 36, Impairment of Assets • PAS 38, Intangible Assets • PAS 39, Financial Instruments: Recognition and Measurement • Philippine Interpretation IFRIC 9, Reassessment of Embedded Derivatives • Philippine Interpretation IFRIC 16, Hedge of a Net Investment in a Foreign Operation
New Accounting Standards, Interpretations and Amendments to Existing Standards Effective Subsequent to December 31, 2010 The Company will adopt the standards and interpretations enumerated below when these become effective. Except as otherwise indicated, the Company does not expect the adoption of these new and amended PFRS and Philippine Interpretations and improvements to PFRS to have significant impact on the parent company financial statements. Effective in 2011 PAS 24 (Amended), Related Party Disclosures The amended standard is effective for annual periods beginning on or after January 1, 2011. It clarified the definition of a related party to simplify the identification of such relationships and to eliminate inconsistencies in its application. The revised standard introduces a partial exemption of disclosure requirements for government-related entities. Early adoption is permitted for either the partial exemption for government-related entities or for the entire standard. PAS 32, Financial Instruments: Presentation (Amendment) - Classification of Rights Issues The amendment to PAS 32 is effective for annual periods beginning on or after February 1, 2010 and amended the definition of a financial liability in order to classify rights issues (and certain options or warrants) as equity instruments in cases where such rights are given pro rata to all of the existing owners of the same class of an entity’s non-derivative equity instruments, or to acquire a fixed number of the entity’s own equity instruments for a fixed amount in any currency.

3
PFRS 7, Financial Instruments: Disclosures (Amendments) - Disclosures - Transfers of Financial Assets
The amendments to PFRS 7 are effective for annual periods beginning on or after July 1, 2011. The amendments will allow users of financial statements to improve their understanding of transfer transactions of financial assets (for example, securitizations), including understanding the possible effects of any risks that may remain with the entity that transferred the assets. The amendments also require additional disclosures if a disproportionate amount of transfer transactions are undertaken around the end of a reporting period. Philippine Interpretation IFRIC 14 (Amendment) - Prepayments of a Minimum Funding
Requirement The amendment to Philippine Interpretation IFRIC 14 is effective for annual periods beginning on or after January 1, 2011, with retrospective application. The amendment provides guidance on assessing the recoverable amount of a net pension asset. The amendment permits an entity to treat the prepayment of a minimum funding requirement as an asset. Philippine Interpretation IFRIC 19, Extinguishing Financial Liabilities with Equity Instruments Philippine Interpretation IFRIC 19 is effective for annual periods beginning on or after July 1, 2010. The interpretation clarifies that equity instruments issued to a creditor to extinguish a financial liability qualify as consideration paid. The equity instruments issued are measured at their fair value. In case that this cannot be reliably measured, the instruments are measured at the fair value of the liability extinguished. Any gain or loss is recognized immediately in the parent company statement of income. The adoption of this interpretation will have no effect on the financial statements of the Company Improvements to PFRS 2010 Improvements to PFRS is an omnibus of amendments to PFRS. The amendments have not been adopted as they become effective for annual periods on or after either July 1, 2010 or January 1, 2011. The amendments listed below, are considered to have a reasonable possible impact on the Company: • PFRS 3, Business Combinations • PFRS 7, Financial Instruments: Disclosures • PAS 1, Presentation of Financial Statements • PAS 27, Consolidated and Separate Financial Statements Effective in 2012 PAS 12, Income Taxes (Amendment) - Deferred Tax: Recovery of Underlying Assets The amendment provides a practical solution to the problem of assessing whether recovery of an asset will be through use or sale. It introduces a presumption that recovery of the carrying amount of an asset will, normally, be through sale. Philippine Interpretation IFRIC 15, Agreements for the Construction of Real Estate This Interpretation, effective for annual periods beginning on or after January 1, 2012, covers accounting for revenue and associated expenses by entities that undertake the construction of real estate directly or through subcontractors. The Interpretation requires that revenue on construction of real estate be recognized only upon completion, except when such contract qualifies as construction contract to be accounted for under PAS 11, Construction Contracts, or involves rendering of services in which case revenue is recognized based on stage of completion. Contracts involving provision of services with the construction materials and where the risks and reward of

4
ownership are transferred to the buyer on a continuous basis will also be accounted for based on stage of completion.

5
Effective in 2013 PFRS 9, Financial Instruments PFRS 9, as issued in 2010, reflects the first phase of the work on the replacement of PAS 39 and applies to classification and measurement of financial assets and financial liabilities as defined in PAS 39. The standard is effective for annual periods beginning on or after January 1, 2013. In subsequent phases, hedge accounting and derecognition will be addressed. The completion of this project is expected in the second quarter of 2011. The Company will assess the impact of the standard on its financial statements. Summary of Significant Accounting Policies Cash and Cash Equivalents Cash and cash equivalents in the parent company balance sheet consist of cash in banks and on hand and short-term deposits with an original maturity of three months or less from dates of placements and that are subject to insignificant risk of changes in value.
Financial Instruments Date of recognition The Company recognizes a financial asset or a financial liability in the parent company balance sheet on the date when it becomes a party to the contractual provisions of the instrument. All regular way purchases and sales of financial assets are recognized on trade date, which is the date that the Company commits to purchase the asset. Regular way purchases or sales of financial assets are purchases or sales of financial assets that require delivery of assets within the period generally established by regulation or convention in the marketplace. Initial recognition of financial instruments All financial assets and financial liabilities are recognized initially at fair value. Except for securities at FVPL, the initial measurement of financial assets includes transaction costs. The Company classifies its financial assets in the following categories: financial assets at FVPL, loans and receivables, held-to-maturity (HTM) investments, and AFS investments. For financial liabilities, the Company also classifies them into financial liabilities at FVPL and other liabilities. The classification depends on the purpose for which the investments were acquired and whether they are quoted in an active market. The Company determines the classification of its financial assets at initial recognition and, where allowed and appropriate, re-evaluates such designation at every reporting date. Financial instruments are classified as liabilities or equity in accordance with the substance of the contractual arrangement. Interest, dividends, gains and losses relating to a financial instrument or a component that is a financial liability, are reported as expense or income. Distributions to holders of financial instruments classified as equity are charged directly to equity net of any related income tax benefits. Determination of fair value The fair value of investments that are actively traded in organized financial markets is determined by reference to quoted market bid prices at the close of business on the balance sheet date. For investments where there is no active market, fair value is determined using valuation techniques. Such techniques include using recent arm’s length market transactions; reference to the current market value of another instrument, which are substantially the same; discounted cash flow analysis and other valuation models.

6
For all other financial instruments not listed in an active market, the fair value is determined by using appropriate valuation methodologies. Valuation methodologies include net present value techniques, comparison to similar instruments for which market observable prices exist, options pricing models, and other relevant valuation models. ‘Day 1’ difference Where the transaction price in a non-active market is different from the fair value of other observable current market transactions in the same instrument or based on a valuation technique whose variables include only data from observable market, the Company recognizes the difference between the transaction price and fair value (a ‘Day 1’ difference) in the parent company statement of income unless it qualifies for recognition as some other type of asset. In cases where use is made of data which is not observable, the difference between the transaction price and model value is only recognized in the parent company statement of income when the inputs become observable or when the instrument is derecognized. For each transaction, the Company determines the appropriate method of recognizing the ‘Day 1’ difference amount. Financial assets and financial liabilities at FVPL Financial assets and financial liabilities at FVPL include financial assets held for trading and financial assets designated upon initial recognition as FVPL. Financial assets and financial liabilities are classified as held for trading if they are acquired for the purpose of selling in the near term. Derivatives, including separated embedded derivatives, are also classified as held for trading unless they are designated as effective hedging instruments or a financial guarantee contract. Gains or losses on investments held for trading are recognized in the parent company statement of income. Financial assets or financial liabilities may be designated at initial recognition as at FVPL if the following criteria are met: (i) the designation eliminates or significantly reduces the inconsistent treatment that would otherwise arise from measuring the assets or recognizing the gains or losses on them on a different basis; or (ii) the assets are part of a group of financial assets which are managed and their performance evaluated on fair value basis, in accordance with a documented risk management strategy; or (iii) the financial asset contains an embedded derivative that would need to be separately recorded. When a contract contains one or more embedded derivatives, the entire hybrid contract may be designated as a financial asset or financial liabilities at FVPL, except when the embedded derivative does not significantly modify the cash flows or it is clear that separation of the embedded derivative is prohibited. As of December 31, 2010 and 2009, the Company has no financial assets and liabilities at FVPL. Loans and receivables Loans and receivables are non-derivative financial assets with fixed or determinable payments that are not quoted in an active market. Loans and receivables are carried at amortized cost using the effective interest method. Gains and losses are recognized in the parent company statement of income when the loans and receivables are derecognized or impaired, as well as through the amortization process. Loans and receivables are included in current assets if maturity is within 12 months from the balance sheet date. Financial assets included in this classification are the Company’s cash in banks and cash equivalents and trade and other receivables.

7
HTM investments HTM investments are quoted non-derivative financial assets which carry fixed or determinable payments and fixed maturities and which the Company has the positive intention and ability to hold to maturity. After the initial measurement, HTM investments are measured at amortized cost using the effective interest method. This method uses an effective interest rate that exactly discounts estimated future cash receipts through the expected life of the financial asset to the net carrying amount of the financial asset. HTM investments are quoted non-derivative financial assets with fixed or determinable payments and fixed maturities for which the Company’s management has the positive intention and ability to hold to maturity. Where the Company sells other than an insignificant amount of HTM investments, the entire category would be tainted and reclassified as AFS investments. Gains and losses are recognized in the parent company statement of income when the investments are derecognized or impaired, as well as through the amortization process. As of December 31, 2010 and 2009, the Company has no HTM investments. AFS investments AFS investments are those non-derivative financial assets which are designated as such or do not qualify to be classified as financial assets designated at FVPL, HTM investments or loans and receivables. They are purchased and held indefinitely, and may be sold in response to liquidity requirements or changes in market conditions. After initial measurement, AFS investments are measured at fair value with unrealized gains or losses recognized in the parent company statement of comprehensive income and in the parent company statement of changes in equity in the “Unrealized valuation gains (losses) on AFS investments” until the AFS investments is derecognized, at which time the cumulative gain or loss recorded in equity is recognized in the parent company statement of income. Unquoted equity securities are carried at cost, net of impairment. The Company’s AFS investments as of December 31, 2010 and 2009 include investments in quoted and unquoted shares of stock. Other financial liabilities Other financial liabilities are initially recognized at fair value of the consideration received, less directly attributable transaction costs. After initial recognition, other financial liabilities are subsequently measured at amortized cost using the effective interest method. Amortized cost is calculated by taking into account any related issue costs, discount or premium. Gains and losses are recognized in the parent company statement of income when the liabilities are derecognized, as well as through the amortization process. Included under this category are the Company’s long-term debt, accounts payable and accrued expenses, and redeemable preferred shares. Derecognition of Financial Assets and Liabilities Financial assets A financial asset (or, where applicable a part of a financial asset or part of a group of similar financial assets) is derecognized where: • the rights to receive cash flows from the asset expires; • the Company retains the right to receive cash flows from the asset, but has assumed an
obligation to pay them in full without material delay to a third party under a ‘pass-through’ arrangement; or
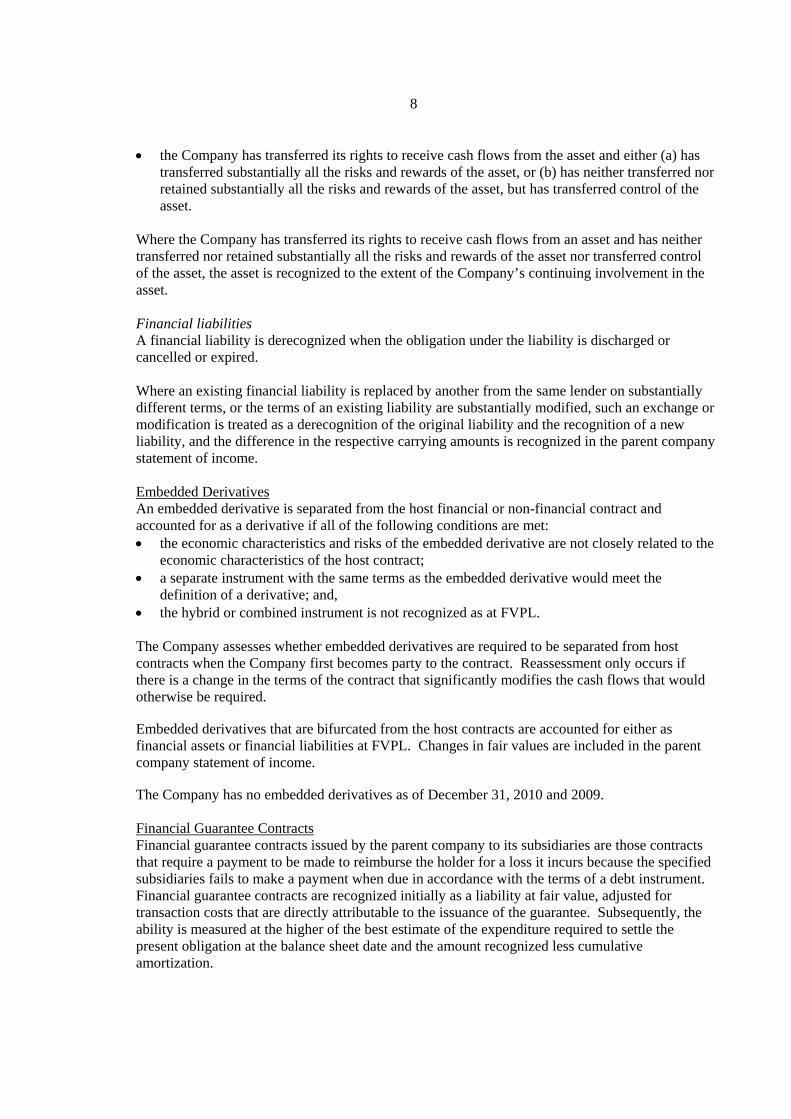
8
• the Company has transferred its rights to receive cash flows from the asset and either (a) has transferred substantially all the risks and rewards of the asset, or (b) has neither transferred nor retained substantially all the risks and rewards of the asset, but has transferred control of the asset.
Where the Company has transferred its rights to receive cash flows from an asset and has neither transferred nor retained substantially all the risks and rewards of the asset nor transferred control of the asset, the asset is recognized to the extent of the Company’s continuing involvement in the asset. Financial liabilities A financial liability is derecognized when the obligation under the liability is discharged or cancelled or expired. Where an existing financial liability is replaced by another from the same lender on substantially different terms, or the terms of an existing liability are substantially modified, such an exchange or modification is treated as a derecognition of the original liability and the recognition of a new liability, and the difference in the respective carrying amounts is recognized in the parent company statement of income. Embedded Derivatives An embedded derivative is separated from the host financial or non-financial contract and accounted for as a derivative if all of the following conditions are met: • the economic characteristics and risks of the embedded derivative are not closely related to the
economic characteristics of the host contract; • a separate instrument with the same terms as the embedded derivative would meet the
definition of a derivative; and, • the hybrid or combined instrument is not recognized as at FVPL. The Company assesses whether embedded derivatives are required to be separated from host contracts when the Company first becomes party to the contract. Reassessment only occurs if there is a change in the terms of the contract that significantly modifies the cash flows that would otherwise be required. Embedded derivatives that are bifurcated from the host contracts are accounted for either as financial assets or financial liabilities at FVPL. Changes in fair values are included in the parent company statement of income. The Company has no embedded derivatives as of December 31, 2010 and 2009. Financial Guarantee Contracts Financial guarantee contracts issued by the parent company to its subsidiaries are those contracts that require a payment to be made to reimburse the holder for a loss it incurs because the specified subsidiaries fails to make a payment when due in accordance with the terms of a debt instrument. Financial guarantee contracts are recognized initially as a liability at fair value, adjusted for transaction costs that are directly attributable to the issuance of the guarantee. Subsequently, the ability is measured at the higher of the best estimate of the expenditure required to settle the present obligation at the balance sheet date and the amount recognized less cumulative amortization.

9
Offsetting of Financial Instruments Financial assets and financial liabilities are offset and the net amount reported in the parent company balance sheet if, and only if, there is a currently enforceable legal right to offset the recognized amounts and there is an intention to settle on a net basis, or to realize the assets and settle the liabilities simultaneously. This is not generally the case with master netting agreements, and the related assets and liabilities are presented at gross amounts in the parent company balance sheet. Classification of Financial Instruments Between Debt and Equity A financial instrument is classified as debt if it provides for a contractual obligation to: • deliver cash or another financial asset to another entity; or • exchange financial assets or financial liabilities with another entity under conditions that are
potentially unfavorable to the Company; or • satisfy the obligation other than by the exchange of a fixed amount of cash or another financial
asset for a fixed number of own equity shares. If the Company does not have an unconditional right to avoid delivering cash or another financial asset to settle its contractual obligation, the obligation meets the definition of a financial liability. The components of issued financial instruments that contain both liability and equity elements are accounted for separately, with the equity component being assigned the residual amount after deducting from the instrument as a whole the amount separately determined as the fair value of the liability component on the date of issue. Impairment of Financial Assets The Company assesses at each balance sheet date whether a financial asset or group of financial assets is impaired. Assets carried at amortized cost If there is objective evidence that an impairment loss on loans and receivables carried at amortized cost has been incurred, the amount of the loss is measured as the difference between the asset’s carrying amount and the present value of estimated future cash flows (excluding future credit losses that have not been incurred) discounted at the financial asset’s original effective interest rate (i.e., the effective interest rate computed at initial recognition). The carrying amount of the asset shall be reduced either directly or through use of an allowance account. The amount of the loss shall be recognized in parent company statement of income. The Company first assesses whether objective evidence of impairment exists individually for financial assets that are individually significant, and individually or collectively for financial assets that are not individually significant. If it is determined that no objective evidence of impairment exists for an individually assessed financial asset, whether significant or not, the asset is included in a group of financial assets with similar credit risk characteristics and that group of financial assets is collectively assessed for impairment. Assets that are individually assessed for impairment and for which an impairment loss is or continues to be recognized are not included in a collective assessment of impairment.
If, in a subsequent period, the amount of the impairment loss decreases and the decrease can be related objectively to an event occurring after the impairment was recognized, the previously recognized impairment loss is reversed. Any subsequent reversal of an impairment loss is

10
recognized in the parent company statement of income, to the extent that the carrying value of the asset does not exceed its amortized cost at the reversal date. In relation to trade receivables, a provision for impairment loss is made when there is objective evidence (such as the probability of insolvency or significant financial difficulties of the debtor) that the Company will not be able to collect all the amounts due under the original terms of the invoice. The carrying amount of the receivables is reduced through use of an allowance account. Impaired debts are derecognized when they are assessed as uncollectible. Assets carried at cost If there is objective evidence that an impairment loss on an unquoted equity instrument that is not carried at fair value because its fair value cannot be reliably measured, or on a derivative asset that is linked to and must be settled by delivery of such an unquoted equity instrument has been incurred, the amount of the loss is measured as the difference between the asset’s carrying amount and the present value of estimated future cash flows discounted at the current market rate of return for a similar financial asset. AFS investments If an AFS investment is impaired, an amount comprising the difference between its cost (net of any principal payment and amortization) and its current fair value, less any impairment loss previously recognized in the parent company statement of income, is transferred from equity to the parent company statement of income. Reversals in respect of equity instruments classified as AFS are not recognized in the parent company statement of income. Reversals of impairment losses on debt instruments are reversed through the parent company statement of income, if the increase in fair value of the instrument can be objectively related to an event occurring after the impairment loss was recognized in parent company statement of income. In case of equity investments classified as AFS, objective evidence of impairment would include a significant or prolonged decline in the fair value of the investments below its cost. Where there is evidence of impairment, the cumulative loss (measured as the difference between the acquisition cost and the current fair value, less any impairment loss on that financial asset previously recognized in the parent company statement of income) is removed from equity and recognized in the parent company statement of income. Impairment losses on equity investments are not reversed through the parent company statement of income. Increases in fair value after impairment are recognized directly in the parent company statement of changes in equity. Redeemable Preferred Shares (RPS) The component of the RPS that exhibits characteristics of a liability is recognized as a liability in the parent company balance sheet, net of transaction costs. The corresponding dividends on those shares are charged as interest expense in the parent company statement of income. On issuance of the redeemable preference shares, the fair value of the liability component is determined using a market rate for an equivalent non-convertible bond; and this amount is carried as a long term liability on the amortized cost basis until extinguished on conversion or redemption. The remainder of the proceeds is allocated to the conversion option that is recognized and included in parent company statement of changes in equity, net of transaction costs. The carrying amount of the conversion option is not remeasured in subsequent years. Transaction costs are apportioned between the liability and equity components of the convertible preference shares based on the allocation of proceeds to the liability and equity components when the instruments are first recognized.

11
Investments in Subsidiaries and Associates Investments in subsidiaries Subsidiaries are all entities over which the Company has the power to govern the financial and operating policies generally accompanying a shareholding of more than one half of the voting rights. The existence and effect of potential voting rights that are currently exercisable or convertible are considered when assessing whether the Company controls another entity. Investments in subsidiaries are carried at cost less any impairment in value. Business combination of entities under common control is accounted for using a method similar to pooling of interest. Under the pooling of interest method, any excess of acquisition cost over the net asset value of the acquired entity is recorded in equity. Investments in associates The Company’s investment in its associate is accounted for using the cost method of accounting. An associate is an entity in which the Company has significant influence. The Company’s investments in subsidiaries and associates are accounted for under the cost method of accounting in the Company’s separate financial statements. These investments are carried in the Company’s balance sheet at cost less any impairment in value. The Company recognizes income from the investments only to the extent that the Company receives distributions from accumulated profits of the subsidiaries and associates arising after the date of acquisition. Distributions received in excess of such profits are regarded as a recovery of investment and are recognized as a reduction of the cost of the investment. Property and Equipment Property and equipment are stated at cost, excluding the costs of day-to-day servicing, less accumulated depreciation and amortization and accumulated impairment in value. Such cost includes the cost of replacing part of such property and equipment when that cost is incurred if the recognition criteria are met. Repairs and maintenance costs are recognized in the parent company statement of income as incurred. Construction in progress represents structures under construction and is stated at cost. This includes cost of construction and other direct costs. Construction in progress is not depreciated until such time that the relevant assets are completed and put into operational use.
Depreciation and amortization are calculated on a straight-line basis over the useful lives of the assets, or the terms of the lease in case of leasehold improvements, whichever is shorter, as follows:
Category Number of Years Transportation equipment 5 Office equipment, furniture and fixtures 3-5 Leasehold improvements 5 Computer equipment 1-3
The carrying values of property and equipment are reviewed for impairment when events or changes in circumstances indicate that the carrying values may not be recoverable.
An item of property and equipment is derecognized upon disposal or when no future economic benefits are expected from its use or disposal. Any gain or loss arising on derecognition of the asset (calculated as the difference between the net disposal proceeds and the carrying amount of

12
the asset) is included in the parent company statement of income in the year the asset is derecognized. The asset’s residual values, useful lives and depreciation method are reviewed, and adjusted if appropriate, at each financial year-end.
When each major inspection is performed, its cost is recognized in the carrying amount of the property and equipment as a replacement if the recognition criteria are satisfied.
Computer Development Cost Costs incurred in the development of computer software are capitalized. Computer development costs, included under “Other noncurrent assets” account in the parent company balance sheet, are amortized using the straight-line method over a period of two (2) to three (3) years.
The carrying value of computer development costs is reviewed for impairment annually when the asset is not yet in use, and otherwise when events or changes in circumstances indicate that carrying value may not be recoverable.
Impairment of Nonfinancial Assets Investments in subsidiaries and associates, property, plant and equipment and project cost are reviewed for impairment whenever events or changes in circumstances indicate that the carrying amount of an asset may not be recoverable or may be impaired. If any such indication exists, or when annual impairment testing for an asset is required, the Company makes an estimate of the asset’s recoverable amount. An asset’s recoverable amount is the higher of an asset’s or cash-generating unit’s fair value less costs to sell and its value in use and is determined for an individual asset, unless the asset does not generate cash inflows that are largely independent of those from other assets or groups of assets. Where the carrying amount of an asset exceeds its recoverable amount, the asset is considered impaired and is written down to its recoverable amount. In assessing value in use, the estimated future cash flows are discounted to their present value using a pre-tax discount rate that reflects current market assessments of the time value of money and the risks specific to the asset. Impairment losses of continuing operations are recognized in the statement of income in those expense categories consistent with the function of the impaired asset. An assessment is made at each reporting date as to whether there is any indication that previously recognized impairment losses may no longer exist or may have decreased. If such indication exists, the recoverable amount is estimated. A previously recognized impairment loss is reversed only if there has been a change in the estimates used to determine the asset’s recoverable amount since the last impairment loss was recognized. If that is the case, the carrying amount of the asset is increased to its recoverable amount. That increased amount cannot exceed the carrying amount that would have been determined, net of accumulated depreciation, had no impairment loss been recognized for the asset in prior years. Such reversal is recognized in the statement of income unless the asset is carried at revalued amount, in which case the reversal is treated as a revaluation increase. After such a reversal, the depreciation charge is adjusted in future periods to allocate the asset’s revised carrying amount, less any residual value, on a systematic basis over its remaining useful life. Capital Stock Capital stock is measured at par value for all shares issued. When the Company issues more than one class of stock, a separate account is maintained for each class of stock and the number of shares issued. Capital stock includes common stock and preferred stock.

13
When the shares are sold at premium, the difference between the proceeds and the par value is credited to the “Additional paid-in capital” account. When shares are issued for a consideration other than cash, the proceeds are measured by the fair value of the consideration received. In case the shares are issued to extinguish or settled the liability of the Company, the shares shall be measured either at the fair value of the shares issued or fair value of the liability settled, whichever is more reliably determinable.
Direct costs incurred related to equity issuance, such as underwriting, accounting and legal fees, printing costs and taxes are debited to the “Additional paid-in capital” account. If additional paid-in capital is not sufficient, the excess is charged against an equity reserve account. Treasury Shares The Company’s own equity instruments which are reacquired (treasury shares) are recognized at cost and deducted from equity. No gain or loss is recognized in the parent company statement of income on the purchase, sale, issue or cancellation of the Company’s own equity instruments. Any difference between the carrying amount and the considerations is recognized in other capital reserves. Revenue Recognition Revenue is recognized to the extent that it is probable that the economic benefits will flow to the Company and the revenue can be reliably measured regardless of when the payment is being made. Revenue is measured at the fair value of the consideration received or receivable, taking into account contractually defined terms of payment and excluding discounts, rebates and other sales taxes or duties. The Company assesses its revenue arrangements against specific criteria in order to determine if it is acting as principal or agent. The Company has concluded that it is acting as a principal in all of its revenue arrangements. The following specific recognition criteria must also be met before revenue is recognized: Rendering of services Management, professional and technical fees are recognized when the related services are rendered. Dividend income Dividend income is recognized when the Company’s right to receive payment is established. Interest income Interest income is recognized as it accrues taking into consideration the effective yield on the asset. Expenses Expenses are decreases in economic benefits during the accounting period in the form of outflows or decrease of assets or incurrence of liabilities that result in decreases in equity, other than those relating to distributions to equity participants. Expenses are recognized when incurred. Borrowing Costs Borrowing costs are generally charged to expense as incurred. Borrowing costs are capitalized if they are directly attributable to the acquisition or construction of a qualifying asset. Capitalization of borrowing costs commences when the activities to prepare the assets are in progress and expenditures and borrowing costs are being incurred. Borrowing costs are capitalized until the assets are substantially ready for their intended use.

14
Pension Benefits The Company has a defined benefit pension plan which requires contributions to be made to a separately administered fund. The cost of providing benefits under the defined benefit plan is determined using the projected unit credit actuarial valuation method. Actuarial gains and losses are recognized as income or expense when the net cumulative unrecognized actuarial gains and losses at the end of the previous reporting period exceeded 10% of the higher of the defined benefit obligation and the fair value of plan assets at that date. These gains or losses are recognized over the expected average remaining working lives of the employees participating in the plan. The past service cost is recognized as an expense on a straight-line basis over the average period until the benefits become vested. If the benefits are already vested immediately following the introduction of, or changes to, a pension plan, past service cost is recognized immediately. The defined benefit asset or liability comprises the present value of the defined benefit obligation and actuarial gains and losses not recognized less past service cost not yet recognized and less the fair value of plan assets out of which the obligations are to be settled directly. The value of any asset is restricted to the sum of any cumulative net actuarial losses and past service cost not yet recognized and the present value of any economic benefits available in the form of refunds from the plan or reductions in the future contributions to the plan. If the asset is measured at the aggregate of cumulative unrecognized net actuarial losses and past service cost and the present value of any economic benefits available in the form of refunds from the plan or reductions in the future contributions to the plan, net actuarial losses of the current period and past service cost of the current period are recognized immediately to the extent that they exceed any reduction in the present value of those economic benefits. If there is no change or an increase in the present value of the economic benefits, the entire net actuarial losses of the current period and past service cost of the current period are recognized immediately. Similarly, net actuarial gains of the current period after the deduction of past service cost of the current period exceeding any increase in the present value of the economic benefits stated above are recognized immediately if the asset is measured at the aggregate of cumulative unrecognized net actuarial losses and past service cost and the present value of any economic benefits available in the form of refunds from the plan or reductions in the future contributions to the plan. If there is no change or a decrease in the present value of the economic benefits, the entire net actuarial gains of the current period after the deduction of past service cost of the current period are recognized immediately. Leases The determination of whether an arrangement is, or contains a lease, is based on the substance of the arrangement and requires an assessment of whether the fulfillment of the arrangement is dependent on the use of a specific asset or assets and the arrangement conveys a right to use the asset. A reassessment is made after inception of the lease only if one of the following applies: a. there is a change in contractual terms, other than a renewal or extension of the arrangement; b. a renewal option is exercised or extension granted, unless that term of the renewal or
extension was initially included in the lease term; c. there is a change in the determination of whether fulfillment is dependent on a specified
asset; or d. there is a substantial change to the asset.

15
When a reassessment is made, lease accounting shall commence or cease from the date when the change in circumstances give rise to the reassessment for scenarios (a), (c) or (d) and at the date of renewal or extension period of scenario (b).
Foreign Currency Transactions The parent company financial statements are presented in Philippine peso, which is the Company’s functional and presentation currency. Transactions in foreign currencies are initially recorded in the foreign exchange rate ruling at the date of the transaction. Monetary assets and liabilities denominated in foreign currencies are retranslated at the functional currency rate of exchange ruling on the balance sheet date. All differences arising from settlement or restatement are taken to the parent company statement of income. Taxes Current income tax Current income tax assets and liabilities for the current and prior periods are measured at the amount expected to be recovered from or paid to the taxation authorities. The tax rates and tax laws used to compute the amount are those that are enacted or substantively enacted as of the balance sheet date. Deferred income tax Deferred income tax is provided using the balance sheet liability method on temporary differences at the balance sheet date between the tax bases of assets and liabilities and their carrying amounts for financial reporting purposes. Deferred income tax liabilities are recognized for all taxable temporary differences, except: • where the deferred income tax liability arises from the initial recognition of goodwill or of an
asset or liability in a transaction that is not a business combination and, at the time of the transaction, affects neither the accounting profit nor taxable profit or loss; and
• in respect of taxable temporary differences associated with investments in subsidiaries, associates and interests in joint ventures, where the timing of the reversal of the temporary differences can be controlled and it is probable that the temporary differences will not reverse in the foreseeable future.
Deferred income tax assets are recognized for all deductible temporary differences and carryforward benefits of net operating loss carryover (NOLCO) and minimum corporate income tax (MCIT), to the extent that it is probable that future taxable profit will be available against which the deductible temporary differences and the carryforward benefits of NOLCO and MCIT can be utilized except:
• where the deferred income tax asset relating to the deductible temporary difference arises from
the initial recognition of an asset or liability in a transaction that is not a business combination and, at the time of the transaction, affects neither the accounting profit nor taxable profit or loss; and,
• in respect of deductible temporary differences associated with investments in subsidiaries, associates and interests in joint ventures, deferred income tax assets are recognized only to the extent that it is probable that the temporary differences will reverse in the foreseeable future and taxable profit will be available against which the temporary differences can be utilized.
The carrying amount of deferred income tax assets is reviewed at each balance sheet date and reduced to the extent that it is no longer probable that sufficient taxable profit will be available to allow all or part of the deferred income tax asset to be utilized. Unrecognized deferred income tax

16
assets are reassessed at each balance sheet date and are recognized to the extent that it has become probable that future taxable profit will allow the deferred income tax asset to be recovered.
Deferred income tax assets and liabilities are measured at the tax rates that are expected to apply to the year when the asset is realized or the liability is settled, based on tax rates (and tax laws) that have been enacted or substantively enacted as of the balance sheet date. Income tax relating to items recognized directly in equity is recognized in the parent company statement of comprehensive income and not in the parent company statement of income. Deferred income tax assets and deferred income tax liabilities are offset, if a legally enforceable right exists to set off current tax assets against current tax liabilities and the deferred income taxes relate to the same taxable entity and the same taxation authority. Sales tax Revenues, expenses, and assets are recognized net of amount of sales tax except:
• where the sales tax incurred on a purchase of assets or services is not recoverable from the taxation authority, in which case the sales tax is recognized as part of the cost of acquisition of the asset or as part of the expense item as applicable; and
• receivable and payables that are stated with the amount of sales tax are included. The net amount of sales tax recoverable from, or payable to, the taxation authority is included as part of receivables or payables in the parent company balance sheet. Provisions Provisions are recognized when the Company has a present obligation (legal or constructive) as a result of a past event, it is probable that an outflow of resources embodying economic benefits will be required to settle the obligation and a reliable estimate can be made of the amount of the obligation. Where the Company expects some or all of a provision to be reimbursed, for example under an insurance contract, the reimbursement is recognized as a separate asset but only when the reimbursement is virtually certain. The expense relating to any provision is presented in the parent company statement of income net of any reimbursement. If the effect of the time value of money is material, provisions are discounted using a current pre-tax rate that reflects, where appropriate, the risks specific to the liability. Where discounting is used, the increase in the provision due to the passage of time is recognized as a borrowing cost. Contingencies Contingent liabilities are not recognized in the parent company financial statements. These are disclosed unless the possibility of an outflow of resources embodying economic benefits is remote. Contingent assets are not recognized in the parent company financial statements but disclosed when an inflow of economic benefits is probable.
Events After the Balance Sheet Date Post year-end events that provide additional information about the Company’s position at balance sheet date (adjusting events) are reflected in the parent company financial statements. Post year-end events that are not adjusting events are disclosed when material. Dividends on Common Shares Dividends on common shares are recognized as a liability and deducted from retained earnings when approved by the respective shareholders of the Company. Dividends for the year that are approved after the balance sheet date are dealt with as an event after the balance sheet date.

17
3. Significant Accounting Judgments and Estimates The preparation of the parent company financial statements requires management to make judgments, estimates and assumptions that affect the reported amounts of revenues, expenses, assets and liabilities and the disclosure of contingent liabilities, as of December 31, 2010, 2009 and 2008. However, uncertainty about these assumptions and estimates could result in outcomes that require a material adjustment to the carrying amount of the asset or liability affected in the future periods. Judgments In the process of applying the Company’s accounting policies, management has made the following judgment, apart from those involving estimations, which have the most significant effect on the amounts recognized in the parent company financial statements: Determining functional currency Based on the economic substance of the underlying circumstances relevant to the Company, the functional currency of the Company has been determined to be the Philippine peso. The Philippine peso is the currency of the primary economic environment in which the Company operates. It is the currency that mainly influences the pricing of management, professional and technical fees and the costs of providing such services. Estimation Uncertainty The key assumptions concerning the future and other key sources of estimation uncertainty at the balance sheet date, that have a significant risk of causing a material adjustment to the carrying amounts of assets and liabilities within the next financial year are discussed follow: Estimating allowance for impairment losses on trade and other receivables The Company maintains allowance for impairment losses on trade and other receivables at a level considered adequate to provide for potential uncollectible receivables. The level of this allowance is evaluated by the Company on the basis of factors that affect the collectibility of the accounts. These factors include, but are not limited to, the length of the Company’s relationship with debtors, their payment behavior and known market factors. The Company reviews the age and status of the receivables, and identifies accounts that are to be provided with allowance on a continuous basis. The Company also evaluates its receivables from a portfolio perspective, to determine whether there are collective indicators of incurred loss. The amount and timing of recorded expenses for any period would differ if the Company made different judgment or utilized different estimates. An increase in the Company’s allowance for probable losses on receivables would increase the Company’s recorded expenses and decrease current assets. The main considerations for impairment assessment include whether any payments are overdue or if there are any known difficulties in the cash flows of the counterparties. The Company assesses impairment into two areas: individually assessed allowances and collectively assessed allowances. The Company determines allowance for each significant receivable on an individual basis. Among the items that the Company considers in assessing impairment is the inability to collect from the counterparty based on the contractual terms of the receivables. Receivables included in the specific assessment are the account that have been endorsed to the legal department, non-moving account receivables, accounts of defaulted agents and accounts from closed stations.

18
For collective assessment, allowances are assessed for receivables that are not individually significant and for individually significant receivables where there is not yet objective evidence of individual impairment. Impairment losses are estimated by taking into consideration the age of the receivables, past collection experience and other factors that may affect collectibility. The Company has no allowance for impairment losses as of December 31, 2010 and 2009. Trade and other receivables amounted to P=921.9 million and P=118.8 million as of December 31, 2010 and 2009, respectively (see Note 5). Estimating allowance for impairment losses on advances to subsidiaries and associates Advances to subsidiaries and associates are reviewed for impairment whenever events or changes in circumstances indicate that the carrying amount may not be recoverable. There are no impairment indicators in 2010, 2009 and 2008 based on management’s assessment. As of December 31, 2010 and 2009, net advances from subsidiaries and associates amounted to P=29.5 million and P=27.6 million, respectively (see Notes 6 and 7). Allowance for impairment losses amounted to P=23.5 million in 2010 and 2009. Estimating useful lives of property and equipment The Company estimates the useful lives of property and equipment based on their economic lives. The estimated useful lives of property and equipment are reviewed periodically and updated if expectations differ materially from previous estimates due to physical wear and tear, technical or commercial obsolescence and legal or other limits on the use of the property and equipment. However, it is possible that future results or operations could be materially affected by changes in the estimates brought about by changes in factors mentioned above. The amounts and timing of recording of expenses for any period would be affected by changes in these factors and circumstances. A reduction in the estimated useful lives of the property and equipment would increase the recorded expenses and decrease the noncurrent assets. As of December 31, 2010 and 2009, the carrying amount of property and equipment amounted to P=89.2 million and P=93.6 million, respectively (see Note 10). Assessing impairment of AFS investments The computation for the impairment of AFS investments requires an estimation of the present value of the expected future cash flows and the selection of an appropriate discount rate. An impairment issue arises when there is an objective evidence of impairment, which involves significant judgment. In applying this judgment, the Company evaluates the financial health of the issuer, among others. In the case of AFS equity instruments, the Company expands its analysis to consider changes in the issuer’s industry and sector performance, legal and regulatory framework, changes in technology and other factors that affect the recoverability of the Company’s investments. Fair value of AFS investments amounted to P=340.3 million and P=334.6 million as of December 31, 2010 and 2009, respectively. No impairment losses were recognized in 2010 and 2009 (see Note 21). Assessing impairment of nonfinancial assets PFRS requires that an impairment review be performed when certain impairment indicators are present. Determining the value of property and equipment, investments in subsidiaries and associates, software development costs and other noncurrent assets, which require the determination of future cash flows expected to be generated from the continued use and ultimate disposition of such assets, requires the Company to make estimates and assumptions that can materially affect its parent company financial statements. Future events could cause the Company to conclude that the property and equipment, investments in subsidiaries and associate, computer development costs and other noncurrent assets are impaired. Any resulting impairment loss could have a material adverse impact on the Company’s financial condition and results of operations.

19
The aggregate carrying values of investments in subsidiaries and associates, property and equipment and computer program development and project costs amounted to P=19,171.9 million and P=21,272.9 million and as of December 31, 2010 and 2009, respectively (see Notes 6, 7 and 10). The Company recognized impairment loss amounting to nil in 2010 and 2009, and P=2,144.3 million in 2008. Estimating realizability of deferred income tax assets The Company reviews the carrying amounts of deferred income tax assets at each balance sheet date and reduced to the extent that it is no longer probable that sufficient taxable profit will be available to allow all or part of the deferred income tax assets to be utilized. The Company’s assessment on the recognition of deferred income tax assets on nondeductible temporary differences is based on the budgeted taxable income of the following reporting period. This budget is based on the Company’s past results and future expectations on revenue and expenses. As of December 31, 2010 and 2009, gross deferred income tax assets amounted to P=2.5 million and P=6.9 million, respectively (see Note 19).
Pension costs The determination of the Company’s retirement cost is dependent on the selection of certain assumptions used by the actuary in calculating such amounts. Those assumptions are described in Note 19, Pension Benefit Plan, to the financial statements and include, among others, discount rates and rates of compensation increase. In accordance with PAS 19, actual results that differ from Company’s assumptions are accumulated and amortized over future periods and therefore, generally affect the Company’s recognized expense and recorded obligation in such future periods. While management believes that the assumptions are reasonable and appropriate, significant differences in the Company’s actual experience or significant changes in the assumptions may materially affect the pension and other retirement obligation. Net benefit expense amounted to P=5.3 million in 2010, P=16.5 million in 2009 and P=13.3 million in 2008. The Company has a pension asset as of December 31, 2010 amounting to P=4.1 million and a pension liability as of December 31, 2009 amounting to P=7.1 million (see Note 18).
Fair value of financial instruments PFRS requires that certain financial assets and liabilities be carried at fair value, which requires the use of accounting judgment and estimates. While significant components of fair value measurement are determined using verifiable objective evidence (e.g. foreign exchange rates, interest rates, volatility rates), the timing and amount of changes in fair value would differ with the valuation methodology used. Any change in the fair value of these financial assets and liabilities would directly affect net income or loss and equity. The carrying values and corresponding fair values of financial assets and financial liabilities as well as the manner in which fair values were determined are discussed in more detail in Note 21.
Legal contingencies The estimate of probable costs for the resolution of possible claims has been developed in consultation with outside counsel handling the Company’s defense in these matters and is based upon an analysis of potential results. No provision for probable losses arising from legal contingencies was recognized in the parent company financial statements as of December 31, 2010 and 2009.

20
4. Cash and Cash Equivalents
2010 2009Cash on hand and in banks (see Note 9) P=24,205,025 P=370,824,453Short-term investments (see Note 9) 5,526,986,999 49,938,366 P=5,551,192,024 P=420,762,819
Cash in banks earn interest at prevailing bank deposit rates. Short-term investments are made for varying periods of up to three months depending on the immediate cash requirements of the Company, and earn interest at the respective short-term investment rates. Interest income earned on cash and cash equivalents amounted to P=15.1 million in 2010, P=23.5 million in 2009 and P=41.1 million in 2008.
5. Trade and Other Receivables
2010 2009Dividends receivable P=783,422,831 P=−Trade receivables (see Note 9) 131,171,280 112,861,295Interest receivable 4,004,158 107,841Others 3,274,975 5,816,724 P=921,873,244 P=118,785,860
Trade receivables are non-interest bearing and are normally on 30 - 60 days’ term.
6. Investments in Subsidiaries
Percentage of Ownership 2010 2009 Subsidiaries
Nature of Business Direct Indirect Direct Indirect
AEV Properties, Inc. (API)* Real Estate 100.00 − 100.00 − AEV Aviation, Inc. (AVI)** Service 100.00 − 100.00 − Pilmico Foods Corporation (PILMICO) and
Subsidiaries Food Manufacturing 100.00 − 100.00 −
Archipelago Insurance PTE LTD (AIPL)*** Insurance 100.00 − − − Cebu Praedia Development Corporation
(CPDC)** Real Estate 88.27 8.96 88.27 8.96 Aboitiz Power Corporation (AP) and
Subsidiaries Power 76.40 − 76.40 − Aboitiz Jebsen Bulk Transport Corporation
(AJBTC) and Subsidiaries Ship management 62.50 − − 62.50
Jebsen Maritime, Inc. (JMI) Manpower Services 62.50 − − 62.50
Aboitiz Jebsen Manpower Solution, Inc. (AJMSI)
Manpower Services 62.50 − − 62.50
City Savings Bank (CSB) Banking 59.25 40.00 − − Aboitiz Transport System Corporation (ATS)
and Subsidiaries Transportation − − 77.24 − * No commercial operations
** The 2010 and 2009 financial statements of these subsidiaries were audited by other independent auditors. All other companies were audited by the principal auditors.
***Incorporated in Singapore. All other companies are incorporated in the Philippines.

21
The details of the Company’s investments in subsidiaries accounted for under the cost method follow:
2010 2009AP P=10,119,763,093 P=10,119,763,093PILMICO 1,658,885,002 1,658,885,002CSB 594,450,374 −AJBTC 271,155,449 − CPDC 176,546,023 176,546,023 JMI 71,398,918 − API 25,000,000 25,000,000AIPL 21,739,130 −AJMSI 13,354,065 −AVI 250,000 250,000ATS − 5,753,977,397 12,952,542,054 17,734,421,515Less allowance for impairment losses − (2,144,302,705) 12,952,542,054 15,590,118,810Advances from subsidiaries (30,462,779) (28,488,606) P=12,922,079,275 P=15,561,630,204
Acquistion of CSB shares The Bangko Sentral ng Pilipinas (BSP) approved on November 17, 2010 the proposed acquisition by the Company and its wholly-owned subsidiary, PILMICO, of up to 60% and 40%, respectively, of the outstanding shares of stock of CSB. With this BSP approval, the Company completed its acquisition of additional 24.86% of CSB on November 26, 2010, increasing its ownership to 59.25% and gaining control on the financial and operating policies of the bank. This additional 24.86% interest represents 48,554 common shares of CSB with an acquisition cost of P=515.4 million. CSB is an associate prior to this additional acquisition in which cost of investment amounted to P=79.0 million (see Note 7). Sale of Investment in ATS On December 1, 2010, the BOD of the Company and ACO approved the sale of their entire holdings in ATS to Negros Navigation Co., Inc. (NENACO). The sale was finalized on December 28, 2010 for P=1.88 per share for total proceeds of P=3.5 billion. Loss on sale of ATS recognized in the parent company statement of income amounted to P=74.6 million. As part of the condition for the sale of ATS to NENACO, on the same date, the Company acquired ATS’s respective 62.5% ownership in AJBTC, JMI and AJMSI for P=355.9 million.

22
Following is the summarized financial information of significant subsidiaries (amounts in thousand pesos):
2010 2009 2008AP and Subsidiaries* Total current assets P=27,920,246 P=9,915,103 P=17,739,650 Total noncurrent assets 106,636,626 101,425,614 29,532,486 Total current liabilities 10,824,973 14,655,779 8,090,192 Total noncurrent liabilities 65,997,689 61,638,011 8,490,281 Gross revenue 59,551,458 23,174,265 12,242,980 Net income 25,083,030 5,769,768 4,424,328 PILMICO and Subsidiaries Total current assets 3,902,808 3,035,263 4,273,427 Total noncurrent assets 3,321,168 2,281,180 2,158,394 Total current liabilities 4,598,985 2,470,387 3,266,609 Total noncurrent liabilities 226,715 474,789 721,303 Gross revenue 12,879,584 11,048,314 10,688,583 Gross profit 2,932,850 2,129,655 1,281,575 Net income 1,602,009 1,227,359 458,461 CSB Total current assets 8,792,589 − – Total noncurrent assets 184,016 − − Total current liabilities 1,615,398 − − Total noncurrent liabilities 6,114,039 − − Gross revenue 911,503 − − Net income (loss) 444,030 − − ATS and Subsidiaries Total current assets − 4,799,883 9,081,917 Total noncurrent assets − 5,822,114 327,103 Total current liabilities − 5,394,293 4,809,249 Total noncurrent liabilities − 68,132 8,986 Gross revenue − 11,824,431 2,595,627 Net income (loss) − 622,717 (6,572)
* Amounts are based on cost model of accounting for investment properties. Investment properties are adjusted to
fair values in the consolidated financial statements of the Company and its Subsidiaries to conform with the Group’s uniform accounting policy for investment properties under the fair value model.

23
7. Investments in and Advances to Associates
Percentage of Ownership
Nature of Business*** 2010 2009
Accuria, Inc. (Accuria) Holding company 49.54 49.54
Jardine Aboitiz Insurance Brokers, Inc. (JAIB)* Insurance Brokerage 49.00 49.00
Union Bank of the Philippines (UBP) Banking 40.91 38.66 CSB Banking − 34.39 Cebu International Container Terminal, Inc.
(CICTI)* Transportation 20.00 20.00 South Western Cement Corporation (SWCC)** Cement 20.00 20.00 * No commercial operations ** The 2010 and 2009 financial statements of these associates were audited by other independent auditors. All other companies were audited by the principal auditors ***All companies are incorporated in the Philippines. The details of the Company’s investments in and advances to associates accounted for under the cost method follow:
2010 2009UBP P=5,154,420,902 P=4,507,737,189Accuria 719,739,476 719,739,476CICTI 240,125,000 240,125,000SWCC 28,995,322 28,995,322JAIB 1,884,426 1,884,426CSB − 79,001,110 6,145,165,126 5,577,484,532Less allowance for impairment losses (28,995,322) (28,995,322) 6,116,169,804 5,548,487,201Advances to associates 918,048 918,048 P=6,117,087,852 P=5,549,405,249
Following is the summarized financial information of UBP, a significant associate (amounts in thousand pesos):
2010 2009 2008UBP and Subsidiaries Total current assets P=61,929,911 P=58,908,760 P=35,789,294 Total noncurrent assets 191,069,906 185,452,558 168,111,809 Total current liabilities 211,977,367 208,043,868 175,597,243 Total noncurrent liabilities 5,037,100 5,037,100 1,287,100 Gross revenue 11,813,054 11,891,519 10,316,263 Net income 5,353,251 4,325,003 2,068,426
On various dates in 2010, the Company purchased additional 14.4 million shares in UBP for a total consideration of P=647.0 million, further increasing its share in UBP from 38.66% to 40.91%. In March 2009, the Company purchased additional 14.9 million shares in UBP for a total consideration of P=297.0 million increasing its share in UBP from 36.34% to 38.66%.

24
The fair value of the investment in UBP for which there is a published price quotation amounted to P=15.7 billion and P=9.2 billion as of December 31, 2010 and 2009, respectively.
8. Accounts Payable and Accrued Expenses
2010 2009Stocks purchases payable (see Note 6) P=355,908,432 P=235,017,429Accrued interest (see Notes 11 and 12) 31,513,112 11,830,224Advances to parent and subsidiaries (see Note 9) 24,359,344 −Others 116,042,956 72,086,080 P=527,823,844 P=318,933,733
Stock purchases payable as of December 31, 2010 and 2009 pertain to outstanding payables on acquisition of shares in certain investees. The amounts were subsequently paid in January 2011 and 2010, respectively. Other payable and accrued expenses as of December 31, 2010 and 2009 consist of expenses arising from the ordinary course of the business which are non-interest bearing and are normally on 30 days’ terms.
9. Related Party Disclosures In the normal course of business, the Company enters into transactions with related parties, principally consisting of the following: a. Interest-bearing temporary advances to ACO and certain subsidiaries and associates. Net
interest income earned from these temporary advances amounted to P=37.6 million, P=25.6 million, and P=54.1 million in 2010, 2009 and 2008, respectively.
b. Aviation services from AVI for the use of aircraft during travel of the Company’s officers and employees. Expenses amounted to P=12.7 million, P=11.4 million, and P=11.9 million in 2010, 2009 and 2008, respectively.
c. Service fees to CPDC for the use of CPDC’s properties by the Company’s officers and employees. Fees amounted to P=1.3 million, P=0.8 million, and P=0.5 million in 2010, 2009 and 2008, respectively.
d. Management and other professional and technical fees charged to related parties. Income amounted to P=491.9 million, P=410.2 million and P=423.2 million in 2010, 2009 and 2008, respectively. Accounts receivable outstanding from these revenues amounted to P=127.3 million in 2010 and P=154.0 million in 2009.
e. Cash deposits and investments in UBP earn interest income at prevailing rates.
f. Professional and technical services from ACO charged to operations amounted to P=27.7 million in 2008.

25
The parent company balance sheets include the following more significant balances resulting from the above transactions with related parties (amounts in thousand pesos):
Cash and Cash Equivalents Receivables (Payables) 2010 2009 2010 2009Parent Company ACO P=– P=– (P=647) (47,635)Subsidiaries CPDC – – 390 92,619 AP – – (9,560) 20,845 DLP – – 24,436 1,701 ATS – – 6,715 6,984 Subic Enerzone
Corporation – – 2,154 8,581 Mactan Enerzone
Corporation – – 2,825 3,888 Balamban Enerzone
Corporation – – 336 3,742 AP Renewables, Inc. – – (1,796) 3,133 PILMICO – – 39,595 773 Pilmico Animal Nutrition
Corporation (formerly Fil-am Foods, Inc.) – – 1,263 762
Aboitiz One, Inc. – – 729 486Associates UBP 4,249,972 419,750 193 17 Visayan Electric
Company, Inc. – – 44,123 12,478 Manila-Oslo Renewable
Enterprise, Inc. – – 13,060 11,127Other Related Parties – – 2,864 (6,505)
Compensation of Key Management Personnel
2010 2009 2008Short-term benefits P=49,202,311 P=55,704,950 P=37,139,875Post-employment benefits 2,616,804 5,015,833 2,761,494 P=51,819,115 P=60,720,783 P=39,901,369

26
10. Property and Equipment December 31, 2010
Transportation
Equipment
Office Equipment,
Furniture andFixtures
LeaseholdImprovements
ComputerEquipment
Construction in Progress Total
Cost At January 1 P=46,469,462 P=38,420,580 P=38,506,042 P=40,451,000 P=7,053,177 P=170,900,261 Additions 9,664,789 7,490,790 3,053,014 13,174,307 – 33,382,900Disposals (19,083,375) (4,229,586) (134,080) (1,133,780) – (24,580,821)Reclassifications – 156,318 7,109,306 (212,447) (7,053,177) –At December 31 37,050,876 41,838,102 48,534,282 52,279,080 – 179,702,340Accumulated depreciation and amortization:
At January 1 26,079,845 18,709,410 16,946,674 15,569,736 – 77,305,665Additions 8,540,555 7,847,748 4,545,393 10,427,985 – 31,361,681Disposals (14,111,614) (3,421,066) (836) (586,460) – (18,119,976)At December 31 20,508,786 23,136,092 21,491,231 25,411,261 – 90,547,370Net book value P=16,542,090 P=18,702,010 P=27,043,051 P=26,867,819 P=– P=89,154,970
December 31, 2009
Transportation
Equipment
Office Equipment,
Furniture andFixtures
LeaseholdImprovements
ComputerEquipment
Construction in Progress Total
Cost: At January 1 P=40,556,271 P=25,851,546 P=33,968,224 P=14,735,723 P=5,712,714 P=120,824,478 Additions 8,003,841 11,892,662 1,646,546 19,528,218 7,260,358 48,331,625 Disposals (3,276,364) (8,214) – (217,044) – (3,501,622)Reclassifications 1,185,714 684,586 2,891,272 6,404,103 (5,919,895) 5,245,780 At December 31 46,469,462 38,420,580 38,506,042 40,451,000 7,053,177 170,900,261 Accumulated depreciation and amortization: At January 1 20,552,006 13,294,294 13,132,110 11,516,651 – 58,495,061 Additions 8,804,201 5,415,116 3,814,564 4,270,127 – 22,304,008 Disposals (3,276,362) – – (217,042) – (3,493,404)At December 31 26,079,845 18,709,410 16,946,674 15,569,736 – 77,305,665 Net book value P=20,389,617 P=19,711,170 P=21,559,368 P=24,881,264 P=7,053,177 P=93,594,596
11. Long-term Debt
2010 2009Financial institutions - unsecured peso
denominated loans P=4,600,000,000 P=1,975,000,000Less current portion 608,850,000 375,000,000 P=3,991,150,000 P=1,600,000,000
The loans availed by the Company from financial institutions include:
a. An unsecured loan obtained in 2006, amounting to P=1.0 billion, is payable in five years with 10% of the principal due on the second year, 25% due on the third and fourth year and the remaining 40% on the fifth year, with interest rates ranging from 2.63% to 5.18% in 2010 and 5.06% to 7.49% in 2009, to be repriced on a quarterly basis.

27
b. Unsecured loan obtained in 2006, amounting to P=500.0 million, is payable in five years with 10% of the principal due on the second year, 25% due on the third and fourth year and the remaining 40% on the fifth year, with interest rates ranging from 2.46% to 5.21% in 2010 and 5.03% to 7.33% in 2009, subject to quarterly repricing.
c. Unsecured loan amounting to P=1.0 billion availed in 2008 with bullet principal payment due at the end of five years and with interest payments due quarterly at a fixed rate of 9.19%. The loan was fully paid on November 28, 2010.
2010 Fixed Rate Corporate Notes On May 19, 2010, the Company availed of a total of P=2.5 billion from the Notes Facility Agreement it signed on May 14, 2010, with First Metro Investment Corporation as Issue Manager. The Notes Facility Agreement provided for the issuance of 6-year corporate notes in a private placement to not more than 19 institutional investors pursuant to Section 9.2 of the Securities Regulation Code (SRC) and Rule 9.2(2)(B) of the SRC Rules. The note bears an annual interest of 8.25% and is unsecured. Prior to the maturity date, the Company may redeem in whole the relevant outstanding notes on the 16th interest payment date. The amount payable in respect of such early redemption shall be the accrued interest on the principal amount being earlier redeemed plus the Breakage Cost. Breakage Cost is calculated as the present value of the remaining principal amortizations and interest payments discounted at the sum of the comparable benchmark tenor yield plus the original spread on the loan. Unless previously redeemed, the notes shall be redeemable on a lump sum basis on the respective maturity date at its face value. Under the notes facility agreement, the Company shall not permit its debt to equity (DE) ratio to exceed 2:1 calculated based on its year-end audited parent company financial statements. For the purposes of determining compliance with the required ratio, the outstanding preferred shares and contingent liabilities of the Company, including but not limited to the liabilities in the form of corporate guarantees in favour of any person or entity, shall be included in the computation of debts. The Company is in compliance with the debt covenant as of December 31, 2010. Unamortized deferred debt issuance cost amounted to P=23.2 million as of December 31, 2010. On November 30, 2010, the Company availed another P=1.5 billion from the Notes Facility Agreement it signed on November 23, 2010, with Bank of Philippine Islands, BPI Asset Management and Trust Group as Investment Manager for ALFM Peso Bond, Inc. and BPI Asset Management and Trust Group as Noteholders. The Notes Facility Agreement provided for the issuance of 5-year corporate notes in a private placement to not more than 19 institutional investors pursuant to Section 9.2 of the SRC and Rule 9.2(2)(B) of the SRC Rules. The loan bears an annual interest of 5.23% and is unsecured. Prior to the maturity date, the Company may redeem in whole the relevant outstanding notes on the 12th interest payment date. The amount payable in respect of such early redemption shall be the accrued interest on the principal amount being earlier redeemed plus the Breakage Cost. Breakage Cost is calculated as the present value of the remaining principal amortizations and interest payments discounted at the sum of the comparable benchmark tenor yield plus the original spread of the loan, provided that the prepayment shall not exceed 102% nor less than 100% of the principal amount of the Notes being earlier redeemed.

28
Unless previously redeemed, the notes shall be redeemable on a lump sum basis on the respective maturity date at its face value. Under the notes facility agreement, the Company shall not permit its DE ratio to exceed 2.5:1 calculated based on its year-end audited parent company financial statements. For the purposes of determining compliance with the required ratio, the outstanding preferred shares and contingent liabilities of the Company, including but not limited to the liabilities in the form of corporate guarantees in favour of any person or entity, shall be included in the computation of debts. The Company is in compliance with the debt covenant as of December 31, 2010. Unamortized deferred debt issuance cost amounted to P=11.5 million in 2010.
Interest expense recognized on the long-term debt amounted to P=252.3 million in 2010, P=155.3 million in 2009, and P=164.1 million in 2008.
12. Capital Stock and Redeemable Preferred Shares
Information on the Company’s authorized capital stock follows:
Number of Shares 2010 2009Authorized capital stock:
Common shares, P=1 par value 9,600,000,000 9,600,000,000Preferred shares, P=1 par value 400,000,000 400,000,000
Outstanding capital stocks are as follows:
Number of Shares 2010 2009Common shares issued 5,694,599,621 5,694,599,621Less treasury shares 172,727,800 172,727,800Balance at end of year 5,521,871,821 5,521,871,821
Preferred shares issued: Balance at beginning of year 150,000,000 212,600,000Redeemed – (62,600,000)Balance at end of year 150,000,000 150,000,000
The redeemable preferred shares are presented in the parent company balance sheets as part of liabilities in accordance with PAS 32 as follows:
2010 2009Redeemable preferred shares P=1,500,000,000 P=1,500,000,000
The preferred shares are non-voting, non-participating, non-convertible, cumulative reissuable and redeemable and may be issued from time to time by the BOD in one or more series and fixed before issuance thereof, the number of shares in each series, and all designations, relative rights, preferences and limitations of the shares in each series. Preferred shares that are redeemed by the Company may be re-issued.

29
The Company’s outstanding preferred shares as of December 31, 2010 and 2009 consist of (1) Series “E” amounting to P=1,000,000 with fixed dividend rate of 8.25% per annum; and (2) Series “F” amounting to P=500,000 with fixed dividend rate of 8.5% per annum. The Company shall redeem the preferred shares at the end of the corresponding agreed periods from Issue Dates (Final Redemption Dates) regardless of the existence of unrestricted retained earnings or other amounts legally available for the payment of dividends in such period, provided that the Issuer has, after redemption, sufficient assets in the books to cover debts and liabilities inclusive of capital stock, and subject to the Issuer’s compliance with the applicable laws, rules and regulations, including the requirements of the SEC. The final redemption dates are as follows: (1) December 2011 for series “E” (shown as current in the December 31, 2010 parent company balance sheet); and (2) December 2013 for series “F”. The preferred shares shall be redeemed by payment in cash of 100% of the Issue Price plus all accrued and unpaid cash dividends on the Final Redemption Date. Interest expense recognized on the preferred shares amounted to P=161.6 million in 2009, P=168.6 million in 2008 and P=162.9 million in 2007.
13. Retained Earnings
On March 10, 2010, the BOD approved the declaration of a regular cash dividend of P=0.52 a share (P=2.9 billion) to stockholders of record as of March 24, 2010. These dividends were paid on April 16, 2010. On February 11, 2009, the BOD approved the declaration of a regular cash dividend of P=0.27 a share (P=1.5 billion) to stockholders of record as of February 26, 2009. These dividends were paid on March 23, 2009.
On February 7, 2008, the BOD approved the declarations of a regular cash dividend of P=0.31 a share (P=1.765 billion) and a special cash dividend of P=0.30 a share (P=1.708 billion) out of the Company’s retained earnings. These dividends were paid on March 3, 2008 to stockholders of record as of February 21, 2008.
14. Treasury Shares
On January 26, 2007, the Company successfully placed its entire treasury shares holdings representing 742,511,938 shares at a price of P=8.20 per share or a 5.7% discount to the share price close of P=8.70. The treasury sale transaction represents approximately P=5.9 billion, equivalent to US$124 million.
In 2008, the Company started to buy back its shares. As of December 31, 2010 and 2009, approximately 172.7 million AEV shares were bought into treasury with a total cost of P=1,295.2 million.

30
15. Cost of Services
2010 2009 2008Salaries and wages (see Note 17) P=103,692,316 P=96,144,307 P=37,655,844Depreciation (see Note 10) 30,746,986 23,383,199 14,845,569Professional fees (see Note 9) 26,699,961 21,820,208 16,435,652Employees’ benefits (see Notes 16 and 17) 8,330,389 18,816,818 13,241,929Communication, light and water 8,208,732 7,080,609 4,002,023Repairs and maintenance 6,232,562 5,285,204 5,931,985Rent (see Note 9) 5,369,601 4,525,268 613,046Amortization of computer software 2,455,826 4,367,273 5,021,404Office supplies 2,120,930 1,578,258 1,577,221Outside services – 1,399,395 – P=193,857,303 P=184,400,539 P=99,324,673
16. General and Administrative Expenses
2010 2009 2008Outside services P=38,785,152 P=15,400,389 P=9,494,747Bank charges 36,853,985 7,225,855 66,037,855Transportation and travel (see Note 9) 32,205,351 23,288,400 20,571,572Insurance 17,999,884 15,006,675 10,212,161Training and development 13,471,120 14,515,152 1,669,802Employees’ benefits
(see Notes 15 and 17) 5,335,552 5,419,256 2,754,368Communication, light and water 4,089,901 3,270,104 1,165,423Taxes and licenses 3,537,639 3,273,400 6,460,118Salaries and wages (see Note 17) 2,073,017 2,268,467 2,246,902Entertainment, amusement and
recreation 1,931,082 1,581,642 2,614,327Advertising 1,652,907 1,342,041 1,963,098Depreciation (see Note 10) 614,695 551,712 885,826Professional fees (see Note 9) 533,786 514,834 980,706Donations and contributions 504,218 2,080,000 70,000Repairs and maintenance 124,601 124,701 353,958Rent (see Note 9) 107,349 106,771 36,580Amortization of computer software 49,096 103,043 299,624Office supplies 42,402 37,238 94,112Others 37,500,706 18,309,181 10,944,721 P=197,412,443 P=114,418,861 P=138,855,900 Other expenses include books and periodicals, freight and handling, legal expense and other expenses that do not have specific account classification.

31
17. Personnel Expenses
2010 2009 2008Salaries and wages P=105,765,333 P=98,412,774 P=39,902,746Employee benefits (see Note 18) 13,665,941 24,236,074 15,996,297 P=119,431,274 P=122,648,848 P=55,899,043
18. Pension Benefit Plan
The Company has a funded, noncontributory, defined benefit pension plan, administered by the Fund’s Trustees, covering all regular and full-time employees.
The following tables summarizes the components of net benefit expense recognized in the parent company statements of income and the funded status and amounts recognized in the parent company balance sheets for the plan. Net benefit expense
2010 2009 2008Current service cost P=16,404,800 P=13,341,520 P=16,806,325Interest cost on benefit obligation 28,569,030 23,558,344 15,785,635Expected return on plan assets (36,565,345) (20,514,121) (18,046,172)Net actuarial loss (gain) recognized
during the year (3,154,179) 140,745 (1,220,849)Net benefit expense P=5,254,306 P=16,526,488 P=13,324,939
Actual return of the Company’s plan assets amounted to P=157.6 million in 2010, P=126.1 million in 2009 and (P=19.1 million) in 2008.
Pension liability (asset)
2010 2009Defined benefit obligation P=215,189,500 P=285,690,300Fair value of plan assets (366,906,391) (365,653,448)Unrecognized net actuarial losses 147,635,464 87,032,215Pension liability (asset) (P=4,081,427) P=7,069,067
Changes in the present value of the defined benefit obligation are as follows:
2010 2009Opening defined benefit obligation P=285,690,300 P=222,039,059Interest cost 28,569,030 23,558,344Current service cost 16,404,800 13,341,520Actuarial loss (gain) on obligation 57,300,570 (6,140,662)Benefits paid – (53,254,430)Employee transfers (172,775,200) 86,146,469Closing defined benefit obligation P=215,189,500 P=285,690,300

32
Changes in the fair value of plan assets are as follows:
2010 2009Opening fair value of assets P=365,653,448 P=186,492,012Expected return 36,565,345 20,514,121Actual contributions 16,404,800 20,126,403Actuarial gain 121,057,998 105,628,873Benefits paid – (53,254,430)Employee transfers (172,775,200) 86,146,469Closing fair value of plan assets P=366,906,391 P=365,653,448
The Company expects to contribute P=15.0 million to its defined benefit pension plan in 2011. The major categories of plan assets as a percentage of the fair value of the total plan assets are as follows:
2010 2009 Temporary investments 92.30% 99.28% Accounts receivable 7.70% 0.72%
The overall expected rate of return on assets is determined based on the market prices prevailing on that date, applicable to the period over which the obligation is to be settled. The principal assumptions on January 1, 2010 and 2009 used in determining pension liability for the Company’s plan are shown below:
2010 2009 Discount rate 10.00% 10.61% Expected rate of return on assets 10.00% 11.00% Future salary increase 8.00% 9.00%
Amounts for the current and previous periods follow: 2010 2009 2008 2007 Defined benefit obligation P=215,189,500 P=285,690,300 P=222,039,059 P=219,244,928 Fair value of plan assets 366,906,391 365,653,448 186,492,012 257,802,451 Deficit (surplus) (151,716,891) (79,963,148) 35,547,047 (38,557,523) Experience adjustments on plan liabilities (73,499,700) (71,930,400) (29,797,829) (14,036,444) Experience adjustments on plan assets − − (37,195,926) (37,772,511)

33
19. Income Tax The “Provision for income tax” account consists of:
2010 2009 2008Current Corporate income tax P=28,953,869 P=72,061,587 P=79,343,658 Final tax 3,018,367 3,249,359 7,402,612 31,972,236 75,310,946 86,746,270Deferred 4,075,706 (357,434) 3,885,245 P=36,047,942 P=74,953,512 P=90,631,515
The current provisions for income tax in 2010 and 2009 represent regular corporate income tax. The net deferred income tax assets represent the tax effects of the following:
2010 2009Accrued retirement P=2,504,113 P=6,928,266Unrealized foreign exchange loss (gain) 1,344 (347,103) P=2,505,457 P=6,581,163
In computing for deferred income tax assets and liabilities as of December 31, 2010 and 2009, the rate used was 30%, which is the rate expected to apply to taxable income in the years in which the deferred income tax assets and liabilities are expected to be recovered or settled. The reconciliation of the provision for income tax on income before income tax computed at the statutory tax rate to the provision for income tax reported in the Company statements of income follows:
2010 2009 2008Provision for (benefit from) income tax at
the statutory tax rates of 30% in 2010 and 2009 and 35% in 2008. P=1,194,710,423 P=1,140,092,880 (P=152,295,051)
Add (deduct) income tax effects of the following:
Nondeductible dividends on preferred shares 37,993,863 48,478,794 59,001,401Loss (gain) on sale of investment 22,370,229 (88,823) –Write-off of project costs 8,181,833 – 750,505,947Nondeductible interest expense 1,499,693 1,638,520 5,525,976Nontaxable dividend income (1,227,181,942) (1,113,454,195) (563,500,133)
Interest income already subjected to final tax at lower rate (1,526,157) (1,715,853) (5,754,474)
NOLCO – – (3,889,441) Others – 2,189 1,037,290 P=36,047,942 P=74,953,512 P=90,631,515

34
20. Financial Risk Management Objectives and Policies
The Company’s principal financial instruments comprise cash in banks and cash equivalents, AFS investments, redeemable preferred shares, and long-term debt. The main purpose of these financial instruments is to raise finances for the Company’s operations and its investments in existing subsidiaries and associates and in new projects. The Company has other financial assets and liabilities such as trade and other receivables and accounts payable and accrued expenses which arise directly from operations.
The main risks arising from the Company’s financial instruments are interest rate risk resulting from movements in interest rates that may have an impact on outstanding long-term loans and redeemable preferred shares; credit risk involving possible exposure to counter party default on its cash and AFS investments; liquidity risk in terms of the proper matching of the type of financing required for specific investments; and foreign exchange risk in terms of foreign exchange fluctuations that may significantly affect its foreign currency denominated placements. Credit risk Credit risk refers to the risk that a counterparty will default on its contractual obligations resulting in financial loss to the Company. The Company’s credit risk on its cash in banks and short-term investments, accounts receivables and advances to subsidiaries and associates pertains to possible default by the counterparty, with a maximum exposure equal to the carrying amount of these assets. With respect to short-term investments, the risk is mitigated by the short-term and/or liquid nature of its short-term investments mainly in bank deposits and placements, which are placed with financial institutions of high credit standing. With respect to accounts receivables and advances to subsidiaries and associates, credit risk is controlled by the application of credit approval, limit and monitoring procedures. It is the Company’s policy that all debtors who wish to trade on credit terms are subject to credit procedures. In addition, receivable balances are monitored on an ongoing basis with the result that the Company’s exposure to bad debts is not significant.
The Company has no significant concentration risk to a counterparty or group of counterparties. As of December 31, 2010 and 2009, none of the Company’s financial assets are past due nor impaired and the credit quality is considered to be of high grade as these are expected to be collectible without incurring any credit losses. The Company trades with related parties and recognized, creditworthy third parties. Counterparty risk The Company’s counterparty risk encompasses issuer risk on investment securities; credit risk on cash in bank, time deposits, and security deposit. The Company manages its counterparty risk by transacting with counterparties of good financial condition and selecting investment grade securities.
The Company’s maximum counterparty exposure is related to its cash and cash equivalents accounts which have a balance of P=5,551.2 million and P=420.8 million as of December 31, 2010 and 2009, respectively.

35
Liquidity risk Liquidity risk is the potential of not meeting obligations as they come due because of an inability to liquidate assets or obtain adequate funding. The Company maintains sufficient cash and cash equivalents to finance its operations. Any excess cash is invested in short-term money market placements. These placements are maintained to meet maturing obligations and pay dividend declarations. The Company, in general, matches the appropriate long-term funding instruments with the general nature of its equity investments. In managing its short-term fund requirements, the Company’s policy is to ensure that there are sufficient working capital inflows to match repayments of short-term borrowings. With regards to its long-term financing requirements, the Company’s policy is that not more than 35.0% of long-term borrowings should mature in any 12-month period. Of its debt, 26% will mature in less than one year from December 31, 2010 (2009: 11%). The following table summarizes the maturity profile of the Company’s financial liabilities based on contractual undiscounted payments (amounts in thousand pesos): December 31, 2010
Contractual undiscounted payments
TotalCarrying
Value Total On demandLess than
1 year 1 to 5 years More than
5 yearsAccounts payables and
accrued expenses P=527,204 P=527,204 P=– P=527,204 P=– P=– Long-term debt 4,600,000 6,226,288 – 898,611 2,649,031 2,678,646 Redeemable preferred
shares 1,500,000 1,710,000 – 1,125,000 585,000 – Total P=6,627,203 P=8,464,491 P=– P=2,551,435 P=3,234,031 P=2,678,646 December 31, 2009
Contractual undiscounted payments
Total Carrying
Value Total On demandLess than
1 year 1 to 5 years More than
5 yearsAccounts payables and
accrued expenses P=318,934 P=318,934 P=– P=318,934 P=– P=– Long-term debt 1,975,000 2,344,865 – 503,965 1,840,900 – Redeemable preferred
shares 1,500,000 1,835,000 – 125,000 1,710,000 – Total P=3,793,934 P=4,498,799 P=– P=947,899 P=3,550,900 P=– Market risk The Company’s activities expose it primarily to the financial risks of changes in interest rates. There has been no change to the Company’s exposure to market risks or the manner in which it manages and measures the risk.
Interest rate risk Cash flow interest rate risk is the risk that the future cash flows of a financial instrument will fluctuate because of changes in market interest rates. Fair value interest rate risk is the risk that the fair value of a financial instrument will fluctuate due to changes in market interest rates. The Company’s exposure to market risk for changes in interest rates relates primarily to its long-term debt obligations. To manage this risk, the Company determines the mix of its debt portfolio

36
as a function of the level of current interest rates, the required tenor of the loan, and the general use of the proceeds of its various fund raising activities. As of December 31, 2010, 10.00% of the Company’s long term debt had floating interest rates ranging from 2.46% to 5.21%, and 90.00% are with fixed rates ranging from 5.23% to 8.5%. As of December 31, 2009, 28.00% of the Company’s long-term debt had floating interest rates ranging from 5.03% to 7.72%, and 72.00% are with fixed rates ranging from 9.19% to 12.00% (see Note 11). The following table sets out the carrying amount, by maturity, of the Company's financial instruments that are exposed to interest rate risk (amounts in thousand pesos): December 31, 2010
Less than
1 year 1-5 years More than
5 years Total Fixed rate: Long-term debt P=8,850 P=1,516,650 P=2,474,500 P=4,000,000 Redeemable preferred shares 1,000,000 500,000 – 1,500,000Floating rate: Long-term debt 600,000 – – 600,000 P=1,608,850 P=2,016,650 P=2,474,500 P=6,100,000
December 31, 2009
Less than
1 year 1-5 years More than
5 years Total Fixed rate: Long-term debt P=– P=1,000,000 P=– P=1,000,000 Redeemable preferred shares – 1,500,000 – 1,500,000Floating rate: Long-term debt 375,000 600,000 – 975,000 P=375,000 P=3,100,000 P=– P=3,475,000
Interest on financial instruments classified as floating rate is repriced at intervals of less than one year. Interest on financial instruments classified as fixed rate is fixed until the maturity of the instrument. The other financial instruments of the Company that are not included in the above table are non-interest bearing and are therefore not subject to interest rate risk.

37
The following table demonstrates the sensitivity to a reasonably possible change in interest rates, with all other variables held constant, of the Company’s profit before tax (through the impact on floating-rate borrowings) (amounts in thousand pesos).
Increase (decrease)
in basis points Effect on income
before taxDecember 31, 2010 100 (P=6,000) (50) 3,000 December 31, 2009 100 (9,750) (50) 4,875
Foreign exchange risk The foreign exchange risk of the Company is mainly with respect to its foreign currency denominated cash investments.
To mitigate the risk of incurring foreign exchange losses, foreign currency holdings are matched against the potential need for foreign currency in financing equity investments and new projects. Capital management Capital includes equity attributable to the equity holders of the parent company. The primary objective of the Company’s capital management is to ensure that it maintains a strong credit rating and healthy capital ratios in order to support its business and maximize shareholder value. The Company manages its capital structure and makes adjustments to it, in light of changes in economic conditions. To maintain or adjust the capital structure, the Company may adjust the dividend payment to shareholders, return capital to shareholders or issue new shares. No changes were made in the objectives, policies or processes during the years ended December 31, 2010 and 2009. The Company is not subject to externally imposed capital requirements. The Company monitors capital using a gearing ratio, which is net debt divided by equity plus net debt. The Company’s policy is to keep the gearing ratio at 30% or below. The Company determines net debt as the sum of redeemable preferred shares and long-term debt less cash and short-term deposits and advances to subsidiaries and associates. Gearing ratios of the Company as of December 31, 2010 and 2009 are as follows (amounts in thousand pesos):
2010 2009Long-term debt P=4,600,000 1,975,000Redeemable preferred shares 1,500,000 1,500,000Cash and cash equivalents (5,551,192) (420,763)Advances from (to) parent and subsidiaries (2,850) 47,635Net debt (a) 545,958 3,101,872
Equity 19,614,232 18,533,570
Equity and net debt (b) P=20,160,190 P=21,635,442
Gearing ratio (a/b) 2.71% 14.34%

38
21. Financial Instruments Fair Value of Financial Instruments Set out below is a comparison by category of carrying amounts and fair value of all of the Company’s financial instruments that are carried in the financial statements as of December 31, 2010 and 2009 (amounts in thousand pesos).
2010 2009
Carrying
Value Fair
Value Carrying
Value Fair
Value Financial Assets: Loans and receivable
Cash and cash equivalents P=5,551,192 P=5,551,192 P=420,763 P=420,763 Trade and other receivables 921,893 921,893 118,786 118,786
6,473,085 6,473,085 539,549 539,549 AFS investments
Quoted shares of stock 340,347 340,347 334,629 334,629 P=6,813,432 P=6,813,432 P=874,178 P=874,178
Financial Liabilities: Other financial liabilities
Accounts payable and accrued expenses P=527,824 P=527,824 P=318,934 P=318,934 Long-term debt: Floating rate 600,000 600,000 975,000 975,000 Fixed rate 4,000,000 4,187,969 1,000,000 1,090,946 Redeemable preferred shares: Fixed rate 1,500,000 1,573,043 1,500,000 1,538,741
P=6,627,824 P=6,884,836 P=3,793,934 P=3,923,621
Fair value is defined as the amount at which the financial instrument could be exchanged in a current transaction between knowledgeable willing parties in an arm’s length transaction, other than in a forced liquidation or sale. Fair values are obtained from quoted market prices, discounted cash flow models and option pricing models, as appropriate. The following methods and assumptions are used to estimate the fair value of each class of financial instruments:
Cash and cash equivalents, trade and other receivables, and accounts payable and accrued expenses The carrying amounts of cash and cash equivalents, trade and other receivables and trade and other payables approximate fair value due to the relatively short-term maturity of these financial instruments. Fixed-rate borrowings and Redeemable preferred shares The fair values of fixed rate interest bearing loans and redeemable preferred shares are based on the discounted value of future cash flows using the applicable rates for similar types of loans ranging from 4.26% to 6.41% and 6.81% to 7.78% in 2010 and 2009, respectively.

39
Variable-rate borrowings Where the repricing of the variable-rate interest bearing loan is frequent (i.e., three-month repricing), the carrying value approximates the fair value. Otherwise, the fair value is determined by discounting the principal plus the known interest payment using current market rates. The carrying values of the variable-rate borrowings approximate the fair value.
AFS investments The fair value of AFS investments are based on quoted market prices. Fair Value Hierarchy The Company uses the following hierarchy for determining the fair value of financial instruments by valuation technique:
Level 1: quoted (unadjusted) prices in active markets for identical assets or liabilities Level 2: other techniques for which all inputs which have a significant effect on the recorded
fair value are observable, either directly or indirectly Level 3: techniques which use inputs which have a significant effect on the recorded fair value
that are not based on observable market data. As of December 31, 2010 and 2009, the Company’s AFS investments, which are measured using level 1 valuation technique, are the only financial instruments measured at fair value . During the reporting period ending December 31, 2010 and 2009, there were no transfers between Level 1 and Level 2 fair value measurements, and no transfers into and out of Level 3 fair value measurements.
22. Events After Balance Sheet Date
On March 3, 2011, the BOD of the Company approved the declaration of a cash dividend of P=1.58 a share (P=8.7 billion) to all stockholders of record as of March 17, 2011, payable on April 5, 2011.
23. Supplementary Information Required Under Revenue Regulations 15-2010
The Company reported and/or paid the following types of taxes in 2010: Value added tax (VAT) The Company’s sales are subject to output value added tax (VAT) while its importations and purchases from other VAT-registered individuals or corporations are subject to input VAT. The VAT rate is 12.0%.

40
a. Net Sales/Receipts and Output VAT declared in the Company’s VAT returns for 2010
Net Sales/
Receipts Output
VAT Taxable Sales:
Sale of goods P=5,796,028 P=695,523 Sales of services 427,353,742 51,282,449
433,149,770 51,977,972 Zero-rated Sales 19,852,038 − Exempt Sales 158,433,872 − P=611,435,680 P=51,977,972
Zero-rated sales of goods and services consist of those rendered to persons or entities whose exemptions are provided under special laws or international agreements to which the Philippines is a signatory.
b. Input VAT claimed per 2010 VAT Returns
Balance at January 1 P=5,990,962 Current year’s domestic purchases/payments for: Goods for resale/manufacture or further processing − Goods other than for resale or manufacture 1,163,968 Capital goods subject to amortization 2,710,447 Capital goods not subject to amortization 275,724 Services lodged under cost of goods sold − Services lodged under other accounts 14,828,371 24,969,472 VAT input applied against VAT output 18,781,338 Balance at December 31 P=6,188,134
Other Taxes and Licenses for 2010
Taxes and licenses, local and national, include real estate taxes, licenses and permit fees for 2010:
Included in Operating Expenses: License and permits fees P=3,321,990 Documentary stamp taxes on shares of stocks 184,081 Fringe benefits taxes 88,400 Real estate taxes 21,326 Others 10,242 P=3,626,039

41
Percentage tax on sale of ATS shares amounting to P=17,773 is lodged under the account “Loss on Sale of Investments.”

42
Withholding Taxes
Withholding taxes on compensation and benefits P=22,013,764 Expanded withholding taxes 10,688,324 Final withholding taxes 56,996,623
P=89,698,711
Tax Assessments and Cases
The Company has no pending tax cases outside the administration of the BIR.


*SGVMC409510*
ABOITIZ EQUITY VENTURES, INC. AND SUBSIDIARIES NOTES TO CONSOLIDATED FINANCIAL STATEMENTS (Amounts in Thousands, Except Par Value, and When Otherwise Indicated) 1. Corporate Information
Aboitiz Equity Ventures, Inc. (the Company) was incorporated and is domiciled in the Republic of the Philippines. The Company and its subsidiaries (collectively referred to as the “Group”) are engaged in various business activities mainly in the Philippines, including power generation and distribution, food manufacturing, banking and financial services and transportation (see Notes 14 and 30). The Company is the publicly-listed holding and management company of the Group. The registered office address of the Company is Aboitiz Corporate Center, Gov. Manuel A. Cuenco Avenue, Cebu City. The parent and the ultimate parent of the Company is Aboitiz & Company, Inc. (ACO). The consolidated financial statements of the Group as of December 31, 2010 and 2009 and for each of the three years in the period ended December 31, 2010, were authorized for issue by the Board of Directors (BOD) of the Company on March 3, 2011.
2. Basis of Preparation, Statement of Compliance and Summary of Significant Accounting
Policies
Basis of Preparation The consolidated financial statements of the Group have been prepared on a historical cost basis, except for derivative financial instruments, quoted AFS investments and investment properties which are measured at fair value, and agricultural produce and certain biological assets which are measured at fair value less estimated point-of-sale costs. The consolidated financial statements are presented in Philippine peso and all values are rounded to the nearest thousand except for earnings per share and exchange rates and as otherwise indicated.
Statement of Compliance The consolidated financial statements of the Group have been prepared in compliance with Philippine Financial Reporting Standards (PFRS).
Changes in Accounting Policies The accounting policies adopted are consistent with those of the previous financial year except for the amended and revised PFRS and Philippine Interpretations which the Group has adopted starting January 1, 2010. Adoption of the following revised and amended PFRS and Philippine Interpretations and improvements to PFRS did not have any significant impact to the Group’s consolidated financial statements. Amended and Revised Standards and Interpretations
• PFRS 2, Share-based Payment (Amendment) - Group Cash-settled Share-based Payment Transactions
• PFRS 3 (Revised), Business Combinations, and PAS 27 (Amended), Consolidated and Separate Financial Statements
• PAS 39, Financial Instruments: Recognition and Measurement (Amendment) - Eligible Hedged Items
• Philippine Interpretation IFRIC 17, Distribution of Non-cash Assets to Owners

- 2 -
*SGVMC409510*
Improvements to PFRS • PAS 1, Presentation of Financial Statements • PFRS 2, Share-based Payment • PFRS 5, Non-current Assets Held for Sale and Discontinued Operations • PAS 7, Statement of Cash Flows • PFRS 8, Operating Segments • PAS 17, Leases • PAS 36, Impairment of Assets • PAS 38, Intangible Assets • PAS 39, Financial Instruments: Recognition and Measurement • Philippine Interpretation IFRIC 9, Reassessment of Embedded Derivatives • Philippine Interpretation IFRIC 16, Hedge of a Net Investment in a Foreign Operation
New Accounting Standards, Interpretations and Amendments to Existing Standards Effective
Subsequent to December 31, 2010 The Group will adopt the standards and interpretations enumerated below when these become effective. Except as otherwise indicated, the Group does not expect the adoption of these new and amended PFRS and Philippine Interpretations and improvements to PFRS to have significant impact on its consolidated financial statements. Effective in 2011 PAS 24 (Amended), Related Party Disclosures The amended standard is effective for annual periods beginning on or after January 1, 2011. It clarified the definition of a related party to simplify the identification of such relationships and to eliminate inconsistencies in its application. The revised standard introduces a partial exemption of disclosure requirements for government-related entities. Early adoption is permitted for either the partial exemption for government-related entities or for the entire standard. PAS 32, Financial Instruments: Presentation (Amendment) - Classification of Rights Issues The amendment to PAS 32 is effective for annual periods beginning on or after February 1, 2010 and amended the definition of a financial liability in order to classify rights issues (and certain options or warrants) as equity instruments in cases where such rights are given pro rata to all of the existing owners of the same class of an entity’s non-derivative equity instruments, or to acquire a fixed number of the entity’s own equity instruments for a fixed amount in any currency. PFRS 7, Financial Instruments: Disclosures (Amendments) - Disclosures - Transfers of Financial
Assets The amendments to PFRS 7 are effective for annual periods beginning on or after July 1, 2011. The amendments will allow users of financial statements to improve their understanding of transfer transactions of financial assets (for example, securitizations), including understanding the possible effects of any risks that may remain with the entity that transferred the assets. The amendments also require additional disclosures if a disproportionate amount of transfer transactions are undertaken around the end of a reporting period. Philippine Interpretation IFRIC 14 (Amendment) - Prepayments of a Minimum Funding Requirement The amendment to Philippine Interpretation IFRIC 14 is effective for annual periods beginning on or after January 1, 2011, with retrospective application. The amendment provides guidance on assessing the recoverable amount of a net pension asset. The amendment permits an entity to treat the prepayment of a minimum funding requirement as an asset.

- 3 -
*SGVMC409510*
Philippine Interpretation IFRIC 19, Extinguishing Financial Liabilities with Equity Instruments Philippine Interpretation IFRIC 19 is effective for annual periods beginning on or after July 1, 2010. The Interpretation clarifies that equity instruments issued to a creditor to extinguish a financial liability qualify as consideration paid. The equity instruments issued are measured at their fair value. In case that this cannot be reliably measured, the instruments are measured at the fair value of the liability extinguished. Any gain or loss is recognized immediately in the consolidated statement of income. Improvements to PFRSs 2010 Improvements to PFRSs is an omnibus of amendments to PFRSs. The amendments have not been adopted as they become effective for annual periods on or after either July 1, 2010 or January 1, 2011. The amendments listed below, are considered to have a reasonably possible impact on the Group:
• PFRS 3, Business Combinations • PFRS 7, Financial Instruments: Disclosures • PAS 1, Presentation of Financial Statements • PAS 27, Consolidated and Separate Financial Statements
Effective in 2012 PAS 12, Income Taxes (Amendment) - Deferred Tax: Recovery of Underlying Assets The amendment provides a practical solution to the problem of assessing whether recovery of an asset will be through use or sale. It introduces a presumption that recovery of the carrying amount of an asset will, normally, be through sale. Philippine Interpretation IFRIC 15, Agreements for the Construction of Real Estate This Interpretation, effective for annual periods beginning on or after January 1, 2012, covers accounting for revenue and associated expenses by entities that undertake the construction of real estate directly or through subcontractors. The Interpretation requires that revenue on construction of real estate be recognized only upon completion, except when such contract qualifies as construction contract to be accounted for under PAS 11, Construction Contracts, or involves rendering of services in which case revenue is recognized based on stage of completion. Contracts involving provision of services with the construction materials and where the risks and rewards of ownership are transferred to the buyer on a continuous basis will also be accounted for based on stage of completion. Effective in 2013 PFRS 9, Financial Instruments PFRS 9, as issued in 2010, reflects the first phase of the work on the replacement of PAS 39 and applies to classification and measurement of financial assets and financial liabilities as defined in PAS 39. The standard is effective for annual periods beginning on or after January 1, 2013. In subsequent phases, hedge accounting and derecognition will be addressed. The completion of this project is expected in the second quarter of 2011. The Group will assess the impact of this standard on its consolidated financial statements.

- 4 -
*SGVMC409510*
Basis of Consolidation The consolidated financial statements include the financial statements of the Company and the subsidiaries listed in the following table (see Note 14).
Percentage of Ownership 2010 2009 2008 Nature of Business Direct Indirect Direct Indirect Direct Indirect Aboitiz Power Coporation (AP) and Subsidiaries Power 76.40% – 76.40% – 76.03 –
Aboitiz Energy Solutions, Inc. (AESI) Power – 100.00 – 100.00 – 100.00 Subic Enerzone Corporation (SEZC) Power – 100.00 – 100.00 – 100.00 Aboitiz Renewables Inc. (ARI) (formerly Philippine Hydropower Corporation) and Subsidiaries*** Power – 100.00 – 100.00 – 100.00
Hedcor, Inc. (HI) Power – 100.00 – 100.00 – 100.00 Hedcor Tamugan, Inc. (HTI) Power – 100.00 – 100.00 – 100.00 Hedcor Sibulan, Inc. (HSI) Power – 100.00 – 100.00 – 100.00 Cleanergy, Inc. (CI) Power – 100.00 – 100.00 – 100.00 Hydro Electric Development Corporation (HEDC) Power – 99.97 – 99.97 – 99.97
Mactan Enerzone Corporation (MEZ) Power – 100.00 – 100.00 – 100.00 Cotabato Light & Power Co., Inc. (CLP) Power – 99.94 – 99.93 – 99.91
Cotabato Ice Plant, Inc. Manufacturing – 100.00 – 100.00 – 100.00 Davao Light & Power Co., Inc. (DLP) Power – 99.93 – 99.93 – 99.92 Cebu Private Power Corporation (CPPC) Power – 60.00 – 60.00 – 60.00 Balamban Enerzone Corporation (BEZ) Power – 100.00 – 100.00 – 100.00 Abovant Holdings, Inc. (AHI) Power – 60.00 – 60.00 – 60.00 AP Renewables, Inc. (APRI) Power – 100.00 – 100.00 – 100.00 Therma Power, Inc. (TPI) Power – 100.00 – 100.00 – 100.00 Therma Power Visayas, Inc. (TPVI) Power – 100.00 – 100.00 – 100.00 Therma Luzon, Inc. (TLI) Power – 100.00 – 100.00 – – Therma Marine, Inc. (Therma Marine) Power – 100.00 – 100.00 – – Therma Mobile, Inc. (Therma Mobile)* Power – 100.00 – 100.00 – – Therma Pagbilao, Inc.* Power – 100.00 – 100.00 – – Adventenergy, Inc. (AI)* Power – 100.00 – 100.00 – 100.00
Pilmico Foods Corporation (PILMICO) Food manufacturing 100.00 – 100.00 – 100.00 – Fil-Agri Holdings, Inc. Holding company – 100.00 – 100.00 – 100.00 Pilmico Animal Nutrition Corporation
(PANC; formerly Fil-Am Foods, Inc.) Food manufacturing – 100.00 – 100.00 – 100.00 Fil-Agri Land, Inc. Real Estate – 100.00 – 100.00 – 100.00
Aboitiz Transport System Corp. (ATS and Subsidiaries) (see Note 14) Transportation – – 77.24 – 77.24 –
Supercat Fast Ferry Corporation (SFFC) Transportation – – – 100.00 – 100.00 WG & A Supercommerce, Inc. (WSI) Transportation – – – 100.00 – 100.00 Zoom In Packages, Inc. (ZIP) Transportation – – – 100.00 – 100.00
Aboitiz One, Inc. (AOI) and Subsidiaries
Courier, logistics and forwarding services – – – 100.00 – 100.00
Aboitiz Jebsen Bulk Transport Corporation (AJBTC) and Subsidiaries**** Ship management 62.50 – – 62.50 – 62.50
Jebsen Maritime, Inc. (JMI)**** Manpower services 62.50 – – 62.50 – 62.50 Aboitiz Jebsen Manpower Solutions, Inc. (AJMSI)**** Manpower services 62.50 – – 62.50 – 62.50 JebsenManagement (BVI) Limited
(JMBVI ) and Subsidiaries** Shipping – – – 50.00 – 50.00 City Savings Bank (CSB) (see Note 9) Financial Services 59.25 40.00 – – – – Archipelago Insurance Pte Ltd (AIPL)***** Insurance 100.00 – – – – – AEV Aviation, Inc. (AEV Aviation) Service 100.00 – 100.00 – 100.00 – AEV Properties, Inc.* Real estate 100.00 – 100.00 – 100.00 – Cebu Praedia Development Corporation (CPDC) Real estate 88.27 8.96 88.27 8.96 88.27 8.91 *No commercial operations **Incorporated in the British Virgin Islands. Functional currency is United States (US) dollars. ***On March 23, 2010, the SEC approved the change of corporate name of PHC to Aboitiz Renewables, Inc. ****Acquired direct ownership from ATS in 2010 (see Note 14) *****Incorporated in Singapore

- 5 -
*SGVMC409510*
Except for JMBVI and AIPL, all the subsidiaries were incorporated in the Philippines. Basis of consolidation from January 1, 2010 The consolidated financial statements comprise the financial statements of the Company and its subsidiaries as at December 31 of each year. The financial statements of the subsidiaries are prepared for the same reporting year as the Company using consistent accounting policies. Subsidiaries are fully consolidated from the date of acquisition, being the date on which the Group obtains control, and continue to be consolidated until the date that such control ceases. All intra-group balances, transactions, income and expenses and profits and losses resulting from intra-group transactions that are recognized in assets, are eliminated in full. The results of subsidiaries acquired or disposed of during the year are included in the consolidated statement of income from the date of acquisition or up to the date of disposal, as appropriate. Losses within a subsidiary are attributed to the non-controlling interest even if that results in a deficit balance. A change in the ownership interest of a subsidiary, without loss of control, is accounted for as an equity transaction. If the Group loses control over a subsidiary, it: • Derecognizes the assets (including goodwill) and liabilities of the subsidiary • Derecognizes the carrying amount of any non-controlling interest; • Derecognizes the cumulative translation differences, recorded in equity • Recognizes the fair value of the consideration received • Recognizes the fair value of any investment retained • Recognizes any surplus or deficit in profit or loss • Reclassifies the parent’s share of components previously recognized in other comprehensive
income to profit or loss or retained earnings, as appropriate. Basis of consolidation prior to January 1, 2010 Certain of the abovementioned requirements were applied on a prospective basis. The following differences, however, are carried forward in certain instances from the previous basis of consolidation: • Losses incurred by the Group were attributed to the non-controlling interest until the balance
was reduced to nil. Any further excess losses were attributed to the parent, unless the non-controlling interest had a binding obligation to cover these. Losses prior to January 1, 2010 were not reallocated between non-controlling interest and the parent shareholders.
• Upon loss of control, the Group accounted for the investment retained at its proportionate share of net asset value at the date control was lost. The carrying value of such investment at January 1, 2010 has not been restated.
Transactions with non-controlling interests Non-controlling interests represent the portion of profit or loss and net assets in the subsidiaries not held by the Group and are presented separately in the consolidated statement of income and within equity in the consolidated balance sheet, separately from the equity attributable to equity holders of the parent. Transactions with non-controlling interests are accounted for as equity transactions. On acquisitions of non-controlling interests, the difference between the consideration and the book value of the share of the net assets acquired is reflected as being a transaction between owners and recognized directly in equity. Gain or loss on disposals to non-controlling interest is also recognized directly in equity.

- 6 -
*SGVMC409510*
Summary of Significant Accounting Policies Cash and Cash Equivalents Cash and cash equivalents in the consolidated balance sheet consist of cash on hand and with banks and short-term deposits with an original maturity of three (3) months or less from dates of placements and that are subject to insignificant risk of changes in value. For the purpose of the consolidated statement of cash flows, cash and cash equivalents consist of cash and cash equivalents as defined above, net of outstanding bank overdrafts. Financial Instruments Date of recognition The Group recognizes a financial asset or a financial liability in the consolidated balance sheet on the date when it becomes a party to the contractual provisions of the instrument. All regular way purchases and sales of financial assets are recognized on trade date, which is the date that the Group commits to purchase the asset. Regular way purchases or sales of financial assets are purchases or sales of financial assets that require delivery of assets within the period generally established by regulation or convention in the marketplace. Derivatives are recognized on a trade date basis. Initial recognition of financial instruments All financial assets and financial liabilities are recognized initially at fair value. Except for financial assets at fair value through profit or loss (FVPL), the initial measurement of financial assets includes transaction costs. The Group classifies its financial assets in the following categories: financial assets at FVPL, loans and receivables, held-to-maturity (HTM) investments, and AFS investments. For financial liabilities, the Group also classifies them into financial liabilities at FVPL and other financial liabilities. The classification depends on the purpose for which the investments were acquired and whether they are quoted in an active market. The Group determines the classification of its financial assets at initial recognition and, where allowed and appropriate, re-evaluates such designation at every reporting date.
Determination of fair value The fair value of investments held that are actively traded in organized financial markets is determined by reference to quoted market bid prices at the close of business on the balance sheet date. For investments where there is no active market, fair value is determined using valuation techniques. Such techniques include using recent arm’s length market transactions; reference to the current market value of another instrument, which are substantially the same; discounted cash flow analysis and other valuation models.
For all other financial instruments not listed in an active market, the fair value is determined by using appropriate valuation methodologies. Valuation methodologies include net present value techniques, comparison to similar instruments for which market observable prices exist, options pricing models, and other relevant valuation models. ‘Day 1’ Difference Where the transaction price in a non-active market is different from the fair value of other observable current market transactions in the same instrument or based on a valuation technique whose variables include only data from observable market, the Group recognizes the difference between the transaction price and fair value (a ‘Day 1’ difference) in the consolidated statement of income unless it qualifies for recognition as some other type of asset. In cases where use is made of data which is not observable, the difference between the transaction price and model value is only recognized in the consolidated statement of income when the inputs become observable or when the instrument is derecognized. For each transaction, the Group determines the appropriate method of recognizing the ‘Day 1’ difference amount.

- 7 -
*SGVMC409510*
Financial assets and financial liabilities at FVPL Financial assets and financial liabilities at FVPL include financial assets held for trading and financial assets designated upon initial recognition as FVPL. Financial assets and financial liabilities are classified as held for trading if they are acquired for the purpose of selling and repurchasing in the near term. Derivatives, including separated embedded derivatives, are also classified as held for trading unless they are designated as effective hedging instruments or a financial guarantee contract. Gains or losses on investments held for trading are recognized in the consolidated statement of income. Financial assets and financial liabilities may be designated at initial recognition as at FVPL if the following criteria are met: (i) the designation eliminates or significantly reduces the inconsistent treatment that would otherwise arise from measuring the assets or liabilities or recognizing the gains or losses on them on a different basis; or (ii) the assets and liabilities are part of a group of financial assets, liabilities or both which are managed and their performance evaluated on fair value basis, in accordance with a documented risk management strategy; or (iii) the financial instrument contains an embedded derivative that would need to be separately recorded. When a contract contains one or more embedded derivatives, the entire hybrid contract may be designated as a financial asset or financial liabilities at FVPL, except when the embedded derivative does not significantly modify the cash flows or it is clear that separation of the embedded derivative is prohibited.
Financial assets and liabilities at FVPL are recorded in the consolidated balance sheet at fair value. Subsequent changes in fair value are recognized in the consolidated statement of income. Interest earned or incurred is recorded as interest income or expense, respectively, while dividend income is recorded as other income when the right to receive payment has been established.
Financial instruments included in this classification are the Group’s derivative asset and derivative liability (see Note 33). Loans and receivables Loans and receivables are non-derivative financial assets with fixed or determinable payments that are not quoted in an active market. They are not entered into with the intention of immediate or short-term resale and are not reclassified or designated as AFS investments or financial assets at FVPL. After initial measurement, loans and receivables are subsequently carried at amortized cost using the effective interest method less any allowance for impairment. Amortized cost is calculated taking into account any discount or premium on acquisition and includes fees that are an integral part of the effective interest rate and transaction costs. Gains and losses are recognized in the consolidated statement of income when the loans and receivables are derecognized or impaired, as well as through the amortization process. Loans and receivables are included in current assets if maturity is within 12 months from the balance sheet date. Otherwise, they are classified as non-current assets. Financial assets included in this classification are the Group’s cash in banks and cash equivalents, trade and other receivables and restricted cash (see Note 33). HTM investments HTM investments are quoted non-derivative financial assets which carry fixed or determinable payments and fixed maturities and which the Group has the positive intention and ability to hold to maturity. After the initial measurement, held to maturity investments are measured at amortized cost. This cost is computed as the amount initially recognized less principal repayments, plus or minus the cumulative amortization using the effective interest method of any difference between
- 8 -
*SGVMC409510*
the initially recognized amount and the maturity amount, less allowance for impairment. This calculation includes all fees and points paid or received between the parties to the contract that are integral part of the effective interest rate, transaction costs and all other premiums and discounts. Where the Group sells other than an insignificant amount of HTM investments, the entire category would be tainted and reclassified as AFS investments. Gains and losses are recognized in the consolidated statement of income when the investments are impaired, as well as through the amortization process. As of December 31, 2010 and 2009, the Group has no HTM investments. AFS investments Available-for-sale financial investments include equity and debt securities. Equity investments classified as available-for sale are those which are neither classified as held for trading nor designated as at FVPL. Debt securities in this category are those which are intended to be held for an indefinite period of time and which may be sold in response to needs for liquidity or in response to changes in the market conditions. They are included in non-current assets unless the investment matures or management intends to dispose of it within 12 months of the end of the reporting period. After initial recognition, AFS financial assets are measured at fair value with unrealized gains or losses being recognized in the other comprehensive income and in equity as “Net unrealized valuation gains on AFS investments”. When the investment is disposed of, the cumulative gains or loss previously recorded in equity is recognized in the consolidated statement of income. The Group uses the specific identification method in determining the cost of securities sold. Interest earned or paid on the investments is reported as interest income or expense using the effective interest rate. Unquoted equity securities are carried at cost, net of impairment. The Group’s AFS investments as of December 31, 2010 and 2009 include investments in quoted and unquoted shares of stock (see Note 33).
Other financial liabilities Financial liabilities are classified in this category if these are not held for trading or not designated as at FVPL upon the inception of liability. These include liabilities arising from operations or borrowings. Other financial liabilities are initially recorded at fair value, less directly attributable transaction costs. After initial recognition, interest-bearing loans and borrowings are subsequently measured at amortized cost using the effective interest method. Amortized cost is calculated by taking into account any issue costs, and any discount or premium on settlement. Gains and losses are recognized in the consolidated statement of income when the liabilities are derecognized as well as through the amortization process.
Included in other financial liabilities are the Group’s debt and other borrowings (bank loans and long-term debts), obligations under finance lease, trade and other payables, customers’ deposits, dividends payable, long-term obligation on PDS, payable to preferred shareholder of a subsidiary, and redeemable preferred shares (see Note 33).

- 9 -
*SGVMC409510*
Impairment of Financial Assets The Group assesses at each balance sheet date whether a financial asset or group of financial assets is impaired. A financial asset or a group of financial assets is deemed to be impaired if and only if, there is an objective evidence of impairment as a result of one or more events that has occurred after the initial recognition of the asset (an incurred ‘loss event’) and that loss event has an impact on the estimated future cash flows of the financial asset or the group of financial assets that can be reliably estimated. Evidence of impairment may include indications that the debtors or a group of debtors is experiencing significant financial difficulty, default or delinquency in interest or principal payments, the probability that they will enter bankruptcy or other financial reorganization and where observable data indicate that there is a measurable decrease in the estimated future cash flows, such as changes in arrears or economic conditions that correlate with defaults. Loans and receivables For loans and receivables carried at amortized cost, the Group first assesses individually whether objective evidence of impairment exists for financial assets that are individually significant, or collectively for financial assets that are not individually significant. If there is objective evidence that an impairment loss has been incurred, the amount of the loss is measured as the difference between the asset’s carrying amount and the present value of estimated future cash flows (excluding future expected credit losses that have not yet been incurred). If the Group determines that no objective evidence of impairment exists for an individually assessed financial asset, whether significant or not, the asset is included in a group of financial assets with similar credit risk characteristics and that group of financial assets is collectively assessed for impairment. Assets that are individually assessed for impairment and for which an impairment loss is or continues to be recognized are not included in a collective assessment of impairment. The carrying amount of the asset is reduced through the use of an allowance account and the amount of the loss is recognized in the consolidated statement of income. Interest income continues to be accrued on the reduced carrying amount based on the original effective interest rate of the financial asset. Loans and receivables together with the associated allowance are written off when there is no realistic prospect of future recovery and all collateral has been realized or has been transferred to the Group. If, in a subsequent period, the amount of the impairment loss increases or decreases because of an event occurring after the impairment was recognized, the previously recognized impairment loss is increased or decreased by adjusting the allowance account. Any subsequent reversal of an impairment loss is recognized in the consolidated statement of income, to the extent that the carrying value of the asset does not exceed its amortized cost at the reversal date. Assets carried at cost If there is objective evidence that an impairment loss on an unquoted equity instrument that is not carried at fair value because its fair value cannot be reliably measured, or on a derivative asset that is linked to and must be settled by delivery of such an unquoted equity instrument has been incurred, the amount of the loss is measured as the difference between the asset’s carrying amount and the present value of estimated future cash flows discounted at the current market rate of return for a similar financial asset.
AFS investments In the case of equity investments classified as AFS, objective evidence of impairment would include a significant or prolonged decline in the fair value of the investments below its cost. Where there is evidence of impairment, the cumulative loss (measured as the difference between the acquisition cost and the current fair value, less any impairment loss on that financial asset previously recognized in the consolidated statement of income) is removed from other

- 10 -
*SGVMC409510*
comprehensive income and recognized in the consolidated statement of income. Impairment losses on equity investments are not reversed through the consolidated statement of income. Increases in fair value after impairment are recognized directly in other comprehensive income. Derecognition of Financial Assets and Liabilities Financial assets A financial asset (or, where applicable a part of a financial asset or part of a group of similar financial assets) is derecognized where: • the rights to receive cash flows from the asset have expired; • the Group retains the right to receive cash flows from the asset, but has assumed an obligation to
pay them in full without material delay to a third party under a ‘pass-through’ arrangement; or • the Group has transferred its rights to receive cash flows from the asset and either (a) has
transferred substantially all the risks and rewards of the asset, or (b) has neither transferred nor retained substantially all the risks and rewards of the asset, but has transferred control of the asset.
Where the Group has transferred its rights to receive cash flows from an asset and has neither transferred nor retained substantially all the risks and rewards of the asset nor transferred control of the asset, the asset is recognized to the extent of the Group’s continuing involvement in the asset. Continuing involvement that takes the form of a guarantee over the transferred asset is measured at the lower of the original carrying amount of the asset and the maximum amount of consideration that the Group could be required to repay. Financial liabilities A financial liability is derecognized when the obligation under the liability is discharged or cancelled or has expired. Where an existing financial liability is replaced by another from the same lender on substantially different terms, or the terms of an existing liability are substantially modified, such an exchange or modification is treated as a derecognition of the original liability and the recognition of a new liability, and the difference in the respective carrying amounts is recognized in consolidated statement of income. Derivative Financial Instruments Derivative financial instruments, including embedded derivatives, are initially recognized at fair value on the date in which a derivative transaction is entered into or bifurcated, and are subsequently re-measured at FVPL, unless designated as effective hedge. Changes in fair values of derivative instruments not accounted as hedges are recognized immediately in the consolidated statement of income. Derivatives are carried as assets when the fair value is positive and as liabilities when the fair value is negative. The Group assesses whether embedded derivatives are required to be separated from host contracts when the Group first becomes party to the contract.
An embedded derivative is separated from the host financial or non-financial contract and accounted for as a derivative if all of the following conditions are met: • the economic characteristics and risks of the embedded derivative are not closely related to the
economic characteristics of the host contract;

- 11 -
*SGVMC409510*
• a separate instrument with the same terms as the embedded derivative would meet the definition of a derivative; and,
• the hybrid or combined instrument is not recognized as at FVPL. Reassessment only occurs if there is a change in the terms of the contract that significantly modifies the cash flows that would otherwise be required. Embedded derivatives that are bifurcated from the host contracts are accounted for either as financial assets or financial liabilities at FVPL. As of December 31, 2010 and 2009, the Group has freestanding derivatives in the form of non-deliverable foreign currency forward contracts entered into to hedge its foreign currency risks (see Note 33). In 2010 and 2009, the Group did not apply hedge accounting treatment on its derivatives transactions. The Group has no bifurcated embedded derivatives as of December 31, 2010 and 2009. Financial Guarantee Contracts Financial guarantee contracts issued by the parent company to its subsidiaries are those contracts that require a payment to be made to reimburse the holder for a loss it incurs because the specified subsidiaries fail to make a payment when due in accordance with the terms of a debt instrument. Financial guarantee contracts are recognized initially as a liability at fair value, adjusted for transaction costs that are directly attributable to the issuance of the guarantee. Subsequently, the liability is measured at the higher of the best estimate of the expenditure required to settle the present obligation at the balance sheet date and the amount recognized less cumulative amortization. Offsetting Financial Instruments Financial assets and financial liabilities are offset and the net amount is reported in the consolidated balance sheet if, and only if, there is a currently enforceable legal right to offset the recognized amounts and there is an intention to settle on a net basis, or to realize the asset and settle the liability simultaneously. This is generally not the case with master netting agreements, and the related assets and liabilities are presented at gross in the consolidated balance sheet. Classification of Financial Instruments Between Liability and Equity Financial instruments are classified as liabilities or equity in accordance with the substance of the contractual arrangement. Interest, dividends, gains and losses relating to a financial instrument or a component that is a financial liability, are reported as expense or income. Distributions to holders of financial instruments classified as equity are charged directly to equity, net of any related income tax benefits. A financial instrument is classified as liability if it provides for a contractual obligation to: • deliver cash or another financial asset to another entity; or • exchange financial assets or financial liabilities with another entity under conditions that are
potentially unfavorable to the Group; or • satisfy the obligation other than by the exchange of a fixed amount of cash or another financial
asset for a fixed number of its own equity shares. If the Group does not have an unconditional right to avoid delivering cash or another financial asset to settle its contractual obligation, the obligation meets the definition of a financial liability.

- 12 -
*SGVMC409510*
The components of issued financial instruments that contain both liability and equity elements are accounted for separately, with the equity component being assigned the residual amount after deducting from the instrument as a whole the amount separately determined as the fair value of the liability component on the date of issue. Redeemable Preferred Shares (RPS) The component of the RPS that exhibits characteristics of a liability is recognized as a liability in the consolidated balance sheet, net of transaction costs. The corresponding dividends on those shares are charged as interest expense in the consolidated statement of income. On issuance of the RPS, the fair value of the liability component is determined using a market rate for an equivalent non-convertible bond; and this amount is carried as a long term liability on the amortized cost basis until extinguished on redemption. Inventories Inventories are valued at the lower of cost and net realizable value (NRV). Costs incurred in bringing each product to its present location and condition are accounted for as follows:
Wheat grains and other raw materials - purchase cost on a first-in, first-out basis;
Finished goods and work in process
- cost of direct materials, labor and a portion of manufacturing overhead based on normal operating capacity but excluding borrowing costs;
Fuel and lubricants - purchase cost on a first-in, first-out basis;
Materials, parts and supplies - purchase cost on a weighted average
method
NRV of wheat grains and other raw materials, work in process and finished goods is the estimated selling price in the ordinary course of business, less estimated costs of completion and the estimated costs necessary to make the sale. NRV of fuel and lubricants and parts and supplies is the current replacement costs. Agricultural Activity Agricultural produce Agricultural produce (swine) are measured at fair value less estimated point-of-sale costs at point of harvest. Biological assets Biological assets are measured on initial recognition and at each balance sheet date at fair value less estimated point-of-sale costs except when, on initial recognition, market-determined prices or values are not available and for which alternative estimates of fair value are determined to be clearly unreliable. In such cases, those biological assets are measured at accumulated costs less any accumulated depreciation and any accumulated impairment losses. Once the fair value of such biological assets becomes reliably measurable, those biological assets are measured at fair value less estimated point-of-sale costs. Gains or losses arising on initial recognition of a biological asset (for market hogs and piglets) at fair value less estimated point-of-sale costs and from changes in their fair values less estimated point-of-sale costs are included in the consolidated statement of income for the period in which they arise.

- 13 -
*SGVMC409510*
Biological assets measured at fair value less estimated point-of-sale costs continue to be measured as such until disposed. Expenditures on biological assets subsequent to initial recognition, excluding the costs of day-to-day servicing, are capitalized.
Bearer (i.e., breeders) biological assets are stated at cost less accumulated depreciation and any impairment losses. Bearer biological assets are depreciated over three (3) years. Investments in Associates The Group’s investments in associates are accounted for under the equity method of accounting. An associate is an entity in which the Group has significant influence and which is neither a subsidiary nor a joint venture. Under the equity method, the investment in the associate is carried in the consolidated balance sheet at cost plus post-acquisition changes in the Group’s share of net assets of the associate. Goodwill relating to an associate is included in the carrying amount of the investment and is not amortized or separately tested for impairment. After application of the equity method, the Group determines whether it is necessary to recognize any additional impairment loss with respect to the Group’s net investment in the associates. The consolidated statement of income reflects the share of the results of operations of the associates. Where there has been a change recognized directly in the equity of the associate, the Group recognizes its share of any changes and discloses this, when applicable, in the consolidated statement of changes in equity. The reporting dates of the associates and the Group are identical and the associates’ accounting policies conform to those used by the Group for like transactions and events in similar circumstances. Business Combination and Goodwill Business combinations from January 1, 2010 Business combinations are accounted for using the acquisition method. The cost of an acquisition is measured as the aggregate of the consideration transferred, measured at acquisition date fair value and the amount of any non-controlling interest in the acquiree. For each business combination, the acquirer measures the noncontrolling interest in the acquiree either at fair value or at the proportionate share of the acquiree’s identifiable net assets. Acquisition costs incurred are expensed and included in administrative expenses. When the Group acquires a business, it assesses the financial assets and liabilities assumed for appropriate classification and designation in accordance with the contractual terms, economic circumstances and pertinent conditions as at the acquisition date. This includes the separation of embedded derivatives in host contracts by the acquiree. If the business combination is achieved in stages, the acquisition date fair value of the acquirer’s previously held equity interest in the acquiree is remeasured to fair value at the acquisition date through profit or loss. Any contingent consideration to be transferred by the acquirer will be recognized at fair value at the acquisition date. Subsequent changes to the fair value of the contingent consideration which is deemed to be an asset or liability, will be recognized in accordance with PAS 39 either in profit or loss or as a change to other comprehensive income. If the contingent consideration is classified as equity, it should not be remeasured until it is finally settled within equity.

- 14 -
*SGVMC409510*
Goodwill is initially measured at cost being the excess of the aggregate of the consideration transferred and the amount recognized for non-controlling interest over the Group’s interest in the fair values of the net identifiable assets acquired and liabilities assumed. If this consideration is lower than the fair value of the net assets of the subsidiary acquired, the difference is recognized in profit or loss. After initial recognition, goodwill is measured at cost less any accumulated impairment losses. For the purpose of impairment testing, goodwill acquired in a business combination is, from the acquisition date, allocated to each of the Group’s cash-generating units that are expected to benefit from the combination, irrespective of whether other assets or liabilities of the acquiree are assigned to those units. Where goodwill forms part of a cash-generating unit and part of the operation within that unit is disposed of, the goodwill associated with the operation disposed of is included in the carrying amount of the operation when determining the gain or loss on disposal of the operation. Goodwill disposed of in this circumstance is measured based on the relative values of the operation disposed of and the portion of the cash-generating unit retained. Business combinations prior to January 1, 2010 In comparison to the above-mentioned requirements, the following differences applied: Business combinations were accounted for using the purchase method. Transaction costs directly attributable to the acquisition formed part of the acquisition costs. The non-controlling interest (formerly known as minority interest) was measured at the proportionate share of the acquiree’s identifiable net assets. Business combinations achieved in stages were accounted for as separate steps. Any additional acquired share of interest did not affect previously recognized goodwill. When the Group acquired a business, embedded derivatives separated from the host contract by the acquire were not reassessed on acquisition unless the business combination resulted in a change in the terms of the contract that significantly modified the cash flows that otherwise would have been required under the contract. Contingent consideration was recognized if, and only if, the Group had a present obligation, the economic outflow was more likely than not and a reliable estimate was determinable. Subsequent adjustments to the contingent consideration were recognized as part of goodwill.
Impairment of goodwill Following initial recognition, goodwill is measured at cost less any accumulated impairment losses. Goodwill is reviewed for impairment, annually or more frequently, if events or changes in circumstances indicate that the carrying value may be impaired. For the purpose of impairment testing, goodwill acquired in a business combination is, from the acquisition date, allocated to each of the Group’s cash-generating units, or groups of cash-generating units, that are expected to benefit from the synergies of the combination, irrespective of whether other assets or liabilities of the Group are assigned to those units or groups of units.

- 15 -
*SGVMC409510*
Impairment is determined by assessing the recoverable amount of the cash-generating unit (group of cash-generating units), to which the goodwill relates. Where the recoverable amount of the cash-generating unit (group of cash-generating units) is less than the carrying amount, an impairment loss is recognized. Property, Plant and Equipment Except for land, property, plant and equipment are stated at cost, excluding the costs of day-to-day servicing, less accumulated depreciation and accumulated impairment in value. Cost includes the cost of replacing part of such property, plant and equipment when that cost is incurred and the recognition criteria are met. Repairs and maintenance costs are recognized in the consolidated statement of income as incurred. Land is stated at cost less any accumulated impairment in value. Construction in progress represents structures under construction and is stated at cost. This includes cost of construction and other direct costs. Ships under refurbishment include the acquisition cost of the ships, the cost of ongoing refurbishments and other direct costs. Ships under refurbishment and construction in progress are not depreciated until such time that the relevant assets are complete and available for use. Borrowing costs that are directly attributable to the refurbishment of ships and construction of property and equipment are capitalized during the refurbishment and construction period.
Except for flight equipment of certain subsidiaries, depreciation of the Group’s property, plant and equipment and assets under finance leases is calculated on a straight-line basis over the useful lives of the assets or the terms of the co-operation period (see Note 35) or lease in case of power plant equipment of CPPC and leasehold improvements, respectively, whichever is shorter as follows:
Number of Years Category 2010 2009 Buildings, warehouses and improvements 10 - 30 10 - 30 Power plant and equipment 9 - 40 9 - 40 Transmission and distribution equipment
Poles and wires 30 30 Other components 12 12
Distribution transformers and substation equipment Power transformers 30 30 Other components 12 12
Machinery and equipment 10 - 20 10 - 20 Transportation equipment 3 - 6 3 - 6 Ships in operation and improvements
(excluding drydocking costs) 15 - 30 15 - 30 Drydocking costs 2 ½ - 7 2 ½ - 7 Containers (including units acquired
under finance lease arrangements) 5 - 7 5 - 7 Handling equipment 5 - 7 5 - 7 Office furniture, fixtures and equipment 3 - 10 3 - 10 Leasehold improvements 3 - 10 3 - 10 Others 3 - 10 3 - 10
Drydocking costs, consisting mainly of replacement of steel plate of the ships’ hull and related expenditures, are capitalized as a component of “Ships in operation.” Steel components are depreciated over 7 years or the remaining life of the vessel whichever is shorter. Other components are depreciated over 2 ½ years. When drydocking costs occur prior to the end of this period, the remaining unamortized balance of the previous drydocking cost is derecognized in the consolidated statement of income.

- 16 -
*SGVMC409510*
The depreciable cost of ships in operation excludes residual value based on the estimated scrap value of the ship’s hull. The carrying values of property, plant and equipment are reviewed for impairment when events or changes in circumstances indicate that the carrying values may not be recoverable. The asset’s residual values, useful lives and depreciation methods are reviewed and adjusted, if appropriate, at each financial year-end. Fully depreciated assets are retained in the accounts until these are no longer in use. When assets are retired or otherwise disposed of, both the cost and related accumulated depreciation and amortization and any allowance for impairment losses are removed from the accounts and any resulting gain or loss is credited or charged to current operations. An item of property, plant and equipment is derecognized upon disposal or when no future economic benefits are expected from its use or disposal. Any gain or loss arising on derecognition of the asset (calculated as the difference between the net disposal proceeds and the carrying amount of the asset) is included in the consolidated statement of income in the year the asset is derecognized. When each major inspection is performed, its cost is recognized in the carrying amount of the property, plant and equipment as a replacement if the recognition criteria satisfied. Service Concession Arrangements Public-to-private service concession arrangements where: (a) the grantor controls or regulates what services the entities in the Group must provide with the infrastructure, to whom it must provide them, and at what price; and (b) the grantor controls - through ownership, beneficial entitlement or otherwise - any significant residual interest in the infrastructure at the end of the term of the arrangement, are accounted for under the provisions of Philippine Interpretation IFRIC 12, Service Concession Arrangements. Infrastructures used in a public-to-private service concession arrangement for its entire useful life (whole-of-life assets) are within the scope of this Interpretation if the conditions in (a) are met. This Interpretation applies to both: (a) infrastructure that the entities in the Group constructs or acquires from a third party for the purpose of the service arrangement; and (b) existing infrastructure to which the grantor gives the entity in the Group access for the purpose of the service arrangement. Infrastructures within the scope of this Interpretation are not recognized as property, plant and equipment of the Group. Under the terms of contractual arrangements within the scope of this Interpretation, an entity acts as a service provider. An entity constructs or upgrades infrastructure (construction or upgrade services) used to provide a public service and operates and maintains that infrastructure (operation services) for a specified period of time. An entity recognizes and measures revenue in accordance with PAS 11, Construction Contracts, and PAS 18, Revenues, for the services it performs. If an entity performs more than one service (i.e. construction or upgrade services and operation services) under a single contract or arrangement, consideration received or receivable shall be allocated by reference to the relative fair values of the services delivered, when the amounts are separately identifiable. When an entity provides construction or upgrade services, the consideration received or receivable by the entity is recognized at its fair value. An entity accounts for revenue and costs relating to construction or upgrade services in accordance with PAS 11. Revenue from construction contracts is recognized based on the percentage-of-completion method, measured by reference to the percentage of costs incurred to date to estimated total costs for each contract. The applicable entities account for revenue and costs relating to operation services in accordance with PAS 18.

- 17 -
*SGVMC409510*
An entity recognizes a financial asset to the extent that it has an unconditional contractual right to receive cash or another financial asset from or at the direction of the grantor for the construction services. An entity recognizes an intangible asset to the extent that it receives a right (a license) to charge users of the public service. When the applicable entities have contractual obligations it must fulfil as a condition of its license (a) to maintain the infrastructure to a specified level of serviceability or (b) to restore the infrastructure to a specified condition before it is handed over to the grantor at the end of the service arrangement, it recognizes and measures these contractual obligations in accordance with PAS 37, Provisions, Contingent Liabilities and Contingent Assets, i.e., at the best estimate of the expenditure that would be required to settle the present obligation at the balance sheet date.
Borrowing cost attributable to the construction of the asset if the consideration received or receivable is an intangible asset, is capitalized during the construction phase. In all other cases, borrowing costs are expensed as incurred. Intangible Asset - Service Concession Right The Group’s intangible asset - service concession right pertains mainly to its right to charge users of the public service in connection with the service concession and related arrangements. This is recognized initially at the fair value of the construction services. Following initial recognition, the intangible asset is carried at cost less accumulated amortization and any accumulated impairment losses. The intangible asset - service concession right is amortized using the straight-line method over the estimated useful economic life which is the service concession period, and assessed for impairment whenever there is an indication that the intangible asset may be impaired. The estimated useful life is 25 years. The amortization period and the amortization method are reviewed at least at each financial year-end. Changes in the expected useful life or the expected pattern of consumption of future economic benefits embodied in the asset is accounted for by changing the amortization period or method, as appropriate, and are treated as changes in accounting estimates. The amortization expense is recognized in the consolidated statement of income in the expense category consistent with the function of the intangible asset. Gains or losses arising from derecognition of an intangible asset - service concession right are measured as the difference between the net disposal proceeds and the carrying amount of the asset and are recognized in the consolidated statement of income when the asset is derecognized. Investment Properties Investment properties, which pertain to land and buildings, are measured initially at cost, including transaction costs. The carrying amount includes the cost of replacing part of an existing investment property at the time that cost is incurred if the recognition criteria are met; and excludes the costs of day-to-day servicing of an investment property. Subsequent to initial recognition, investment properties are carried at fair value, which reflects market conditions at the balance sheet date. Gains or losses arising from changes in fair values of investment properties are included in the consolidated statement of income in the year in which they arise. Investment properties are derecognized when either they have been disposed of or when the investment property is permanently withdrawn from use and no future economic benefit is expected from its disposal. Any gains or losses on the retirement or disposal of an investment property are recognized in the consolidated statement of income in the year of retirement or disposal.

- 18 -
*SGVMC409510*
Transfers are made to investment property when, and only when, there is a change in use, evidenced by ending of owner-occupation, commencement of an operating lease to another party or ending of construction or development with a view to sale. For a transfer from investment property to owner-occupied property or inventories, the deemed cost of property for subsequent accounting is its fair value at the date of change in use. If the property occupied by the Group as an owner-occupied property becomes an investment property, the Group accounts for such property in accordance with the policy stated under property, plant and equipment up to the date of change in use. For a transfer from inventories to investment property, any difference between the fair value of the property at that date and its previous carrying amount is recognized in the consolidated statement of income. When the Group completes the construction or development of a self-constructed investment property, any difference between the fair value of the property at that date and its previous carrying amount is recognized in the consolidated statement of income. Noncurrent Assets Classified as Held for Sale and Discontinued Operations Non-current assets and disposal groups classified as held for sale are measured at the lower of their carrying mount and fair value less costs to sell. Non-current assets and disposal groups are classified as held for sale if their carrying amounts will be recovered principally through a sale transaction rather than through continuing use. This condition is regarded as met only when the sale is highly probable and the asset or disposal group is available for immediate sale in its present condition. Management must be committed to the sale, which should be expected to qualify for recognition as a completed sale within one year from the date of classification. In the consolidated statement of income of the reporting period, and of the comparable period of the previous year, income and expenses from discontinued operations are reported separately from income and expenses from continuing operations, down to the level of net income after taxes, even when the Group retains a non-controlling interest in the subsidiary after the sale. The resulting net income is reported separately in the consolidated statement of income. If there are changes to a plan of sale, and the criteria for the asset or disposal group to be classified as held for sale are no longer met, the Group ceases to classify the asset or disposal group as held for sale and it shall be measured at the lower of: • its carrying amount before the asset was classified as held for sale adjusted for any
depreciation, amortization or revaluations that would have been recognized had the asset not been classified as held for sale, and
• its recoverable amount at the date of the subsequent decision not to sell. The Group includes any required adjustment to the carrying amount of a noncurrent asset or disposal group that ceases to be classified as held for sale in the consolidated statement of income from continuing operations in the period in which the criteria for the asset or disposal group to be classified as held for sale are no longer met. The Group presents that adjustment in the same caption in the consolidated statement of income used to present a gain or loss recognized, if any. If the Group ceases to classify a component of an entity as held for sale, the results of operations of the component previously presented in discontinued operations shall be reclassified and included in income from continuing operations for all periods presented. The amounts for prior periods shall be described as having been re-presented. Software Development Costs Software development costs are initially recognized at cost. Following initial recognition, the software development costs are carried at cost less accumulated amortization and any accumulated impairment in value.

- 19 -
*SGVMC409510*
The software development costs are amortized on a straight-line basis over its estimated useful economic life and assessed for impairment whenever there is an indication that the intangible asset may be impaired. The amortization commences when the software development costs are available for use. The amortization period and the amortization method for the software development costs are reviewed at each financial year-end. Changes in the estimated useful life is accounted for by changing the amortization period or method, as appropriate, and treating them as changes in accounting estimates. The amortization expense is recognized in the consolidated statement of income in the expense category consistent with the function of the software development costs. Impairment of Nonfinancial Assets Property, plant and equipment, intangible assets and investments in associates are reviewed for impairment whenever events or changes in circumstances indicate that the carrying amount of an asset may not be recoverable or may be impaired. If any such indication exists, or when annual impairment testing for an asset is required, the Group makes an estimate of the asset’s recoverable amount. An asset’s recoverable amount is the higher of an asset’s or cash-generating unit’s fair value less costs to sell and its value in use and is determined for an individual asset, unless the asset does not generate cash inflows that are largely independent of those from other assets or groups of assets. Where the carrying amount of an asset exceeds its recoverable amount, the asset is considered impaired and is written down to its recoverable amount. In assessing value in use, the estimated future cash flows are discounted to their present value using a pre-tax discount rate that reflects current market assessments of the time value of money and the risks specific to the asset. Impairment losses of continuing operations are recognized in the consolidated statement of income in those expense categories consistent with the function of the impaired asset. An assessment is made at each reporting date as to whether there is any indication that previously recognized impairment losses may no longer exist or may have decreased. If such indication exists, the recoverable amount is estimated. A previously recognized impairment loss is reversed only if there has been a change in the estimates used to determine the asset’s recoverable amount since the last impairment loss was recognized. If that is the case, the carrying amount of the asset is increased to its recoverable amount. That increased amount cannot exceed the carrying amount that would have been determined, net of accumulated depreciation, had no impairment loss been recognized for the asset in prior years. Such reversal is recognized in the consolidated statement of income unless the asset is carried at revalued amount, in which case the reversal is treated as a revaluation increase. After such a reversal, the depreciation charge is adjusted in future periods to allocate the asset’s revised carrying amount, less any residual value, on a systematic basis over its remaining useful life. Treasury Shares The Group’s own equity instruments which are reacquired (treasury shares) are deducted from equity. No gain or loss is recognized in the consolidated statement of income on the purchase, sale, issue or cancellation of the Group’s own equity instruments. Foreign Currency Transactions The consolidated financial statements are presented in Philippine peso, which is the Group’s functional and presentation currency. Each entity in the Group determines its own functional currency and items included in the financial statements of each entity are measured using that functional currency. Transactions in foreign currencies are initially recorded in the functional currency at the rate ruling at the date of the transaction. Monetary assets and liabilities denominated in foreign currencies are retranslated at the functional currency rate of exchange ruling at the balance sheet date. All differences are taken to the consolidated statement of income.

- 20 -
*SGVMC409510*
Non-monetary items that are measured in terms of historical cost in a foreign currency are translated using the exchange rates as at the dates of the initial transactions. Non-monetary items measured at fair value in a foreign currency are translated using the exchange rates at the date when the fair value was determined. The functional currency of JMBVI and Subsidiaries, a subsidiary up to December 28, 2010, and Luzon Hydro Corporation (LHC), STEAG State Power, Inc. (STEAG), Western Mindanao Power Corporation (WMPC) and Southern Philippines Power Corporation (SPPC), associates, is the United States Dollar. As at the reporting date, the assets and liabilities of these entities are translated into the presentation currency of the Group (the Philippine peso) at the rate of exchange ruling at the balance sheet date and their statements of income are translated at the weighted average exchange rates for the year. The exchange differences arising on the translation are taken directly to other comprehensive income. On disposal of the subsidiary and associate, the deferred cumulative amount recognized in other comprehensive income relating to that particular entity is recognized in the consolidated statement of income. Revenue Recognition Revenue is recognized to the extent that it is probable that the economic benefits will flow to the Group and the revenue can be reliably measured. Revenue is measured at the fair value of the consideration received, excluding discounts, rebates, and sales taxes or duty. The Group assesses its revenue arrangements against specific criteria in order to determine if it is acting as principal or agent. The Group assesses whether it is acting as a principal in all of its revenue arrangements. The following specific recognition criteria must also be met before revenue is recognized: Sales Revenue from sale of power and electricity is recognized in the period in which actual capacity is generated and earned and upon distribution of power to customers. Revenue from sale of goods is recognized when the significant risks and rewards of ownership of the goods have passed to the buyer. Rendering of services Freight, passage and service revenues are recognized when the related services are rendered. Customer payments for which services have not yet been rendered are classified as unearned revenue under “Trade and other payables” in the consolidated balance sheet. Bank revenues - service fees and bank charges Service fees, penalties and bank charges are recognized only upon collection or accrued where there is reasonable degree of certainty as to its collectibility. Service fees earned for the provision of services over a period of time are accrued over that period. These fees include portfolio fees, credit related fees and other management fees. Bank revenues - interest income For all financial instruments measured at amortized cost, interest income is recorded at the EIR, which is the rate that exactly discounts estimated future cash payments or receipts through the expected life of the financial instrument or a shorter period, where appropriate, to the net carrying amount of the financial asset or financial liability. The calculation takes into account all contractual terms of the financial instrument including any fees or incremental costs that are directly attributable to the instrument and are an integral part of the EIR, but not future credit losses. The carrying amount of the financial asset or financial liability is adjusted if the Bank revises its estimates of payments or receipts. The adjusted carrying amount is calculated based on the original EIR. The change in carrying amount is recorded as interest income.
- 21 -
*SGVMC409510*
Once the recorded value of a financial asset or bank of similar financial assets has been reduced due to an impairment loss, interest income continues to be recognized based on the original EIR used to discount the future recoverable cash flows. Rental income Rental income arising from operating leases is accounted for on a straight-line basis over the related lease terms. Dividend income Dividend income is recognized when the Group’s right to receive payment is established. Interest income Interest income is recognized as it accrues taking into account the effective yield on the asset.
Expenses Expenses are decreases in economic benefits during the accounting period in the form of outflows or decrease of assets or incurrence of liabilities that result in decreases in equity, other than those relating to distributions to equity participants. Pension Benefits The Group has defined benefit pension plans, which require contributions to be made to separately administered funds. The cost of providing benefits under the defined benefit plans is determined separately for each plan using the projected unit credit actuarial valuation method. Actuarial gains and losses are recognized as income or expense when the net cumulative unrecognized actuarial gains and losses for each individual plan at the end of the previous reporting year exceeded 10% of the higher of the defined benefit obligation and the fair value of plan assets at that date. These gains or losses are recognized over the expected average remaining working lives of the employees participating in the plans. The past service cost is recognized as an expense on a straight-line basis over the average period until the benefits become vested. If the benefits are already vested immediately following the introduction of, or changes to, a pension plan, past service cost is recognized immediately. The defined benefit liability is the aggregate of the present value of the defined benefit obligation and actuarial gains and losses not recognized reduced by past service cost not yet recognized and the fair value of plan assets out of which the obligations are to be settled directly. If such aggregate is negative, the asset is measured at the lower of such aggregate or the aggregate of cumulative unrecognized net actuarial losses and past service cost and the present value of any economic benefits available in the form of refunds from the plan or reductions in the future contributions to the plan.
If the asset is measured at the aggregate of cumulative unrecognized net actuarial losses and past service cost and the present value of any economic benefits available in the form of refunds from the plan or reductions in the future contributions to the plan, net actuarial losses of the current period and past service cost of the current period are recognized immediately to the extent that they exceed any reduction in the present value of those economic benefits. If there is no change or increase in the present value of the economic benefits, the entire net actuarial losses of the current period and past service cost of the current period are recognized immediately. Similarly, net actuarial gains of the current period after the deduction of past service cost of the current period exceeding any increase in the present value of the economic benefits stated above are recognized immediately if the asset is measured at the aggregate of cumulative unrecognized net actuarial losses and past service cost and the present value of any economic benefits available in the form of

- 22 -
*SGVMC409510*
refunds from the plan or reductions in the future contributions to the plan. If there is no change or decrease in the present value of the economic benefits, the entire net actuarial gains of the current period after the deduction of past service cost of the current period are recognized immediately. Borrowing Costs Borrowing costs directly attributable to the acquisition, construction or production of an asset that necessarily takes a substantial period of time to get ready for its intended use or sale are capitalized as part of the cost of the respective assets. All other borrowing costs are expensed in the period they occur. Borrowing costs consist of interest and other costs that an entity incurs in connection with the borrowing of funds. Leases The determination of whether an arrangement is, or contains a lease, is based on the substance of the arrangement and requires an assessment of whether the fulfillment of the arrangement is dependent on the use of a specific asset or assets and the arrangement conveys a right to use the asset. Group as a lessee Finance leases, which transfer to the Group substantially all the risks and benefits incidental to ownership of the leased item, are capitalized at the inception of the lease at the fair value of the leased property or, if lower, at the present value of the minimum lease payments. Lease payments are apportioned between the finance charges and reduction of the lease liability so as to achieve a constant rate of interest on the remaining balance of the liability. Finance charges are charged directly against income.
Capitalized leased assets are depreciated over the shorter of the estimated useful life of the asset and the lease term, if there is no reasonable certainty that the Group will obtain ownership by the end of the lease term. Leases where the lessor retains substantially all the risks and benefits of ownership of the asset are classified as operating lease. Operating lease payments are recognized as an expense in the consolidated statement of income on a straight-line basis over the lease term. Group as a lessor Leases where the Group retains substantially all the risks and benefits of ownership of the asset are classified as operating leases. Initial direct costs incurred in negotiating an operating lease are added to the carrying amount of the leased asset and recognized over the lease term on the same basis as rental income. Taxes Current income tax Current income tax assets and liabilities for the current and prior periods are measured at the amount expected to be recovered from or paid to the taxation authorities. The tax rates and tax laws used to compute the amount are those that are enacted or substantively enacted at the balance sheet date. Current income tax relating to items recognized directly in equity is recognized in the consolidated statement of comprehensive income and not in the consolidated statement of income. Management periodically evaluates positions taken in the tax returns with respect to situations in which applicable tax regulations are subject to interpretation and establishes provisions where appropriate.

- 23 -
*SGVMC409510*
Deferred income tax Deferred income tax is provided using the balance sheet liability method on temporary differences at the balance sheet date between the tax bases of assets and liabilities and their carrying amounts for financial reporting purposes. Deferred income tax liabilities are recognized for all taxable temporary differences, except: • where the deferred income tax liability arises from the initial recognition of goodwill or of an
asset or liability in a transaction that is not a business combination and, at the time of the transaction, affects neither the accounting profit nor taxable profit or loss; and
• in respect of taxable temporary differences associated with investments in subsidiaries, associates and interests in joint ventures, where the timing of the reversal of the temporary differences can be controlled and it is probable that the temporary differences will not reverse in the foreseeable future.
Deferred income tax assets are recognized for all deductible temporary differences and carryforward benefits of net operating loss carryover (NOLCO) and excess of minimum corporate income tax (MCIT) over regular corporate income tax (RCIT), to the extent that it is probable that future taxable profit will be available against which the deductible temporary differences and the carryforward benefits of NOLCO and excess of MCIT over RCIT can be utilized except: • where the deferred income tax asset relating to the deductible temporary difference arises from
the initial recognition of an asset or liability in a transaction that is not a business combination and, at the time of the transaction, affects neither the accounting profit nor taxable profit or loss; and
• in respect of deductible temporary differences associated with investments in subsidiaries, associates and interests in joint ventures, deferred income tax assets are recognized only to the extent that it is probable that the temporary differences will reverse in the foreseeable future and taxable profit will be available against which the temporary differences can be utilized.
The carrying amount of deferred income tax assets is reviewed at each balance sheet date and reduced to the extent that it is no longer probable that sufficient taxable profit will be available to allow all or part of the deferred income tax asset to be utilized. Unrecognized deferred income tax assets are reassessed at each balance sheet date and are recognized to the extent that it has become probable that future taxable profit will allow the deferred tax asset to be recovered. Deferred income tax assets and liabilities are measured at the tax rates that are expected to apply to the year when the asset is realized or the liability is settled, based on tax rates (and tax laws) that have been enacted or substantively enacted at the balance sheet date. Deferred tax relating to items recognized outside profit or loss is recognized outside profit or loss. Deferred tax items are recognized in correlation to the underlying transaction either in other comprehensive income or directly in equity. Deferred income tax assets and deferred income tax liabilities are offset, if a legally enforceable right exists to set off current income tax assets against current income tax liabilities and the deferred income taxes relate to the same taxable entity and the same taxation authority.

- 24 -
*SGVMC409510*
Sales tax Revenues, expenses and assets are recognized net of the amount of sales tax except: • where the sales tax incurred on a purchase of assets or services is not recoverable from the
taxation authority, in which case the sales tax is recognized as part of the cost of acquisition of the asset or as part of the expense item as applicable; and
• receivables and payables that are stated with the amount of sales tax included. The net amount of sales tax recoverable from, or payable to, the taxation authority is included as part of receivables or payables in the consolidated balance sheet. Provisions Provisions are recognized when the Group has a present obligation (legal or constructive) as a result of a past event, it is probable that an outflow of resources embodying economic benefits will be required to settle the obligation and a reliable estimate can be made of the amount of the obligation. Where the Group expects some or all of a provision to be reimbursed, for example under an insurance contract, the reimbursement is recognized as a separate asset but only when the reimbursement is virtually certain. The expense relating to any provision is presented in the consolidated statement of income, net of any reimbursement. If the effect of the time value of money is material, provisions are discounted using a current pre-tax rate that reflects, where appropriate, the risks specific to the liability. Where discounting is used, the increase in the provision due to the passage of time is recognized as a borrowing cost. Contingencies Contingent liabilities are not recognized in the consolidated financial statements. These are disclosed unless the probability of an outflow of resources embodying economic benefits is remote. Contingent assets are not recognized in the consolidated financial statements but are disclosed when an inflow of economic benefits is probable. Events After the Reporting Period Post year-end events that provide additional information about the Group’s position at balance sheet date (adjusting events) are reflected in the consolidated financial statements. Post year-end events that are not adjusting events are disclosed when material. Earnings Per Common Share Basic earnings per common share are computed by dividing net income for the year attributable to the common shareholders of the parent by the weighted average number of common shares issued and outstanding during the year, after retroactive adjustments for any stock dividends declared. Diluted earnings per share amounts are calculated by dividing the net income for the year attributable to the common shareholders of the parent by the weighted average number of common shares outstanding during the year plus the weighted average number of common shares that would be issued for outstanding common stock equivalents. The Group does not have dilutive common stock equivalents. Operating Segments For management purposes, the Group is organized into five major operating segments (power, food manufacturing, transportation, financial services and parent company/others) according to the nature of the products and the services provided. The Group’s identified operating segments are consistent with the segments reported to the BOD which is the Group’s Chief Operating Decision Maker (CODM). Financial information on operating segments is presented in Note 30.

- 25 -
*SGVMC409510*
3. Summary of Significant Accounting Judgments and Estimates The preparation of the Group’s consolidated financial statements requires management to make judgments, estimates and assumptions that affect the reported amounts of revenues, expenses, assets and liabilities and the disclosure of contingent liabilities. However, uncertainty about these assumptions and estimates could result in outcomes that require a material adjustment to the carrying amount of the asset or liability affected in the future periods. Judgments In the process of applying the Group’s accounting policies, management has made the following judgments, apart from those involving estimations, which have the most significant effect on the amounts recognized in the consolidated financial statements: Determining functional currency Based on the economic substance of the underlying circumstances relevant to the companies in the Group, the functional currency of the companies in the Group has been determined to be the Philippine peso, except for certain subsidiaries and associates whose functional currency is the US dollar. The Philippine peso is the currency of the primary economic environment in which the companies in the Group operate and it is the currency that mainly influences the sale of power, goods and services and the costs of power, manufacturing and selling the goods and the rendering of services. Service concession arrangements - Companies in the Group as Operators Based on management’s judgment, the provisions of IFRIC 12 apply to the SEZC’s Distribution Management Service Agreement (DMSA) with Subic Bay Metropolitan Authority (SBMA) and MEZ’s Built-Operate-Transfer agreement with Mactan Cebu International Airport Authority. SEZC and MEZ’s service concession agreements were accounted for under the intangible asset model. The Company’s associates, LHC and STEAG, have also determined that the provisions of Philippine Interpretation IFRIC 12 apply to their power purchase agreements with National Power Corporation (NPC). LHC and STEAG’s service concession agreements were accounted for under the intangible and financial asset model, respectively. Refer to the accounting policy on service concession arrangements for the discussion of intangible asset and financial asset models. Finance lease - Group as the lessee In accounting for its Independent Power Producer Administration Agreement (IPP Administration Agreement) with the Power Sector Assets and Liabilities Management Corporation (PSALM), the Group has made a judgment that the IPP Administration Agreement is an arrangement that contains a lease. The Group has made a judgment that it has substantially acquired all the risks and rewards incidental to ownership of the power plant principally by virtue of its right to control the capacity of the power plant and its right to receive the transfer of the power plant at the end of the IPP Administration Agreement for no consideration. Accordingly, the Group accounted for the agreement as a finance lease and recognized the power plant and finance lease obligation at the present value of the agreed monthly payments to PSALM (see Notes 20 and 32). The power plant is depreciated over its estimated useful life as there is reasonable certainty that the Group will obtain ownership by the end of the lease term. As of December 31, 2010 and 2009, the carrying value of the power plant amounted to P=43.4 billion and P=44.5 billion, respectively. The carrying value of finance lease obligation amounted to P=48.3 billion and P=45.6 billion as of December 31, 2010 and 2009, respectively (see Notes 12 and 20).

- 26 -
*SGVMC409510*
Operating lease commitments - Group as lessor The Group has entered into commercial property leases on its investment property portfolio. The Group has determined, based on an evaluation of the terms and conditions of the arrangements, that it retains all the significant risks and rewards of ownership of these properties and accounts for the contracts as operating leases. Biological assets In applying PAS 41, Agriculture, the Group has made a judgment that market-determined prices or values of bearers and growing stocks are not available and for which alternative estimates of their fair values are clearly unreliable and, accordingly, measured such biological assets at accumulated cost less accumulated depreciation and any accumulated impairment losses. These biological assets amounted to P=383,864 as of December 31, 2010 and P=320,040 as of December 31, 2009 (see Note 8). Determining fair value of customers’ deposits In applying PAS 39, Financial Instruments: Recognition and Measurement, on transformer and lines and poles deposits, the Group has made a judgment that the timing and related amounts of future cash flows relating to such deposits cannot be reasonably and reliably estimated for purposes of an alternative valuation technique in establishing their fair values since the expected timing of customers’ refund or claim for these deposits cannot be reasonably estimated. These customers’ deposits amounted to P=2,011,285 and P=1,786,681 as of December 31, 2010 and 2009, respectively (see Notes 19 and 33). Determining whether the Power Purchase Agreement (PPA) Contains a Lease. The PPA with Visayan Electric Co. (VECO) qualifies as a lease on the basis that CPPC sells substantially all its output to VECO. The agreement requires that CPPC guarantee the availability of the power plant. This arrangement is determined to be an operating lease where a significant portion of the risks and rewards of ownership of the asset are retained by CPPC. Accordingly, the power plant assets are recorded as part of the cost of property, plant and equipment and the fixed capacity fees and fixed operating and maintenance fees billed to VECO are recorded as operating revenues based on a straight-line basis over the term of the PPA.
Accounting for acquisitions of Power Barges (PB) In 2010, the Group took ownership of PB 118 and PB 117. The Group has made a judgment that the transactions represent acquisitions of assets, and accordingly, accounted for the acquisitions in accordance with PAS 16, Property, Plant and Equipment (see Note 12). Estimation Uncertainty The key assumptions concerning the future and other key sources of estimation uncertainty at the balance sheet date, that have a significant risk of causing a material adjustment to the carrying amounts of assets and liabilities within the next financial year are discussed as follows:
Acquisition accounting The Group accounts for acquired businesses using the purchase method of accounting which requires that the assets acquired and the liabilities assumed be recorded at the date of acquisition at their respective fair values. The application of the purchase method requires certain estimates and assumptions especially concerning the determination of the fair values of acquired intangible assets and property, plant and equipment as well as liabilities assumed at the date of the acquisition. Moreover, the useful lives of the acquired intangible assets, property, plant and equipment have to be determined.

- 27 -
*SGVMC409510*
The judgments made in the context of the purchase price allocation can materially impact the Group’s future results of operations. Accordingly, for significant acquisitions, the Group obtains assistance from third party valuation specialists. The valuations are based on information available at the acquisition date (see Note 9).
Estimating allowance for impairment losses on receivables
The Group maintains allowance for impairment on receivables at a level considered adequate to provide for potential uncollectible receivables. The level of this allowance is evaluated by the Group on the basis of factors that affect the collectibility of the accounts. These factors include, but are not limited to, the length of the Group’s relationship with debtors, their payment behavior and known market factors. The Group reviews the age and status of the receivables, and identifies accounts that are to be provided with allowance on a continuous basis. The amount and timing of recorded expenses for any period would differ if the Group made different judgments or utilized different estimates. An increase in the Group’s allowance for impairment losses would increase the Group’s recorded expenses and decrease current assets. The main considerations for impairment assessment include whether any payments are overdue or if there are any known difficulties in the cash flows of the counterparties. The Group assesses impairment into two areas: individually assessed allowances and collectively assessed allowances. The Group determines allowance for each significant receivable on an individual basis. Among the items that the Group considers in assessing impairment is the inability to collect from the counterparty based on the contractual terms of the receivables. Receivables included in the specific assessment are the accounts that have been endorsed to the legal department, non-moving account receivables, accounts of defaulted agents and accounts from closed stations. For collective assessment, allowances are assessed for receivables that are not individually significant and for individually significant receivables where there is no objective evidence yet of individual impairment. Impairment losses are estimated by taking into consideration the age of the receivables, past collection experience and other factors that may affect collectibility. Allowance for impairment losses as of December 31, 2010 and 2009 amounted to P=508,621 and P=397,115, respectively. Trade and other receivables, net of valuation allowance, amounted to P=15,702,445 and P=7,634,835 as of December 31, 2010 and 2009, respectively (see Note 5). Estimating allowance for inventory obsolescence The Group estimates the allowance for inventory obsolescence based on the age of inventories. The amounts and timing of recorded expenses for any period would differ if different judgments or different estimates are made. An increase in allowance for inventory obsolescence would increase recorded expenses and decrease current assets. As of December 31, 2010 and 2009, allowance for inventory obsolescence amounted to P=48,174 and P=54,100, respectively. The carrying amount of the inventories, net of valuation allowance, amounted to P=4,075,091 and P=3,268,720 as of December 31, 2010 and 2009, respectively (see Note 6).
Estimating allowance for impairment losses on investments in and advances to associates Investments in and advances to associates are reviewed for impairment whenever events or changes in circumstances indicate that the carrying amount may not be recoverable. The cash flows are derived from the projection for the next five years as well as the terminal value at the end of five years. The recoverable amount is most sensitive to the discount rate used for the discounted cash flow model as well as the expected cash inflows and the growth rates. The carrying amounts of the investments in and advances to associates amounted to P=44,849,975 and P=38,568,422 as of December 31, 2010 and 2009, respectively. The allowance for impairment losses amounted to P=28,995 as of December 31, 2010 and 2009 (see Note 10).

- 28 -
*SGVMC409510*
Deferred income tax assets The Group reviews the carrying amounts of deferred income tax assets at each balance sheet date and reduces deferred income tax assets to the extent that it is no longer probable that sufficient taxable income will be available to allow all or part of the deferred income tax assets to be utilized. The Group has net deferred income tax assets amounting to P=251,090 and P=514,530 as of December 31, 2010 and 2009, respectively (see Note 28). As of December 31, 2010, no deferred income tax assets were recognized on AP’s NOLCO and MCIT amounting to P=114,822 and P=23,775, respectively, since management expects that AP will not generate sufficient taxable income in the future that will be available to allow all or part of the deferred income tax assets to be utilized. There were no unrecognized deferred income tax assets as of December 31, 2009.
Pension benefits The determination of the Group’s obligation and cost of pension is dependent on the selection of certain assumptions used by actuaries in calculating such amounts. Those assumptions are described in Note 27 - Pension Benefit Plans and include, among others, discount rates, expected rates of return on plan assets and rates of future salary increase. In accordance with PAS 19, Employee Benefits, actual results that differ from the Group’s assumptions are accumulated and amortized over future periods and therefore, generally affect the Group’s recognized expenses and recorded obligation in such future periods. While management believes that its assumptions are reasonable and appropriate, significant differences in the actual experience or significant changes in the assumptions may materially affect the Group’s pension and other post-employment obligations. Pension expense amounted to P=163,444, P=63,964 and P=77,321 in 2010, 2009 and 2008, respectively. The Group’s pension liability amounted to P=32,350 and P=55,631 as of December 31, 2010 and 2009, respectively. Pension asset amounted to P=179,425 and P=105,507 as of December 31, 2010 and 2009, respectively (see Note 27).
Estimating useful lives of property, plant and equipment The Group estimates the useful lives of property, plant and equipment based on the period over which assets are expected to be available for use. The estimated useful lives of property, plant and equipment are reviewed periodically and are updated if expectations differ from previous estimates due to physical wear and tear, technical or commercial obsolescence and legal or other limits on the use of the assets. In addition, the estimation of the useful lives of property, plant and equipment is based on collective assessment of internal technical evaluation and experience with similar assets. It is possible, however, that future results of operations could be materially affected by changes in estimates brought about by changes in the factors and circumstances mentioned above. As of December 31, 2010 and 2009, the net book values of property, plant and equipment amounted to P=77,444,279 and P=80,564,992, respectively (see Note 12).
Estimating useful lives of intangible asset - service concession rights The Group estimates the useful lives of intangible asset arising from service concessions based on the period over which the asset is expected to be available for use which is twenty-five (25) years. The Group has not included any renewal period on the basis of uncertainty, as of balance sheet date, of the probability of securing renewal contract at the end of the original contract term. As of December 31, 2010 and 2009, the net book values of intangible asset - service concession rights amounted to P=936,996 and P=882,308, respectively. Estimating residual value of property, plant and equipment The residual value of the Group’s property, plant and equipment is estimated based on the amount that the entity would obtain from disposal of the asset, after deducting estimated costs of disposal, if the asset is already of the age and in the condition expected at the end of its useful life. The estimated residual value of each asset is reviewed periodically and updated if expectations differ from previous estimates. As of December 31, 2010 and 2009, the net book values of property, plant and equipment amounted to P=77,444,279 and P=80,564,992, respectively (see Note 12).

- 29 -
*SGVMC409510*
Assessing impairment of AFS investments The Group treats AFS equity investments as impaired when there has been a significant or prolonged decline in the fair value below its cost or where other objective evidence of impairment exists. The determination of what is ‘significant’ or ‘prolonged’ requires judgment. The Group treats ‘significant’ generally as 20% or more and ‘prolonged’ as greater than 6 months for quoted equity securities. In addition, the Group evaluates other factors, including normal volatility in share price for quoted equities and the future cash flows and the discount factors for unquoted equities. Fair value of AFS investments amounted to P=70,814 and P=84,935 as of December 31, 2010 and 2009, respectively. No impairment loss was recognized in 2010 and 2009. In 2008, impairment loss recorded amounted to P=5,300. Assessing impairment of goodwill The Group determines whether goodwill is impaired at least on an annual basis. This requires an estimation of the value in use of the cash-generating units to which the goodwill is allocated. Estimating the value in use requires the Group to make an estimate of the expected future cash flows from the cash-generating unit and also to choose a suitable discount rate in order to calculate the present value of those cash flows. The carrying amount of goodwill as of December 31, 2010 and 2009 amounted to P=1,639,518 and P=1,812,783, respectively (see Note 11). Fair value of consumable biological assets The Group determines the most reliable estimate of fair value of its consumable biological assets. Fair value reflects the most recent market transaction price provided that there has been no significant change in economic circumstances between the date of transaction and balance sheet date. Point-of-sale cost is estimated based on recent transactions and is deducted from the fair value in order to measure the biological assets at balance sheet date. Fair value of consumable biological assets amounted to P=330,492 and P=275,522 as of December 31, 2010 and 2009, respectively (see Note 8). Impairment of nonfinancial assets The Group assesses whether there are any indicators of impairment for non-financial assets at each reporting date. These nonfinancial assets (other current assets, property, plant and equipment, intangible asset - service concession rights and other noncurrent assets) are tested for impairment when there are indicators that the carrying amounts may not be recoverable. Determining the recoverable amount of property, plant and equipment and intangible asset - service concession rights, which require the determination of future cash flows expected to be generated from the continued use and ultimate disposition of such assets, requires the Group to make estimates and assumptions that can materially affect its consolidated financial statements. Future events could cause the Group to conclude that the other current assets, property, plant and equipment, intangible asset - service concession rights and other noncurrent assets are impaired. Any resulting impairment loss could have a material adverse impact on the consolidated balance sheet and consolidated statement of income. As of December 31, 2010 and 2009, the aggregate net book values of these assets amounted to P=81,691,556 and P=84,840,968, respectively (see Notes 7, 8, 12, 13 and 15). The Group recognized an impairment loss of P=778,830 in 2010 which pertains to the property, plant and equipment of discontinued operations principally on the basis of estimated fair value less cost to sell. No impairment loss was recognized in 2009 (see Note 12). Fair value of financial instruments PFRS requires that certain financial assets and liabilities be carried at fair value, which requires the use of accounting judgment and estimates. While significant components of fair value measurement are determined using verifiable objective evidence (e.g. foreign exchange rates, interest rates, volatility rates), the timing and amount of changes in fair value would differ with the valuation methodology used. Any change in the fair value of these financial assets and liabilities would directly affect net income or loss and equity. The carrying values and corresponding fair values of financial assets and financial liabilities as well as the manner in which fair values were determined are discussed in more detail in Note 33.

- 30 -
*SGVMC409510*
Fair value of investment properties The fair value of investment properties is determined based on valuations performed by experienced and competent appraisers as of the consolidated balance sheet date. Any gain or loss from a change in the fair value of each investment property is included in the consolidated statement of income in the year in which the change arises. As of December 31, 2010 and 2009, the carrying value of investment properties amounted to P=402,486 and P=306,611. Legal contingencies The estimate of probable costs for the resolution of possible claims has been developed in consultation with outside counsels handling the Group’s defense in these matters and is based upon an analysis of potential results. No provision for probable losses arising from legal contingencies was recognized in the Group’s consolidated financial statements as of December 31, 2010 and 2009.
4. Cash and Cash Equivalents
2010 2009 Cash on hand and in banks P=9,150,763 P=3,947,769 Short-term deposits 16,946,440 1,634,459 P=26,097,203 P=5,582,228
Cash in banks earn interest at prevailing bank deposit rates. Short-term deposits are made for varying periods of between one (1) day and three (3) months depending on the immediate cash requirements of the Group, and earn interest at the respective short-term deposit rates.
Interest income earned from cash and cash equivalents, including restricted cash classified as other noncurrent assets (see Note 15), amounted to P=176,629 in 2010, P=403,641 in 2009 and P=520,609 in 2008. Short-term deposits as of December 31, 2010 include CSB’s deposit with banks and others amounting to P=1,678,256 that earned interest of P=30,639 in 2010. This is presented as part of “Bank revenues” in the 2010 consolidated statement of income.
5. Trade and Other Receivables
2010 2009 Trade receivables
Banking P=7,071,224 P=– Power 6,274,900 3,712,394 Food manufacturing 940,489 816,731 Transport services 426,067 2,062,890 Holding and others 490,681 795
15,203,361 6,592,810 Insurance and other claims 7,484 223,656 Others 1,000,221 1,215,484 16,211,066 8,031,950 Less allowance for impairment losses (508,621) (397,115) P=15,702,445 P=7,634,835

- 31 -
*SGVMC409510*
Trade receivables, except banking receivables, are non-interest bearing and are generally on 10 - 30 days’ terms. Banking receivables earn interest at prevailing rates and are on varying terms. Interest income on banking receivables, included under “Bank revenues” in the consolidated statement of income, amounted to P=880,864 in 2010. Certain receivables with outstanding balance of P=2.38 billion as of December 31, 2010 are pledged as collateral to secure CSB’s long-term debt (see Note 18). For terms and conditions relating to related party receivables, refer to Note 31. Receivables from insurance and other claims in 2009 pertain mainly to ATS’s claims for reimbursement of losses against insurance coverage for hull, machinery and cargo damages and personal accidents.
Other receivables substantially comprise various outstanding claims. The rollforward analysis of allowance for impairment losses is presented below: December 31, 2010 Trade Receivables Insurance
and Other Claims Others Total
Transport Services Power
Food Manufacturing Banking
Holding and Others
At beginning of year P=233,496 P=106,170 P=31,586 P=– P=– P=7,519 P=18,344 P=397,115 Provisions (see Note
24) 20,850 292,065 2,600 25,900 – – – 341,415 Reversals (see Note 26) (12,527) (21,323) (3,054) (8,898) – – – (45,802) Changes through the
consolidated statement of income 8,323 270,742 (454) 17,002 – – – 295,613
Acquired subsidiary – – – 83,575 – – – 83,575 Discontinued operations (241,819) – – – – (7,519) (18,344) (267,682) At end of year P=– P=376,912 P=31,132 P=100,577 P=– P=– P=– P=508,621
December 31, 2009
Trade Receivables Insurance and
Other Claims Others Total Transport Services Power
Food Manufacturing Banking
Holding and Others
At beginning of year P=267,224 P=2,941 P=30,644 P=– P=– P=10,824 P=26,836 P=338,469 Provisions (see Note
24) 30,129 137,595 8,058 – – – – 175,782 Reversals (see Note 26) (60,884) (34,366) (7,116) – – – (5,157) (107,523) Changes through the
consolidated statement of income (30,755) 103,229 942 – – – (5,157) 68,259
Allowances used to cover write-offs (2,973) – – – – (3,305) (3,335) (9,613)
At end of year P=233,496 P=106,170 P=31,586 P=– P=– P=7,519 P=18,344 P=397,115
Allowance for impairment losses as of December 31, 2010 and 2009 pertains to receivables that
are individually determined to be impaired at balance sheet date. These relate to debtors that are in significant financial difficulties and have defaulted on payments and accounts under dispute and legal proceedings. These receivables are not secured by any collateral or credit enhancements except for banking receivables. The collateral for banking receivables consists of cash, securities, letters of guarantee and real and personal properties. Fair value of these collaterals amounted to P=39.01 million as of December 31, 2010.

- 32 -
*SGVMC409510*
Provision for impairment losses of receivables is included in “Operating expenses - Others” except for the transport segment which classifies its provisions as part of “Overhead expenses”. Reversals of allowance for impairment losses are presented in “Others - net” under “Other income - net”.
6. Inventories
2010 2009 At cost: Fuel and lubricants P=1,400,525 P=119,496 Wheat grains and other raw materials 1,388,723 1,007,994 Finished goods 188,309 68,648 Purchases in transit 39,668 82,120 Materials, parts and supplies 4,252 1,110,639 At NRV: Materials, parts and supplies 1,043,571 872,482 Raw materials 10,043 7,341 P=4,075,091 P=3,268,720
The cost of inventories charged to operations in the consolidated statements of income amounted to P=20,942,800, P=11,740,600 and P=10,391,400 in 2010, 2009 and 2008, respectively. Allowance for inventory obsolescence amounted to P=48,174 and P=54,100 as of December 31, 2010 and 2009, respectively.
7. Other Current Assets
2010 2009 Input value added taxes (VAT) P=737,045 P=518,442 Prepaid expenses 472,517 923,286 Biological assets (see Note 8) 330,492 275,522 Others 340,592 200,818 P=1,880,646 P=1,918,068
8. Biological Assets
2010 2009 Consumables:
Market hogs at fair value less estimated point of sale costs P=224,112 P=176,852
Piglets at fair value less estimated point of sale costs 75,205 63,743
Growing stocks at cost 31,175 34,927 330,492 275,522 Bearers - net of accumulated depreciation of
P=40.1 million in 2010 and P=30.0 million in 2009 (see Note 15) 53,372 44,518
P=383,864 P=320,040

- 33 -
*SGVMC409510*
Bearers are measured at accumulated cost less accumulated depreciation and any accumulated impairment losses. The Group uses this method of measurement because market-determined prices and values are not available and alternative estimates of fair values are determined to be unreliable.
Fair values of consumable biological assets measured at fair value less estimated point-of-sale costs are determined based on average market selling prices at year-end. The reconciliation of changes in the carrying amount follows:
2010 2009 At beginning of year P=275,522 P=255,120 Additions 900,432 725,575 Sales at fair value (1,061,815) (878,230) Transfer to breeding herd (36,424) (34,807) Increase in fair value (see Note 26) 252,777 207,864 At end of year P=330,492 P=275,522
Consumable biological assets are included in “Other current assets” account while bearers are included in “Other noncurrent assets” account in the consolidated balance sheets (see Note 15).
9. Business Acquisitions
a. Step-acquisition of CSB The Bangko Sentral ng Pilipinas (BSP) approved on November 17, 2010 the proposed acquisition by the Company and its wholly-owned subsidiary, Pilmico Foods Corporation, of up to 60% and 40%, respectively, of the outstanding shares of stock of CSB. With this BSP approval, the Group completed its acquisition of additional 64.86% of CSB on November 27, 2010, increasing its ownership to 99.25% and gaining control of the financial and operating policies of the bank. CSB was an associate prior to this additional acquisition.
CSB is a non-listed Cebu-based thrift bank which is primarily engaged in offering loans to school teachers under the Department of Education’s Automatic Payroll Deduction System. It has one of the best operating efficiencies in the thrift banking industry with a low past due ratio and is among those with the highest capital adequacy ratios. The Company’s management believes that with the full acquisition of CSB, the Company will be able to support the bank’s growth ambitions and entry into the Luzon market. The accounting for this business combination was determined provisionally due to the ongoing determination of possible recognition of intangible assets and any contingent liabilities arising from the acquisition. This will be finalized in 2011 as allowed by PFRS.

- 34 -
*SGVMC409510*
The provisional fair values of the identifiable assets of CSB as at the date of acquisition follow:
Fair value recognized
on acquisition Assets: Cash and cash equivalents P=1,102,907 Held to maturity investments 476,991 Loans and receivables 6,279,069 Investment in associates 889 Bank premises, furniture, fixtures and equipment 103,895 Investment properties 19,680 Deferred tax assets 35,534 Other resources 25,268 8,044,233 Liabilities: Deposit liabilities 4,714,131 Bills payable 1,935,052 Income tax payable 49,926 Accrued expenses and other liabilities 264,225 6,963,334 Total identifiable net assets at fair value 1,080,899 Total consideration satisfied by cash 1,344,559 Fair value of previously-held interest in CSB 371,711 Non-controlling interest (proportionate share of the
acquiree’s net identifiable assets) 8,142 1,724,412 Goodwill arising from acquisition P=643,513 Cash flow on acquisition: Net cash acquired with the subsidiary P=1,102,907 Cash paid (1,344,559) Net cash outflow on acquisition (P=241,652)
Remeasurement of the previously-held interest in CSB as at the date of acquisition follows:
Carrying value of the previously held interest in CSB P=372,702
Fair value of previously-held interest in CSB (371,711) Loss on the remeasurement of previously held
interest (included in “other income - net” in the consolidated statement of income (see Note 16) P=991
The fair value of the loans and receivables amounted to P=6,279,069. The gross amount of loans and receivables amounted to P=6,354,210 and the allowance for impairment losses amounted to P=99,300.

- 35 -
*SGVMC409510*
The goodwill of P=643,513 comprises the value of expected synergies arising from the acquisition. Goodwill is allocated entirely to CSB. None of the goodwill recognized is expected to be deductible for income tax purposes. From the date of acquisition, the additional interest in CSB has contributed P=143,623 to the net income of the Group. This newly-qualified subsidiary has likewise contributed P=1,471,458 in revenue to the Group.
b. Acquisition of the 747 Megawatt (MW) Tiwi-MakBan Geothermal Power Plant (“Tiwi-MakBan Power Plant”)
In August 2008, PSALM issued the Notice of Award and Certificate of Effectivity to APRI, an AP subsidiary, officially declaring it as the winning bidder for the 289 MW Tiwi Geothermal Power Plant located in Tiwi, Albay and the 458 MW Makiling-Banahaw (MakBan) Geothermal Plant located in Laguna and Batangas Provinces. On May 25, 2009, following the completion of the conditions precedent and the execution of the respective Certificates of Closing, the control and possession of the purchased assets were successfully turned over and transferred by PSALM to APRI. APRI started the commercial operations of the Tiwi-MakBan Power Plant on May 26, 2009. APRI accounted for the purchase of the Tiwi-MakBan Power Plant under the purchase method. The provisional fair value of the identifiable assets of the Tiwi-MakBan Power Plant as at the date of acquisition follows:
Fair value recognized
on acquisition Property, plant and equipment Steam field assets P=11,910,223 Machinery and equipment 6,106,985 Electrical equipment 1,290,397 Other land improvements 150,779 Buildings 509,858 Inventories 237,774 Deferred income tax liability (7,242) Total consideration P=20,198,774
No complete comparable information was available with respect to the carrying amounts of each of the assets acquired in the books of PSALM immediately before the acquisition. The accounting for the business combination that was effected in 2009 was determined provisionally as APRI had incomplete information as of report date with respect to possible recognition of intangible assets and deferred income tax assets arising from the acquisition. In 2010, the accounting for the business combination was finalized and no changes were made on the purchase price allocation that was provisionally computed.
The total cost of the business combination was P=20,198,774, consisting of the purchase price of P=19,900,270 and costs directly attributable to the acquisition of P=298,504. From the date of acquisition up to December 31, 2009, the Tiwi-MakBan Power Plant has contributed P=2,072,730 to the net income of the Group.

- 36 -
*SGVMC409510*
c. Acquisition of Scanasia Overseas, Inc. (SOI) On June 3, 2008, AOI acquired 100% ownership in SOI, a company engaged in the business of sales, marketing, warehousing and transportation of temperature-controlled and ambient food products to its customers in the Philippines. The business acquisition resulted in a goodwill of P=235,486.
Cash flow on acquisition: Net cash acquired with the subsidiary P=148,246 Cash paid (373,870) Net cash outflow on acquisition (P=225,624)
SOI has contributed P=21.4 million, P=10.5 million and P=18.9 million to the net income of the Group in 2010, 2009 and 2008, respectively.
d. Significant Business Acquisition by an Associate
Acquisition of the 175 MW Ambuklao-Binga Hydroelectric Power Plant Complex (Ambuklao-Binga HEPPC)
On November 28, 2007, SN Aboitiz Power-Benguet, Inc., (SNAP-Benguet), an associate of MORE, won the auction for the Ambuklao-Binga HEPPC with a bid of US$325.0 million. On July 10, 2008, PSALM turned over the possession and control of the Ambuklao-Binga HEPPC to SNAP-Benguet, following payment by SNAP-Benguet of 70% of the purchase price to PSALM. SNAP-Benguet started the commercial operations of the Binga Power Plant on July 11, 2008. The Ambuklao Power Plant is currently undergoing rehabilitation. SNAP-Benguet accounted for the purchase of the Ambuklao-Binga HEPPC under the purchase method. From the date of acquisition up to December 31, 2008, SNAP-Benguet has contributed P=16,705 to the net income of the Group.
10. Investments in and Advances to Associates
2010 2009 Acquisition cost: Balance at beginning of year P=24,488,191 P=21,660,274 Additions during the year 1,680,915 2,827,917 Step-acquisition to subsidiary (79,001) − Disposals during the year (see Note 14) (815,337) − Balance at end of year 25,274,768 24,488,191 Accumulated share in net earnings: Balance at beginning of year 12,238,894 9,048,865 Share in net earnings for the year 6,883,363 4,321,679 Disposals during the year (see Note 14) (444,275) − Step-acquisition to subsidiary (199,564) −
(Forward)

- 37 -
*SGVMC409510*
2010 2009 Cash dividends received (P=2,138,853) (P=1,125,681)
Earnings adjustment − (5,969) Balance at end of year 16,339,565 12,238,894 Share in cumulative translation adjustments
of associates 57,922 115,759 Share in unrealized valuation gain (loss) on
AFS investments of an associate 322,284 (64,734) Gain on dilution 1,014,137 1,014,137 43,008,676 37,792,247 Advances to associates 1,870,294 805,170 44,878,970 38,597,417 Less allowance for impairment losses (28,995) (28,995) P=44,849,975 P=38,568,422
Share in net earnings amounts in 2010 and 2009 includes that of discontinued operations amounting to P=40,207 and P=57,128, respectively. The Group’s associates and the corresponding equity ownership are as follows:
Percentage of Ownership Nature of Business 2010 2009 2008 Manila-Oslo Renewable Enterprise, Inc. (MORE) Holding company 83.33 83.33 83.33 VECO Power 55.19 55.18 55.11 SNAP-Magat Power 50.00 50.00 50.00 SNAP-Benguet Power 50.00 50.00 50.00 SNAP-Pangasinan, Inc.* Power 50.00 50.00 − LHC Power 50.00 50.00 50.00 East Asia Utilities Corporation (EAUC) Power 50.00 50.00 50.00 Redondo Peninsula Energy, Inc. (RP Energy)* Power 50.00 50.00 50.00 San Fernando Electric Light and Power Co., Inc.
(SFELAPCO) Power 43.78 43.78 43.78 Cordillera Hydro Corporation* Power 35.00 35.00 35.00 STEAG Power 34.00 34.00 34.00 Cebu Energy Development Corporation
(CEDC)* Power 26.40 26.40 26.40 SPPC Power 20.00 20.00 20.00 WMPC Power 20.00 20.00 20.00 Cebu International Container Terminal, Inc.
(CICTI)* Transportation 20.00 20.00 20.00 Aboitiz Project TS Corporation (APTSC) Transportation – 50.00 50.00 MCC Philippines Transportation – 33.00 33.00 Hapag-Lloyd Philippines, Inc. Transportation 15.00 – – Jebsen People Solutions AS (JPS) Manpower services 50.00 50.00 – Accuria, Inc. Holding company 49.54 49.54 49.54 Hijos de F. Escano, Inc. (HIJOS) Holding company 46.73 46.73 46.66 Pampanga Energy Ventures Inc. (PEVI) Holding company 42.84 42.84 42.84 Union Bank of the Philippines (UBP) Banking 40.91 38.66 36.34 CSB (see Note 9) Banking – 34.39 34.39 South Western Cement Corporation Cement 20.00 20.00 20.00 CSB Land, Inc. Real Estate 40.00 – – CSB Holdings, Inc. Real Estate 40.00 – –
*No commercial operations.

- 38 -
*SGVMC409510*
The Group does not consolidate MORE because of absence of control resulting from the shareholders agreement which, among others, stipulate the management and operation of MORE. The management of MORE is vested in its BOD and the affirmative vote of the other shareholder is required for the approval of certain corporate actions which include significant financial and operating undertakings. The Group also does not consolidate VECO as the other shareholders’ group has the control over the financial and operating policies of VECO. The unrealized gain on dilution primarily pertains to the Group’s waiver of its pre-emptive right to subscribe to the additional stock offering of UBP in 2007. On various dates in 2010, the company purchased additional 14.4 million shares in UBP for a total consideration of P=646,684, further increasing its share in UBP from 38.66% to 40.91%. In March 2009, the Company purchased additional 14.9 million shares in UBP for a total consideration of P=297,563, increasing its share in UBP from 36.34% to 38.66%. In 2010, additional P=1,030,839 was invested in MORE to support SNAP-Benguet’s plant rehabilitation and refurbishment. In 2009, the Group paid P=2,377,637 as additional investment in CEDC.
The detailed carrying values of investments in associates, which are accounted for under the equity method, follow:
2010 2009 UBP P=15,820,478 P=13,192,023 MORE 13,336,441 10,109,764 STEAG 6,445,009 5,909,444 CEDC 2,396,218 2,417,898 VECO/HIJOS 2,080,789 1,918,699 LHC 1,181,164 1,232,222 SFELAPCO/PEVI 513,918 403,597 WMPC 465,002 421,960 EAUC 335,563 1,375,712 SPPC 230,452 251,256 CICTI 240,125 240,125 CSB – 275,584 RP Energy (3,252) 2,118 Others (33,231) 41,845 P=43,008,676 P=37,792,247
The fair value of the investment in UBP for which there is a published price quotation amounted to P=15.7 billion and P=9.2 billion as of December 31, 2010 and 2009, respectively.

- 39 -
*SGVMC409510*
Following is the summarized financial information of significant associates:
2010 2009 2008 UBP Total current assets P=61,929,911 P=58,908,760 P=35,789,294 Total noncurrent assets 191,069,906 185,452,558 168,111,809 Total current liabilities 211,977,367 208,043,868 175,597,243 Total noncurrent liabilities 5,037,100 5,037,100 1,287,100 Gross revenue 11,813,054 11,891,519 10,392,551 Operating profit 6,186,456 4,420,466 2,908,474 Net income 5,353,251 4,325,003 2,068,426 MORE Total current assets P=234,714 P=278,313 P=125,849 Total noncurrent assets 16,013,675 12,037,113 10,685,237 Total current liabilities 241,362 276,057 238,040 Total noncurrent liabilities 3,298 490,400 253,351 Gross revenue 4,084,202 1,270,474 832,142 Operating profit 3,836,899 1,096,944 723,172 Net income 3,911,204 1,102,475 716,448 STEAG Total current assets P=5,624,376 P=8,029,261 P=7,081,353 Total noncurrent assets 11,129,719 10,924,231 12,129,785 Total current liabilities 1,659,345 2,307,605 3,189,506 Total noncurrent liabilities 3,348,866 6,880,704 8,573,835 Gross revenue 6,507,354 6,205,924 6,265,242 Operating profit 3,131,010 3,118,338 3,850,860 Net income 1,754,369 2,602,400 3,216,793 LHC Total current assets P=382,808 P=332,448 P=364,594 Total noncurrent assets 3,965,135 4,496,366 4,954,809 Total current liabilities 1,468,097 1,593,142 456,638 Total noncurrent liabilities 517,517 771,228 2,218,420 Gross revenue 934,710 1,223,189 1,088,083 Operating profit 492,193 749,635 682,124 Net income 339,521 467,264 1,080,494 VECO* Total current assets P=3,251,474 P=1,424,236 P=1,602,279 Total noncurrent assets 7,878,006 7,532,706 6,775,561 Total current liabilities 2,513,044 1,902,036 1,340,521 Total noncurrent liabilities 3,939,339 2,546,256 2,434,584 Gross revenue 13,405,730 10,830,878 9,899,115 Operating profit 609,522 140,657 396,922 Net income 609,526 315,082 509,527

- 40 -
*SGVMC409510*
2010 2009 2008 EAUC Total current assets P=552,025 P=697,187 P=428,112 Total noncurrent assets 1,002,340 3,122,061 3,128,757 Total current liabilities 166,788 255,217 282,265 Total noncurrent liabilities 10,861 9,565 8,160 Gross revenue 1,741,244 1,381,633 1,579,424 Operating profit 283,349 186,597 106,568 Net income 252,754 286,577 126,927 WMPC Total current assets P=1,031,813 P=718,455 P=819,909 Total noncurrent assets 1,584,896 1,792,574 2,043,482 Total current liabilities 148,542 192,535 277,785 Total noncurrent liabilities 143,422 181,783 357,740 Gross revenue 1,324,460 1,206,970 1,283,784 Operating profit 769,956 558,505 670,578 Net income 851,962 548,359 415,925
*Amounts are based on appraised values of property, plant and equipment and on historical costs of investment properties which are adjusted to historical amounts and to fair values, respectively, upon equity take-up of the Group. Using cost method in accounting for property, plant and equipment and fair value method in accounting for investment properties, net income amounted to P=788,629, P=467,792 and P=566,578 in 2010, 2009 and 2008, respectively, for VECO.
11. Impairment Testing of Goodwill
Goodwill acquired through business combinations have been attributed to each business considered as cash-generating unit.
The recoverable amount of the investments has been determined based on a value in use calculation using cash flow projections based on financial budgets approved by senior management covering a five-year period. The discount rate applied to cash flow projections are from 8.22% to 15.70% in 2010 and from 9.58% to 18.87% in 2009, and cash flows beyond the five-year period are extrapolated using a zero percent growth rate.
Key assumptions used in value in use calculation for December 31, 2010 and 2009 The following describes each key assumption on which management has based its cash flow projections to undertake impairment testing of goodwill. Foreign exchange rates The assumption used to determine foreign exchange rate is a weakening Philippine peso which starts at a rate of P=44.00 to a dollar in 2011 and depreciates at 2% annually until 2015.
Materials price inflation The assumption used to determine the value assigned to the materials price inflation is 4.4% in 2011, which then increases by 20 and 40 basis points on the second and third year, respectively. It then remains steady at 5% until the fifth year. The starting point of 2011 is consistent with external information sources. Based on the impairment testing, no impairment was recognized in 2010 and 2009.

- 41 -
*SGVMC409510*
With regard to the assessment of value-in-use, management believes that no reasonably possible change in any of the above key assumptions would cause the carrying value of the goodwill to materially exceed its recoverable amount. The carrying amount of goodwill follows:
2010 2009 CSB P=643,513 P=– MEZ 538,373 538,373 BEZ 237,404 237,404 HI 220,228 220,228 ATS (see Note 14) – 560,314 SOI (see Note 14) – 235,486 Reefer Van Specialist Inc. (see Note 14) – 20,978 P=1,639,518 P=1,812,783
The reconciliation of the carrying amount of goodwill at the beginning and end of the year are as follows:
2010 2009 Beginning balance P=1,812,783 P=1,812,783 Acquisition of a subsidiary (see Note 9) 643,513 – Discontinued operations (see Note 14) (816,778) – P=1,639,518 P=1,812,783

- 42 -
*SGVMC409510*
12. Property, Plant and Equipment
December 31, 2010
Building, Warehouses and
Improvements
Power Plant and
Equipment
Transmission and
Distribution Equipment
Machinery and
Equipment Flight
Equipment Transportation
Equipment
Ships in Operation and
Improvements Containers Handling
Equipment
Office Furniture,
Fixtures and Equipment
Leasehold Improve-
ments Land
Ships under Refurbish- ments and
Construction in Progress Others 2010
COST At January 1 P=2,914,865 P=66,628,765 P=4,553,427 P=3,664,635 P=351,988 P=795,628 P=5,879,220 P=1,473,737 P=1,288,727 P=1,004,250 P=570,596 P=369,100 P=4,827,987 P=366,426 P=94,689,351 Acquisition of a subsidiary
(Note 9) 63,355 – – – – – – – – 91,998 33,425 5,659 – – 194,437 Additions 74,972 1,498,217 296,882 20,925 150 169,405 3,300,429 35,670 97,450 194,625 36,094 41 2,690,775 94,432 8,510,067 Disposals (9,833) (37,280) (99) (74) (1,561) (102,279) (482,614) (57,077) (279) (39,266) (1,387) (19,500) (134) (30,534) (781,917) Reclassifications 79,908 5,280,435 148,693 172,322 13,598 (18,627) (62,032) 112,443 (135) (7,904) 95,359 (8,040) (5,793,565) (3,557) 8,898 Discontinued operations
(Note 14) (689,325) – – – (62,811) (200,408) (8,635,003) (1,564,773) (1,274,238) (618,522) (336,471) – (2,873) (2,555) (13,386,979) At December 31 2,433,942 73,370,137 4,998,903 3,857,808 301,364 643,719 – – 111,525 625,181 397,616 347,260 1,722,190 424,212 89,233,857 ACCUMULATED DEPRECIATION AND AMORTIZATION At January 1 678,887 3,289,900 2,282,549 1,322,638 82,819 446,250 2,220,913 1,331,613 1,159,794 758,986 333,007 – – 217,003 14,124,359 Acquisition of a subsidiary
(Note 9) 25,004 – – – – – – – – 73,258 8,110 – – – 106,372 Additions 118,075 2,480,574 194,431 92,712 19,702 104,693 1,043,602 21,316 49,985 165,865 68,396 – – 156,203 4,515,554 Disposals (6,293) (36,068) (789) (70) (1,553) (79,643) (354,192) (32,040) (197) (33,793) (1) – – (25,611) (570,250) Reclassifications (31,358) 57,075 2,644 – 12,527 39,778 (169,329) 74,556 14,967 45,150 48,974 – – (2,957) 92,027 Impairment – – – – – – 778,830 – – – – – – – 778,830 Discontinued operations
(Note 14) (253,424) – – – (62,264) (134,912) (3,519,824) (1,395,445) (1,137,975) (525,135) (221,282) – – (7,053) (7,257,314) At December 31 530,891 5,791,481 2,478,835 1,415,280 51,231 376,166 – – 86,574 484,331 237,204 – – 337,585 11,789,578 Net Book Value P=1,903,051 P=67,578,656 P=2,520,068 P=2,442,528 P=250,133 P=267,553 P=– P=– P=24,951 P=140,850 P=160,412 P=347,260 P=1,722,190 P=86,627 P=77,444,279

- 43 -
*SGVMC409510*
December 31, 2009
Building, Warehouses and
Improvements
Power Plant and
Equipment
Transmission and
Distribution Equipment
Machinery and
Equipment Flight
Equipment Transportation
Equipment
Ships in Operation and
Improvements Containers Handling
Equipment
Office Furniture,
Fixtures and Equipment
Leasehold Improve-
ments Land
Ships under Refurbish- ments and
Construction in Progress Others 2009
COST At January 1 P=993,031 P=3,511,445 P=4,442,990 P=1,957,486 P=301,364 P=682,536 P=– P=– P=109,534 P=786,268 P=66,563 P=240,158 P=2,526,651 P=276,108 P=15,894,134 Re-presentation of Disposal
Group in 2008 666,455 – – – 62,980 298,183 5,098,939 1,537,335 1,136,559 612,092 276,460 – 81,046 – 9,770,049 Reversal of impairment – – – – – – 14,341 – – – – – – – 14,341 Acquisition 660,637 18,017,208 – 1,290,397 – – – – – – – – – – 19,968,242 Additions 143,467 45,300,656 298,640 74,416 564 143,774 1,639,082 – 85,988 135,453 56,699 24,708 2,404,977 73,958 50,382,382 Disposals (23,288) (48,231) (5,004) (741) (12,913) (116,396) (465,921) (63,812) (29,867) (83,403) (2,763) – – (4,421) (856,760) Reclassifications 474,563 (152,313) (183,199) 343,077 (7) (212,469) (407,221) 214 (13,487) (446,160) 173,637 104,234 (184,687) 20,781 (483,037) At December 31 2,914,865 66,628,765 4,553,427 3,664,635 351,988 795,628 5,879,220 1,473,737 1,288,727 1,004,250 570,596 369,100 4,827,987 366,426 94,689,351 ACCUMULATED DEPRECIATION AND AMORTIZATION At January 1 410,069 2,349,819 2,137,134 1,007,667 101,491 285,919 – – 75,436 463,467 32,775 – – 74,090 6,937,867 Re-presentation of Disposal
Group in 2008 239,309 – – – 57,770 149,560 2,099,919 1,362,742 1,048,025 481,952 136,275 – – – 5,575,552 Additions 92,595 987,191 190,394 174,881 19,483 106,632 679,946 28,525 65,364 102,663 44,073 – – 30,543 2,522,290 Disposals (21,401) (39,313) (418) (544) (8,170) (102,454) (362,548) (59,265) (22,838) (83,392) (4,728) – – (3,955) (709,026) Reclassifications (41,685) (7,797) (44,561) 140,634 (87,755) 6,593 (196,404) (389) (6,193) (205,704) 124,612 – – 116,325 (202,324) At December 31 678,887 3,289,900 2,282,549 1,322,638 82,819 446,250 2,220,913 1,331,613 1,159,794 758,986 333,007 – – 217,003 14,124,359 Net Book Value P=2,235,978 P=63,338,865 P=2,270,878 P=2,341,997 P=269,169 P=349,378 P=3,658,307 P=142,124 P=128,933 P=245,264 P=237,589 P=369,100 P=4,827,987 P=149,423 P=80,564,992

- 44 -
*SGVMC409510*
Containers include units acquired under finance lease arrangements (see Note 20). The depreciation of the leased containers, amounting to P=5.4 million in 2010, P=29.0 million in 2009 and P=62.1 million in 2008, were computed on the basis of the Group’s depreciation policy for owned assets. Specific borrowing costs capitalized as part of construction in progress amounted to P=151.9 million and P=227.3 million in 2010 and 2009, respectively. The rate used to determine the amount of borrowing costs eligible for capitalization was 8.26%, which is the effective interest rate of the related specific borrowing. Property, plant and equipment with carrying amounts of P=7.1 billion and P=6.1 billion as of December 31, 2010 and 2009, respectively, are used to secure the Group’s long-term debts (see Note 18). Acquisition of PB 118 and PB 117 On July 31, 2009, Therma Marine and Therma Mobile, subsidiaries, won the negotiated bid with the Power Sector Assets and Liabilities Management Corporation (PSALM) for the barge-mounted diesel-powered generation plants, the 100 MW PB 118 and 100 MW PB 117, with bid prices of US$14 million (P=651,233,800) and $16 million (P=739,467,200), respectively. PB 118 is moored in Barangay San Roque, Maco, Compostela Valley in Mindanao. PB 117 is moored in Barangay Sta. Ana, Nasipit, Agusan Del Norte. Under the terms of the Asset Purchase Agreement (APA), Therma Marine and Therma Mobile is required to deliver at least 40% of the purchase price upon closing of the acquisition. The remaining 60% is payable over a period not to exceed seven years. On February 5, 2010 and February 26, 2010, Therma Marine fully paid PSALM the total bid prices of PB118 and PB117, respectively. On February 16, 2010, Therma Marine entered into an Assignment Agreement with Therma Mobile. Under the APA, Therma Mobile transferred all of its rights and obligations as buyer of PB 117. Therma Marine has become, for all intents and purposes, the buyer of PB 117. The control and possession of PB 118 and PB 117 were successfully turned-over and transferred to Therma Marine on February 6, 2010 and March 1, 2010, respectively. Therma Marine started the commercial operations of the power barges on the turn-over dates. The Group accounted for the acquisitions as purchases of assets in accordance with PAS 16, Property, Plant and Equipment (see Note 3). Fully depreciated transmission and distribution equipment and distribution transformers and substation equipment with gross carrying amount of P=2.5 billion and P=1.4 billion as of December 31, 2010 and 2009 are still in use. Fully depreciated power generation property, plant and equipment with gross carrying amount of P=147.6 million and P=121.1 million as of December 31, 2010 and 2009 are still in use. In 2010 and 2009, the Group has non-cash acquisitions of property and equipment amounting to P=167,393 and P=24,595,185, respectively.

- 45 -
*SGVMC409510*
13. Intangible Asset - Service Concession Rights
2010 2009 Cost:
At beginning of year P=1,045,054 P=973,532 Additions 104,385 71,522
1,149,439 1,045,054 Accumulated amortization:
At beginning of year 162,746 119,339 Amortization (see Note 24) 49,697 43,407
212,443 162,746 P=936,996 P=882,308
Service concession arrangements entered into by the Group are as follows: • On May 15, 2003, the SBMA, AEV and DLP entered into a DMSA for the privatization of the
SBMA PDS on a rehabilitate-operate-and-transfer arrangement; and to develop, construct, lease, lease out, operate and maintain property, structures, and machineries in the SBFZ.
Under the terms of the DMSA, SEZC was created to undertake the rehabilitation, operation and maintenance of the PDS (the Project), including the provision of electric power service to the customers within the Subic Bay Freeport Secured Areas of the SBFZ as well as the collection of the relevant fees from them for its services and the payment by SBMA of the service fees throughout the service period pursuant to the terms of the DMSA. In compliance with the terms of the DMSA, the SBMA shall turn over to SEZC full possession of the Project and any and all improvements, spare parts, inventories, vehicles, works and structures constructed, improved and introduced by the SBMA in the Project and land, roads and any land rights of any description including, without any limitations, easements, access, rights-of-way, leases, licenses and covenants belonging to the SBMA or otherwise appertaining to the Project, or to be acquired by or granted to SEZC by the SBMA or any relevant Governmental Instrumentalities for purposes of implementing the Project on, through, above or below the ground on which any part of the Project is located, maintained and managed, including, without limitation to, arrangements for the disposal of waste materials. The SBMA shall also turnover all records, files and/or contracts pertinent to the PDS. The SBMA shall remain the owner of the Project including all its assets and improvements.
The DMSA shall be effective for a 25-year period commencing on the turnover date and consisting of two phases: (a) the 5-year rehabilitation period and (b) the 20-year operation, management and maintenance period. Total estimated rehabilitation costs committed by SEZC under the DMSA amounted to P=368.6 million. SEZC is subject to the rate making regulations and regulatory policies of the ERC. The DMSA provides that there will be no change in the basic power supply and power distribution rates for the first 5 years from the turnover date. For and in consideration of the services and expenditures of SEZC for it to undertake the rehabilitation, operation, management and maintenance of the Project, it shall be paid by the SBMA the service fees in such amount equivalent to all the earnings of the Project, provided, however, that SEZC shall remit the amount of P=40.0 million to the SBMA at the start of every 12-month period throughout the service period regardless of the total amount of all earnings of the Project. The said remittance may be reduced by the outstanding power receivables from the SBMA, including streetlights power consumption and maintenance, for the immediately preceding year.
- 46 -
*SGVMC409510*
Since SBMA controls ownership of the equipment at the end of the agreement, the PDS are treated as intangible assets and are amortized over a period of twenty five years up to year 2028, in accordance with Philippine Interpretation IFRIC 12.
• AboitizLand, Inc. (ALI), the Developer-Operator of Mactan Export Processing Zone II
(MEPZ II), entered into a Build-Operate-Transfer (BOT) agreement with Mactan Cebu International Airport Authority (MCIAA). Under the terms of the agreement, MCIAA will provide the land, while ALI will undertake the development of MEPZ II. The project has a term of 25 years, with an option to extend the lease for another 25 years. Under the agreement, ownership of permanent structures within MEPZ II will be transferred to MCIAA after termination of the agreement.
On February 20, 2007, MEZ signed a Deed of Assignment with ALI wherein ALI transferred its power distribution assets with a net book value of P=68,659,728 in exchange for 6,254,443 shares of MEZ.
MEZ entered into a Tripartite Memorandum of Agreement with National Power Corporation (NPC) and ALI, wherein ALI assigned its rights, title and interests in the power supply contract with NPC to the MEZ. Under the agreement, ALI assigns to MEZ all its rights and obligations under the Supply of Electric Energy it entered into with NPC, which will expire on September 25, 2015.
The transmission and distribution equipment of the MEZ are located within MEPZ II. Since MCIAA controls ownership of the equipment at the end of the agreement, the equipment are treated as intangible assets and are amortized over a period of twenty one years up to year 2028, in accordance with IFRIC 12.
Management believes that, based on the assessment performed, the intangible asset - service concession rights are not impaired.
Specific borrowing costs amounting to P=19.1 million and P=22.6 million that were directly attributable to the rehabilitation of the PDS were capitalized in 2010 and 2009, respectively. The rates used to determine the amount of borrowing costs eligible for capitalization range from 8.26% to 10.02%, which are the effective interest rates of the related specific borrowings.
14. Discontinued Operations
Sale of ATS in 2010 On December 1, 2010, the BOD of the Company approved the sale of its entire holdings in ATS to Negros Navigation Co., Inc. (NENACO). The sale was finalized on December 28, 2010 for P=1.88 per share for total proceeds of P=3.5 billion. Loss on sale of ATS amounted to P=456.3 million and this is presented as part of discontinued operations in the 2010 consolidated statement of income.
Cash flow on sale of ATS: Cash received P=3,535,107 Cash of discontinued operations (764,183) Net cash inflow on sale P=2,770,924

- 47 -
*SGVMC409510*
As part of the condition for the sale of ATS to NENACO, on the same date, the Company acquired ATS’s 62.5% ownership in Aboitiz Jebsen Bulk Transport Corporation (AJBTC), Jebsen Maritime, Inc. (JMI) and Aboitiz Jebsen Manpower Solutions, Inc. (AJMSI) for P=355.9 million, and ACO acquired ATS’s 50% ownership in Jebsen Management BVI Limited (JMBVI) for P=44.0 million. The carrying amounts of the assets and liabilities of AJBTC, JMI and AJMSI in the consolidated balance sheet of ATS as of the sale date therefore continue to be the carrying amounts in the consolidated balance sheet of the Group. The gain on sale of JMBVI by ATS to ACO amounting to P=24.7 million was reflected in the 2010 consolidated statement of income as part of discontinued operations. The results of operation of ATS Group, excluding AJBTC, JMI and AJMSI, which are presented in the 2010, 2009 and 2008 consolidated statements of income as discontinued operations, are presented below: 2010 2009 2008 Revenue P=12,985,115 P=11,304,542 P=12,399,888 Cost and expenses (13,567,667) (10,919,711) (12,587,555) Interest income 5,263 12,851 13,050 Share in net earnings (losses) of
associates 40,207 57,128 (6,362) Interest expense (228,879) (74,101) (40,883) Other income (charges) - net (655,036) 296,200 259,887 Income (loss) before income tax from
discontinued operations (1,420,997) 676,909 38,025 Provision for (benefit from) income tax
Current 51,230 67,764 70,697 Deferred (462,197) 99,573 (57,387)
(410,967) 167,337 13,310 Net income (loss) from discontinued
operations before loss on sale (1,010,030) 509,572 24,715 Loss on sale of discontinued operations (456,318) − − Net income (loss) from discontinued
operations (P=1,466,348) P=509,572 P=24,715 Attributable to: Equity holders of the parent (P=1,303,326) P=356,730 P=24,970 Non-controlling interests (163,022) 152,842 (255) (P=1,466,348) P=509,572 P=24,715
Earnings (loss) per share: Basic and diluted earnings (loss) from
discounted operations (P=0.236) P=0.064 P=0.004

- 48 -
*SGVMC409510*
The net cash flows by ATS Group, excluding AJBTC, JMI and AJMAN, are as follows: 2010 2009 2008 The net cash flows by ATS Group are as
follows:
Operating P=738,981 P=969,980 P=910,162 Investing (3,570,759) (1,468,834) (1,197,386) Financing 2,479,865 579,916 432,848
Net cash inflow (outflow) (P=351,913) P=81,062 P=145,624
As a result of the disposal of the ATS Group, the Company also de-recognized the adjustment in additional paid in capital that it recorded in 2005 arising from its swap of ownership in the ATS Group with ACO, its parent; as well as the carrying amount of the non-controlling interest and components of other comprehensive income in ATS Group. The ATS Group is a reportable segment and is presented under the “Transport Services” segment in the operating segment information (see Note 30).
15. Other Noncurrent Assets
2010 2009 Prepaid rent (see Note 35) P=534,825 P=541,830 VAT tax credit receivable 430,470 45,335 Biological assets - net (see Note 8) 53,372 44,518 Rental deposits 24,358 195,314 Software development costs - net − 112,127 Restricted cash − 560,423 Others 386,610 536,476 P=1,429,635 P=2,036,023
“Restricted cash” in 2009 pertains to a US$12.2 million deposit to a bank to secure a long-term loan of an associate. The related long-term loan was fully paid in 2010 and the restricted cash was reclassified to cash and cash equivalents. Interest income from these cash equivalents is reported as part of interest income in the consolidated statements of income. Movement of the Group’s software development costs follows:
2010 2009 Cost:
Balances at beginning of year P=578,556 P=577,309 Additions 4,399 6,264 Disposals (14,078) (5,017) Discontinued operations (see Note 14) (568,877) − Balances at end of year − 578,556
Accumulated amortization: Balances at beginning of year 466,429 389,099 Additions (see Note 24) 67,120 82,335 Disposals (9,773) (5,005) Discontinued operations (see Note 14) (523,776) − Balances at end of year − 466,429
Net book value P=− P=112,127

- 49 -
*SGVMC409510*
Software development costs comprise all expenditures that can be directly attributed to the development and acquisition of several application softwares related to integrated financial and revenue management system.
16. Bank Loans
2010 2009 Peso loans P=5,459,100 P=5,179,648 US dollar loans 208,240 3,855,390 P=5,667,340 P=9,035,038
The peso loans are unsecured short-term notes payable obtained from local banks with interest rates ranging from 2.24% to 4.25% in 2010 and 5.10% to 8.75% in 2009. These loans mature on various dates in 2011 and 2010. US dollar loans include unsecured short-term notes payable obtained by AJBTC and JMI from foreign and local banks and have outstanding balance amounting to US$4.8 million and US$2.5 million as of December 31, 2010 and 2009, respectively. These loans bear interest of 4.0% to 4.75% in 2010 and 4.0% to 6.5% in 2009. These loans mature on various dates in 2011 and 2010.
The peso and dollar short-term loans are covered by the respective borrower entities’ existing credit lines with the banks and are not subject to any significant covenants and warranties. Total interest expense on bank loans recognized in 2010, 2009 and 2008 amounted to P=418,466, P=321,855 and P=297,488, respectively (see Note 32).
17. Trade and Other Payables
2010 2009 Trade payables (see Note 35) P=3,365,628 P=5,603,295 Nontrade payables and others 3,829,454 2,361,240 Deposit liabilities of CSB 1,679,941 – Accrued expenses 1,555,355 1,629,591 Due to related parties (see Note 31) 129,999 1,151,608 P=10,560,377 P=10,745,734
Trade payables are non-interest bearing and are usually 30-90 days’ terms. Nontrade and other payables include current and deferred output VAT and withholding taxes. Deposit liabilities of CSB bear annual fixed interest rates ranging from 0.50% to 8.50% with varying terms of maturity.
Current portion of deposit liabilities P=1,679,941 Noncurrent portion of deposit liabilities 3,683,745 P=5,363,686

- 50 -
*SGVMC409510*
Interest expense on deposit liabilities in 2010 follows:
Time P=255,928 Savings 20,474 Demand 723 P=277,125
Under existing BSP regulations, non-FCDU deposit liabilities of CSB are subject to liquidity reserves equivalent to 2.00% and statutory reserves equivalent to 4.00%. CSB is in compliance with such regulation as of December 31, 2010. Accrued expenses include interest on borrowings, fuel and lube costs, taxes and licenses, freight expense and energy fees that are due within 12 months. These represent P=1,340,167 and P=865,820 of the total accrued expenses as of December 31, 2010 and 2009, respectively.
18. Long-term Debt 2010 2009 Interest Rate Amount Interest Rate Amount Company: Financial institutions - unsecured peso denominated loans 2.46% - 8.25% P=4,600,000 7.33% - 9.19% P=1,975,000 Subsidiaries: AP Financial and non-financial institutions - unsecured 8.00% - 9.33% 11,878,800 8.00% - 9.33% 11,884,400 HSI Financial institutions - secured 8.52% 3,570,000 8.52% 3,570,000 CSB Financial institution - secured 5.23% - 10.10% 1,428,422 – – Non-financial institution 4.00% - 8.5% 695,752 – – CPPC Financial institutions - unsecured 6.68% - 6.71% 640,000 – – HI Financial institution - secured 8.36% 549,100 8.36% 613,700 PILMICO Financial institutions - secured 5.48% - 7.75% 310,000 5.48% - 7.75% 506,667 PANC Financial institution - secured 7.22% 162,500 7.22% 212,500 SEZC Financial institution - secured 8.26% - 10.02% 119,091 8.26% - 10.02% 331,454 BEZC Financial institution - unsecured 7.50% 70,000 – – Total 24,023,665 19,093,721 Less deferred financing costs 123,878 147,019 23,899,787 18,946,702 Less current portion 1,552,022 722,867 P=22,347,765 P=18,223,835

- 51 -
*SGVMC409510*
The Company The loans availed by the Company from financial institutions include:
a. An unsecured loan obtained in 2006 amounting to P=1.0 billion, payable in five years with 10% of the principal due on the second year, 25% due on the third and fourth year and the remaining 40% on the fifth year. Interest is payable and repriced quarterly, with rates ranging from 2.63% to 5.18% in 2010 and 5.06% to 7.49% in 2009.
b. An unsecured loan obtained in 2006 amounting to P=500.0 million, payable in five years with 10% of the principal due on the second year, 25% due on the third and fourth year and the remaining 40% on the fifth year. Interest is payable and repriced quarterly, with rates ranging from 2.46% to 5.21% in 2010 and 5.03% to 7.33% in 2009.
c. An unsecured loan amounting to P=1.0 billion availed in 2008 with bullet principal payment due at the end of five years and interest payments due quarterly at a fixed rate of 9.19%. The loan was fully paid on November 28, 2010.
2010 Fixed Rate Corporate Notes On May 19, 2010, the Company availed of a total of P=2.5 billion from the Notes Facility Agreement it signed on May 14, 2010, with First Metro Investment Corporation as Issue Manager. The Notes Facility Agreement provided for the issuance of 6-year corporate notes in a private placement to not more than 19 institutional investors pursuant to Section 9.2 of the Securities Regulation Code (SRC) and Rule 9.2(2)(B) of the SRC Rules. The note bears an annual interest of 8.25% and is unsecured. Prior to the maturity date, the Company may redeem in whole the relevant outstanding notes on the 16th interest payment date. The amount payable in respect of such early redemption shall be the accrued interest on the principal amount being earlier redeemed plus the Breakage Cost. Breakage Cost is calculated as the present value of the remaining principal amortizations and interest payments discounted at the sum of the comparable benchmark tenor yield plus the original spread on the loan. Unless previously redeemed, the notes shall be redeemable on a lump sum basis on the respective maturity date at its face value. Under the notes facility agreement, the Company shall not permit its debt to equity (DE) ratio to exceed 2:1 calculated based on its year-end audited parent company financial statements. For the purposes of determining compliance with the required ratio, the outstanding preferred shares and contingent liabilities of the Company, including but not limited to the liabilities in the form of corporate guarantees in favour of any person or entity, shall be included in the computation of debts. The Company is in compliance with the debt covenant as of December 31, 2010. Unamortized deferred debt issuance cost amounted to P=23.2 million as of December 31, 2010. On November 30, 2010, the Company availed another P=1.5 billion from the Notes Facility Agreement it signed on November 23, 2010, with Bank of Philippine Islands, BPI Asset Management and Trust Group as Investment Manager for ALFM Peso Bond, Inc. and BPI Asset Management and Trust Group as Noteholders. The Notes Facility Agreement provided for the issuance of 5-year corporate notes in a private placement to not more than 19 institutional investors pursuant to Section 9.2 of the Securities Regulation Code (SRC) and Rule 9.2(2)(B) of the SRC Rules. The loan bears an annual interest of 5.23% and is unsecured.

- 52 -
*SGVMC409510*
Prior to the maturity date, the Company may redeem in whole the relevant outstanding notes on the 12th interest payment date. The amount payable in respect of such early redemption shall be the accrued interest on the principal amount being earlier redeemed plus the Breakage Cost. Breakage Cost is calculated as the present value of the remaining principal amortizations and interest payments discounted at the sum of the comparable benchmark tenor yield plus the original spread of the loan, provided that the prepayment shall not exceed 102% nor less than 100% of the principal amount of the Notes being earlier redeemed. Unless previously redeemed, the notes shall be redeemable on a lump sum basis on the respective maturity date at its face value. Under the notes facility agreement, the Company shall not permit its DE ratio to exceed 2.5:1 calculated based on its year-end audited parent company financial statements. For the purposes of determining compliance with the required ratio, the outstanding preferred shares and contingent liabilities of the Company, including but not limited to the liabilities in the form of corporate guarantees in favour of any person or entity, shall be included in the computation of debts. The Company is in compliance with the debt covenant as of December 31, 2010. Unamortized deferred debt issuance cost amounted to P=11.5 million in 2010. AP Retail Bonds On April 30, 2009, AP registered and issued bonds worth P=3.0 billion. As provided for in the Underwriting Agreement, the three-year and five-year bonds bear interest at 8.00% and 8.70% per annum, respectively. The bonds have been rated PRS AAA by the Philippine Rating Services Corporation. The rating is subject to regular annual reviews, or more frequently as market developments may dictate, for as long as the bonds are outstanding. Prior to the maturity date, AP may redeem in whole the relevant outstanding notes on the 12th interest payment date. The amount payable in respect of such early redemption shall be the accrued interest on the principal amount, the principal amount and a prepayment penalty of 2.00% on the outstanding principal amount. Unless previously redeemed, the principal amount of the bonds shall be payable on a lump sum basis on the respective maturity date at its face value.
Under the bond trust agreement, AP shall not permit its Debt-to-Equity (DE) ratio to exceed 2:1 calculated based on the AP’s year-end audited parent company financial statements. For the purposes of determining compliance with the required ratio, the outstanding preferred shares and contingent liabilities of AP, including but not limited to the liabilities in the form of corporate guarantees in favour of any person or entity shall be included in the computation of debts. AP is in compliance with the debt covenant as of December 31, 2010. Unamortized deferred debt issuance cost reduced the carrying amount of long-term debt by P=24.4 million in 2010 and P=32.1 million in 2009. 2009 Fixed Rate Corporate Notes On September 28, 2009, AP availed a total of P=5.0 billion from the Notes Facility Agreement it signed on September 18, 2009, with First Metro Investment Corporation as Issue Manager. The Notes Facility Agreement provided for the issuance of 5-year corporate notes in a private placement to not more than 19 institutional investors pursuant to Section 9.2 of the Securities Regulation Code (SRC) and Rule 9.2(2)(B) of the SRC Rules. The note bears an interest of 8.23% and is unsecured.
- 53 -
*SGVMC409510*
Prior to the maturity date, AP may redeem in whole the relevant outstanding notes on the 12th interest payment date. The amount payable in respect of such early redemption shall be the accrued interest on the principal amount, the principal amount and a prepayment penalty of 2.00% on the outstanding principal amount. Unless previously redeemed, the notes shall be redeemable on a lump sum basis on the respective maturity date at its face value. Under the notes facility agreement, AP shall not permit its DE ratio to exceed 2:1 calculated based on its year-end audited parent company financial statements. For the purposes of determining compliance with the required ratio, the outstanding preferred shares and contingent liabilities of AP, including but not limited to the liabilities in the form of corporate guarantees in favour of any person or entity shall be included in the computation of debts. AP is in compliance with the debt covenant as of December 31, 2010. Unamortized deferred debt issuance cost reduced the carrying amount of long-term debt by P=39.2 million in 2010 and P=47.7 million in 2009. 2008 Fixed Rate Corporate Notes On December 18, 2008, AP availed a total of P=3.9 billion from the Notes Facility Agreement it signed on December 15, 2008, with BDO Capital & Investment Corporation, BPI Capital Corporation, First Metro Investment Corporation, ING Bank N.V., Manila Branch as Joint Lead Managers. The Notes Facility Agreement provided for the issuance of 5-year and 7-year corporate notes in a private placement to not more than 19 institutional investors pursuant to Section 9.2 of the Securities Regulation Code (SRC) and Rule 9.2(2)(B) of the SRC Rules. The 5-year and 7-year corporate notes bear an interest of 8.78% and 9.33%, respectively.
Prior to the maturity date, AP may redeem in whole the relevant outstanding notes on the 12th interest payment date for the 5-year note and on the 16th interest payment date for the 7-year note. The amount payable in respect of such early redemption shall be the accrued interest on the outstanding principal amount, the outstanding principal amount and a prepayment penalty of 2.00% of the outstanding principal amount. Unless previously redeemed, the notes shall be redeemable on a lump sum basis on the respective maturity date at its face value. Under the notes facility agreement, AP shall not permit its DE ratio to exceed 2:1 calculated based on its year-end parent company audited financial statements. For the purposes of determining compliance with the required ratio, the outstanding preferred shares and contingent liabilities of AP, including but not limited to the liabilities in the form of corporate guarantees in favour of any person or entity shall be included in the computation of debts. AP is in compliance with the debt covenant as of December 31, 2010. Unamortized deferred debt issuance cost reduced the carrying amount of long-term debt by P=32.6 million in 2010 and P=41.0 million in 2009. HSI On May 21, 2008, HSI and ARI entered into an agreement with local banks for a loan facility in the aggregate principal amount of up to P=3.6 billion to partially finance the design, development, procurement, construction, operation and maintenance of the 42.5 MW Sibulan hydro-electric power plant.

- 54 -
*SGVMC409510*
Repayment terms of the loan are as follows: • 70% of the principal amount of the loan is payable in semi-annual installments within 12 years
commencing on the 30th month from September 1, 2008. • A balloon payment equivalent to 30% of the loan principal on the final principal amortization
date. HSI may prepay the loan at par without premium or penalty beginning on the fourth year from the initial advance.
Interest on the loan for the first five years is fixed at 8.52%. For the remaining seven-year period interest rate will be fixed at the prevailing seven year-PDST-F interest rate for the day immediately preceding the Fixed Interest Setting Date plus 1.125%. Loan covenants include, among others, the establishment and maintenance of certain project account depositories under the control of appointed trustees of the lenders, submission of certain reports and others. As of December 31, 2010 and 2009, HSI has complied with the covenants required by the loan agreement. The loan is secured by real estate and chattel mortgages on real assets and all machineries, equipment and other properties of HSI, actually located at the project site or plant site used in the project with carrying value of P=5.20 billion and P=4.28 billion as of December 31, 2010 and 2009, respectively (see Note 12). Interest on the loan capitalized as construction in progress amounted to P=151.9 million and P=227.3 million as of December 31, 2010 and 2009 (see Note 12). Unamortized deferred debt issuance cost reduced the carrying amount of long-term debt by P=23.7 million in 2010 and P=25.6 million in 2009. CSB Long-term debt of CSB in 2010 consists of the following:
Development Bank of the Philippines (DBP) P=428,421 First Metro Investment Corporation (FMIC) and its
related parties 400,000 Security Bank Corporation (SBC) 300,000 China Banking Corporation (CBC) 300,000 Ramon Aboitiz Foundation, Inc. (RAFI) 287,758 Aboitiz Foundation Inc. (AFI) 72,000 Others 353,056 2,141,235 Unamortized transaction cost (17,061) P=2,124,174
Loans with DBP are subject to annual interest rates ranging from 5.33% to 5.87% in 2010. These loans are collateralized by assignment of CSB borrowers’ promissory notes (see Note 5). Balance of the collateralized loans as of December 31, 2010 amounted to P=475.0 million. The loans with DBP availed in 2010 are payable monthly and will be fully paid within two years. The loans with FMIC and its related parties, CBC and a portion of SBC (P=300.0 million) pertains to a P=1.0 billion 5-year fixed rate corporate notes issued by CSB in 2009 with annual interest rates ranging from 9.60% to 10.10% which are secured by the assignment of CSB borrowers’

- 55 -
*SGVMC409510*
promissory notes (see Note 5). These loans will mature in 2014. Amortization of the transaction cost of this loan amounting to P=3.03 million in 2010 are included as part of “Bank interest expense” in the consolidated statement of income.
Loans with RAFI, AFI and others are subject to annual interest rates ranging from 4.25% to 8.50% in 2010. It will mature in various dates from 2011 to 2015. CPPC On January 27, 2010, CPPC issued P=800 million three-year notes to SB Capital Investment Corporation (P=400 million) and BDO Capital & Investment Corporation (P=400 million). The notes bear an interest rate computed based on the PDST-F rate for three months plus a 2.25% spread. The notes are to be paid in 15 principal payments amounting to P=53.3 million each quarter starting on May 2, 2010. In accordance with the Notes Facility Agreement, CPPC’s debt-to-equity ratio shall not exceed 3:1, provided that upon redemption of redeemable preferred shares, debt-to-equity ratio shall not exceed 5:1. As of December 31, 2010, CPPC’s debt-to-equity ratio is at 2:1. CPPC is in compliance with the debt covenant as of December 31, 2010 Unamortized deferred debt issuance cost reduced the carrying amount of long-term debt by P=3.6 million in 2010. HI The loan availed by HI from Banco de Oro is a five-year loan of which P=450.0 million is payable at P=1.0 million per year starting 2006 with the remaining balance fully payable on January 28, 2010, and P=200.0 million is subject to a balloon payment on October 20, 2010. It bears interest of two and one-fourth percent over the applicable three-month treasury securities as displayed on Money Market Association of the Philippines (MART)1 page of Bloomberg of the rate setting day plus gross receipts tax, reviewable and payable quarterly. On February 28, 2009, HI, amended the terms of its long-term loans with BDO. Maturity dates of the loans were changed from January 31, 2010 to February 28, 2016 for the P=450.0 million long-term loans and from October 20, 2010 to February 28, 2016 for the P=200.0 million long-term loans. The amended terms also changed interest rates from floating to fixed of 8.36%.
The loan is secured by a chattel mortgage over the machineries and improvements of the Benguet and Davao hydropower plants of HI and a suretyship of ARI. Carrying value of machineries and improvements of the Benguet and Davao hydropower plants mortgaged with BDO to secure loans amounted to P=392.5 million and P=488.9 million as of December 31, 2010 and 2009, respectively (see Note 12). Loan covenant includes, among others, maintenance of debt service cover ratio of at least 1:1 and DE ratio of 75:25, and restrictions such as not to declare or pay dividends to its stockholders if debt service cover ratio is less than 1:2 nor shall it redeem or repurchase or retire or otherwise acquire for value any of its capital stock. HI is in compliance with the debt covenant as of December 31, 2010.

- 56 -
*SGVMC409510*
PILMICO The loans availed by PILMICO include: Principal Creditor Interest Rate Payment Schedule Collateral 2010 2009
Security Bank Corporation (SBC)
5 - year PDS Treasury Reference Rate AM (PDST R1) plus spread of 0.75%
12 equal quarterly payments of P=41.7 million starting July 2009
Secured by Mortgage Trust Indenture (MTI)
P=250,000 P=416,667
Metropolitan Bank and Trust Company (MBTC)
1.5% over the prevailing Development Bank of the Philippines (DBP) passed-on rate
20 equal quarterly payments of P=4.4 million starting January 2008
Secured by MTI
35,200 52,800
MBTC 1.5% over the prevailing MART 1 rate
20 equal quarterly payments of P=2.0 million starting January 2008
Secured by MTI
16,000 24,000
MBTC 1.5% over the prevailing DBP passed-on rate
20 equal quarterly payments of P=1.1 million starting January 2008
Secured by MTI
8,800 13,200
310,000 506,667 Less current portion 196,667 196,667 P=113,333 P=310,000
The loan agreement with SBC requires PILMICO to maintain and preserve the collateral values, as well as seek prior approval for any merger, consolidation, change in ownership, suspension of business operations, disposal of assets, and maintenance of financial ratios and others.
The MTIs with MBTC require PILMICO among others, to seek prior approval for any merger, consolidation, change in ownership, suspension of business operations, disposal of assets, and maintenance of financial ratios. They also prohibit PILMICO to purchase, redeem, retire or otherwise acquire for value any of its capital stock now or hereafter outstanding (other than as a result of the conversion of any share of capital stock into any other class of capital stock), return any capital to the stockholders (other than distributions payable in shares of its capital stock), declare or pay dividends to its stockholders if payment of any sum due to MBTC is in arrears, and declare or pay management bonus or profit sharing over and above existing employee benefits.
As of December 31, 2010, PILMICO has complied with the covenants required by the loan agreements.
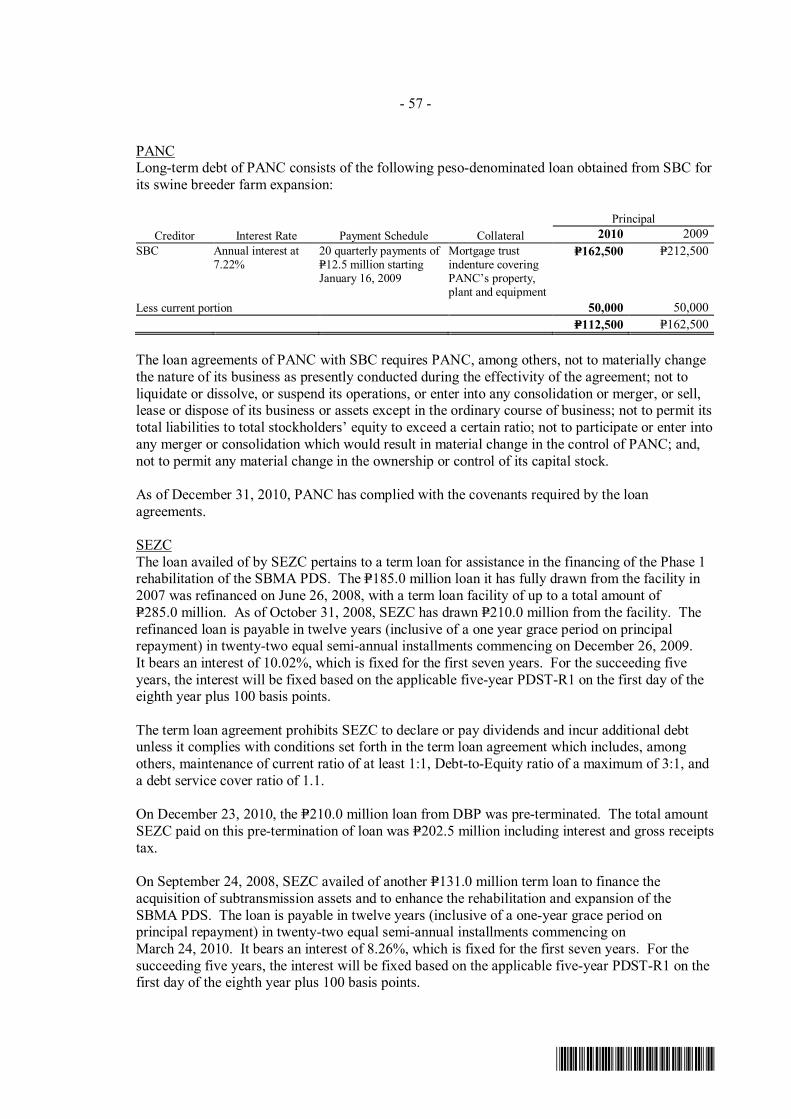
- 57 -
*SGVMC409510*
PANC Long-term debt of PANC consists of the following peso-denominated loan obtained from SBC for its swine breeder farm expansion:
Principal Creditor Interest Rate Payment Schedule Collateral 2010 2009
SBC Annual interest at 7.22%
20 quarterly payments of P=12.5 million starting January 16, 2009
Mortgage trust indenture covering PANC’s property, plant and equipment
P=162,500 P=212,500
Less current portion 50,000 50,000 P=112,500 P=162,500
The loan agreements of PANC with SBC requires PANC, among others, not to materially change the nature of its business as presently conducted during the effectivity of the agreement; not to liquidate or dissolve, or suspend its operations, or enter into any consolidation or merger, or sell, lease or dispose of its business or assets except in the ordinary course of business; not to permit its total liabilities to total stockholders’ equity to exceed a certain ratio; not to participate or enter into any merger or consolidation which would result in material change in the control of PANC; and, not to permit any material change in the ownership or control of its capital stock. As of December 31, 2010, PANC has complied with the covenants required by the loan agreements. SEZC The loan availed of by SEZC pertains to a term loan for assistance in the financing of the Phase 1 rehabilitation of the SBMA PDS. The P=185.0 million loan it has fully drawn from the facility in 2007 was refinanced on June 26, 2008, with a term loan facility of up to a total amount of P=285.0 million. As of October 31, 2008, SEZC has drawn P=210.0 million from the facility. The refinanced loan is payable in twelve years (inclusive of a one year grace period on principal repayment) in twenty-two equal semi-annual installments commencing on December 26, 2009. It bears an interest of 10.02%, which is fixed for the first seven years. For the succeeding five years, the interest will be fixed based on the applicable five-year PDST-R1 on the first day of the eighth year plus 100 basis points. The term loan agreement prohibits SEZC to declare or pay dividends and incur additional debt unless it complies with conditions set forth in the term loan agreement which includes, among others, maintenance of current ratio of at least 1:1, Debt-to-Equity ratio of a maximum of 3:1, and a debt service cover ratio of 1.1. On December 23, 2010, the P=210.0 million loan from DBP was pre-terminated. The total amount SEZC paid on this pre-termination of loan was P=202.5 million including interest and gross receipts tax. On September 24, 2008, SEZC availed of another P=131.0 million term loan to finance the acquisition of subtransmission assets and to enhance the rehabilitation and expansion of the SBMA PDS. The loan is payable in twelve years (inclusive of a one-year grace period on principal repayment) in twenty-two equal semi-annual installments commencing on March 24, 2010. It bears an interest of 8.26%, which is fixed for the first seven years. For the succeeding five years, the interest will be fixed based on the applicable five-year PDST-R1 on the first day of the eighth year plus 100 basis points.

- 58 -
*SGVMC409510*
The P=131.0 million loan is secured by surety of the stockholders and assignment of rights and benefits of SEZC related to revenue receivable and new equipment and assets to be purchased and used in the SBMA PDS. The term loan agreement prohibits SEZC to make or permit a material change in the character, ownership or control of its business, to secure any indebtedness, to sell, lease, transfer or dispose of all or substantially all of its properties, assets and investments. The agreement also does not permit SEZC to exceed the allowed DE ratio nor be less than the allowed ratio of current assets to current liabilities. The adoption of Philippine Interpretation IFRIC 12 in 2008 caused its DE ratio to exceed the maximum 3:1 limit as required by the above term loans. Prior to adopting and upon assessing the financial impact of the Interpretation on its financial statements, SEZC’s management initiated talks and negotiations with creditor bank on securing a waiver on the DE requirement as contained in the loan agreements. In December 2008, the creditor bank agreed to revise the DE ratio. On January 30, 2009, the creditor bank confirmed that the DE ratio of SEZC for the year 2008 may go up to 4:1. On January 14, 2010, the creditor bank approved and allowed the DE ratio for the year 2009 up to 2011 to go up to a maximum of 3.5:1. SEZC is in compliance with the debt covenant as of December 31, 2010. Unamortized deferred debt issuance cost reduced the carrying amount of long-term debt by P=0.5 million in 2010 and by P=0.6 million in 2009. BEZ On June 28, 2010, BEZ availed of a P=70 million ten-year loan from the Metropolitan Bank and Trust Company (MBTC) to finance the acquisition, construction and installation of a new substation. The loan is payable in quarterly installments starting September 28, 2012. Interest on the loan for the first five years is fixed at 7.50%. For the remaining five-year period, interest rate will be fixed at the prevailing five-year PDST- F interest rate for the day immediately preceding the fixed interest setting date plus 100 basis points. Loan covenant includes, among others, restrictions such as not to declare or pay dividends to its stockholders if there are payments to the bank that are in arrears, permit any indebtedness to be secured in violation of the executed deed of negative pledge nor shall it redeem or repurchase or retire or otherwise acquire for value any of its capital stock. BEZ is in compliance with the loan covenant as of December 31, 2010.
19. Customers’ Deposits
2010 2009 Transformer deposits P=854,669 P=751,317 Lines and poles deposits 778,587 692,427 Bill deposits 371,128 337,372 Others 6,901 5,565 P=2,011,285 P=1,786,681
Transformer and lines and poles deposits are obtained from certain customers principally as cash bond for their proper maintenance and care of the said facilities while under their exclusive use and responsibility. These deposits are non-interest bearing and are refundable only after their related contract is terminated and the assets are returned to the Group in their proper condition and all obligations and every account of the customer due to the Group shall have been paid. Bill deposit serves to guarantee payment of bills by a customer which is estimated to equal one month’s consumption or bill of the customer.

- 59 -
*SGVMC409510*
Both the Magna Carta and Distribution Services and Open Access Rules (DSOAR) also provide that residential and non-residential customers, respectively, must pay a bill deposit to guarantee payment of bills equivalent to their estimated monthly billing. The amount of deposit shall be adjusted after one year to approximate the actual average monthly bills. A customer who has paid his electric bills on or before due date for three consecutive years, may apply for the full refund of the bill deposit, together with the accrued interests, prior to the termination of his service; otherwise, bill deposits and accrued interests shall be refunded within one month from termination of service, provided all bills have been paid. In cases where the customers has previously received the refund of his bill deposit pursuant to Article 7 of the Magna Carta, and later defaults in the payment of his monthly bills, the customer shall be required to pose another bill deposit with the distribution utility and lose his right to avail of the right to refund his bill deposit in the future until termination of service. Failure to pay the required bill deposit shall be a ground for disconnection of electric service. Interest on bill deposits amounted to P=3,768, P=5,712 and P=5,462 in 2010, 2009 and 2008, respectively (see Note 32). The Group classified customers’ deposit under noncurrent due to the expected long-term nature of these deposits.
20. Finance Leases TLI In August 2009, TLI, an AP subsidiary, was declared by PSALM as the winning bidder for the IPP Administration Agreement with a discounted bid price of US$691 million. In September 2009, TLI and PSALM executed the IPP Administration Agreement where PSALM appointed TLI to manage the 700 MW contracted capacity of NPC in the coal-fired power plant in Pagbilao, Quezon. TLI assumed dispatch control of the contracted capacity on October 1, 2009. The IPP Administration Agreement includes the following obligations TLI would have to perform until the transfer date of the power plant (or the earlier termination of the IPP Administration Agreement):
a. supply and deliver all fuel for the power plant in accordance with the specifications of the original Energy Conservation Agreement (ECA); and
b. pay to PSALM the monthly payments (based on the bid) and energy fees (equivalent to the amount paid by NPC to the Independent Power Producer).
TLI has the following rights, among others, under the IPP Administration Agreement:
a. The right to receive, manage and control the Capacity of the power plant for its own account and at its own cost and risk;
b. The right to trade, sell or otherwise deal with the Capacity (whether pursuant to the spot market, bilateral contracts with third parties or otherwise) and contract for or offer related ancillary services, in all cases for its own account and its own risk and cost. Such rights shall carry the rights to receive revenues arising from such activities without obligation to account therefore to PSALM or any third party.
c. The right to receive the transfer of the power plant at the end of the IPP Administration Agreement (which is technically the end of the ECA) for no consideration; and
d. The right to receive an assignment of NPC’s interest to existing short-term bilateral Power Supply Contract from the effective date of the IPP Administration Agreement to November 2011 only.
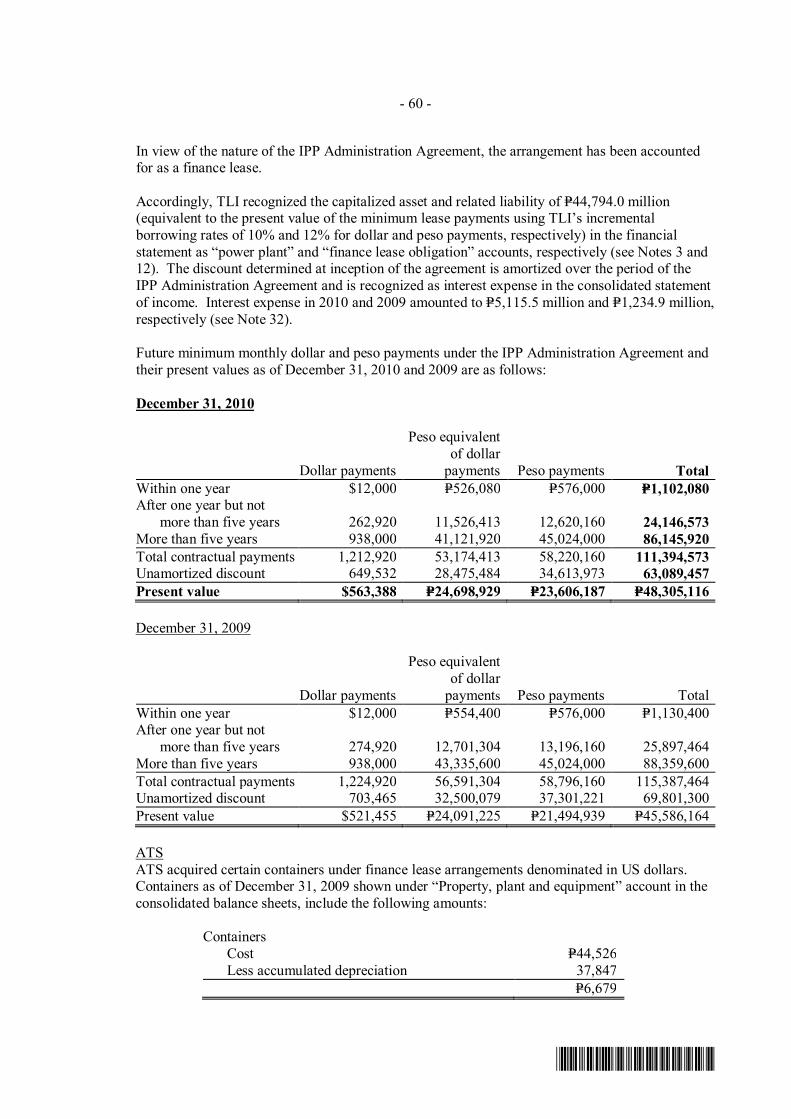
- 60 -
*SGVMC409510*
In view of the nature of the IPP Administration Agreement, the arrangement has been accounted for as a finance lease. Accordingly, TLI recognized the capitalized asset and related liability of P=44,794.0 million (equivalent to the present value of the minimum lease payments using TLI’s incremental borrowing rates of 10% and 12% for dollar and peso payments, respectively) in the financial statement as “power plant” and “finance lease obligation” accounts, respectively (see Notes 3 and 12). The discount determined at inception of the agreement is amortized over the period of the IPP Administration Agreement and is recognized as interest expense in the consolidated statement of income. Interest expense in 2010 and 2009 amounted to P=5,115.5 million and P=1,234.9 million, respectively (see Note 32). Future minimum monthly dollar and peso payments under the IPP Administration Agreement and their present values as of December 31, 2010 and 2009 are as follows: December 31, 2010
Dollar payments
Peso equivalent of dollar
payments Peso payments Total Within one year $12,000 P=526,080 P=576,000 P=1,102,080 After one year but not
more than five years 262,920 11,526,413 12,620,160 24,146,573 More than five years 938,000 41,121,920 45,024,000 86,145,920 Total contractual payments 1,212,920 53,174,413 58,220,160 111,394,573 Unamortized discount 649,532 28,475,484 34,613,973 63,089,457 Present value $563,388 P=24,698,929 P=23,606,187 P=48,305,116 December 31, 2009
Dollar payments
Peso equivalent of dollar
payments Peso payments Total Within one year $12,000 P=554,400 P=576,000 P=1,130,400 After one year but not
more than five years 274,920 12,701,304 13,196,160 25,897,464 More than five years 938,000 43,335,600 45,024,000 88,359,600 Total contractual payments 1,224,920 56,591,304 58,796,160 115,387,464 Unamortized discount 703,465 32,500,079 37,301,221 69,801,300 Present value $521,455 P=24,091,225 P=21,494,939 P=45,586,164 ATS ATS acquired certain containers under finance lease arrangements denominated in US dollars. Containers as of December 31, 2009 shown under “Property, plant and equipment” account in the consolidated balance sheets, include the following amounts:
Containers Cost P=44,526 Less accumulated depreciation 37,847 P=6,679

- 61 -
*SGVMC409510*
In 2009, the lease term on the containers has already ended and ATS has exercised its bargain purchase option. Future minimum lease payments under finance lease, together with the present value of minimum lease payments, were as follows:
Due within one year P=8,466 Beyond one year 30,377 Total minimum lease obligation 38,843 Less amount representing interest 7,275 Present value of minimum lease payments P=31,568
The outstanding balance of the US dollar denominated finance lease obligation of US$0.7 million as of December 31, 2009 have been restated at the rates prevailing as of that date of P=46.20 to US$1.
21. Capital Stock
Information on the Company’s authorized capital stock follows:
Number of Shares 2010 2009 Authorized capital stock:
Common shares, P=1 par value 9,600,000,000 9,600,000,000 Preferred shares, P=1 par value 400,000,000 400,000,000
Outstanding capital stock are as follows:
Number of Shares 2010 2009 Common shares issued 5,694,599,621 5,694,599,621 Less treasury shares 172,727,800 172,727,800 Balance at end of year 5,521,871,821 5,521,871,821
Preferred shares issued:
Balance at beginning of year 150,000,000 212,600,000 Redeemed – (62,600,000) Balance at end of year 150,000,000 150,000,000
The redeemable preferred shares are presented in the consolidated balance sheets as part of current and noncurrent liabilities in accordance with PAS 32 as follows:
2010 2009 Redeemable preferred shares of the Company P=1,500,000 P=1,500,000 Redeemable preferred shares of a subsidiary – 20,176 P=1,500,000 P=1,520,176
The preferred shares are non-voting, non-participating, non-convertible, cumulative re-issuable and redeemable and may be issued from time to time by the BOD in one or more series and fixed before issuance thereof, the number of shares in each series, and all designations, relative rights, preferences and limitations of the shares in each series. Preferred shares that are redeemed by the Company may be re-issued.

- 62 -
*SGVMC409510*
The Company’s outstanding preferred shares as of December 31, 2010 and 2009 consist of (1) Series “E” amounting to P=1,000,000 with fixed dividend rate of 8.25% per annum; and (2) Series “F” amounting to P=500,000 with fixed dividend rate of 8.5% per annum. The Company shall redeem the preferred shares at the end of the corresponding agreed periods from Issue Dates (Final Redemption Dates) regardless of the existence of unrestricted retained earnings or other amounts legally available for the payment of dividends in such period, provided that the Issuer has, after redemption, sufficient assets in the books to cover debts and liabilities inclusive of capital stock, and subject to the Issuer’s compliance with the applicable laws, rules and regulations, including the requirements of the SEC. The final redemption dates are as follows: (1) December 2011 for series “E”; and (2) December 2013 for series “F”. The preferred shares shall be redeemed by payment in cash of 100% of the Issue Price plus all accrued and unpaid cash dividends on the Final Redemption Date. Interest recognized on the preferred shares amounted to P=126,646 in 2010, P=161,596 in 2009 and P=168,575 in 2008 (see Note 32). Treasury Shares
In 2008, the Company started to buy back its shares. As of December 31, 2010 and 2009, approximately P=172.7 million AEV shares have been bought into treasury with a total cost of P=1,295.2 million.
22. Retained Earnings
On March 10, 2010, the BOD approved the declaration of a regular cash dividend of P=0.52 a share (P=2.871 billion) to all stockholders of record as of March 24, 2010. These dividends were paid on April 16, 2010. On February 11, 2009, the BOD approved the declaration of a regular cash dividend of P=0.27 a share (P=1.5 billion) to stockholders of record as of February 26, 2009. These dividends were paid on March 23, 2009. On February 7, 2008, the BOD approved the declarations of a regular cash dividend of P=0.31 a share (P=1.8 billion) and a special cash dividend of P=0.30 a share (P=1.7 billion). These dividends were paid on March 3, 2008 to stockholders of record as of February 21, 2008.
23. Revenues
a. The Uniform Rate Filing Requirements (UFR) on the rate unbundling released by the ERC on October 30, 2001, specified that the billing for sale and distribution of power and electricity will have the following components: Generation Charge, Transmission Charge, System Loss Charge, Distribution Charge, Supply Charge, Metering Charge, the Currency Exchange Rate Adjustment and Interclass and Lifeline Subsidies. National and local franchise taxes, the Power Act Reduction (for residential customers) and the Universal Charge are also separately indicated in the customer’s billing statements.
b. Bank revenues in 2010 consist of the following:
Interest income (see Notes 4 and 5) P=911,503 Service fees and bank charges 559,955 P=1,471,458

- 63 -
*SGVMC409510*
24. Costs and Expenses
Cost of goods sold consists of:
2010
2009 (As re-
presented, see Note 14)
2008 (As re-
presented, see Note 14)
Raw materials used P=9,257,767 P=7,911,227 P=6,892,608 Purchases and changes in
biological assets and inventories 2,206,641 1,800,775 2,980,449
11,464,408 9,712,002 9,873,057 Direct labor (see Note 25) 54,885 137,455 12,845 Manufacturing overhead
Power 185,245 147,889 127,216 Depreciation (see Note 12) 153,089 159,399 98,388 Repairs and maintenance 94,862 59,591 57,556 Indirect labor (see Note 25) 80,701 39,768 40,090
Utilities and supplies 38,380 8,659 – Fuel and lubricants 37,032 28,913 35,671
Freight and handling 23,348 10,113 14,993 Taxes and licenses 23,115 19,826 20,206 Pest control 7,490 4,153 3,638 Insurance 6,048 34,807 36,937 Employees’ benefits (see Note 25) 2,768 22,170 15,862
Others 104,225 92,376 70,709 756,303 627,664 521,266 Cost of goods manufactured 12,275,596 10,477,121 10,407,168 Finished goods inventory
(see Note 6) Beginning of year 44,910 114,168 98,350 End of year (169,274) (44,910) (114,168)
12,151,232 10,546,379 10,391,350 Cost of goods sold attributable to
the discontinued operations (see Note 14) (2,206,641) (1,432,867) (966,463)
P=9,944,591 P=9,113,512 P=9,424,887
Operating expenses consist of:
2010
2009 (As re-
presented, see Note 14)
2008 (As re-
presented, see Note 14)
Depreciation and amortization (see Note 12)
P=4,224,072 P=2,176,456 P=1,242,490
Fuel and lubricants 3,251,852 2,249,181 5,044,309 Personnel (see Notes 25 and 27) 1,861,285 1,199,633 1,033,816 Outside services (Note 35) 1,560,331 1,890,478 1,217,930
(Forward)

- 64 -
*SGVMC409510*
2010
2009 (As re-
presented, see Note 14)
2008 (As re-
presented, see Note 14)
Charter hire (see Note 35) P=1,093,873 P=680,979 P=2,020,059 Repairs and maintenance 871,186 813,781 642,752 Taxes and licenses 571,118 422,918 125,804 Freight and handling 560,116 308,862 267,284 Insurance 425,096 266,921 153,095 Rent (see Note 33) 260,553 22,224 10,089 Transportation and travel 218,564 139,161 81,633 Advertising 115,054 108,533 52,440 Utilities 110,275 16,593 32,140 Management and professional fees
(see Note 31) 69,743 117,538 177,728 Commissions 38,548 91,602 49,203 Training and development 23,513 52,424 8,722 Others 1,992,883 1,467,161 1,154,174 17,248,062 12,024,445 13,313,668 Operating expenses attributable to
the discontinued operations (see Note 14) (8,094,502) (6,723,102) (8,732,111)
P=9,153,560 P=5,301,343 P=4,581,557
Other operating expenses consist of miscellaneous items, the most significant of which are materials and supplies and meals of passengers and vessel crews. Overhead expenses consist of:
2010
2009 (As re-
presented, see Note 14)
2009 (As re-
presented, see Note 14)
Personnel (see Notes 25 and 27) P=973,498 P=967,309 P=873,812 Outside services 191,498 188,570 151,739 Depreciation and amortization (see Notes 12 and 13) 176,674 194,541 199,686 Communication, light and water 102,444 98,187 94,246 Advertising 92,750 120,693 103,395 Rent 90,234 93,054 85,490 Entertainment, amusement and
recreation 25,207 34,790 38,478 Provision for impairment losses
(see Note 5) 20,850 30,129 ,504 Others 382,300 368,464 339,459 2,055,455 2,095,737 1,894,809 Overhead expenses attributable to
the discontinued operations (see Note 14) (1,792,545) (1,757,975) (1,592,359)
P=262,910 P=337,762 P=302,450

- 65 -
*SGVMC409510*
Terminal expenses consist of:
2010
2009 (As re-
presented, see Note 14)
2008 (As re-
presented, see Note 14)
Transportation and delivery P=592,981 P=302,351 P=548,494 Outside services 334,072 241,587 257,496 Personnel (see Notes 25 and 27) 151,765 112,425 101,572 Depreciation and amortization
(see Note 12) 99,641 123,737 173,969 Repairs and maintenance 90,081 80,214 73,593 Rent 62,868 43,426 45,246 Fuel and lubricants 37,308 29,602 43,598 Others 105,263 72,425 52,654 1,473,979 1,005,767 1,296,622 Terminal expenses attributable to the
discontinued operations (see Note 14) (1,473,979) (1,005,767) (1,296,622)
P=− P=− P=−
Sources of depreciation and amortization are as follows:
2010
2009 (As re-
presented, see Note 14)
2008 (As re-
presented, see Note 14)
Property, plant and equipment (see Note 12) P=4,515,554 P=2,522,290 P=1,590,854
Software development costs (see Note 15) 67,120 82,335 88,283
Bearers (see Notes 8 and 15) 21,105 27,207 16,441 Intangible asset - service concession
rights (see Note 13) 49,697 43,407 35,397 4,653,476 2,675,239 1,730,975 Depreciation and amortization
attributable to the discontinued operations (see Note 14) (1,350,526) (1,017,453) (1,023,219)
P=3,302,950 P=1,657,786 P=707,756 25. Personnel Expenses
2010
2009 (As re-
presented, see Note 14)
2008 (As re-
presented, see Note 14)
Salaries and wages P=2,540,538 P=2,164,475 P=1,814,357 Employee benefits (see Note 27) 522,680 314,285 263,640 3,063,218 2,478,760 2,077,997 Personnel expenses attributable to the
discontinued operations (see Note 14) (1,415,217) (1,289,774) (1,212,172)
P=1,648,001 P=1,188,986 P=865,825

- 66 -
*SGVMC409510*
26. Other Income - net
2010
2009 (As re-
presented, see Note 14)
2008 (As re-
presented, see Note 14)
Foreign exchange gains - net (see Note 33) P=1,387,072 P=559,915 P=6,355
Impairment loss on property and equipment (see Note 12) (778,830) − −
Change in fair value of biological assets (see Note 8) 252,777 207,864 182,314
Service and other fees 139,291 214,232 265,550 Unrealized valuation gain on
investment property - net 66,282 − 7,014 Gain (loss) on sale of: AFS investments 57,895 296 74
Stock investments 24,738 52,500 (15,051) Property, plant and equipment (19,710) 29,973 (2,661) Rental income (see Note 31) 5,736 16,452 40,302 Dividend income 1,382 6,795 11,356 Provision for decline in value of various
assets, project costs and others (95,390) (14,693) (58,162) Increase (decrease) in carrying amount of
goodwill and property, plant, and equipment in disposal group − 574,789 (574,789)
Others - net 369,446 460,617 563,566 1,410,689 2,108,740 425,868 Other charges (income) attributable to the
discontinued operations (see Note 14) 655,036 (296,200) (259,886)
P=2,065,725 P=1,812,540 P=165,982 Rental income earned from and direct operating expenses of investment properties amounted to P=20,529 and P=12,606, respectively, in 2010; P=16,452 and P=9,426, respectively, in 2009; and P=40,302 and P=28,154, respectively, in 2008. Included in “Foreign exchange gains - net” are the net gains and losses relating to currency forward transactions of a subsidiary. In 2008, the Group decreased the carrying amount of its goodwill in ATS and certain ATS property and equipment by the aggregate amount of P=574,789, based on the fair value less cost to sell of the said investment following its classification to non-current asset held for sale. In 2009, the planned sale was terminated.

- 67 -
*SGVMC409510*
27. Pension Benefit Plans
The Group has defined benefit pension plans covering substantially all of its employees, which require contributions to be made to separately administered funds.
The following tables summarize the components of net benefit expense recognized in the consolidated statements of income and the funded status and amounts recognized in the consolidated balance sheets for the respective plans. Net benefit expense
2010
2009 (As re-
presented, see Note 14)
2008 (As re-
presented, see Note 14)
Interest cost on benefit obligation P=119,666 P=98,978 P=55,680 Current service cost 112,986 55,823 66,162 Separation cost 16,995 − − Net actuarial losses (gains) recognized 13,933 (68) (1,169) Expense (income) due to asset limit 296 (26,036) 13,554 Curtailment gain (4,766) − − Expected return on plan assets (95,666) (66,964) (57,900) Nonvested benefits − 2,001 764 Vested benefits − 230 230 Net benefit expense 163,444 63,964 77,321 Net benefit expense attributable to the
discontinued operations (see Note 14) (63,543) (26,972) (27,614)
P=99,902 P=36,992 P=49,707 Actual return on plan assets P=312,353 P=187,756 P=6,712
Pension asset - net
2010 2009 Fair value of plan assets P=1,128,469 P=884,965 Defined benefit obligation (1,017,662) (1,165,003) Funded (under-funded) obligation 110,807 (280,038) Unrecognized actuarial losses (asset ceiling) 70,543 320,721 Unrecognized past service cost 7,119 9,193 188,469 49,876 Net pension asset attributable to the discontinued
operations (see Note 14) (41,394) − P=147,075 P=49,876
Net pension asset above comprise gross pension asset amounting to P=179,425 and P=105,507 as of December 31, 2010 and 2009, respectively; and gross pension liability amounting to P=32,350 and P=55,631 as of December 31, 2010 and 2009, respectively.

- 68 -
*SGVMC409510*
Changes in the present value of the defined benefit obligation are as follows:
2010 2009 Opening defined benefit obligation P=1,165,003 P=589,321 Interest cost 119,666 98,979 Current service cost 112,986 55,823 Actuarial losses 99,567 445,351 Defined benefit obligation of acquired subsidiary
(see Note 9) 41,139 – Separation cost 16,995 – Employee transfers 4,154 86,146 Curtailment gain (4,052) – Benefits paid (46,799) (110,719) Transfers to (from) affiliates (191,937) 102 Defined benefit obligation of disposed subsidiary
(see Note 14) (299,060) − Closing defined benefit obligation P=1,017,662 P=1,165,003
Changes in the fair value of plan assets are as follows:
2010 2009 Opening fair value of assets P=884,965 P=587,009 Contributions by employer 312,400 102,227 Actuarial gains 216,178 145,508 Expected return 96,174 66,964 Fair value of plan assets of acquired subsidiary
(see Note 9) 70,672 – Benefits paid (46,269) (102,991) Transfer to affiliates (187,782) 102 Fair value of plan assets of disposed subsidiary
(see Note 14) (217,869) – Employee transfers – 86,146 Closing fair value of plan assets P=1,128,469 P=884,965
The Group expects to contribute approximately P=34.7 million to the defined benefit pension plan in 2011. The overall expected rate of return on assets is determined based on the market prices prevailing on that date, applicable to the period over which the obligation is to be settled. The principal assumptions used on January 1, 2010, 2009 and 2008 in determining pension benefit obligations for the Group’s plans are shown below:
2010 2009 2008 Discount rates 9% - 11% 11% - 16% 7% - 8% Expected rates of return on plan assets 10% 9% - 11% 7% - 9% Future salary increase rates 5% - 8% 6% - 11% 5% - 8%

- 69 -
*SGVMC409510*
Amounts for the current and previous periods are as follows:
2010 2009 2008 2007 Defined benefit obligation P=1,017,662 P=1,165,005 P=589,321 P=685,531 Fair value of plan assets 1,128,469 884,965 587,009 747,521 Deficit (surplus) (110,807) 280,140 2,312 (61,990) Experience adjustments on plan liabilities 139,577 126,731 (108,880) (109,174) Experience adjustments on plan assets 62,899 (5,029) (63,312) (32,778)
The major categories of plan assets as a percentage of the fair value of total plan assets are as follows:
2010 2009 Investments in: Cash, common trust fund and
money market placements 52.08% 34.66% AFS investments 43.54% 54.85% Notes and other receivable 4.38% 2.90% Government securities and other debt securities – 7.18%Others – 0.41% 100.00% 100.00%
28. Income Taxes
The provision for income tax consists of:
2010
2009 (As re-
presented, see Note 14)
2008 (As re-
presented, see Note 14)
Current Corporate income tax P=1,338,819 P=1,083,158 P=948,891 Final tax 13,147 3,249 7,403 1,351,966 1,086,407 956,294 Deferred (138,299) 119,308 21,705 1,213,667 1,205,715 977,999 Provision for (benefit from) income tax
attributable to the discontinued operations (see Note 14) (410,967) 167,337 13,309
P=1,624,634 P=1,038,378 P=964,690

- 70 -
*SGVMC409510*
A reconciliation between the statutory income tax rate and the Group’s effective income tax rates follows:
2010
2009 (As re-
presented, see Note 14)
2008 (As re-
presented, see Note 14)
Statutory income tax rate 30.00% 30.00% 35.00% Tax effects of:
Non-deductible interest expense 5.29 3.32 − Non-deductible depreciation
expense 1.13 0.74 − Non-deductible impairment
provisions (recoveries) 0.83 (0.14) − Loss (gain) on sale of investments
already subjected to final tax 0.10 (0.14) (0.08) Interest income subjected to final
tax at lower rates - net (0.20) (0.60) (1.98) Nontaxable equity in net earnings
of associates (7.11) (11.62) (20.22) Income subject to ITH (27.30) (7.37) (0.96)
Others 1.44 (1.98) 3.82 4.18% 12.21% 15.58%
Net deferred income tax assets at December 31 relate to the following:
2010 2009 NOLCO P=141,619 P=211,917 Allowances for:
Impairment and probable losses 62,097 162,801 Inventory obsolescence 28,867 26,326
Unrealized foreign exchange losses 27,879 3,755 MCIT 16,417 78,425 Accrued retirement benefits 768 45,754 Others (26,557) (14,448) P=251,090 P=514,530
Net deferred income tax liabilities at December 31 relate to the following:
2010 2009 Unrealized foreign exchange gains P=319,631 P=1,554 Unamortized customs duties and taxes
capitalized 18,324 17,015 Unamortized streetlight donations capitalized 6,249 − Pension cost − 15,379 Rental income based on straight-line method − 386 Others (22,609) 8,669 P=321,595 P=43,003
In computing for deferred income tax assets and liabilities, the rates used were 30% and 10%, which are the rates expected to apply to taxable income in the years in which the deferred income tax assets and liabilities are expected to be recovered or settled and considering the tax rate for renewable energy developers as allowed by the Renewable Energy Act of 2008.

- 71 -
*SGVMC409510*
As of December 31, 2010, no deferred income tax assets were recognized on AP’s NOLCO and MCIT amounting to P=114,822 and P=23,775, respectively, since management expects that it will not generate sufficient taxable income in the future that will be available to allow all of the deferred income tax assets to be utilized. There were no unrecognized deferred income tax assets as of December 31, 2009. There are no income tax consequences to the Group attaching to the payment of dividends to its shareholders.
29. Earnings per Common Share
Earnings per common share amounts were computed as follows:
2010 2009 2008
a. Net income attributable to equity holders of the parent P=21,865,302 P=8,306,868 P=4,120,886
b. Net income from continuing operations attributable to equity holders of the parent 23,168,628 7,950,138 4,095,916
c. Weighted average number of common shares issued and outstanding 5,521,872 5,561,675 5,616,839
d. Earnings per common share (a/c) P=3.960 P=1.494 P=0.734
e. Earnings per common share from continuing operations (b/c) P=4.196 P=1.429 P=0.729
There are no dilutive potential common shares as of December 31, 2010, 2009 and 2008.
30. Operating Segment Information Operating segments are components of the Group that engage in business activities from which they may earn revenues and incur expenses, whose operating results are regularly reviewed by the Group’s CODM to make decisions about how resources are to be allocated to the segment and assess their performances, and for which discrete financial information is available. For purposes of management reporting, the Group’s operating businesses are organized and managed separately according to services provided, with each segment representing a strategic business segment. The Group identified operating segments, which are consistent with the segments reported to the BOD, which is the Group’s CODM, are as follows: • power segment, which is engaged in power generation and sale of electricity; • food manufacturing segment, which is engaged in the production of flour and feeds and swine
breeding; • the transportation segment, which comprises ATS Group, provides domestic sea and land
transportation and logistics services (see Note 14); • the financial services segment, which is engaged in banking operations; and • the parent company and others, which include the operations of the Company, air transport
services and real property business of the Group.

- 72 -
*SGVMC409510*
For management purposes, the Group is organized into five (5) business segments based on their products and services. No operating segments have been aggregated to form the above reportable operating segments. The Group has only one geographical segment as all of its assets are located in the Philippines. The Group operates and derives principally all of its revenue from domestic operations. Thus, geographical business information is not required. Management monitors the operating results of its segments separately for the purpose of making decisions about resource allocation and performance assessment. Segment revenue and segment expenses are measured in accordance with PFRS. The presentation and classification of segment revenue and segment expenses are consistent with the consolidated statement of income. Interest expense and financing charges, depreciation and amortization expense and income taxes are managed on a per segment basis. The Group has inter-segment revenues in the form of management fees as well as inter-segment sales of electricity and other services which are eliminated in consolidation. The transfers are accounted for at competitive market prices on an arm’s length basis. Segment assets do not include deferred income tax assets, pension asset and other noncurrent assets. Segment liabilities do not include deferred income tax liabilities, income tax payable and pension liability. Capital expenditures consist of additions of property, plant and equipment and intangible asset - service concession rights. Adjustments as shown below include items not presented as part of segment assets and liabilities. There is no concentration of significant customers on any of the segments. Financial information on the operations of the various business segments are summarized as follows: 2010
Power Financial
Services Food
Manufacturing
Transport Services
(Discontinued Operations)
Parent Company
and Others Eliminations Consolidated
REVENUE Third parties P=59,543,462 P=1,471,458 P=12,879,584 P=13,420,558 P=220,755 P=– P=87,535,817 Inter-segment 2,143 – – – 407,994 (410,137) – Total revenue 59,545,605 1,471,458 12,879,584 13,420,558 628,749 (410,137) 87,535,817
RESULTS Segment results 26,267,944 639,719 1,746,193 (557,999) 141,986 (229,248) 28,008,595 Unallocated corporate
income (expenses) 1,564,036 71,766 268,745 (365,742) (259,910) (46,918) 1,231,977
INCOME FROM OPERATIONS 29,240,573
Interest expense (6,678,293) – (67,732) (240,532) (277,072) – (7,263,629) Dividends on redeemable
preferred shares – – – – (126,646) – (126,646) Interest income 224,158 – 4,224 8,024 56,548 – 292,954 Share in net earnings of
associates 4,627,014 2,218,916 86,749 41,639 20,172,267 (20,263,223) 6,883,362 Provision for income tax (920,697) (212,103) (422,754) 383,736 (41,849) – (1,213,667)
NET INCOME 27,812,947
(Forward)

- 73 -
*SGVMC409510*
2010
Power Financial
Services Food
Manufacturing
Transport Services
(Discontinued Operations)
Parent Company
and Others Eliminations Consolidated
OTHER INFORMATION Segment assets P=27,920,247 P=8,807,494 P=3,902,809 P=640,866 P=7,079,304 (P=587,666) P=47,763,054 Investments and advances 28,896,439 15,821,266 915,986 6,327 48,217,248 (49,007,291) 44,849,975 Unallocated corporate assets 77,847,256 227,794 2,405,626 93,414 1,136,641 643,513 82,354,244 Consolidated total assets 174,967,273
Segment liabilities 76,305,892 7,664,689 4,763,077 626,580 7,192,944 (557,202) 95,995,980 Unallocated corporate liabilities 516,770 68,971 49,651 17,999 474 – 653,865 Consolidated total liabilities 96,649,845
Capital expenditure 4,208,027 42,825 276,984 3,670,520 144,318 – 8,342,674 Depreciation and amortization 3,003,977 37,251 166,248 1,366,707 79,293 – 4,653,476
2009
Power Financial
Services Food
Manufacturing
Transport Services
(Discontinued Operations)
Parent Company
and Others Eliminations Consolidated
REVENUE Third parties P=23,174,265 P=– P=11,048,314 P=11,762,738 P=244,637 P=– P=46,229,954 Inter-segment – – – 61,691 295,940 (357,631) – Total revenue 23,174,265 – 11,048,314 11,824,429 540,577 (357,631) 46,229,954
RESULTS Segment results 5,456,167 – 1,351,270 513,444 159,508 46,384 7,526,773 Unallocated corporate income (expenses) 813,411 – 222,820 327,475 791,418 (46,384) 2,108,740
INCOME FROM OPERATIONS 9,635,513 Interest expense (2,813,978) – (55,840) (99,110) (183,167) – (3,152,095) Dividends on redeemable
preferred shares – – – – (161,596) – (161,596) Interest income 409,972 – 6,113 28,530 72,122 – 516,737 Share in net earnings of
associates 2,536,637
1,768,050 – 53,434 5,950,134 (5,986,576) 4,321,679 Provision for income tax (631,190) – (297,004) (201,056) (76,465) – (1,205,715)
NET INCOME 9,954,524
OTHER INFORMATION Segment assets 9,915,103 – 3,035,263 4,799,883 819,958 (165,509) 18,404,698 Investments and advances 24,896,238 13,467,608 – 74,208 34,106,955 (33,976,587) 38,568,422 Unallocated corporate assets 76,635,313 – 2,281,180 5,747,905 1,082,976 560,314 86,307,688 Consolidated total assets 143,280,808
Segment liabilities 75,862,419 – 2,863,846 5,427,097 4,066,398 (137,020) 88,082,740 Unallocated corporate liabilities 431,372 – 81,329 35,327 7,829 – 555,857 Consolidated total liabilities 88,638,597
Capital expenditure 23,473,164 – 260,639 1,940,756 112,638 – 25,787,197 Depreciation and amortization 1,412,900 – 162,201 1,033,545 66,593 – 2,675,239

- 74 -
*SGVMC409510*
2008
Power Financial Services
Food Manufacturing
Transport Services
(Discontinued Operations)
Parent Company
and Others Eliminations Consolidated
REVENUE Third parties P=12,242,980 P=– P=10,688,583 P=12,759,613 P=171,072 P=– P=35,862,248 Inter-segment – – – 108,905 351,457 (460,362) – Total revenues 12,242,980 – 10,688,583 12,868,518 522,529 (460,362) 35,862,248
RESULTS Segment results 1,652,505 – 496,704 (48,280) 205,739 33,747 2,340,415 Unallocated corporate income (expenses) 386,691 – 226,208 271,882 (425,166) (33,747) 425,868
INCOME FROM OPERATIONS 2,766,283 Interest expense (315,112) – (48,838) (76,985) (173,349) 21,490 (592,794) Dividends on redeemable
preferred shares –
– – – (168,575) – (168,575) Interest income 544,116 – 5,715 19,405 96,881 (21,490) 644,627 Share in net earnings of
associates 2,808,641
816,458 – (7,639) 3,870,629 (3,863,113) 3,624,976 Provision for income tax (618,384) – (221,328) (47,671) (90,616) – (977,999)
NET INCOME 5,296,518
OTHER INFORMATION Segment assets 17,157,942 – 4,273,426 4,161,538 648,882 4,722,013 30,963,801
Investments and advances 21,345,587
11,112,188 – 17,346 29,809,467 (29,655,162) 32,629,426 Unallocated corporate assets 8,873,293
– 2,158,395 5,230,136 1,038,385 (5,178,826) 12,121,383
Consolidated total assets 75,714,610
Segment liabilities 16,425,559 – 3,987,912 4,798,996 4,110,647 (449,230) 28,873,884 Unallocated corporate liabilities 154,913
– – 19,239 10,974 – 185,126
Consolidated total liabilities 29,059,010
Capital expenditure 2,623,993 – 657,838 1,113,175 207,782 – 4,602,788 Depreciation and amortization 511,154 – 126,418 1,035,731 57,672 – 1,730,975
31. Related Party Disclosures In the normal course of business, the Group enters into transactions with related parties, principally consisting of the following:
a. Service contracts of ACO and certain associates with the Company at fees based on agreed rates. Professional and technical fees paid by ACO and certain associates to the Company totaled P=179,692 and P=151,596 in 2010 and 2009, respectively. Up until December 2008, ACO provided these same services to the Group and generated P=84,525 service sales in 2008. With the transfer of all ACO employees to the Company in January 2009, the Company since then has been rendering these services.
b. Temporary cash advances to and from ACO and certain associates for working capital
requirements. The advances are unsecured and interest bearing at interest rates ranging from 1.8% to 4.5% in 2010, 3.0% to 6.4%% in 2009, and 3.0% to 4.0% in 2008. Interest income recognized on these advances amounted to P=129,419 in 2010, P=52,302 in 2009 and P=124,018 in 2008, while interest expense amounted to nil in 2010, P=5,183 in 2009 and P=4,391 in 2008. These advances will be settled in cash upon maturity.
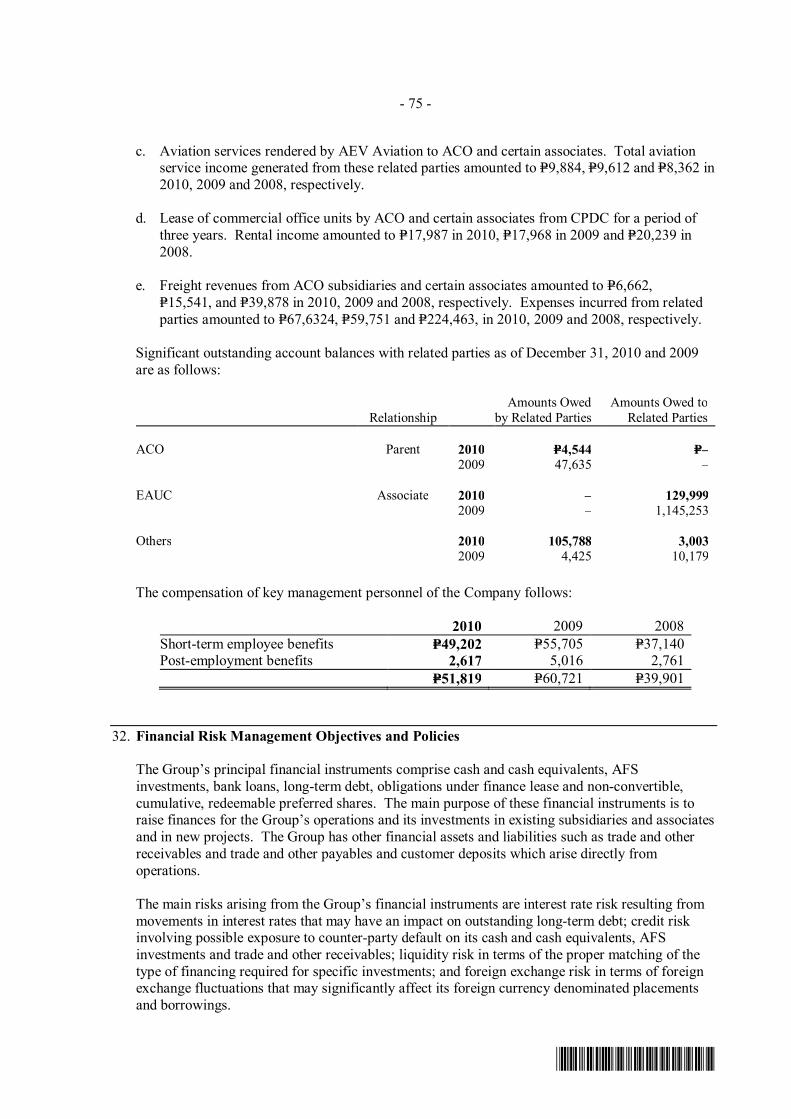
- 75 -
*SGVMC409510*
c. Aviation services rendered by AEV Aviation to ACO and certain associates. Total aviation service income generated from these related parties amounted to P=9,884, P=9,612 and P=8,362 in 2010, 2009 and 2008, respectively.
d. Lease of commercial office units by ACO and certain associates from CPDC for a period of three years. Rental income amounted to P=17,987 in 2010, P=17,968 in 2009 and P=20,239 in 2008.
e. Freight revenues from ACO subsidiaries and certain associates amounted to P=6,662, P=15,541, and P=39,878 in 2010, 2009 and 2008, respectively. Expenses incurred from related parties amounted to P=67,6324, P=59,751 and P=224,463, in 2010, 2009 and 2008, respectively.
Significant outstanding account balances with related parties as of December 31, 2010 and 2009 are as follows:
Relationship Amounts Owed
by Related Parties Amounts Owed to
Related Parties ACO Parent 2010 P=4,544 P=– 2009 47,635 – EAUC Associate 2010 – 129,999 2009 – 1,145,253 Others 2010 105,788 3,003 2009 4,425 10,179
The compensation of key management personnel of the Company follows:
2010 2009 2008 Short-term employee benefits P=49,202 P=55,705 P=37,140 Post-employment benefits 2,617 5,016 2,761 P=51,819 P=60,721 P=39,901
32. Financial Risk Management Objectives and Policies
The Group’s principal financial instruments comprise cash and cash equivalents, AFS investments, bank loans, long-term debt, obligations under finance lease and non-convertible, cumulative, redeemable preferred shares. The main purpose of these financial instruments is to raise finances for the Group’s operations and its investments in existing subsidiaries and associates and in new projects. The Group has other financial assets and liabilities such as trade and other receivables and trade and other payables and customer deposits which arise directly from operations. The main risks arising from the Group’s financial instruments are interest rate risk resulting from movements in interest rates that may have an impact on outstanding long-term debt; credit risk involving possible exposure to counter-party default on its cash and cash equivalents, AFS investments and trade and other receivables; liquidity risk in terms of the proper matching of the type of financing required for specific investments; and foreign exchange risk in terms of foreign exchange fluctuations that may significantly affect its foreign currency denominated placements and borrowings.

- 76 -
*SGVMC409510*
Interest rate risk The Group’s exposure to market risk for changes in interest rates relates primarily to its long-term debt obligations. To manage this risk, the Group determines the mix of its debt portfolio as a function of the level of current interest rates, the required tenor of the loan, and the general use of the proceeds of its various fund raising activities. As of December 31, 2010, 1.8% of the Group’s long-term debt had floating interest rates ranging from 2.46% to 6.71%, and 98.2% are with fixed rates ranging from 5.23% to 10.10%. As of December 31, 2009, 5.4% of the Group’s long-term debt had floating interest rates ranging from 4.2% to 9.0%, and 94.6% are with fixed rates ranging from 6.75% to 10.02%. The following tables set out the carrying amount, by maturity, of the Group’s financial instruments that are exposed to cash flow interest rate risk: December 31, 2010
Less than
1 year 1-5 years More than
5 years Total Long-term debt
Floating rate P=821,333 P=431,100 P=– P=1,252,433 Fixed rate 730,689 16,890,764 5,025,901 22,647,354
Payable to preferred shareholder of a subsidiary - floating 13,797 62,970 – 76,767
Redeemable preferred shares – Fixed rate 1,000,000 500,000 – 1,500,000
P=2,565,819 P=17,884,834 P=5,025,901 P=25,476,554
December 31, 2009
Less than
1 year 1-5 years More than
5 years Total Long-term debt
Floating rate P=383,000 P=616,000 P=– P=999,000 Fixed rate 339,866 14,128,162 3,479,674 17,947,702
Payable to preferred shareholder of a subsidiary - floating 11,263 76,767 – 88,030
Redeemable preferred shares Fixed rate – 1,520,176 – 1,520,176
Obligations under finance lease - floating 6,222 25,346 – 31,568
P=740,351 P=16,366,451 P=3,479,674 P=20,586,476 Interest on financial instruments classified as floating rate is repriced at intervals of less than one year. Interest on financial instruments classified as fixed rate is fixed until the maturity of the instrument. The other financial instruments of the Group that are not included in the above tables are non-interest bearing and are therefore not subject to interest rate risk.

- 77 -
*SGVMC409510*
The interest expense recognized during the period is as follows:
2010 2009 2008 Long-term debt (see Note 18) P=1,650,956 P=1,505,184 P=229,157 Obligations under finance lease
(see Note 20) 5,122,830 1,245,963 20,168 Bank loans (see Note 16) 418,466 321,855 297,488 Advances from related parties
(see Note 31) 32,510 37,737 4,391 Long-term obligation on PDS 35,099 35,644 36,128 Customers’ deposits (see Note 19) 3,768 5,712 5,462 7,263,629 3,152,095 592,794 Interest expense attributable to
discontinued operations (see Note 14) (228,878) (74,101) (40,883)
P=7,034,751 P=3,077,994 P=551,911 The interest income recognized during the period is as follows:
2010 2009 2008 Cash and cash equivalents P=176,629 P=403,641 P=520,609 Intercompany deposits 116,325 113,096 124,018 292,954 516,737 644,627 Interest income attributable to
discontinued operations (Note 14) (5,263) (12,851) (13,050)
P=287,691 P=503,886 P=631,577 Interest on redeemable preferred shares amounting to P=126,646, P=161,596 and P=168,575 in 2010, 2009 and 2008, respectively, are recognized as dividends on redeemable preferred shares in the consolidated statements of income. The following table demonstrates the sensitivity to a reasonably possible change in interest rates, with all other variables held constant, of the Group’s profit before tax (through the impact on floating rate borrowings) as of December 31, 2010 and 2009:
Increase (decrease)
in basis points Effect on income
before tax 2010 100 (P=13,292)
(50) 6,646
2009 100 (11,186) (50) 5,593
The Group’s sensitivity to an increase/decrease in interest rates pertaining to derivative instruments is expected to be insignificant in 2010 and 2009 due to their short-term maturities and immateriality relative to the total assets and liabilities of the Group.
There is no other impact on the Group’s equity other than those already affecting the consolidated statement of income.

- 78 -
*SGVMC409510*
Foreign exchange risk The foreign exchange risk of the Group pertains significantly to its foreign currency denominated borrowings, including obligations under finance lease, which are mainly in US Dollar. To manage its foreign exchange risk, stabilize cash flows and improve investment and cash flow planning, the Group enters into foreign currency forward contracts aimed at reducing and/or managing adverse impact of changes in foreign exchange rates on financial performance and cash flows. As of December 31, 2010 and 2009, foreign currency denominated borrowings account for 30.8% and 37.2%, respectively, of total consolidated borrowings.
The following table presents the Group’s foreign currency denominated assets and liabilities: 2010 2009
US Dollar Peso
Equivalent1 US Dollar Peso
Equivalent2 Loans and receivables Cash and cash equivalents $10,801 P=473,494 $13,090 P=604,773 Trade and other receivables 9,233 404,775 7,420 342,804 Amounts owed by related parties 13,402 587,544 2,636 121,783 Restricted cash – – 12,130 560,423 Total Financial Assets $33,436 P=1,465,813 $35,276 P=1,629,783
Other financial liabilities Bank loans $4,750 P=208,240 $83,450 P=3,855,390 Trade and other payables 11,436 501,354 16,494 762,023 Advances from shipping
principals 90 3,946 212 9,794 Amounts owed to a related party – – 607 28,043 Obligations under finance lease 563,388 24,698,930 522,138 24,122,776 Total Financial Liabilities $579,664 P=25,412,470 $622,901 P=28,778,026 Net foreign currency
denominated liabilities ($546,228) (P=23,946,657) ($587,625) (P=27,148,243) 1USD1= P=43.84 2USD1= P=46.20
The following table demonstrates the sensitivity to a reasonably possible change in the US dollar exchange rates, with all other variables held constant, of the Group’s profit before tax as of December 31, 2010 and 2009.
Increase (decrease) in US dollar
rate against the Peso
Effect on income before
income tax 2010 US dollar denominated accounts US Dollar strengthens by 5% (P=1,197,333) US Dollar weakens by 5% 1,197,333 2009 US dollar denominated accounts US Dollar strengthens by 5% (P=1,357,412) US Dollar weakens by 5% 1,357,412
The increase in US Dollar rate represents depreciation of Philippine peso while the decrease in US Dollar rate represents appreciation of Philippine peso.

- 79 -
*SGVMC409510*
The Group’s sensitivity to an increase/decrease in foreign currency pertaining to derivative instruments is expected to be insignificant in 2010 and 2009 due to their short-term maturities and immateriality relative to the total assets and liabilities of the Group. There is no other impact on the Group’s equity other than those already affecting the consolidated statements of income. Equity price risk Equity price risk is the risk that the fair value of traded equity instruments decreases as the result of the changes in the levels of equity indices and the value of the individual stocks. As of December 31, 2010 and 2009, the Group’s exposure to equity price risk is minimal. Credit risk For its cash investments (which includes those that are restricted), AFS investments, derivative assets, and receivables, the Group’s credit risk pertains to possible default by the counterparty, with a maximum exposure equal to the carrying amount of these financial assets. With respect to cash and AFS investments, the risk is mitigated by the short-term and or liquid nature of its cash investments mainly in bank deposits and placements, which are placed with financial institutions and entities of high credit standing. With respect to receivables, credit risk is controlled by the application of credit approval, limit and monitoring procedures. It is the Group’s policy to enter into transactions with a diversity of credit-worthy parties to mitigate any significant concentration of credit risk. The Group ensures that sales are made to customers with appropriate credit history and has internal mechanism to monitor the granting of credit and management of credit exposures. The Group has no significant concentration of credit risk to a counterparty or group of counterparties.
The credit quality per class of financial assets that are neither past due nor impaired is as follows: December 31, 2010
Neither past due nor impaired Past due or
individually impaired Total High Medium Unrated
Loans and receivables Cash and cash equivalents P=26,097,203 P=– P=– P=– P=26,097,203 Trade and other receivables
Trade receivables Banking – 6,839,555 80,541 151,128 7,071,224 Power 2,532,982 1,650,295 198,022 1,893,601 6,274,900 Food manufacturing 102,856 532,689 30,046 274,898 940,489 Holding and others 483,810 – – 6,871 490,681 Transport services 426,067 – – – 426,067
Receivable from insurance and other claims 7,484
–
–
– 7,484
Other receivables 851,924 93,082 3,944 51,271 1,000,221 AFS
Quoted shares of stocks 33,020 – – – 33,020 Unquoted shares of stocks 37,794 – – – 37,794
Financial asset at FVPL Derivative asset 7,670 – – – 7,670 P=30,580,810 P=9,115,621 P=312,553 P=2,377,769 P=42,386,753

- 80 -
*SGVMC409510*
December 31, 2009
Neither past due nor impaired Past due or
individually impaired Total High Medium Unrated
Loans and receivables Cash and cash equivalents P=5,582,228 P=– P=– P=– P=5,582,228 Trade and other receivables
Trade receivables Power 1,100,562 2,094,347 203,142 314,343 3,712,394 Transport services 1,002,103 163,094 382,607 515,086 2,062,890 Food manufacturing 70,287 272,841 258,322 215,281 816,731 Holding and others 171 – – 624 795
Receivable from insurance and other claims 18,525 12,026 – 193,105 223,656
Other receivables 388,555 97,929 12,226 716,774 1,215,484 Restricted cash 560,423 – – – 560,423 AFS
Quoted shares of stocks 34,445 – – – 34,445 Unquoted shares of stocks 50,490 – – – 50,490
Financial asset at FVPL Derivative asset 846 – – – 846 P=8,808,635 P=2,640,237 P=856,297 P=1,955,213 P=14,260,382
High quality receivables pertain to receivables from related parties and customers with good favorable credit standing. Medium quality receivables pertain to receivables from customers that have history of sliding beyond the credit terms but pay a week after being past due. Unrated receivables are accounts from new customers on which the Group has no basis yet as far as their payment habit is concerned.
The Group evaluated its cash and cash equivalents and restricted cash as high quality financial assets since these are placed in financial institutions of high credit standing. With respect to AFS investments and derivative asset, the Group evaluates the counterparty’s external credit rating in establishing credit quality.
The aging analysis per class of financial assets that are past due but not impaired is as follows:
December 31, 2010
Neither past due nor
impaired
Past due but not impaired
Impaired Total Less than
30 days 31 days
to 1 year
Over 1 year up to
3 years Over
3 years Loans and receivables Cash and cash equivalents P=26,097,203 P=– P=– P=– P=– P=– P=26,097,203 Trade and other receivables
Trade receivables Banking 6,920,096 691 49,860 – – 100,577 7,071,224 Power 4,381,299 455,562 1,061,823 – – 376,216 6,274,900 Food manufacturing 665,591 219,996 23,770 – – 31,132 940,489 Holding and others 483,810 – 6,871 – – – 490,681 Transport services 426,067 – – – – – 426,067
Receivable from insurance and other claims 7,484
–
–
–
–
– 7,484 Other receivables 948,950 9,453 41,122 – 696 1,000,221
AFS Quoted shares of stocks 33,020 – – – – – 33,020 Unquoted shares of stocks 37,794 – – – – – 37,794 Financial asset at FVPL Derivative asset 7,670 – – – – – 7,670 P=40,008,984 P=685,701 P=1,183,446 P=– P=– P=508,621 P=42,386,753

- 81 -
*SGVMC409510*
December 31, 2009
Neither past due nor
impaired
Past due but not impaired
Impaired Total Less than
30 days 31 days
to 1 year
Over 1 year up to
3 years Over
3 years Loans and receivables Cash and cash equivalents P=5,582,228 P=– P=– P=– P=– P=– P=5,582,228 Trade and other receivables
Trade receivables Power 3,398,051 174,088 34,779 – – 105,476 3,712,394 Transport services 1,547,804 208,224 72,753 – – 234,109 2,062,890 Food manufacturing 601,450 168,708 14,988 – – 31,585 816,731 Holding and others 171 – 624 – – – 795
Receivable from insurance and other claims 30,551 – 172,481
–
– 20,624 223,656 Other receivables 498,710 173,848 537,605 – – 5,321 1,215,484
Restricted cash 560,423 – – – – – 560,423 AFS Quoted shares of stocks 34,445 – – – – – 34,445 Unquoted shares of stocks 50,490 – – – – – 50,490 Financial asset at FVPL Derivative asset 846 – – – – – 846 P=12,305,169 P=724,868 P=833,230 P=– P=– P=397,115 P=14,260,382
Trade and other receivables that are individually determined to be impaired at the balance sheet date relate to debtors that are in significant financial difficulties and have defaulted on payments and accounts under dispute and legal proceedings. Liquidity risk Liquidity risk is the risk that an entity in the Group will be unable to meet its obligations as they become due. The Group, except CSB (which has a separate risk management policy), manages liquidity risk by effectively managing its working capital, capital expenditure and cash flows, making use of a centralized treasury function to manage pooled business unit cash investments and borrowing requirements. Currently the Group, except CSB, is maintaining a positive cash position, conserving the Group’s cash resources through renewed focus on working capital improvement and capital reprioritization. The Group, except CSB, meets its financing requirements through a mixture of cash generated from its operations and short-term and long-term borrowings. Adequate banking facilities and reserve borrowing capacities are maintained. The Group is in compliance with all of the financial covenants per its loan agreements, none of which is expected to present a material restriction on funding or its investment policy in the near future. The Group has sufficient undrawn borrowing facilities, which could be utilized to settle obligations. In managing its long-term financial requirements, the policy of the Group, excluding CSB, is that not more than 25% of long term borrowings should mature in any twelve-month period. As of December 31, 2010 and 2009, the portion of the total long-term debt that will mature in less than one year is 4.79% and 3.31%, respectively. For its short-term funding, the Group’s policy is to ensure that there are sufficient working capital inflows to match repayments of short-term debt. Cash and cash equivalents and trade and other receivables, which are all short-term in nature, have balances of P=24,279,760 and P=8,731,798 as of December 31, 2010 and P=5,582,228 and P=7,634,835 as of December 31, 2009, respectively (see Notes 4 and 5). These financial assets will be used to fund short-term and operational liquidity needs of the Group.

- 82 -
*SGVMC409510*
The table below analyses the financial liabilities of the Group, except CSB, into relevant maturity groupings based on the remaining period at the balance sheet date to the contractual maturity. The amounts disclosed in the table are the contractual undiscounted cash flows and include interest.
December 31, 2010
Total carrying
value
Contractual undiscounted payments
Total On demand Less than
1 year 1-5 years > 5 years Financial liabilities: Operating Trade and other payables P=6,627,810 P=6,627,810 P=– P=6,627,810 P=– P=– Customers’ deposits 2,011,285 2,019,151 100 41,402 37,888 1,939,761 Financing Bank loans 5,667,340 5,699,055 – 5,699,055 – – Derivative liability – – – – – – Long-term debt 21,775,613 33,289,059 – 3,353,595 24,233,249 5,702,215 Obligations under finance lease 48,305,116 111,394,573 – 1,102,080 24,146,573 86,145,920 Long-term obligation on PDS 282,559 680,000 – 40,000 200,000 440,000 Redeemable preferred shares 1,500,000 1,710,000 – 1,125,000 585,000 – Others Payable to preferred
shareholder of a subsidiary 76,767 124,280
– 31,070
93,210 – Total P=86,246,490 P=161,543,928 P=100 P=18,020,012 P=49,295,920 P=94,227,896
December 31, 2009
Total carrying
value
Contractual undiscounted payments
Total On demand Less than
1 year 1-5 years > 5 years Financial liabilities: Operating Trade and other payables P=10,037,181 P=10,037,181 P=– P=10,037,181 P=– P=– Customers’ deposits 1,786,681 1,794,900 – 59,164 27,270 1,708,466 Financing Bank loans 9,035,038 9,067,068 – 9,067,068 – – Derivative liability 16,476 16,476 – 16,476 – – Long-term debt 18,946,702 27,026,408 – 2,241,685 19,910,044 4,874,679 Obligations under finance lease 45,617,732 115,426,307 – 1,138,866 25,927,841 88,359,600 Long-term obligation on PDS 287,460 720,000 – 40,000 200,000 480,000 Redeemable preferred shares 1,520,176 1,862,363 – 125,000 1,737,363 – Others Payable to preferred
shareholder of a subsidiary 88,030 155,350 – 31,070
124,280 – Total P=87,335,476 P=166,106,053 P=– P=22,756,510 P=47,926,798 P=95,422,745
CSB closely monitors the current and prospective maturity structure of its resources and liabilities and the market condition to guide pricing and asset/liability allocation strategies to manage its liquidity risks. In addition, CSB manages liquidity risk by holding sufficient liquid assets of appropriate quality to ensure short-term funding requirements are met and by maintaining a balanced loan portfolio which is repriced on a regular basis. It seeks to maintain sufficient liquidity to take advantage of interest rate and exchange rate opportunities when they arise. It is also the policy of the Group to closely monitor CSB’s risk exposure.

- 83 -
*SGVMC409510*
Liquidity is monitored by CSB on a daily basis. The table below shows the maturity profile of the bank’s financial assets and liabilities, based on its internal methodology that manages liquidity based on expected undiscounted cash flows, rather than contractual undiscounted cash flows as of December 31, 2010:
Up to 1 month
Over 1 to 3 months
Over 3 months to 1 year Beyond 1 year Total
Financial Assets Cash and other cash items P=139,187 P=– P=– P=– P=139,187 Due from BSP 1,373,701 116,545 38,451 – 1,528,697 Due from other banks 201,095 536 2,410 – 204,041 AFS investments – – – 4,500 4,500 Loans and receivables 631,103 410,010 6,133,828 652,179 7,827,120 Refundable deposits – – – 2,041 2,041
2,345,086 527,091 6,174,689 658,720 9,705,586 Financial Liabilities Deposit liabilities 1,394,503 50,746 539,166 3,980,341 5,964,756 Bills payable 11,681 23,363 258,981 2,110,504 2,404,529 Accounts payable and accrued expenses 36,529 14,477 51,752 45,244 148,001 Other liabilities 9,850 – – – 9,850
1,452,563 88,585 849,899 6,136,089 8,527,136 P=892,523 P=438,506 P=5,324,790 (P=5,477,369) P=1,178,450
Capital management Capital includes equity attributable to the equity holders of the parent. The primary objective of the Group’s capital management is to ensure that it maintains a strong credit rating and healthy capital ratios in order to support its business and maximize shareholder value. The Group manages its capital structure and makes adjustments to it, in light of changes in economic conditions. To maintain or adjust the capital structure, the Group may adjust the dividend payment to shareholders, return capital to shareholders or issue new shares. Certain entities within the Group that are registered with the BOI are required to raise a minimum amount of capital in order to avail of their registration incentives. As of December 31, 2010 and 2009, these entities have complied with this requirement as applicable (see Note 34). No changes were made in the objectives, policies or processes during the years ended December 31, 2010, 2009 and 2008. The Group monitors capital using a gearing ratio, which is net debt divided by equity plus net debt. The Group’s policy is to keep the gearing ratio at 70% or below at the consolidated level. The Group determines net debt as the sum of interest-bearing short-term and long-term obligations (comprised of long-term debt, obligations under finance lease, redeemable preferred shares and payable to preferred shareholder of a subsidiary) less cash and short-term deposits and temporary advances to related parties.

- 84 -
*SGVMC409510*
Gearing ratios of the Group as of December 31, 2010 and 2009 are as follows:
2010 2009 Bank loans P=7,347,281 P=9,035,038 Long-term loans 73,781,670 66,172,640 Temporary advances from (to) related parties (2,850) 47,635 Cash and cash equivalents (26,097,203) (5,582,228) Net debt (a) 55,028,898 69,673,085 Equity 78,317,428 54,642,211 Equity and net debt (b) P=133,346,326 P=124,315,296 Gearing ratio (a/b) 41.27% 56.05%
33. Financial Instruments Set out below is a comparison by category of the carrying amounts and fair values of all of the Group’s financial instruments.
2010 2009
Carrying Amount
Fair Value
Carrying Amount
Fair Value
Financial assets Loans and receivables
Cash and cash equivalents Cash in bank P=9,150,763 P=9,150,763 P=3,947,769 P=3,947,769 Short-term deposits 16,946,440 16,946,440 1,634,459 1,634,459 26,097,203 26,097,203 5,582,228 5,582,228 Trade and other receivables Trade receivables
Banking 6,970,647 6,970,647 − − Power 5,897,988 5,897,988 3,606,224 3,606,224 Transportation services 426,067 426,067 1,803,530 1,803,530 Food manufacturing 909,357 909,357 785,145 785,145 Holding and others 490,680 490,680 795 795
Receivable from insurance and other claims 7,484 7,484 223,656 223,656
Other receivables 1,000,221 1,000,221 1,215,485 1,215,485 Restricted cash − − 560,423 560,423
41,799,647 41,799,647 13,777,486 13,777,486 AFS investments
Quoted shares of stock 33,020 33,020 34,445 34,445 Unquoted shares of stock 37,794 37,794 50,490 50,490 70,814 70,814 84,935 84,935
Financial asset at FVPL Derivative asset 7,670 7,670 846 846
P=41,878,131 P=41,878,131 P=13,863,267 P=13,863,267
(Forward)
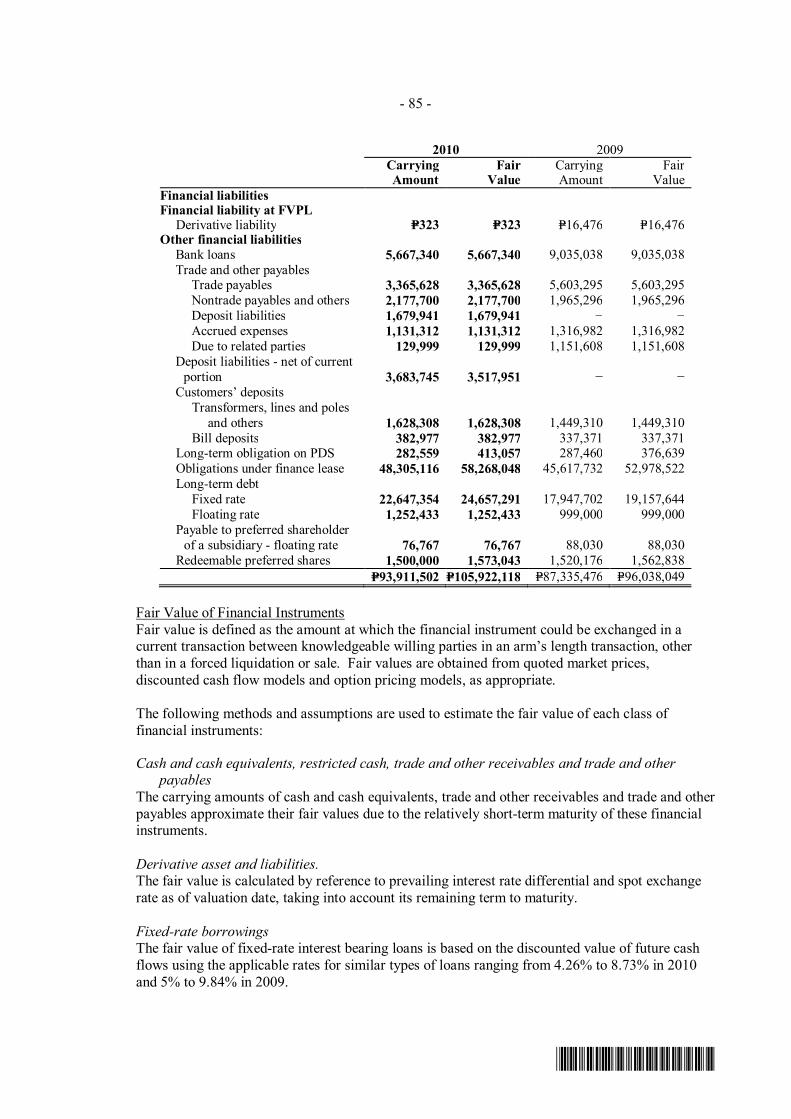
- 85 -
*SGVMC409510*
2010 2009
Carrying Amount
Fair Value
Carrying Amount
Fair Value
Financial liabilities Financial liability at FVPL
Derivative liability P=323 P=323 P=16,476 P=16,476 Other financial liabilities
Bank loans 5,667,340 5,667,340 9,035,038 9,035,038 Trade and other payables
Trade payables 3,365,628 3,365,628 5,603,295 5,603,295 Nontrade payables and others 2,177,700 2,177,700 1,965,296 1,965,296 Deposit liabilities 1,679,941 1,679,941 − − Accrued expenses 1,131,312 1,131,312 1,316,982 1,316,982 Due to related parties 129,999 129,999 1,151,608 1,151,608
Deposit liabilities - net of current portion 3,683,745 3,517,951 − −
Customers’ deposits Transformers, lines and poles
and others 1,628,308 1,628,308 1,449,310 1,449,310 Bill deposits 382,977 382,977 337,371 337,371
Long-term obligation on PDS 282,559 413,057 287,460 376,639 Obligations under finance lease 48,305,116 58,268,048 45,617,732 52,978,522 Long-term debt
Fixed rate 22,647,354 24,657,291 17,947,702 19,157,644 Floating rate 1,252,433 1,252,433 999,000 999,000
Payable to preferred shareholder of a subsidiary - floating rate 76,767 76,767 88,030 88,030
Redeemable preferred shares 1,500,000 1,573,043 1,520,176 1,562,838 P=93,911,502 P=105,922,118 P=87,335,476 P=96,038,049
Fair Value of Financial Instruments Fair value is defined as the amount at which the financial instrument could be exchanged in a current transaction between knowledgeable willing parties in an arm’s length transaction, other than in a forced liquidation or sale. Fair values are obtained from quoted market prices, discounted cash flow models and option pricing models, as appropriate. The following methods and assumptions are used to estimate the fair value of each class of financial instruments:
Cash and cash equivalents, restricted cash, trade and other receivables and trade and other payables
The carrying amounts of cash and cash equivalents, trade and other receivables and trade and other payables approximate their fair values due to the relatively short-term maturity of these financial instruments. Derivative asset and liabilities. The fair value is calculated by reference to prevailing interest rate differential and spot exchange rate as of valuation date, taking into account its remaining term to maturity. Fixed-rate borrowings The fair value of fixed-rate interest bearing loans is based on the discounted value of future cash flows using the applicable rates for similar types of loans ranging from 4.26% to 8.73% in 2010 and 5% to 9.84% in 2009.

- 86 -
*SGVMC409510*
Variable-rate borrowings Where the repricing of the variable-rate interest-bearing instruments is frequent (i.e., three-month repricing), the carrying value approximates the fair value. Otherwise, the fair value is determined by discounting the principal plus the known interest payment using current market rates. Long-term obligation on PDS The fair value of the long-term obligations on power distribution system is calculated by discounting expected future cash flows at prevailing market rates. Discount rates used in discounting the obligation ranges from 2.53% to 7.60% in 2010 and 4.82% to 9.00% in 2009. Obligations under finance lease The fair value of the finance lease obligation was calculated by discounting future cash flows using discount rates of 5.96% to 9.88% for dollar payments and 2.95% to 10.33% for peso payments in 2010 and 5.00% to 9.03% for dollar payments and 9.00% to 14.00% for peso payments in 2009.
Customers’ deposits The fair value of bill deposits approximate the carrying values as these deposits earn interest at the prevailing market interest rate in accordance with regulatory guidelines. The timing and related amounts of future cash flows relating to transformer and lines and poles deposits cannot be reasonably and reliably estimated for purposes of establishing their fair values using an alternative valuation technique. Redeemable preferred shares The fair values of the redeemable preferred shares are based on the discounted value of future cash flows using the applicable rates for similar types of borrowings. Discount rates ranging from 4.26% to 5.99% in 2010 and 4.80% to 7.78% in 2009 were used in calculating its fair value. AFS investments The fair values of AFS investments are based on quoted market prices, except for unquoted equity shares which are carried at cost since fair values are not readily determinable. Derivative asset and liabilities The Group enters into derivative financial instruments with financial institutions with investment grade credit ratings. Derivative valued using a valuation technique with market observable inputs pertains to a foreign exchange forward contract. The most applied valuation technique is forward pricing. The model incorporates various inputs including the credit quality of counterparty and foreign exchange spot and forward rates. Fair Value Hierarchy The Group uses the following hierarchy for determining the fair value of financial instruments by valuation technique: Level 1: quoted (unadjusted) prices in active markets for identical assets or liabilities Level 2: other techniques for which all inputs which have a significant effect on the recorded
fair value are observable, either directly or indirectly Level 3: techniques which use inputs which have a significant effect on the recorded fair value
that are not based on observable market data

- 87 -
*SGVMC409510*
As of December 31, 2010 and 2009, the Group held the following financial instruments that are measured and carried at fair value:
December 31, 2010 Total Level 1 Level 2 Level 3 AFS investments P=33,020 P=33,020 P=− P=− Derivative asset 7,670 − 7,670 − Derivative liability (323) − (323) − P=40,367 P=33,020 P=7,347 P=−
December 31, 2009 Total Level 1 Level 2 Level 3 AFS investments P=34,445 P=34,445 P=− P=− Derivative asset 846 − 846 − Derivative liability (16,476) − (16,476) − P=18,815 P=34,445 (P=15,630) P=− During the year ended December 31, 2010 and 2009, there were no transfers between level 1 and level 2 fair value measurements and transfers into and out of level 3 fair value measurement. Derivative financial instruments The Group enters into non-deliverable short-term forward contracts with counterparty banks to manage foreign currency risks associated with foreign currency-denominated liabilities and purchases. As of December 31, 2010 and 2009, the Group has outstanding non-deliverable buy Dollar and sell Peso forward exchange contracts with counterparty banks with an aggregate notional amount of $56.0 million and $78.5 million, respectively and remaining maturities of 1 month to 8 months and 1 month to 10 months, respectively. The forward rates related to the forward contracts ranged from P=43.84 to P=44.13 per US$ and P=46.40 to P=47.14 per US$1 as at December 31, 2010 and 2009, respectively. The Group recognized derivative asset relating to these contracts amounting to P=5,328 as of December 31, 2010. The Group also recognized derivative asset and liability related to these contracts amounting to P=846 and P=15,286, respectively, as of December 31, 2009. As of December 31, 2010 and 2009, the Group also has outstanding non-deliverable sell US Dollar buy EURO short-term forward exchange contracts with a counterparty bank with an aggregate notional amount of €2.24 million and €1.83 million, respectively and remaining maturities of 1 month to 8 months and less than 1 month to 3 months, respectively. As at December 31, 2010 and 2009, the forward rates related to the forward contracts ranges from €1.279 to €1.3291 per US$1 and €1.4347 to €1.4381 per US$1, respectively. As of December 31, 2010, the Group recognized derivative asset and liability relating to these contracts amounting to P=2,340 and P=323, respectively. As of December 31, 2009, the Group recognized derivative liability related to these contracts amounting to P=1,190.

- 88 -
*SGVMC409510*
The movements in fair value changes of all derivative instruments for the year ended December 31, 2010 and 2009 are as follows:
2010 2009 At beginning of year (P=15,630) P=− Net changes in fair value of derivatives not
designated as accounting hedges (40,041) (15,630) Fair value of settled instruments 63,018 – At end of year P=7,347 (P=15,630)
The loss from the net fair value changes relating to the forward contracts amounting to P=40.0 million in 2010 and P=15.6 million in 2009 are included as “Foreign exchange gains - net” under “Other income - net”.
34. Registrations with the Department of Energy and BOI
a. In accordance with its registration with the Department of Energy (DOE) under RA 7156 known as "Mini Hydro Electric Power Incentives Act" as mini hydro electric power developer, HI is currently entitled to ITH on the four (4) power plants located in Mintal, Tugbok, Davao City, which were acquired from PSALM, transferred on January 18, 2005 and started commercial operations on January 19, 2005. ITH on the four (4) plants started on September 28, 2005. With the effectivity of RA 9136 known as “Electric Power Industry Reform Act (EPIRA) of 2001”, HI has updated its registration with the BIR from VAT Exempt to VAT Zero Rated effective April 10, 2003.
b. On June 19, 2009, the BOI approved APRI’s application as a new operator of the Tiwi-Makban Power Plant and granted APRI a pioneer status under the Omnibus Investments Code of 1987. The following are the incentives granted by BOI to APRI:
• ITH for six (6) years from June 2009 or actual start of commercial operations/selling, whichever is earlier but in no case earlier than the date of registration. The ITH shall be limited only to sales/revenue generated from the sales of electricity of the power plant. Revenues generated from the sales of carbon emission reduction credits are also entitled to ITH.
• For the first five (5) years from date of registration, APRI shall be allowed an additional deduction from taxable income of fifty percent (50%) of the wages corresponding to the increment in the number of direct labor for skilled and unskilled workers in the year of availment as against the previous year if the project meets the prescribed ratio of capital equipment to the number of workers set by BOI of $10,000 to one worker and provided that this incentive shall not be availed of simultaneously with the ITH.
• Employment of foreign nationals. This may be allowed in supervisory, technical or advisory positions for five (5) years from date of registration.
• Importation of consigned equipment for a period of ten (10) years from the date of registration, subject to the posting of re-export bond.
• APRI may qualify to import capital requirement, spare parts and accessories at zero (0%) duty rate from the date of registration to June 16, 2011 pursuant to Executive Order (EO) No. 528 and its Implementing Rules and Regulations.

- 89 -
*SGVMC409510*
The following are the significant specific terms and conditions for the availment of the ITH:
• APRI shall start commercial operations in June 2009. • APRI shall increase its authorized, subscribed and paid-up capital stock to at least
P=5,700,000 and shall submit proof of compliance prior to availment of ITH. This condition was superseded by a BOI letter dated September 18, 2009 clarifying that for the purposes of BOI registration, the BOI has redefined the term equity such that, it shall now cover not only the paid-up capital stock but also other items in the Balance Sheet of the Audited Financial Statements; i.e., additional paid in capital stock, retained earnings. Hence, if APRI has at least 25% stockholders equity as shown in the Audited Financial Statements, it is deemed complied with the 25% equity requirement and is no longer required to increase its capital stock.
• APRI shall secure a Certificate of Compliance from ERC prior to start of commercial operations.
• APRI is enjoined to undertake Corporate Social Responsibility Projects/Activities
The BOI incentives availed by APRI amounted to P=3.18 billion in 2010 and P=636.6 million in 2009.
c. On December 23, 2009, the BOI pre-approved TLI’s application for registration as a new operator of the power plant on a non-pioneer status. Once approved, TLI will be entitled with the following incentives:
• ITH for a period of four (4) years without extension from January 1, 2010 or actual start of operation, whichever is earlier but in no case earlier than the date of registration. The ITH incentives shall be limited only to the sales/revenue generated from the sale of electricity of the power plant.
• For the first five (5) years from date of registration, TLI shall be allowed an additional deduction from taxable income of 50% of the wages corresponding to the increment in number of direct labor for skilled and unskilled workers in the year of availment as against the previous year if the project meets the prescribed ratio of capital equipment to the number of workers set by the Board of US$10 to one (1) worker and provided that this incentive shall not be availed of simultaneously with the ITH.
• Employment of foreign nationals may be allowed in supervisory, technical or advisory positions for five (5) years from date of registration. The president, general manager and treasurer of foreign-owned registered firms or their equivalent shall not be subject to the foregoing limitations.
• Importation of consigned equipment for a period of ten (10) years from date of registration, subject to the posting of re-export bond.
On February 26, 2010, TLI submitted to BOI all its requirements with a commitment to comply with the 25% minimum equity requirement of P=490.0 million prior to the availment of ITH incentives. As of December 31, 2010, TLI has complied with the minimum equity required through deposits for future stocks subscription received from TPI on September 24, 2010.
d. PANC is registered with the BOI on its swine finishing farm expansion as “expanding
producer of hogs” and its swine breeder farm expansion as “new producer of hogs” on a nonpioneer status under the Omnibus Investment Code of 1987. The registration of the swine finishing farm expansion entitles PANC’s swine finishing farm with ITH for a period of three (3) years from the actual start of commercial operations, or January 2009, whichever comes first, but in no case earlier than the date of registration. The registration of the swine breeder

- 90 -
*SGVMC409510*
farm expansion entitles PANC’s swine finishing farm with ITH for a period of four (4) years starting from January 2010 or actual start of commercial operations whichever comes first but in no case earlier than date of registration.
e. PILMICO is registered with the BOI on its new feedmill plant as “new producer of animal feeds on a non-pioneer status with pioneer incentives” under the Omnibus Investment Code of 1987. The registration entitles the PILMCO’s new feedmill plant, among others, with ITH for a period of six (6) years from July 2008 or actual start of commercial operation, whichever is earlier, but in no case earlier than the date of registration. PILMICO’s feedmill plant started commercial operations on September 2008.
35. Rate Regulation, Power Supply and Other Agreements a. Certain subsidiaries are subject to the ratemaking regulations and regulatory policies by the
ERC.
b. DLP, CLP and SEZC have contracts with NPC for the purchase of electricity. Pursuant to Section 8 of RA No. 9136, National Transmission Corporation (Transco) was created and has assumed the electrical transmission functions of NPC. The material terms of the contracts are as follows:
Term of Agreement with NPC Contract Energy
(MWH year) DLP Ten years; expiring in December 2015 1,238,475 CLP Ten years; expiring in December 2015 116,906 SEZC Two-and-a-half years; renewed in
March 2008 expiring in March 2011 90,000 Total power purchases from the NPC and Transco, net of discounts, recognized in the consolidated statements of income, amounted to P=6.61 billion in 2010, P=7.1 billion in 2009 and P=5.8 billion in 2008. The outstanding payable to NPC and Transco on purchased power, presented as part of the “Trade and other payables” account in the consolidated balance sheets amounted to P=468.1 million and P=601.1 million as of December 31, 2010 and 2009, respectively (see Note 17).
c. Certain subsidiaries of PHC have Electric Power Supply Agreements with various corporations to supply or sell power and energy produced by the mini hydroelectric power plants. The maturity of these agreements varies from one taker to another with the nearest that matured in 2007 and farthest in 2018. All agreements provide for renewals or extensions subject to mutually agreed upon terms and conditions by both parties.
d. AJBTC, JMI and AJMSI (Agents) have outstanding agreements with foreign shipping principals, wherein the Agents render manning and crew management services consisting primarily of the employment of crew for the principals’ vessels. As such, the principals have authorized the Agents to act on their behalf with respect to all matters relating to the manning of the vessels. Total service fees revenues recognized in the consolidated statements of income from these agreements amounted to P=384.4 million in 2010, P=400.0 million in 2009 and P=387.8 million in 2008.

- 91 -
*SGVMC409510*
e. APRI Agreements Service Contract (SC) with Chevron Among the assumed contracts that APRI received from the APA is the SC with Chevron Geothermal Philippines Holdings, Inc. (CGPHI) which provides for the following:
• The SC is to provide for the exploration and exploitation to APRI of Geothermal
Resources in the Area of Interest described in the SC. • CGPHI shall be the sole contractor responsible to APRI for the execution of services for
the exploration and exploitation operations in accordance with the provisions of SC and, in accordance with the terms hereof, is hereby appointed as the sole contractor of NPC for such purposes in connection with the Area of Interest.
• CGPHI shall furnish technical assistance required for the exploration for and exploitation of Geothermal Resources in order to make geothermal steam available for utilization into electric power, and shall recover its operating costs and realizes its return solely from the sale of power produced from the Geothermal Energy.
• APRI shall provide and defray Philippine currency expenses to the extent hereinafter set forth necessary in the exploration for and exploitation of Geothermal Resources and Utilization of geothermal steam for electric power.
• APRI shall provide and install as its own expense and the with technological assistance of CGPHI as hereinafter provided, such plants, machineries and auxiliary works as may be necessary for the conversion of geothermal steam into electric power and distribution of such power.
In 2010 and 2009, total steam supply costs incurred by APRI amounted to P=3,542,806,508 and P=2,207,503,892, respectively. Lease Agreement with PSALM On May 25, 2009, APRI entered into a lease agreement with PSALM for a parcel of land owned by the latter on which a portion of the assets purchased under the APA is situated. The lease term is for a period of twenty-five (25) years commencing from the Closing Date as defined in the APA which falls on May 25, 2009. The rental fees for the whole term of 25 years amounting to P=492.0 million were paid in full after the receipt by APRI of the Certificate of Effectivity on the lease. Total land lease charged to operations in 2010 and 2009 amounted to P=19,681 and P=11,480 respectively.
f. Coal Supply Agreement TLI enters into short-term coal supply agreements. Outstanding coal supply agreements as of December 31, 2010 have aggregate supply amounts of 495,089 MT (equivalent dollar value is $38 million) which are due for delivery from January 10, 2011 to April 7, 2011. Terms of payments are by letter of credit where payment is due at sight against presentation of documents, and by telegraphic transfer where payment is due within 7 days from receipt of original invoice. Outstanding coal supply agreements as of December 31, 2009 have aggregate supply amounts of 202,112 metric tons (equivalent dollar value is $12.5 million) which are due for delivery from January 30, 2010 to March 3, 2010. Terms of payment are by letter of credit where payment is due at sight against presentation of documents, and by telegraphic transfer where payment is due within 7 days from receipt of original invoice.
g. ARI and Subsidiaries’ Power Supply Agreement In February 2007, ARI, in consortium with subsidiaries, HI, HTI and HSI successfully bid for an agreement to supply DLP a total of 400.00 million kilowatt hours (kWh) of new capacity

- 92 -
*SGVMC409510*
per year for a 12-year period beginning 2009. The delivery of the contracted energy under the agreement is in two phases: Phase I Supply, whereby 200 million kWh per year of Net Expected Energy will be delivered, has a target completion date of August 1, 2009; and Phase II Supply, whereby the additional 200 million kWh per year of Net Expected Energy will be delivered, has a target completion date of August 1, 2010. Net Expected Energy refers to the quantity of electricity generated by the respective projects of the parties of the consortium, net of electricity used by the project, site usage, and step up transformer and transmission losses up to the delivery per meter points, which points are to be agreed upon by the parties. The bid price of the contracted energy is P=4.0856/kWh delivered, subject to adjustment based on changes to the Philippine consumer price index.
h. In connection with the Sibulan hydropower project, HSI entered into agreements with various
contractors and suppliers. Major agreements entered into as of December 31, 2009 included those for the construction of civil works and electro-mechanical works and project management. Total purchase commitments entered into by HSI from their contracts amounted to P=3,028,893 and $25,003 as of December 31, 2010 and P=2,745,959 and $24,094 as of December 31, 2009. Total payments made from the commitments amounted to P=2,957,398 and $23,032 as of December 31, 2010 and P=2,565,868 and $19,758 as of December 31, 2009. These amounts are presented as part of “Other receivable” and “Construction in progress” in the consolidated balance sheets. In 2010, construction of the power plants have been completed (see Note 12).
i. HTI Agreements with Local Government Units On October 29, 2007, HTI, a subsidiary, entered into agreements with various barangays in Davao City wherein each barangay gives its consent to HTI to manage, administer, regulate and undertake the construction of HTI’s hydroelectric power plants and other related activities in their respective areas. In consideration thereof, HTI shall pay each of the barangay an annual royalty fee in an amount equivalent to P=0.01 per kwh of electricity sales of the power plant located within their area to be paid annually beginning the first anniversary date of the commencement of HTI’s commercial operations and on every anniversary date thereafter to be increased by P=0.001 every 5 years. In addition to the royalty fee, HTI shall make donations for the undertaking of certain infrastructure projects and provide financial assistance for the various needs of the community. The agreement likewise provides that HTI shall comply with Sec. 5(i) of RA No. 7638 as implemented by ER No. 1-94 as amended, prescribing the following annual benefits during the operation of the power stations: a) electrification fund to be distributed to the relevant host LGU equivalent to P=0.0075 per kwh of the total electricity sales; b) development and livelihood fund to be shared by the province, municipality, barangay and region equivalent to P0.00125 per kwh of the total electricity sales; and c) reforestation, watershed management, health and/or environmental enhancement fund to be shared by the resettlement area, barangay, municipality, province and region equivalent to P=1.00125 per kwh of the total electricity sales.
The duration of the agreements is for a period of 25 years and renewable for another 25 years as agreed by the Barangay Council of Wines and HTI.

- 93 -
*SGVMC409510*
j. Operating lease commitments ATS Group lease their office space for a period of one to five years. Future minimum rentals payable under non-cancellable operating leases were as follows:
2009 Within one year P=162,177 After one year but not more than five years 286,360 More than five years 10,394 P=458,931 Total rent expense charged to operations amounted to P=307,198, P=201,540 and P=150,290 in 2010, 2009 and 2008, respectively. The Group has no contingent rent commitments in 2010, 2009 and 2008.
k. Agreement with SBMA On May 15, 2003, the SBMA, SEZC and DLP entered into a DMSA for the privatization of the SBMA PDS on a rehabilitate-operate-and-transfer arrangement.
Under the terms of the DMSA, SEZC was created to undertake the administration, rehabilitation, operation and maintenance of the PDS including the provision of electric power service to the customers within the Subic Bay Freeport Secured Areas of the Subic Bay Freeport Zone as well as the collection of the relevant fees from them for its services and the payment by SBMA of the service fees throughout the service period pursuant to the terms of the DMSA. The DMSA shall be effective for a twenty five-year period commencing on the turnover date and consisting of two phases: (a) the five-year rehabilitation period and (b) the twenty-year operation, management and maintenance period. Total estimated rehabilitation costs committed by SEZC under the DMSA amounted to P=368,600. For and in consideration of the services and expenditures of SEZC for it to undertake the rehabilitation, operation, management and maintenance of the Project, it shall be paid by the SBMA the service fees in such amount equivalent to all the earnings of the Project, provided, however, that SEZC shall remit the amount of P=40.0 million to the SBMA at the start of every 12-month period throughout the service period regardless of the total amount of all earnings of the Project.
l. On February 7, 1997, VECO entered into a Power Purchase Agreement (PPA) for the purchase of electric energy from CPPC effective for a period of 15 years from the commercial operations of the latter. Among the salient features of the contract is that the electricity price shall not exceed 98% of the effective NPC billing rate to VECO based on contracted demand and energy. On September 1, 2006, a Supplement to the 1997 PPA was executed by VECO and CPPC. Some of the salient provisions of the Supplement included the removal of the minimum off-take and a pricing arrangement that effectively allowed CPPC to bill capacity-based fees based on CPPC’s guaranteed contractual capacity. On December 28, 2007, the ERC approved the Supplement to the 1997 PPA, which was implemented on the billing period ending January 26, 2008, the first billing cycle immediately after the approval of the ERC. Energy fees billed by CPPC to VECO amounted to P=2.0 billion in 2010, P=2.1 billion in 2009 and P=2.3 billion in 2008.

- 94 -
*SGVMC409510*
36. Contingencies There are legal cases filed against certain subsidiaries in the normal course of business. Management and its legal counsel believe that the subsidiaries have substantial legal and factual bases for their position and are of the opinion that losses arising from these cases, if any, will not have a material adverse impact on the consolidated financial statements. AP obtained standby letters of credit (SBLC) and is acting as surety for the benefit of certain subsidiaries and associates in connection with loans and credit accommodations. It provided SBLC for STEAG, LHC, SNAP M and SNAP B in the amount of P=1.70 billion in 2010 and P=1.80 billion in 2009.
a. DLP Case On December 7, 1990, certain customers of DLP filed before the then Energy Regulatory Board (ERB) a letter-petition for recovery claiming that with the SC’s decision reducing the sound appraisal value of DLP’s properties, DLP exceeded the 12% Return on Rate Base (RORB). The ERB’s order dated June 4, 1998, limited the computation coverage of the refund from January 19, 1984 to December 14, 1984. No amount was indicated in the ERB order as this has yet to be recomputed. The CA, in Court of Appeals General Register Special Proceeding (CA-GR SP) No. 50771, promulgated a decision dated February 23, 2001 which reversed the order of the then ERB, and expanded the computation coverage period from January 19, 1984 to September 18, 1989. The SC in its decision dated November 30, 2006 per GR150253 reversed the CA’s decision CA-GR SP No. 50771 by limiting the period covered for the refund from January 19, 1984 to December 14, 1984, approximately 11 months. The respondent/customers filed a Motion for Reconsideration with the SC, which was denied with finality by the SC in its Order dated July 4, 2007. The SC, following its decision dated November 30, 2006, ordered the ERC to proceed with the refund proceedings instituted by the respondents with reasonable dispatch. On March 17, 2010, the ERC directed DLP to submit its proposed scheme in implementing the refund to its customers. In compliance with the order, DLP filed its compliance stating that it cannot propose a scheme for implementing a refund as its computation resulted to no refund. A clarificatory meeting was held where DLP was ordered to submit its memoranda. On October 4, 2010, in compliance with the ERC directive, DLP submitted its memoranda reiterating the no refund scheme can be made.
b. LHC Arbitration LHC is a party to a dispute with a contractor regarding the delay in the completion of its Power Station. Under the Turnkey Contract, the contractor shall pay liquidated damages for each day of delay on the following day without the need of demand from LHC. LHC may, without prejudice to any other method of recovery, deduct the amount of such damages from any monies due or to become due to the contractor and/or by drawing on the irrevocable and confirmed standby letters of credit amounting to US$18 million (the Security).

- 95 -
*SGVMC409510*
Due to the delay in the completion of the Power Station, LHC, in 2000 and 2001, withdrew the irrevocable and confirmed standby letters of credit amounting to about $18.0 million which TPI has constituted as security to LHC as required under the Turnkey Contract. The withdrawal of the standby letters of credit became the subject of court cases in Australia and the Philippines. In 2008, both parties entered into a Settlement Deed (the Settlement) for the purpose of settling all claims and disputes related to the Turnkey Contract, including the Final Award. As a result of the Settlement, all related cases in the Philippines and Australia were dismissed following the parties’ Joint Motion to Dismiss filed with relevant courts.
37. Other Matters
a. Renewable Energy Act of 2008 On January 30, 2009, R.A. No. 9513, An Act Promoting the Development, Utilization and Commercialization of Renewable Energy Resources and for Other Purposes, which shall be known as the “Renewable Energy Act of 2008” (the Act), became effective. The Act aims to (a) accelerate the exploration and development of renewable energy resources such as, but not limited to, biomass, solar, wind, hydro, geothermal and ocean energy sources, including hybrid systems, to achieve energy self-reliance, through the adoption of sustainable energy development strategies to reduce the country’s dependence on fossil fuels and thereby minimize the country’s exposure to price fluctuations in the international markets, the effects of which spiral down to almost all sectors of the economy; (b) increase the utilization of renewable energy by institutionalizing the development of national and local capabilities in the use of renewable energy systems, and promoting its efficient and cost-effective commercial application by providing fiscal and non-fiscal incentives; (c) encourage the development and utilization of renewable energy resources as tools to effectively prevent or reduce harmful emissions and thereby balance the goals of economic growth and development with the protection of health and environment; and (d) establish the necessary infrastructure and mechanism to carry out mandates specified in the Act and other laws. As provided for in the Act, renewable energy (RE) developers of RE facilities, including hybrid systems, in proportion to and to the extent of the RE component, for both power and non-power applications, as duly certified by the Department of Energy (DOE), in consultation with the Board of Investments (BOI), shall be entitled to incentives, such as, income tax holiday, duty-free importation of RE machinery, equipment and materials, zero percent VAT rate on sale of power from RE sources, and tax exemption of carbon credits, among others. The Group expects that the Act may have significant effect on the operating results of some of its subsidiaries and associates that are RE developers. Impact on the operating results is expected to arise from the effective reduction in taxes.
b. EPIRA of 2001
RA No. 9136 was signed into law on June 8, 2001 and took effect on June 26, 2001. The law provides for the privatization of National Power Corporation (NPC) and the restructuring of the electric power industry. The Implementing Rules and Regulations (IRR) were approved by the Joint Congressional Power Commission on February 27, 2002.
R.A. No. 9136 and the IRR impact the industry as a whole. The law also empowers the ERC to enforce rules to encourage competition and penalize anti-competitive behavior.

- 96 -
*SGVMC409510*
R.A. Act No. 9136, the EPIRA, and the covering IRR provides for significant changes in the power sector, which include among others:
i. The unbundling of the generation, transmission, distribution and supply and other disposable assets of a company, including its contracts with IPPs and electricity rates;
ii. Creation of a WESM; and iii. Open and non-discriminatory access to transmission and distribution systems.
The law also requires public listing of not less than 15% of common shares of generation and distribution companies within 5 years from the effectivity date of the EPIRA. It provides cross ownership restrictions between transmission and generation companies and a cap of 50% of its demand that a distribution utility is allowed to source from an associated company engaged in generation except for contracts entered into prior to the effectivity of the EPIRA. There are also certain sections of the EPIRA, specifically relating to generation companies, which provide for a cap on the concentration of ownership to only 30% of the installed capacity of the grid and/or 25% of the national installed generating capacity.
38. Event After the Reporting Period
On March 3, 2011, the BOD of the Company approved the declaration of a cash dividend of P=1.58 a share (P=8.725 billion) to all stockholders of record as of March 17, 2011, payable on April 5, 2011.


*SGVMC409510*
INDEPENDENT AUDITORS’ REPORT ON SUPPLEMENTARY SCHEDULES The Stockholders and the Board of Directors Aboitiz Equity Ventures, Inc and Subsidiaries Aboitiz Corporate Center Gov. Manuel A. Cuenco Avenue, Cebu City We have audited in accordance with Philippine Standards on Auditing the consolidated financial statements of Aboitiz Equity Ventures, Inc and Subsidiaries included in this Form 17-A as of December 31, 2010 and 2009 and have issued our report thereon dated March 3, 2011 which contained an unqualified opinion on those financial statements. Our audits were conducted for the purpose of forming an opinion on the basic financial statements taken as a whole. The supplementary information on the schedules listed in the Index to Financial Statements and Supplementary Schedules for the year ended December 31, 2010 is presented for purpose of filing with the Securities and Exchange Commision and is not a required part of the basic financial statements. The information is required by Securities Regulation Code (SRC) Rule 68. Such information is the responsibility of the management of Aboitiz Equity Ventures, Inc and Subsidiaries. The information has been subjected to the auditing procedures applied in our audit of the basic financial statements. In our opinion, the information is fairly stated in all material respects in relation to the basic financial statements taken as a whole. SYCIP GORRES VELAYO & CO. J. Carlitos G. Cruz Partner CPA Certificate No. 49053 SEC Accreditation No. 0072-AR-2 Tax Identification No. 102-084-648 BIR Accreditation No. 08-001998-14-2009,
June 1, 2009, Valid until May 31, 2012 PTR No. 2641514, January 3, 2011, Makati City March 3, 2011

*SGVMC409510*
ABOITIZ EQUITY VENTURES, INC. AND SUBSIDIARIES Supplementary Schedules Required
By the Securities and Exchange Commission As of and for the Year Ended December 31, 2010
Page A - Marketable Securities (Current Marketable Equity Securities and Other Short-Term Cash Investments) NA B - Amounts Receivable from Directors, Officers, Employees, Related Parties and Principal Stockholders (Other than affiliates) 1 C - Long-Term Investments in Securities (Noncurrent Marketable Equity Securities, Other Long-Term Investments in Stock, Investments in Bonds and Other Debt Securities) 2 D - Indebtedness of Unconsolidated Subsidiaries and Affiliates NA E - Property, Plant and Equipment 5 F - Accumulated Depreciation and Amortization 6 G - Intangible Assets and Other Assets 7 H - Long-Term Debt 8 I - Indebtedness to Affiliates (Long-Term Loans from Affiliated Companies) NA J - Guarantees of Securities of Other Issuers NA K - Capital Stock 9 Statement of Retained Earnings Available for Dividend Declaration 10 NA: NOT APPLICABLE

*SGVMC409510*
- 1 -
ABOITIZ EQUITY VENTURES, INC. AND SUBSIDIARIES SCHEDULE B - AMOUNTS RECEIVABLE FROM
DIRECTORS, OFFICERS, EMPLOYEES, RELATED PARTIES AND PRINCIPAL STOCKHOLDERS (OTHER THAN AFFILIATES)
AS OF DECEMBER 31, 2010 (Amounts in Thousands)
Deductions Name and Designation of Debtor
Beginning Balance Additions
Amounts Collected
AmountsWritten off Current Non-Current
Ending Balance
Officers P=6,591 P=3,782 P=2,145 P=– P=1,199 P=7,029 P=8,228 Various employees 76,962 77,595 71,382 – 30,866 52,309 83,175 Advances from officers and employees
attributable to discontinued operations - – – – – – (38,986) Total P=83,553 P=81,377 P=73,527 P=– P=32,065 P=59,338 P=52,417

*SGVMC409510*
- 2 -
ABOITIZ EQUITY VENTURES, INC. AND SUBSIDIARIES SCHEDULE C – LONG-TERM INVESTMENTS IN SECURITIES
(NONCURRENT MARKETABLE EQUITY SECURITIES OTHER LONG TERM INVESTMENTS IN STOCK
INVESTMENT IN BONDS AND OTHER DEBT SECURITIES) AS OF DECEMBER 31, 2010
(Amounts in Thousands)
BEGINNING BALANCE ADDITIONS DEDUCTIONS ENDING BALANCE
Name of Issuing Entity and Description of Investment
Number of Shares or Principal
Amount of Bonds & Notes
Amount in Pesos
Equity in Earnings
(Losses) of Investees for
the Period Others
Distribution of Earnings by
Investees Others
Number of Shares or Principal
Amount of Bonds & Notes
Amount in Pesos
Dividends Received from
Investments Not
Accounted for by the Equity
MethodINVESTMENT IN SHARES OF STOCK A. EQUITIZED INVESTMENTS Visayan Electric Co., Inc. 419,654 P=963,238 P=319,026 P=393 P=191,586 P= - 419,654 P=1,091,071 P=– SNAP-Pangasinan, Inc. – 4,732 – – – 4,732 – – – Luzon Hydro Corporation 111,196,750 1,232,222 169,761 – 154,290 66,528 111,196,750 1,181,165 – Manila-Oslo Renewable Enterprise, Inc. 2,500,000,000 10,109,764 3,181,910 1,030,839 925,000 61,071 2,500,000,000 13,336,442 – Accuria, Inc. 519,829,804 (66,710) (2,313) – – 319 519,829,804 (69,342) – JAIB, Inc. 1,225 – – – – – 1,225 – – Hijos de Escano, Inc. 13,360 955,461 85,816 – 51,560 – 13,360 989,717 – San Fernando Electric Light and Power Company 540,809 177,490 31,162 36,205 16,231 – 540,809 228,626 – Pampanga Energy Ventures, Inc. 12,996,191 226,107 35,848 41,913 18,576 – 12,996,191 285,292 – Union Bank of the Philippines 247,952,560 13,192,023 2,218,916 955,035 545,496 – 262,384,348 15,820,478 – Cordillera Hydro Corporation 87,500 – – – – – 87,500 – – City Savings Bank 67,155 275,583 – – – 275,583 – – –

*SGVMC409510*
- 3 -
BEGINNING BALANCE ADDITIONS DEDUCTIONS ENDING BALANCE
Name of Issuing Entity and Description of Investment
Number of Shares or Principal
Amount of Bonds & Notes
Amount in Pesos
Equity in Earnings
(Losses) of Investees for
the Period Others
Distribution of Earnings by
Investees Others
Number of Shares or Principal
Amount of Bonds & Notes
Amount in Pesos
Dividends Received from
Investments Not Accounted
for by the Equity
MethodWestern Mindanao Power Corporation 903,202 P=421,960 P=177,339 P=– P=111,446 P=22,850 903,202 P=465,003 P=– CSB Holdings, Inc. – – (101) 889 – – 10,000 788 – Cebu International Container Terminal, Inc. 50,000,000 240,125 – – – – 50,000,000 240,125 – Southern Philippines Power Corporation 553,000 251,255 46,511 – 54,668 12,645 553,000 230,453 – South Western Cement Corporation 286,741 28,995 – – – – 286,741 28,995 – East Asia Utilities Corporation 50,000,000 1,375,711 175,105 – 70,000 1,145,253 50,000,000 335,563 – STEAG State Power, Inc. 161,074,029 5,909,444 429,792 105,773 – – 161,074,029 6,445,009 – Redondo Peninsula Energy, Inc. – 2,118 (5,370) – – – – (3,252) – Cebu Energy Dev't. Corp. – 2,417,897 (21,679) – – – – 2,396,218 – Adventenergy, Inc. – 625 – – – 625 – – – Aboitiz Project TS Coporation – 24,440 7,596 – – 32,036 – – – MCC Philippines – 44,873 32,611 – – 77,484 – – – Hapag-Lloyd Philippines, Inc. 1,800 4,894 1,433 – – – 1,800 6,327 – 3,655,923,780 37,792,247 6,883,363 2,171,047 2,138,853 1,699,126 3,670,298,413 43,008,678 – Allowance for decline in value of investment in SWCC – (28,995) – – – – – (28,995) – Total 3,655,923,780 P=37,763,252 P=6,883,363 P=2,171,047 P=2,138,853 P=1,699,126 3,670,298,413 P=42,979,683 P=–

*SGVMC409510*
- 4 -
BEGINNING BALANCE ADDITIONS DEDUCTIONS ENDING BALANCE
Name of Issuing Entity and Description of Investment
Number of Shares or Principal
Amount of Bonds & Notes
Amount in Pesos
Equity in Earnings
(Losses) of Investees for the Period Others
Distribution of Earnings by
Investees Others
Number of Shares or Principal
Amount of Bonds & Notes
Amount in Pesos
Dividends Received from
Investments Not Accounted
for by the Equity Method
B. ADVANCES TO INVESTEES SN Aboitiz Power, Inc. – P=4,860 P=– P=4,733 P=– P=– – P=9,593 P=– Manila-Oslo Renewable Enterprise, Inc. –
123,888 – – – 28,933 –
94,955 –
Luzon Hydro Corporation – – – 526,080 – – – 526,080 – Mazzaraty/Prism – 1,311 – – – – – 1,311 – RP Energy, Inc. – 296,611 – 563,249 – – – 859,860 – Cebu Energy Dev't. Corp. – 377,582 – – – 7 – 377,575 – South Western Cement Corporation –
24,390 –
– – – –
24,390 –
Allowance for loss of advances to SWCC – (23,472) – – – – – (23,472) – Total Advances to Investees – 805,170 – 1,094,062 – 28,940 – 1,870,292 –
TOTAL 3,655,923,780 P=38,568,422 P=6,883,363 P=3,265,109 P=2,138,853 P=1,728,066 3,670,298,413 P=44,849,975 P=–

*SGVMC409510*
- 5 -
ABOITIZ EQUITY VENTURES, INC. AND SUBSIDIARIES SCHEDULE E - PROPERTY, PLANT AND EQUIPMENT
AS OF DECEMBER 31, 2010 (Amounts in Thousands)
Building, Warehouses
and Improvemen
ts
Power Plant and
Equipment
Transmission
and Distribution Equipment
Machinery and
Equipment Flight
Equipment
Transportation
Equipment
Ships in Operation
and Improvemen
t Containers Handling
Equipment
Office Furniture,
Fixtures and Equipment
Leasehold Improve-
ments Land
Ships under Refurbish- ments and
Construction in Progress Others 2010
COST At January 1 P=2,914,865 P=66,628,765 P=4,553,427 P=3,664,635 P=351,988 P=795,628 P=5,879,220 P=1,473,737 P=1,288,727 P=1,004,250 P=570,596 P=369,100 P=4,827,987 P=366,426 P=94,689,351 Acquisition of a
subsidiary 63,355 – – – – – – – – 91,998 33,425 5,659 – – 194,437 Additions 74,972 1,498,217 296,882 20,925 150 169,405 3,300,429 35,670 97,450 194,625 36,094 41 2,690,775 94,432 8,510,067 Disposals (9,833) (37,280) (99) (74) (1,561) (102,279) (482,614) (57,077) (279) (39,266) (1,387) (19,500) (134) (30,534) (781,917) Reclassifications 79,908 5,280,435 148,693 172,322 13,598 (18,627) (62,032) 112,443 (135) (7,904) 95,359 (8,040) (5,793,565) (3,557) 8,898 Discontinued
operations (689,325) – – – (62,811) (200,408) (8,635,003) (1,564,773) (1,274,238) (618,522) (336,471) – (2,873) (2,555) (13,386,979) At December 31 2,433,942 73,370,137 4,998,903 3,857,808 301,364 643,719 – – 111,525 625,181 397,616 347,260 1,722,190 424,212 89,233,857

*SGVMC409510*
- 6 -
ABOITIZ EQUITY VENTURES, INC. AND SUBSIDIARIES SCHEDULE F - ACCUMULATED DEPRECIATION AND AMORTIZATION
AS OF DECEMBER 31, 2010 (Amounts in Thousands)
Building, Warehouses
and Improvemen
ts
Power Plant and
Equipment
Transmission
and Distribution Equipment
Machinery and
Equipment Flight
Equipment
Transportation
Equipment
Ships in Operation
and Improvemen
t Containers Handling
Equipment
Office Furniture,
Fixtures and Equipment
Leasehold Improve-
ments Land
Ships under Refurbish- ments and
Construction in Progress Others 2010
ACCUMULATED DEPRECIATION AND AMORTIZATION At January 1 678,887 3,289,900 2,282,549 1,322,638 82,819 446,250 2,220,913 1,331,613 1,159,794 758,986 333,007 – – 217,003 14,124,359 Acquisition of a
subsidiary 25,004 – – – – – – – – 73,258 8,110 – – – 106,372 Additions 118,075 2,480,574 194,431 92,712 19,702 104,693 1,043,602 21,316 49,985 165,865 68,396 – – 156,203 4,515,554 Disposals (6,293) (36,068) (789) (70) (1,553) (79,643) (354,192) (32,040) (197) (33,793) (1) – – (25,611) (570,250) Reclassifications (31,358) 57,075 2,644 – 12,527 39,778 (169,329) 74,556 14,967 45,150 48,974 – – (2,957) 92,027 Impairment – – – – – – 778,830 – – – – – – – 778,830 Discontinued
operations (253,424) – – – (62,264) (134,912) (3,519,824) (1,395,445) (1,137,975) (525,135) (221,282) – – (7,053) (7,257,314) At December 31 530,891 5,791,481 2,478,835 1,415,280 51,231 376,166 – – 86,574 484,331 237,204 – – 337,585 11,789,578 Net Book Value P=1,903,051 P=67,578,656 P=2,520,068 P=2,442,528 P=250,133 P=267,553 P=– P=– P=24,951 P=140,850 P=160,412 P=347,260 P=1,722,190 P=86,627 P=77,444,279

*SGVMC409510*
- 7 -
ABOITIZ EQUITY VENTURES, INC. AND SUBSIDIARIES SCHEDULE G - INTANGIBLE ASSETS AND OTHER ASSETS
AS OF DECEMBER 31, 2010 (Amounts in Thousands)
DEDUCTIONS
Description Beginning
BalanceAdditions
At CostCharged to Costs
and Expenses Charged to Other
Accounts
Other Changes Additions
(Deductions)Discontinued
OperationEnding
Balance A. Intangibles P=1,812,783 P=643,513 P=– P=– P=– (P=816,778) P=1,639,518 B. Other Noncurrent Assets
Restricted cash 560,423 – (560,423) – – – – Prepaid rent 541,830 – (7,005) – – – 534,825 Refundable deposits 195,314 – (170,956) – – – 24,358 Software development costs - net 112,127 – (112,127) – – – – VAT tax credit receivable 45,335 385,135 – – – – 430,470 Biological assets - net 44,518 8,854 – – – – 53,372 Others 536,476 – (149,866) – – – 386,610
Total P=3,848,806 P=1,037,502 (P=1,000,377) P=– P=– (P=816,778) P=3,069,153

*SGVMC409510*
- 8 -
ABOITIZ EQUITY VENTURES, INC. AND SUBSIDIARIES SCHEDULE H - LONG-TERM DEBT
AS OF DECEMBER 31, 2010 (Amounts in Thousands)
Name of Issuer and Type of Obligation
Amount Authorized by
Indentures
Amount Shown as
Current
Amount Shown as
Long-Term Remarks Parent Company:
Bank of the Philippine Islands P=400,000 P=400,000 P=- BPI Capital Corporation 500,000 1,250 498,750 BPI-AMTG As Trustee For Various Trust Accounts 770,000 1,925 768,075 BPI-AMTG ALFM Peso Bond Fund, Inc. 230,000 575 229,425 Development Bank of the Philippines 200,000 200,000 - Metropolitan Bank & Trust Company 2,500,000 5,100 2,494,900
Subsidiaries: Aboitiz Power Corporation 11,782,689 5,600 11,777,089 Cebu Private Power Corporation 636,433 213,333 423,100 Hedcor Sibulan, Inc. 3,546,265 260,053 3,286,212 Hedcor, Inc. 549,100 64,600 484,500 Balamban Enerzone Corporation 70,000 - 70,000 Subic Enerzone Corporation 118,626 11,909 106,717 City Savings Bank 2,124,174 141,010 1,983,164 Pilmico Foods Corporation 310,000 196,667 113,333 Pilmico Animal Nutrition Corp. 162,500 50,000 112,500
Total P=23,899,787 P=1,552,022 P=22,347,765

*SGVMC409510*
- 9 -
ABOITIZ EQUITY VENTURES, INC. AND SUBSIDIARIES SCHEDULE K - CAPITAL STOCK
DECEMBER 31, 2010 (Amounts in Thousands)
Title of Issue Number of Shares
AuthorizedNumber of Shares
Issued and Outstanding
Number of Shares Reserved for Options,
Warrants, Conversions, and Other Rights
Number of Shares Held By
Affiliates
Directors, Officers and Employees Others
COMMON SHARES 9,600,000 5,694,600 – 2,735,751 36,960
2,921,889
PREFERRED SHARES 400,000 150,000 – – – 150,000

*SGVMC409510*
- 10 -
Aboitiz Equity Ventures, Inc. Aboitiz Corporate Center
Gov. Manuel A. Cuenco Avenue Cebu City
Statement of Retained Earnings Available for Dividend Declaration December 31, 2010
(Amount in Philippine Currency)
Unappropriated Retained Earnings, as adjusted to available for dividend distribution, beginning
P=7,037,735
Add: Net income (loss) actually earned/realized during the period Net income during the period closed to Retained Earnings P=3,946,320 Add: Non-actual losses
Deferred income tax on benefit expense 4,424 Net income actually incurred during the period 3,950,744 Add (Less):
Cash dividends paid (2,871,373) Treasury shares - (2,871,373)
TOTAL RETAINED EARNINGS, END
AVAILABLE FOR DIVIDEND P=8,117,106