
SECURITIES AND EXCHANGE COMMISSION...A. Selected Financial Data. U.S. GAAP Selected Financial Data...
151
SECURITIES AND EXCHANGE COMMISSION Washington, D.C. 20549 FORM 20-F ‘ REGISTRATION STATEMENT PURSUANT TO SECTION 12(b) OR 12(g) OF THE SECURITIES EXCHANGE ACT OF 1934 OR È ANNUAL REPORT PURSUANT TO SECTION 13 OR 15(d) OF THE SECURITIES EXCHANGE ACT OF 1934 For the fiscal year ended March 31, 2003 OR ‘ TRANSITION REPORT PURSUANT TO SECTION 13 OR 15(d) OF THE SECURITIES EXCHANGE ACT OF 1934 For the transition period from to Commission file number:1-15270 Nomura Horudingusu Kabushiki Kaisha (Exact name of registrant as specified in its charter) Nomura Holdings, Inc. (Translation of registrant’s name into English) Japan 9-1, Nihonbashi 1-chome Chuo-ku, Tokyo 103-8645 Japan (Jurisdiction of incorporation or organization) (Address of principal executive offices) Securities registered or to be registered pursuant to Section 12(b) of the Act: Title of Each Class Name of Each Exchange On Which Registered Common Stock* New York Stock Exchange Securities registered or to be registered pursuant to Section 12(g) of the Act: None (Title of Class) Securities for which there is a reporting obligation pursuant to Section 15(d) of the Act: None (Title of Class) Indicate the number of outstanding shares of each of the issuer’s classes of capital or common stock as of the close of the period covered by the annual report. As of March 31, 2003, 1,965,919,860 shares of Common Stock were outstanding, including 10,084,292 shares represented by 10,084,292 American Depositary Shares. Indicate by check mark whether the registrant: (1) has filed all reports required to be filed by Section 13 or 15(d) of the Securities Exchange Act of 1934 during the preceding 12 months (or for such shorter period that the registrant was required to file such reports), and (2) has been subject to such filing requirements for the past 90 days. Yes È No ‘ Indicate by check mark which financial statement item the registrant has elected to follow. Item 17 ‘ Item 18 È * Not for trading, but only in connection with the registration of the American Depositary Shares, each representing one share of Common Stock.
Transcript of SECURITIES AND EXCHANGE COMMISSION...A. Selected Financial Data. U.S. GAAP Selected Financial Data...

SECURITIES AND EXCHANGE COMMISSIONWashington, D.C. 20549
FORM 20-F‘ REGISTRATION STATEMENT PURSUANT TO SECTION 12(b) OR 12(g) OF THE SECURITIES
EXCHANGE ACT OF 1934
OR
È ANNUAL REPORT PURSUANT TO SECTION 13 OR 15(d) OF THE SECURITIES EXCHANGEACT OF 1934
For the fiscal year ended March 31, 2003
OR
‘ TRANSITION REPORT PURSUANT TO SECTION 13 OR 15(d) OF THE SECURITIESEXCHANGE ACT OF 1934
For the transition period from to
Commission file number:1-15270
Nomura Horudingusu Kabushiki Kaisha(Exact name of registrant as specified in its charter)
Nomura Holdings, Inc.(Translation of registrant’s name into English)
Japan
9-1, Nihonbashi 1-chomeChuo-ku, Tokyo 103-8645
Japan(Jurisdiction of incorporation or organization) (Address of principal executive offices)
Securities registered or to be registered pursuant to Section 12(b) of the Act:
Title of Each Class Name of Each Exchange On Which Registered
Common Stock* New York Stock Exchange
Securities registered or to be registered pursuant to Section 12(g) of the Act:None
(Title of Class)
Securities for which there is a reporting obligation pursuant to Section 15(d) of the Act:None
(Title of Class)
Indicate the number of outstanding shares of each of the issuer’s classes of capital or common stock asof the close of the period covered by the annual report.
As of March 31, 2003, 1,965,919,860 shares of Common Stock were outstanding, including 10,084,292shares represented by 10,084,292 American Depositary Shares.
Indicate by check mark whether the registrant: (1) has filed all reports required to be filed by Section 13 or15(d) of the Securities Exchange Act of 1934 during the preceding 12 months (or for such shorter period that theregistrant was required to file such reports), and (2) has been subject to such filing requirements for the past 90days. YesÈ No‘
Indicate by check mark which financial statement item the registrant has elected to follow.
Item 17‘ Item 18È
* Not for trading, but only in connection with the registration of the American Depositary Shares, eachrepresenting one share of Common Stock.

TABLE OF CONTENTS
Page
PART IItem 1. Identity of Directors, Senior Management and Advisors 2Item 2. Offer Statistics and Expected Timetable 2Item 3. Key Information 3Item 4. Information on the Company 14Item 5. Operating and Financial Review and Prospects 24Item 6. Directors and Senior Management and Employees 51Item 7. Major Shareholders and Related Party Transactions 63Item 8. Financial Information 64Item 9. The Offer and Listing 65Item 10. Additional Information 66Item 11. Quantitative and Qualitative Disclosures about Market Risk 81Item 12. Description of Securities Other Than Equity Securities 86
PART IIItem 13. Defaults, Dividend Arrearages and Delinquencies 86Item 14. Material Modifications to the Rights of Security Holders and Use of Proceeds 86Item 15. Controls and Procedures 86Item 16A. Audit Committee Financial Expert 86Item 16B. Code of Ethics 86Item 16C. Principal Accountant Fees and Services 87Item 16D. Exemptions from the Listing Standards for Audit Committees 87
PART IIIItem 17. Financial Statements 87Item 18. Financial Statements 87Item 19. Exhibits 88Index to the Consolidated Financial Statements F-1
As used in this annual report, references to “Nomura” are to The Nomura Securities Co., Ltd. when thereferences relate to the period prior to, and including, September 30, 2001 and to Nomura Holdings, Inc. whenthe references relate to the period after, and including, October 1, 2001. See “History and Development of theCompany” under Item 4.A of this annual report. Also, as used in this annual report, references to “we”, “our”and “us” are to Nomura and, except as the context otherwise requires, its subsidiaries.
As used in this annual report, “yen” or “¥” means the lawful currency of Japan, and “dollar” or “$”means the lawful currency of the United States of America.
As used in this annual report, “U.S. GAAP” means accounting principles generally accepted in the UnitedStates of America, and “Japanese GAAP” means accounting principles generally accepted in Japan. Dataderived from U.S. GAAP financial statements are rounded to the nearest applicable digit, while data derivedfrom Japanese GAAP financial statements are truncated.
As used in this annual report, “ADS” means an American Depositary Share, currently representing oneshare of Nomura’s common stock, and “ADR” means an American Depositary Receipt evidencing one or moreADSs. See “Rights of Holders of ADSs” under Item 10.B of this annual report.
Amounts shown in this annual report have been rounded off to the nearest indicated digit unless otherwisespecified. In tables and graphs with rounded figures, sums may not add up due to rounding.
1

PART I
Item 1. Identity of Directors, Senior Management and Advisors.
Not applicable.
Item 2. Offer Statistics and Expected Timetable.
Not applicable.
2

Item 3. Key Information.
A. Selected Financial Data.
U.S. GAAP Selected Financial Data
The following selected financial data as of March 31, 2001, 2002 and 2003 and for the years ended March31, 2000, 2001, 2002 and 2003 has been derived from our consolidated financial statements included in thisannual report and the annual report on Form 20-F for the year ended March 31, 2002. The following selectedfinancial data as of March 31, 2000 has been derived from our consolidated financial statements included in ourRegistration Statement on Form 20-F (File No. 1-15270), which we filed with the Securities and ExchangeCommission on December 13, 2001. These financial statements were prepared in accordance with U.S. GAAP.
You should read the following selected financial data in conjunction with Item 5, “Operating and FinancialReview and Prospects”, of this annual report and our consolidated financial statements included in this annualreport.
Year Ended March 31,
2000 2001 2002 2003 2003(4)
(yen amounts in millions, except per share data)
(dollar amounts inmillions, exceptper share data)
Income statement data:Revenue . . . . . . . . . . . . . . . ¥ 1,499,781 ¥ 1,469,298 ¥ 1,825,399 ¥ 840,919 $ 7,122Interest expense . . . . . . . . . 437,131 553,643 504,048 274,645 2,326
Net revenue . . . . . . . . . . . . 1,062,650 915,655 1,321,351 566,274 4,796Non-interest expenses . . . . 690,430 759,483 1,148,379 518,865 4,394
Income before incometaxes and cumulativeeffect of accountingchange . . . . . . . . . . . . . . 372,220 156,172 172,972 47,409 402
Income tax expense . . . . . . 168,671 98,762 4,926 37,295 316
Income before cumulativeeffect of accountingchange . . . . . . . . . . . . . . 203,549 57,410 168,046 10,114 86
Cumulative effect ofaccounting change . . . . . — — — 109,799 930
Net income . . . . . . . . . . . . ¥ 203,549 ¥ 57,410 ¥ 168,046 ¥ 119,913 $ 1,016
Balance sheet data(period end):
Total assets . . . . . . . . . . . . ¥ 14,610,868 ¥ 17,146,024 ¥ 17,758,273 ¥ 21,169,446 $179,296Shareholders’ equity . . . . . 1,410,976 1,436,428 1,604,929 1,642,328 13,910Common stock . . . . . . . . . . 182,796 182,797 182,800 182,800 1,548Number of sharesissued . . . . . . . . . . . . . . . 1,962,977,247 1,962,977,841 1,965,919,860 1,965,919,860
Return on equity(1): . . . . . . 15.3% 4.0% 11.1% 7.4%Per share data:Income before cumulativeeffect of accountingchange—basic(2) . . . . . . ¥ 103.71 ¥ 29.25 ¥ 85.57 ¥ 5.17 $ 0.04
Net income—basic(2) . . . . . 103.71 29.25 85.57 61.26 0.52Income before cumulativeeffect of accountingchange—diluted(2) . . . . . 103.17 29.25 85.32 5.17 0.04
Net income—diluted(2) . . . 103.17 29.25 85.32 61.26 0.52Shareholders’ equity(3) . . . . 719.93 731.77 816.48 846.40 7.17Cash dividends(3) . . . . . . . . 15.00 17.50 15.00 15.00 0.13
3

Notes:(1) Calculated by dividing net income by average shareholders’ equity.(2) Calculated using the weighted average number of shares outstanding for the year (excluding treasury shares
held by us).(3) Calculated using the number of shares outstanding (excluding treasury shares held by us) at year end.(4) Calculated using the yen-dollar exchange rate of $1.00 = ¥118.07, the noon buying rate in New York City
for cable transfers in foreign currencies as certified for customs purposes by the Federal Reserve Bank ofNew York on March 31, 2003.
Japanese GAAP Selected Financial Data
The following selected financial data has been derived from our consolidated financial statements that wereprepared in accordance with Japanese GAAP. These Japanese GAAP consolidated financial statements wereincluded in our annual securities reports which we previously filed with the Japanese authorities pursuant to theSecurities and Exchange Law of Japan. Starting with the year ended March 31, 2003, we no longer prepareJapanese GAAP consolidated financial statements and instead disclose U.S. GAAP consolidated financialstatements for domestic reporting purposes. Accordingly, there is no Japanese GAAP financial data for the yearended March 31, 2003.
Year Ended March 31
1999(4) 2000 2001 2002
(Yen amounts in millions except per share data)Income statement data:Revenue . . . . . . . . . . . . . . . . . . . . . . . . . . ¥ 625,350 ¥ 1,089,416 ¥ 1,299,399 ¥ 1,121,743Interest expense . . . . . . . . . . . . . . . . . . . . 429,953 314,873 512,697 416,397
Net revenue . . . . . . . . . . . . . . . . . . . . . . . 195,397 774,542 786,702 705,346Selling, general, andadministrative expenses . . . . . . . . . . . 519,344 450,009 512,318 550,857
Operating income (loss) . . . . . . . . . . . . . (323,947) 324,532 274,383 154,489Income (loss) beforeincome taxes . . . . . . . . . . . . . . . . . . . . (595,190) 263,388 322,699 162,126
Net income (loss) . . . . . . . . . . . . . . . . . . ¥ (397,544) ¥ 146,298 ¥ 181,666 ¥ 102,756
Balance sheet data (period end):Total assets . . . . . . . . . . . . . . . . . . . . . . . ¥ 17,111,087 ¥ 18,821,897 ¥ 20,529,135 ¥ 18,177,716Shareholders’ equity . . . . . . . . . . . . . . . . 1,304,071 1,420,433 1,642,408 1,704,988Common stock . . . . . . . . . . . . . . . . . . . . . 182,795 182,795 182,796 182,799Number of shares issued . . . . . . . . . . . . . 1,962,977,247 1,962,977,247 1,962,977,841 1,965,919,860Per share data:Net income (loss)—basic(2) . . . . . . . . . . . ¥ (202.52) ¥ 74.55 ¥ 92.54 ¥ 52.32Net income (loss)—diluted(2) . . . . . . . . . (202.52) 74.24 92.29 52.22Shareholders’ equity(3) . . . . . . . . . . . . . . . 664.34 724.75 836.70 867.38Cash dividends(3) . . . . . . . . . . . . . . . . . . . 10.00 15.00 17.50 15.00
Notes:(1) All yen amounts have been truncated at the indicated digit.(2) Calculated using the weighted average number of shares outstanding for the year (excluding treasury shares
held by us).(3) Calculated using the number of shares outstanding (excluding treasury shares held by us) at year end.(4) In the year ended March 31, 1999, tax effect accounting was introduced. Deferred tax assets and liabilities
were recorded for the expected future tax consequences of temporary differences between the carryingamounts and the tax bases of assets and liabilities. This accounting change was not reflected retroactively inthe prior fiscal years. The effect of this accounting change on our Japanese GAAP financial statements forthe year ended March 31, 1999 was to decrease net loss by ¥190,725 million and increase shareholders’equity by ¥377,464 million.
4

There are significant differences between Japanese GAAP and U.S. GAAP. They primarily relate to thestatement of cash flows, disclosure of segment information, the scope of consolidation, accounting forderivatives, accounting for goodwill, accounting for investments in certain equity securities, accounting for leasetransactions, accounting for accrued compensated absences, accounting for employee retirement and severancebenefits, accounting for the impairment of long-lived assets, earnings per share and comprehensive income. Also,under Japanese GAAP, a restatement of prior years’ financial statements reflecting the effect of a change inaccounting principle is not permitted.
Foreign Exchange
Fluctuations in exchange rates between the Japanese yen and U.S. dollar will affect the U.S. dollarequivalent of the yen price of our shares and ADSs and the U.S. dollar amounts received on conversion of cashdividends. We have translated some Japanese yen amounts presented in this annual report into U.S. dollars solelyfor your convenience. The rate we used for the translations was ¥118.07 equal to $1.00, which was the noonbuying rate in New York City for cable transfers in foreign currencies as certified for customs purposes by theFederal Reserve Bank of New York on March 31, 2003. These translations do not imply that the yen amountsactually represent, or have been or could be converted into, equivalent amounts in U.S. dollars.
Year ended March 31, High Low Average* Year end
1999 . . . . . . . . . . . . . . . . . . . . . . . . . . . . . . . . . . . . . . . . . . . . . . . . . . . . . ¥147.14 ¥108.83 ¥128.10 ¥118.432000 . . . . . . . . . . . . . . . . . . . . . . . . . . . . . . . . . . . . . . . . . . . . . . . . . . . . . 124.45 101.53 110.02 102.732001 . . . . . . . . . . . . . . . . . . . . . . . . . . . . . . . . . . . . . . . . . . . . . . . . . . . . . 125.54 104.19 111.64 125.542002 . . . . . . . . . . . . . . . . . . . . . . . . . . . . . . . . . . . . . . . . . . . . . . . . . . . . . 134.77 115.89 125.64 132.702003 . . . . . . . . . . . . . . . . . . . . . . . . . . . . . . . . . . . . . . . . . . . . . . . . . . . . . 133.40 115.71 121.10 118.07
Calendar year 2002 High Low
December . . . . . . . . . . . . . . . . . . . . . . . . . . . . . . . . . . . . . . . . . . . . . . . . 124.99 118.38
Calendar year 2003 High Low
January . . . . . . . . . . . . . . . . . . . . . . . . . . . . . . . . . . . . . . . . . . . . . . . . . . 120.18 117.80February . . . . . . . . . . . . . . . . . . . . . . . . . . . . . . . . . . . . . . . . . . . . . . . . . 121.30 117.14March . . . . . . . . . . . . . . . . . . . . . . . . . . . . . . . . . . . . . . . . . . . . . . . . . . . 121.42 116.47April . . . . . . . . . . . . . . . . . . . . . . . . . . . . . . . . . . . . . . . . . . . . . . . . . . . . 120.55 118.25May . . . . . . . . . . . . . . . . . . . . . . . . . . . . . . . . . . . . . . . . . . . . . . . . . . . . . 119.50 115.94June (through June 26) . . . . . . . . . . . . . . . . . . . . . . . . . . . . . . . . . . . . . . 119.32 117.46
* Average rate represents the average of rates available on the last day of each month during the period.
The noon buying rate for Japanese yen on June 26, 2003 was $1.00 = ¥119.32.
B. Capitalization and Indebtedness.
Not applicable.
C. Reasons for the Offer and Use of Proceeds.
Not applicable.
D. Risk Factors.
You should carefully consider the risks described below before making an investment decision. If any of therisks described below actually occurs, our business, financial condition or results of operations could beadversely affected. In that event, the trading prices of our shares and ADSs could decline, and you may lose allor part of your investment. Additional risks not currently known to us or that we now deem immaterial may alsoharm us and affect your investment.
5

Market fluctuations could harm our businesses
Our businesses are materially affected by conditions in the financial markets and economic conditions inJapan and elsewhere around the world. Market downturns can occur not only as a result of purely economicfactors, but also as a result of war, act of terrorism, natural disasters or other similar events. A sustained marketdownturn can adversely affect our business and can result in substantial losses. Even in the absence of aprolonged market downturn, we may incur substantial losses due to market volatility.
Our brokerage and asset management revenues may decline
A market downturn could result in a decline in the revenues we receive from commissions because of adecline in the volume of brokered securities transactions that we execute for our customers. Also, in most cases,we charge fees for managing our clients’ portfolios that are based on the value of their portfolios. A marketdownturn that reduces the value of our clients’ portfolios, increases the amount of withdrawals or reduces theamount of new investments in these portfolios would reduce the revenue we receive from our asset managementbusinesses.
Our investment banking revenues may decline
Unfavorable financial or economic conditions would likely reduce the number and size of transactions forwhich we provide securities underwriting, financial advisory and other investment banking services. Ourinvestment banking revenues, which include fees from these services, are directly related to the number and sizeof the transactions in which we participate and would therefore decrease if there is a sustained market downturn.
We may incur significant losses from our trading and investment activities
We maintain large trading and investment positions in the fixed income and equity markets, both for ourown account and for the purpose of facilitating our customers’ trades. Our positions consist of various types ofasset, including financial derivatives transactions in the interest rate, credit, equity, currency, commodity, realestate and other markets. Market fluctuations can adversely affect the value of these assets. To the extent that weown assets, or have long positions, a market downturn could result in losses if the value of these long positionsdecreases. Furthermore, to the extent that we have sold assets we do not own, or have short positions, a marketupturn could expose us to potentially unlimited losses as we attempt to cover our short positions by acquiringassets in a rising market. We utilize various hedging techniques to mitigate these position risks. We can incurlosses if the markets move in a way we have not anticipated, as a result of specific events such as the terroristattack on September 11, 2001 or the Russian economic crisis in 1998. Also, we face losses if the level of marketvolatility differs from our expectation, which may occur particularly in the emerging markets. In addition, wecommit capital to take relatively large position for underwriting or warehousing assets to facilitate certain capitalmarket transactions. We may incur significant losses from these activities.
Holding large and concentrated positions of securities and other assets may expose us to large losses
Concentration of risk can expose us to large losses in our market-making, block trading and underwritingbusinesses. We have committed substantial amounts of capital to these businesses. This often requires us to takelarge positions in the securities of a particular issuer or issuers in a particular industry, country or region. Forexample, we previously held a large inventory for commercial mortgage-backed securities in our U.S. operations,the value of which seriously deteriorated after bond investors took flight from these investments in August 1998.
Extended market decline can reduce liquidity and lead to material losses
Extended market decline can reduce the level of market activity. If we cannot properly close out ourassociated positions, in particular over-the-counter derivatives, we may incur substantial losses due to thedifficulty of monitoring prices in a less liquid market.
6

Our hedging strategies may not prevent losses
We use a variety of instruments and strategies to hedge our exposure to various types of risk. If our hedgingstrategies are not effective, we may incur losses. We base many of our hedging strategies on historical tradingpatterns and correlations. For example, if we hold a long position in an asset, we may hedge this position bytaking a short position in an asset where the short position has, historically, moved in a direction that wouldoffset a change in value in the long position. However, historical trading patterns and correlations may notcontinue, and these hedging strategies may not be fully effective in mitigating our risk exposure in all marketenvironments or against all types of risk.
Our risk management policies and procedures may not be fully effective in managing market risk
Our policies and procedures to identify, monitor and manage risks may not be fully effective. Some of ourmethods of managing risk are based upon observed historical market behavior. This historical market behaviormay not continue in future periods. As a result, we may suffer losses by being unable to predict future riskexposures that could be significantly greater than the historical measures indicate. Other risk managementmethods that we use also rely on our evaluation of information regarding markets, clients or other matters, whichinformation is publicly available or otherwise accessible by us. This information may not be accurate, complete,up-to-date or properly evaluated, in which case we may be unable to properly assess our risks.
Market risk may increase the other risks that we face
In addition to the potentially adverse effects on our businesses described above, market risk couldexacerbate other risks that we face. For example, the risks associated with new products through financialengineering/innovation may be increased by market risk. Also, if we incur substantial trading losses, our need forliquidity could rise sharply while our access to cash may be impaired. Furthermore, if there is a market downturn,our customers and counterparties could incur substantial losses of their own, thereby weakening their financialcondition and, as a result, increasing our credit risk exposure to them. Our liquidity risk and credit risk aredescribed below.
Liquidity risk could impair our ability to fund operations and jeopardize our financial condition
Liquidity, or having ready access to cash, is essential to our businesses. In addition to maintaining a readilyavailable cash position, we seek to enhance our liquidity through repurchase and securities lending transactions,access to long-term debt, diversification of our short-term funding sources such as commercial paper, and byholding a portfolio of highly liquid assets. We bear the risk that we may lose liquidity under certaincircumstances, including the following:
We may be unable to access the debt capital markets
We depend on continuous access to the debt capital markets to finance our day-to-day operations. Aninability to raise money in the long-term or short-term debt markets, or to engage in repurchase agreements andsecurities lending, could have a substantial negative effect on our liquidity. For example, lenders could refuse toextend the credit necessary for us to conduct our business because of their assessment of our long-term or short-term financial prospects:
• if we incur large trading losses,
• if the level of our business activity decreases due to a market downturn, or
• if regulatory authorities take significant action against us.
Our ability to borrow in the debt markets also could be impaired by factors that are not specific to us, suchas a severe disruption of the financial markets or negative views about the prospects for the investment banking,securities or financial services industries generally. For example, in 1998 and 1999, as a result of concerns
7

regarding asset quality and the failure of several large Japanese financial institutions, some international lenderscharged an additional risk premium to Japanese financial institutions for short-term borrowings in the interbankmarket and restricted the availability of credit they were willing to extend. As concern about banks and otherfinancial institutions in Japan continues, this additional risk premium, commonly known as “Japan premium”,may be imposed again.
In particular, we may be unable to access the short-term debt markets
We depend primarily on the issuance of commercial paper and short-term bank loans as a principal sourceof unsecured short-term funding of our operations. Our liquidity depends largely on our ability to refinance theseborrowings on a continuous basis. Investors who hold our outstanding commercial paper and other short-termdebt instruments have no obligation to purchase new instruments when the outstanding instruments mature. Wemay be unable to obtain short-term financing from banks to make up any shortfall.
We may be unable to sell assets
If we are unable to borrow in the debt capital markets or if our cash balances decline significantly, we willneed to liquidate our assets or take other actions in order to meet our maturing liabilities. In volatile or uncertainmarket environments, overall market liquidity may decline. In a time of reduced market liquidity, we may beunable to sell some of our assets, which could adversely affect our liquidity, or we may have to sell assets atdepressed prices, which could adversely affect our results of operations and financial conditions. Our ability tosell our assets may be impaired by other market participants seeking to sell similar assets into the market at thesame time. For example, after the Russian economic crisis in 1998, the liquidity of some of our assets, includingRussian bonds and other assets, such as commercial mortgage-backed securities, was significantly reduced bysimultaneous attempts by us and other market participants to sell similar assets.
Lowering of our credit ratings could increase our borrowing costs
Our borrowing costs and our access to the debt capital markets depend significantly on our credit ratings.Rating agencies may reduce or withdraw their ratings or place us on “credit watch” with negative implications. Areduction in our credit ratings, or being placed on “credit watch” with negative implications, could increase ourborrowing costs and limit our access to the capital markets. This, in turn, could reduce our earnings andadversely affect our liquidity. For example, in 1998, after a series of credit rating downgrades, we experienced anincrease in borrowing costs and reduced access to short-term funding sources—particularly in connection withour operations in Europe and the United States.
Event risk may cause losses in our trading and investment assets as well as market and liquidity risk
Event risk refers to potential losses in value we may suffer through unpredictable events that cause largeunexpected market price moves. These include not only the events such as the terrorist attack on September 11,2001 and the Russian economic crisis in 1998 that resulted in losses to our business but also the following typesof events that could cause losses on our trading and investment assets:
• sudden and significant changes in credit ratings with regard to our trading and investment assets byrating agencies that have significant presence and influence on the market,
• sudden changes in trading, tax, accounting and other related rules which may make our trading strategyobsolete or less competitive, or
• the failure of corporate actions such as M&A with respect to our trading and investment assets.
Losses caused by financial or other problems of third parties may expose us to credit risk
Our counterparties are from time to time indebted to us as a result of transactions or contracts, includingloans, commitments to lend, other contingent liabilities, and derivatives transactions such as swaps and options.
8

We may incur material losses when our counterparties default on their obligations to us due to bankruptcy,deterioration in their creditworthiness, lack of liquidity, operational failure, an economic or political event, orother reasons. This risk may arise from:
• holding securities of third parties,
• entering into swap or other derivative contracts under which counterparties have obligations to makepayments to us,
• executing securities, futures, currency or derivative trades that fail to settle at the required time due tonon-delivery by the counterparty or systems failure by clearing agents, exchanges, clearing houses orother financial intermediaries, or
• extending credit to our clients through bridge or margin loans or other arrangements.
Problems related to third party credit risk may include the following:
Defaults by a large financial institution could adversely affect the financial markets generally and usspecifically
The commercial soundness of many financial institutions is closely interrelated as a result of credit, trading,clearing or other relationships among the institutions. As a result, concern about, or a default by, one institutioncould lead to significant liquidity problems or losses in, or defaults by, other institutions. This may adverselyaffect financial intermediaries, such as clearing agencies, clearing houses, banks, securities firms and exchanges,with which we interact on a daily basis. Actual defaults, increases in perceived default risk and other similarevents could arise in the future and could have an adverse effect on the financial markets and on us. We maysuffer financially if major Japanese financial institutions fail or experience severe liquidity or solvency problems.
There can be no assurance as to the accuracy of the information about, or the sufficiency of the collateral weuse in managing, our credit risk
We regularly review our credit exposure to specific customers or counterparties and to specific countriesand regions that we believe may present credit concerns. Default risk, however, may arise from events orcircumstances that are difficult to detect, such as fraud. We may also fail to receive full information with respectto the risks of a counterparty. In addition, in cases where we have extended credit against collateral, we may findthat we have insufficient value in the collateral. For example, if sudden declines in market values reduce thevalue of our collateral, we may become undersecured.
Our customers and counterparties may be unable to perform their obligations to us as a result of economic orpolitical conditions
Country, regional and political risks are components of credit risk, as well as market risk. Economic orpolitical pressures in a country or region, including those arising from local market disruptions or currency crises,may adversely affect the ability of clients or counterparties located in that country or region to obtain credit orforeign exchange, and therefore to perform their obligations owed to us.
Operational risk may disrupt our businesses, result in regulatory action against us or limit our growth
We face the following types of operational risk, and if such risk materializes, we could suffer financiallosses, disruption in our business, litigation from relevant parties, regulatory intervention or reputational damage:
• suffering damages due to failure to settle securities transactions,
• suffering damages due to failure by officers or employees to perform proper administrative activitiesprescribed in regular procedures,
9

• suffering damages due to suspension or malfunction of systems, most of which are developed andmaintained by our affiliate, Nomura Research Institute, Ltd.,
• suffering as a result of the destruction of our facilities or systems due to large-scale disasters or criminalactions, or
• suffering damages due to a temporary shutdown of some of our subsidiaries or branches based oninfectious diseases, including Severe Acute Respiratory Syndrome (SARS).
Our business is subject to substantial legal and regulatory risk and to regulatory changes
Substantial legal liability or a significant regulatory action against us could have a material financial effector cause reputational harm to us, which in turn could seriously damage our business prospects. Also, materialchanges in regulations applicable to us or to our market could adversely affect our business.
Our exposure to legal liability is significant
We face significant legal risks in our businesses. These risks include liability under securities or other lawsfor materially false or misleading statements made in connection with securities underwriting and othertransactions, potential liability for advice we provide in corporate transactions and disputes over the terms andconditions of complex trading arrangements. We also face the possibility that counterparties will claim that wefailed to inform them of the risks or that they were not authorized or permitted to enter into a transaction with usand that their obligations to us are not enforceable. During a prolonged market downturn, we would expectclaims against us to increase. We may also face significant litigation. The cost of defending such litigation maybe substantial and our involvement in litigation may damage our reputation. These risks may be difficult to assessor quantify and their existence and magnitude may remain unknown for substantial periods of time.
Extensive regulation of our businesses limits our activities and may subject us to significant penalties
The financial services industry is subject to extensive regulation. We are subject to regulation bygovernmental and self-regulatory organizations in Japan and in virtually all other jurisdictions in which weoperate. These regulations are designed to ensure the integrity of the financial markets and to protect customersand other third parties who deal with us. These regulations are not designed to protect our shareholders and oftenlimit our activities, through net capital, customer protection and market conduct requirements. We face the riskthat regulatory authorities may intervene in our businesses through extended investigation and surveillanceactivity, adoption of costly or restrictive new regulations or judicial or administrative proceedings that may resultin substantial penalties. We could be fined, prohibited from engaging in some of our business activities, or besubject to the temporary or long-term suspension or revocation of our legal authorization to conduct business.Our reputation could also suffer from the adverse publicity that any administrative or judicial sanction against usmay create. As a result of such sanction, we may lose business opportunities for a period of time, even after thesanction is lifted, if and to the extent that our customers, especially governmental institutions, decide not toengage us for their financial transactions.
Material changes in regulations applicable to us or to our market could adversely affect our business
If regulations that apply to our businesses are introduced, modified or removed, we could be adverselyaffected directly or through resulting changes in market conditions. For example, full deregulation of stockbrokerage commission rates in October 1999 has intensified competition in the Japanese stock brokerage market.Also, in September 2002, the Financial Services Agency of Japan abolished restrictions on sharing commonoffice space between banks and their affiliated securities companies. In accordance with this deregulation, somemajor banks have started to provide office space in their branches to affiliated securities companies and as aresult we may face more intensive competition with the bank industry. Furthermore, we may face additionalregulations on trading or other activities that may lead to a reduction of the market liquidity, trading volume ormarket participants. Such regulatory action may damage the Japanese markets as our main revenue source.
10

Misconduct by an employee, Director or Executive Officer could harm us and is difficult to detect anddeter
We face the risk that misconduct by an employee, Director or Executive Officer could occur. Misconduct byan employee, Director or Executive Officer could bind us to transactions that exceed authorized limits or presentunacceptable risks, or hide from us unauthorized or unsuccessful activities, which, in either case, may result inunknown and unmanaged risks or losses. Misconduct by an employee, Director or Executive Officer could alsoinvolve the improper use or disclosure of confidential information, which could result in regulatory sanctions,legal liability and serious reputational or financial damage to us. We may not always be able to deter misconductby an employee, Director or Executive Officer and the precautions we take to prevent and detect misconduct maynot be effective in all cases.
The financial services industry is intensely competitive and rapidly consolidating
The businesses we are in are intensely competitive, and we expect them to remain so. We compete on thebasis of a number of factors, including transaction execution, our products and services, innovation, reputationand price. In recent years, we have experienced intense price competition in brokerage, underwriting and otherbusinesses. There has also been increased competition in terms of delivery of value-added services to customers,such as corporate advisory services, especially from non-Japanese firms entering or expanding operations in theJapanese market.
Deregulation in Japan has increased competition in the Japanese securities industry
Since the late 1990s, the financial services sector in Japan has been deregulated. Banks and other types offinancial institutions can compete with us to a greater degree than they could before deregulation in the areas offinancing and investment trusts. Moreover, since the full deregulation of stock brokerage commission rates inOctober 1999, competition in the domestic brokerage market has intensified. A number of securities companiesin Japan, especially small and medium-sized firms, including those that specialize in on-line securities brokerage,have started offering securities brokerage services at low commission rates. In response to commissionderegulation, we also restructured our stock brokerage commissions to offer lower commissions depending onthe trading amount and the type of customer account. We may continue to experience pricing pressures in thefuture.
Competition with non-Japanese firms in the Japanese market is increasing
Competition from non-Japanese firms has also increased such as through their presence in Japan, especiallyin the areas of securities underwriting and corporate advisory services.
Increased global consolidation in the financial services industry means increased competition for us
In recent years, there has been substantial consolidation and convergence among companies in the financialservices industry. In particular, a number of large commercial banks, insurance companies and other broad-basedfinancial services firms have established or acquired broker-dealers or have merged with other financialinstitutions in Japan and overseas. Many of these firms have the ability to offer a wide range of products,including loans, deposit-taking, insurance, brokerage, asset management and investment banking services. Thisdiversity of services offered may enhance their competitive position. They also have the ability to supplementtheir investment banking and securities business with commercial banking, insurance and other financial servicesrevenues in an effort to gain market share. As these large, consolidated firms increase their market share, we mayexperience increased price competition in our business.
Our ability to expand internationally will depend on our ability to compete successfully with financialinstitutions in international markets
We believe that significant challenges and opportunities will arise for us outside of Japan. In order to takeadvantage of these opportunities, we will have to compete successfully with financial institutions based in
11

important non-Japanese markets, including the United States, Europe and Asia. Some of these financialinstitutions are larger, better capitalized and have a stronger local presence and a longer operating history in thesemarkets.
Our revenues may decline due to competition from alternative trading systems
Securities and futures transactions are now being conducted through the Internet and other alternative, non-traditional trading systems. It appears that the trend toward alternative trading systems will continue andprobably accelerate. A dramatic increase in electronic trading may adversely affect our commission and tradingrevenues, reduce our participation in the trading markets and access to market information, and lead to thecreation of new and stronger competitors.
We may not be able to realize gains we expect on our private equity investments in Europe
We hold substantial private equity investments in Europe, as discussed in “Principal Finance Group” underItem 5.A of this annual report. We hold this investment at fair value, but given the large size and illiquid nature,the general partner of the fund controlling these investments may not be able to realize the value of theseunderlying investments at a level, at the time or in the way the general partner may wish. Inability to dispose ofthese underlying investments could have a material impact on our future financial statements.
We may not be able to dispose of our operating investments at the time or with the speed we would like
As discussed in more detail in “Results of Operations” under Item 5.A of this annual report, we holdsubstantial amounts of operating investments, which refer to investments in equity securities of companies notaffiliated with us which we hold on a long-term basis in order to promote existing and potential businessrelationships. A substantial portion of these investments consists of equity securities of public companies inJapan. Under U.S. GAAP, depending on market conditions, we may record significant unrealized gains or losseson our operating investments, which would have a substantial impact on our income statement. Depending on theconditions of the Japanese equity markets, we may not be able to dispose of these equity securities when wewould like to do so or as quickly as we may wish.
Our investments in publicly-traded shares of affiliates accounted for under the equity method in ourconsolidated financial statements may decline significantly over a period of time and result in ourincurring an impairment loss
We have equity investments in affiliates accounted for under the equity method in our consolidated financialstatements whose shares are publicly traded. Under U.S. GAAP, if there is a decline in the fair value, i.e., themarket price, of the shares we hold in such affiliates over a period of time, and we determine, based on theguidance of Accounting Principles Board Opinion No. 18, “The Equity Method of Accounting for Investments inCommon Stock”, that the decline is other than temporary, then we must record an impairment loss for theapplicable fiscal period. We discuss our investment in JAFCO Co., Ltd., one of our affiliates, in “Results ofOperations” under Item 5.A of this annual report.
We may incur significant unrealized losses on subordinated bonds issued by Japanese banks, which wepurchased from the money management fund we manage
In January 2002, the Investment Trust Association of Japan, a self-regulatory organization, established newrules on management of money management funds, in its effort to regain investors’ confidence in moneymanagement funds, some of which had invested in bonds issued by Enron Corp. and thereby suffered substantiallosses in their asset value. In compliance with these new rules, which specified, with respect to assets included inan investment trust, limitations on the remaining maturity, average maturity and exposure on a single issuer, andminimum criteria on credit ratings to be obtained, we purchased subordinated bonds issued by major Japanese
12

banks from the money management fund we manage. As of March 31, 2003, we held subordinated bondsamounting to an aggregate face value of ¥153.5 billion. Japanese banks have been facing financial difficultiesprincipally related to substantial amounts of bad loans on their balance sheets. Depending on the future financialperformance of Japanese banks, the subordinated bonds we purchased may substantially lose their value, and wemay have to record unrealized losses which would be recognized currently in income.
We may face an outflow of customers’ assets due to losses of cash reserve funds or bonds we offered
We offer many types of product to meet various needs of our customers with different risk profiles. Cashreserve funds, such as money management funds, money reserve funds and long-term bond investment trusts, arecategorized as low-risk products. Such cash reserve funds may fall below par value as a result of defaults onbonds contained in the portfolio. In addition, bonds that we offer may default or experience delays in theirobligation to pay interest and/or principal. For example, in September 2001 we experienced a large-scale defaultin bonds issued by Mycal Corporation, and in January 2001 we faced delayed payments of interest on andprincipal of Argentine government bonds. Such losses in the products we offer may result in the loss of customerconfidence and lead to an outflow of customer assets from our custody.
Because of daily price range limitations under Japanese stock exchange rules, you may not be able to sellyour shares of Nomura’s common stock at a particular price on any particular trading day, or at all
Stock prices on Japanese stock exchanges are determined on a real-time basis by the equilibrium betweenbids and offers. These exchanges are order-driven markets without specialists or market makers to guide priceformation. To prevent excessive volatility, these exchange set daily upward and downward price fluctuationlimits for each stock, based on the previous day’s closing price. Although transactions may continue at theupward or downward limit price if the limit price is reached on a particular trading day, no transactions may takeplace outside these limits. Consequently, an investor wishing to sell at a price above or below the relevant dailylimit may not be able to sell his or her shares at such price on a particular trading day, or at all.
Under Japan’s unit share system, holders of our shares constituting less than one unit are subject tosignificant transfer, voting and other restrictions
Pursuant to the Commercial Code of Japan relating to joint stock corporations and certain related legislation,our Articles of Incorporation provide that 1,000 shares of our stock constitute one “unit”. The Commercial Codeimposes significant restrictions and limitations on holdings of shares that constitute less than a whole unit.Holders of shares constituting less than one unit do not have the right to vote or any other right relating to voting.The transferability of shares constituting less than one unit is significantly limited. Under the unit share system,holders of shares constituting less than a unit have the right to require us to purchase their shares. Also, holdersof shares constituting less than a unit may request us to the effect that we sell shares which become a full unit ofshares, together with the less than a unit shares owned by the registered shareholders. However, holders of ADSsare unable to withdraw underlying shares representing less than one unit. Therefore, as a practical matter, theycannot require us to purchase these underlying shares. As a result, holders of ADSs representing shares in lots ofless than one unit may not have access to the Japanese markets to sell their shares through the withdrawalmechanism.
As a holder of ADSs, you will have fewer rights than a shareholder has and you will have to act throughthe depositary to exercise these rights
The rights of the shareholders under Japanese law to take actions including voting their shares, receivingdividends and distributions, bringing derivative actions, examining the company’s accounting books and recordsand exercising appraisal rights are available only to holders of record. Because the depositary, through itscustodian agent, is the record holder of the shares underlying the ADSs, only the depositary can exercise thoserights in connection with the deposited shares. The depositary will make efforts to vote the shares underlying
13

your ADSs as instructed by you and will pay to you the dividends and distributions collected from us. However,in your capacity as an ADS holder, you will not be able to bring a derivative action, examine our accountingbooks and records or exercise appraisal rights except through the depositary.
Rights of shareholders under Japanese law may be more limited than under the laws of jurisdictionswithin the United States
Our Articles of Incorporation, our Regulations of the Board of Directors and the Japanese Commercial Codegovern our corporate affairs. Legal principles relating to such matters as the validity of corporate procedures,directors’ and executive officers’ fiduciary duties and shareholders’ rights may be different from those thatwould apply if we were a non-Japanese company. Shareholders’ rights under Japanese law may not be asextensive as shareholders’ rights under the laws of jurisdictions within the United States. You may have moredifficulty in asserting your rights as a shareholder than you would as a shareholder of a corporation organized ina jurisdiction within the United States.
It may not be possible for investors to effect service of process within the United States upon us or ourDirectors or Executive Officers, or to enforce against us or those persons judgments obtained in UnitedStates courts predicated upon the civil liability provisions of the federal securities laws of the United States
We are a limited liability, joint-stock corporation incorporated under the laws of Japan. Most of ourDirectors and Executive Officers reside in Japan. Many of our assets and the assets of these persons are locatedin Japan and elsewhere outside the United States. It may not be possible, therefore, for U.S. investors to effectservice of process within the United States upon us or these persons or to enforce against us or these personsjudgments obtained in United States courts predicated upon the civil liability provisions of the federal securitieslaws of the United States. We believe that there is doubt as to the enforceability in Japan, in original actions orinactions for enforcement of judgment of U.S. courts, of liabilities predicated solely upon the federal securitieslaws of the United States.
Special Note Regarding Forward-looking Statements
This annual report contains forward-looking statements that are based on our current expectations,assumptions, estimates and projections about our business, our industry and capital markets around the world.These forward-looking statements are subject to various risks and uncertainties. Generally, these forward-lookingstatements can be identified by the use of forward-looking terminology such as “may”, “will”, “expect”,“anticipate”, “estimate”, “plan” or similar words. These statements discuss future expectations, identifystrategies, contain projections of our results of operations or financial condition, or state other forward-lookinginformation.
Known and unknown risks, uncertainties and other factors may cause our actual results, performance,achievements or financial position to differ materially from any future results, performance, achievements orfinancial position expressed or implied by any forward-looking statement contained in this annual report. Suchrisks, uncertainties and other factors are set forth in this Item 3.D and elsewhere in this annual report.
Item 4. Information on the Company.
A. History and Development of the Company.
Nomura was incorporated in Japan on December 25, 1925 under the Commercial Code of Japan when thesecurities division of The Osaka Nomura Bank, Ltd. became a separate entity specializing in the trading anddistribution of debt securities in Japan. Nomura was the first Japanese securities company to develop its businessinternationally with the opening in 1927 of a representative office in New York, which actively traded non-yen-denominated debt securities. In Japan, we broadened the scope of our business when we began trading in equitysecurities in 1938 and when we organized the first investment trust in Japan in 1941.
14

Since the end of World War II, we have played a leading role in most major developments in the Japanesesecurities market. These developments include the re-establishment of investment trusts in the 1950s, theintroduction of public stock offerings by Japanese companies in the 1960s, the development of the over-the-counter bond market in the 1970s, the introduction of new types of investment trust such as the medium-termJapanese government bond investment trusts in the 1980s, and the growth of the corporate bond and initial publicoffering markets in the 1990s.
Our post-World War II expansion overseas accelerated in 1961, when Nomura acquired a controllinginterest in Nomura International (Hong Kong) Limited for the purpose of conducting broker-dealer activities inthe Hong Kong capital market. Subsequently, we established a number of other overseas subsidiaries, includingNomura Securities International, Inc. in the United States in 1969 as a broker dealer and Nomura InternationalLimited, now Nomura International plc, in the United Kingdom in 1981, which acts as an underwriter and abroker, as well as various other overseas affiliates, branches and representative offices.
In recent years, we have sought to take advantage of new opportunities presented by deregulation of theJapanese financial market and by developments in information technology. For example, to increase retailcustomers’ access to our services, we have taken advantage of the Internet to offer on-line brokerage and relatedservices.
On October 1, 2001, we adopted a holding company structure. In connection with this reorganization,Nomura changed its name from “The Nomura Securities Co., Ltd.” to “Nomura Holdings, Inc.” Nomuracontinues to be listed on the Tokyo Stock Exchange and other stock exchanges on which it was previously listed.A wholly-owned subsidiary of Nomura assumed Nomura’s securities businesses and is named “NomuraSecurities Co., Ltd.”
In December 2001, we were listed on the New York Stock Exchange.
We have also strengthened our mergers and acquisitions and other financial advisory businesses byacquiring majority interests in Nomura Corporate Advisors Co., Ltd., formerly Nomura Wasserstein Perrella Co.,Ltd., in November 1999. Nomura Corporate Advisors became a wholly-owned subsidiary of Nomura inSeptember 2000 and merged with Nomura Securities in April 2002.
We have also enhanced our asset management business through the acquisition of a majority interest inNomura Asset Management Co., Ltd. in March 2000. Nomura Asset Management became a wholly-ownedsubsidiary of Nomura in December 2001.
On June 26, 2003, we adopted the Committee System under which we established a Nomination Committee,an Audit Committee and a Compensation Committee.
The address of Nomura’s registered office is 9-1, Nihonbashi 1-chome, Chuo-ku, Tokyo 103-8645, Japan,telephone number: 81-3-5255-1000.
B. Business Overview.
Overview
We are the leading securities and investment banking firm in Japan and have worldwide operations. As ofMarch 31, 2003, we operated offices in more than 20 countries and regions including Japan, the United States,the United Kingdom, Singapore and Hong Kong. As of the same date, we employed 14,385 people, with 11,583in Japan and 2,802 outside Japan.
Our customers include individuals, corporations, financial institutions, governments and governmentalagencies.
15

Our businesses consist of the following three business segments:
• Domestic Retail—principally investment consultation services to retail customers; and
• Global Wholesale—principally fixed income and equity trading, investment banking, and merchantbanking in and outside Japan; and
• Asset Management—principally development and management of investment trusts, and investmentadvisory services.
For a discussion on revenues by category of activity and geographic market, see “Results of Operations”under Item 5.A of this annual report.
Our Business Strategy
Our Corporate Goals and Principles
We seek to establish ourselves firmly as a “globally competitive Japanese financial institution”. We believethat the Japanese securities market has the potential to grow rapidly, and we will seek to realize our vision bystrengthening our base in the domestic securities businesses and by focusing our group resources both in Japanand abroad to our key businesses.
We attach great importance to management of our business with a focus on shareholder value. We intend tomaintain an average return on equity of 10 to 15% on a consolidated basis over the medium- to long-term.
In executing our business strategy, we focus on business segments, which are linked along global businesslines, not on individual legal entities. We seek to establish a competitive business base by enhancing theprofessional competence of each of these business lines, while at the same time strengthening the linkages amongthese business lines.
Our Current Challenges
The Japanese economy and securities market continue to face difficult circumstances. In this environment,we need to respond effectively to the various needs of our customers and the market, and provide servicesthrough the capital markets, both at home and abroad based on our accumulated experience, knowledge andexpertise.
In the Domestic Retail segment, we seek to provide products and services focusing on the core values of ourcustomers by maintaining the flexibility and capacity to quickly supply domestic and overseas products. Corevalues are those values that our customers consider to be most important in their financial asset management. Weare promoting the shifting of individual financial assets from cash and deposits to higher yielding assets andseeking to broaden our customer base through enhancement of our structure tailored to deliver services focusingon the core values of customers with respect to various financial products. In addition, we are promoting agreater awareness of the importance of the capital markets and the value of holding securities products amongindividual investors.
In the Global Wholesale segment, we seek to increase our participation in corporate reorganizations,particularly in Japan. Among the areas that we believe have future growth potential are mergers and acquisitions,corporate revitalization, finance business for asset mobilization, and principal investments. We are promoting aglobalization strategy by accommodating the various needs of our customers.
In the Asset Management segment, we aim to strengthen our investment management business and improveinvestment performance through the establishment of a management structure that enables us to generatemedium- to long-term value-added, for example by centralizing management systems and strengthening researchfunctions. Also, by expanding our marketing channels and diversifying our product base, we endeavor to increaseassets under management and revenues.
16

Domestic Retail
The business operations of Domestic Retail are headquartered in Tokyo. In this business segment, weconduct business activities mainly for individuals and corporations in Japan through a network of 128 branchesnationwide as of the end of March 2003. We offer investment consultation service and maintenance services tomeet the medium- to long-term needs of our customers. The aggregate market value of our retail client assets was¥27.1 trillion as of the end of March 2003. We discuss retail client assets in “Operating Results” under Item 5.Aof this annual report.
In order to execute our business strategy described above in “Our Current Challenges”, we have variousmethods to deliver our services to our clients. Examples include face-to-face meetings with our staff, either inour branches or by visiting our customers, and communications through Nomura Home Trade, an Internet-basedtrading services or our call center.
We capitalize on the linkages among the Domestic Retail, Global Wholesale and Asset Managementsegments to offer to our customers various financial instruments such as stocks, bonds, investment trusts andvariable annuity insurance products, for the short, medium, and long terms, with different risk levels. We seek toprovide information “that can only come from Nomura” to customers through various media such as our investorreports, automatic voice mail system (Telephone-Answer), direct mailing and internet-based trading services(Nomura Home Trade).
Global Wholesale
We facilitate customer transactions and trade for our own account by market-making and trading fixedincome and equity securities, including related derivatives, in Japan and overseas. We also provide a broad rangeof investment banking services, including underwriting, financial advisory and other financing services. Also weconduct proprietary transactions, including arbitrage and merchant banking transactions.
Fixed Income
We offer clients global access to the fixed income markets and solutions to their financing needs.
In our trading operations, our offices in Tokyo, Hong Kong, London and New York work closely with oneanother to ensure that clients receive access to coverage across the globe. We have a number of client-focusedtrading teams, with particular expertise in trading domestic and international debt and other fixed income relatedproducts, including government securities, agency securities, municipal securities, credit products, money marketproducts, foreign exchange and asset backed securities. In the field of interest rate, credit and other derivativestrading, we utilize our risk management capabilities and risk tolerance capacity to provide services that respondto the investment requirements of our clients.
We recognize that investors possess differing investment needs. Through our global sales and tradingnetwork, including our capital markets, syndication, securitization and asset finance teams, we provide investorsaround the world with the services and products that match their investment needs in a timely manner. We areseeking to strengthen our track record in euro bonds based on our leadership in the yen bond market for over adecade.
Our research team covers Japan’s domestic economy and markets, and the global economy. In our researchactivities, analysts specializing in economic, credit and quantitative research provide investors with timely up-to-the-minute research and insights on the major issues of the moment. By combining our research power with oursales, trading, origination and syndication capabilities, we seek to provide tailor-made services to our clients.
Equity
Our equity sales, trading and market-making activities cover domestic and foreign equity and equity-relatedproducts such as convertible debt, warrants, equity index products, equity swaps, options and other structured
17

products. We also deal with large block orders arising from the liquidation of cross-shareholdings or baskettransactions from the reallocation of pension funds’ asset portfolios utilizing our execution and distributioncapabilities. We are members of major stock exchanges around the world. In addition, we deal in stockborrowing and stock loan transactions in support of our domestic and international trading, asset managementand custody services.
Investment Banking
We provide a broad range of investment banking services, including underwriting, financial advisory andother financing services.
Underwriting. We manage and participate in the underwriting of offerings of debt, equity and othersecurities in Japan and other major financial markets. We also arrange private placements and engage in othercapital raising activities. We are one of the leading equity and fixed income securities underwriters in Japan. Weare also one of the leading yen Eurobond underwriters. In addition, we are active in underwriting fixed incomesecurities of supranational, governments, government agencies and corporate issuers in Europe.
Financial Advisory Services. We provide financial advisory services on business transactions includingmergers and acquisitions, divestitures, spin-offs, restructurings, capital structuring and leverage buyouts. Ourinvolvement in initial public offerings, reorganizations and other corporate restructurings enhance ouropportunities to offer customers other advisory and investment banking services.
Structured Finance. We engage in the structured finance business, which involves, among other things,arranging the issuance of securities backed by assets such as real estate, leases, loans and other financialproducts.
Merchant Banking
We invest our own capital to actively assist in corporate reorganizations with a goal of maximizing ourreturns on investment by raising corporate value in Japan. In July 2000, we established a wholly ownedsubsidiary, Nomura Principal Finance Co., Ltd., to develop this business in Japan. In Europe, we have privateequity investments managed by Terra Firma, an independent asset management group. Terra Firma wasestablished following reorganization in March 2002 of our principal finance business, and is operated by formerNomura employees. For a further description of this reorganization, see “Principal Finance Group” under Item5.A of this annual report.
Asset Management
In Asset Management, we conduct asset management business and defined contribution plan business.
Asset Management Business
We conduct our asset management business primarily through Nomura Asset Management, the largest assetmanagement company in Japan in terms of assets under management of investment trust. Nomura AssetManagement manages various investment trusts, ranging from low risk/low return products to high risk/highreturn products, and develops new products to respond to various investor needs. Investment trusts are distributedto the investors through our network in the Domestic Retail segment, as well as through financial institutionssuch as securities companies (including those outside our group) and banks. Investment trusts are also offered asinstruments in defined contribution plans. We also provide investment advisory services to public pensions,private pensions, governments and their agencies, central banks and institutional investors.
In addition to Nomura Asset Management, Nomura Corporate Research and Asset Management Inc., orNCRAM, performs asset management mainly for high yield bonds and high yield loans in the United States, andNomura Main trust GmbH and Main trust KAGmbH are subsidiaries in Germany.
18

Defined Contribution Plan Business
We also provide services relating to defined contribution pension plans, such as support for planimplementation (plan design), product selection, provision of information to subscribers, trust services, productsupply, and investor education.
Our Research Activities
We provide fundamental research on the macro economies of different countries and international capitalflows, financial markets, industries and companies.
We produce industry-wide, company-specific and other research reports based on our research activities.We distribute these research reports to our retail customers in Japan and to our institutional customers in andoutside Japan.
Nomura Research Institute, Ltd., our affiliate, produces macroeconomic and other general research reports,which we purchase and distribute to our customers.
Our Information Technology
We believe that information technology is one of the key factors to the success of our overall business andintend to develop and maintain a technology platform to fill the various needs of our clients.
We provide our customers with electronic access to our products and services through the technologyplatform. For our retail customers, we have introduced Nomura Home Trade, at www.nomura.co.jp/hometrade,which provides our retail customers with on-line trading capabilities and current status reports on asset portfolios,investments and transactions and investment information, including our research reports through the internet ormobile phones. For institutional customers, we have introduced BondNavigator, a web site atwww.bondnavi.com, through which we provide on-line information and trading tools on the fixed income market.In addition to these, we have made many strategic investments and participate in a number of institutional tradingnetworks.
Competition
We encounter intense competition in all aspects of our business and compete on a global basis with othersecurities firms and financial institutions, in particular, other leading globally integrated financial services firms.A number of competitive factors affect our business, including:
• the quality, range and prices of our services,
• our ability to originate innovative financial products and services,
• our ability to maintain and develop customer relationships,
• our general reputation, and
• our ability to commit capital resources and to retain qualified employees.
Our competitive position is also affected by a variety of factors that influence the overall condition of theglobal financial markets, such as:
• the monetary and fiscal policies of national governments and international economic organizations, and
• political, economic and regulatory developments in Japan, the United States and other majorindustrialized countries, as well as in developing countries.
19

In Japan, we compete with other domestic securities companies and non-Japanese securities companies.Since the late 1990s, competition with leading global securities and investment banking firms with substantialoperations in Japan has become more intense as the financial services sector in Japan has become increasinglyderegulated, the level of participation by overseas investors in the Japanese securities market has risen, and someof our domestic competitors have consolidated or formed alliances with other financial institutions in Japan oroverseas securities and investment banking firms. We also compete with other types of financial institutions inJapan, such as banks with securities company subsidiaries, with respect to both providing financing and theinvestment of customers’ funds.
Since stock brokerage commission rates were deregulated in October 1999, competition in the domesticstock brokerage market has intensified. A number of securities companies in Japan, especially small andmedium-sized firms, started offering securities brokerage services at low commission rates. We seek to competeagainst these companies not on the basis of commission rates but by offering high-value added services such asour research, consultation and trading execution. At the same time, we realize that there is no assurance that wewill be able to maintain our current commission rates on a long-term basis, and for that reason we continue tomonitor market trends carefully.
We compete with Japanese and non-Japanese asset management companies. We are a leading provider ofasset management services in Japan. Recognizing the opportunities available in Japan for asset managementbusiness, new entrants, in particular major non-Japanese asset management companies, and asset managementcompanies with operations in Japan are allocating more resources to expand their operations. This is causingcompetition in this business to intensify.
Overseas, we compete with major investment banking firms. Some of our competitors in the overseasmarkets have a stronger local presence and longer operating history in these markets than we do. We arecompetitive with respect to Japan-related financial products, such as global sales and trading activities andunderwriting activities in Japanese equity securities and fixed income products denominated in yen, and incertain non-Japan-related areas.
Regulation
Japan
Regulation of Securities Industry. The Securities and Exchange Law regulates most aspects of securitiestransactions and the securities industry, including the public offering, private placement and secondary trading ofsecurities, the on-going disclosure by securities issuers, tender offers for securities, the organization andoperations of securities exchanges and self-regulatory associations, and the registration of securities companies.The Financial Services Agency, which was established in July 2000, is generally delegated the authority of thePrime Minister under the Securities and Exchange Law. The Securities and Exchange Surveillance Commission,an external agency of the Financial Services Agency which is independent from the Agency’s other bureaus, isvested with authority to conduct day-to-day monitoring of the securities market and to investigate irregularactivities that hinder the fair trading of securities. Furthermore, the Financial Services Agency delegates certainauthority delegated to it by the Prime Minister to the Local Finance Bureau. In addition, securities companies aresubject to extensive regulations regarding the scope of business in which they may engage under the Securitiesand Exchange Law. Securities companies are also subject to the rules and regulations of the Japanese stockexchanges and the Japan Securities Dealers Association, a self-regulatory association of securities companies.
Under the Securities and Exchange Law, a securities company may conduct, in addition to businessesincidental to the securities business, certain businesses specified under the Securities and Exchange Law, such asinvestment advisory business, investment trust management business and financial futures trading.
20

Business practices of securities companies are also subject to various regulatory requirements. In addition,the Financial Services Agency or the Local Finance Bureau regularly conducts inspections and examinations ofsecurities companies. A violation of applicable laws and regulations can result in various administrativesanctions, including the revocation of registration or authorization, the suspension of business and an order todischarge a director or executive officer who has not complied with applicable laws and regulations.
Securities companies are not allowed to directly conduct banking and other financial services, except forthose specified in the Securities and Exchange Law. Securities companies may, however, own a majority ofshares in banks and other financial services institutions. Such subsidiaries conducting banking and financialservices are also regulated by relevant laws and regulations. The Nomura Trust and Banking Co., Ltd. is asubsidiary of Nomura and conduct banking and certain financial services.
The Securities and Exchange Law generally prohibits banks and other financial institutions from engagingdirectly in the securities business, with limited exceptions including dealing in, and underwriting of, government,government-guaranteed and municipal bonds and offering and selling of investment trust certificates. Banks andcertain other financial institutions may, however, engage in the securities business, through their securitiessubsidiaries. Recent deregulation allowing securities companies to share office with banks may further encouragebank financial groups to promote their securities business through their securities affiliates.
To enhance investor protection, Japanese securities companies must segregate customer assets and arerequired to be a member of one of two investor protection funds approved by the government under theSecurities and Exchange Law. Each investor protection fund is funded through assessments on securitiescompanies that are members of the fund. The investor protection fund of which Nomura Securities is a memberprovides protection of up to ¥10 million per customer, in the event of failure of a securities company that is amember of the fund. The investor protection fund covers claims related to customer securities deposited with thefailed securities company and certain other claims of customers.
Overseas
Our overseas offices and subsidiaries are also subject to various laws and governmental rules andregulations applicable in those countries where such offices and subsidiaries carry on their respective operations,including those promulgated and enforced by the Securities and Exchange Commission, the New York StockExchange and the National Association of Securities Dealers, Inc. in the United States, and by The FinancialServices Authority and the London Stock Exchange in the United Kingdom. Failure to comply with such laws,rules or regulations could result in fines, suspension or expulsion, which could have a material adverse effectupon us.
Regulatory Capital Rules
Japan
Under the Securities and Exchange Law, securities companies are required to maintain adjusted capital atspecified levels as compared with the quantified total of their business risks on a non-consolidated basis. Article52 of the Securities and Exchange Law requires securities companies to file month-end reports regarding theircapital adequacy ratio, i.e., the ratio of adjusted capital to a quantified total of business risks, to the FinancialServices Agency, or the Local Finance Bureau, and to disclose their capital adequacy ratio to the public on aquarterly basis. A securities company must also file a report on a daily basis with the Financial Services Agencyor the Local Finance Bureau if its capital adequacy ratio falls below 140%. Article 56-2 of the Securities andExchange Law determines the actions which the Prime Minister through the Financial Services Agency may takeif the ratio falls further: if the ratio falls below 120%, the Prime Minister may order the securities company tochange its method of business or to deposit its property in trust, or order other measures for the public interestand investor protection if necessary. A securities company whose ratio falls below 100% may be subject to
21

additional proceedings, including temporary suspension of its business and revocation of its registration as asecurities company if there is no prospect that the ratio will recover three months after the suspension came intoeffect.
Adjusted capital is defined as shareholders’ equity less illiquid assets. Shareholders’ equity mainly consistsof stated capital, additional paid-in capital, legal reserve, retained earnings, reserve for securities transactions andcertain other reserves, certain allowances for doubtful accounts, net unrealized gain/loss in the market value ofinvestment securities, and subordinated debt. The illiquid assets generally include non-current assets, certaindeposits and advances and prepaid expenses. The business risks are divided into three categories: (i) market risks(i.e., risks of asset values being eroded when they are liquidated due to decline in their market value), (ii)counterparty risks (i.e., risks of loss that may be caused by the default of a counterparty on its commitment) and(iii) basic risks (i.e., risks to be monitored in carrying out daily business routines, such as administrativeproblems with securities transaction and clerical mistakes), each quantified in the manner specified in aministerial ordinance under the Securities and Exchange Law.
We closely monitor Nomura Securities’ capital adequacy ratio on a continuous basis. Since the introductionof the capital adequacy requirement in Japan in 1989, we have at all times been in compliance with theserequirements. We believe that we will continue to be in compliance with all applicable capital adequacyrequirements in the foreseeable future.
Overseas
In the United States, Nomura Securities International is a registered broker-dealer, registered futurescommission merchant and a member firm of the New York Stock Exchange. As such, Nomura SecuritiesInternational is subject to the minimum net capital requirements of the United States Securities and ExchangeCommission, the New York Stock Exchange and the Commodity Futures Trading Commission. Theserequirements specify minimum levels of capital that United States broker-dealers are required to maintain andlimit the amount of leverage that such broker-dealers may use in their businesses. As a primary dealer in UnitedStates government securities, Nomura Securities International is also subject to the capital adequacyrequirements under the Government Securities Act of 1986.
Nomura International in the United Kingdom is regulated by The Financial Services Authority and is subjectto capital requirements of that authority.
In addition, certain of our other subsidiaries are subject to various securities and banking regulations, andcapital adequacy requirements promulgated by the regulatory and exchange authorities of the countries in whichsuch subsidiaries operate. We believe that each such subsidiary is, and will in the foreseeable future be, incompliance with such requirements in all material respects.
22

C. Organizational Structure.
The following table lists Nomura and its significant subsidiaries and their respective countries ofincorporation. Indentation indicates the principal parent of each subsidiary. Proportions of ownership interestinclude indirect ownership.
Name CountryOwnershipInterest
(%)
Nomura Holdings, Inc. . . . . . . . . . . . . . . . . . . . . . . . . . . . . . . . . . . . . . . . . . . . . . . . Japan —Nomura Securities Co., Ltd. . . . . . . . . . . . . . . . . . . . . . . . . . . . . . . . . . . . . . . . Japan 100Nomura Asset Management Co., Ltd. . . . . . . . . . . . . . . . . . . . . . . . . . . . . . . . . Japan 100The Nomura Trust & Banking Co., Ltd. . . . . . . . . . . . . . . . . . . . . . . . . . . . . . . Japan 100Nomura Babcock & Brown Co., Ltd. . . . . . . . . . . . . . . . . . . . . . . . . . . . . . . . . Japan 100Nomura Capital Investment Co., Ltd. . . . . . . . . . . . . . . . . . . . . . . . . . . . . . . . . Japan 100Nomura Investor Relations Co., Ltd. . . . . . . . . . . . . . . . . . . . . . . . . . . . . . . . . Japan 100Nomura Principal Finance Co., Ltd. . . . . . . . . . . . . . . . . . . . . . . . . . . . . . . . . . Japan 100The Nomura Fundnet Securities Co., Ltd. . . . . . . . . . . . . . . . . . . . . . . . . . . . . Japan 100Nomura Funds Research and Technologies Co., Ltd. . . . . . . . . . . . . . . . . . . . . Japan 51Nomura DC Planning Co., Ltd. . . . . . . . . . . . . . . . . . . . . . . . . . . . . . . . . . . . . . Japan 100Nomura Human Capital Solutions Co., Ltd. . . . . . . . . . . . . . . . . . . . . . . . . . . . Japan 100Nomura Research & Advisory Co., Ltd. . . . . . . . . . . . . . . . . . . . . . . . . . . . . . . Japan 100Nomura Business Services Co., Ltd. . . . . . . . . . . . . . . . . . . . . . . . . . . . . . . . . . Japan 100Nomura Satellite Communications Co., Ltd. . . . . . . . . . . . . . . . . . . . . . . . . . . Japan 100Nomura Holding America Inc. . . . . . . . . . . . . . . . . . . . . . . . . . . . . . . . . . . . . . United States 100
Nomura Securities International, Inc. . . . . . . . . . . . . . . . . . . . . . . . . . . . . United States 100Nomura Corporate Research and Asset Management Inc. . . . . . . . . . . . . United States 100Nomura Asset Capital Corporation . . . . . . . . . . . . . . . . . . . . . . . . . . . . . . United States 100
The Capital Company of America, LLC . . . . . . . . . . . . . . . . . . . . . . United States 100Nomura Derivative Products, Inc. . . . . . . . . . . . . . . . . . . . . . . . . . . . . . . . United States 100Nomura Global Financial Products, Inc. . . . . . . . . . . . . . . . . . . . . . . . . . . United States 100Nomura Securities (Bermuda) Ltd. . . . . . . . . . . . . . . . . . . . . . . . . . . . . . . Bermuda 100
Nomura Europe Holdings plc . . . . . . . . . . . . . . . . . . . . . . . . . . . . . . . . . . . . . . United Kingdom 100Nomura International plc . . . . . . . . . . . . . . . . . . . . . . . . . . . . . . . . . . . . . United Kingdom 100Nomura Bank International plc . . . . . . . . . . . . . . . . . . . . . . . . . . . . . . . . . United Kingdom 100Banque Nomura France . . . . . . . . . . . . . . . . . . . . . . . . . . . . . . . . . . . . . . . France 100Nomura Bank (Luxembourg) S.A. . . . . . . . . . . . . . . . . . . . . . . . . . . . . . . Luxemburg 100Nomura Bank (Deutschland) GmbH . . . . . . . . . . . . . . . . . . . . . . . . . . . . . Germany 100Nomura Bank (Switzerland) Ltd. . . . . . . . . . . . . . . . . . . . . . . . . . . . . . . . Switzerland 100Nomura Italia S.I.M. p.A. . . . . . . . . . . . . . . . . . . . . . . . . . . . . . . . . . . . . . Italy 100
Nomura Funding Facility Corporation Limited . . . . . . . . . . . . . . . . . . . . . . . . Ireland 100Nomura Global Funding plc . . . . . . . . . . . . . . . . . . . . . . . . . . . . . . . . . . . . . . . United Kingdom 100
Nomura Europe Finance N.V. . . . . . . . . . . . . . . . . . . . . . . . . . . . . . . . . . . The Netherlands 100Nomura Principal Investment plc . . . . . . . . . . . . . . . . . . . . . . . . . . . . . . . . . . . United Kingdom 100Nomura Asia Holding N.V. . . . . . . . . . . . . . . . . . . . . . . . . . . . . . . . . . . . . . . . The Netherlands 100
Nomura Investment Banking (Middle East) E.C. . . . . . . . . . . . . . . . . . . . Bahrain 100Nomura International (Hong Kong) Limited . . . . . . . . . . . . . . . . . . . . . . Hong Kong 100Nomura Singapore Limited . . . . . . . . . . . . . . . . . . . . . . . . . . . . . . . . . . . . Singapore 100Nomura Advisory Services (Malaysia) Sdn. Bhd. . . . . . . . . . . . . . . . . . . Malaysia 100Nomura Australia Limited . . . . . . . . . . . . . . . . . . . . . . . . . . . . . . . . . . . . Australia 100
PT Nomura Indonesia . . . . . . . . . . . . . . . . . . . . . . . . . . . . . . . . . . . . . . . . . . . . Indonesia 80
23
D. Property, Plants and Equipment.
Our Properties
Our principal head office is located in Tokyo, Japan and occupies 806,336 square feet of office space. Ourother major offices in Japan are our Osaka branch office, which occupies 131,150 square feet, our Nagoya branchoffice, which occupies 77,338 square feet, and the head office of Nomura Asset Management in Tokyo, whichoccupies 161,696 square feet. We own the head office building of Nomura Asset Management which was builtduring the year ended March 31, 2003. We lease most of our other office space in Japan. Nomura Land andBuilding Co., Ltd., which is accounted for under the equity method of accounting in our consolidated financialstatements, is the lessor of a substantial portion of our leased office space in Japan, including our Tokyoheadquarters and Nagoya branch office.
Our major offices outside Japan are the London head office of Nomura International, which occupies410,277 square feet, and the New York head office of Nomura Securities International, which occupies 283,845square feet. We own the land and building for the London head office of Nomura International. We lease most ofour other overseas office space.
As of March 31, 2003, the aggregate book value of the land and buildings we owned was ¥75.8 billion, andthe aggregate book value of equipment we owned, including communications and data processing facilities, was¥30.0 billion. We lease other equipment we use in our operations.
Item 5. Operating and Financial Review and Prospects.
A. Operating Results.
You should read the following discussion of our operating and financial review and prospects together withItem 3.A “Selected Financial Data” of this annual report and our consolidated financial statements includedelsewhere in this annual report.
This discussion and analysis contains forward-looking statements that involve risks, uncertainties andassumptions. Our actual results may differ materially from those anticipated in these forward-looking statementsas a result of factors, including, but not limited to, those under Item 3.D “Risk Factors” and elsewhere in thisannual report.
Business Environment
Japan
The Japanese economy experienced a recession in 2001 primarily due to a global high technology recession,but started recovering in early 2002 owing to inventory adjustments and economic turnarounds in the UnitedStates and Asia. Since mid-2002, however, the economy has stagnated as the recovery in domestic demand hasbeen weak and export growth has slowed. In the spring of 2003, growth had yet to show signs of recovery. InOctober 2002, the Japanese government announced its Program for Financial Revival to accelerate the disposalof non-performing loans at major Japanese banks as a necessary step to revive the economy. At the same time,the government decided to establish the Industrial Revitalization Corporation of Japan to coordinate the disposalof bad debt and revitalization of Japanese industries and corporations. This new organization started operations inMay 2003.
Following the downturn during the year ended March 31, 2002, Japanese corporate earnings reboundedstrongly in the year ended March 31, 2003, despite a weak macro economy. We expect Japanese corporateearnings to continue rising in the year ending March 31, 2004, even while sales growth may remain sluggish,owing to the ongoing efforts by Japanese companies to improve profitability through the restructuring ofoperations and overhauling of existing employment practices.
24

While Japanese corporate earnings have been generally recovering since 2002, equity prices had continuedtheir downward trend, reflecting the deterioration in supply and demand conditions. TOPIX, a benchmark for theoverall stock market in Japan, was at 1,060.19 points at the end of March 2002, down 17% from the end ofMarch 2001, and at the end of March 2003, it stood at 788.00 points, representing a further decline of 26%.Likewise, the Nikkei Average fell 15% to ¥11,024.94 at the end of March 2002 compared with the end of March2001, and further fell 28% to ¥7,972.71 at the end of March 2003.
Yields on newly issued 10-year Japanese Government Bonds, or JGBs, stayed generally between 1.0% and1.6% in 2001, but began declining in 2002 and was at around 0.6% in 2003. This decline was due to the weakdemand for funds as Japanese companies tried to reduce debt, additional monetary easing measures undertakenby the Bank of Japan in the form of higher targets for the current account balance and increased purchases oflong-term JGBs, and the increased investment in bonds by institutional investors as the investment performanceof equities deteriorated.
Although the U.S. dollar traded in a range between ¥115 and ¥125 per U.S. dollar in 2001, the yen started toweaken from the end of 2001, pushing the U.S. dollar’s trading range for the first half of 2002 to between ¥125and ¥135 per U.S. dollar. However, that trading range returned to between ¥115 and ¥125 per U.S. dollar in thesecond half of 2002. Meanwhile, the Euro traded mostly between US$0.85 to US$0.95 per Euro in 2001 and thenbegan strengthening from mid-2002. In May 2003, the U.S. dollar weakened due to concerns over the size of theU.S. current account deficit, falling to near ¥115 per U.S. dollar, while the Euro climbed to around Euro1.15 perU.S. dollar.
Overseas
Outside Japan, in 2002, the economies of the major developed nations began to recover after finally shakingoff the effects of the previous year’s high technology recession. However, with the exception of Asia, recoveriesfaltered in the second half of the year as corporate accounting scandals in the United States, such as Enron andWorldcom, undermined investors’ faith in corporate results, and geopolitical tensions over Iraq led to a spike incrude oil prices. The quick end to the hostilities in Iraq saw crude oil prices fall back, but the economies have yetto return to a recovery footing.
The U.S. economy was dealt a heavy blow by the September 11, 2001 terrorist attacks in New York andWashington, D.C., but began to recover soon thereafter on the back of strong consumer spending and housinginvestment, supported by the decline in long-term and short-term interest rates. Capital expenditure in thecorporate sector languished throughout 2002 as the excessive investment of the information technology bubblecame to light and the corporate accounting scandals emerged in the first half of the year. Nevertheless, real GDPgrowth, shored up by the household sector, was 2.4% in 2002, up from 0.3% in 2001. The U.S. economy beganto lose steam once again, however, as tensions mounted over Iraq at the end of 2002. Despite the swift end to theIraqi war that began in March 2003, unemployment continues to rise and business sentiment remains depressed.
The Federal Funds rate, which peaked at 6.5% in 2000, was cut to 1.25% in November 2002, its lowest levelin 40 years. The yield on 10-year U.S. Treasuries, which moved in the range of 4.5% to 5.5% from 2001 up tothe first half of 2002, fell dramatically in the summer of 2002 as the corporate accounting scandals broke out andstock prices fell. Yields have since remained in the range of 3.5% to 4.25%. The Dow Jones Industrial Averagefell below 8,000 immediately after September 11, 2001, but recovered to 10,000 in the first half of 2002. TheDow then spiraled downward as more corporate accounting irregularities were uncovered and the Iraqi situationbecame increasingly tense, and has been fluctuating between 7,500 and 9,000 since the second half of 2002.
The European economies followed a similar pattern, recovering in step with the U.S. economy in the firsthalf of 2002, only to see the recovery fizzle out as it did in the United States and Japan. There are no signs ofrecovery yet in 2003. In March 2003, the European Central Bank lowered interest rates to 2.5%, down from the
25

peak of 4.75% in 2000. European stock markets have generally been stagnating since the collapse of theinformation technology bubble.
The Asian economies outside Japan have remained generally robust, even after the U.S., European, andJapanese economies peaked out in the second half of 2002. The outbreak of SARS in spring 2003, however, hasbeen causing concern in the Asian economies.
Results of Operations
Overview
The following table provides selected consolidated income statement information for the years indicated.
Year Ended March 31,
2001 2002 2003
(yen amounts in millions; dollar amounts in millions)
Non-interest revenues . . . . . . . . . . . . . . . . . . . . . . . . . . . . . . . . . . ¥950,357 ¥1,324,858 ¥438,995 $3,718Net interest revenue . . . . . . . . . . . . . . . . . . . . . . . . . . . . . . . . . . . . (34,702) (3,507) 127,279 1,078
Net revenue . . . . . . . . . . . . . . . . . . . . . . . . . . . . . . . . . . . . . . . . . . 915,655 1,321,351 566,274 4,796Non-interest expenses . . . . . . . . . . . . . . . . . . . . . . . . . . . . . . . . . . 759,483 1,148,379 518,865 4,394
Income before income taxes . . . . . . . . . . . . . . . . . . . . . . . . . . . . . 156,172 172,972 47,409 402Income tax expense . . . . . . . . . . . . . . . . . . . . . . . . . . . . . . . . . . . . 98,762 4,926 37,295 316Cumulative effect of accounting change(1) . . . . . . . . . . . . . . . . . . — — 109,799 930
Net income . . . . . . . . . . . . . . . . . . . . . . . . . . . . . . . . . . . . . . . . . . . ¥ 57,410 ¥ 168,046 ¥119,913 $1,016
Return on equity . . . . . . . . . . . . . . . . . . . . . . . . . . . . . . . . . . . . . . . 4.0% 11.1% 7.4%
(1) Cumulative effect of accounting change represents the write-off of the remaining unamortized negativegoodwill associated with the acquisition of additional shares of Nomura Asset Management Co., Ltd.
Net revenue decreased by 57% from ¥1,321,351 million for the year ended March 31, 2002 to ¥566,274million for the year ended March 31, 2003. The decline in net revenue is primarily due to the fact that the resultsof operations for the year ended March 31, 2002 included the consolidated results of the Principal FinanceGroup, (“the PFG entities”), as explained in “Principal Finance Group” below. We ceased to control the PFGentities on March 27, 2002 and, accordingly, they were not consolidated with our results of operations for theyear ended March 31, 2003. PFG entities product sales and PFG entities rental income accounted for ¥471,984million of net revenue for the year ended March 31, 2002. Also, net revenue for the year ended March 31, 2002included a gain on private equity investments in the amount of ¥232,472 million, relating to the deconsolidationof the PFG entities. This gain was derived mainly from the difference between the fair value of our investmentsin the PFG entities and their historical cost balance sheet value at that date. In addition, we recorded a gain onsales of PFG entities in the amount of ¥116,324 million for the year ended March 2002, which was derived fromsales of certain PFG entities. For the year ended March 31, 2003, the decline in net revenue on account of thePFG entities as discussed above more than offset increases in commissions, fees from investment banking, netgains on trading and net interest for that year compared with the previous year.
Net interest revenue amounted to ¥127,279 million for the year ended March 31, 2003, while we had netinterest expenses for the preceding two fiscal years. Net interest revenue is a function of the level and mix oftotal assets and liabilities, which includes trading assets and financing and lending transactions, and the level,term structure and volatility of interest rates. Net interest revenue is an integral component of trading activity. Inassessing the profitability of our overall business and of our Global Wholesale business in particular, we view netinterest revenue and non-interest revenues in aggregate.
Net revenue increased by 44% from ¥915,655 million for the year ended March 31, 2001, to ¥1,321,351million for the year ended March 31, 2002. The increase was mainly due to gains of ¥116,324 million on the
26

disposal of certain PFG entities and a gain on private equity investments of ¥232,472 million. Prior to March 27,2002, the results of the PFG entities were consolidated in our financial statements, and PFG entities rentalincome and PFG entities product sales increased due partly to the full year effect of certain PFG entities acquiredduring the year ended March 31, 2001, as well as the impact of one PFG entity acquired during the year endedMarch 31, 2002. These increases offset a decrease in commissions in the amount of ¥49,840 million and adecrease in net gain on trading in the amount of ¥145,761 million.
In our consolidated income statement, we include under “Revenue” profit (loss) on investments in equitysecurities. We recorded losses on such investments in the amounts of ¥98,968 million for the year ended March31, 2001, ¥55,860 million for the year ended March 31, 2002 and ¥41,288 million for the year ended March 31,2003. This line item includes unrealized gains and losses on operating investments, and gains and losses realizedupon disposition of operating investments. Operating investments refer to our investments in unaffiliatedcompanies, which we hold on a long-term basis in order to promote existing and potential business relationships.In our consolidated financial statements, operating investments are recorded at market value, with unrealizedgains and losses on these investments being recognized currently in income.
Non-interest expenses decreased by 55% from ¥1,148,379 million for the year ended March 31, 2002 to ¥518,865 million for the year ended March 31, 2003. The decrease in non-interest expenses was mainly due to thedeconsolidation of the PFG entities, whose expenses, such as the PFG entities cost of goods sold of ¥200,871million and PFG entities expenses associated with rental income of ¥111,529 million, were included in the non-interests expenses for the year ended March 31, 2002. This decrease was partially offset by an impairment loss inthe amount of ¥21,165 million on our investment in JAFCO, one of our affiliates as discussed below.
Non-interest expenses increased by 51% from ¥759,483 million for the year ended March 31, 2001 to¥1,148,379 million for the year ended March 31, 2002 mainly due to increases in PFG entities cost of goods soldand PFG entities expenses associated with rental income which were contributed from some of newly acquiredPFG entities for the year ended March 31, 2002. The increase also reflects an increase in compensation andbenefits and an impairment loss in the amount of ¥92,441 million on our investment for the year endedMarch 31, 2002 in JAFCO.
Income before income taxes was ¥156,172 million for the year ended March 31, 2001, ¥172,972 million forthe year ended March 31, 2002 and ¥ 47,409 million for the year ended March 31, 2003.
We are subject to a number of different taxes in Japan which, in the aggregate, represented a statutory taxrate of approximately 42% for the years ended March 31, 2001 and 2002. For the year ended March 31, 2003, weadopted a consolidation tax system as permitted under the Japanese tax low. In addition to the basic corporate taxrate, a 2% surtax will be imposed until the year ending March 31, 2004. Our foreign subsidiaries are subject toincome taxes of the countries in which they operate. Reflecting the surtax, the tax rate was approximately 44 %for the year ended March 31, 2003.
Income tax expense for the year ended March 31, 2003 was ¥37,295 million, representing an effective taxrate of 78.7%. The effective tax rate was significantly above the statutory tax rate of 44% mainly due to thefollowing two reasons. First, new Japanese tax legislation was issued in March 2003, reducing the standardenterprise tax rate and creating new taxes on capital and certain expenses defined in the law. This legislation willbe effective on April 1, 2004, and will result in a domestic statutory tax rate of approximately 40%. As a result ofthe future lower statutory tax rate, deferred tax assets were reduced and, accordingly, this increased the effectivetax rate for the year ended March 31, 2003 by approximately 16%. Second, deferred tax assets were decreasedwith respect to the movement of valuation allowance of certain foreign subsidiaries relating to their operatingloss carry forwards for tax purposes and, accordingly, this increased the effective tax rate for the year endedMarch 31, 2003 by approximately 12%.
Income tax expenses for the year ended March 31, 2002, was ¥4,926 million, representing an effective taxrate of 2.8%. The effective tax rate was significantly below our statutory tax rate of 42% mainly due to the
27

following two reasons. First, the 2002 effective tax rate was affected by the change in accounting for PFGentities following the change in our PFG business structure. As discussed in “Principal Finance Business” below,on March 27, 2002, we ceased to control the PFG entities. As a result, we deconsolidated the PFG entities andrecorded a corresponding gain on private equity investments of ¥232,472 million. There was no net tax effectrelated to this gain, and accordingly this reduced the effective tax rate for the year ended March 31, 2002 byapproximately 25%. Second, the lower tax rate applicable to income of our foreign operations (mainly our U.K.operation which recorded a material gain on sale of certain PFG entities) reduced the effective tax rate byapproximately 14%.
Income tax expense for the year ended March 31, 2001 was ¥98,762 million, representing an effective taxrate of 63.2%. The higher effective tax rate was due mainly to increase in valuation allowance for operating taxloss carry forwards (mainly for our U.S. operations), which increased the effective tax rate by approximately19%.
We wrote off negative goodwill arising with respect to Nomura Asset Management Co., Ltd. a previousbusiness combination upon adoption of SFAS No. 142 and recorded, as cumulative effect of accounting change,a gain of ¥109,799 million for the year ended March 31, 2003. For further information on this gain, see Note 3 toour consolidated financial statements included in this annual report.
Net income was ¥57,410 million for the year ended March 31, 2001, ¥168,046 million for the year endedMarch 31, 2002 and ¥119,913 for the year ended March 31, 2003. Our return on equity was 4.0% for the yearended March 31, 2001, 11.1% for the year ended March 31, 2002 and 7.4% for the year ended March 31, 2003.
Results by Business Segment
As discussed in “Overview” under Item 4.B of this annual report, our business segments are DomesticRetail, Global Wholesale and Asset Management. Gain (loss) on investment securities, corporate items and otherfinancial adjustments are included as “Other” operating results outside our business segments in our segmentinformation. Unrealized gain (loss) on investments in equity securities held for relationship purposes and theeffects of consolidation and deconsolidation of the PFG entities and other private equity investee companies areclassified as reconciling items outside our segment information. You should read the following segmentinformation in conjunction with Item 4.B of this annual report and Note 16 to our consolidated financialstatements included in this annual report. Reconciliation of our segment results of operations and consolidatedfinancial statements is set forth in Note 16.
Domestic Retail
In Domestic Retail, we receive commissions and fees from investment consultation services which weprovide mainly to individual customers in Japan. Additionally, we receive operational fees from assetmanagement companies in connection with the administration services of investment trust certificates that wedistribute. We also receive agent commissions from insurance companies for the variable annuity insuranceproducts we sell as an agent.
Operating Results of Domestic RetailYear Ended March 31,
2001 2002 2003
(yen amounts in millions; dollar amounts in millions)
Non-interest revenues . . . . . . . . . . . . . . . . . . . . . . . . . . . . . . . . . . . ¥260,193 ¥226,156 ¥246,938 $2,091Net interest revenue . . . . . . . . . . . . . . . . . . . . . . . . . . . . . . . . . . . . 6,236 2,949 2,313 20
Net revenue . . . . . . . . . . . . . . . . . . . . . . . . . . . . . . . . . . . . . . . . . . . 266,429 229,105 249,251 2,111Non-interest expenses . . . . . . . . . . . . . . . . . . . . . . . . . . . . . . . . . . . 215,638 208,621 213,562 1,808
Income before income taxes . . . . . . . . . . . . . . . . . . . . . . . . . . . . . . ¥ 50,791 ¥ 20,484 ¥ 35,689 $ 303
28

Net revenue for the year ended March 31, 2003 reached ¥249,251 million, increasing 9% from ¥229,105million for the year ended March 31, 2002. This was due to the fact that the placements and sales of bondsincreased, while commissions and fees in stock brokerage and asset management fees decreased. The decrease incommissions and fees in stock brokerage was caused by the decline in sales amounts mainly due to the downturnin the stock market. Additionally, the decrease in asset management fees was caused by decreases in the balancesfor Long-Term Bond Investment Trusts and also by decreases in trust fees due to a drop in distribution ratios forLong-Term Bond Investment Trusts, and decline in the balances for stock investment trusts due to the downturnin the stock market. These decreases in commissions and fees were offset by an increase in revenue reflecting theincrease in the placements and sales of foreign bonds.
Net revenue decreased by 14% from ¥266,429 million for the year ended March 31, 2001 to ¥229,105million for the year ended March 31, 2002, mainly due to decreases in commissions and asset management andportfolio service fees. Commissions revenue decreased mainly due to the decline of agency transaction volumesassociated with stagnant equity markets in Japan. Asset management and portfolio service fees decreased mainlydue to the redemption of the Medium-term Japanese Government Bond Fund in September 2001 and a decreasein the outstanding balances of stock investment trusts. However, increases in selling commissions from mediumterm notes and foreign currency bond partially offset this decrease.
Non-interest expenses for the year ended March 31, 2003 were ¥213,562 million, increasing 2% from¥208,621 million for the year ended March 31, 2002 mainly due to increases in compensation and benefits. Non-interest expenses for the year ended March 31, 2002 were ¥208,621 million, decreasing 3% from ¥215,638million for the year ended March 31, 2001, mainly due to declines in compensation and benefits.
Income before income taxes were ¥50,791 million for the year ended March 31, 2001, ¥20,484 million forthe year ended March 31, 2002, and ¥35,689 million for the year ended March 31, 2003.
The graph below shows the revenue breakdown by instrument in terms of Domestic Retail non-interestrevenues for the years ended March 31, 2001, 2002, and 2003.
As described above, equity commissions and asset management fees decreased for the year ended March 31,2003. Such decreases were offset by an increase in revenue reflecting the increase in the placements and sales offoreign bonds. Of Domestic Retail non-interest revenues for the year ended March 31, 2002, 72% werecomposed of revenue for equities, investment trusts distribution, and asset management fees. However, thisfigure declined to 57% for the year ended March 31, 2003. On the other hand, revenue from bonds increasedfrom 28% for the year ended March 31, 2002 to 40% for the year ended March 31, 2003, and the commissionsfor
29
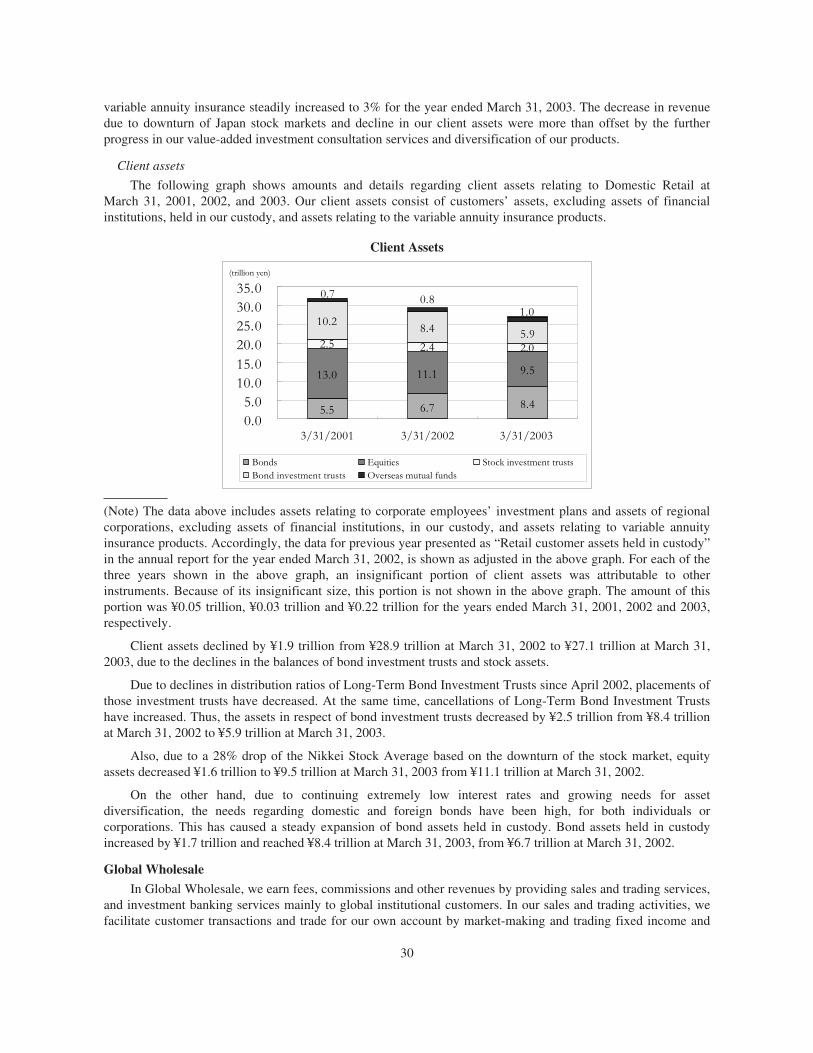
variable annuity insurance steadily increased to 3% for the year ended March 31, 2003. The decrease in revenuedue to downturn of Japan stock markets and decline in our client assets were more than offset by the furtherprogress in our value-added investment consultation services and diversification of our products.
Client assets
The following graph shows amounts and details regarding client assets relating to Domestic Retail atMarch 31, 2001, 2002, and 2003. Our client assets consist of customers’ assets, excluding assets of financialinstitutions, held in our custody, and assets relating to the variable annuity insurance products.
Client Assets
(Note) The data above includes assets relating to corporate employees’ investment plans and assets of regionalcorporations, excluding assets of financial institutions, in our custody, and assets relating to variable annuityinsurance products. Accordingly, the data for previous year presented as “Retail customer assets held in custody”in the annual report for the year ended March 31, 2002, is shown as adjusted in the above graph. For each of thethree years shown in the above graph, an insignificant portion of client assets was attributable to otherinstruments. Because of its insignificant size, this portion is not shown in the above graph. The amount of thisportion was ¥0.05 trillion, ¥0.03 trillion and ¥0.22 trillion for the years ended March 31, 2001, 2002 and 2003,respectively.
Client assets declined by ¥1.9 trillion from ¥28.9 trillion at March 31, 2002 to ¥27.1 trillion at March 31,2003, due to the declines in the balances of bond investment trusts and stock assets.
Due to declines in distribution ratios of Long-Term Bond Investment Trusts since April 2002, placements ofthose investment trusts have decreased. At the same time, cancellations of Long-Term Bond Investment Trustshave increased. Thus, the assets in respect of bond investment trusts decreased by ¥2.5 trillion from ¥8.4 trillionat March 31, 2002 to ¥5.9 trillion at March 31, 2003.
Also, due to a 28% drop of the Nikkei Stock Average based on the downturn of the stock market, equityassets decreased ¥1.6 trillion to ¥9.5 trillion at March 31, 2003 from ¥11.1 trillion at March 31, 2002.
On the other hand, due to continuing extremely low interest rates and growing needs for assetdiversification, the needs regarding domestic and foreign bonds have been high, for both individuals orcorporations. This has caused a steady expansion of bond assets held in custody. Bond assets held in custodyincreased by ¥1.7 trillion and reached ¥8.4 trillion at March 31, 2003, from ¥6.7 trillion at March 31, 2002.
Global Wholesale
In Global Wholesale, we earn fees, commissions and other revenues by providing sales and trading services,and investment banking services mainly to global institutional customers. In our sales and trading activities, wefacilitate customer transactions and trade for our own account by market-making and trading fixed income and
30

equity securities. We also provide a broad range of investment banking services, including underwriting andfinancial advisory services. Also, we conduct proprietary transactions, including arbitrage and principal financetransactions. Through March 27, 2002, our investments in PFG entities had been treated as private equitypositions for business segment information purposes.
Operating Results of Global Wholesale
Year Ended March 31,
2001 2002 2003
(yen amounts in millions; dollar amounts in millions)
Non-interest revenues . . . . . . . . . . . . . . . . . . . . . . . . . . . . . . . . . . . ¥487,644 ¥385,430 ¥196,675 $1,666Net interest revenue . . . . . . . . . . . . . . . . . . . . . . . . . . . . . . . . . . . . (24,839) 54,505 101,794 862
Net revenue . . . . . . . . . . . . . . . . . . . . . . . . . . . . . . . . . . . . . . . . . . . 462,805 439,935 298,469 2,528Non-interest expenses . . . . . . . . . . . . . . . . . . . . . . . . . . . . . . . . . . . 210,062 248,657 207,436 1,757
Income before income taxes . . . . . . . . . . . . . . . . . . . . . . . . . . . . . . ¥252,743 ¥191,278 ¥ 91,033 $ 771
Net revenue was ¥462,805 million, ¥439,935 million and ¥298,469 million for the years ended March 31,2001, 2002 and 2003, respectively.
Non-interest expenses were ¥210,062 million, ¥248,657 million and ¥207,436 million for the years endedMarch 31, 2001, 2002 and 2003, respectively.
As discussed in “Overview” under Item 4.B of this annual report, our Global Wholesale consists of fourbusiness lines: Fixed Income, Equity, Investment Banking and Merchant Banking.
Fixed Income
We cover fixed income related products, including government securities, agency securities, municipalsecurities, credit products, money market products, foreign exchange, asset backed securities and variousderivatives products. Our strategy is to enhance customer-driven transactions and focus on maintaining ourpresence as a market leader in yen bond markets globally. We have enhanced our execution capabilities fortrading in structured medium-term notes to meet strong demand from our high-net-worth clients and regionalinstitutions in Domestic Retail.
The table below shows our market share of Japanese Government bond auctions and secondary bondtrading, in terms of the principal amounts of bonds purchased, for the years indicated. Secondary bond tradingrefers to the trading of bonds originally issued in Japan in the over-the-counter market and on exchanges inJapan, but excludes gensaki and inter-dealer transactions.
Year Ended March 31,
2001 2002 2003
Share in Japanese Government bond auctions . . . . . . . . . . . . . . . . . . . . . . . . . . . . . . . . . . . . . 13% 15% 15%Share in secondary bond trading . . . . . . . . . . . . . . . . . . . . . . . . . . . . . . . . . . . . . . . . . . . . . . . 15% 15% 14%
Operating Results of Fixed IncomeYear Ended March 31,
2001 2002 2003
(yen amounts in millions;dollar amounts in millions)
Net revenue . . . . . . . . . . . . . . . . . . . . . . . . . . . . . . . . . . . . . . . . . . . . . . . ¥78,390 ¥90,753 ¥153,966 $1,304Non-interest expenses . . . . . . . . . . . . . . . . . . . . . . . . . . . . . . . . . . . . . . . 56,171 66,739 76,759 650
Income before income taxes . . . . . . . . . . . . . . . . . . . . . . . . . . . . . . . . . . ¥22,219 ¥24,014 ¥ 77,207 $ 654
31

Net revenue increased by 70% from ¥90,753 million for the year ended March 31, 2002 to ¥153,966 millionfor the year ended March 31, 2003, mainly due to an increase in net gain on trading relating to medium-termnotes and foreign currency bonds.
Net revenue increased by 16% from ¥78,390 million for the year ended March 31, 2001 to ¥90,753 millionfor the year ended March 31, 2002 due mainly to our success in trading in structured medium-term notes to meetstrong demand from high-net-worth clients and regional institutions in Domestic Retail.
Non-interest expenses increased by 15% from ¥66,739 million for the year ended March 31, 2002 to¥76,759 million for the year ended March 31, 2003 mainly due to increases in compensation and benefits in ouroverseas operations.
Non-interest expenses increased by 19% from ¥56,171 million for the year ended March 31, 2001 to¥66,739 million for the year ended March 31, 2002 due mainly to an increase in compensation and benefits in ouroverseas operations.
Income before income taxes was ¥22,219 million for the year ended March 31, 2001, ¥24,014 million forthe year ended March 31, 2002 and ¥77,207 million for the year ended March 31, 2003.
Equity
We focus on transactions by customer order flow as well as arbitrage trading. In recent years, manyJapanese corporations which have needed to restructure their balance sheets have accelerated their liquidation ofcross-shareholdings of other Japanese corporations. Utilizing our strong client base, solution providing servicesand execution capabilities, we have been handling large block orders resulting from such liquidations. We expectsuch restructuring to continue during the year ending March 31, 2004.
Furthermore, through our global sales network we often handle orders for baskets of various stocks fromdomestic and foreign large corporations and public pension funds. In the year ended March 31, 2003, wecontinued to strengthen our sales network into a global organization, which enables us to meet the 24-hourdemand from large global customers through out Tokyo, London and New York offices.
The following table sets forth the closing level of the TOPIX and the Nikkei 225, which are both stockmarket indices in Japan, as of the dates indicated, and the percentage changes from the closing level at the dateone year before:
Stock Market Index March 31,
2001 2002 2003
TOPIX . . . . . . . . . . . . . . . . . . . . . . . . . . . . . . . . . . . . . . . . . . . . . . . . . . . . . . . . 1,277.27 1,060.19 788.00-25.1% -17.0% -25.7%
Nikkei 225 (“Nikkei Stock Average”) . . . . . . . . . . . . . . . . . . . . . . . . . . . . . . . 12,999.70 11,024.94 7,972.71-36.1% -15.2% -27.7%
In the Japanese stock market, in May 2002, the Nikkei Stock Average rallied to a high for the year inresponse to a “bottoming out” declaration announced by the Japanese government. However, since then theNikkei Stock Average has generally declined as, among other factors, corporate accounting scandals underminedinvestors’ faith in corporate results in the United States, and concerns rose about the direction of the U.S.economy. Also, the Nikkei Stock Average dropped below the 8,000 mark in March 2003, due to the war in Iraq
32

and the deterioration in supply and demand conditions. The following table shows our market share of Japaneseequity trading for the years indicated.
Year Ended March 31,
Nomura’s Share in 2001 2002 2003
Total equity trading market in Japan . . . . . . . . . . . . . . . . . . . . . . . . . . . . . . . . . . . . . . . . . . . . 11% 10% 9%Off-floor/off-exchange equity trading market in Japan . . . . . . . . . . . . . . . . . . . . . . . . . . . . . . 21% 19% 20%
Operating Results of Equity
Year Ended March 31,
2001 2002 2003
(yen amounts in millions;dollar amounts in millions)
Net revenue . . . . . . . . . . . . . . . . . . . . . . . . . . . . . . . . . . . . . . . . . . . . . . . ¥241,291 ¥125,076 ¥82,025 $694Non-interest expenses . . . . . . . . . . . . . . . . . . . . . . . . . . . . . . . . . . . . . . . 73,617 66,475 65,675 556
Income before income taxes . . . . . . . . . . . . . . . . . . . . . . . . . . . . . . . . . . . ¥167,674 ¥ 58,601 ¥16,350 $138
Net revenue decreased by 34% from ¥125,076 million for the year ended March 31, 2002 to ¥82,025 millionfor the year ended March 31, 2003, mainly due to a decrease in customers’ order flow, such as block trading,resulting from a stagnant Japanese equity market.
Net revenue decreased by 48% from ¥241,291 million for the year ended March 31, 2001 to ¥125,076million for the year ended March 31, 2002 due partially to a stagnant Japanese equity market. Also, the resultsfor the year ended March 31, 2002 did not reflect block trades which took place in large numbers and volume inconnection with the reorganization of the Nikkei Stock Average which occurred during the year ended March 31,2001.
Non-interest expenses decreased by 1% from ¥66,475 million for the year ended March 31, 2002 to ¥65,675million for the year ended March 31, 2003 mainly due to decreases in compensation and benefits in our overseasoperations.
Non-interest expenses decreased by 10% from ¥73,617 million for the year ended March 31, 2001 to¥66,475 million for the year ended March 31, 2002 due mainly to a decrease in performance-linkedcompensation overseas.
Income before income taxes was ¥167,674 million for the year ended March 31, 2001, ¥58,601 million forthe year ended March 31, 2002, and ¥16,350 million for the year ended March 31, 2003.
Investment Banking
We offer various investment banking services, such as underwriting and advisory activities. We underwriteofferings of bonds, stocks, and other instruments in the major global markets of Japan, Europe, and the U.S. Thefollowing table shows changes in our market share in the underwriting market for bonds and stocks in Japan.
Year Ended March 31,
2001 2002 2003
Share in Japanese IPOs . . . . . . . . . . . . . . . . . . . . . . . . . . . . . . . . . . . . . . . . . . . . . . . . . . . . . . 44% 36% 49%Share in Japanese Public Offerings . . . . . . . . . . . . . . . . . . . . . . . . . . . . . . . . . . . . . . . . . . . . . 16% 34% 44%Share in Japanese Straight Bonds . . . . . . . . . . . . . . . . . . . . . . . . . . . . . . . . . . . . . . . . . . . . . . 22% 21% 23%Share in Japanese Samurai Bonds . . . . . . . . . . . . . . . . . . . . . . . . . . . . . . . . . . . . . . . . . . . . . . 18% 38% 14%
33

We have been enhancing our M&A and financial advisory capabilities for cross border deals as well asJapanese deals. According to Thomson Financial, the amounts of announced M&A deals which involvedJapanese parties was $63,090 million and our share was 32.4% for the year ended December 31, 2002.
Merchant Banking
In October 2001, we established the Merchant Banking division within Global Wholesale, which combinesour principal finance business in Japan and Europe, and other private equity businesses in Japan and Europe.
In our principal finance business, we generally take controlling stakes in mature businesses that have strongcash flows and offer potential for strong capital appreciation. We also take minority positions in start up typeenterprises or investments through private equity funds in our private equity business. In Japan, NomuraPrincipal Finance Co., Ltd. has been developing private equity business in the field of buy-outs and corporaterevitalization. The business has also been developed through investment in funds managed by the NomuraResearch & Advisory Co., Ltd. in Japan. As explained in “Principal Finance Group” below, since March 27,2002, our principal finance investments in Europe have been controlled and managed by Terra Firma.
In the financial analysis below, the operating results of merchant banking for the year ended March 31, 2001are included in the investment banking category.
Operating Results of Investment Banking and Merchant Banking
Year Ended March 31,
2001 2002 2003
(yen amounts in millions; dollar amounts in millions)
Investment Banking:Net revenue . . . . . . . . . . . . . . . . . . . . . . . . . . . . . . . . . . . . . . ¥143,124 ¥ 88,349 ¥ 69,125 $ 585Non-interest expenses . . . . . . . . . . . . . . . . . . . . . . . . . . . . . . 80,274 57,406 56,374 477
Income before income taxes . . . . . . . . . . . . . . . . . . . . . . . . . ¥ 62,850 ¥ 30,943 ¥ 12,751 $ 108
Merchant Banking:Net revenue . . . . . . . . . . . . . . . . . . . . . . . . . . . . . . . . . . . . . . ¥ — ¥135,757 ¥ (6,647) $ (56)Non-interest expenses . . . . . . . . . . . . . . . . . . . . . . . . . . . . . . — 58,037 8,628 73
Income before income taxes . . . . . . . . . . . . . . . . . . . . . . . . . ¥ — ¥ 77,720 ¥(15,275) $(129)
Investment Banking and Merchant Banking:Net revenue . . . . . . . . . . . . . . . . . . . . . . . . . . . . . . . . . . . . . . ¥143,124 ¥224,106 ¥ 62,478 $ 529Non-interest expenses . . . . . . . . . . . . . . . . . . . . . . . . . . . . . . 80,274 115,443 65,002 550
Income before income taxes . . . . . . . . . . . . . . . . . . . . . . . . . ¥ 62,850 ¥108,663 ¥ (2,524) $ (21)
Net revenue for Investment Banking and Merchant Banking decreased by 72 % from ¥224,106 million forthe year ended March 31, 2002 to ¥62,478 million for the year ended March 31, 2003. Net revenue in MerchantBanking was adversely impacted by the worldwide recession, which depressed asset values and limited exitopportunities. Investment gains realized through exit transactions in Japan were offset by a decline in the fairvalue of investments in Europe. Net revenue in Investment Banking decreased partly due to a decrease in orderflow relating to the Japanese equity market. Public offering activities were stagnant during the year ended March31, 2003 in the Japanese capital market, although the number of M&A deals increased.
34

Net revenue increased by 57% from ¥143,124 million for the year ended March 31, 2001 to ¥224,106million for the year ended March 31, 2002 mainly due to gains resulting from the disposal of assets held byAngel Street Capital Limited and Tutor Street Capital, both PFG entities, and securitization by AnningtonHoldings plc, another PFG entity, in Merchant Banking. These gains were offset by a decrease in net revenue inInvestment Banking due mainly to a decrease in volume of public stock offerings in Japan reflecting the stagnantJapanese equity market.
Non-interest expenses decreased by 44% from ¥115,443 million for the year ended March 31, 2002 to¥65,002 million for the year ended March 31, 2003 mainly due to decreases in compensation and benefitsreflecting the performance of Merchant Banking.
Non-interest expenses increased by 44% from ¥80,274 million for the year ended March 31, 2001 to¥115,443 million for the year ended March 31, 2002 mainly due to an increase in compensation and benefitsreflecting the improved performance of Merchant Banking.
Income before income taxes was ¥62,850 million for the year ended March 31, 2001 and ¥108,663 millionfor the year ended March 31, 2002, and loss before income taxes was ¥2,524 million for the year ended March31, 2003.
Asset Management
In Asset Management, principally conducted through Nomura Asset Management, we develop and manageinvestment trusts, which we and other financial institutions distribute, and earn management fees for the portfoliomanagement of investment trusts. We also provide investment advisory services for pension funds and otherinstitutional customers. Net revenues mainly consist of asset management and portfolio service fees.Additionally, in the defined contribution business, we receive commissions as a defined contribution pensionplan administrator.
Operating Results of Asset Management
Year Ended March 31,
2001 2002 2003
(yen amounts in millions; dollar amounts in millions)
Non-interest revenues . . . . . . . . . . . . . . . . . . . . . . . . . . . . . . ¥58,237 ¥46,840 ¥34,828 $295Net interest revenue . . . . . . . . . . . . . . . . . . . . . . . . . . . . . . . 1,810 367 2,232 19
Net revenue . . . . . . . . . . . . . . . . . . . . . . . . . . . . . . . . . . . . . 60,047 47,207 37,060 314Non-interest expenses . . . . . . . . . . . . . . . . . . . . . . . . . . . . . 39,537 37,031 33,866 287
Income before income taxes . . . . . . . . . . . . . . . . . . . . . . . . . ¥20,510 ¥10,176 ¥ 3,194 $ 27
Net revenue decreased by 21% from ¥47,207 million for the year ended March 31,2002 to ¥37,060 millionfor the year ended March 31, 2003, due to decreases in asset management and portfolio service fees reflectingdeclines in the outstanding balance of our Long-term Bond Investment Trusts.
Net revenue decreased by 21% from ¥60,047 million for the year ended March 31, 2001 to ¥47,207 millionfor the year ended March 31, 2002, mainly due to decreases in asset management and portfolio service feescaused primarily by the redemption of the Medium-term Japanese Government Bond Fund in September 2001and a decrease in the outstanding balance of stock investment trusts.
Non-interest expenses decreased by 9% from ¥37,031 million for the year ended March 31, 2002 to ¥33,866million for the year ended March 31,2003 partly due to a decrease in compensation and benefits.
35

Non-interest expenses decreased by 6% from ¥39,537 million for the year ended March 31, 2001 to ¥37,031million for the year ended March 31, 2002, due partly to a decrease in performance-linked compensation inaccordance with a decrease in its revenue.
Income before income taxes was ¥20,510 million for the year ended March 31, 2001, ¥10,176 million forthe year ended March 31, 2002, and ¥3,194 million for the year ended March 31, 2003.
Nomura Asset Management’s assets under management
As of March 31,
2001 2002 2003
(yen amounts in billions)
Publicly offered stock investment trusts . . . . . . . . . . . . . . . . . . . . . . ¥ 2,645 ¥ 3,199 ¥ 3,168Publicly offered bond investment trusts . . . . . . . . . . . . . . . . . . . . . . . 13,331 10,388 7,253Privately placed investment trusts . . . . . . . . . . . . . . . . . . . . . . . . . . . 162 181 238Investment advisory . . . . . . . . . . . . . . . . . . . . . . . . . . . . . . . . . . . . . . 4,904 4,447 3,578
Total . . . . . . . . . . . . . . . . . . . . . . . . . . . . . . . . . . . . . . . . . . . . . . . . . . ¥21,042 ¥18,214 ¥14,237
(Note) There are some assets that are calculated in a partially overlapping manner, due to funds of funds.
Asset Management Business of Nomura Asset Management
The assets under management of Nomura Asset Management accounted for ¥14.2 trillion for the year endedMarch 31, 2003, reflecting a decrease by ¥6.8 trillion from the year ended March 31, 2001, and a decrease of¥4.0 trillion from the year ended March 31, 2002. As of March 31, 2003, the assets under management ofNomura Asset Management included publicly offered stock investment trusts in the aggregate principle amountof ¥3.2 trillion, publicly offered bond investment trusts in the aggregate principal amount of ¥7.3 trillion,privately placed investment trusts in the aggregate principal amount of ¥0.2 trillion, and investment advisoryactivities covering assets in the amount of ¥3.6 trillion.
With respect to publicly offered stock investment trusts, in a trend that started in the year ended March 31,2002 and continued through the year ended March 31, 2003, a number of Exchange Traded Funds, to whichJapanese financial institutions contributed stocks, in relation to their unwinding of cross-shareholdings, wereestablished. Additionally, there was a substantial inflow of customer assets into foreign bond investment trusts,which are classified as stock investment trusts in Japan. During the year ended March 31, 2003, the Nikkei StockAverage dropped to ¥7,972 at year end from ¥11,024 at the beginning of the year, representing a decline of about28%.
As a result, the total net assets of stock investment trusts managed by Nomura Asset Management as ofMarch 31, 2003 amounted to ¥3,168 billion, representing ¥30 billion, or about 1%, a decrease from ¥3,199billion as of March 31, 2002. In addition, during the year ended March 31, 2003, some of our major clientsterminated investment advisory contracts with Nomura Asset Management, and, as a result, investment advisoryassets of Nomura Asset Management decreased to ¥3,578 billion as of March 31, 2003 from ¥4,447 billion as ofMarch 31, 2002.
With respect to publicly offered bond investment trusts, net assets declined about ¥3 trillion in each of theyears ended March 31, 2002 and 2003. In the year ended March 31, 2002, Nomura Asset Managementexperienced difficult business circumstances relating to Enron’s bankruptcy in the United States in late 2001. InNovember 2001, Enron’s bankruptcy prevented some asset management companies in Japan from keeping theunit price of their Money Management Funds, or MMFs, at the original investment value of ¥10,000. Thistriggered large withdrawals from MMFs, mainly by listed corporations and financial institutions, and hasdamaged the investment trusts industry in Japan, including other investment trust management companies,
36

including Nomura Asset Management whose MMFs’ unit prices remained above the original investment value.Nomura Asset Management’s MMFs decreased in terms of the principal amount by 54% from ¥3.9 trillion at theend of September 2001 to ¥1.8 trillion at the end of March 2002, and to ¥1.3 trillion at the end of March 2003.On January 18, 2002, the Investment Trusts Association of Japan announced new rules for MMFs. These newrules are intended to help the investment trusts industry regain investors’ confidence in MMFs. With respect toassets included in an investment trust, these rules specify limitations on the remaining maturity, average maturityand exposure in a single issuer, and minimum criteria on credit ratings to be obtained. Nomura AssetManagement has introduced the new rules to the management and asset structures of its MMFs.
For the year ended March 31, 2003, the aggregate principal amount of MMFs decreased by ¥500 billion,representing a 26% change. Due to a change of the appraisal method for composite bonds and general declines ininterest rates, the net assets for the publicly offered bond investment trusts, whose targeted distribution amountsdropped greatly, decreased by ¥2,269.5 billion from ¥6,299.5 billion at March 31, 2002 to ¥4,030.0 billion atMarch 31, 2003. At the same time, the net assets for publicly offered bond investment trusts decreased to ¥7.3trillion as of March 31, 2003, compared with ¥10.4 trillion at March 31, 2002.
The following table shows Nomura Asset Management’s share, in terms of net asset value, in the Japaneseasset management market as of the dates indicated. Nomura Asset Management’s market share in publiclyoffered investment trusts declined to 30% as of March 31, 2003 because of an overall increase in the market sizeof publicly offered stock investment trusts.
The share of Nomura Asset Management in the fund market of Japan
As of March 31,
2001 2002 2003
Total of publicly offered investment trusts . . . . . . . . . . . . . . . . . . . . . . . . . . . . . . 30% 33% 30%Stock investment trusts . . . . . . . . . . . . . . . . . . . . . . . . . . . . . . . . . . . . . . . . . 18% 21% 19%Bond investment trusts . . . . . . . . . . . . . . . . . . . . . . . . . . . . . . . . . . . . . . . . . . 35% 40% 40%
Defined contribution pension plan in Japan
In connection with the defined contribution business in Japan, we offer various services. Among otherthings, we provide consulting and support for plan implementation (plan design), product selection, provision ofinformation to subscribers, trust services, product supply, and investor education. As of the end of March 2003,there were 36 companies with respect to which we, through Nomura DC Planning Co., Ltd., were entrusted withthe administration and management of defined contribution plans, and the total number of participants in thoseplans was about 160, 000 persons, which was the largest in Japan.
Other Operating Results
Other operating results include gain (loss) on investment securities, equity in earnings (losses) of affiliates,amortization of goodwill, gain (loss) on sales of tangible assets, other losses arising from long-lived assets andcancellation of company agreements, corporate items and other financial adjustments. We introduced certainmethodologies to allocate Headquarters’ expenses creating global Headquarters account for our three businesssegments effective April 1, 2002 in order to better allocate the expenses based on benefits received by eachsegment. Had we not applied the current allocation methodologies for the year ended March 31, 2003, incomebefore income taxes for Domestic Retail, Global Wholesale and Asset Management would have been ¥ 42,758million, ¥ 99,734 million and ¥ 3,883 million, respectively. Please refer to Note 16 to the consolidated financialstatements for a reconciliation of segment results to income statement information.
Loss before income taxes in other operating results decreased from ¥143,397 million for the year endedMarch 31, 2002 to ¥40,705 million for the year ended March 31, 2003.
37

Loss before income taxes in other operating results increased from ¥60,455 million for the year endedMarch 31, 2001 to ¥143,397 million for the year ended March 31, 2002, mainly due to the impairment loss onour investment in JAFCO.
Among our listed affiliates that are accounted for under the equity method in our consolidated financialstatements, JAFCO, which is in the business of investing in and enhancing the equity value of non-listedcompanies, currently comprises a substantial portion of the aggregate carrying amount of our equity investments.During the years ended March 31, 2002 and 2003, the overall decline in market conditions in Japan led to adecrease in revenues relating to JAFCO-backed initial public offerings, and this contributed to a substantialdecline in JAFCO’s share price. As a result, we determined that there was an other-than-temporary loss on ourinvestment in JAFCO, and we recorded an impairment loss on that investment in the amount of ¥92,441 millionand ¥21,165 million for the year ended March 31, 2002 and 2003, respectively. This loss is included in “Non-interest expenses—Other” in our consolidated income statement for these years. For further information on theselosses, see Note 14 to our consolidated financial statements included in this annual report.
Investments in Equity Securities Held for Relationship Purposes
In our consolidated financial statements, operating investments, which refer to investments in equitysecurities of companies not affiliated with us which we hold on a long-term basis in order to promote existingand potential business relationships, are treated in accordance with U.S. GAAP for broker-dealers—they arerecorded at market value, with unrealized gains and losses on these investments being recognized in income.
Our operating investments share the following characteristics, which are based on customary businesspractices in Japan:
• We primarily acquire operating investments for business relationship purposes, and not for generatingcapital gains. We do so in order to promote existing and potential business relationships with Japanesefinancial institutions and corporations.
• We generally hold these investments for the long term, commensurate with our longstanding businessrelationships with the investees. We generally do not dispose of these investments for the purpose ofrealizing short-term capital gains.
• We do not, as a matter of business practice, generally dispose of these investments without consultingwith the investees beforehand. We have a business incentive in not disposing of an operating investmentwithout such prior consultation, because an investee may interpret the disposal as an indication that wewere placing less value on our business relationship with the investee and might, as retaliation, reduceor terminate the business it brings to us, thereby causing substantial harm to our business.
In pursuing our business strategy, we continuously review our business relationships with Japanesecompanies that are the investees of our operating investments.
In light of the characteristics of our operating investments as explained above, we do not include theunrealized profit/ (loss) on these investments in our segment information.
Effect of Consolidation/Deconsolidation of the PFG Entities
Prior to March 27, 2002, under U.S. GAAP, the PFG entities’ financial position and results of operationswere included in our consolidated financial statements because of our controlling financial interests in the PFGentities. We held controlling financial interests in each of the PFG entities through warrants, which enabled us topurchase equity interests in them. As described in “Principal Finance Group” below, on March 27, 2002, wecontributed most of our interests in certain of the PFG entities to Terra Firma Capital Partners I (“TFCPI”), alimited partnership involved in the private equity business, in exchange for a limited partnership interest. The
38

general partner of the limited partnership assumed control of these investments, together with one other PFGentity, Annington, which was not transferred to the partnership. Accordingly, we ceased consolidating the PFGentities at that time. The effects of consolidation and deconsolidation of the PFG entities are reflected in ourconsolidated financial statements but not in our segment information. This is because we view and treat our PFGbusinesses as private equity investments and because we manage these businesses based on management’sestimate of fair value. Our financial exposure is limited to the fair value of our direct investments. For a furtherexplanation of this accounting treatment, see Note 16 to our consolidated financial statements included in thisannual report.
Summary of Regional Contribution
For a summary of our net revenue, income before income taxes and identifiable assets by geographic region,see Note 16 to our consolidated financial statements included in this annual report.
Regulatory Capital Requirements
Many of our business activities are subjected to statutory capital requirements, including those of Japan, theUnited Kingdom, the United States and certain other countries in which we operate.
In Japan, we are subject to the capital adequacy rule of the Financial Services Agency. This rule requires themaintenance of a capital adequacy ratio of not less than 120%. The calculation of a capital adequacy ratio isdescribed in “Regulatory Capital Rules—Japan” under Item 4.B of this annual report. As of March 31, 2003, wehad a capital adequacy ratio of 260.2% compared to 231.6% as of March 31, 2002.
Some of our subsidiaries are subject to various regulatory requirements that may limit cash dividends andadvances to the Japanese parent company and that may establish minimum capital requirements. Thesesubsidiaries are in compliance with all applicable regulatory capital adequacy requirements.
Translation Exposure
A significant portion of our business is conducted in currencies other than yen—most significantly, U.S.dollars, British pounds and Euros. In foreign countries where we operate, our business is conducted in thecurrencies of those countries. We prepare financial statements of our foreign operations in their functionalcurrencies prior to consolidation into our financial statements. Translation exposure is the risk arising from theeffect of fluctuations in exchange rates on the net assets of our foreign subsidiaries. Translation exposure is notrecognized in our statements of operations unless and until we dispose of, or liquidate, the relevant foreignsubsidiary, which historically has not occurred, and which we do not expect to occur, frequently.
Critical Accounting Policies
Use of estimates
In presenting the consolidated financial statements, management makes estimates regarding certain financialinstrument and investment valuations, the outcome of litigation, the recovery of the carrying value of goodwill,the allowance for loan losses, the realization of deferred tax assets and other matters that affect the reportedamounts of assets and liabilities as well as the disclosure in the financial statements. Estimates, by their nature,are based on judgment and available information. Therefore, actual results may differ from estimates, whichcould have a material impact on the consolidated financial statements and, it is possible that such adjustmentscould occur in the near term.
39

Fair value for financial instruments
Fair value of financial instruments is based on quoted market prices, broker or dealer quotations or anestimation by management of the amounts expected to be realized upon settlement under current marketconditions. Fair value of exchange-traded securities and certain exchange-traded derivative contracts aregenerally based on quoted market prices or broker/dealer quotations. Where quoted market prices or broker/dealer quotations are not available, prices for similar instruments or valuation pricing models are considered inthe determination of fair value. Valuation pricing models consider time value, volatility and other statisticalmeasurements for the relevant instruments or for instruments with similar characteristics. These models alsoincorporate adjustments relating to the administrative costs of servicing future cash flow and market liquidityadjustments. These adjustments are fundamental components of the fair value calculation process.
Trading assets and trading liabilities, including derivative contracts, are recorded at fair value, andunrealized gains and losses are reflected in trading revenues. Fair values are based on quoted market prices orbroker/dealer quotations where possible. If quoted market prices or broker/dealer quotations are not available orif the liquidation of our positions would reasonably be expected to impact quoted market prices, fair value isdetermined based on valuation pricing models that take into consideration time value and volatility factorsunderlying the financial instrument.
Valuation pricing models and their underlying assumptions impact the amount and timing of unrealizedgains and losses recognized, and the use of different valuation models or underlying assumptions could producedifferent financial results. Changes in the fixed income, equity, foreign exchange and commodity markets willimpact our estimates of fair value in the future, potentially affecting trading revenues. To the extent financialcontracts have extended maturity dates, our estimates of fair value may involve greater subjectivity due to thelack of transparent market data available upon which to base underlying modeling assumptions.
In determining fair value, we set forth five categories of financial instruments as described below:
Billions of yen
Translation intobillions ofU.S. dollars
March 31, 2003
Assets Liabilities Assets Liabilities
Trading securities, including securities pledged as collateral(1) . . . . . . . . . ¥8,474 ¥3,375 $72 $ 29Non-trading debt securities . . . . . . . . . . . . . . . . . . . . . . . . . . . . . . . . . . . . . 270 — 2 —Investments in equity securities . . . . . . . . . . . . . . . . . . . . . . . . . . . . . . . . . . 138 — 1 —Private equity investments . . . . . . . . . . . . . . . . . . . . . . . . . . . . . . . . . . . . . . 271 — 2 —Derivative contracts(1) . . . . . . . . . . . . . . . . . . . . . . . . . . . . . . . . . . . . . . . . . . 541 514 5 4
(1) Securities options are classified as derivative contracts.
The following table sets forth the valuation of trading securities, non-trading debt securities, investment inequity securities and private equity investments by level of price transparency:
Billions of yen
March 31, 2003
With pricetransparency
With little or noprice transparency Total
Trading securities inventory . . . . . . . . . . . . . . . . . . . . . . . . . . . . . . . . . . . ¥7,883 ¥591 ¥8,474Trading securities sold but not yet purchased . . . . . . . . . . . . . . . . . . . . . 3,366 9 3,375Non-trading debt securities . . . . . . . . . . . . . . . . . . . . . . . . . . . . . . . . . . . 94 176 270Investments in equity securities . . . . . . . . . . . . . . . . . . . . . . . . . . . . . . . . 93 45 138Private equity investments . . . . . . . . . . . . . . . . . . . . . . . . . . . . . . . . . . . . — 271 271
40

The fair value of trading securities, non-trading debt securities, and investments in equity securities isgenerally obtained from quoted market prices or broker/dealer quotations with reasonable level of pricetransparency, or priced with reference to comparable financial instruments whose parameters can be directlyobserved.
The types of instruments valued in this manner include listed equity, major sovereign government andagency bonds, supernational bonds, municipal bonds, corporates, liquid mortgage backed securities and moneymarket instruments.
Certain trading and non-trading debt securities are less liquid and priced using management’s best estimateof fair value. These type of instruments include non-investment grade and distressed corporates debt, emergingmarket debts, mortgage and commercial loans, mortgage derivatives, non-investment grade peace of structurednotes, and notes with embedded exotic option.
Private equity investments
We had been actively involved in the private equity business, through our U.K. based Principal FinanceGroup (“PFG”). As a result of a review to determine the optimum structure to run this business going forward, onMarch 27, 2002. We restructured PFG and, as a result, contributed our investments in certain of our remaininginvestee companies (the “PFG entities”) to Terra Firma Capital Partners I (“TFCP I”), a limited partnershipwhich is engaged in the private equity business. As a result of our contribution of our investments in the PFGentities to TFCP I in exchange for a limited partnership interest, Terra Firma Investments (GP) Limited (“TerraFirma”), the general partner of TFCP I, which is independent of us, assumed control of these investments,together with one investment, Annington Holdings plc, which was not transferred to the partnership. Accordinglywe ceased consolidating the investments on such date. Terra Firma Capital Partners Limited (“TFCPL”) has beenestablished by some of our former employees to advise Terra Firma in relation to the management of TFCP I aswell as to raise and to invest of additional capital obtained from third parties. With effect from March 27, 2002,we account for our investments managed and controlled by Terra Firma (collectively referred to as “the TerraFirma investments”) at fair value in accordance with accounting practice for broker-dealers.
As stated above, the investments controlled and managed by Terra Firma are carried at fair value.Corresponding changes in the fair value of these investments are included in gains/losses on private equityinvestments. The determination of fair value is significant to our financial condition and results of operations andrequires management to make judgements based on complex factors.
As the underlying investments are in non-publicly listed companies, there are no external quoted marketprices available. As a result, our Risk Management unit meets with TFCPL and the management teams of theunderlying investments to discuss, among other things, Terra Firma’s valuation of the investments, currentbusiness performance, actual versus budgeted results, revised full year projections and the status of majorinitiatives to boost sales, or reduce operating costs. Terra Firma also provides regular performance reports foreach investment. The information obtained from these meetings and reports, together with comparisons made tosimilar quoted businesses and, in the case of any property based investments, input from external advisors allowsus to produce our own estimates of the fair value for each underlying investment.
In estimating fair value, we estimate the price that would be obtained between a willing buyer and a willingseller dealing at arm’s length.
Valuations are typically based on projected future cash flows to be generated from the underlyinginvestment, discounted at a weighted average cost of capital. The cost of capital is estimated, where possible, byreference to quoted comparables with a similar risk profile. Cash flows are derived from the bottom up, withdetailed projections prepared by management of each respective investment. These projections will reflect thebusiness drivers specific to each investment.
41

Examples of the factors affecting the business valuations are set out in the table below:
Sector Valuation Factors
Hotels Room rate achieved and occupancy, which in turn are driven by business and leisure travel.Revenue from conference facilities and food and beverage sales.Staff and other costs and central overheads.
Real Estate Sales values, leaseback and open market rental values achieved, driven by underlyingdemand for housing in both the homeowner and rental markets.Property holding and refurbishment and head office costs.Availability and cost of finance.
Consumer Finance Number of rental agreements outstanding, average revenue per rental agreement (taking intoaccount arrears), rental acquisition costs, rental maintenance costs, as well as overheads andhead office costs.
Retail Market share, changes in market size, underlying trends in consumer behavior.Gross margin and operating costs, including outlet overheads and head office costs.
Services Contract terms negotiated at beginning of contract. Initial contract set up costs and capitalexpenditure. Ongoing servicing costs, including staff costs and central overheads.Additional contracts and additional non-contracted works. Availability and cost of finance.
Where possible, these valuations are compared with price/earnings data for comparable quoted companiesor recent market price data for comparable transactions. Any significant differences are analyzed andconsideration given to whether this analysis indicates an adjustment to the Discounted Cash Flow valuation isrequired. While it is likely that certain potential purchasers may have special interests in the relevant investmentsthat would allow them to justify a premium price, such as synergy or strategic benefits, no such premium hasbeen included within the valuation models. Conversely, no discounts have been taken for the fact that there mayonly be a limited number of potential purchasers of the investments. These valuations are then stress tested toassess the impact of particular risk factors. Examples of such stress tests include:
• Stressing exit assumptions, either by altering the timing or the exit multiple used. In particular, usingexit multiples in line with 5-year lows of trading multiples for similar companies are considered
• Stressing growth assumptions, to assume lower growth. Where possible, the impact of a mild recessionis considered
• Removing or curtailing any assumptions about increases in operating margins.
An assessment of the results of the fair value exercise and the stress tests allows the final estimatedvaluation to be established. The fair value of Terra Firma investments represents the sum of the fair values of theindividual investments less any performance bonuses that may be payable, either to the management team of aparticular business or to Terra Firma.
For recently acquired investments (i.e., those acquired within 12 months), fair value is equal to acquisitioncost unless there has been a material change to the operating performance of the specific investment or asignificant event has occurred in the marketplace.
The estimated fair value of Terra Firma investments was ¥265,714 million and ¥265,742 million atMarch 31, 2002 and 2003, respectively. Of these amounts, the respective percentages at March 31, 2002 and2003 were 47% and 64% for Real Estate, 9% and 6% for the Services Sector and the remaining balance of 44%and 30% for the Consumer Businesses, which include Retail, Consumer Finance and Hotels.
The use of different valuation models, methodologies or assumptions could produce materially differentestimates of fair value, which could materially affect the results of operations or statement of financial condition.
42

Derivative contracts
Derivative contracts consist of listed derivatives and OTC derivatives. The fair values of listed derivativesare generally determined from quoted market prices. OTC derivatives are valued using valuation models. Listedderivative and OTC derivative assets and liabilities are shown below:
Billions of yenTranslation into
billions of U.S. dollars
March 31, 2003
Assets Liabilities Assets Liabilities
Listed derivatives . . . . . . . . . . . . . . . . . . . . . . . . . . . . . . . . . . . . . . . . . . . . ¥ 21 ¥ 14 $0 $0OTC derivatives . . . . . . . . . . . . . . . . . . . . . . . . . . . . . . . . . . . . . . . . . . . . . 520 500 5 4
¥541 ¥514 $5 $4
The fair values of OTC derivative assets and liabilities at March 31, 2003 by remaining contractual maturityare shown below:
Billions of yen
Years to Maturity
Cross-maturitynetting(1)
Totalfairvalue
Lessthan1 year
1 to 3years
3 to 5years
5 to 7years
Morethan
7 years
OTC derivative assets . . . . . . . . . . . . . . . . . . . . . . . . . . . . ¥133 ¥307 ¥241 ¥229 ¥683 ¥(1,073) ¥520OTC derivative liabilities . . . . . . . . . . . . . . . . . . . . . . . . . 102 259 258 213 776 (1,108) 500
Note: (1) This item represents the netting of payable balances with receivable balances for the samecounterparty across maturity band categories. Receivable and payable balances with the samecounterparty in the same maturity category, however, are netted within the maturity category.
Fair values for OTC derivatives are estimated using price models based on net present value of estimatedfuture cash flows. Price transparency for OTC derivative varies depending on product type, maturity and thecomplexity of the contract. Foreign exchange forwards, interest rate swaps and cross currency swaps in majorcurrencies are the types of derivative contracts with high degree of price transparency as they are valued withmodel with readily observable market parameters. Long dated foreign exchange options, credit basket defaultswaps, swaps with multiple call feature and other complex derivatives often valued with correlations andvolatilities that needs some estimates and judgment, and they are less transparent in pricing.
Transfers of financial assets
We account for the transfer of financial assets in accordance with Statement of Financial AccountingStandards (“SFAS”) No. 140, “Accounting for Transfers and Servicing of Financial Assets and Extinguishmentsof Liabilities” (SFAS 140). This statement requires that we account for the transfer of financial assets, occurringafter March 31, 2001, as a sale when we relinquished control over the asset. SFAS 140 deems control to berelinquished when the following conditions are met: (a) the assets have been isolated from the transferor (even inbankruptcy or other receivership), (b) the transferee has the right to pledge or exchange the assets received and(c) the transferor has not maintained effective control over the transferred assets. In connection with itssecuritization activities, we utilize special purposes entities principally for (but not limited to) the securitizationof commercial and residential mortgages, home equity loans, government and corporate bonds, and lease andtrade receivables. We derecognized financial assets transferred in securitizations provided that control over suchassets has effectively been relinquished.
We have historically used special purpose entities or, SPE vehicles, as conduits and have generally notretained a financial interest in the asset securitizations. In conduit transactions, we serve as the administrator.
43

Conduits provide clients with a way to access liquidity in the commercial paper markets by allowing clients tosell assets to the conduit, which in return issues commercial paper to fund the purchases. The commercial paperissued by the conduits is supported with sufficient collateral and other credit enhancements to receive at least anA-1 or P-1 rating. We may obtain an interest in the financial assets in the future, which may include residualinterests in the special purpose entities established to facilitate the securitization. Any such interests would beincluded in Securities inventory within our balance sheet. We record our securities inventory, including suchinterests, at fair value with any changes in fair value included in revenues.
Accounting Developments
In June 2002, the FASB issued SFAS No. 146, “Accounting for Costs Associated with Exit or DisposalActivities.” The statement specifies the accounting for certain employee termination benefits, contracttermination costs and costs to consolidate facilities or relocate employees and is effective for exit and disposalactivities initiated after December 31, 2002. The implementation of SFAS No. 146 did not have a material impacton our financial condition or results of operations for the year ended March 31, 2003.
In November 2002, the FASB issued FIN No. 45, “Guarantor’s Accounting and Disclosure Requirementsfor Guarantees, Including Indirect Guarantees of Indebtedness of Others.” FIN No. 45 specifies the disclosures tobe made about obligations under certain issued guarantees and requires a liability to be recognized for the fairvalue of a guarantee obligation. The recognition and measurement provisions of the interpretation applyprospectively to guarantees issued or amended after December 31, 2002. The disclosure provisions are effectivewith our year ended March 31, 2003. The implementation of FIN No. 45 did not have a material impact on ourfinancial condition or results of operations for the year ended March 31, 2003.
In January 2003, the FASB released FIN No. 46, which clarifies when an enterprise should consolidate anentity that meets the definition of a variable interest entity, or a VIE. A VIE is an entity in which equity investorsdo not have the characteristics of a controlling financial interest or do not have sufficient equity at risk for theentity to finance its activities without additional subordinated financial support from other parties, and mayinclude many types of SPEs. FIN No. 46 requires that an enterprise shall consolidate a VIE if that enterprise hasa variable interest that will absorb a majority of the VIE’s expected losses, receive a majority of the VIE’sexpected residual returns, or both. FIN No. 46 is effective immediately for newly created VIEs after January 31,2003. The effective date for VIEs that existed before February 1, 2003 is July 1, 2003.
With respect to certain VIEs created before February 1, 2003, we believe that it is reasonably possible thatwe will either be required to disclose additional information about such entities in which we hold a significantvariable interest or of which we will be the primary beneficiary as of July 1, 2003. At March 31, 2003, inconnection with our Global Wholesale business, the aggregate size of these entities in which our interest is eithersignificant or of which we could be deemed to be the primary beneficiary was ¥818 billion ($7 billion), of which¥271 billion ($2 billion) is already recorded on the consolidated balance sheet at that date. Our variable interestsassociated with these entities, primarily the Terra Firma investments, financial asset-backed securitizations,credit-linked notes, and collateralized debt and loan obligation entities, are ¥271 billion ($2 billion), whichrepresents our maximum exposure to loss at March 31, 2003. Our variable interests of ¥271 billion ($2 billion)are already recorded on the consolidated balance sheet at that date.
It is reasonably possible that, as a result of consolidating certain entities that are not currently consolidated,FIN No. 46 could have a material impact on our consolidated financial statements in the future, althoughadopting FIN No. 46 will not materially change our economic exposure with respect to these entities. This isespecially true for the Terra Firma investments; should we conclude that FIN No. 46 applies to these investmentsand that either all, or some, require re-consolidation. See “Principal Finance Group” discussed below withrespect to the impact of de-consolidation in March 2002.
44

We purchase and sell interests in entities that may be deemed to be VIEs in our market-making capacity inthe ordinary course of our Global Wholesale business. As a result of these activities, it is reasonably possible thatsuch entities may be consolidated and deconsolidated at various points in time. Therefore, the variable interestsreferred to above may not be held by us at March 31, 2004. We are currently assessing the potential impact ofadoption of FIN No. 46.
In April 2003, the FASB issued SFAS No. 149, “Amendment of Statement 133 on Derivative Instrumentsand Hedging Activities”. SFAS No. 149 amends and clarifies accounting for derivative instruments, includingcertain derivative instruments embedded in other contracts, and for hedging activities under SFAS No. 133. Thenew guidance amends SFAS No. 133 for decisions made as part of the Derivatives Implementation Group(“DIG”) process that effectively required amendments to SFAS No. 133, and decisions made in connection withother FASB projects dealing with financial instruments and in connection with implementation issues raised inrelation to the application of the definition of a derivative and characteristics of a derivative that containsfinancing components. In addition, it clarifies when a derivative contains a financing component that warrantsspecial reporting in the statement of cash flows. SFAS No. 149 is effective for contracts entered into or modifiedafter June 30, 2003 and for hedging relationships designated after June 30, 2003. We are currently assessing theimpact of SFAS No. 149 on the consolidated financial statements.
In May 2003, the FASB issued SFAS No. 150, “Accounting for Certain Financial Instruments withCharacteristics of both Liabilities and Equity”. SFAS No. 150 requires an issuer to classify certain financialinstruments with characteristics of both liabilities and equity as liabilities (or an asset in some circumstances).Many of those instruments were previously classified as equity. Under SFAS No. 150, certain financialinstruments issued in the form of shares that are mandatorily redeemable, that embody an obligation torepurchase the issuer’s equity shares, and that the issuer must or may settle by issuing a variable number of itsequity shares, are classified as liabilities. SFAS 150 is effective for financial instruments entered into or modifiedafter May 31, 2003, and otherwise is effective at the beginning of the first interim period beginning after June 15,2003. We are currently assessing the impact of SFAS No. 150 on the consolidated financial statements.
Principal Finance Group
Background
In the period from 1995 to March 2002, we made a series of 16 private equity investments in variousbusinesses, for a total investment of ¥678 billion. We refer to this business as the Principal Finance Group, orPFG, business. The businesses in which we had invested, referred to as the “PFG entities”, are primarily locatedin the United Kingdom, Germany and the United States, and are in basic service industries with stable operatingresults and cash flows.
Examples of companies we have bought and sold in this area include: AT&T Capital Corporation, a U.S.leasing and commercial finance company; Angel Train Contracts, a privatized U.K. rolling stock company;William Hill, a major U.K. bookmaker; and Angel Street Capital Limited, a U.K. pub company. Currentinvestments include: Le Grand Cap Limited, a U.K. pub company; Carmelite Capital Limited, a consumer rentalcompany with operations primarily in Western Europe; Annington Holdings plc and Deutsche AnningtonHoldings Limited, residential property rental companies in the United Kingdom and Germany, respectively; andThresher Wines Capital Limited, the largest specialist off-license retailer in the United Kingdom.
45

PFG Portfolio
A summary of the principal operating PFG entities as of March 27, 2002, immediately prior to thereorganization described below, were as follows:
Name of Company Activity Location
Carmelite Capital Limited Rental and sale of consumer United KingdomElectronics
Thresher Wines Capital Limited Sale of beer, wine and spirits United KingdomAnnington Holdings plc Investment in properties United KingdomDeutsche Annington Holdings Investment in properties GermanyLimited
Meridien Capital Limited Hotels United Kingdom
We invested in these businesses for capital appreciation purposes, which we expected to realize after a fiveto seven year holding period, although we exited some investments for significant returns in a shorter period.Value is generated through fundamentally changing strategy, hiring and empowering new management, andachieving operational efficiencies in each of the companies acquired.
Prior to the reorganization described below, for financial reporting purposes, the PFG entities’ financialposition and results of operations were recorded using purchase accounting at the date of the acquisition and wereconsolidated in our consolidated financial statements because we had controlling financial interests in the PFGentities. We held these controlling financial interests through our holding of warrants to purchase equity interestsin the PFG entities.
PFG Reorganization
On March 27, 2002, we contributed our interests in certain of the PFG entities to Terra Firma CapitalPartners I (“TFCPI”), a limited partnership in exchange for a limited partnership interest. Terra FirmaInvestments (GP) Limited (“Terra Firma”), the general partner of TFCP I, which is independent of us, assumedcontrol of these investments. Terra Firma also assumed control of one other PFG entity, Annington, via adiscretionary management agreement. For all of these investments (referred to as “Terra Firma investments”), weassumed the role of a passive investor and we ceased consolidating the PFG entities at that time. On that date, webegan accounting for our Terra Firma investments at fair value in accordance with the accounting practices forbroker-dealers and include this investment in “Private equity investments” in our consolidated balance sheet.This accounting treatment is effective only for periods on and after March 27, 2002. Thus, our operating resultsfor the year ending March 31, 2003 will not be directly comparable to prior years regarding the PFG entities.
We recognized revenue amounting to ¥232,472 million through the deconsolidation of the PFG entities.This gain is a result of the March 31,2002 estimated fair value exceeding the carrying value of the investment.The carrying value was the cost of the investment less book losses incurred during the period of ownership. Inother words, the 2002 gain on deconsolidation is primarily the reversal of losses that had previously beenconsolidated. The fair value of our investments in Terra Firma investments shows their economic value which isa more meaningful representation of the risk we incur. Fair value is typically derived from projected future cashflows to be generated by the investment, discounted at its weighted average cost of capital and, in some cases,real estate property valuations received from independent valuation specialists as discussed in “CriticalAccounting Policies” above. As of March 31, 2003, the estimated aggregate fair value of Terra Firmainvestments was ¥265,742 million.
46

B. Liquidity and Capital Resources.
Liquidity
Cash Flow
Our cash flows are primarily related to the operating and financing activities undertaken in connection withour trading and market-making businesses. Following is summary information on consolidated cash flows for theyear ended March 31, 2003:
Year Ended March 31, 2003
(in billions)
Net cash provided by operating activities . . . . . . . . . . . . . . . . . . . . . . . . . . . . . . . . . . . . . ¥ 34.1Net income . . . . . . . . . . . . . . . . . . . . . . . . . . . . . . . . . . . . . . . . . . . . . . . . . . . . . . . . 119.9Trading assets and private equity investments . . . . . . . . . . . . . . . . . . . . . . . . . . . . . (1,182.1)Trading liabilities . . . . . . . . . . . . . . . . . . . . . . . . . . . . . . . . . . . . . . . . . . . . . . . . . . . 1,242.3Other, net . . . . . . . . . . . . . . . . . . . . . . . . . . . . . . . . . . . . . . . . . . . . . . . . . . . . . . . . . (146.0)
Net cash provided by investing activities . . . . . . . . . . . . . . . . . . . . . . . . . . . . . . . . . . . . . 134.1Decrease in non-trading debt securities, net . . . . . . . . . . . . . . . . . . . . . . . . . . . . . . . 152.2Other, net . . . . . . . . . . . . . . . . . . . . . . . . . . . . . . . . . . . . . . . . . . . . . . . . . . . . . . . . . (18.1)
Net cash used in financing activities . . . . . . . . . . . . . . . . . . . . . . . . . . . . . . . . . . . . . . . . (24.6)Increase in long-term borrowings, net . . . . . . . . . . . . . . . . . . . . . . . . . . . . . . . . . . . 330.2Decrease in short-term borrowings, net . . . . . . . . . . . . . . . . . . . . . . . . . . . . . . . . . . (290.8)Other, net . . . . . . . . . . . . . . . . . . . . . . . . . . . . . . . . . . . . . . . . . . . . . . . . . . . . . . . . . (64.0)
Effect of exchange rate changes . . . . . . . . . . . . . . . . . . . . . . . . . . . . . . . . . . . . . . . . . . . . (9.0)
Net increase in cash and cash equivalents . . . . . . . . . . . . . . . . . . . . . . . . . . . . . . . . . . . . ¥ 134.6
Liquidity Objective
We maintain a highly liquid balance sheet comprised primarily of marketable securities matched with aliability structure that ensures that liquidity is available regardless of market conditions. We aim to withstandmarket shocks for periods lasting over one year without raising additional unsecured financing or forcing theliquidation of assets, although we may from time to time decide to sell assets in the course of normal business orfor strategic purposes. Our management establishes our overall liquidity policies.
Liquidity Policy
In order to meet our liquidity objective, we have designed the following liquidity policies:
Ensure Appropriate Funding Mix. We aim to maintain enough long-term debt and equity to meet the cashcapital requirements of all of our assets. Liquidity is measured by our ability in a stress condition to finance thoseassets using secured funding, including repurchase agreements and securities lending transactions. We financethe cash capital needs of our assets with long-term debt and equity, and we calculate such needs usingconservative estimates of the assets’ secured borrowing power.
Consistent with the aim of maintaining an appropriate funding mix, we have reduced our reliance on short-term unsecured financing, thereby diminishing the effect of a potential liquidity event. As of March 31, 2003, ourlong-term unsecured financing totaled ¥1,955.4 billion, well over the short-term unsecured financing amount of¥914.0 billion. For the most part, our long-term debt is issued on a variable rate basis, and is linked to short-termmoney market indices to avoid interest rate risk arising from a change in the shape of the yield curve. All of ourstructured notes are hedged with financial instruments in order to realize a scheduled cash flow.
Maintain a Liquidity Portfolio. We aim to maintain a portfolio of cash and highly liquid securities thatcould be converted to cash through sale or pledge so that we could satisfy immediate liquidity requirements. As
47

of March 31, 2003, we maintained a ¥1,629.1 billion liquidity portfolio that consisted of cash, cash equivalentsand government securities, mostly denominated in Japanese yen and U.S. dollar, as shown in the table below:
March 31, 2003
(in billions)
Liquidity Portfolio . . . . . . . . . . . . . . . . . . . . . . . . . . . . . . . . . . . . . . . . . . . . . . . . . . . . . . . . . . . . . . . ¥1,629.1Cash, Cash Equivalent and Deposits . . . . . . . . . . . . . . . . . . . . . . . . . . . . . . . . . . . . . . . . . . . . . 913.8Overnight Call Loans . . . . . . . . . . . . . . . . . . . . . . . . . . . . . . . . . . . . . . . . . . . . . . . . . . . . . . . . . 113.6Government Securities . . . . . . . . . . . . . . . . . . . . . . . . . . . . . . . . . . . . . . . . . . . . . . . . . . . . . . . . 601.8
Net Liquidity Value of Other Unencumbered Assets . . . . . . . . . . . . . . . . . . . . . . . . . . . . . . . . . . . . 1,085.3
We have structured our liquidity portfolio under the assumption that in some instances legal and regulatoryrequirements may restrict the flow of funds between entities in our consolidated group, and that funds orsecurities may not be freely transferable from a subsidiary to the parent company. The cost of and availability toa company of unsecured funding generally are dependent on credit ratings and could be adversely affected by adebt rating downgrade or deterioration in certain of the company’s financial ratios or other measures of financialperformance. For example, cost of issuing commercial paper may rise due to a downgrade of our short-term debtratings. The structuring of our liquidity portfolio hence takes into consideration the following:
• upcoming maturities of unsecured debt,
• potential buy backs of our outstanding debt,
• collateral outflows related to derivatives transactions,
• market halt due to a large-scale disaster, and
• difficulty in issuing new debt due to downgrade of our short-term and or long-term debt ratings.
As of March 31, 2003, the aggregate value of the liquidity portfolio and the estimated net liquidity value ofother unencumbered assets was ¥2,714.4 billion, which represented 297% of our total short-term unsecuredfinancing.
Diversify Funding Sources. We seek to reduce refinancing risk by maintaining well-diversified sources ofunsecured funding. We diversify funding by product and market. We benefit by distributing a significant portionof our liabilities through our own sales force to a large diversified global client base.
As of March 31, 2003, our unsecured funding sources were as follows:
March 31, 2003
(yen amounts in billions)Short-Term Unsecured Debt Total(1) . . . . . . . . . . . . . . . . . . . . . . . . . . . . . ¥ 914.0 20.3%
Short-Term Bank Borrowing . . . . . . . . . . . . . . . . . . . . . . . . . . . . . . . 117.1Other Loans . . . . . . . . . . . . . . . . . . . . . . . . . . . . . . . . . . . . . . . . . . . . 15.8Commercial Paper . . . . . . . . . . . . . . . . . . . . . . . . . . . . . . . . . . . . . . . 251.2
Deposit at Banking Entities . . . . . . . . . . . . . . . . . . . . . . . . . . . . . . . . 233.5Certificate of Deposits . . . . . . . . . . . . . . . . . . . . . . . . . . . . . . . . . . . . 22.7Bonds and Notes maturing within one year . . . . . . . . . . . . . . . . . . . . 273.7
Long-Term Unsecured Debt Total . . . . . . . . . . . . . . . . . . . . . . . . . . . . . . . 1,955.4 43.3%Long-Term Bank Borrowing . . . . . . . . . . . . . . . . . . . . . . . . . . . . . . . 296.4Other Loans . . . . . . . . . . . . . . . . . . . . . . . . . . . . . . . . . . . . . . . . . . . . 155.4Bonds and Notes . . . . . . . . . . . . . . . . . . . . . . . . . . . . . . . . . . . . . . . . . 1,503.6
Equity . . . . . . . . . . . . . . . . . . . . . . . . . . . . . . . . . . . . . . . . . . . . . . . . . . . . . 1,642.3 36.4%
(1) Short-Term Unsecured Debt does not include secured loan from Bank of Japan.
48

Maintain Committed Bank Facilities. We maintain undrawn committed revolving credit facilities with agroup of global banks in order to provide contingent financing sources. Almost all of these facilities havematurities of less than one year, so that the maturity dates of these facilities are spotted evenly in order to preventhaving excessive maturities of facilities in one day or any given period. We do not believe that any of thecovenant requirements in any of the facilities will impair our ability to obtain funding under the facilities. Theundrawn portion of these facilities amounted to ¥921.4 billion as of March 31, 2003.
Reduce Refinancing Risk. In order to manage refinancing risk, we set limits for the amount of debtmaturing each year and during any quarter. We maintain a detailed contingency funding plan that is updatedperiodically to assure ample liquidity in the event that our access to financing is impaired.
Credit Ratings
The cost and availability of unsecured funding generally are dependent on credit ratings. Our long-term andshort-term debt were rated by several recognized credit rating agencies. As of March 31, 2003, the credit ratingsof Nomura Holdings and Nomura Securities provided by such credit rating agencies were as follows:
Short-termDebt Senior Debt
Nomura Holdings, Inc.Standard & Poor’s . . . . . . . . . . . . . . . . . . . . . . . . . . . . . . . . . . . . . . . . . . . . . . . . . . . . . . . . A-2 BBBMoody’s Investors Service . . . . . . . . . . . . . . . . . . . . . . . . . . . . . . . . . . . . . . . . . . . . . . . . . P-2 Baa2Rating and Investment Information, Inc. . . . . . . . . . . . . . . . . . . . . . . . . . . . . . . . . . . . . . . . a-1 A+Japan Credit Rating Agency, Ltd. . . . . . . . . . . . . . . . . . . . . . . . . . . . . . . . . . . . . . . . . . . . . Not rated AA
Nomura Securities Co., Ltd.Standard & Poor’s . . . . . . . . . . . . . . . . . . . . . . . . . . . . . . . . . . . . . . . . . . . . . . . . . . . . . . . . A-2 BBB+Moody’s Investors Service . . . . . . . . . . . . . . . . . . . . . . . . . . . . . . . . . . . . . . . . . . . . . . . . . P-2 Baa1Rating and Investment Information, Inc. . . . . . . . . . . . . . . . . . . . . . . . . . . . . . . . . . . . . . . . a-1 A+Japan Credit Rating Agency, Ltd. . . . . . . . . . . . . . . . . . . . . . . . . . . . . . . . . . . . . . . . . . . . . Not rated AA
We believe that our credit ratings include the credit rating agencies’ assessment of the general operatingenvironment, our positions in the markets in which we compete, reputation, movements and volatility of ourearnings, risk management policies, liquidity and capital management. An adverse change in any of these factorscould result in a reduction in our credit ratings, and that could, in turn, increase our borrowing costs and limit ouraccess to the capital markets or require us to post additional collateral and permit counterparties to terminatetransactions pursuant to certain of our contractual obligations.
Capital
Capital Adequacy
We aim to maintain sufficient capital at all times to withstand losses due to extreme market movements. Oursenior management is responsible for implementing and enforcing capital policies. This includes thedetermination of our balance sheet size and required capital levels. We continuously review our equity capitalbase to ensure that it can support the economic risk inherent in our business. There are also regulatoryrequirements for minimum capital of entities that operate in regulated securities businesses.
49

Our capital was ¥1,642.3 billion as of March 31, 2003 compared with ¥1,604.9 billion as of March 31, 2002.The following table sets forth our shareholders’ equity, total assets, adjusted assets and leverage ratios:
March 31,
2002 2003
(yen amounts in billions)Shareholders’ equity . . . . . . . . . . . . . . . . . . . . . . . . . . . . . . . . . . . . ¥ 1,604.9 ¥ 1,642.3Total assets . . . . . . . . . . . . . . . . . . . . . . . . . . . . . . . . . . . . . . . . . . . 17,758.3 21,169.4Adjusted assets(1) . . . . . . . . . . . . . . . . . . . . . . . . . . . . . . . . . . . . . . . 11,908.4 13,585.4Leverage ratio(2) . . . . . . . . . . . . . . . . . . . . . . . . . . . . . . . . . . . . . . . . 11.1x 12.9xAdjusted leverage ratio(3) . . . . . . . . . . . . . . . . . . . . . . . . . . . . . . . . 7.4x 8.3x
Notes:(1) Adjusted assets represent total assets less securities purchased under agreements to resell and the receivable
for securities pledged as collateral.(2) Leverage ratio equals total assets divided by shareholders’ equity.(3) Adjusted leverage ratio equals adjusted assets divided by shareholders’ equity.
During the year ended March 31, 2003, we repurchased 22 million shares of our common stock. In April2003, we repurchased additional 3 million shares. Between June 26, 2003, the date of our ordinary generalmeeting of shareholders in 2004, and the date of the next ordinary general meeting of shareholders, we areauthorized to repurchase up to 100 million shares for up to ¥150 billion. See “Rights of Our Shareholders—Repurchase by Us of Shares” under Item 10.B of this annual report.
Capital PolicyCapital adequacy is an important strategic objective of our financial management. We have devised a global
risk management methodology that seeks to ensure our capital is adequate to cover the economic risks inherent toour businesses, including market risk, credit risk, event risk, and market liquidity risk. Under this methodology,we calculate the required capital levels of our businesses based on our trading strategies. To determine ouraggregate required capital level, we use a portfolio methodology that is based on conservative diversificationassumptions. Adequacy on a legal entity basis is driven by a combination of regional economic needs togetherwith regulatory requirements and rating agency guidelines. We constantly review our capital base and ourbusiness mix to ensure it delivers return on equity commensurate to our risk profile, the market circumstances,and our peer group.
Contractual Obligations, Contingent Liabilities and CommitmentsIn connection with our operating activities, we enter into certain contractual obligations, contingent
liabilities and commitments. The following table shows our significant contractual obligations, contingentliabilities and commitments, which may require future payments at March 31, 2003:
Totalcontractualamount
Years to Maturity Crossmaturitynetting(2)
Less than1 year
1 to 3years
4 to 5years
More than5 years
(in millions)Long-term debt . . . . . . . . . . . . . . . . ¥2,269,370 ¥313,933 ¥433,138 ¥400,694 ¥1,121,605 ¥ —Operating leases . . . . . . . . . . . . . . . 34,269 5,344 8,324 6,671 13,930 —Commitments to extend credit andnote issuance facilities . . . . . . . . 218,862 44,663 129,779 1,082 43,338 —
Derivative contracts(1) . . . . . . . . . . . 513,905 114,155 260,296 258,298 988,783 (1,107,627)Standby letters of credit and otherguarantees . . . . . . . . . . . . . . . . . . 49,449 49,209 — — 240 —
Notes:(1) Represents the liability balance of derivative contracts at March 31, 2003. Securities options are classified
as derivative contracts.(2) This item represents netting of payable balances with receivable balances for the same counterparty across
maturity band categories. Receivable and payable balances with the same counterparty in the same maturitycategory, however, are net within the maturity category.
50

At March 31, 2003, we have commitments to enter into resale and repurchase agreements of ¥1,957 billion($ 17 billion) and ¥3,514 billion ($30 billion), respectively.
We have ¥28 billion ($0.2billion) of investment commitments in connection with our private equity andother merchant banking activities at March 31, 2003
C. Research and Development, Patents and Licenses, etc.
Not applicable.
D. Trend Information.
The information required by this item is set forth in Item 5.A of this annual report.
E. Off-Balance Sheet Arrangements.
Not applicable.
F. Tabular Disclosure of Contractual Obligations.
Not applicable.
Item 6. Directors and Senior Management and Employees.
A. Directors and Senior Management.
Directors
The following table provides information about Nomura’s Directors as of June 26, 2003. With respect to theinformation under “Business Experience” below, some of the Directors changed their titles upon our adoption ofthe holding company structure on October 1, 2001 and the Committee System on June 26, 2003, as described inItem 6.C of this annual report.
Name(Date of Birth)
Current Positions and PrincipalPositions outside the Company Business Experience
Junichi Ujiie Chairman of the Board of Directors Nov. 1975 Joined Nomura(Oct. 12, 1945) Chairman of the Nomination Committee Jun. 1990 Director
Chairman of the Compensation Committee Jun. 1995 Managing DirectorSenior Managing Director May 1997 President & CEO
Apr. 2003 Chairman
Nobuyuki Koga Director Apr. 1974 Joined Nomura(Aug. 22, 1950) President & Chief Executive Officer Jun. 1995 Director
Representative Executive Officer Apr. 1999 Managing DirectorPresident & Chief Executive Officer and Directorof Nomura Securities Co., Ltd.
Jun. 2000Apr. 2003
Executive Vice PresidentPresident & CEO
Hiroshi Toda Director Apr. 1975 Joined Nomura(Sep. 12, 1951) Deputy President & Chief Operating Officer Jun. 1997 Director
Representative Executive Officer Jun. 2000 Executive Managing DirectorDeputy President & Chief Operating Officer andDirector of Nomura Securities Co., Ltd.
Oct. 2001Apr. 2003Jun. 2003
DirectorExecutive Vice President & COODeputy President & COO
Kazutoshi Inano Director Apr. 1976 Joined Nomura(Sep. 4, 1953) Deputy President & Co-Chief Operating Officer Jun. 1997 Director
Representative Executive Officer Jun. 2000 Executive Managing DirectorPresident & Chief Executive Officer and Directorof Nomura Asset Management Co., Ltd.
Oct. 2001Apr. 2003Jun. 2003
DirectorExecutive Vice President & Co-COODeputy President & Co-COO
51

Name(Date of Birth)
Current Positions and PrincipalPositions outside the Company Business Experience
Takashi Fujita Director Apr. 1971 Joined Nomura(Jul. 30, 1948) Director of Nomura Securities Co., Ltd. Jun. 1996 Director
Jun. 2000 Managing DirectorJun. 2001 Statutory AuditorSep. 2001 Retired from Statutory AuditorOct. 2001 Statutory Auditor of Nomura Securities Co., Ltd.
(currently, Director of Nomura Securities Co., Ltd.)Apr. 2003 AdvisorJun. 2003 Director
Shozo Kumano Director Apr. 1970 Joined Nomura(Jul. 28, 1947) Director of Nomura Asset Management Co., Ltd. Jun. 1994 Director
May 1997 AdvisorJun. 1997 Statutory AuditorJun. 2000 Retired from Statutory AuditorJun. 2000 Statutory Auditor of Nomura Real Estate
Development Co., Ltd.Jun. 2002 Retired from Office of Nomura Real Estate
Development Co., Ltd.Jun. 2002 Statutory Auditor of Nomura Asset
Management Co., Ltd.(currently, Director of Nomura AssetManagement Co., Ltd.)
Apr. 2003 AdvisorJun. 2003 Director
Masaharu Shibata Director Jun. 1994 President & CEO of NGK Insulators, Ltd.(Feb. 21, 1937) Member of the Nomination Committee Oct. 2001 Director
Member of the Compensation Committee Jun. 2002 Chairman & CEO of NGK Insulators, Ltd.Director of Nomura Securities Co., Ltd.Chairman & CEO of NGK Insulators, Ltd.
Hideaki Kubori Director Apr. 1998 Chairman of Hibiya Park Law Office(Aug. 29, 1944) Member of the Nomination Committee Apr. 2001 President of Daini Tokyo Bar Association
Member of the Compensation Committee Oct. 2001 DirectorDirector of Nomura Securities Co., Ltd.Chairman of Hibiya Park Law Office
Mar. 2002 Retired from President of Daini Tokyo BarAssociation
Haruo Tsuji Director Jun. 1998 Corporate Advisor of Sharp Corporation(Dec. 6, 1932) Chairman of the Audit Committee Jun. 2001 Statutory Auditor
Director of Nomura Securities Co., Ltd. Jun. 2003 Retired from Statutory AuditorCorporate Advisor of Sharp Corporation Jun. 2003 Director
Fumihide Nomura Director Apr. 1957 Joined Nomura(Apr. 13, 1934) Member of the Audit Committee Dec. 1976 Director
President of Nomura Shokusan Co., Ltd. Dec. 1979 Managing DirectorDec. 1982 Statutory AuditorJun. 2003 Retired from Statutory AuditorJun. 2003 Director
Koji Tajika Director Jun. 1997 Chairman & CEO of Tohmatsu & Co.(Jan. 7, 1936) Member of the Audit Committee May 1999 Retired from Chairman & CEO of Tohmatsu Co.
Director of Nomura Securities Co., Ltd. Jun. 1999 Chairman of Deloitte Touche TohmatsuTrustee of International Accounting StandardsCommittee Foundation
May 2000 Retired from Chairman of Deloitte ToucheTohmatsu
Professor of Chuo Graduate School ofAccountingDirector of Murata Manufacturing Co., Ltd.
Jun. 2000
May 2002
Trustee of International Accounting StandardsCommittee FoundationRetired from Advisor of Tohmatsu & Co.
Jun. 2002 Director of Murata Manufacturing Co., Ltd.Jun. 2003 Director
Among the above listed Directors, Masaharu Shibata, Hideaki Kubori, Haruo Tsuji and Koji Tajika satisfythe requirements for an “outside director” under the Commercial Code of Japan. The Commercial Code definesan outside director of a company as a non-executive director (i) who has never assumed the position of executivedirector, manager or employee of the company or its subsidiaries and (ii) who does not currently assume theposition of executive director, manager or employee of the company or its subsidiaries.
52

Executive Officers
The following table provides information about Nomura’s Executive Officers as of June 26, 2003. Withrespect to the information under “Business Experience” below, some of the Executive Officers changed theirtitles or positions upon our adoption of the holding company structure on October 1, 2001 and the CommitteeSystem on June 26, 2003, as described in Item 6.C of this annual report.
Name(Date of Birth) Current Positions Business Experience
Junichi Ujiie(Oct. 12, 1945)
Chairman of the Board of DirectorsSenior Managing Director
See “Directors” under this Item 6.A.
Nobuyuki Koga(Aug. 22, 1950)
DirectorPresident & Chief Executive OfficerRepresentative Executive Officer
See “Directors” under this Item 6.A.
Hiroshi Toda(Sep. 12, 1951)
DirectorDeputy President & Chief Operating OfficerRepresentative Executive Officer
See “Directors” under this Item 6.A.
Kazutoshi Inano(Sep. 4, 1953)
DirectorDeputy President & Co-Chief Operating OfficerRepresentative Executive OfficerHead of Asset Management
See “Directors” under this Item 6.A.
Takashi Tsutsui Senior Managing Director Apr. 1974 Joined Nomura(Jul. 3, 1950) Jun. 1997 Director
Jun. 2000 Managing DirectorSep. 2001 Retired from Managing DirectorOct. 2001 Managing Director of Nomura Securities Co., Ltd.
(currently, Executive Vice President of NomuraSecurities Co., Ltd.)
Jun. 2002 DirectorJun. 2003 Retired from DirectorJun. 2003 Senior Managing Director
Takashi Yanagiya Senior Managing Director Apr. 1975 Joined Nomura(Nov. 3, 1951) Head of Domestic Retail Jun. 1997 Director
Jun. 2000 Managing DirectorSep. 2001 Retired from Managing DirectorOct. 2001 Managing Director of Nomura Securities Co., Ltd.
(currently, Executive Vice President of NomuraSecurities Co., Ltd.)
Jun. 2002 DirectorJun. 2003 Retired from DirectorJun. 2003 Senior Managing Director
Kenichi Watanabe Senior Managing Director Apr. 1975 Joined Nomura(Oct. 28, 1952) Head of Global Risk Management, IR,
IT & OperationsJun. 1998Jun. 2000
DirectorManaging Director
Oct. 2001 DirectorOct. 2001 Managing Director of Nomura Securities Co., Ltd.
(currently, Executive Vice President and Directorof Nomura Securities Co., Ltd.)
Jun. 2003 Retired from DirectorJun. 2003 Senior Managing Director
53

Name(Date of Birth) Current Positions Business Experience
Takumi Shibata Senior Managing Director Apr. 1976 Joined Nomura(Jan. 8, 1953) Head of Global Wholesale Jun. 1998 Director
Jun. 2000 Managing DirectorSep. 2001 Retired from Managing DirectorOct. 2001 Managing Director of Nomura Securities Co., Ltd.
(currently, Executive Vice President of NomuraSecurities Co., Ltd.)
Jun. 2003 Senior Managing Director
Hiromi Yamaji Senior Managing Director Apr. 1977 Joined Nomura(Mar. 8, 1955) Regional Management of Europe Region Jun. 1998 Director
Jun. 2000 Managing DirectorSep. 2001 Retired from Managing DirectorOct. 2001 Managing Director of Nomura Securities Co., Ltd.Apr. 2002 President of Nomura Europe Holdings plcJun. 2003 Retired from Managing Director of Nomura
Securities Co., Ltd.Jun. 2003 Senior Managing Director
Manabu Matsumoto Senior Managing Director Apr. 1975 Joined Nomura(Jun. 19, 1950) Jun. 1998 Director
Jun. 2001 Managing DirectorSep. 2001 Retired from Managing DirectorOct. 2001 Managing Director of Nomura Securities Co., Ltd.
(currently, Executive Managing Director ofNomura Securities Co., Ltd.)
Jun. 2003 Senior Managing Director
Yoshifumi Kawabata Senior Managing Director Apr. 1975 Joined Nomura(Nov. 3, 1952) Head of Global Merchant Banking Jun. 1998 Director
Sep. 2001 Retired from DirectorOct. 2001 Director of Nomura Securities Co., Ltd. (currently,
Executive Managing Director of NomuraSecurities Co., Ltd.)
Jun. 2003 Senior Managing Director
Shogo Sakaguchi Senior Managing Director Apr. 1976 Joined Nomura(May 27, 1953) Jun. 1998 Director
Sep. 2001 Retired from DirectorOct. 2001 Director of Nomura Securities Co., Ltd. (currently,
Executive Managing Director of NomuraSecurities Co., Ltd.)
Jun. 2003 Senior Managing Director
Masanori Itatani Senior Managing Director Apr. 1976 Joined Nomura(Oct. 13, 1953) Head of Global Corporate Communications Jun. 1998 Director
Oct. 2001 Director of Nomura Securities Co., Ltd. (currently,Executive Managing Director of NomuraSecurities Co., Ltd.)
Jun. 2003 Retired from DirectorJun. 2003 Senior Managing Director
Yoshimitsu Oura Senior Managing Director Apr. 1977 Joined Nomura(Jul. 8, 1954) Jun. 1999 Director
Sep. 2001 Retired from DirectorOct. 2001 Director of Nomura Securities Co., Ltd. (currently,
Executive Managing Director of NomuraSecurities Co., Ltd.)
Jun. 2003 Senior Managing Director
54

Name(Date of Birth) Current Positions Business Experience
Yusuke Yamada Senior Managing Director Apr. 1977 Joined Nomura(Dec. 26, 1953) Jun. 1999 Director
Sep. 2001 Retired from DirectorOct. 2001 Director of Nomura Securities Co., Ltd. (currently,
Executive Managing Director of NomuraSecurities Co., Ltd.)
Jun. 2003 Senior Managing Director
Hitoshi Tada Senior Managing Director Apr. 1978 Joined Nomura(Jun. 29, 1955) Jun. 1999 Director
Oct. 2001 Director of Nomura Securities Co., Ltd. (currently,Executive Managing Director of NomuraSecurities Co., Ltd.)
Mar. 2003 Retired from DirectorJun. 2003 Senior Managing Director
Kenichi Fukuhara Senior Managing Director Apr. 1976 Joined Nomura(Apr. 19, 1951) Head of Global Research Jun. 2000 Director
Sep. 2001 Retired from DirectorOct. 2001 Director of Nomura Securities Co., Ltd. (currently,
Senior Managing Director of Nomura SecuritiesCo., Ltd.)
Jun. 2003 Senior Managing Director
Yasuo Agemura Senior Managing Director Apr. 1976 Joined Nomura(Feb. 19, 1954) Head of Global Fixed Income Jun. 2000 Director
Sep. 2001 Retired from DirectorOct. 2001 Director of Nomura Securities Co., Ltd. (currently,
Senior Managing Director of Nomura SecuritiesCo., Ltd.)
Jun. 2003 Senior Managing Director
Hideyuki Takahashi Senior Managing Director Apr. 1979 Joined Nomura(Jan. 10, 1956) Regional Management of Americas Region Apr. 2002 Director of Nomura Securities Co., Ltd.
Apr. 2002 President & CEO of Nomura Holding America Inc.Jun. 2003 Retired from Director of Nomura Securities Co.,
Ltd.Jun. 2003 Senior Managing Director
Hiroshi Tanaka Senior Managing Director Apr. 1980 Joined Nomura(May 13, 1956) Head of Global Equity Apr. 2002 Director of Nomura Securities Co., Ltd. (currently,
Senior Managing Director of Nomura SecuritiesCo., Ltd.)
Jun. 2003 Senior Managing Director
Noriyuki Ushiyama Senior Managing Director Apr. 1978 Joined Nomura(Aug. 16, 1953) Head of Global Investment Banking Apr. 2003 Director of Nomura Securities Co., Ltd. (currently,
Senior Managing Director of Nomura SecuritiesCo., Ltd.)
Jun. 2003 Senior Managing Director
Noriyasu Yoshizawa Senior Managing Director Apr. 1980 Joined Nomura(Oct. 25, 1956) Regional Management of Asia & Oceania
RegionApr. 2003 Director of Nomura Securities Co., Ltd. (currently,
Senior Managing Director of Nomura SecuritiesCo., Ltd.)
Apr. 2003 President of Nomura Asia Holding N.V.Jun. 2003 Senior Managing Director
55

Name(Date of Birth) Current Positions Business Experience
Yasuo Yoshihara Senior Managing Director Apr. 1981 Joined Nomura(Aug. 28, 1956) Apr. 2003 Director of Nomura Securities Co., Ltd. (currently,
Senior Managing Director of Nomura SecuritiesCo., Ltd.)
Jun. 2003 Senior Managing Director
Akira Maruyama Senior Managing Director Apr. 1979 Joined Nomura(Mar. 21, 1957) Chief Financial Officer
Head of Global Treasury and ControllerApr. 2003 Director of Nomura Securities Co., Ltd. (currently,
Senior Managing Director of Nomura SecuritiesCo., Ltd.)
Jun. 2003 Senior Managing Director & Chief FinancialOfficer
Kamezo Nakai Senior Managing Director Apr. 1974 Joined Nomura(Jul. 30, 1950) Jun. 1995 Director
Apr. 1999 Managing DirectorSep. 2001 Retired from Managing DirectorOct. 2001 Managing Director of Nomura Securities Co., Ltd.Mar. 2003 Retired from Managing Director of Nomura
Securities Co., Ltd.Apr. 2003 Director & Principal Executive Officer of Nomura
Asset Management Co., Ltd. (currently, ExecutiveVice President of Nomura Asset Management Co.,Ltd.)
Jun. 2003 Senior Managing Director
Akio Nakaniwa Senior Managing Director Apr. 1972 Joined Nomura(Nov. 22, 1948) Jun. 1994 Director
May 1998 Retired from DirectorJun. 1998 Senior Executive Officer of Nomura Asset
Management Co., Ltd. (currently, Executive VicePresident of Nomura Asset Management Co., Ltd.)
Jun. 2003 Senior Managing Director
Takahide Mizuno Senior Managing Director Apr. 1975 Joined Nomura(Apr. 17, 1952) Feb. 1988 Transferred to Nomura Investment Management
Co., Ltd.Oct. 1997 Director of Nomura Asset Management Co., Ltd.
(currently, Executive Vice President of NomuraAsset Management Co., Ltd.)
Jun. 2003 Senior Managing Director
B. Compensation.
The aggregate compensation, including bonuses, paid by Nomura to its Directors and Statutory Auditors asa group during the year ended March 31, 2003 was ¥1,390 million. In accordance with customary Japanesebusiness practices, a retiring Director or Statutory Auditor receives a lump-sum retirement payment, which issubject to the approval of the general meeting of shareholders. In June 2002, we abolished the lump-sumretirement payment system, but the Directors and Statutory Auditors who were in office as of September 30,2001 are eligible to receive lump-sum retirement payments based on the length of their tenure of office as of thatdate, generally when he retires. In the year ended March 31, 2003, retirement payments in the aggregate amountof ¥1,887 million were made. All of our Statutory Auditors retired, as our Board of Statutory Auditors wasabolished when we adopted the committee-based corporate governance system on June 26, 2003, as described inItem 6.C of this annual report.
As also described in Item 6.C of this annual report, we now have Executive Officers who determine thematters delegated by the resolutions of our Board of Directors and execute our business activities. Our
56

Compensation Committee establishes the policy with respect to the determination of the individual compensationof each Executive Officer and makes such determination under the policy.
In July 2000, we introduced a stock option plan under which Nomura’s Directors and Statutory Auditors, aswell as our employees in Japan, have been granted options in the form of stock subscription warrants. Thesewarrants are exercisable between February 26, 2001 and August 23, 2004. The current exercise price is ¥2,305per share. Subject to adjustments, a total of 663.8 thousand shares will be issuable upon full exercise of all thewarrants granted to the Directors and Statutory Auditors, and a total of 472.5 thousand shares will be issuableupon full exercise of all the warrants granted to these employees.
In accordance with the resolution of the general meeting of shareholders held on June 26, 2002, we issuedstock subscription warrants as stock options. The warrants to subscribe for 2,227 thousand shares were granted toNomura’s Directors, Statutory Auditors and employees, as well as those of our subsidiaries in and outside Japanwithout consideration. The exercise price is ¥1,807 per share and the warrants are exercisable from July 1, 2004to June 30, 2009. Subject to adjustments, a total of 375 thousand shares will be issuable upon full exercise of allthe warrants granted to the Directors, Statutory Auditors and employees.
At the general meeting of shareholders held on June 26, 2003, we were authorized to grant two types ofstock options, “Stock Option A” and “Stock Option B”, in the form of stock subscription warrants withoutconsideration therefore, to Nomura’s Directors, Executive Officers and employees, as well as those of oursubsidiaries in and outside Japan. These stock options are exercisable during the period within seven years of theissuing date, which is decided by our Board of Directors or an Executive Officer designated by our Board ofDirectors. The exercise price of Stock Option A will be determined by reference to the market price of ourcommon stock while that of Stock Option B will be ¥1 per share. Subject to adjustments, a total of 5 millionshares will be issuable upon full exercise of all the stock options granted in this round, 2.5 million shares ofwhich will be issued for Stock Option A and the other 2.5 million shares of which will be issuable for StockOption B.
C. Board Practices.
Information Concerning Our Directors
Under the recent amendments to the Law for Special Exception to the Commercial Code Concerning Audit,etc. of Joint Stock Companies, which became effective on April 1, 2003, certain large joint stock companies inJapan have the option of introducing a new committee-based corporate governance system, which is referred toas the “Committee System” in this annual report, instead of the traditional corporate governance system thatconsists of directors and statutory auditors. The amendments have been enacted to promote efficient, flexible andtransparent management of joint stock companies in Japan by separating the supervisory and operationalfunctions of corporate governance, both of which belong to directors in the traditional governance system. Inorder to be eligible for the Committee System, a company must establish three committees: a nominationcommittee, an audit committee and a compensation committee. The members of each committee are chosen fromthe company’s directors. A majority of each committee must be outside directors who are not executive officersof the company. The company must then appoint executive officers and representative executive officers by aresolution of the board of directors. Under the Committee System, the executive officers manage the businessaffairs of a company. While the board of directors is entitled to establish the basic management policy for thecompany and has decision-making authority over certain prescribed matters, all other decisions related tobusiness affairs may be made by executive officers. When an eligible company adopts the Committee System, itsboard of statutory auditors is abolished.
We adopted the Committee System by amending our Articles of Incorporation by way of a specialresolution adopted at our general meeting of shareholders held on June 26, 2003. Our Board of Directors
57

established three committees, a Nomination Committee, an Audit Committee and a Compensation Committee, asdescribed below. Through the adoption of the Committee System, we aim to strengthen management oversight,increase transparency in our management and have more flexible group operations. Our Board of Directors hasthe authority to determine the basic management policy for Nomura and supervise the execution by the Directorsand Executive Officers of their duties. Our Board of Directors has, by resolution, delegated to our ExecutiveOfficers most of its authority to make decisions with regard to our company’s business.
Our Articles of Incorporation provide for not more than 20 Directors. Directors are elected at a generalmeeting of shareholders, and the normal term of office of Directors is one year, although they may serve anynumber of consecutive terms. From among its members, our Board of Directors elects the Chairman.
Compensation Committee
Our Compensation Committee is authorized to determine the policy with respect to the determination of theparticulars of the compensation for each Director and Executive Officer, and the particulars of the compensationfor each Director and Executive Officer. This committee’s current members are Junichi Ujiie, Masaharu Shibataand Hideaki Kubori. Junichi Ujiie is the Chairman of this committee.
Nomination Committee
Our Nomination Committee is authorized to determine the particulars of proposals concerning the electionand dismissal of Directors to be submitted to a general meeting of shareholders by our Board of Directors. Thiscommittee’s current members are Junichi Ujiie, Masaharu Shibata and Hideaki Kubori. Junichi Ujiie is theChairman of this committee.
Audit Committee
We have an Audit Committee that, according to our Articles of Incorporation, is authorized to (i) audit theexecution by the Directors and the Executive Officers of their duties and (ii) determine the particulars ofproposals concerning the election and dismissal of the independent auditor for domestic reporting purposes andthe non-retention of such independent auditor to be submitted to a general meeting of shareholders by our Boardof Directors. With respect to financial reporting, our Audit Committee has the statutory duty to examine ourfinancial statements and business reports to be prepared by Executive Officers designated by our Board ofDirectors and to report its opinion to a general meeting of shareholders. In addition, our Regulations of the AuditCommittee provide that our Audit Committee has the authority to (i) pre-approve audit or non-audit servicesprovided by the independent auditor for SEC reporting purposes, as required by the U.S. auditor independencerules, (ii) oversee the work of such independent auditor (including resolution of disagreements betweenmanagement and such independent auditor regarding financial reporting) regarding such independent auditor’saudit report for financial statements filed with the SEC, and (iii) retain legal counsel, consultants or other outsideadvisers.
This committee is currently composed of Haruo Tsuji, Fumihide Nomura and Koji Tajika. Haruo Tsuji isthe Chairman of this committee.
Limitation of Liabilities of Some Directors
We have entered into agreements with four of our Directors, Masaharu Shibata, Hideaki Kubori, HaruoTsuji and Koji Tajika, that limit their liabilities to us for damages suffered by us due to their acts taken in goodfaith and without gross negligence, up to the higher of (a) ¥20 million or (b) the amount specified in theagreements. The amount specified in each of these agreements is generally the aggregate amount of two years’remunerations and other compensation received or entitled to be received by the respective Director.
58

Information Concerning Our Executive Officers
Nomura’s Executive Officers have the authority to determine the matters delegated by the resolutions of ourBoard of Directors and execute our business activities. Nomura’s Articles of Incorporation provide for not morethan 45 Executive Officers. Executive Officers are elected at a meeting of our Board of Directors meeting, andthe normal term of Executive Officers is one year, although they may serve any number of consecutive terms.Some of the Executive Officers appointed by our Board of Directors are members of our Executive ManagementBoard where they discuss or determine important matters concerning management of the Nomura Group.
Corporate Governance Practices
Pursuant to home country practices exemptions granted to us by the New York Stock Exchange, we arepermitted to follow certain corporate governance practices complying with relevant Japanese laws and Japanesestock exchange rules, which are different from those required for U.S. domestic companies under the New YorkStock Exchange’s listing standards. The New York Stock Exchange rules and our current practices relating tocorporate governance have the following significant differences:
• Independence and Other Qualifications of Audit Committee Members. The New York Stock Exchangerequires that a listed company have an audit committee consisting of at least three directors, each ofwhom must be “independent” as defined by Section 303.01 of the New York Stock Exchange’s ListedCompany Manual. Under Section 303.01, “independence” means having no relationship with thecompany that may interfere with the exercise of the director’s independence from management and thecompany. In addition, Section 303.01 imposes certain restrictions on each audit committee member. Forexample, at least three years must elapse from the termination of his or her employment before a formeremployee (including former non-employee executive officers) of the company who becomes or is adirector may serve on the audit committee. Also, a director who directly or through an organization, hasa business relationship with the company may serve on the audit committee only if the company’s boardof directors determines in its business judgment that the relationship does not interfere with thedirector’s exercise of independent judgment. Under the Commercial Code of Japan, for a Japanesecompany that has adopted the Committee System, a majority of its audit committee’s members must beoutside directors who are not executive officers of the company, and in addition any audit committeemember shall not concurrently assume the position of executive officer, employee or executive directorof the company or its subsidiaries. The Commercial Code defines an outside director of a company as anon-executive director (i) who has never assumed the position of executive director, manager oremployee of the company or its subsidiaries and (ii) who does not currently assume the position ofexecutive director, manager or employee of the company or its subsidiaries.
• Shareholder Approval Policy. The New York Stock Exchange requires that shareholder approval beobtained prior to issuance of stock options to officers or directors except, among others, where no singleofficer or director may acquire more than 1% of the number of common stock outstanding at the timethe stock option plan is adopted, and the stock option plan, together with all plans of the issuer otherthan those for which shareholder approval is not required, does not authorize the issuance of more than5% of the issuer’s common stock outstanding at the time the stock option plan is adopted. We followrelevant Japanese laws which, as discussed in “Rights of Our Shareholders” under Item 10.B of thisannual report, generally require us to obtain shareholder approval only if stock options in the form ofstock subscription warrants are to be issued with “specially favorable” conditions.
The New York Stock Exchange also requires that, with certain exceptions specified in its rules, shareholderapproval be obtained prior to issuance of common stock or securities convertible into or exercisable for commonstock (1) to a director, an officer, a substantial security holder or a party related to any of them if the number ofshares of common stock which are to be issued or are issuable upon conversion exceeds 1% of the number ofcommon stock or voting power outstanding before the issuance, (2) in any transaction or series of transactions, ifthe voting power of the common stock is equal to or exceeds 20% of the voting power outstanding before the
59

issuance or if the number of shares of the common stock is equal to or exceeds 20% of the number of sharesoutstanding before the issuance, and (3) that will result in a change of control of the issuer. We follow relevantJapanese laws which, as discussed in “Rights of Our Shareholders” under Item 10.B of this annual report,generally require us to obtain shareholder approval with respect to the issuance of common stock or securitiesconvertible into or exercisable for common stock only if common stock is to be issued at a “specially favorable”price or warrants to subscribe for new shares are to be issued with “specially favorable” conditions.
On June 6, 2002, the Corporate Accountability and Listing Standards Committee of the New York StockExchange issued a report recommending that the Exchange adopt significant changes to its corporate governancestandards. On August 16, 2002, the New York Stock Exchange filed with the SEC proposed changes to itscorporate governance standards which reflect the findings of the Committee. Subsequently, in light of thepromulgation by the SEC of Rule 10A-3 pursuant to Section 301 of the Sarbanes-Oxley Act, on April 4, 2003,the New York Stock Exchange filed with the SEC Amendment No. 1 to its proposed rule changes in order toreflect the requirements of Rule 10A-3. The proposed rule changes, as amended, will become effective upon theSEC’s approval. The proposed rule changes, as amended, provide that, with respect to foreign private issuers,such as Nomura, only those provisions of the amended corporate governance standards that implement therequirements of Rule 10A-3 will be applicable. Among such requirements, a foreign private issuer listed on theNew York Stock Exchange will be required to have an audit committee consisting of directors all of whom mustbe independent under the standards set forth in paragraph (b) of Rule 10A-3, and the audit committee will berequired to be directly responsible for the appointment, compensation, retention and oversight of the work of theaccounting firm engaged (including resolution of disagreements between management and the auditor regardingfinancial reporting) for the purpose of preparing or issuing an audit report or performing other audit, review orattest services for the issuer, unless one or more of the exemptions set forth in Rule 10A-3 apply. Pursuant toparagraph (a)(5) of Rule 10A-3, the amended corporate governance standards of the New York Stock Exchangeimplementing the requirements of the rule will become applicable to foreign private issuers listed on the NewYork Stock Exchange on July 31, 2005.
As described in “Information Concerning Our Directors” under this Item 6.C, on June 26, 2003, we adoptedthe Committee System. Under this system, we have committees under our Board of Directors, including an AuditCommittee, each consisting of several Directors. We currently expect that, on and after July 31, 2005, we will besubject to the provisions of the amended corporate governance standards of the New York Stock Exchangeimplementing the requirements of Rule 10A-3, including the requirements relating to the independence of theaudit committee members and responsibilities of the Audit Committee.
The rights of ADR holders, including their rights relating to corporate governance practices, are governedby the Deposit Agreement which is an exhibit to this annual report. See also “Rights of Holders of ADSs” underItem 10.B of our Registration Statement on Form 20-F (File No. 1-15270), which we filed with the Securities andExchange Commission on December 13, 2001. The information contained in that part of the RegistrationStatement is incorporated in Item 10.B of this annual report by reference.
60

D. Employees
The following table shows the number of our employees as of the dates indicated:
As of March 31,
2001 2002 2003
Japan . . . . . . . . . . . . . . . . . . . . . . . . . . . . . . . . . . . . . . . . . . . . . . . . . . . . . . . . . . . . . . . . 11,702 11,874 11,244Europe . . . . . . . . . . . . . . . . . . . . . . . . . . . . . . . . . . . . . . . . . . . . . . . . . . . . . . . . . . . . . . 1,370 1,381 1,389Americas . . . . . . . . . . . . . . . . . . . . . . . . . . . . . . . . . . . . . . . . . . . . . . . . . . . . . . . . . . . . . 835 827 797Asia (other than Japan) and Oceania . . . . . . . . . . . . . . . . . . . . . . . . . . . . . . . . . . . . . . . 486 468 616
Subtotal . . . . . . . . . . . . . . . . . . . . . . . . . . . . . . . . . . . . . . . . . . . . . . . . . . . . . . . . . . 14,393 14,550 14,046PFG entities . . . . . . . . . . . . . . . . . . . . . . . . . . . . . . . . . . . . . . . . . . . . . . . . . . . . . . . . . . 23,848 — —NPF entities . . . . . . . . . . . . . . . . . . . . . . . . . . . . . . . . . . . . . . . . . . . . . . . . . . . . . . . . . . — — 339
Total . . . . . . . . . . . . . . . . . . . . . . . . . . . . . . . . . . . . . . . . . . . . . . . . . . . . . . . . . . . . 38,241 14,550 14,385
The lower number of our employees as of March 31, 2002 compared with the number as of March 31, 2001mainly reflects the fact that the PFG entities were no longer consolidated as of March 31, 2002.
Japan
In Japan, as of March 31, 2003, we had 11,244 employees, of which 7,768 were engaged in DomesticRetail, 1,274 were engaged in Global Wholesale and 555 were engaged in Asset Management.
Most of our employees, excluding registered representatives who are engaged in retail activities on annualcontracts, receive compensation on the basis of fixed annual salaries and twice-a-year bonuses. Registeredrepresentatives, who numbered 1,986 as of March 31, 2003, receive mostly performance-linked compensation.
As of March 31, 2003, 7,515 of Nomura Securities’ employees in Japan were members of Nomuraemployees’ union, with which we have a labor contract. Pursuant to this contract, salaries and bonuses arenegotiated with the labor union based on our overall performance during the relevant fiscal period and ourfinancial position. Similar to other major companies in Japan, we grant our employees annual basic wageincreases.
We emphasize and reward individual skills and performance.
For information on stock options granted to some of our employees, see Item 6.B. of this annual report.
Under our retirement allowance system, eligible employees are entitled to a lump-sum allowance and aretirement annuity upon their retirement.
In Japan, we have not experienced any strikes or other labor disputes and consider our employee relations tobe excellent.
Overseas
As of March 31, 2003, we had 2,802 employees overseas, including 1,389 in Europe, 797 in the Americasand 616 in Asia (excluding Japan) and Oceania.
Most of our overseas professional employees receive salaries as well as incentive compensation in the formof bonuses and profit sharing. Compensation for some of our employees consists largely of incentivecompensation. Our employees overseas are not unionized.
We have not experienced any strikes or other labor disputes overseas and consider our overseas employeerelations to be excellent.
61

NPF entities
Nomura Principal Finance Co., Ltd. engages in principal investment business in Japan. As of March 31,2003, Nomura Principal Finance and its subsidiaries had 339 employees mainly in Japan.
E. Share Ownership.
The following table shows the number of shares owned by our Directors and Executive Officers as of June27, 2003. As of that date, none of them owned 1% or more of our issued and outstanding shares.
DirectorsName Number of Shareholdings
Junichi Ujiie 58,735Nobuyuki Koga 15,053Hiroshi Toda 18,000Kazutoshi Inano 27,000Takashi Fujita 7,000Shozo Kumano 7,031Masaharu Shibata 5,000Hideaki Kubori 0Haruo Tsuji 4,000Fumihide Nomura 188,626Koji Tajika 0
Total 330,445
Executive OfficersName Number of Shareholdings
Junichi Ujiie See aboveNobuyuki Koga See aboveHiroshi Toda See aboveKazutoshi Inano See aboveTakashi Tsutsui 11,000Takashi Yanagiya 12,000Kenichi Watanabe 4,066Takumi Shibata 11,002Hiromi Yamaji 8,000Manabu Matsumoto 19,163Yoshifumi Kawabata 7,212Shogo Sakaguchi 10,309Masanori Itatani 14,822Yoshimitsu Oura 8,154Yusuke Yamada 5,000Hitoshi Tada 7,000Kenichi Fukuhara 4,000Yasuo Agemura 11,069Hideyuki Takahashi 2,000Hiroshi Tanaka 2,000Noriyuki Ushiyama 6,000Noriyasu Yoshizawa 8,000Yasuo Yoshihara 10,021Akira Maruyama 4,030Kamezo Nakai 13,000Akio Nakaniwa 3,000Takahide Mizuno 795
Total 300,431
62

Item 7. Major Shareholders and Related Party Transactions.
A. Major Shareholders.
As of March 31, 2003, to our knowledge, no person beneficially held, directly or indirectly, more than 5%of Nomura’s then outstanding common stock. To our knowledge, we are not directly or indirectly owned orcontrolled by another corporation, by any government or by any other natural or legal person severally or jointly.We know of no arrangements the operation of which may at a later time result in a change of control of Nomura.Also as of March 31, 2003, there were 196 record shareholders of Nomura with addresses in the United States,and those U.S. holders held 165,997,329 shares of Nomura’s common stock, representing 8.4% of Nomura’s thenoutstanding common stock. As of March 31, 2003, there were 10,084,292 ADSs outstanding, representing10,084,292 shares of Nomura’s common stock or 0.5% of Nomura’s then outstanding common stock.
B. Related Party Transactions.
Nomura Land and Building Co., Ltd.
Nomura Land and Building, of which Nomura held 9.4% directly and 19.9% indirectly through NomuraAsset Management as of March 31, 2003, owns a substantial portion of Nomura’s leased space in Japan. Othermajor shareholders of Nomura Land and Building were Nomura Welfare Cooperative Association, holding23.5%, Nomura Research Institute, holding 14.9%, and Obayashi Corporation, holding 14.8%.
For the years ended March 31, 2001, 2002 and 2003, Nomura paid ¥29,778 million, ¥24,556 million and¥22,203 million in rent to NLB, respectively. As of March 31, 2002 and 2003, Nomura had ¥55,744 million and¥52,448 million of lease deposits, respectively, with Nomura Land and Building. Nomura has made loans toNLB amounting to ¥99,500 million, including long-term loans of ¥72,500 million, as of March 31, 2003. Theinterest rates of the long-term loans vary from 1.00% to 1.63% per annum, and the repayment dates will bebetween 2005 and 2007.
During the year ended March 31, 2003, Nomura acquired an additional 3.6% equity interest in JAFCO andan additional 1.0% equity interest in Nomura Research Institute, Ltd. from Nomura Land and Building Co., Ltd.
Nomura Research Institute, Ltd.
Nomura Research Institute, undertakes domestic and overseas economic research and also develops andmaintains computer networks. One of the major customers of Nomura Research Institute is Nomura.
Nomura Research Institute completed an initial public offering and issued 2 million shares of common stockto third parties at a price of ¥11,000 per share in December 2001. Nomura recognized a pretax gain of ¥3,504million due to the price exceeding Nomura’s carrying value per share. Deferred taxes have been provided on thegain. As a result of this issuance, Nomura’s equity interest in Nomura Research Institute declined from 25.2% to24.1%. Nomura Land and Building’s equity interest in Nomura Research Institute declined from 49.9% to 31.0%due to this issuance and the sale of the shares.
For the years ended March 31, 2002 and 2003, Nomura purchased ¥26,013 million and ¥27,946 million ofsoftware and computer equipment, respectively, and paid Nomura Research Institute ¥24,887 million and¥27,644 million for other services, respectively.
C. Interests of Experts and Counsel
Not applicable.
63

Item 8. Financial Information.
A. Consolidated Statements and Other Financial Information
Financial Statements
The information required by this item is set forth in our consolidated financial statements includedelsewhere in this annual report.
Legal or Arbitration Proceedings
We are involved in a number of actions and proceedings in Japan and overseas, which are either ordinaryroutine actions and proceedings incidental to our business or not material to us. Based upon the informationcurrently available to us and our domestic and overseas legal counsel, we believe that the ultimate resolution ofsuch actions and proceedings will not, in the aggregate, have a material adverse effect on our financial conditionor results of our operations including the actions described below.
In 1998, one of our European subsidiaries, Nomura Principal Investment plc, acquired approximately 46%of the issued share capital of Investicni a postovni banka, a.s. (IPB), a Czech bank. On June 16, 2000, the CzechNational Bank (CNB) placed IPB into forced administration. On June 19, 2000, the administrator appointed bythe CNB transferred IPB’s entire business to Ceskoslovenska obchodni banka (CSOB), another Czech bank.Nomura Principal Investment and Nomura International plc, another one of our European subsidiaries, areinvolved in both bringing and defending a number of legal claims arising out of the circumstances surroundingNomura Principal Investment’s acquisition of its interest in IPB, the imposition of forced administration and theimmediate sale by the administrator of IPB’s entire business to CSOB. The legal disputes include a counterclaimbrought by the Czech Republic seeking damages of $3-8 billion. Also, on February 25, 2002, CSOB commenceda legal action against Nomura Principal Investment, Nomura International and others in both the English andCzech courts arising out of IPB’s sale of a Czech brewery. Nomura Principal Investment and NomuraInternational successfully challenged CSOB’s ability to bring these proceedings before the English courts, butCSOB is still seeking damages of $629 million before the Czech courts. We believe that all such claims broughtagainst us are without merit and we are vigorously defending against them.
Dividend Policy
We determine the dividend amount based on the achieved return on equity level and the stability of dividendpayments while taking into account the need to maintain sufficient capital to enable us to develop businessopportunities. According to this policy, we paid ¥15.0 per share dividend for the year ended March 31, 2003.
B. Significant Changes
Except as disclosed in this annual report, there have been no significant changes since March 31, 2003.
64

Item 9. The Offer and Listing.
A. Offer and Listing Details.
Price History
The following table sets forth, for the periods indicated, the reported high and low sale prices of ourcommon stock on the Tokyo Stock Exchange and the reported high and low share prices of our ADS on NewYork Stock Exchange.
Tokyo StockExchange PricePer Share of
Common Stock
New York StockExchange PricePer Share of ADS
Calendar Year High Low High Low
Annual highs and lows1998 . . . . . . . . . . . . . . . . . . . . . . . . . . . . . . . . . . . . . . . . . . . . . . . . . . . . . ¥1,810 ¥ 8051999 . . . . . . . . . . . . . . . . . . . . . . . . . . . . . . . . . . . . . . . . . . . . . . . . . . . . . 1,958 8832000 . . . . . . . . . . . . . . . . . . . . . . . . . . . . . . . . . . . . . . . . . . . . . . . . . . . . . 3,510 1,7852001 (for the ADSs, starting on December 17, 2001) . . . . . . . . . . . . . . . 2,890 1,451 $13.05 $11.352002 . . . . . . . . . . . . . . . . . . . . . . . . . . . . . . . . . . . . . . . . . . . . . . . . . . . . . 2,190 1,190 17.40 8.91
Quarterly highs and lows2001
First Quarter . . . . . . . . . . . . . . . . . . . . . . . . . . . . . . . . . . . . . . . . . . 2,490 1,650Second Quarter . . . . . . . . . . . . . . . . . . . . . . . . . . . . . . . . . . . . . . . . 2,890 2,200Third Quarter . . . . . . . . . . . . . . . . . . . . . . . . . . . . . . . . . . . . . . . . . . 2,425 1,451Forth Quarter (for the ADSs, starting on December 17, 2001) . . . . 1,910 1,541 13.05 11.35
2002First Quarter . . . . . . . . . . . . . . . . . . . . . . . . . . . . . . . . . . . . . . . . . . 1,964 1,190 15.00 8.91Second Quarter . . . . . . . . . . . . . . . . . . . . . . . . . . . . . . . . . . . . . . . . 2,190 1,651 17.40 12.25Third Quarter . . . . . . . . . . . . . . . . . . . . . . . . . . . . . . . . . . . . . . . . . . 1,845 1,353 15.60 11.80Forth Quarter . . . . . . . . . . . . . . . . . . . . . . . . . . . . . . . . . . . . . . . . . . 1,615 1,221 13.07 10.20
Monthly highs and lows2002
December . . . . . . . . . . . . . . . . . . . . . . . . . . . . . . . . . . . . . . . . . . . . 1,507 1,300 12.35 10.652003
January . . . . . . . . . . . . . . . . . . . . . . . . . . . . . . . . . . . . . . . . . . . . . . 1,534 1,304 13.08 10.95February . . . . . . . . . . . . . . . . . . . . . . . . . . . . . . . . . . . . . . . . . . . . . 1,547 1,384 13.12 11.82March . . . . . . . . . . . . . . . . . . . . . . . . . . . . . . . . . . . . . . . . . . . . . . . 1,421 1,205 12.17 10.31April . . . . . . . . . . . . . . . . . . . . . . . . . . . . . . . . . . . . . . . . . . . . . . . . 1,285 1,087 10.88 9.07May . . . . . . . . . . . . . . . . . . . . . . . . . . . . . . . . . . . . . . . . . . . . . . . . . 1,266 1,143 10.85 9.70June (through June 26) . . . . . . . . . . . . . . . . . . . . . . . . . . . . . . . . . . 1,525 1,251 13.05 10.75
B. Plan of Distribution.
Not applicable.
C. Markets.
The principal trading market for our Common Stock is the Tokyo Stock Exchange. Our Common Stock hasbeen listed on the Tokyo Stock Exchange, the Osaka Securities Exchange and the Nagoya Stock Exchange since1961.
In December 2001, we listed our Common Stock on New York Stock Exchange in the form of ADSsevidenced by ADRs. Each ADS represents one share of Common Stock.
65

Also, our Common Stock has been listed on Euronext Amsterdam Stock Market N.V. (previously theAmsterdam Stock Exchange) in the form of Continental Depositary Receipts since 1973, the Luxembourg StockExchange in the form of European Depositary Receipts since 1981 and the Singapore Stock Exchange since1994.
D. Selling Shareholders.
Not applicable.
E. Dilution.
Not applicable.
F. Expenses of the Issue.
Not applicable.
Item 10. Additional Information.
A. Share Capital.
Not applicable.
B. Memorandum and Articles of Association.
Objects and Purposes in Nomura’s Articles of Incorporation
Article 2 of our Articles of Incorporation, which are an exhibit to this annual report, states our objects andpurposes.
Provisions Regarding Our Directors
There is no provision in our Articles of Incorporation as to a Director’s power to vote on a proposal orarrangement in which the Director is materially interested, but, under the Commercial Code and the Law forSpecial Exception to the Commercial Code Concerning Audit, etc. of Joint Stock Companies of Japan (together,hereinafter referred to as the “Commercial Code”) and our Regulations of the Board of Directors, a director mustabstain from voting on such matters at meetings of the Board of Directors.
The Commercial Code provides that, under the Committee System, the compensation committee determinesthe compensation for directors. The compensation committee must first establish a policy with respect to thedetermination of the individual compensation of each director and executive officer and then for each individualcase determine the amount of compensation, the calculation method as to variable compensation and/or definecomponents of non-monetary compensation for each director and executive officer in accordance with theestablished policy.
Pursuant to the Commercial Code, under the Committee System, the board of directors may delegate toexecutive officers powers regarding the incurrence by a company of a significant loan from a third party.However, our Board of Directors has retained such powers.
There is no mandatory retirement age for our Directors under the Commercial Code or our Articles ofIncorporation.
There is no requirement concerning the number of shares an individual must hold in order to qualify him orher as a Director of Nomura under the Commercial Code or our Articles of Incorporation.
66

Pursuant to the Commercial Code and our Articles of Incorporation, we may, by resolution of our Board ofDirectors, release the liabilities of any Directors or Executive Officers to us for damages suffered by us due totheir acts taken in good faith and without gross negligence, to the extent permitted by law and our Articles ofIncorporation. In addition, we may execute with outside directors agreements that limit their liabilities to us fordamages suffered by us due to their acts in good faith and without gross negligence, to the extent permitted bylaw and our Articles of Incorporation.
Holding of Our Shares by Foreign Investors
Other than the Japanese unit share system that is described in “Rights of Our Shareholders — Japanese UnitShare System” below, there are no limitations on the rights of non-residents or foreign shareholders to hold orexercise voting rights on our shares imposed by the laws or our Articles of Incorporation or our other constituentdocuments.
Rights of Our Shareholders
Set forth below is information relating to our common stock, including brief summaries of the relevantprovisions of our Articles of Incorporation and Share Handling Regulations, as currently in effect, and of theCommercial Code of Japan and related legislation.
General
Our authorized share capital is 6,000,000,000 shares, of which 1,965,919,860 shares were issued andoutstanding as of March 31, 2003. Under the Commercial Code, shares must be registered and are transferable bydelivery of share certificates. In order to assert shareholders’ rights against us, a shareholder must have its nameand address registered on our register of shareholders, in accordance with our Share Handling Regulations.
A holder of shares may choose, at its discretion, to participate in the central clearing system for sharecertificates under the Law Concerning Central Clearing of Share Certificates and Other Securities of Japan.Participating shareholders must deposit certificates representing all of the shares to be included in this clearingsystem with the Japan Securities Depository Center. If a holder is not a participating institution in the SecuritiesCenter, it must participate through a participating institution, such as a securities company or bank having aclearing account with the Securities Center. All shares deposited with the Securities Center will be registered inthe name of the Securities Center on our register of shareholders. Each participating shareholder will in turn beregistered on our register of beneficial shareholders and be treated in the same way as shareholders registered onour register of shareholders. For the purpose of transferring deposited shares, delivery of share certificates is notrequired. Entry of the share transfer in the books maintained by the Securities Center for participatinginstitutions, or in the book maintained by a participating institution for its customers, has the same effect asdelivery of share certificates. The registered beneficial owners may exercise the rights attached to the shares,such as voting rights, and will receive dividends (if any) and notices to shareholders directly from us. The sharesheld by a person as a registered shareholder and those held by the same person as a registered beneficial ownerare aggregated for these purposes. Beneficial owners may at any time withdraw their shares from deposit andreceive share certificates, subject to the limitations caused by the Japanese unit share system described below.
The registered beneficial holder of deposited shares underlying the ADSs is the depositary for the ADSs.Accordingly, holders of ADSs will not be able to directly assert shareholders’ rights.
Dividends
Under our Articles of Incorporation, our financial accounts will be closed on March 31 of each year anddividends, if any, will be distributed to shareholders (or pledgees) appearing in the register of shareholders as ofthe close of business on that date following resolution of our Board of Directors. The Commercial Code permits a
67

joint stock company to distribute profits by way of interim dividends if the articles of incorporation of a companyso provide. Our Articles of Incorporation permit us to distribute interim dividends to the shareholders (orpledgees) appearing in the register of shareholders as of September 30 of each year by a resolution of our Boardof Directors. Dividends will be distributed in cash. Under our Articles of Incorporation, we are not obliged to payany dividends that are left unclaimed for a period of three years after the date on which they first becamepayable.
The Commercial Code provides that, until the aggregate amount of our legal reserve and additional paid-incapital is at least one-quarter of our stated capital, we may not make any distribution of profits by way of annualcash dividends or interim dividends unless we set aside in our legal reserve an amount equal to at least one-tenthof any amount that we pay out as an appropriation of retained earnings, including any payment by way of annualand interim dividends. The Commercial Code will permit us to distribute profits by way of dividends out of theexcess of the net assets, on a non-consolidated basis, over the aggregate of:
(1) the stated capital;
(2) the additional paid-in capital;
(3) the accumulated legal reserve;
(4) the legal reserve to be set aside in respect of the dividends concerned an proposed payment by way ofappropriation of retained earnings; and
(5) other matters specified in the Implementation Ordinance of the Commercial Code.
In the case of interim dividends, the net assets are calculated by reference to the non-consolidated balancesheet as at the last closing of our accounts, but adjusted to reflect: (i) any subsequent payment by way ofappropriation of retained earnings and transfer to the legal reserve in respect thereof; (ii) any subsequent transferof retained earnings to stated capital; (iii) if such purchase has been authorized pursuant to a resolution of ageneral meeting of shareholders (see “Repurchase by Us of Shares”) below) the total amount of the purchaseprice of such shares so authorized by such resolution; and (iv) other matters specified in the ImplementationOrdinance of the Commercial Code. Interim dividends may not be paid where there is a risk that at the end of thefiscal year net assets might not exceed the aggregate of the amounts referred to in (1) through (5) above.
For information as to Japanese taxes on dividends, see “Japanese Taxation” under Item 10.E. of this annualreport.
Stock Splits
In accordance with the Commercial Code, our Board of Directors has by resolution delegated to ourExecutive Management Board powers to make stock splits, regardless of the value of net assets (as appearing inour latest non-consolidated balance sheet) per share. Under the Commercial Code, when we issue new shares inthe future, the entire amount of issue price of those new shares is required to be accounted for as stated capital,although we may account for an amount not exceeding one-half of the issue price as additional capital. Byresolution of our Executive Management Board, we may make a stock split within an amount of stated capital orby transferring the whole or any part of additional paid-in capital and legal reserve to stated capital.
In accordance with the Commercial Code, our Board of Directors has by resolution delegated to ourExecutive Management Board powers to increase the authorized shares up to the number reflecting the rate ofstock splits and amend our Articles of Incorporation to this effect without the approval of a shareholders’meeting. For example, if each share became three shares by way of a stock split, we may increase the authorizedshares from the current 6,000,000,000 shares to 18,000,000,000 shares.
68

Japanese Unit Share System
Our Articles of Incorporation provide that 1,000 shares of common stock constitute one “unit.” TheCommercial Code permits us, by resolution of our Board of Directors, to reduce the number of shares whichconstitutes one unit or abolish the unit share system, and amend our Articles of Incorporation to this effectwithout the approval of a shareholders’ meeting.
Transferability of Shares Representing Less Than One Unit. We may not issue share certificates for anumber of shares not constituting an integral number of units, except in limited circumstances. Because thetransfer of shares normally requires delivery of the share certificates for the shares being transferred, sharesconstituting a fraction of a unit and for which no share certificates are issued may not be transferable. Becausetransfer of ADRs does not require a change in the ownership of the underlying shares, holders of ADRsevidencing ADSs that constitute less than one unit of shares are not affected by these restrictions in their abilityto transfer the ADRs. However, because transfers of less than one unit of the underlying shares are normallyprohibited under the unit share system, the deposit agreement provides that the right of ADR holders to surrendertheir ADRs and withdraw the underlying shares for sale in Japan may only be exercised as to whole units.
Right of a Holder of Shares Representing Less Than One Unit to Require Us to Purchase Its Shares. Aholder of shares representing less than one unit may at any time require us to purchase its shares. These shareswill be purchased at (a) the closing price of the shares reported by the Tokyo Stock Exchange on the day whenthe request to purchase is made or (b) if no sale takes place on the Tokyo Stock Exchange on that day, then theprice at which sale of shares is effected on such stock exchange immediately thereafter. In such case, we willrequest payment of an amount equal to the brokerage commission applicable to the shares purchased pursuant toour Share Handling Regulations. However, because holders of ADSs representing less than one unit are not ableto withdraw the underlying shares from deposit, these holders will not be able to exercise this right as a practicalmatter.
Right of a Holder of Shares Representing Less than One Unit to Purchase from Us Its Shares up to a WholeUnit. Our Articles of Incorporation provide that a holder of shares representing less than one unit may requireus to sell any fractional shares it may have to such holder so that the holder can raise its fractional ownership upto a whole unit. These shares will be sold at (a) the closing price of the shares reported by the Tokyo StockExchange on the day when the request to sell becomes effective or (b) if no sale has taken place on the TokyoStock Exchange on that day, then the price at which sale of shares is effected on such stock exchangeimmediately thereafter. In such case, we will request payment of an amount equal to the brokerage commissionapplicable to the shares sold pursuant to our Share Handling Regulations.
Voting Rights of a Holder of Shares Representing Less Than One Unit. A holder of shares representingless than one unit cannot exercise any voting rights pertaining to those shares. In calculating the quorum forvarious voting purposes, the aggregate number of shares representing less than one unit will be excluded from thenumber of outstanding shares. A holder of shares representing one or more whole units will have one vote foreach whole unit represented.
A holder of shares representing less than one unit does not have any rights related to voting, such as theright to participate in a demand for the resignation of a director, the right to participate in a demand for theconvocation of a general meeting of shareholders and the right to join with other shareholders to propose anagenda item to be addressed at a general meeting of shareholders. In addition, a holder of shares constituting lessthan one unit does not have the right to require us to issue share certificates for those shares.
However, a holder of shares constituting less than one unit has all other rights of a shareholder in respect ofthose shares, including the following rights:
• to receive annual and interim dividends,
• to receive shares and/or cash by way of retirement, consolidation, subdivision, conversion, exchange ortransfer of shares, company split or merger,
69

• to be allotted rights to subscribe for new shares and other securities when such rights are granted toshareholders,
• to participate in any distribution of surplus assets upon liquidation,
• to institute a representative action by shareholders, and
• to demand that an executive officer suspend illegal and certain other acts.
Ordinary General Meeting of Shareholders
We normally hold our ordinary general meeting of shareholders in June of each year in Chuo-ku, Tokyo orin a neighboring area. In addition, we may hold an extraordinary general meeting of shareholders whenevernecessary by giving at least two weeks’ advance notice. Under the Commercial Code, notice of any shareholders’meeting must be given to each shareholder having voting rights or, in the case of a nonresident shareholder, tohis resident proxy or mailing address in Japan in accordance with our Share Handling Regulations, at least twoweeks prior to the date of the meeting.
Voting Rights
A shareholder is generally entitled to one vote per one unit of shares as described in this paragraph andunder “Japanese Unit Share System” above. In general, under the Commercial Code, a resolution can be adoptedat a general meeting of shareholders by a majority of the shares having voting rights represented at the meeting.The Commercial Code and our Articles of Incorporation require a quorum for the election of directors andstatutory auditors of not less than one-third of the total number of outstanding shares having voting rights. Ourshareholders are not entitled to cumulative voting in the election of directors. A corporate shareholder whoseoutstanding shares are in turn more than one-quarter directly or indirectly owned by us does not have votingrights. Shareholders may exercise their voting rights through proxies, provided that those proxies are alsoshareholders who have voting rights.
The Commercial Code and our Articles of Incorporation provide that a quorum of not less than one-third ofoutstanding shares with voting rights must be present at a shareholders’ meeting to approve any materialcorporate actions such as:
• a reduction of stated capital,
• amendment of the articles of incorporation (except amendments which the board of directors (or underthe Committee System, executive officers) are authorized to make under the Commercial Code asdescribed in “Stock Splits” and “Japanese Unit Share System” above),
• the removal of a director,
• establishment of a 100% parent-subsidiary relationship by way of share exchange or share transfer,
• a dissolution, merger or consolidation,
• a corporate separation,
• the transfer of the whole or an important part of our business,
• the taking over of the whole of the business of any other corporation,
• any issuance of new shares at a “specially favorable” price, bonds or debentures with warrants tosubscribe for new shares with “specially favorable” conditions or warrants to subscribe for new shareswith “specially favorable” conditions to persons other than shareholders, and
• release of part of directors’ or executive officers’ liabilities to their corporation.
70

At least two-thirds of the outstanding shares having voting rights present at the meeting must approve theseactions.
The voting rights of holders of ADSs are exercised by the depositary based on instructions from thoseholders.
Subscription Rights
Holders of shares have no preemptive rights under our Articles of Incorporation when we issue new shares.Under the Commercial Code, our Executive Management Board, which has been delegated by our Board ofDirectors with the authority to issue new shares, may, however, determine that shareholders be givensubscription rights in connection with a particular issue of new shares. In this case, such rights must be given onuniform terms to all shareholders as of a specified record date by at least two weeks’ prior public notice toshareholders of the record date. Public or individual notice must be given to each of these shareholders at leasttwo weeks prior to the date of expiration of the subscription rights.
We may issue warrants to subscribe for new shares (hereinafter referred to as “subscription warrants”) aswarrants on their own or attached to bonds or debentures to any persons. Holders of shares have no preemptiverights under our Articles of Incorporation when we issue subscription warrants. Under the Commercial Code, ourExecutive Management Board, which has been delegated by our Board of Directors with the authority to issuesubscription warrants, may, however, determine that shareholders be given subscription rights in connection witha particular issue of subscription warrants. In the case of an issue of subscription warrants, public or individualnotice must be given to each of the shareholders at least two weeks prior to the date for payment (or issuance ofthe subscription rights if such subscription warrants are issued without consideration).
Rights to subscribe for new shares, subscription warrants or rights to subscribe for subscription warrants,may be transferable or nontransferable by our Executive Management Board and may be made at or substantiallybelow the market price of shares. Accordingly, rights offerings can result in substantial dilution or can result inrights holders not being able to realize the economic value of those rights for subscription warrants.
A special resolution of our ordinary general meeting of shareholders held on June 26, 2003 authorizes us toissue up to 5,000 subscription warrants, each of which represents a right to subscribe for 1,000 shares of commonstock, for 5,000,000 shares of common stock, to Nomura and its subsidiaries’ directors, executive officers andemployees. See “Item 6. Directors and Senior Management and Employees, B. Compensation” above.
Liquidation Rights
In the event of liquidation, the assets remaining after payment of all debts, liquidation expenses and taxeswill be distributed among the shareholders in proportion to the number of shares they own.
Liability to Further Calls or Assessments
All of our currently outstanding shares, including shares represented by the ADSs, are fully paid andnonassessable.
Transfer Agent
UFJ Trust Bank, Limited is the transfer agent for our shares. UFJ Trust’s office is located at 4-3,Marunouchi 1-chome, Chiyoda-ku, Tokyo, 100-0005 Japan. UFJ Trust maintains our register of shareholders andrecords transfers of record ownership upon presentation of share certificates.
Record Date
The close of business on March 31 is the record date for our year-end dividends, if paid. The close ofbusiness on September 30 is the record date for our interim dividends, if paid. A holder of shares constituting one
71

or more whole units, who is registered as a holder on our register of shareholders at the close of business as ofMarch 31, is also entitled to exercise shareholders’ voting rights at the ordinary general meeting of shareholderswith respect to the year ended on March 31. In addition, we may set a record date for determining theshareholders entitled to other rights and for other purposes by giving at least two weeks’ public notice.
The shares generally trade ex-dividend or ex-rights in the Japanese stock exchanges on the third businessday before a record date (or if the record date is not a business day, the fourth business day prior thereto), for thepurpose of dividends or rights offerings.
Repurchase by Us of Shares
Under the Commercial Code, we may acquire our shares for any purposes subject to the authorization ofshareholders at an ordinary general shareholders’ meeting. This acquisition is subject to the condition that theaggregate amount of the purchase price must not exceed the amount of the retained earnings available for annualdividend payments less the sum of any amount paid or to be paid by way of appropriation of retained earningsand any transfer of retained earnings to stated capital.
A resolution of our ordinary general meeting of shareholders held on June 26, 2002 authorized us to acquireup to 100 million shares (representing approximately 5.0% of shares issued and outstanding) for up to ¥250billion by the closing of our ordinary general meeting of shareholders held in 2003. Under the resolution, werepurchased 22 million shares for ¥29,290 million during the year ended March 31, 2003. In addition, wecontinued to repurchase shares after April 1, 2003 in accordance with the resolution and, as a result, theaggregate number and value of shares repurchased during the authorization period under the resolution reached25 million shares and ¥32,914 million.
A resolution of our ordinary general meeting of shareholders held on June 26, 2003 authorizes us to acquireup to 100 million shares (representing approximately 5.0% of shares issued and outstanding) for up to ¥150billion by the closing of our ordinary general meeting of shareholders held in 2004.
In the case of shares listed on a Japanese stock exchange or traded in the over-the-counter market,acquisition shall be made through the market or by way of tender offer by the close of the following ordinarygeneral meeting, unless acquisition of the shares from a specified person is authorized by the approval of two-thirds of outstanding shares having voting rights present at the shareholders’ meeting at which a quorum of notless than one-third of outstanding shares having voting rights must be present.
In addition, we may acquire our shares by means of repurchase of any number of shares constituting lessthan one unit upon the request of the holder of those shares, as described under “Japanese Unit Share System”above.
Report of Substantial Shareholdings
The Securities and Exchange Law of Japan requires any person who has become a holder of more than 5%of the total issued shares of a company listed on any Japanese stock exchange or whose shares are traded on theover-the-counter market to file with the relevant Local Finance Bureau, within five business days, a reportconcerning those shareholdings. A similar report must also be filed to reflect any change of 1% or more in theabove shareholding. Copies of any reports must also be furnished to the company and to all Japanese stockexchanges on which the company’s shares are listed or, in the case of shares traded on the over-the-countermarket, the Securities Dealers Association of Japan. For this purpose, shares issuable to a 5% or greatershareholder upon exercise of subscription warrants are taken into account in determining both the number ofshares held by that holder and the company’s total issued share capital.
Daily Price Fluctuation Limits under Japanese Stock Exchange Rules
Stock prices on Japanese stock exchanges are determined on a real-time basis by the equilibrium betweenbids and offers. These exchanges are order-driven markets without specialists or market makers to guide price
72

formation. To prevent excessive volatility, these exchange set daily upward and downward price fluctuationlimits for each stock, based on the previous day’s closing price. Although transactions may continue at theupward or downward limit price if the limit price is reached on a particular trading day, no transactions may takeplace outside these limits. Consequently, an investor wishing to sell at a price above or below the relevant dailylimit may not be able to sell the invester’s shares at such price on a particular trading day, or at all.
On June 26, 2003, the closing price of our shares on the Tokyo Stock Exchange was ¥1,468 per share. Thefollowing table shows the daily price limit for a stock on the Tokyo Stock Exchange with a closing price ofbetween ¥1,000 and ¥1,499 per share, as well as the daily price limit if our per share price were to rise to between¥1,500 and ¥1,999, or fall to between ¥500 and ¥999. Other daily price limits would apply if our per share pricemoved to other ranges.
Selected Daily Price Limits
Previous Day’s Closing Price or Special QuoteMaximum DailyPrice Movement
Over ¥ 500 Less than ¥ 999 ¥ 100Over 1,000 Less than 1,499 200Over 1,500 Less than 1,999 300
For a history of the trading price of our shares on the Tokyo Stock Exchange, see Item 9.A of this annualreport.
Rights of Holders of ADSs
For a description of rights of holders of ADSs, see “Rights of Holders of ADSs” under Item 10.B. of ourRegistration Statement on Form 20-F (File No. 1-15270), which we filed with the Securities and ExchangeCommission on December 13, 2001. The information contained in that part of the Registration Statement isincorporated in this Item 10.B. by reference.
C. Material Contracts.
For the two years immediately preceding the date of this annual report, we have not been a party to anymaterial agreement other than in the ordinary course of business, except as disclosed in Item 6.C. of this annualreport.
D. Exchange Controls.
Acquisition or Disposition of Shares or ADSs
Under the Foreign Exchange and Foreign Trade Law, all aspects of regulations on foreign exchange andforeign trade transactions are, with minor exceptions relating to inward direct investments (which are notgenerally applicable to our shares), only subject to post transaction reporting requirements. Non-residents ofJapan (including foreign corporations not resident in Japan) who acquire or dispose of shares of common stock orADSs are generally not required to submit such post transaction reports. However, the Minister of Finance hasthe power to impose a licensing requirement for transactions in limited circumstances.
Dividends and Proceeds of Sale
Under the Foreign Exchange and Foreign Trade Law, dividends paid on, and the proceeds of sales in Japanof, shares held by non-residents of Japan may in general be converted into any foreign currency and repatriatedabroad. Under the terms of the deposit agreement pursuant to which our ADSs will be issued, the depositary isrequired, to the extent that in its judgment it can convert yen on a reasonable basis into dollars and transfer theresulting dollars to the United States, to convert all cash dividends that it receives in respect of deposited sharesinto dollars and to distribute the amount received (after deduction of applicable withholding taxes) to the holdersof ADSs.
73

E. Taxation.
This section describes the material United States federal income and Japanese tax consequences of owningshares or ADSs. It applies to you only if you acquire your shares or ADSs in an offering and you hold yourshares or ADSs as capital assets for tax purposes. This section does not apply to you if you are a member of aspecial class of holders subject to special rules, including:
• a dealer in securities,
• a trader in securities that elects to use a mark-to-market method of accounting for your securitiesholdings,
• a tax-exempt organization,
• a life insurance company,
• a person liable for alternative minimum tax,
• a person that actually or constructively owns 10% or more of our voting stock,
• a person that holds shares or ADSs as part of a straddle or a hedging, conversion, integrated orconstructive sale transaction, or
• a person whose functional currency is not the U.S. dollar.
This section is based on the Internal Revenue Code of 1986, as amended, its legislative history, existing andproposed regulations, published rulings and court decisions, and the laws of Japan all as currently in effect, aswell as on the Income Tax Convention Between the United States of America and Japan (the “Treaty”). Theselaws are subject to change, possibly on a retroactive basis. Prospective investors should be aware that, onJune 10, 2003, the U.S. Treasury Department announced that the United States and Japan have agreed inprinciple to the terms of a new bilateral income tax treaty to replace the Treaty. As of the date of the filing of thisForm 20-F, a new treaty has not been finalized. There can be no certainty whether a new treaty will ultimately gointo effect, what the provisions of such a new treaty might be, and whether such provisions will affect U.S.Holders. In addition, this section is based in part upon the representations of The Bank of New York and theassumption that each obligation in the deposit agreement and any related agreement will be performed inaccordance with its terms.
You are a U.S. holder if you are a beneficial owner of shares or ADSs and you are:
• a citizen or resident of the United States,
• a domestic corporation,
• an estate whose income is subject to United States federal income tax regardless of its source, or
• a trust if a United States court can exercise primary supervision over the trust’s administration and oneor more United States persons are authorized to control all substantial decisions of the trust.
A “non-U.S. holder” is a beneficial owner of shares or ADSs that is not a United States person for UnitedStates federal income tax purposes.
You should consult your own tax advisor regarding the United States federal, state and local and theJapanese and other tax consequences of owning and disposing of shares and ADSs in your particularcircumstances.
This discussion addresses only United States federal income taxation and Japanese income taxation, gift andinheritance taxation.
74

In general, and taking into account the earlier assumptions, for United States federal income tax purposes, ifyou hold ADRs evidencing ADSs, you will be treated as the owner of the shares represented by those ADSs.Exchanges of shares for ADSs, and ADSs for shares, generally will not be subject to United States federalincome or to Japanese tax.
United States Federal Income Taxation
Under the United States federal income tax laws, and subject to the passive foreign investment company, orPFIC, rules discussed below, if you are a U.S. holder, the gross amount of any dividend we pay out of our currentor accumulated earnings and profits (as determined for United States federal income tax purposes) is subject toUnited States federal income taxation. If you are a noncorporate U.S. holder, dividends paid to you in taxableyears beginning after December 31, 2002 and before January 1, 2009 that constitute qualified dividend incomewill be taxable to you at a maximum tax rate of 15% provided that you hold the shares or ADSs for more than 60days before the ex-dividend date and meet other holding period requirements. Dividends we pay with respect tothe shares or ADSs generally will be qualified dividend income. You must include any Japanese tax withheldfrom the dividend payment in this gross amount even though you do not in fact receive it. The dividend is taxablewhen you, in the case of shares, or the Depositary, in the case of ADSs, receive the dividend, actually orconstructively. The dividend will not be eligible for the dividends-received deduction generally allowed toUnited States corporations in respect of dividends received from other United States corporations. The amount ofthe dividend distribution that you must include in your income as a U.S. holder will be the U.S. dollar value ofthe Japanese yen payments made, determined at the spot Japanese yen/U.S. dollar rate on the date the dividenddistribution is includible in your income, regardless of whether the payment is in fact converted into U.S. dollars.Generally, any gain or loss resulting from currency exchange fluctuations during the period from the date youinclude the dividend payment in income to the date you convert the payment into U.S. dollars will be treated asordinary income or loss and will not be eligible for the special tax rate applicable to qualified dividend income.The gain or loss generally will be income or loss from sources within the United States for foreign tax creditlimitation purposes. Distributions in excess of current and accumulated earnings and profits, as determined forUnited States federal income tax purposes, will be treated as a non-taxable return of capital to the extent of yourbasis in the shares or ADSs and thereafter as capital gain.
Subject to certain limitations, the Japanese tax withheld in accordance with the Treaty and paid over toJapan will be creditable against your United States federal income tax liability. Special rules apply indetermining the foreign tax credit limitation with respect to dividends that are subject to the maximum 15% rate.
Dividends will be income from sources outside the United States, but generally will be “passive income” or“financial services income”, which is treated separately from other types of income for purposes of computingthe foreign tax credit allowable to you.
A transfer of retained earnings or legal reserve to stated capital is treated as a dividend payment for Japanesetax purposes subject to withholding tax. In addition, if we purchase our shares for the purpose of cancellationwith retained earnings and we cancel the shares after March 31, 2002 selling shareholders will be deemed to havereceived a dividend payment. If we purchase the shares pursuant to a tender offer non-selling shareholders willbe deemed to have received a dividend whether we purchase the shares by tender offer or otherwise. Such atransfer or dividends is not generally a taxable event for United States federal income tax purposes (though aselling U.S. shareholder would be subject to U.S. federal income tax on capital gains realized on a sale of sharesto us, as described below) and therefore would not give rise to foreign source income, and you would not be ableto use the foreign tax credit arising from any Japanese withholding tax imposed on such distribution unless youcan apply the credit (subject to limitations) against U.S. tax due or other foreign source income in the appropriatecategory for foreign tax credit purposes.
Distributions of additional shares or ADSs or rights to you with respect to shares or ADSs that are made aspart of a pro rata distribution to all of our shareholders generally will not be subject to United States federal
75

income tax. Your basis in the new shares or ADSs or rights received will be determined by allocating your basisin the shares or ADSs you held at the time of the distribution between the new shares or ADSs or rights and theshares or ADSs you held at the time of the distribution based on their relative fair market value on the date of thedistribution. However, the basis of rights you receive will generally be zero if (i) at the time of the distributionthe fair market value of the rights is less than 15% of the fair market value of the shares or ADSs you held at thetime of the distribution and you do not elect to allocate a portion of the basis in the shares or ADS you held at thetime of the distribution according to the method described in the previous sentence or (ii) the rights are notexercised and therefore expire.
Non-U.S. Holders
If you are a non-U.S. holder, dividends paid to you in respect of shares or ADSs will not be subject toUnited States federal income tax unless the dividends are “effectively connected” with your conduct of a trade orbusiness within the United States, and the dividends are attributable to a permanent establishment that youmaintain in the United States if that is required by an applicable income tax treaty as a condition for subjectingyou to United States taxation on a net income basis. In such cases you generally will be taxed in the same manneras a U.S. holder. If you are a corporate non-U.S. holder, “effectively connected” dividends may, under certaincircumstances, be subject to an additional “branch profits tax” at a 30% rate or at a lower rate if you are eligiblefor the benefits of an income tax treaty that provides for a lower rate.
Taxation of Capital Gains
Subject to the PFIC rules discussed below, if you are a U.S. holder and you sell or otherwise dispose of yourshares or ADSs, you will recognize capital gain or loss for United States federal income tax purposes equal to thedifference between the U.S. dollar value of the amount that you realize and your tax basis, determined in U.S.dollars, in your shares or ADSs. Capital gain of a noncorporate U.S. holder that is recognized on or after May 6,2003 and before January 1, 2009 is generally taxed at a maximum rate of 15% where the property is held formore than one year. The gain or loss will generally be income or loss from sources within the United States forforeign tax credit limitation purposes.
Taxation of Capital Gain—Non-U.S. Holders
If you are a non-U.S. holder, you will not be subject to United States federal income tax on gain recognizedon the sale or other disposition of your shares or ADSs unless:
• the gain is “effectively connected” with your conduct of a trade or business in the United States, and thegain is attributable to a permanent establishment that you maintain in the United States if that is requiredby an applicable income tax treaty as a condition for subjecting you to United States taxation on a netincome basis, or
• you are an individual, you are present in the United States for 183 or more days in the taxable year ofthe sale and certain other conditions exist.
If you are a corporate non-U.S. holder, “effectively connected” gains that you recognize may also, under certaincircumstances, be subject to an additional “branch profits tax” at a 30% rate or at a lower rate if you are eligiblefor the benefits of an income tax treaty that provides for a lower rate.
PFIC Rules
We do not expect our shares and ADSs to be treated as stock of a PFIC for United States federal income taxpurposes for 2002, but this conclusion is a factual determination that is made annually and thus may be subject tochange. Moreover, the application of the PFIC rules to a corporation, such as Nomura, that is primarily engagedin an active business as a securities dealer is not entirely clear.
76

In general, if you are a U.S. holder, we will be a PFIC with respect to you if for any taxable year in whichyou held our ADSs or shares:
• at least 75% of our gross income for the taxable year is passive income or,
• at least 50% of the value, determined on the basis of a quarterly average, of our assets is attributable toassets that produce or are held for the production of passive income.
Passive income generally includes dividends, interest, royalties, rents (other than certain rents and royaltiesderived in the active conduct of a trade or business), annuities and gains from assets that produce passive income.If a foreign corporation owns at least 25% by value of the stock of another corporation, the foreign corporation istreated for purposes of the PFIC tests as owning its proportionate share of the assets of the other corporation, andas receiving directly its proportionate share of the other corporation’s income.
Dividends that you receive from us will not constitute qualified dividend income to you if we are a PFICeither in the taxable year of the distribution or the preceding taxable year. Dividends that you receive that do notconstitute qualified dividend income are not eligible for taxation at the preferential rates applicable to qualifieddividend income. Instead, you must include the gross amount of any such dividend paid by us out of ouraccumulated earnings and profits (as determined for United States federal income tax purposes) in you grossincome, and it will be subject to tax at rates applicable to ordinary income.
If we are treated as a PFIC, and you are a U.S. holder that did not make a mark-to-market election, asdescribed below, you will be subject to special rules with respect to:
• any gain you realize on the sale or other disposition of your shares or ADSs, and
• any excess distribution that we make to you (generally, any distributions to you during a single taxableyear that are greater than 125% of the average annual distributions received by you in respect of theshares or ADSs during the three preceding taxable years or, if shorter, your holding period for the sharesor ADSs).
Under these rules:
• the gain or excess distribution will be allocated ratably over your holding period for the shares or ADSs,
• the amount allocated to the taxable year in which you realized the gain or excess distribution and anytaxable year prior to the first year in which we were a PFIC will be taxed as ordinary income,
• the amount allocated to each other year, with certain exceptions, will be taxed at the highest tax rate ineffect for that year, and
• the interest charge generally applicable to underpayments of tax will be imposed in respect of the taxattributable to each such year.
Special rules apply for calculating the amount of the foreign tax credit with respect to excess distributionsby a PFIC.
If you own shares or ADSs in a PFIC that are regularly traded on a qualified exchange, they will be treatedas marketable stock, and you may elect to mark your shares or ADSs to market. If you make this election, youwill not be subject to the PFIC rules described above. Instead, in general, you will include as ordinary incomeeach year the excess, if any, of the fair market value of your shares or ADSs at the end of the taxable year overyour adjusted basis in your shares or ADSs. You will also be allowed to take an ordinary loss in respect of theexcess, if any, of the adjusted basis of your shares or ADSs over their fair market value at the end of the taxableyear (but only to the extent of the net amount of previously included income as a result of the mark-to-marketelection). Your basis in the shares or ADSs will be adjusted to reflect any such income or loss amounts. We urgeyou to speak to your tax advisor regarding the availability and advisability of this election.
77

If you own shares or ADSs during any year that we are a PFIC, you must file Internal Revenue ServiceForm 8621.
Backup Withholding and Information Reporting.
If you are a noncorporate U.S. holder, information reporting requirements, on Internal Revenue ServiceForm 1099, generally will apply to:
• dividend payments or other taxable distributions made to you within the United States, and
• the payment of proceeds to you from the sale of shares or ADSs effected at a United States office of abroker.
Additionally, backup withholding may apply to such payments if you are a noncorporate U.S. holder that:
• fails to provide an accurate taxpayer identification number,
• is notified by the Internal Revenue Service that you have failed to report all interest and dividendsrequired to be shown on your federal income tax returns, or
• in certain circumstances, fails to comply with applicable certification requirements.
If you are a non-U.S. holder, you are generally exempt from backup withholding and information reportingrequirements with respect to:
• dividend payments made to you outside the United States by us or another non-United States payor and
• other dividend payments and the payment of the proceeds from the sale of shares or ADSs effected at aUnited States office of a broker, as long as the income associated with such payments is otherwiseexempt from United States federal income tax, and:
• the payor or broker does not have actual knowledge or reason to know that you are a United Statesperson and you have furnished the payor or broker:
• an Internal Revenue Service Form W-8BEN or an acceptable substitute form upon which youcertify, under penalties of perjury, that you are a non-United States person, or
• other documentation upon which it may rely to treat the payments as made to a non-United Statesperson in accordance with U.S. Treasury regulations, or
• you otherwise establish an exemption.
Payment of the proceeds from the sale of shares or ADSs effected at a foreign office of a broker generallywill not be subject to information reporting or backup withholding. However, a sale of shares or ADSs that iseffected at a foreign office of a broker will be subject to information reporting and backup withholding if:
• the proceeds are transferred to an account maintained by you in the United States,
• the payment of proceeds or the confirmation of the sale is mailed to you at a United States address, or
• the sale has some other specified connection with the United States as provided in U.S. Treasuryregulations,
unless the broker does not have actual knowledge or reason to know that you are a United States person and thedocumentation requirements described above are met or you otherwise establish an exemption.
In addition, a sale of shares or ADSs effected at a foreign office of a broker will be subject to informationreporting if the broker is:
• a United States person,
78

• a controlled foreign corporation for United States tax purposes,
• a foreign person 50% or more of whose gross income is effectively connected with the conduct of aUnited States trade or business for a specified three-year period, or
• a foreign partnership, if at any time during its tax year:
• one or more of its partners are “U.S. persons”, as defined in U.S. Treasury regulations, who in theaggregate hold more than 50% of the income or capital interest in the partnership, or
• such foreign partnership is engaged in the conduct of a United States trade or business,
unless the broker does not have actual knowledge or reason to know that you are a United States person and thedocumentation requirements described above are met or you otherwise establish an exemption. Backupwithholding will apply if the sale is subject to information reporting and the broker has actual knowledge thatyou are a United States person.
You generally may obtain a refund of any amounts withheld under the backup withholding rules that exceedyour income tax liability by filing a refund claim with the United States Internal Revenue Service.
Japanese Taxation
The following is a summary of the principal Japanese tax consequences to owners of our shares who arenon-resident individuals or non-Japanese corporations without a permanent establishment in Japan to which therelevant income is attributable. As tax laws are frequently revised, the tax treatments described in this summaryare also subject to changes in the applicable Japanese laws and/or double taxation conventions occurring in thefuture, if any. This summary is not exhaustive of all possible tax considerations which may apply to specificinvestors under particular circumstances. Potential investors should satisfy themselves as to
• the overall tax consequences of the acquisition, ownership and disposition of shares or ADSs, includingspecifically the tax consequences under Japanese law,
• the laws of the jurisdiction of which they are resident, and
• any tax treaty between Japan and their country of residence, by consulting with their own tax advisers.
Generally, a non-resident shareholder is subject to Japanese withholding tax on dividends on the shares paidby us. A stock split is not subject to Japanese income or corporation tax, as it is characterized merely as anincrease of number of shares (as oppose to an increase of value of shares) from Japanese tax perspectives. Due tothe 2001 Japanese tax legislation effective from April 1, 2001, a conversion of retained earnings or legal reserve(but other than additional paid-in capital, in general) into stated capital on a non-consolidated basis is notcharacterized as a deemed dividend for Japanese tax purposes, and therefore such a conversion does not triggerJapanese withholding taxation (Article 2 (17) (n) of the Japanese Corporation Tax Law).
Under the 2001 tax legislation, deemed dividend taxation system has been drastically changed. Under thenew rule, if we purchase our listed shares by way of a tender offer for the purpose of cancellation with retainedearnings, the selling shareholders (both individuals and corporations) are in general required to recognize (i)deemed dividend corresponding to a distribution of retained earnings proportionally computed by a statutoryformula on a pro rata basis allocating the purchase price into share capital portion (including additional paid-incapital) and retained earnings portion on a non-consolidated basis, and (ii) capital gain or loss computed as adifference between the basis of the shares subject to the tender offer at the shareholders level and the amount ofthe consideration for the tender offer (deducting the amount corresponding to the deemed dividend computed as(i) above). On the other hand, in the case of individual shareholders, no deemed dividend is required to recognizeuntil March 31, 2005 due to the operation of a temporary measurement (Article 9-4 of the Japanese Special TaxMeasurement Law) and therefore they are only required to recognize capital gain or loss of the shares subject to
79

the tender offer. In the meantime, when shares are acquired by us (whether by way of a tender offer or otherwise)for the purpose of cancellation with retained earnings, the shareholders (both individuals and corporations)whose shares were not canceled were previously deemed to have received a dividend corresponding to theincrease of share value by the share cancellation, under the old tax law before the 2001 tax legislation. However,under the 2001 tax legislation, no deemed dividend taxation occurs for the remaining shareholders (bothindividuals and corporations) whose shares are not canceled.
Unless an applicable tax treaty, convention or agreement reducing the maximum rate of withholding tax, therate of Japanese withholding tax applicable to dividends on the shares paid by us to non-resident shareholders is20%. Japan has income tax treaties, conventions or agreements whereby the above-mentioned withholding taxrate is reduced, generally to 15% for portfolio investors, with, among others, Australia, Belgium, Canada,Denmark, Finland, France, Germany, Ireland, Italy, Luxembourg, The Netherlands, New Zealand, Norway,Singapore, Spain, Sweden, Switzerland, the United Kingdom and the United States. Non-resident shareholderswho are entitled to a reduced rate of Japanese withholding tax on payment of dividends on the shares by us arerequired to submit an Application Form for Income Tax Convention regarding Relief from Japanese Income Taxon Dividends in advance through us to the relevant tax authority before payment of dividends. A standing proxyfor non-resident shareholders may provide such application service. See “Rights of Our Shareholders” under Item10.B of this annual report. Non-resident shareholders who do not submit an application in advance will beentitled to claim the refund of withholding taxes withheld in excess of the rate of an applicable tax treaty fromthe relevant Japanese tax authority.
Gains derived from the sale of shares outside Japan, or from the sale of shares within Japan by a nonresidentshareholder as a portfolio investor, are, in general, not subject to Japanese income or corporation taxes.
Japanese inheritance and gift taxes at progressive rates may be payable by an individual who has acquiredshares as a legatee, heir or done, even if the individual is not a Japanese resident.
F. Dividends and Paying Agents.
Not applicable.
G. Statement by Experts.
Not applicable.
H. Documents on Display.
We are subject to the informational requirements of the Securities Exchange Act of 1934 and, in accordancetherewith, we will file annual reports on Form 20-F within six months of our fiscal year-end and other reportsand information on Form 6-K with the Securities and Exchange Commission. These reports and otherinformation can be inspected at the public reference room at the Securities and Exchange Commission at 450Fifth Street, N.W., Washington, D.C. 20549. You can also obtain copies of such material by mail from the publicreference room of the Securities and Exchange Commission at prescribed fees. You may obtain information onthe operation of the Securities and Exchange Commission public reference room by calling the Securities andExchange Commission in the United States at 1-800-SEC-0330. You can also access to the documents filed viathe Electronic Data Gathering, Analysis, and Retrieval system on the SEC’s website (http://www.sec.gov).
I. Subsidiary Information.
Not applicable.
80

Item 11. Quantitative and Qualitative Disclosures about Market Risk
Risk Management
Our business is subject to various risks. These risks include market, credit, event, market liquidity,operational, system and legal risks. The process of managing those risks is an integral part of management’sresponsibilities. Financial innovation in global business activities can lead to complex interactions among risks.We recognize the importance of identifying, evaluating, monitoring and managing our risk profile.
We manage market, credit, event and market liquidity risks using a global risk management structuredescribed below. We manage operational, system and legal risks primarily on a regional basis.
Global Risk Management Structure
We have an independent global risk management unit headquartered in Tokyo to support risk managementwhich takes place at each level of our business. The global risk management unit also monitors and managesmarket, credit, event and market liquidity risks with regard to our trading and investment portfolios on aworldwide basis.
Our current global management structure places primary risk control responsibility with the head of GlobalWholesale together with the head of each global business under Global Wholesale. This structure enhances thecoordination of our global business while satisfying the regional-based requirements of each legal entity.Concurrently, the global risk management organization monitors, controls and supports our business segments.The global risk manager who is based in Tokyo is the overall controller for global risk management, andcoordinates the efforts of the regional risk managers.
The Executive Management Board of Nomura is responsible for establishing global risk policies, andmonitoring and managing the various risks that we face in our business activities.
The Board of Executive Officers and Executive Management Board also determine our strategic directionand allocate resources and capital to each of our businesses. The Executive Management Board reviews ourbusiness plans, budgets and risk-adjusted performance to ensure proper diversification of risks and revenues. TheBoard of Executive Officers is made up of all of our Executive Officers. The Executive Management Board ismade up of Representative Executive Officers and some of the Executive Officers appointed by our Board ofDirectors. Our President and Chief Executive Officer is the Chairman of both of the organizations.
The Board of Executive Officers and Executive Management Board set the overall risk limit that appliesacross business segments to all of our trading and investment portfolios for our global business. The global riskmanager monitors the extent of risk exposure at each of our trading units relative to the in-house risk limitassigned to that unit and reports it to senior management daily. In addition, each of our regional operationsemploys its own position limits and stop-loss limits, which may be stricter than the in-house risk limit.
Our global risk management headquartered in Tokyo provides risk information to the ExecutiveManagement Board and quantifies risk for each of our businesses.
The role of our global risk manager in Tokyo is to monitor risk, ensure compliance with risk limits andrecommend action to management as market conditions and our portfolio changes. To this end, daily reports onthe monitoring and management of our worldwide risks are produced by the global risk management unit.Reports from the global risk manager enable our senior management to identify and control risk across the entireorganization.
Our global risk management structure meets the risk management requirements of our major regulatory andreporting bodies. Regional risk managers located in Europe, the United States, Asia outside Japan, and in Tokyo,
81

report on a daily basis to both regional management and risk management headquarters. In addition, consolidatedrisk information is reported to the global business heads and to our senior management in Tokyo on a daily basis.
We have made a significant commitment to the development and continuous enhancement of an appropriaterisk management system and procedures. This system now enables us to produce various analyses of global-based exposure to counterparties under the unified obligor identification, as well as to calculate risk amounts,including Value-at-Risk amounts discussed below, based upon our position and sensitivity data sets providedfrom our regional risk management. The system, which senior management and other key managers access,integrates global market data, counterparty, position, exposure and other risk information worldwide. Thisenables us to achieve more efficient risk monitoring and more effective risk control. Especially we can monitorand control concentration of credit exposure on a daily basis against any credit events, which we now experiencein the markets worldwide.
We maintain standardized methodologies for all our global operations. With this standardized framework,we can evaluate and compare the risk-adjusted profitability of our existing businesses in a consistent manner.Senior management can use this information to enhance our performance by diversifying revenues andcontrolling exposures.
Our global risk management employs an in-house risk limit, which we have developed as a tool tocomprehensively measure our market, credit, event and market liquidity risks. We group our traders based on thetype of trading strategy they use and the type of financial instrument in which they trade, and we assign to eachgroup a specific in-house risk limit. The traders may execute their transactions until the aggregate risk valueassociated with the positions they have built reaches the assigned in-house risk limit.
Types of Risks Managed
The seven principal categories of risk that we face in our daily business operations are market, credit, event,market liquidity, operational, system and legal risks.
Market Risk
Market risk refers to the potential loss in the value of an asset resulting from changes in market prices, rates,indices, volatilities, correlations or other market factors. We are exposed to this type of risk primarily inconnection with our trading activities. Effective monitoring and management of this risk requires an ability toanalyze a complex and constantly changing capital market environment worldwide and to highlight anyproblematic trends quickly.
VaR. The statistical technique known as Value-at-Risk, or VaR, is one of the tools we use to assess marketrisk exposure of our trading portfolio. VaR is the potential loss in the value of our trading positions due toadverse movements in markets over a defined time horizon with a specified confidence level.
For our VaR, which we report below, we use a one-day time horizon and a 99% confidence level. Thismeans that, statistically, there is one day out of every 100 days on which the actual trading loss exceeds the VaR.
VaR Methodology, Assumptions and Limitations. We make a number of assumptions and approximationsin connection with the modeling of the risk characteristics of our trading positions. Different assumptions,approximations or a combination of them could result in a materially different VaR. We believe that theassumptions and approximations we use are reasonable.
We use a historical simulation approach to estimate VaR using a 99% confidence level and a one-day timehorizon for our trading portfolio. Market risks that are incorporated in the VaR model include equity prices,interest rates, foreign exchange rates, and associated volatilities and correlations. The historical data to calculate
82

volatilities and correlations are weighted to give greater importance to more recent observations. Given itsreliance on historical data, VaR is most effective in estimating risk exposures in markets in which there are nosudden changes in market environments. An inherent limitation of VaR is that past changes in market riskfactors, even when weighted toward more recent observations, may not produce accurate predictions of futuremarket risk. Also, VaR using a one-day time horizon may not capture the market risk of positions that cannot beliquidated or hedged within one day.
There are other limitations of VaR. For example, our VaR computation assumes normal distribution for thereturns on trading portfolios, while non-linear risk exposures on options would likely produce a non-normaldistribution for the returns on those portfolios. Different distributional assumptions could produce a materiallydifferent VaR.
The following table shows our VaR as of each of the dates indicated for substantially all of our tradingpositions:
As of
Mar. 29,2002
Apr. 30,2002
May 31,2002
Jun. 28,2002
Jul. 31,2002
Aug. 30,2002
Sep. 30,2002
Oct. 31,2002
Nov. 29,2002
Dec. 30,2002
Jan. 31,2003
Feb. 28,2003
Mar. 31,2003
(dollar amounts in millions)Equity . . . . . . . . . . . . . . . $15.0 $12.7 $13.9 $ 14.7 $ 11.8 $ 11.2 $10.4 $10.6 $12.0 $10.8 $10.9 $14.2 $12.7Interest Rate . . . . . . . . . . 17.5 15.0 16.0 13.9 17.9 14.3 14.7 8.9 17.0 16.1 20.4 15.2 18.8Foreign Exchange . . . . . . 1.5 2.7 2.1 3.1 3.5 2.7 3.4 3.4 2.4 2.6 1.7 1.9 1.6
Sub-total . . . . . . . . . 34.0 30.4 31.9 31.7 33.3 28.2 28.5 22.9 31.3 29.5 33.0 31.3 33.1Less:
DiversificationBenefit . . . . . . . . (9.2) (8.8) (8.4) (10.2) (12.7) (10.2) (9.8) (8.8) (10.1) (9.5) (8.4) (9.7) (7.5)
Value at Risk . . . . . $24.8 $21.6 $23.5 $ 21.6 $ 20.6 $ 18.0 $18.7 $14.1 $21.3 $20.0 $24.6 $21.6 $25.6
Value at Risk(maximum) . . . . . . . $27.9 : March 28, 2003(average) . . . . . . . . . 20.8 : Average for the period from April 1, 2002 to March 31, 2003(minimum) . . . . . . . 14.0 : October 25, 2002
VaR relating to equity risk decreased from $15.0 million at the end of March 2002 to $12.7 million at theend of March 2003 mainly due to the reduced position of equity block trading and convertible bond trading inTokyo. VaR relating to interest rate risk increased from $17.5 million at the end of March 2002 to $18.8 millionat the end of March 2003 mainly due to the position in fixed income business which is sensitive to yield curve.We manage the position size according to the market environment.
Non-trading Risk. A major market risk in our non-trading portfolio relates to operating equity investmentsheld for relationship purposes which we hold on a long-term basis. Our non-trading portfolio is exposed mainlyto volatility in the Japanese stock market. One method that can estimate the market risk in the portfolio is toanalyze market sensitivity based on changes in the Tokyo Stock Price Index, or TOPIX, which is a leading indexof prices of stocks on the First Section of the Tokyo Stock Exchange.
We used regression analysis between fluctuation in TOPIX and the market value of our operating equityinvestments held for relationship purposes for the past 90 days. Our simulation indicates that, for each 10%change in TOPIX, the market value of our operating equity investments held for relationship purposes can beexpected to change by ¥15,533 million as of March 29, 2002 and ¥9.098 million as of March 31, 2003. Thedifference in simulated numbers between March 29, 2002 and March 31, 2003 is due mainly from the positiondecrease as well as market value decrease of our operating equity investments held for relationship purposes. OnMarch 29, 2002, TOPIX closed at 1,060.19 points and on March 31, 2003, TOPIX closed at 788.00 points. Thissimulation analyzes data for our entire operating equity investments held for relationship purposes. Therefore, itis very important to note that the actual results differ from our expectations because of price fluctuations ofindividual equities.
83

Credit Risk
Credit risk refers to the potential loss in the value of a transaction because of a counterparty or issuer failingto perform its contractual commitment. This type of risk is reduced through diversification, effective creditanalysis of counterparties, enforcement of credit limits by country and by counterparty, management of creditexposure through netting arrangements, and the maintenance of adequate collateral to secure the commitments ofcounterparties. We also use credit derivatives to reduce our exposure or hedge our credit risk with respect toissuers. Our regional credit officers monitor on a daily basis all credit risk and limits, and communicate creditinformation and concerns to our global risk management headquarters in Tokyo.
We measure our credit risk to derivatives transaction counterparties as the sum of actual current exposureevaluated daily at its fair value, plus potential exposure until maturity of such transactions. All derivative creditlines are centrally controlled through our global risk management unit in Tokyo.
We enter into International Swaps and Derivatives Association, Inc. master agreements or equivalentagreements called master netting agreements with many of our derivative counterparties. Master nettingagreements provide protection to reduce our risks of counterparty default and, in some cases, offset ourconsolidated balance sheet exposure with the same counterparty which provides a more meaningful presentationof our balance sheet credit exposure.
In addition, to reduce default risk, we require collateral, principally cash or highly liquid bonds, includingU.S. government securities and Japanese government securities when necessary.
The credit quality of Nomura’s trading-related derivatives as of March 31, 2003 is summarized in the tablebelow, showing the fair value of the related assets by counterparty credit rating. The actual credit ratings aredetermined by Nomura’s internally determined public rating agency equivalents.
Counterparty Credit Ratings for Replacement Cost (Net of Collateral) of Trading Derivatives inGain Positions
Millions of Yen
Translationinto millions
of U.S.dollars
Years to Maturity Cross-MaturityNetting (1)
ReplacementCost
CreditRating (1)
Less than1 Year
1 to 3Years
3 to 5Years
5 to 7Years
More than7 Years
Total FairValue
CollateralObtained
ReplacementCost
(a) (b) (a)-(b)
AAA . . . . ¥ 17,409 ¥ 18,150 ¥ 7,788 ¥ 2,946 ¥ 23,705 ¥ (25,971) ¥ 44,026 ¥ — ¥ 44,026 $ 373AA . . . . . . 70,870 183,043 143,841 143,942 471,871 (735,930) 277,636 102,259 175,377 1,485A . . . . . . . 29,823 76,304 59,456 42,189 139,457 (236,146) 111,082 24,233 86,849 736BBB . . . . 11,799 28,414 29,715 39,505 39,497 (67,527) 81,402 9,594 71,808 608BB . . . . . . 241 631 280 113 — — 1,265 — 1,265 11Other(2) . . 2,929 129 49 — 8,437 (7,264) 4,280 148 4,132 35
Sub-total . 133,071 306,671 241,129 228,695 682,967 (1,072,838) 519,691 136,234 383,457 3,248Listed . . . 20,319 929 182 — — — 21,430 — 21,430 182
Total . . . . ¥153,390 ¥307,600 ¥241,311 ¥228,695 ¥682,967 ¥(1,072,838) ¥541,121 ¥136,234 ¥404,887 $3,430
Notes:
(1) This item represents netting of payable balances with receivable balances for the same counterparty acrossmaturity band categories. Receivable and payable balances with the same counterparty in the same maturitycategory, however, are net within the maturity category.
(2) “Other” does not necessarily indicate that the counterparties’ credit is below investment grade.
84
Event Risk
Event risk refers to the potential loss in value that we may suffer through unpredictable events that causelarge unexpected market price moves. Event risk can be caused by changes in political or economic factors. Forexample, our global risk management unit collects information on current developments in the political andeconomic situations in the emerging countries in which we conduct business and report them to our seniormanagement on a weekly basis. We also monitor event risk associated with the possible failure of expectedmergers and acquisitions and other corporate transactions with respect to which we have made strategicinvestments in parties involved in these transactions.
Through our Merchant Banking activities, we have significant exposure to private equity assets. Under ourrisk management framework, we treat them as private equity investments.
By their nature, these assets are less liquid than other trading assets, and as a result, valuation is moreuncertain. In addition, our exposure is in some cases more concentrated than is the case for other trading assets.They also exhibit a high degree of asset-specific risk. Given these characteristics, market risk approach which isderived from day-to-day movement of market variables cannot capture the risk of private equity, and thereforewe believe it is appropriate to characterize private equity risk as event risk.
We have developed modeling techniques to help us quantify the scale of our private equity risk and to allowus to calibrate these risks to the same confidence level that we apply to other trading activities. These techniquesallow us to reflect the high levels of specific risk attached to private equity and the unusual statisticalcharacteristics of early stage corporate finance portfolios.
Market Liquidity Risk
Market liquidity risk refers to the additional risk that we face when we have large positions which cannot bedisposed of in the course of normal market trading turnover. The longer we are exposed to these large positions,the greater the risk we face from fluctuations in the market price and other volatile market conditions. Fundingrisk is discussed in “ Liquidity and Capital Resources” under Item 5.B. of this annual report.
Operational Risk
Operational risk refers to the potential cost associated with criminal or other improper actions taken by ourexecutives and employees, or failure or malfunction of our system management, or the occurrence of externalphenomena such as natural disasters. Due to the increased sophistication in security transactions and theoutsourcing or systemization of our operations for efficiency purposes, reduction of operational risk has becomeincreasingly essential. We manage our operational risk primarily by periodic evaluation and enhancement, asnecessary, of our internal controls.
System Risk
System risk is a type of operational risk. It is defined as risk in which we suffer damages due to systemdefects, such as the shutdown or malfunction of computer systems. System risk also includes the risk that wemay suffer damages due to unauthorized uses of computers.
In order to deal with system risk, we have internal regulations on information security management that setout our security policy. We make it a first priority to make these regulations well known and understood by ouremployees, including the importance of compliance. Also, users at Nomura and developers such as NomuraResearch Institute cooperate in developing new systems since the early stage of the development, and we aim tostructure these systems that operate in line with our actual business operations. Users at Nomura participate incomprehensive tests at the time of releasing important systems. We endeavor to mitigate system risk through
85

appropriate inspections. Furthermore, for important systems, we have a surveillance system which operates 24hours a day, 365 days a year, and we implement early inspection and recovery from failures.
Legal Risk
Legal risk refers to the risk of non-compliance with applicable legal and regulatory requirements, andpotential loss from the inability to recover payments due from a counterparty owing to the non-enforceability of acontract. Professional expertise in the applicable regulatory environment where we conduct business, and anability to develop cross-border products and services that meet divergent and often conflicting requirements ofvarious regulatory regimes, are essential for managing this type of risk. We manage our legal risk primarily at thelevel of our regional operations. Within Nomura, we have an Internal Controls Committee which is charged withthe task of promoting proper corporate behavior throughout our group and enhancing our internal controls andprocedures. The members of this committee are the President and Chief Executive Officer, some of the ExecutiveOfficers and non-executive Directors including a member of the Audit Committee. In addition, for our Japanesesecurities operations, the Compliance Committee in Nomura Securities, which consists of the President and ChiefExecutive Officer and some of the Executive Officers of Nomura Securities as well as two outside lawyers,considers major compliance matters. As part of our efforts to address legal risks for our global business, globallegal and compliance conferences are held regularly to discuss issues relating to cross-border business.
Item 12. Description of Securities Other Than Equity Securities.
Not applicable.
PART II
Item 13. Defaults, Dividend Arrearages and Delinquencies.
None.
Item 14. Material Modifications to the Rights of Security Holders and Use of Proceeds.
None.
Item 15. Controls and Procedures.
Within 90 days of the filing of this report, an evaluation was carried out under the supervision and with theparticipation of Nomura’s management, including its Chief Executive Officer and Chief Financial Officer(collectively referred to as the “Certifying Officers”), of the effectiveness of the disclosure controls andprocedures (as defined in Rules 13a-14 and 15d-14 of the Securities Exchange Act of 1934). Based on thatevaluation, the Certifying Officers concluded that, as of the date of the evaluation, the disclosure controls andprocedures were effective. No significant changes were made in our internal controls or in other factors thatcould significantly affect these controls subsequent to the date of the evaluation, including any corrective actionswith regard to significant deficiencies and material weaknesses.
Item 16A. Audit Committee Financial Expert.
Not applicable.
Item 16B. Code of Ethics.
Not applicable.
86

Item 16C. Principal Accountant Fees and Services.
Not applicable.
Item 16D. Exemptions from the Listing Standards for Audit Committees.
Not applicable.
PART III
Item 17. Financial Statements.
In lieu of responding to this item, we have responded to Item 18 of this annual report.
Item 18. Financial Statements.
The information required by this item is set forth in our consolidated financial statements included in thisannual report.
In July 2002, we decided to engage Shin Nihon & Co., member firm in Japan of Ernst & Young, as our newindependent auditor with respect to our U.S. GAAP consolidated financial statements, replacing ChuoAoyamaAudit Corporation, member firm in Japan of PricewaterhouseCoopers. The engagement of Shin Nihon & Co./Ernst & Young as our U.S. GAAP independent auditor is effective for the year ended March 31, 2003.
Through the year ended March 31, 2002, for domestic reporting purposes, we used Shin Nihon & Co. as theindependent auditor with respect to our Japanese GAAP non-consolidated financial statements, and Shin Nihon& Co. and ChuoAoyama Audit Corporation as independent auditors with respect to our Japanese GAAPconsolidated financial statements. Starting with the year ended March 31, 2003, we are permitted under Japan’srecently revised regulations on consolidated financial statements. to prepare and publicly disclose, for domesticreporting purposes, U.S. GAAP consolidated financial statements. We have elected to do so with respect to theyear ended March 31, 2003 and thereafter. In light of our decision to discontinue preparing Japanese GAAPconsolidated financial statements for domestic reporting purposes, we reviewed and assessed the manner andprocess under which our U.S. GAAP consolidated financial statements for domestic reporting and SEC-reportingpurposes were audited, and determined that it would be appropriate to engage a single independent auditor, ShinNihon & Co./ Ernst & Young, for such purposes.
87

Item 19. Exhibits.
ExhibitNumber Description
1.1 Articles of Incorporation of the registrant (English translation)
1.2 Share Handling Regulations of the registrant (English translation)
1.3 Regulations of the Board of Directors of the registrant (English translation)
1.4 Regulations of the Nomination Committee (English translation)
1.5 Regulations of the Audit Committee (English translation)
1.6 Regulations of the Compensation Committee (English translation)
1.7 Liabilities Limitation Agreement (English translation) (*)
2.1 Specimen common stock certificates of the registrant (English translation)
2.2 Form of Deposit Agreement among the registrant, The Bank of New York as Depositary and all ownersand holders from time to time of American Depositary Receipts, including the form of AmericanDepositary Receipt (incorporated by reference to the Registration Statement on Form F-6 (File No.333-14178) filed on December 10, 2001)
8.1 Subsidiaries of the registrant
(*) Nomura and each of Masaharu Shibata, Hideaki Kubori, Haruo Tsuji and Koji Tajika entered into aLiabilities Limitation Agreement, dated June 26, 2003, in the form of this exhibit.
We have not included as exhibits certain instruments with respect to our long-term debt. The amount of debtauthorized under each such debt instrument does not exceed 10% or our total assets. We will furnish a copy ofany such instrument to the SEC upon request.
88
NOMURA HOLDINGS, INC.
INDEX TO THE CONSOLIDATED FINANCIAL STATEMENTS
Page
Consolidated Financial Statements:Report of Independent Auditors . . . . . . . . . . . . . . . . . . . . . . . . . . . . . . . . . . . . . . . . . . . . . . . . . . . . . . . F-2Report of Independent Accountants . . . . . . . . . . . . . . . . . . . . . . . . . . . . . . . . . . . . . . . . . . . . . . . . . . . . F-3Consolidated Balance Sheets as of March 31, 2002 and 2003 . . . . . . . . . . . . . . . . . . . . . . . . . . . . . . . . F-4Consolidated Income Statements for the Years Ended March 31, 2001, 2002 and 2003 . . . . . . . . . . . . F-6Consolidated Statements of Shareholders’ Equity for the Years Ended March 31, 2001, 2002 and2003 . . . . . . . . . . . . . . . . . . . . . . . . . . . . . . . . . . . . . . . . . . . . . . . . . . . . . . . . . . . . . . . . . . . . . . . . . . . F-7
Consolidated Statements of Comprehensive Income for the Years Ended March 31, 2001, 2002 and2003 . . . . . . . . . . . . . . . . . . . . . . . . . . . . . . . . . . . . . . . . . . . . . . . . . . . . . . . . . . . . . . . . . . . . . . . . . . . F-8
Consolidated Statements of Cash Flows for the Years Ended March 31, 2001, 2002 and 2003 . . . . . . F-9Notes to the Consolidated Financial Statements . . . . . . . . . . . . . . . . . . . . . . . . . . . . . . . . . . . . . . . . . . . F-10
F-1

REPORT OF INDEPENDENT AUDITORS
The Board of Directors and ShareholdersNomura Holdings, Inc.
We have audited the accompanying consolidated balance sheet of Nomura Holdings, Inc. and subsidiaries(the “Company”) as of March 31, 2003, and the related consolidated statements of income, shareholders’ equity,comprehensive income and cash flows for the year then ended. These financial statements are the responsibilityof the Company’s management. Our responsibility is to express an opinion on the financial statements based onour audit.
We conducted our audit in accordance with auditing standards generally accepted in the United States ofAmerica. Those standards require that we plan and perform the audit to obtain reasonable assurance aboutwhether the financial statements are free of material misstatement. An audit includes examining, on a test basis,evidence supporting the amounts and disclosures in the financial statements. An audit also includes assessing theaccounting principles used and significant estimates made by management, as well as evaluating the overallfinancial statement presentation. We believe that our audit provides a reasonable basis for our opinion.
In our opinion, the financial statements referred to above present fairly, in all material respects, theconsolidated financial position of Nomura Holdings, Inc. and subsidiaries at March 31, 2003, and theconsolidated results of their operations and their cash flows for the year then ended in conformity withaccounting principles generally accepted in the United States of America.
As discussed in Note 1 to the consolidated financial statements, in the year ended March 31, 2003 theCompany changed its method of accounting for goodwill amortization to conform to Statements of FinancialAccounting Standards No. 141, “Business Combinations” and No. 142, “Goodwill and Other Intangible Assets.”
Ernst & YoungTokyo, JapanMay 8, 2003,Except for Notes 10 and 12, as to which the dateis June 26, 2003
F-2

REPORT OF INDEPENDENT ACCOUNTANTS
To the Board of Directors and Shareholdersof Nomura Holdings, Inc.
In our opinion, the accompanying consolidated balance sheet and the related consolidated incomestatements and consolidated statements of shareholders’ equity, comprehensive income and cash flows presentfairly, in all material respects, the financial position of Nomura Holdings, Inc. (formerly The Nomura SecuritiesCo., Ltd.) and its subsidiaries as of March 31, 2002, and the results of their operations and their cash flows foreach of the two years in the period ended March 31, 2002, in conformity with accounting principles generallyaccepted in the United States of America. These financial statements are the responsibility of the Company’smanagement; our responsibility is to express an opinion on these financial statements based on our audits. Weconducted our audits of these statements in accordance with auditing standards generally accepted in the UnitedStates of America, which require that we plan and perform the audit to obtain reasonable assurance aboutwhether the financial statements are free of material misstatement. An audit includes examining, on a test basis,evidence supporting the amounts and disclosures in the financial statements, assessing the accounting principlesused and significant estimates made by management, and evaluating the overall financial statement presentation.We believe that our audits provide a reasonable basis for the opinion expressed above.
PricewaterhouseCoopersTokyo, Japan
June 26, 2002
F-3
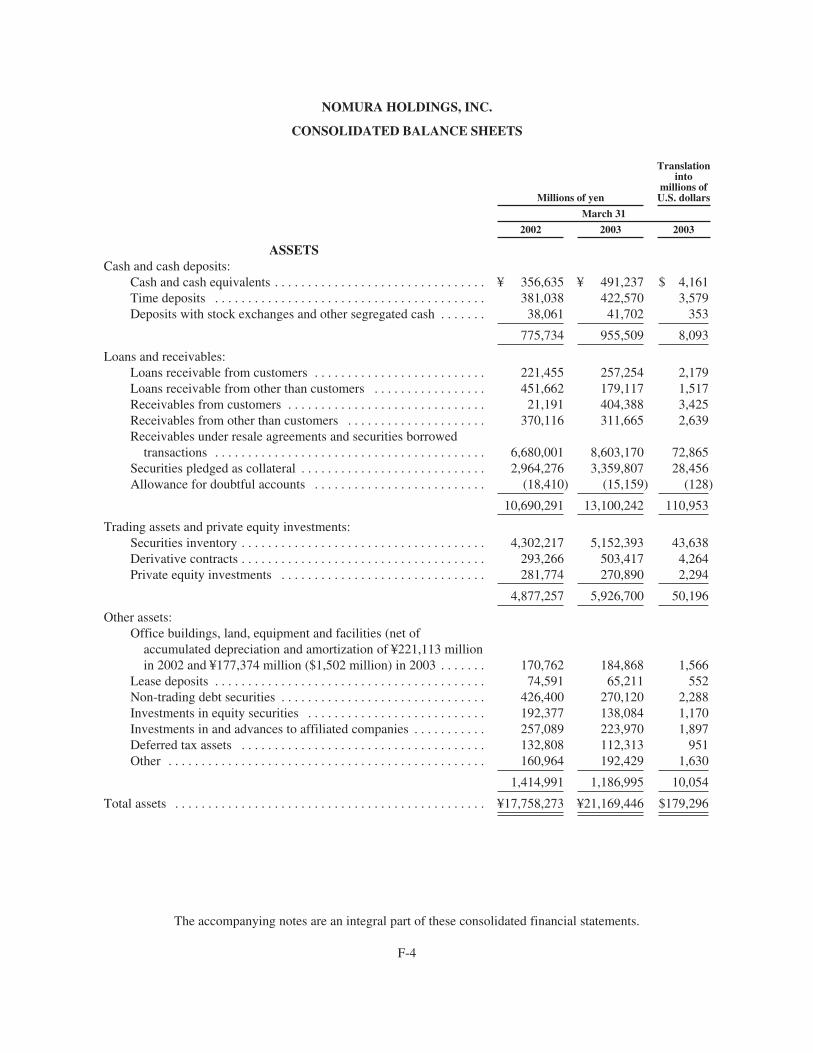
NOMURA HOLDINGS, INC.
CONSOLIDATED BALANCE SHEETS
Millions of yen
Translationinto
millions ofU.S. dollars
March 31
2002 2003 2003
ASSETSCash and cash deposits:
Cash and cash equivalents . . . . . . . . . . . . . . . . . . . . . . . . . . . . . . . . ¥ 356,635 ¥ 491,237 $ 4,161Time deposits . . . . . . . . . . . . . . . . . . . . . . . . . . . . . . . . . . . . . . . . . 381,038 422,570 3,579Deposits with stock exchanges and other segregated cash . . . . . . . 38,061 41,702 353
775,734 955,509 8,093
Loans and receivables:Loans receivable from customers . . . . . . . . . . . . . . . . . . . . . . . . . . 221,455 257,254 2,179Loans receivable from other than customers . . . . . . . . . . . . . . . . . 451,662 179,117 1,517Receivables from customers . . . . . . . . . . . . . . . . . . . . . . . . . . . . . . 21,191 404,388 3,425Receivables from other than customers . . . . . . . . . . . . . . . . . . . . . 370,116 311,665 2,639Receivables under resale agreements and securities borrowedtransactions . . . . . . . . . . . . . . . . . . . . . . . . . . . . . . . . . . . . . . . . . 6,680,001 8,603,170 72,865
Securities pledged as collateral . . . . . . . . . . . . . . . . . . . . . . . . . . . . 2,964,276 3,359,807 28,456Allowance for doubtful accounts . . . . . . . . . . . . . . . . . . . . . . . . . . (18,410) (15,159) (128)
10,690,291 13,100,242 110,953
Trading assets and private equity investments:Securities inventory . . . . . . . . . . . . . . . . . . . . . . . . . . . . . . . . . . . . . 4,302,217 5,152,393 43,638Derivative contracts . . . . . . . . . . . . . . . . . . . . . . . . . . . . . . . . . . . . . 293,266 503,417 4,264Private equity investments . . . . . . . . . . . . . . . . . . . . . . . . . . . . . . . 281,774 270,890 2,294
4,877,257 5,926,700 50,196
Other assets:Office buildings, land, equipment and facilities (net ofaccumulated depreciation and amortization of ¥221,113 millionin 2002 and ¥177,374 million ($1,502 million) in 2003 . . . . . . . 170,762 184,868 1,566
Lease deposits . . . . . . . . . . . . . . . . . . . . . . . . . . . . . . . . . . . . . . . . . 74,591 65,211 552Non-trading debt securities . . . . . . . . . . . . . . . . . . . . . . . . . . . . . . . 426,400 270,120 2,288Investments in equity securities . . . . . . . . . . . . . . . . . . . . . . . . . . . 192,377 138,084 1,170Investments in and advances to affiliated companies . . . . . . . . . . . 257,089 223,970 1,897Deferred tax assets . . . . . . . . . . . . . . . . . . . . . . . . . . . . . . . . . . . . . 132,808 112,313 951Other . . . . . . . . . . . . . . . . . . . . . . . . . . . . . . . . . . . . . . . . . . . . . . . . 160,964 192,429 1,630
1,414,991 1,186,995 10,054
Total assets . . . . . . . . . . . . . . . . . . . . . . . . . . . . . . . . . . . . . . . . . . . . . . . ¥17,758,273 ¥21,169,446 $179,296
The accompanying notes are an integral part of these consolidated financial statements.
F-4

NOMURA HOLDINGS, INC.
CONSOLIDATED BALANCE SHEETS—(Continued)
Millions of yen
Translationinto
millions ofU.S. dollars
March 31
2002 2003 2003
LIABILITIES AND SHAREHOLDERS’ EQUITYPayables, borrowings and deposits:
Payables to customers . . . . . . . . . . . . . . . . . . . . . . . . . . . . . . . . . . . ¥ 729,907 ¥ 180,565 $ 1,529Payables to other than customers . . . . . . . . . . . . . . . . . . . . . . . . . . 182,760 384,910 3,260Payables under repurchase agreements and securities loanedtransactions . . . . . . . . . . . . . . . . . . . . . . . . . . . . . . . . . . . . . . . . . 8,245,492 10,952,135 92,760
Short-term borrowings . . . . . . . . . . . . . . . . . . . . . . . . . . . . . . . . . . 1,689,504 1,497,468 12,683Time and other deposits received . . . . . . . . . . . . . . . . . . . . . . . . . . 338,925 256,184 2,170
11,186,588 13,271,262 112,402
Trading liabilities:Securities sold but not yet purchased . . . . . . . . . . . . . . . . . . . . . . . 2,387,847 3,401,715 28,811Derivative contracts . . . . . . . . . . . . . . . . . . . . . . . . . . . . . . . . . . . . . 305,899 487,005 4,125
2,693,746 3,888,720 32,936
Other liabilities:Accrued income taxes . . . . . . . . . . . . . . . . . . . . . . . . . . . . . . . . . . . 50,920 28,608 242Accrued pension and severance costs . . . . . . . . . . . . . . . . . . . . . . . 56,109 86,582 733Other . . . . . . . . . . . . . . . . . . . . . . . . . . . . . . . . . . . . . . . . . . . . . . . . 411,127 296,509 2,511
518,156 411,699 3,486
Long-term borrowings . . . . . . . . . . . . . . . . . . . . . . . . . . . . . . . . . . . . . . . 1,754,854 1,955,437 16,562
Total liabilities . . . . . . . . . . . . . . . . . . . . . . . . . . . . . . . . . . . . . . . . . . . . . 16,153,344 19,527,118 165,386
Commitments and contingencies (Note 15) . . . . . . . . . . . . . . . . . . . . . .Shareholders’ equity:
Common stockAuthorized—6,000,000,000 sharesIssued—1,965,919,860 shares at March 31, 2002 and2003 . . . . . . . . . . . . . . . . . . . . . . . . . . . . . . . . . . . . . . . . . . . 182,800 182,800 1,548
Additional paid-in capital . . . . . . . . . . . . . . . . . . . . . . . . . . . . . . . . . . . . 150,979 151,328 1,282Retained earnings . . . . . . . . . . . . . . . . . . . . . . . . . . . . . . . . . . . . . . . . . . 1,316,221 1,407,028 11,917
Accumulated other comprehensive (loss) income:Minimum pension liability adjustment . . . . . . . . . . . . . . . . . . . . . . (24,972) (41,558) (352)Cumulative translation adjustments . . . . . . . . . . . . . . . . . . . . . . . . (19,685) (22,329) (189)
(44,657) (63,887) (541)
1,605,343 1,677,269 14,206Less—Common stock held in treasury, at cost—246,075 shares and25,556,340 shares at March 31, 2002 and 2003, respectively . . . . . . (414) (34,941) (296)
Total shareholders’ equity . . . . . . . . . . . . . . . . . . . . . . . . . . . . . . . . . . . . 1,604,929 1,642,328 13,910
Total liabilities and shareholders’ equity . . . . . . . . . . . . . . . . . . . . . . . . ¥17,758,273 ¥21,169,446 $179,296
The accompanying notes are an integral part of these consolidated financial statements.
F-5

NOMURA HOLDINGS, INC.
CONSOLIDATED INCOME STATEMENTS
Millions of yen
Translation intomillions ofU.S. dollars
Year ended March 31
2001 2002 2003 2003
Revenue:Commissions . . . . . . . . . . . . . . . . . . . . . . . . . . . . . . . . . . . . . . . ¥ 189,841 ¥ 140,001 ¥141,640 $1,200Fees from investment banking . . . . . . . . . . . . . . . . . . . . . . . . . . 87,160 75,255 81,847 693Asset management and portfolio service fees . . . . . . . . . . . . . . 144,882 109,985 79,290 672Net gain on trading . . . . . . . . . . . . . . . . . . . . . . . . . . . . . . . . . . . 307,989 162,228 172,308 1,459Interest and dividends . . . . . . . . . . . . . . . . . . . . . . . . . . . . . . . . . 518,941 500,541 401,924 3,404Loss on investments in equity securities . . . . . . . . . . . . . . . . . . (98,968) (55,860) (41,288) (350)Gain from changes in equity of an affiliated company . . . . . . . — 3,504 — —PFG entities product sales . . . . . . . . . . . . . . . . . . . . . . . . . . . . . 117,523 294,931 — —PFG entities rental income . . . . . . . . . . . . . . . . . . . . . . . . . . . . . 103,339 177,053 — —Gain on sales of PFG entities . . . . . . . . . . . . . . . . . . . . . . . . . . . — 116,324 — —Gain (loss) on private equity investments . . . . . . . . . . . . . . . . . — 232,472 (14,391) (122)Other . . . . . . . . . . . . . . . . . . . . . . . . . . . . . . . . . . . . . . . . . . . . . . 98,591 68,965 19,589 166
Total revenue . . . . . . . . . . . . . . . . . . . . . . . . . . . . . . . . . . . 1,469,298 1,825,399 840,919 7,122Interest expense . . . . . . . . . . . . . . . . . . . . . . . . . . . . . . . . . . . . . 553,643 504,048 274,645 2,326
Net revenue . . . . . . . . . . . . . . . . . . . . . . . . . . . . . . . . . . . . 915,655 1,321,351 566,274 4,796
Non-interest expenses:Compensation and benefits . . . . . . . . . . . . . . . . . . . . . . . . . . . . 305,190 379,540 244,167 2,068Commissions and floor brokerage . . . . . . . . . . . . . . . . . . . . . . . 26,393 20,962 20,844 177Information processing and communications . . . . . . . . . . . . . . 70,998 87,252 77,389 655Occupancy and related depreciation . . . . . . . . . . . . . . . . . . . . . 65,319 73,787 57,152 484Business development expenses . . . . . . . . . . . . . . . . . . . . . . . . . 29,940 26,652 24,361 206PFG entities cost of goods sold . . . . . . . . . . . . . . . . . . . . . . . . . 84,004 200,871 — —PFG entities expenses associated with rental income . . . . . . . . 43,760 111,529 — —Other . . . . . . . . . . . . . . . . . . . . . . . . . . . . . . . . . . . . . . . . . . . . . . 133,879 247,786 94,952 804
759,483 1,148,379 518,865 4,394
Income before income taxes and cumulative effect of accountingchange . . . . . . . . . . . . . . . . . . . . . . . . . . . . . . . . . . . . . . . . . . . . . . . 156,172 172,972 47,409 402
Income tax expense (benefit):Current . . . . . . . . . . . . . . . . . . . . . . . . . . . . . . . . . . . . . . . . . . . . 53,693 61,898 25,519 216Deferred . . . . . . . . . . . . . . . . . . . . . . . . . . . . . . . . . . . . . . . . . . . 45,069 (56,972) 11,776 100
98,762 4,926 37,295 316
Income before cumulative effect of accounting change . . . . . . . . . . . 57,410 168,046 10,114 86Cumulative effect of accounting change . . . . . . . . . . . . . . . . . . . . . . — — 109,799 930
Net income . . . . . . . . . . . . . . . . . . . . . . . . . . . . . . . . . . . . . . . . . . . . . ¥ 57,410 ¥ 168,046 ¥119,913 $1,016
YenTranslation intoU.S. dollars
Per share of common stock:Basic—Income before cumulative effect of accounting change . . . . . . . ¥ 29.25 ¥ 85.57 ¥ 5.17 $ 0.04Cumulative effect of accounting change . . . . . . . . . . . . . . . . . . — — 56.09 0.48
Net income . . . . . . . . . . . . . . . . . . . . . . . . . . . . . . . . . . . . . . . . . ¥ 29.25 ¥ 85.57 ¥ 61.26 $ 0.52
Diluted—Income before cumulative effect of accounting change . . . . . . . ¥ 29.25 ¥ 85.32 ¥ 5.17 $ 0.04Cumulative effect of accounting change . . . . . . . . . . . . . . . . . . — — 56.09 0.48
Net income . . . . . . . . . . . . . . . . . . . . . . . . . . . . . . . . . . . . . . . . . ¥ 29.25 ¥ 85.32 ¥ 61.26 $ 0.52
The accompanying notes are an integral part of these consolidated financial statements.
F-6

NOMURA HOLDINGS, INC.
CONSOLIDATED STATEMENTS OF SHAREHOLDERS’ EQUITY
Millions of yen
Translationinto
millions ofU.S. dollars
Year ended March 31
2001 2002 2003 2003
Common StockBalance at beginning of year . . . . . . . . . . ¥ 182,796 ¥ 182,797 ¥ 182,800 $ 1,548Conversion of convertible bonds . . . . . . . 1 — — —Exercise of warrants . . . . . . . . . . . . . . . . . — 3 — —
Balance at end of year . . . . . . . . . . . . . . . ¥ 182,797 ¥ 182,800 ¥ 182,800 $ 1,548
Additional paid-in capitalBalance at beginning of year . . . . . . . . . . ¥ 147,714 ¥ 146,133 ¥ 150,979 $ 1,279Loss on sales of treasury stock . . . . . . . . . (1,691) — — —Issuance of common stock warrants . . . . . 109 — — —Issuance of common stock options . . . . . . — — 349 3Common stock issued for businesscombinations . . . . . . . . . . . . . . . . . . . . — 4,843 — —
Exercise of warrants . . . . . . . . . . . . . . . . . — 3 — —Conversion of convertible bonds . . . . . . . 1 — — —
Balance at end of year . . . . . . . . . . . . . . . ¥ 146,133 ¥ 150,979 ¥ 151,328 $ 1,282
Retained earningsBalance at beginning of year . . . . . . . . . . ¥ 1,154,599 ¥ 1,177,660 ¥ 1,316,221 $11,148Net income . . . . . . . . . . . . . . . . . . . . . . . . 57,410 168,046 119,913 1,016Cash dividends . . . . . . . . . . . . . . . . . . . . . (34,349) (29,485) (29,106) (247)
Balance at end of year . . . . . . . . . . . . . . . ¥ 1,177,660 ¥ 1,316,221 ¥ 1,407,028 $11,917
Accumulated comprehensive income:Minimum pension liability adjustmentBalance at beginning of year . . . . . . . . . . ¥ (4,073) ¥ (19,083) ¥ (24,972) $ (212)Net change during the year . . . . . . . . . . . . (15,010) (5,889) (16,586) (140)
Balance at end of year . . . . . . . . . . . . . . . ¥ (19,083) ¥ (24,972) ¥ (41,558) $ (352)
Cumulative translation adjustmentsBalance at beginning of year . . . . . . . . . . ¥ (59,716) ¥ (51,021) ¥ (19,685) $ (167)Transfer to income statement on salesand contribution of PFG entities . . . . . — 2,627 — —
Other change during the year, net . . . . . . 8,695 28,709 (2,644) (22)
Balance at end of year . . . . . . . . . . . . . . . ¥ (51,021) ¥ (19,685) ¥ (22,329) $ (189)
Common stock held in treasuryBalance at beginning of year . . . . . . . . . . ¥ (10,344) ¥ (58) ¥ (414) $ (4)Repurchase of common stock . . . . . . . . . — — (34,527) (292)Sale of common stock . . . . . . . . . . . . . . . 10,050 387 — —Other net change in treasury stock . . . . . . 236 (743) — —
Balance at end of year . . . . . . . . . . . . . . . ¥ (58) ¥ (414) ¥ (34,941) $ (296)
Number of shares issuedBalance at beginning of year . . . . . . . . . . 1,962,977,247 1,962,977,841 1,965,919,860Conversion of convertible bonds . . . . . . . 594 — —Common stock issued for businessacquisitions . . . . . . . . . . . . . . . . . . . . . . — 2,939,416 —
Exercise of warrants . . . . . . . . . . . . . . . . . — 2,603 —
Balance at end of year . . . . . . . . . . . . . . . 1,962,977,841 1,965,919,860 1,965,919,860
The accompanying notes are an integral part of these consolidated financial statements.
F-7

NOMURA HOLDINGS, INC.
CONSOLIDATED STATEMENTS OF COMPREHENSIVE INCOME
Millions of yen
Translationinto
millions ofU.S. dollars
Year ended March 31
2001 2002 2003 2003
Net income . . . . . . . . . . . . . . . . . . . . . . . . . . . . . . . . . . . . . . . . . . . ¥ 57,410 ¥168,046 ¥119,913 $1,016Other comprehensive (loss) income:
Change in cumulative translation adjustments, net of tax: . . . 8,695 31,336 (2,644) (22)Minimum pension liability adjustment:
Changes in minimum pension liability during theyear . . . . . . . . . . . . . . . . . . . . . . . . . . . . . . . . . . . . . . . (25,879) (10,154) (27,460) (233)
Deferred income taxes . . . . . . . . . . . . . . . . . . . . . . . . . . 10,869 4,265 10,874 92
Total . . . . . . . . . . . . . . . . . . . . . . . . . . . . . . . . . . . . . . . . (15,010) (5,889) (16,586) (141)
Total other comprehensive (loss) income . . . . . . . . . . . . . . . . (6,315) 25,447 (19,230) (163)
Comprehensive income . . . . . . . . . . . . . . . . . . . . . . . . . . . . . . . . . . ¥ 51,095 ¥193,493 ¥100,683 $ 853
The accompanying notes are an integral part of these consolidated financial statements.
F-8

NOMURA HOLDINGS, INC.
CONSOLIDATED STATEMENTS OF CASH FLOWS
Millions of yen
Translationinto
millions ofU.S. dollars
Year ended March 31
2001 2002 2003 2003Cash flows from operating activities:
Net income . . . . . . . . . . . . . . . . . . . . . . . . . . . . . . . . . . . . . . . . . . . . . . . . . . . . . . . . . . . . . . . . . ¥ 57,410 ¥ 168,046 ¥ 119,913 $ 1,016Adjustments to reconcile net income to net cash provided by (used in) operating activities:
Cumulative effect of accounting change . . . . . . . . . . . . . . . . . . . . . . . . . . . . . . . . . . . . . . — — (109,799) (930)Depreciation and amortization . . . . . . . . . . . . . . . . . . . . . . . . . . . . . . . . . . . . . . . . . . . . . . 52,982 70,042 31,249 265Loss on investments in equity securities . . . . . . . . . . . . . . . . . . . . . . . . . . . . . . . . . . . . . . 98,968 55,860 41,288 350Gain from changes in equity of an affiliated company . . . . . . . . . . . . . . . . . . . . . . . . . . . — (3,504) — —Loss (gain) on sales of office buildings, land, equipment and facilities . . . . . . . . . . . . . . (15,027) (17,087) 467 4Loss on devaluation of office buildings, land, equipment and facilities . . . . . . . . . . . . . . 25,232 20,180 3,175 27Amortization of goodwill (negative goodwill) . . . . . . . . . . . . . . . . . . . . . . . . . . . . . . . . . (5,696) (3,889) — —Provision for (reversal of) allowance for doubtful accounts . . . . . . . . . . . . . . . . . . . . . . . 15,412 5,002 (3,661) (31)Gain on sales of PFG entities . . . . . . . . . . . . . . . . . . . . . . . . . . . . . . . . . . . . . . . . . . . . . . . — (116,324) — —Loss (gain) on private equity investments . . . . . . . . . . . . . . . . . . . . . . . . . . . . . . . . . . . . . — (232,472) 14,391 122Reversal of provision for financial assistance to NFC . . . . . . . . . . . . . . . . . . . . . . . . . . . (16,200) — — —Deferred income tax expense (benefit) . . . . . . . . . . . . . . . . . . . . . . . . . . . . . . . . . . . . . . . 45,069 (56,972) 11,776 100Changes in operating assets and liabilities: . . . . . . . . . . . . . . . . . . . . . . . . . . . . . . . . . . . .Time deposits . . . . . . . . . . . . . . . . . . . . . . . . . . . . . . . . . . . . . . . . . . . . . . . . . . . . . . . . . . . (41,666) (97,592) (36,585) (310)Deposits with stock exchanges and other segregated cash . . . . . . . . . . . . . . . . . . . . . . . . 297,859 10,695 (6,271) (53)Trading assets and private equity investments . . . . . . . . . . . . . . . . . . . . . . . . . . . . . . . . . 915,146 (854,907) (1,182,091) (10,012)Trading liabilities . . . . . . . . . . . . . . . . . . . . . . . . . . . . . . . . . . . . . . . . . . . . . . . . . . . . . . . . (172,483) (264,355) 1,242,333 10,522Receivables under resale agreements and securities borrowed transactions . . . . . . . . . . . (861,628) (379,434) (2,315,743) (19,614)Payables under repurchase agreements and securities loaned transactions . . . . . . . . . . . . 1,605,528 363,754 3,236,698 27,413Loans and receivables, net of allowance . . . . . . . . . . . . . . . . . . . . . . . . . . . . . . . . . . . . . . (1,577,472) (107,129) (590,802) (5,004)Time and other deposits received and other payables . . . . . . . . . . . . . . . . . . . . . . . . . . . . 1,800 3,326 (477,756) (4,046)Financial assistance to NFC . . . . . . . . . . . . . . . . . . . . . . . . . . . . . . . . . . . . . . . . . . . . . . . . (59,000) — — —Accrued income taxes, net . . . . . . . . . . . . . . . . . . . . . . . . . . . . . . . . . . . . . . . . . . . . . . . . . 19,936 6,058 (31,738) (269)Other, net . . . . . . . . . . . . . . . . . . . . . . . . . . . . . . . . . . . . . . . . . . . . . . . . . . . . . . . . . . . . . . (19,933) 127,318 87,269 739
Net cash provided by (used in) operating activities . . . . . . . . . . . . . . . . . . . . . . . . . . 366,237 (1,303,384) 34,113 289
Cash flows from investing activities:Payments for purchases of office buildings, land, equipment and facilities . . . . . . . . . . . . . . . (78,414) (92,168) (45,235) (383)Proceeds from sales of office buildings, land, equipment and facilities . . . . . . . . . . . . . . . . . . 47,558 25,762 690 6Payments for purchases of investments in equity securities . . . . . . . . . . . . . . . . . . . . . . . . . . . (3,192) (3,017) (10,299) (87)Proceeds from sales of investments in equity securities . . . . . . . . . . . . . . . . . . . . . . . . . . . . . . 85,931 36,621 30,067 254Business combinations, net of cash acquired . . . . . . . . . . . . . . . . . . . . . . . . . . . . . . . . . . . . . . . (107,398) (258,987) — —Cash contributed to private equity investments . . . . . . . . . . . . . . . . . . . . . . . . . . . . . . . . . . . . . — (95,720) — —Proceeds from sales of PFG entities . . . . . . . . . . . . . . . . . . . . . . . . . . . . . . . . . . . . . . . . . . . . . — 129,469 — —(Increase) decrease in non-trading debt securities . . . . . . . . . . . . . . . . . . . . . . . . . . . . . . . . . . . (147,119) 178,869 152,209 1,289(Increase) decrease in other investments and other assets . . . . . . . . . . . . . . . . . . . . . . . . . . . . . (68,769) 26,989 6,621 56
Net cash (used in) provided by investing activities . . . . . . . . . . . . . . . . . . . . . . . . . . (271,403) (52,182) 134,053 1,135
Cash flows from financing activities:Increase in long-term borrowings . . . . . . . . . . . . . . . . . . . . . . . . . . . . . . . . . . . . . . . . . . . . . . . 650,098 1,499,309 654,407 5,543Decrease in long-term borrowings . . . . . . . . . . . . . . . . . . . . . . . . . . . . . . . . . . . . . . . . . . . . . . . (473,195) (966,131) (324,232) (2,746)(Decrease) increase in short-term borrowings, net . . . . . . . . . . . . . . . . . . . . . . . . . . . . . . . . . . (248,901) 696,681 (290,775) (2,463)Payments for repurchases of common stock . . . . . . . . . . . . . . . . . . . . . . . . . . . . . . . . . . . . . . . — — (34,527) (292)Payments for cash dividends . . . . . . . . . . . . . . . . . . . . . . . . . . . . . . . . . . . . . . . . . . . . . . . . . . . (29,398) (34,352) (29,485) (250)
Net cash (used in) provided by financing activities . . . . . . . . . . . . . . . . . . . . . . . . . . (101,396) 1,195,507 (24,612) (208)
Effect of exchange rate changes on cash and cash equivalents . . . . . . . . . . . . . . . . . . . . . . . . . . . . . (12,732) 13,018 (8,952) (76)
Net increase (decrease) in cash and cash equivalents . . . . . . . . . . . . . . . . . . . . . . . . . . . . . . . . . . . . (19,294) (147,041) 134,602 1,140Cash and cash equivalents at beginning of the year . . . . . . . . . . . . . . . . . . . . . . . . . . . . . . . . . . . . . 522,970 503,676 356,635 3,021
Cash and cash equivalents at end of the year . . . . . . . . . . . . . . . . . . . . . . . . . . . . . . . . . . . . . . . . . . . ¥ 503,676 ¥ 356,635 ¥ 491,237 $ 4,161
Supplemental information on cash flows (see also Note 3):Cash paid during the year for—
Interest . . . . . . . . . . . . . . . . . . . . . . . . . . . . . . . . . . . . . . . . . . . . . . . . . . . . . . . . . . . . . . . . ¥ 508,752 ¥ 460,538 ¥ 253,098 $ 2,144
Income tax payments, net . . . . . . . . . . . . . . . . . . . . . . . . . . . . . . . . . . . . . . . . . . . . . . . . . ¥ 21,943 ¥ 65,335 ¥ 57,257 $ 485
Non cash investing activities—Common stock issued for business acquisitions . . . . . . . . . . . . . . . . . . . . . . . . . . . . . . . . ¥ — ¥ 4,843 ¥ — $ —
Non cash financing activities—Conversion of convertible bonds into common stock and additional paid-in capital . . . . ¥ 1 ¥ — ¥ — $ —
The accompanying notes are an integral part of these consolidated financial statements.
F-9

NOMURA HOLDINGS, INC.
NOTES TO THE CONSOLIDATED FINANCIAL STATEMENTS
1. Summary of accounting policies:
Description of business—
Nomura Holdings, Inc. (the “Company”) and its broker-dealer, banking and other financial servicessubsidiaries provide investment, financing and related services to individual, institutional and governmentcustomers on a global basis. The Company and other entities in which it has a controlling financial interest arecollectively referred to as “Nomura”.
Nomura’s business segments are structured based on its management structure, the nature of products andservices and its customer base. Nomura reports operating results in three business segments: Domestic Retail,Global Wholesale and Asset Management.
In Nomura’s Domestic Retail business, Nomura receives commissions and fees from investmentconsultation services which it provides mainly to individual customers in Japan. Additionally, Nomura receivesoperational fees from asset management companies in connection with the administration services of investmenttrust certificates that it distributes. Nomura also receives agent commissions from insurance companies for thevariable annuity insurance products it sells as an agent. In Nomura’s Global Wholesale business, Nomura earnsfees, commissions and other revenues by providing sales and trading services, and investment banking servicesmainly to institutional customers globally. In Nomura’s sales and trading activities, Nomura facilitates customertransactions and trades for its own account by market-making and trading fixed income and equity securities.Nomura also provides a broad range of investment banking services, including underwriting and financialadvisory services. Also, Nomura conducts proprietary transactions, including arbitrage and principal financetransactions. In Nomura’s Asset Management business, Nomura develops and manages investment trusts andearns management fees for the portfolio management of investment trusts. Nomura also provides investmentadvisory services for pension funds and other institutional customers. Additionally, in the defined contributionbusiness, Nomura receives commissions as a defined contribution pension plan administrator.
On October 1, 2001, the Company adopted a holding company structure, via a corporation separation. Suchrestructuring had been approved at the annual meeting of shareholders on June 28, 2001. This was effectedthrough The Nomura Securities Co., Ltd. changing its name to Nomura Holdings, Inc. and becoming a holdingcompany. At the same time, its wholly-owned subsidiary, Nomura Securities Spin-off Preparation Company,Limited changed its name to Nomura Securities Co., Ltd. and assumed the operations of the registered securitiescompany. The consolidated financial statements have been presented on this basis.
Basis of presentation—
The consolidated financial statements include the accounts of the Company and other entities in which it hasa controlling financial interest. Because the usual condition for a controlling financial interest in an entity isownership of a majority of the voting interest, the Company consolidates its majority-owned subsidiaries. Acontrolling financial interest can also exist in entities in which equity investors do not have the characteristics ofa controlling financial interest or do not have sufficient equity at risk for the entity to finance its activitieswithout additional subordinated financial support. Such entities are referred to as variable interest entities(“VIEs”). The Company consolidates VIEs created after January 31, 2003 where Nomura is the primarybeneficiary, generally defined as the enterprise that will absorb a majority of the expected losses or receive amajority of the expected residual returns of the entity, or both. Investments in entities in which Nomura hassignificant influence over operating and financial decisions (generally defined as 20 to 50 percent of votinginterest) are accounted for using the equity method of accounting and are reported in Investments in andadvances to affiliated companies. Investments in which Nomura has neither control nor significant influence arecarried at fair value.
F-10

NOMURA HOLDINGS
NOTES TO THE CONSOLIDATED FINANCIAL STATEMENTS—(Continued)
The accounting and financial reporting policies of the Company conform to accounting principles generallyaccepted in the United States (“US GAAP”) as applicable to broker-dealers.
The Company’s principal subsidiaries include Nomura Securities Co., Ltd., Nomura Securities International,Inc. and Nomura International plc. In addition, the consolidated financial statements include the accounts of theinvestee companies (“PFG entities”) of the Principal Finance Group (“PFG”) through March 27, 2002, the dateNomura ceased to control or have significant influence over such entities. The Company consolidated the PFGentities through March 27, 2002 because it had a controlling financial interest in the PFG entities up to that date.
All material intercompany transactions and balances have been eliminated on consolidation.
Certain reclassifications of previously reported amounts have been made to conform to the current yearpresentation.
Use of estimates—
In presenting the consolidated financial statements, management makes estimates regarding certain financialinstrument and investment valuations, the outcome of litigation, the recovery of the carrying value of goodwill,the allowance for loan losses, the realization of deferred tax assets and other matters that affect the reportedamounts of assets and liabilities as well as the disclosure in the financial statements. Estimates, by their nature,are based on judgment and available information. Therefore, actual results may differ from estimates, whichcould have a material impact on the consolidated financial statements and, it is possible that such adjustmentscould occur in the near term.
Fair value of financial instruments—
Fair value of financial instruments is based on quoted market prices, broker or dealer quotations or anestimation by management of the amounts expected to be realized upon settlement under current marketconditions. Fair value of exchange-traded securities and certain exchange-traded derivative contracts aregenerally based on quoted market prices or broker/dealer quotations. Where quoted market prices or broker/dealer quotations are not available, prices for similar instruments or valuation pricing models are considered inthe determination of fair value. Valuation pricing models consider time value, volatility and other statisticalmeasurements for the relevant instruments or for instruments with similar characteristics. These models alsoincorporate adjustments relating to the administrative costs of servicing future cash flow and market liquidityadjustments. These adjustments are fundamental components of the fair value calculation process.
Trading assets and trading liabilities, including derivative contracts, are recorded at fair value, andunrealized gains and losses are reflected in trading revenues. Fair values are based on quoted market prices orbroker/dealer quotations where possible. If quoted market prices or broker/dealer quotations are not available orif the liquidation of Nomura’s positions would reasonably be expected to impact quoted market prices, fair valueis determined based on valuation pricing models that take into consideration time value and volatility factorsunderlying the financial instrument.
Valuation pricing models and their underlying assumptions impact the amount and timing of unrealizedgains and losses recognized, and the use of different valuation pricing models or underlying assumptions couldproduce different financial results. Changes in the fixed income, equity, foreign exchange and commoditymarkets will impact Nomura’s estimates of fair value in the future, potentially affecting trading revenues. To theextent financial contracts have extended maturity dates, Nomura’s estimates of fair value may involve greater
F-11

NOMURA HOLDINGS
NOTES TO THE CONSOLIDATED FINANCIAL STATEMENTS—(Continued)
subjectivity due to the lack of transparent market data available upon which to base underlying modelingassumptions.
Private equity investments—
Nomura had been actively involved in the private equity business, through its UK based PFG. As a result ofa review to determine the optimum structure to run this business going forward, on March 27, 2002, Nomurarestructured PFG and, as a result, contributed its investments in certain of its remaining investee companies (the“PFG entities”) to Terra Firma Capital Partners I (“TFCP I “), a limited partnership which is engaged in theprivate equity business. As a result of Nomura’s contribution of its investments in the PFG entities to TFCP I inexchange for a limited partnership interest, Terra Firma Investments (GP) Limited (“Terra Firma”), the generalpartner of TFCP I, which is independent of Nomura, assumed control of these investments, together with oneinvestment, Annington Holdings plc, which was not transferred to the partnership. Accordingly, Nomura ceasedconsolidating the investments at that time. Terra Firma Capital Partners Limited (“TFCPL”) has been establishedby former employees of Nomura to advise Terra Firma in relation to the management of TFCP I as well as theraising and investing of additional capital. With effect from March 27, 2002, Nomura accounts for itsinvestments managed and controlled by Terra Firma (collectively referred to as “Terra Firma investments”) atfair value in accordance with accounting practices for broker-dealers.
As stated above, Terra Firma investments are carried at fair value. Corresponding changes in the fair valueof these investments are included in gains/losses on private equity investments. The determination of fair value issignificant to Nomura’s financial condition and results of operations and requires management to makejudgments based on complex factors.
As the underlying investments are in non-publicly listed companies, there are no externally quoted marketprices available. As a result, Nomura’s Risk Management unit meets with TFCPL and the management teams ofthe underlying investments to discuss, among other things, Terra Firma’s valuation of the investments, currentbusiness performance, actual versus budgeted results, revised full year projections and the status of majorinitiatives to boost sales, or reduce operating costs. Terra Firma also provides regular performance reports foreach investment. The information obtained from these meetings and reports, together with comparisons made tosimilar quoted businesses and, in the case of any property based investments, input from external advisors allowsNomura to produce its own estimates of the fair value for each underlying investment.
In estimating fair value, Nomura estimates the price that would be obtained between a willing buyer and awilling seller dealing at arm’s length.
Valuations are typically based on projected future cash flows to be generated from the underlyinginvestment, discounted at a weighted average cost of capital. The cost of capital is estimated, where possible, byreference to quoted comparables with a similar risk profile. Cash flows are derived from bottom up, detailedprojections prepared by management of each respective investment. These projections will reflect the businessdrivers specific to each investment.
F-12

NOMURA HOLDINGS
NOTES TO THE CONSOLIDATED FINANCIAL STATEMENTS—(Continued)
Examples of the factors affecting the business valuations are set out in the table below:
Sector Valuation Factors
Hotels Room rate achieved and occupancy, which in turn are driven by business and leisure travel.Revenue from conference facilities and food and beverage sales.Staff and other costs and central overheads.
Real Estate Sales values, leaseback and open market rental values achieved, driven by underlyingdemand for housing in both the homeowner and rental markets.Property holding and refurbishment and head office costs.Availability and cost of finance.
Consumer Finance Number of rental agreements outstanding, average revenue per rental agreement (taking intoaccount arrears), rental acquisition costs, rental maintenance costs, as well as overheads andhead office costs.
Retail Market share, changes in market size, underlying trends in consumer behavior.Gross margin and operating costs, including outlet overheads and head office costs.
Services Contract terms negotiated at beginning of contract. Initial contract set up costs and capitalexpenditure. Ongoing servicing costs, including staff costs and central overheads.Additional contracts and additional non-contracted works. Availability and cost of finance.
Where possible these valuations are compared with price/earnings data for comparable quoted companies orrecent market price data for comparable transactions. Any significant differences are analyzed and considerationgiven to whether this analysis indicates an adjustment to the Discounted Cash Flow valuation is required. Whileit is likely that certain potential purchasers may have special interests in the relevant investments that wouldallow them to justify a premium price, such as synergy or strategic benefits, no such premium has been includedwithin the valuation models. Conversely, no discounts have been taken for the fact that there may only be alimited number of potential purchasers of the investments. These valuations are then stress tested to assess theimpact of particular risk factors. Examples of such stress tests include:
• Stressing exit assumptions, either by altering the timing or the exit multiple used. In particular, usingexit multiples in line with 5-year lows of trading multiples for similar companies are considered
• Stressing growth assumptions, to assume lower growth. Where possible, the impact of a mild recessionis considered
• Removing or curtailing any assumptions about increases in operating margins.
An assessment of the results of the fair value exercise and the stress tests allows the final estimatedvaluation to be established. The fair value of Terra Firma investments represents the sum of the fair values of theindividual investments less any performance bonuses that may be payable, either to the management team of aparticular business or to Terra Firma.
For recently acquired investments (i.e., those acquired within 12 months), fair value is equal to acquisitioncost unless there has been a material change to the operating performance of the specific investment or asignificant event has occurred in the marketplace.
The estimated fair value of Terra Firma investments was ¥265,714 million and ¥265,742 million ($2,251million) at March 31, 2002 and 2003, respectively. Of this, the respective percentages at March 31, 2002 and2003 are 47% and 64% for Real Estate, 9% and 6% for the Services Sector and the remaining balance of 44%and 30% is in Consumer Businesses, which includes Retail, Consumer Finance and Hotels.
F-13

NOMURA HOLDINGS
NOTES TO THE CONSOLIDATED FINANCIAL STATEMENTS—(Continued)
The use of different valuation models, methodologies or assumptions could produce materially differentestimates of fair value, which could materially affect the results of operations or statement of financial condition.
Transfers of financial assets—
Nomura accounts for the transfer of financial assets in accordance with Statement of Financial AccountingStandards (“SFAS”) No. 140, “Accounting for Transfers and Servicing of Financial Assets and Extinguishmentsof Liabilities” (SFAS 140). This statement requires that Nomura account for the transfer of financial assets,occurring after March 31, 2001, as a sale when Nomura relinquishes control over the asset. SFAS 140 deemscontrol to be relinquished when the following conditions are met: (a) the assets have been isolated from thetransferor (even in bankruptcy or other receivership), (b) the transferee has the right to pledge or exchange theassets received and (c) the transferor has not maintained effective control over the transferred assets. Inconnection with its securitization activities, Nomura utilizes special purpose entities principally for (but notlimited to) the securitization of commercial and residential mortgages, home equity loans, government andcorporate bonds, and lease and trade receivables. Nomura derecognizes financial assets transferred insecuritizations provided that Nomura has relinquished control over such assets.
Nomura has historically used special purpose entities, or SPE vehicles, as conduits, and has generally notretained a financial interest in the asset securitizations. In conduit transactions, Nomura serves as theadministrator. Conduits provide clients with a way to access liquidity in the commercial paper markets byallowing clients to sell assets to the conduit, which in return issues commercial paper to fund the purchases. Thecommercial paper issued by the conduits is supported with sufficient collateral and other credit enhancements toreceive at least an A-1 or P-1 rating. Nomura may obtain an interest in the financial assets in the future, whichmay include residual interests in the special purpose entities established to facilitate the securitization. Any suchinterests would be included in Securities inventory within Nomura’s balance sheet. Nomura records its securitiesinventory, including such interests, at fair value with any changes in fair value included in revenues.
Foreign currency translation—
The financial statements of the Company’s subsidiaries outside Japan are measured using their functionalcurrency. All assets and liabilities of foreign subsidiaries are translated into Japanese yen at exchange rates ineffect at the balance sheet date; all revenue and expenses are translated at the average exchange rates for therespective years and the resulting translation adjustments are accumulated and reported as Cumulative translationadjustments in shareholders’ equity.
Foreign currency assets and liabilities are translated at exchange rates in effect at the balance sheet date andthe resulting translation gains or losses are currently credited or charged to income.
Fee revenue—
Commissions charged for executing brokerage transactions are accrued on a trade date basis and areincluded in current period earnings. Fees from investment banking include securities underwriting fees and othercorporate financing services fees. Underwriting fees are recorded when services for underwriting are completed.All other fees are recognized when related services are performed. Asset management fees are accrued as earned.
PFG entities revenue—
Product sales revenue, representing sales of beer, wine and spirits, and consumer electronics, wasrecognized upon the exchange of merchandise with customers or upon delivery of beer to pubs. Rental income
F-14

NOMURA HOLDINGS
NOTES TO THE CONSOLIDATED FINANCIAL STATEMENTS—(Continued)
under operating leases for tenanted pubs and residential properties was recognized over the lease term, generallyon a straight-line basis. Rental income under operating leases for consumer electronics was recognized whenearned under the terms of rental agreements, generally on a straight-line basis.
Trading assets and trading liabilities—
Trading assets and trading liabilities, including contractual commitments arising pursuant to derivativetransactions, are recorded on the consolidated balance sheets on a trade date basis at fair value with the relatedgains and losses recorded in Net gain on trading in the consolidated income statements.
Securities financing transactions—
Repurchase and reverse repurchase transactions (“Repo transactions”) principally involve the buying orselling of Government and Government agency securities under agreements with customers to resell orrepurchase these securities to or from those customers. Nomura takes possession of securities purchased underagreements to resell while providing collateral to counterparties to collateralize securities sold under agreementsto repurchase. Nomura monitors the value of the underlying securities on a daily basis relative to the relatedreceivables and payables, including accrued interest, and requests or returns additional collateral when deemedappropriate. Repo transactions are accounted for as collateralized financing transactions and are recorded on theconsolidated balance sheets at the amount at which the securities will be repurchased or resold, as appropriate.
Repo transactions are presented on the accompanying consolidated balance sheets net-by-counterparty,where net presentation is consistent with Financial Accounting Standards Board Interpretation (“FIN”) No. 41,“Offsetting of Amounts Related to Certain Repurchase and Reverse Repurchase Agreements.”
Securities borrowed and securities loaned are accounted for as financing transactions. Securities borrowedand securities loaned that are cash collateralized are recorded on the accompanying consolidated balance sheetsat the amount of cash collateral advanced or received. Securities borrowed transactions generally require Nomurato provide the counterparty with collateral in the form of cash or other securities. For securities loanedtransactions, Nomura generally receives collateral in the form of cash or other securities. Nomura monitors themarket value of the securities borrowed or loaned and requires additional cash or securities, as necessary, toensure that such transactions are adequately collateralized.
Historically, Nomura engaged in Gensaki transactions which originated in the Japanese financial markets.Gensaki transactions involved the selling of commercial paper, certificates of deposit, Japanese governmentbonds and various other debt securities to an institution wishing to make a short-term investment, with Nomuraagreeing to reacquire them from the institution on a specified date at a specified price. The repurchase pricereflects the current interest rates in the money markets and any interest derived from the securities. There are nomargin requirements for Gensaki transactions nor is there any right of security substitution. As such, Gensakitransactions are recorded as sales in the consolidated income statements and the related securities and obligationsto repurchase such Gensaki securities are not reflected in the accompanying consolidated balance sheets.
New Gensaki transactions (“Gensaki Repo transactions”) started in the Japanese financial markets in 2001.Gensaki Repo transactions contain margin requirements, rights of security substitution, or restrictions on thecustomer’s right to sell or repledge the transferred securities. Accordingly, Gensaki Repo transactions areaccounted for as collateralized financing transactions and are recorded on the consolidated balance sheets at theamount that the securities will be repurchased or resold, as repurchase and reverse repurchase transactions.
F-15

NOMURA HOLDINGS
NOTES TO THE CONSOLIDATED FINANCIAL STATEMENTS—(Continued)
On the consolidated balance sheets, all Nomura-owned securities pledged to counterparties where thecounterparty has the right to sell or repledge the securities, including Gensaki Repo transactions, are classified asSecurities pledged as collateral in accordance with SFAS 140.
Derivatives—
Trading
Nomura uses a variety of derivative financial instruments, including futures, forwards, swaps and options, inits trading activities and in the management of its interest rate, market price and currency exposures.
Those derivative financial instruments used in trading activities are valued at market or estimated fair valuewith the related gains and losses recorded in Net gain on trading. Unrealized gains and losses arising fromNomura’s dealings in over-the-counter derivative financial instruments are presented in the accompanyingconsolidated balance sheets on a net-by-counterparty basis where net presentation is consistent with FIN No. 39,“Offsetting of Amounts Related to Certain Contracts.”
Non-trading
In addition to its trading activities, Nomura, as an end user, uses derivative financial instruments to manageits interest rate and currency exposures or to modify the interest rate characteristics of certain non-trading assetsand liabilities.
These derivative financial instruments are linked to specific assets or specific liabilities and are designatedas hedges as they are effective in reducing the risk associated with the exposure being hedged, and they arehighly correlated with changes in the market or fair value of the underlying hedged item, both at inception andthroughout the life of the hedge contract. Nomura applies fair value hedge accounting to these hedgingtransactions, and the relating unrealized profit and losses are recognized together with those of the hedged assetsand liabilities as interest revenue or expenses.
Derivatives that do not meet these criteria are carried at market or fair value and with changes in valueincluded currently in earnings.
In June 2000, the Financial Accounting Standards Board (“FASB”) issued SFAS No. 138, “Accounting forCertain Derivative Instruments and Certain Hedging Activities.” SFAS No. 138 was effective concurrently withSFAS No. 137 “Accounting for Derivative Instruments and Hedging Activities — Deferral of the Effective Dateof FASB statement No. 133” that deferred the effective date of SFAS No. 133 “Accounting for DerivativeInstruments and Hedging Activities” to fiscal years beginning after June 15, 2000. These statements establishaccounting and reporting standards for derivative instruments, including certain derivative instruments embeddedin other contracts, and for hedging activities. These statements require that an entity recognize all derivatives aseither assets or liabilities in the balance sheet and measure those instruments at fair value. The accounting forchanges in the fair value of a derivative instrument depends on its intended use and the resulting designation.Nomura adopted these statements on April 1, 2001.
Allowance for loan losses—
Loans receivable consist primarily of loans receivable from customers and from other than customers.Loans receivable from customers consist of commercial loans and margin transaction loans. Loans receivablefrom other than customers mainly represent loans receivable from institutional counterparties in the moneymarkets used for short-term financing.
F-16

NOMURA HOLDINGS
NOTES TO THE CONSOLIDATED FINANCIAL STATEMENTS—(Continued)
Allowances for loan losses on loans for margin transactions and loans receivable from other than customersare provided for based primarily on historical loss experience.
Allowances for loan losses on commercial loans reflect management’s best estimate of probable losses. Theevaluation includes an assessment of the ability of borrowers to pay by considering various factors such aschanges in the nature of the loan, volume of the loan, deterioration of pledged collateral, delinquencies and thecurrent financial situation of the borrower.
Office buildings, land, equipment and facilities—
Office buildings, land, equipment and facilities, which consist mainly of computer installations andsoftware, are stated at cost. Significant renewals and additions are capitalized at cost. Maintenance, repairs andminor renewals are charged currently to income.
Depreciation is generally computed by the declining-balance method and at rates based on estimated usefullives of each asset according to general class, type of construction and use. Amortization is generally computedby the straight-line method over the estimated useful lives. The estimated useful lives are generally as follows:
Office buildings . . . . . . . . . . . . . . . . . . . . . . . . . . . . . . . . . . . . . . . . . . . . . . . . . . . . . . . 15 to 50 yearsEquipment and installations . . . . . . . . . . . . . . . . . . . . . . . . . . . . . . . . . . . . . . . . . . . . . . 3 to 6 yearsSoftware . . . . . . . . . . . . . . . . . . . . . . . . . . . . . . . . . . . . . . . . . . . . . . . . . . . . . . . . . . . . . 5 years
Depreciation and amortization is included in Information processing and communications in the amount of¥18,742 million, ¥23,381 million and ¥25,570 million ($217 million), and is included in Occupancy and relateddepreciation in the amount of ¥5,836 million, ¥5,732 million and ¥5,678 million ($48 million) for the yearsended March 31, 2001, 2002 and 2003, respectively.
PFG entities land, buildings, equipment and furniture and fixtures—
Land, buildings, equipment and furniture and fixtures are stated at cost. Significant renewals and additionsare capitalized at cost. Maintenance, repairs and minor renewals are charged to income as incurred.
Depreciation starts when assets are placed in service, or upon installation for equipment rented inmerchandise operations. Depreciation is computed to residual value using the straight-line method over theassets’ estimated useful lives. The estimated useful lives are as follows:
Buildings . . . . . . . . . . . . . . . . . . . . . . . . . . . . . . . . . . . . . . . . . . . . . . . . . . . . . . . . . . . . . . 25 to 50 yearsEquipment and furniture and fixtures . . . . . . . . . . . . . . . . . . . . . . . . . . . . . . . . . . . . . . . . 3 to 20 years
Depreciation and amortization was included in Occupancy and related depreciation in the amount of ¥1,719million and ¥3,075 million, and was included in PFG entities expenses associated with rental income in theamount of ¥26,685 million and ¥37,854 million for the years ended March 31, 2001 and 2002, respectively.Because of the restructuring of PFG as of March 27, 2002 as described in Note 1, there are no fixed assetsrelating to the PFG entities on the consolidated balance sheets at March 31, 2002 and 2003.
Long-lived assets—
In August 2001, the FASB released SFAS No. 144, “Accounting for the Impairment or Disposal of Long-Lived Assets,” which supersedes SFAS No. 121, “Accounting for the Impairment of Long-Lived Assets and for
F-17

NOMURA HOLDINGS
NOTES TO THE CONSOLIDATED FINANCIAL STATEMENTS—(Continued)
Long-Lived Assets to Be Disposed Of.” SFAS No. 144 provides guidance on the financial accounting andreporting for the impairment or disposal of long-lived assets. Nomura adopted the provisions of SFAS No. 144on April 1, 2002.
As required by SFAS No. 144, long-lived assets are reviewed for impairment whenever events or changes incircumstances indicate that the carrying amount may not be recoverable. If the estimated undiscounted cash flowis less than the carrying amount of the assets, a loss is recognized based on the market or fair value.
Nomura recorded non-cash impairment charges of ¥25,232 million, ¥18,341 million and ¥305 million ($3million) substantially related to write-downs of office buildings, land, equipment, facilities, and other assets forthe years ended March 31, 2001, 2002 and 2003, respectively. These losses are included in consolidated incomestatements under Non-interest expenses—Other.
These charges were incurred as a result of Nomura’s analysis to determine if there was any impairment oflong-lived assets and significant decreases in the market or fair value of certain assets were identified. Therevised carrying values of these assets were based on the market or fair value of the assets.
Investments in equity securities and non-trading debt securities—
Nomura’s investments in equity securities consist of marketable and non-marketable equity securities thathave been acquired for Nomura’s operating purposes and other than operating purposes. For Nomura’s operatingpurposes, Nomura holds such investments for the long-term in order to promote existing and potential businessrelationships. In doing so, Nomura is following customary business practices in Japan which, through cross-shareholdings, provide a way for companies to manage their shareholder relationships. Such investments consistmainly of equity securities of various financial institutions such as Japanese commercial banks, regional banksand insurance companies. Nomura also holds equity securities such as stock exchange memberships for otherthan operating purposes. In accordance with US GAAP for broker-dealers, investments in equity securities forNomura’s operating purposes and other than operating purposes are recorded at fair value and unrealized gainsand losses are recognized currently in income.
Investments in equity securities for Nomura’s operating purposes recorded as Investments in equitysecurities in the consolidated balance sheets are comprised of listed equity securities and unlisted equitysecurities in the amounts of ¥152,553 million and ¥39,824 million at March 31, 2002 and ¥93,176 million ($790million) and ¥44,908 million ($380 million) at March 31, 2003, respectively.
Investments in equity securities for other than operating purposes are included in the consolidated balancesheets in Other assets—Other and such investments are mainly comprised of unlisted equity securities.
Non-trading debt securities are recorded at market or fair value together with the related hedges and therelated gains and losses are recorded in Revenue—Other in the consolidated income statements.
Accounting for changes in equity of affiliated companies—
An affiliated company may issue shares to third parties in a public offering at amounts per share that are inexcess of or less than Nomura’s average per share carrying value. With respect to such transactions, the resultinggains or losses arising from the change in interest are recorded in income for the year when the change in interesttransaction occurs.
F-18

NOMURA HOLDINGS
NOTES TO THE CONSOLIDATED FINANCIAL STATEMENTS—(Continued)
Income taxes—
In accordance with SFAS No. 109, “Accounting for Income Taxes,” deferred tax assets and liabilities arerecorded for the expected future tax consequences of tax loss carryforwards and temporary differences betweenthe carrying amounts and the tax bases of the assets and liabilities based upon enacted tax laws and rates.Nomura recognizes deferred tax assets to the extent it believes that it is more likely than not that a benefit will berealized. A valuation allowance is provided for tax benefits available to Nomura that are not deemed more likelythan not to be realized.
Stock-based compensation—
At March 31, 2003, Nomura has two stock-based compensation plans. One commenced in August 2000 andthe other commenced in August 2002, both of which are described more fully in Note 10. Prior to April 1, 2002,Nomura accounted for the former plan under the recognition and measurement provisions of APB Opinion No.25, “Accounting for Stock Issued to Employees,” and related Interpretations. Effective April 1, 2002, Nomuraadopted the fair value recognition provisions of SFAS No. 123, “Accounting for Stock-Based Compensation”and applied the modified prospective method under the provisions of SFAS No. 148, “Accounting for Stock-Based Compensation—Transition and Disclosure.” Compensation cost recognized in the year ended March 31,2003 is the same as that which would have been recognized had the recognition provisions of SFAS No. 123been applied from its original effective date. Results for prior years have not been restated.
Earnings per share—
The computation of basic earnings per share is based on the average number of shares outstanding duringthe year. Diluted earnings per share reflect the potential dilutive effect of convertible bonds, warrants and stockacquisition rights.
Cash and cash equivalents—
For purposes of reporting cash flows, cash and cash equivalents include cash on hand and demand depositswith banks.
Goodwill, intangible assets and negative goodwill—
In June 2001, the FASB issued SFAS No. 141, “Business Combinations” and SFAS No. 142, “Goodwill andOther Intangible Assets.” SFAS No. 141 requires that negative goodwill that arises in a business combinationcompleted after June 30, 2001 be written off immediately. SFAS No. 141 also requires that any unamortizednegative goodwill arising from business combinations completed before July 1, 2001 be written off andrecognized as a cumulative effect of a change in accounting principle when SFAS No. 142 is adopted. SFAS No.142 no longer permits the amortization of goodwill and intangible assets with indefinite lives. Instead theseassets must be reviewed annually, or more frequently in certain circumstance, for impairment. Intangible assetsthat have determinable lives will continue to be amortized over their useful lives and reviewed for impairment.
Goodwill recorded prior to July 1, 2001 was recognized as the excess of acquisition cost over the fair valueof net assets acquired and was being amortized over 10 to 20 years on a straight-line basis. The amortization ofgoodwill is included in Non-interest expenses — Other. Goodwill recorded after June 30, 2001 and, uponadoption of SFAS No. 142, goodwill acquired prior to July 1, 2001 is not amortized. Nomura periodicallyassesses the recoverability of goodwill by comparing the fair value of the businesses to which goodwill relates to
F-19

NOMURA HOLDINGS
NOTES TO THE CONSOLIDATED FINANCIAL STATEMENTS—(Continued)
the carrying amount of the businesses including goodwill. If such assessment indicates that the fair value is lessthan the related carrying amount, a goodwill impairment determination is made.
Prior to the year ended March 31, 2003, negative goodwill, which was recognized as the excess of the fairvalue of net assets acquired over the acquisition cost, was included in Other liabilities — Other on theaccompanying balance sheets, and was being amortized over a 10 year period, on a straight-line basis. Theamortization of negative goodwill was included in Non-interest expenses — Other. Nomura adopted SFAS No.142 effective April 1, 2002, which resulted in the write-offs of negative goodwill arising from a previousbusiness combination of ¥109,799 million ($930 million), net of taxes, as of March 31, 2002.
New accounting pronouncements—
In June 2002, the FASB issued SFAS No. 146, “Accounting for Costs Associated with Exit or DisposalActivities.” The statement specifies the accounting for certain employee termination benefits, contracttermination costs and costs to consolidate facilities or relocate employees and is effective for exit and disposalactivities initiated after December 31, 2002. The implementation of SFAS No. 146 did not have a material impacton Nomura’s financial condition or results of operations for the year ended March 31, 2003.
In November 2002, the FASB issued FIN No. 45, “Guarantor’s Accounting and Disclosure Requirementsfor Guarantees, Including Indirect Guarantees of Indebtedness of Others.” FIN No. 45 specifies the disclosures tobe made about obligations under certain issued guarantees and requires a liability to be recognized for the fairvalue of a guarantee obligation. The recognition and measurement provisions of the interpretation applyprospectively to guarantees issued or amended after December 31, 2002. The disclosure provisions are effectivewith Nomura’s year ended March 31, 2003. The implementation of FIN No. 45 did not have a material impact onNomura’s financial condition or results of operations for the year ended March 31, 2003.
In January 2003, the FASB issued FIN No. 46, “Consolidation of Variable Interest Entities—anInterpretation of ARB No. 51.” FIN No. 46 provides guidance on the consolidation of certain entities in whichequity investors do not have the characteristics of a controlling financial interest or do not have sufficient equityat risk for the entity to finance its activities without additional subordinated financial support. Such entities arereferred to as variable interest entities (“VIEs”). FIN No. 46 requires the Company to consolidate VIEs if it hasinterests that give it a majority of the expected losses or a majority of the expected residual returns of the entityor both. FIN No. 46 is effective immediately for VIEs created after January 31, 2003. Nomura must apply FINNo. 46 to VIEs created before February 1, 2003 as of the second quarter of Nomura’s fiscal year ending March31, 2004. Nomura is currently assessing the potential impact of the adoption of FIN No. 46 (see Note 4).
In April 2003, the FASB issued SFAS No. 149, “Amendment of Statement 133 on Derivative Instrumentsand Hedging Activities.” SFAS No. 149 amends and clarifies accounting for derivative instruments, includingcertain derivative instruments embedded in other contracts, and for hedging activities under SFAS No. 133. Thenew guidance amends SFAS No. 133 for decisions made as part of the Derivatives Implementation Group(“DIG”) process that effectively required amendments to SFAS No. 133, and decisions made in connection withother FASB projects dealing with financial instruments and in connection with implementation issues raised inrelation to the application of the definition of a derivative and characteristics of a derivative that containsfinancing components. In addition, it clarifies when a derivative contains a financing component that warrantsspecial reporting in the statement of cash flows. SFAS No. 149 is effective for contracts entered into or modifiedafter June 30, 2003 and for hedging relationships designated after June 30, 2003. Nomura is currently assessingthe impact of SFAS No. 149 on the consolidated financial statements.
In May 2003, the FASB issued SFAS No. 150, “Accounting for Certain Financial Instruments withCharacteristics of both Liabilities and Equity.” SFAS No. 150 requires an issuer to classify certain financial
F-20

NOMURA HOLDINGS
NOTES TO THE CONSOLIDATED FINANCIAL STATEMENTS—(Continued)
instruments with characteristics of both liabilities and equity as liabilities (or an asset in some circumstances).Many of those instruments were previously classified as equity. Under SFAS No. 150, certain financialinstruments issued in the form of shares that are mandatorily redeemable, that embody an obligation torepurchase the issuer’s equity shares, and that the issuer must or may settle by issuing a variable number of itsequity shares, are classified as liabilities. SFAS 150 is effective for financial instruments entered into or modifiedafter May 31, 2003, and otherwise is effective at the beginning of the first interim period beginning after June 15,2003. Nomura is currently assessing the impact of SFAS No. 150 on the consolidated financial statements.
2. U.S. dollar amounts:
The U.S. dollar amounts are included solely for the convenience of the reader and have been translated atthe rate of ¥118.07 = U.S.$1, the noon buying rate in New York City for cable transfers in foreign currencies ascertified for customs purposes by the Federal Reserve Bank of New York on March 31, 2003. This translationshould not be construed to imply that the yen amounts actually represent, or have been or could be convertedinto, equivalent amounts in U.S. dollars.
3. Business combinations:
Prior to the fiscal year ended March 31, 2000, the Company directly held only 5.0% of the outstanding sharecapital of Nomura Asset Management Co., Ltd. (NAM), which provides investment management services andmanages mutual funds. In March 2000, the Company acquired an additional 68.8% equity interest in NAM fromfinancial institutions and affiliated companies for cash of ¥31,908 million. The acquisition has been accountedfor by the purchase method of accounting effective March 31, 2000 and assets acquired and liabilities assumedhave been recorded at estimated fair values. However, since the acquisition cost was determined by the valuationmethod stipulated by the Japanese Inheritance Tax Regulation, which is based on the concept of estimating theper share value by comparing subject companies, there was an excess of fair value over cost of net assetsacquired. This excess should reduce proportionately the values assigned to non-current assets except long-terminvestments in marketable securities. After allocation of the excess to reduce the value of certain non-currentassets a balance of excess over cost remained. There were no stated or unstated rights granted by Nomura to anyof the parties in the NAM share purchase transaction, nor were there any obligations incurred by Nomura, otherthan what was recognized in the NAM business combination transaction.
The remaining excess of acquired net assets at their estimated fair value over acquisition cost was ¥105,767million and was recorded as negative goodwill, which was being amortized into income over 10 years on astraight-line basis from the year ended March 31, 2001. In addition, during the first half of the year ended March31, 2001, the Company acquired an additional 17.9% of equity interest in NAM from financial institutions forcash consideration of ¥11,872 million and recorded the excess of acquired net assets at their estimated fair valueover acquisition cost in the amount of ¥23,974 million as additional negative goodwill.
During the year ended March 31, 2002, the Company acquired an additional 8.2% of equity interest in NAMfrom financial institutions in exchange for 2,939,416 shares of the Company’s common stock and ¥4,915 millionin cash consideration, and recorded additional negative goodwill of ¥6,323 million.
The unamortized balance of negative goodwill was ¥109,799 million, which was included in Otherliabilities—Other, and accumulated amortization was ¥26,264 million at March 31, 2002.
In June 2001, FASB issued SFAS No. 141, “Business Combinations.” As a result, Nomura wrote offnegative goodwill arising from a previous business combination upon adoption of SFAS No. 142 and recorded,
F-21

NOMURA HOLDINGS
NOTES TO THE CONSOLIDATED FINANCIAL STATEMENTS—(Continued)
as Cumulative effect of accounting change, a gain of ¥109,799 million ($930 million) for the year ended March31, 2003.
During the two-year period ended March 31, 2001, PFG acquired seven businesses (collectively, the“Acquired Entities”) in separate transactions accounted for as purchase business combinations. Theseacquisitions were not significant individually. Aggregate cash consideration paid for the Acquired Entities was¥196,736 million and the excess of acquisition cost over acquired net assets at their fair value in the amount of¥72,690 million had been recorded as goodwill.
In July 2001, PFG acquired an effective 59% equity interest in Meridien Capital Limited (“Meridien”). Cashconsideration paid, net of cash acquired, was ¥270,629 million. The results of Meridien’s operations have beenincluded in the consolidated financial statements from the date of acquisition to March 27, 2002, the dateNomura ceased to control Meridien.
In February and March 2002, Nomura sold certain PFG investments in the U.K. pub business totaling 5,400pubs for ¥176,493 million. The sale of these businesses resulted in a realized gain on disposal of ¥116,324million, net of transaction expenses.
As discussed in Note 1, Nomura restructured its interests in the PFG entities as of March 27, 2002. Totalassets and liabilities of PFG entities at the time of the restructuring were ¥1,348,195 million and ¥1,629,215million, respectively. Terra Firma assumed control of these investments, Nomura assuming the role of a passiveinvestor. Nomura ceased consolidating the PFG entities at that time and began accounting for its interests in theTerra Firma investments at fair value in accordance with the accounting practices for broker-dealers and includedthis investment in Private equity investments in the consolidated balance sheets. This accounting treatment iseffective only for periods on and after March 27, 2002. Thus, operating results for the year ended March 31, 2003was not be directly comparable to prior years regarding the PFG entities.
Nomura recognized revenue amounting to ¥232,472 million through the deconsolidation of the PFG entitiesduring the fiscal year ended March 31, 2002. This gain was as a result of the March 31, 2002 estimated fair valueexceeding the carrying value of the investment. The carrying value was the cost of the investment less booklosses incurred during the period of ownership. In other words, the 2002 gain is primarily the reversal of lossesthat had previously been consolidated. The fair value of the investments in the PFG entities was derived fromtheir projected future cash flows discounted at their weighted average cost of capital and, in some cases, realestate property valuations received from independent valuation specialists as discussed in Note 1. As of March31, 2003, the estimated aggregate fair value of its interests in Terra Firma investments was ¥265,742 million($2,251 million).
The following summarized unaudited pro forma financial information assumes the acquisition of NAMshares during the year ended March 31, 2001 had occurred on April 1, 1999, the acquisition of NAM sharesduring the year ended March 31, 2002 had occurred on April 1, 2000, the acquisitions of the seven PFGbusinesses stated above had occurred on April 1, 1999, and the acquisition of Meridien had occurred on April 1,2000.
Year ended March 31
2001 2002
Millions of yen
Total revenue . . . . . . . . . . . . . . . . . . . . . . . . . . . . . . . . . . . . . . . . ¥1,697,352 ¥1,873,805Net income . . . . . . . . . . . . . . . . . . . . . . . . . . . . . . . . . . . . . . . . . 30,632 159,316
F-22

NOMURA HOLDINGS
NOTES TO THE CONSOLIDATED FINANCIAL STATEMENTS—(Continued)
Year ended March 31
2001 2002
Yen
Net income per share—basic . . . . . . . . . . . . . . . . . . . . . . . . . . . . . . . . . . ¥15.61 ¥81.12—diluted . . . . . . . . . . . . . . . . . . . . . . . . . . . . . . . . 15.61 80.75
The following table presents a reconciliation of reported net income and earnings per share (“EPS”) to theamounts adjusted for the exclusion of goodwill amortization and negative goodwill amortization. Goodwill is notdeductible for tax purposes.
Millions of yen, except per shareamounts
Translationinto
millions ofU.S.
dollars,except per
shareamountsYear ended March 31
2001 2002 2003 2003
Net income:Net income, as reported . . . . . . . . . . . . . . . . . . . . . . . . . . . . . . . . . ¥57,410 ¥168,046 ¥ 119,913 $1,016Exclusion: Goodwill and Negative goodwill amortization . . . . . . . (1,212) (2,380) (109,799) (930)
Net income, as adjusted . . . . . . . . . . . . . . . . . . . . . . . . . . . . . . . . . ¥56,198 ¥165,666 ¥ 10,114 $ 86
Basic EPS:Net income, as reported . . . . . . . . . . . . . . . . . . . . . . . . . . . . . . . . . ¥ 29.25 ¥ 85.57 ¥ 61.26 $ 0.52Exclusion: Goodwill and Negative goodwill amortization . . . . . . . (0.62) (1.21) (56.09) (0.48)
Net income, as adjusted . . . . . . . . . . . . . . . . . . . . . . . . . . . . . . . . . ¥ 28.63 ¥ 84.36 ¥ 5.17 $ 0.04
Diluted EPS:Net income, as reported . . . . . . . . . . . . . . . . . . . . . . . . . . . . . . . . . ¥ 29.25 ¥ 85.32 ¥ 61.26 $ 0.52Exclusion: Goodwill and Negative goodwill amortization . . . . . . . (0.62) (1.21) (56.09) (0.48)
Net income, as adjusted . . . . . . . . . . . . . . . . . . . . . . . . . . . . . . . . . ¥ 28.63 ¥ 84.11 ¥ 5.17 $ 0.04
4. Financial instruments:
Nomura enters into transactions in financial instruments including cash instruments and derivativesprimarily for trading purposes and, where needed, non-trading activities.
Risk management—
Nomura is subject to various risks. These risks include market, credit, event, market liquidity, operational,system and legal risks. The process of managing those risks is an integral part of management’s responsibilities.Financial innovation in global business activities can lead to complex interactions among risks. Nomurarecognizes the importance of identifying, evaluating, monitoring and managing its risk profile.
Market Risk
Market risk refers to the potential loss in the value of an asset resulting from changes in market prices, rates,indices, volatilities, correlations or other market factors. Nomura is exposed to this type of risk primarily inconnection with its trading activities. Effective monitoring and management of this risk requires an ability toanalyze a complex and constantly changing capital market environment worldwide and to highlight anyproblematic trends quickly.
F-23

NOMURA HOLDINGS
NOTES TO THE CONSOLIDATED FINANCIAL STATEMENTS—(Continued)
Credit Risk
Credit risk refers to the potential loss in the value of a transaction because of a counterparty or issuer failingto perform its contractual commitment. This type of risk is reduced through diversification, effective creditanalysis of counterparties, enforcement of credit limits by country and by counterparty, management of creditexposure through netting arrangements, and the maintenance of adequate collateral to secure the commitments ofcounterparties. Nomura also uses credit derivatives to reduce its exposure or hedge its credit risk with respect toissuers. Its regional credit officers monitor, on a daily basis, all credit risk and limits, and communicate creditinformation and concerns to its global risk management headquarters in Tokyo.
Nomura measures its credit risk to derivatives transaction counterparties as the sum of actual currentexposure evaluated daily at its fair value, plus potential exposure until maturity of such transactions. Allderivative credit lines are centrally controlled through its global risk management unit in Tokyo.
Nomura enters into International Swaps and Derivatives Association, Inc. master agreements or equivalentagreements, called master netting agreements, with many of its derivative counterparties. Master nettingagreements provide protection to reduce the risks of counterparty default and, in some cases, offset itsconsolidated balance sheet exposure with the same counterparty, which provides a more meaningful presentationof its balance sheet credit exposure.
In addition, to reduce default risk, Nomura requires collateral, principally cash or highly liquid bonds,including U.S. government securities and Japanese government securities, when necessary.
Nomura’s significant single concentrations of credit risk were with the Japanese Government and U.S.Government and its agencies. These concentrations generally arise from taking trading securities positions.Government and government agency bonds (which are mainly sovereign to Japan and the United States ofAmerica), including those classified as Securities pledged as collateral, represented 15.8% and 18.1% ofNomura’s total assets as of March 31, 2002 and 2003, respectively.
Event Risk
Event risk refers to the potential loss in value that Nomura may suffer through unpredictable events thatcause large unexpected market price moves. Event risk can be caused by changes in political or economic factors.For example, Nomura’s global risk management unit collects information on current developments in thepolitical and economic situations in the emerging countries in which Nomura conducts business and report themto its senior management on a weekly basis. Nomura also monitors event risk associated with the possible failureof expected mergers and acquisitions and other corporate transactions with respect to which Nomura has madestrategic investments in parties involved in these transactions.
Through its Merchant Banking activities, Nomura has significant exposure to private equity investments. Bytheir nature, these assets are less liquid than other trading assets, and as a result, valuation is more uncertain. Inaddition, Nomura’s exposure is in some cases more concentrated than is the case for other trading assets. Theyalso exhibit a high degree of asset-specific risk. Given these characteristics, a market risk approach which isderived from day-to-day movement of market variables cannot capture the risk of private equity investments, andtherefore Nomura believes it is appropriate to characterize private equity risk as event risk.
Nomura has developed modeling techniques to help it quantify the scale of its private equity risk and toallow it to calibrate these risks to the same confidence level that Nomura applies to other trading activities. Thesetechniques allow it to reflect the high levels of specific risk attached to private equity investments and theunusual statistical characteristics of early stage corporate finance portfolios.
F-24

NOMURA HOLDINGS
NOTES TO THE CONSOLIDATED FINANCIAL STATEMENTS—(Continued)
Market liquidity Risk
Market liquidity risk refers to the additional risk that Nomura faces when it has large positions which cannotbe disposed of in the course of normal market trading turnover. The longer Nomura is exposed to these largepositions, the greater the risk it faces from fluctuations in the market price and other volatile market conditions.Funding risk is discussed in “Liquidity and Capital Resources” (unaudited) under Item 5.B. of this annual report.
Operational Risk
Operational risk refers to the potential cost associated with criminal or other improper actions taken byNomura’s executives and employees, or failure or malfunction of its system management, or the occurrence ofexternal phenomena such as natural disasters. Due to the increased sophistication in security transactions and theoutsourcing or systemization of its operations for efficiency purposes, reduction of operational risk has becomeincreasingly essential. Nomura manages its operational risk primarily by periodic evaluation and enhancement asnecessary of its internal controls.
System Risk
System risk is a type of operational risk. It is defined as risk in which Nomura suffers damages due tosystem defects, such as the shutdown or malfunction of computer systems. System risk also includes the risk thatNomura may suffer damages due to unauthorized uses of computers.
In order to deal with system risk, Nomura has internal regulations on information security management thatset out its security policy. Nomura makes it a first priority to make these regulations well known and understoodby its employees, including the importance of compliance. Also, users in Nomura and developers such asNomura Research Institute cooperate in developing new systems since the early stage of the development, andNomura aims to structure these systems that operate in line with its actual business operations. Users in Nomuraparticipate in comprehensive tests at the time of releasing important systems. Nomura endeavors to mitigatesystem risk through appropriate inspections. Furthermore, for important systems, Nomura has a surveillancesystem which operates 24 hours a day, 365 days a year, and Nomura implements early inspection and recoveryfrom failures.
Legal Risk
Legal risk refers to the risk of non-compliance with applicable legal and regulatory requirements, andpotential loss from the inability to recover payments due from a counterparty owing to the non-enforceability of acontract. Professional expertise in the applicable regulatory environment where Nomura conducts business, andan ability to develop cross-border products and services that meet divergent and often conflicting requirements ofvarious regulatory regimes, are essential for managing this type of risk. Nomura manages its legal risk primarilyat the level of its regional operations. The Company has an Internal Controls Committee which is charged withthe task of promoting proper corporate behavior throughout the Nomura Group and enhancing its internalcontrols and procedures. The members of this committee are the President and Chief Executive Officer, some ofthe Executive Officers and non-executive Directors. In addition, for its Japanese securities operations, theCompliance Committee in Nomura Securities Co., Ltd., which consists of the President and Chief ExecutiveOfficer and some of the Executive Officers of Nomura Securities Co., Ltd., as well as two outside lawyers,considers major compliance matters. As part of its efforts to address legal risks for its global business, globallegal and compliance conferences are held regularly to discuss issues relating to cross-border business.
Trading activities—
Nomura’s trading activities consist primarily of securities brokerage, trading, and underwriting; derivativesdealing and brokerage; and securities financing transactions. Trading assets and trading liabilities consist of cash
F-25

NOMURA HOLDINGS
NOTES TO THE CONSOLIDATED FINANCIAL STATEMENTS—(Continued)
instruments (such as securities) and derivative instruments used for trading purposes or for hedging other tradingassets or liabilities.
Securities inventory and securities sold but not yet purchased
Nomura pledges firm-owned securities to collateralize repurchase agreements and other secured financings.Pledged securities that can be sold or repledged by the secured party, including Gensaki Repo transactions, areclassified as Securities pledged as collateral of ¥2,964 billion and ¥3,360 billion ($28 billion) on theconsolidated balance sheets at March 31, 2002 and 2003, respectively.
Securities inventory, including securities pledged as collateral, and securities sold but not yet purchased atMarch 31, 2002 and 2003 consist of trading securities at fair value classified as follows:
Millions of yenTranslation into
millions of U.S. dollars
March 31
2002 2003 2003
Securitiesinventory
Securitiessold butnot yet
purchasedSecuritiesinventory
Securitiessold butnot yet
purchasedSecuritiesinventory
Securitiessold butnot yet
purchased
Stocks . . . . . . . . . . . . . . . . . . . . . . . . ¥1,239,066 ¥ 756,420 ¥1,078,981 ¥ 900,933 $ 9,139 $ 7,630Government and governmentagency bonds . . . . . . . . . . . . . . . . 2,800,983 1,389,674 3,840,167 2,260,809 32,524 19,148
Bank and corporation bonds . . . . . . 1,611,155 178,321 1,972,330 210,933 16,705 1,787Commercial paper and certificatesof deposit . . . . . . . . . . . . . . . . . . . 68,171 — 34,012 — 288 —
Options and warrants . . . . . . . . . . . . 75,508 63,432 38,033 27,191 322 230Mortgage and mortgage-backedsecurities . . . . . . . . . . . . . . . . . . . 784,123 — 1,007,928 1,750 8,536 15
Beneficiary certificates and other . . 687,487 — 540,749 99 4,580 1
¥7,266,493 ¥2,387,847 ¥8,512,200 ¥3,401,715 $72,094 $28,811
F-26

NOMURA HOLDINGS
NOTES TO THE CONSOLIDATED FINANCIAL STATEMENTS—(Continued)
Securities financing transactions
Nomura enters into secured borrowing and lending transactions mainly to meet customers’ needs andfinance trading inventory positions. The balance of receivables and payables under resale and repurchaseagreements and securities borrowed and loaned transactions at March 31, 2002 and 2003 are as follows:
Millions of yen
Translationinto
millions ofU.S. dollars
March 31
2002 2003 2003
Receivables under:Resale agreements . . . . . . . . . . . . . . . . . . . . . . . . . . . . . . . . . . . . . . . ¥2,885,585 ¥ 4,224,229 $35,777Securities borrowed transactions . . . . . . . . . . . . . . . . . . . . . . . . . . . . 3,794,416 4,378,941 37,088
Total . . . . . . . . . . . . . . . . . . . . . . . . . . . . . . . . . . . . . . . . . . . . . ¥6,680,001 ¥ 8,603,170 $72,865
Payables under:Repurchase agreements . . . . . . . . . . . . . . . . . . . . . . . . . . . . . . . . . . . ¥4,456,758 ¥ 7,024,677 $59,496Securities loaned transactions . . . . . . . . . . . . . . . . . . . . . . . . . . . . . . 3,788,734 3,927,458 33,264
Total . . . . . . . . . . . . . . . . . . . . . . . . . . . . . . . . . . . . . . . . . . . . . ¥8,245,492 ¥10,952,135 $92,760
Under these agreements and transactions, Nomura either receives or provides collateral, including JapaneseGovernment and agencies, mortgage backed, bank and corporate debt securities, non-Japanese governmentsecurities and equities.
In many cases, Nomura is permitted to use the securities to secure repurchase agreements, enter intosecurities lending transactions or deliver to counterparties to cover short positions. The related balances at March31, 2002 and 2003 are as follows:
Billions of yen
Translationinto billions
of U.S.dollars
March 31
2002 2003 2003
The fair value of securities received as collateral where Nomura is permitted tosell or repledge the securities . . . . . . . . . . . . . . . . . . . . . . . . . . . . . . . . . . . . . . ¥11,338 ¥13,056 $111
The portion of the above that has been sold (included in Securities sold but notyet purchased on the consolidated balance sheets) or repledged . . . . . . . . . . . 8,589 9,729 82
In the normal course of business, Nomura enters into Gensaki transactions which involve selling securitiesto customers and repurchasing them from the customers on a specific future date at a specific price. As theGensaki transactions are recorded as sales, the related securities and repurchase obligations are not reflected onthe accompanying consolidated balance sheets. As of March 31, 2002 and 2003, securities sold under Gensakiagreements but not yet reacquired amounted to ¥151,860 million and ¥35,000 million ($296 million),respectively. The contractual repurchase value of the above Gensaki transactions at March 31, 2002 and 2003approximated the market value of the securities at those dates.
In Japan, there is a market in which participants lend and borrow debt securities without collateral to/fromfinancial institutions under agreements known as lending and borrowing debt securities contracts. Under these
F-27
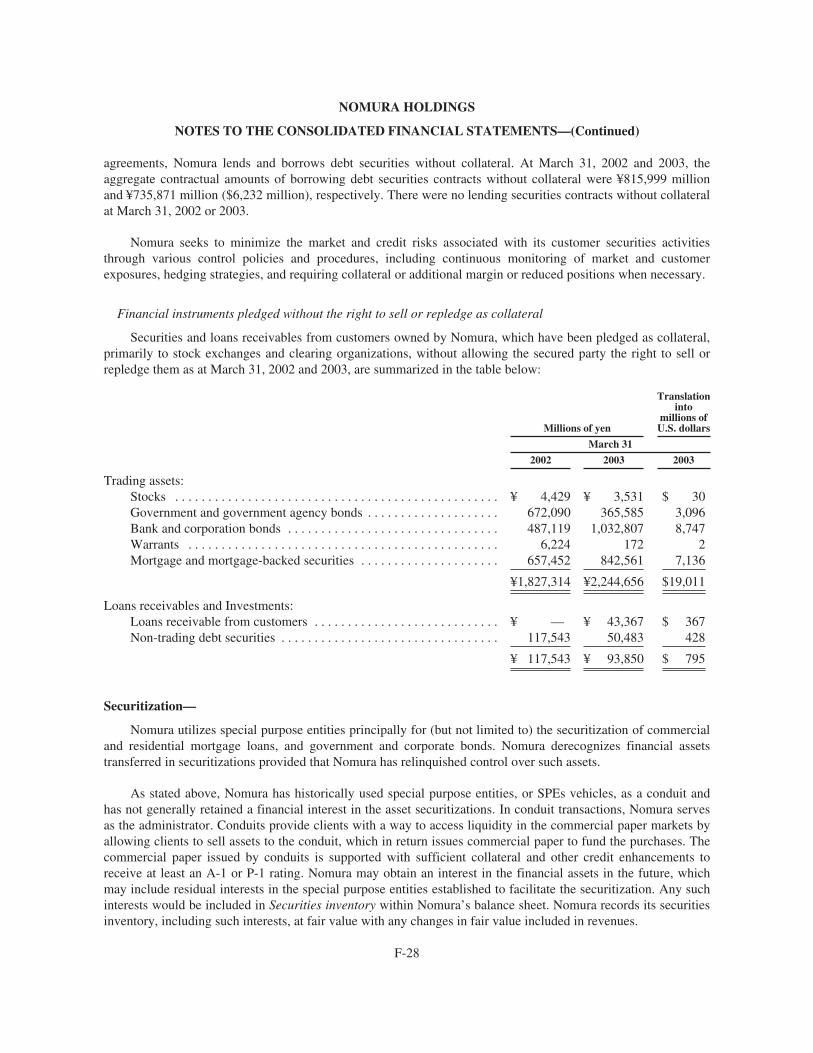
NOMURA HOLDINGS
NOTES TO THE CONSOLIDATED FINANCIAL STATEMENTS—(Continued)
agreements, Nomura lends and borrows debt securities without collateral. At March 31, 2002 and 2003, theaggregate contractual amounts of borrowing debt securities contracts without collateral were ¥815,999 millionand ¥735,871 million ($6,232 million), respectively. There were no lending securities contracts without collateralat March 31, 2002 or 2003.
Nomura seeks to minimize the market and credit risks associated with its customer securities activitiesthrough various control policies and procedures, including continuous monitoring of market and customerexposures, hedging strategies, and requiring collateral or additional margin or reduced positions when necessary.
Financial instruments pledged without the right to sell or repledge as collateral
Securities and loans receivables from customers owned by Nomura, which have been pledged as collateral,primarily to stock exchanges and clearing organizations, without allowing the secured party the right to sell orrepledge them as at March 31, 2002 and 2003, are summarized in the table below:
Millions of yen
Translationinto
millions ofU.S. dollars
March 31
2002 2003 2003
Trading assets:Stocks . . . . . . . . . . . . . . . . . . . . . . . . . . . . . . . . . . . . . . . . . . . . . . . . . ¥ 4,429 ¥ 3,531 $ 30Government and government agency bonds . . . . . . . . . . . . . . . . . . . . 672,090 365,585 3,096Bank and corporation bonds . . . . . . . . . . . . . . . . . . . . . . . . . . . . . . . . 487,119 1,032,807 8,747Warrants . . . . . . . . . . . . . . . . . . . . . . . . . . . . . . . . . . . . . . . . . . . . . . . 6,224 172 2Mortgage and mortgage-backed securities . . . . . . . . . . . . . . . . . . . . . 657,452 842,561 7,136
¥1,827,314 ¥2,244,656 $19,011
Loans receivables and Investments:Loans receivable from customers . . . . . . . . . . . . . . . . . . . . . . . . . . . . ¥ — ¥ 43,367 $ 367Non-trading debt securities . . . . . . . . . . . . . . . . . . . . . . . . . . . . . . . . . 117,543 50,483 428
¥ 117,543 ¥ 93,850 $ 795
Securitization—
Nomura utilizes special purpose entities principally for (but not limited to) the securitization of commercialand residential mortgage loans, and government and corporate bonds. Nomura derecognizes financial assetstransferred in securitizations provided that Nomura has relinquished control over such assets.
As stated above, Nomura has historically used special purpose entities, or SPEs vehicles, as a conduit andhas not generally retained a financial interest in the asset securitizations. In conduit transactions, Nomura servesas the administrator. Conduits provide clients with a way to access liquidity in the commercial paper markets byallowing clients to sell assets to the conduit, which in return issues commercial paper to fund the purchases. Thecommercial paper issued by conduits is supported with sufficient collateral and other credit enhancements toreceive at least an A-1 or P-1 rating. Nomura may obtain an interest in the financial assets in the future, whichmay include residual interests in the special purpose entities established to facilitate the securitization. Any suchinterests would be included in Securities inventory within Nomura’s balance sheet. Nomura records its securitiesinventory, including such interests, at fair value with any changes in fair value included in revenues.
F-28

NOMURA HOLDINGS
NOTES TO THE CONSOLIDATED FINANCIAL STATEMENTS—(Continued)
During the year ended March 31, 2003, Nomura securitized ¥110,123 million ($933 million) of financialassets. In addition, Nomura received ¥44,842 million ($380 million) from securitization trusts and paid ¥37,669million ($319 million) to securitization trusts. At March 31, 2003, Nomura held ¥4,719 million ($40 million) ofretained interests in transferred assets.
Variable Interest Entities (VIEs)—
In January 2003, the FASB released FIN No. 46, which clarifies when an enterprise should consolidate anentity that meets the definition of a VIE. A VIE is an entity in which equity investors do not have thecharacteristics of a controlling financial interest or do not have sufficient equity at risk for the entity to finance itsactivities without additional subordinated financial support from other parties, and may include many types ofSPEs. FIN No. 46 requires that an enterprise shall consolidate a VIE if that enterprise has a variable interest thatwill absorb a majority of the VIE’s expected losses, receive a majority of the VIE’s expected residual returns, orboth. FIN No. 46 is effective immediately for newly created VIEs after January 31, 2003. The effective date forVIEs that existed before February 1, 2003 is July 1, 2003.
With respect to certain VIEs created before February 1, 2003, Nomura believes that it is reasonably possiblethat it will either be required to disclose additional information about such entities in which it holds a significantvariable interest or of which it will be the primary beneficiary as of July 1, 2003. At March 31, 2003, inconnection with its Global Wholesale business, the aggregate size of these entities in which Nomura’s interest iseither significant or of which Nomura could be deemed to be the primary beneficiary was ¥818 billion ($7billion), of which ¥271 billion ($2 billion) is already recorded on the consolidated balance sheet at that date.Nomura’s variable interests associated with these entities, primarily the Terra Firma investments, financial asset-backed securitizations, credit-linked notes, and collateralized debt and loan obligation entities, are ¥271 billion($2 billion), which represents Nomura’s maximum exposure to loss at March 31, 2003. Nomura’s variableinterests of ¥271 billion ($2 billion) are already recorded on the consolidated balance sheet at that date.
It is reasonably possible, that as a result of consolidating certain entities, that are not currently consolidated,FIN No. 46 could have a material impact on Nomura’s consolidated financial statements in the future, althoughadopting FIN No. 46 will not materially change Nomura’s economic exposure with respect to these entities. Thisis especially true for the Terra Firma investments; should Nomura conclude that FIN No. 46 applies to theseinvestments and that either all, or some, require re-consolidation. (See Note 3 for the impact of de-consolidationin March 2002.)
Nomura purchases and sells interests in entities that may be deemed to be VIEs in its market-makingcapacity in the ordinary course of its Global Wholesale business. As a result of these activities, it is reasonablypossible that such entities may be consolidated and deconsolidated at various points in time. Therefore, thevariable interests referred to above may not be held by Nomura at March 31, 2004.
Derivatives utilized for trading purposes—
In the normal course of business, Nomura enters into transactions involving derivative financial instrumentsto meet customer needs, for its trading activities, and to reduce its own exposure to loss due to adversefluctuations in interest rates, currency exchange rates and market prices of securities, etc. These financialinstruments include contractual agreements such as commitments to swap interest payment streams, exchangecurrencies or purchase or sell securities and other financial instruments on specific terms at specific future dates.
F-29

NOMURA HOLDINGS
NOTES TO THE CONSOLIDATED FINANCIAL STATEMENTS—(Continued)
These instruments involve, to varying degrees, off-balance sheet market and credit risk under which default bythe counterparty and future changes in interest rates, foreign currency exchange rates or the market values of thesecurities underlying the instruments may ultimately result in cash settlements in excess of the amountsrecognized on the consolidated balance sheets.
Nomura enters into various derivative financial instruments transactions including futures, forwards, swapand option contracts involving securities, foreign currency, interest rate and other money market instruments aspart of its normal trading activities and for market risk management of certain non-trading assets and liabilities.The Company’s U.S.-based indirect wholly-owned subsidiary, Nomura Derivative Products Inc. (“NDPI”),engages in the swap business. Counterparties to transactions executed with NDPI rely solely on thecreditworthiness of NDPI and have no claims against the assets of any other Nomura group entities.
Nomura maintains active trading positions in a variety of derivative financial instruments. Most ofNomura’s trading activities are customer oriented. Nomura utilizes a variety of derivative financial instrumentsas a means of bridging customers’ specific financial needs and investors’ demands in the securities markets.Nomura also actively trades securities and various derivatives in order to assist its customers in adjusting theirrisk profiles as markets change. In performing these activities, Nomura carries an inventory of capital marketsinstruments and maintains its access to market liquidity by quoting bid and offer prices to and trading with othermarket makers. These activities are essential to provide customers with securities and other capital marketsproducts at competitive prices.
Forward and futures contracts are commitments to either purchase or sell securities, foreign currency ormoney market instruments at a specific future date for a specified price and may be settled in cash or throughdelivery. Foreign exchange contracts include spot, and forward contracts and involve the exchange of twocurrencies at a rate agreed to by the contracting parties. Risks arise from the possible inability of counterpartiesto meet the terms of their contracts and from movements in market prices. Futures contracts are conductedthrough regulated exchanges which clear and guarantee performance of counterparties. Accordingly, credit riskassociated with futures contracts are considered minimal. In contrast, forward contracts are generally negotiatedbetween two counterparties and, therefore, are subject to the performance of the related counterparties.
Options are contracts that grant the purchaser, for a premium payment, the right to either purchase or sell afinancial instrument at a specified price within a specified period of time or on a specified date from or to thewriter of the option. The writer of options receives premiums and bears the risk of unfavorable changes in themarket price of the financial instruments underlying the options.
Swaps are contractual agreements in which two counterparties agree to exchange certain cash flows, atspecified future dates, based on an agreed contract. Certain agreements may result in combined interest rate andforeign currency swap transactions. Entering into swap agreements may involve the risk of credit loss in theevent of the counterparties’ default.
To the extent these derivative financial instruments are hedging offsetting financial instruments or securitiespositions of Nomura, the overall off-balance sheet risk of loss may be fully or partly mitigated by the hedgedposition.
Nomura seeks to minimize its exposure to market risk arising from its use of these derivative financialinstruments through various control policies and procedures, including position limits, monitoring proceduresand hedging strategies whereby Nomura enters into offsetting or other positions in a variety of financialinstruments. Credit risk associated with these financial instruments is controlled by Nomura through credit
F-30

NOMURA HOLDINGS
NOTES TO THE CONSOLIDATED FINANCIAL STATEMENTS—(Continued)
approvals, limits and monitoring procedures. To reduce default risk, Nomura requires collateral, principallygovernment securities, for certain derivative transactions. From an economic standpoint, Nomura evaluatesdefault risk exposure net of related collateral. Furthermore, Nomura generally enters into International Swaps andDerivatives Association, Inc. master agreements or their equivalents (“master netting agreements”) with each ofits counterparties. Master netting agreements provide protection in bankruptcy in certain circumstances andmitigate the credit risk exposure from these transactions. In some cases, they enable unrealized gains and lossesarising from Nomura’s dealings in over-the-counter derivatives to be presented on a net-by-counterparty basis inaccordance with FIN No. 39.
In November 2002, the EITF reached a consensus on EITF Issue No. 02-3, “Issues Involved in Accountingfor Derivative Contracts Held for Trading Purposes and Contracts Involved in Energy Trading and RiskManagement Activities.” EITF Issue No. 02-3 precludes mark-to-market accounting for energy-trading contractsthat are not derivatives pursuant to SFAS No. 133, “Accounting for Derivative Instruments and HedgingActivities.” EITF Issue No. 02-3 also communicates the FASB staff’s view that the transaction price for aderivative contract is the best information available with which to estimate fair value at the inception of acontract when the estimate is not based on other observable market data. The application of the FASB staff’sview did not materially affect Nomura’s consolidated financial statements for the year ended March 31, 2003.
The table below discloses the fair values at March 31, 2002 and 2003 of derivative financial instruments fortrading purposes held or issued by Nomura. These amounts are not reported net of collateral, which Nomuraobtained to reduce credit risk exposure.
Millions of yen
Translationinto
millions ofU.S. dollars
March 31
2002 2003 2003
Trading Assets:Foreign exchange forwards . . . . . . . . . . . . . . . . . . . . . . . . . . . . . . . . . . . . ¥ 23,589 ¥ 16,558 $ 140FRA(1) and other OTC(2) forwards . . . . . . . . . . . . . . . . . . . . . . . . . . . . . . . 1,458 296 3Swap agreements . . . . . . . . . . . . . . . . . . . . . . . . . . . . . . . . . . . . . . . . . . . . 175,009 410,912 3,480Options other than securities options—purchased . . . . . . . . . . . . . . . . . . 93,210 75,651 641
Sub-total . . . . . . . . . . . . . . . . . . . . . . . . . . . . . . . . . . . . . . . . . . . . . . . . 293,266 503,417 4,264Securities options—purchased(3) . . . . . . . . . . . . . . . . . . . . . . . . . . . . . . . . 31,009 37,704 319
Total . . . . . . . . . . . . . . . . . . . . . . . . . . . . . . . . . . . . . . . . . . . . . . . . . ¥324,275 ¥541,121 $4,583
Trading Liabilities:Foreign exchange forwards . . . . . . . . . . . . . . . . . . . . . . . . . . . . . . . . . . . . ¥ 20,164 ¥ 16,999 $ 144FRA and other OTC forwards . . . . . . . . . . . . . . . . . . . . . . . . . . . . . . . . . . 1,108 8 0Swap agreements . . . . . . . . . . . . . . . . . . . . . . . . . . . . . . . . . . . . . . . . . . . . 215,231 443,408 3,756Options other than securities options—written . . . . . . . . . . . . . . . . . . . . . 69,396 26,590 225
Sub-total . . . . . . . . . . . . . . . . . . . . . . . . . . . . . . . . . . . . . . . . . . . . . . . . 305,899 487,005 4,125Securities options—written(3) . . . . . . . . . . . . . . . . . . . . . . . . . . . . . . . . . . 19,070 26,900 228
Total . . . . . . . . . . . . . . . . . . . . . . . . . . . . . . . . . . . . . . . . . . . . . . . . . ¥324,969 ¥513,905 $4,353
(1) “FRA” is Forward Rate Agreements.(2) “OTC” is Over The Counter.(3) Included in Securities inventory and Securities sold but not yet purchased, as appropriate
F-31

NOMURA HOLDINGS
NOTES TO THE CONSOLIDATED FINANCIAL STATEMENTS—(Continued)
Net gain on trading
While trading activities are primarily generated by client order flow, Nomura also takes proprietarypositions in interest rate, debt and equity instruments. Revenues from trading include realized and unrealizedgains and losses arising from trading as principal. Revenues also include realized and unrealized gains and losseson debt and equity securities and derivatives utilized in arbitrage strategies for Nomura’s own account. Nomuramanages its trading business by product groupings. The following table of net trading gains by business unit hasbeen prepared in order to present Nomura’s net trading gains and losses in a format which reflects the manner inwhich Nomura manages its businesses.
Millions of yen
Translationinto
millions ofU.S. dollars
Year ended March 31
2001 2002 2003 2003
Merchant Banking-including units managing principal financebusiness and some other private equity business . . . . . . . . . . . . ¥ 12,916 ¥ (6,828) ¥ 2,779 $ 23
Equity trading-including units trading primarily in stocks,convertible bonds, stock subscription warrants, and relatedderivatives . . . . . . . . . . . . . . . . . . . . . . . . . . . . . . . . . . . . . . . . . 259,800 113,036 35,919 304
Fixed income trading-including units trading primarily ingovernment bonds, corporate debt securities, relatedderivatives, and foreign exchange in connection withNomura’s securities business . . . . . . . . . . . . . . . . . . . . . . . . . . . 35,273 56,020 133,610 1,132
¥307,989 ¥162,228 ¥172,308 $1,459
Non-trading activities—
Nomura’s non-trading activities consist primarily of investments in equity securities for Nomura’s operatingpurposes and derivatives for purposes other than trading. Non-trading assets and non-trading liabilities consist ofaccounts other than Trading assets and private equity investments, Trading liabilities and trading balances ofbonds and notes issued contained in Long-term borrowings which are shown in Note 7.
Derivatives utilized for non-trading purposes
Nomura’s principal objective in utilizing derivatives for purposes other than trading is market riskmanagement for certain non-trading assets and liabilities such as non-trading debt securities, loans receivablefrom customers and other assets as well as bonds and notes issued. The operations of Nomura are subject to therisk of interest rate and currency rate fluctuations to the extent that there is a difference between the amounts ofNomura’s interest-bearing and/or foreign currency assets and liabilities which mature or reprice in specifiedperiods. To manage its exposures to market movements, Nomura uses derivative financial instruments.
Nomura issues Japanese yen and foreign currency denominated debt with both fixed and floating interestrates. Nomura generally enters into swap agreements to convert fixed or floating rate interest payments on itsdebt obligations to floating rate or fixed payments. The maturity structure of the swaps corresponds with thematurity of the debt obligations being hedged. Nomura also uses interest rate swaps to modify the interest ratecharacteristics of certain assets including loans receivable from customers. Credit risk associated with derivativesutilized for non-trading purposes is controlled and managed in the same way as credit risk associated withderivatives utilized for trading purposes.
F-32

NOMURA HOLDINGS
NOTES TO THE CONSOLIDATED FINANCIAL STATEMENTS—(Continued)
Estimated fair value of financial instruments—
Nomura’s financial instruments are recorded using several methods, including historical cost, amortized costor fair value. Specific accounting policies for significant financial instruments are discussed in Note 1.
The estimated fair values of Nomura’s financial instruments are derived using quoted market prices, whereavailable. Because no quoted market prices exist for a significant portion of Nomura’s financial instruments, thefair values of such instruments have been estimated using various valuation techniques that are influenced bynumerous subjective assumptions, such as discount rates of future cash flows. It should be noted that differentassumptions or estimation methodologies could significantly affect these estimates. Such estimates, therefore,may not be necessarily indicative of the net realizable or liquidation value of these instruments. In addition, theestimated fair values presented are calculated based on market conditions at a specific point in time and may notbe reflective of future fair values.
Short-term financial assets and liabilities carried at amounts which approximate fair value include: cash andcash deposits, receivables from customers/other than customers, receivables under resale agreements andsecurities borrowed transactions, loans receivable from other than customers, time and other deposits received,payables to customers/other than customers and payables under repurchase agreements and securities loanedtransactions. These financial instruments mature principally within one year and bear interest at rates thatapproximate market.
The estimated fair values of loans receivable from customers approximated carrying value. The estimatedfair values of loans are determined based on loan characteristics. The fair value of fixed rate loans was estimatedby discounting estimated cash flows. The discount rates are based on the current market rates for the applicablematurity. Where quoted market prices are available, such market prices were utilized as estimated fair values. ForNomura’s floating rate loans receivable, carrying value approximates fair value.
The following table presents financial instruments with carrying values that differ from their estimated fairvalues.
Billions of yenTranslation into billions of
U.S. dollars
March 31
2002 2003 2003
Carryingvalue
Fairvalue
Carryingvalue
Fairvalue
Carryingvalue
Fairvalue
Financial liabilities:Long-term borrowings . . . . . . ¥1,755 ¥1,784 ¥1,955 ¥1,979 $17 $17
Long-term borrowings
For certain bonds and notes issued by Nomura, Nomura enters into interest rate and currency swap contractsdesignated as hedges. The estimated fair values of the bonds and notes and related hedging instruments wereestimated using quoted market prices where available or by discounting future cash flows.
With regard to commitments to extend credit, standby letters of credit and financial guarantees written, thefair values are not material.
F-33

NOMURA HOLDINGS
NOTES TO THE CONSOLIDATED FINANCIAL STATEMENTS—(Continued)
5. Earnings per share:
The reconciliation of the amounts and the numbers used in the basic and diluted earnings per share (“EPS”)computations is as follows:
Yen amounts in millionsexcept per share data presented in yen
Translation intomillions ofU.S. dollarsexcept pershare datapresented inU.S. dollars
Year ended March 31
2001 2002 2003 2003
Basic—Income before cumulative effect of accounting changeapplicable to common stock . . . . . . . . . . . . . . . . . . . . ¥ 57,410 ¥ 168,046 ¥ 10,114 $ 86
Cumulative effect of accounting change applicable tocommon stock . . . . . . . . . . . . . . . . . . . . . . . . . . . . . . . — — 109,799 930
Net income applicable to common stock . . . . . . . . . . . . ¥ 57,410 ¥ 168,046 ¥ 119,913 $1,016
Weighted average number of shares outstanding (inthousands) . . . . . . . . . . . . . . . . . . . . . . . . . . . . . . . . . . 1,962,937 1,963,881 1,957,316
Basic EPS:Income before cumulative effect of accountingchange . . . . . . . . . . . . . . . . . . . . . . . . . . . . . . . . . . . . . ¥ 29.25 ¥ 85.57 ¥ 5.17 $ 0.04
Cumulative effect of accounting change . . . . . . . . . . . . — — 56.09 0.48
Net income . . . . . . . . . . . . . . . . . . . . . . . . . . . . . . . . . . . ¥ 29.25 ¥ 85.57 ¥ 61.26 $ 0.52
Diluted—Income before cumulative effect of accounting changeapplicable to common stock . . . . . . . . . . . . . . . . . . . . ¥ 57,410 ¥ 168,324 ¥ 10,114 $ 86
Cumulative effect of accounting change applicable tocommon stock . . . . . . . . . . . . . . . . . . . . . . . . . . . . . . . — — 109,799 930
Net income applicable to common stock . . . . . . . . . . . . ¥ 57,410 ¥ 168,324 ¥ 119,913 $1,016
Weighted average number of shares outstanding used indiluted EPS computations (in thousands) . . . . . . . . . . 1,962,937 1,972,903 1,957,316
Diluted EPS:Income before cumulative effect of accountingchange . . . . . . . . . . . . . . . . . . . . . . . . . . . . . . . . . . . . . ¥ 29.25 ¥ 85.32 ¥ 5.17 $ 0.04
Cumulative effect of accounting change . . . . . . . . . . . . — — 56.09 0.48
Net income . . . . . . . . . . . . . . . . . . . . . . . . . . . . . . . . . . . ¥ 29.25 ¥ 85.32 ¥ 61.26 $ 0.52
At March 31, 2001, there were 9,022 thousand shares of potential common stock related to convertiblebonds, which were considered antidilutive and thus were not included in the above calculations.
There were warrants to purchase 1,041 thousand shares of common stock at March 31, 2002, and warrantsand options to purchase 3,230 thousand common shares, at March 31, 2003, which were not included in thecomputation of diluted EPS because their exercise prices were greater than the average market prices of thecommon shares for each fiscal year.
F-34

NOMURA HOLDINGS
NOTES TO THE CONSOLIDATED FINANCIAL STATEMENTS—(Continued)
6. Receivables from and payables to customers and other:
Loans receivable from customers consist of loans for margin transactions and commercial loans. Theformer, which amounts to ¥82,152 million and ¥47,243 million ($400 million) at March 31, 2002 and 2003,respectively, is collateralized by customers’ securities and is also secured by customers’ deposits of securities.Commercial loans, which amount to ¥139,303 million and ¥210,011 million ($1,779 million) at March 31, 2002and 2003, respectively, are provided by the lending operations of subsidiaries.
Receivables from and payables to customers/other than customers include amounts due to securitiestransactions. Payables to customers/other than customers include funds received from customers/other thancustomers. Deposits received from customers of ¥157,724 million and ¥150,357 million ($1,273 million) areincluded in Payables to customers at March 31, 2002 and 2003, respectively.
Loans receivable from other than customers mainly consist of loans receivable from institutionalcounterparties in the money markets used for short-term financing.
Nomura establishes an Allowance for doubtful accounts for amounts estimated to be uncollectible. Changesin the Allowance for doubtful accounts for the years ended March 31, 2001, 2002 and 2003 are shown below:
Millions of yen
Translationinto
millions ofU.S. dollars
Year ended March 31
2001 2002 2003 2003
Balance at beginning of year . . . . . . . . . . . . . . . . . . . . . . . . . . . . . . ¥(15,181) ¥(26,529) ¥(18,410) $(156)Additions:
Charged to costs and expenses . . . . . . . . . . . . . . . . . . . . . . . . . (15,412) (5,002) — —Deductions:
Reversal of allowance for doubtful accounts . . . . . . . . . . . . . . — — 3,661 31Charge-offs . . . . . . . . . . . . . . . . . . . . . . . . . . . . . . . . . . . . . . . . 4,608 6,078 650 6
Other:Contribution of PFG entities . . . . . . . . . . . . . . . . . . . . . . . . . . — 8,461 — —Other—net . . . . . . . . . . . . . . . . . . . . . . . . . . . . . . . . . . . . . . . . (544) (1,418) (1,060) (9)
Balance at end of year . . . . . . . . . . . . . . . . . . . . . . . . . . . . . . . . . . . ¥(26,529) ¥(18,410) ¥(15,159) $(128)
7. Borrowings:
Borrowings of Nomura at March 31, 2002 and 2003 are shown below:
Millions of yen
Translationinto
millions ofU.S. dollars
March 31
2002 2003 2003
Short-term borrowings:Bank loans . . . . . . . . . . . . . . . . . . . . . . . . . . . . . . . . . . . . . . . . . . . . . . ¥ 238,291 ¥ 85,460 $ 724Loans from financial institutions other than banks . . . . . . . . . . . . . . . 845,093 846,924 7,173Commercial paper . . . . . . . . . . . . . . . . . . . . . . . . . . . . . . . . . . . . . . . . 388,000 251,151 2,127Current portion of long-term borrowings . . . . . . . . . . . . . . . . . . . . . . 218,120 313,933 2,659
Total . . . . . . . . . . . . . . . . . . . . . . . . . . . . . . . . . . . . . . . . . . . . . . ¥1,689,504 ¥1,497,468 $12,683
F-35

NOMURA HOLDINGS
NOTES TO THE CONSOLIDATED FINANCIAL STATEMENTS—(Continued)
Millions of yen
Translationinto millions
of U.S.dollars
March 31
2002 2003 2003
Long-term borrowings:Long-term bank loans . . . . . . . . . . . . . . . . . . . . . . . . . . . . . . . . . . . . ¥ 380,313 ¥ 492,020 $ 4,167Funding balances of bonds and notes issued: . . . . . . . . . . . . . . . . . .Fixed-rate obligations: . . . . . . . . . . . . . . . . . . . . . . . . . . . . . . . . . 413,484 503,874 4,267Japanese yen denominated(1) . . . . . . . . . . . . . . . . . . . . . . . . . . . 413,484 503,874 4,267
Variable-rate obligations: . . . . . . . . . . . . . . . . . . . . . . . . . . . . . . . 46,460 45,319 384Japanese yen denominated . . . . . . . . . . . . . . . . . . . . . . . . . . . . 33,131 33,826 287Non-Japanese yen denominated . . . . . . . . . . . . . . . . . . . . . . . . 13,329 11,493 97
Medium-term notes: . . . . . . . . . . . . . . . . . . . . . . . . . . . . . . . . . . . 955,570 1,040,278 8,811Japanese yen denominated . . . . . . . . . . . . . . . . . . . . . . . . . . . . 718,094 791,245 6,702Non-Japanese yen denominated . . . . . . . . . . . . . . . . . . . . . . . . 237,476 249,033 2,109
1,415,514 1,589,471 13,462Trading balances of bonds and notes issued . . . . . . . . . . . . . . . . . . . 177,147 187,879 1,592
1,972,974 2,269,370 19,221Less-Portion due within one year . . . . . . . . . . . . . . . . . . . . . . . . . . . 218,120 313,933 2,659
Total . . . . . . . . . . . . . . . . . . . . . . . . . . . . . . . . . . . . . . . . . ¥1,754,854 ¥1,955,437 $16,562
(1) Convertible bonds and warrants included in “Fixed-rate obligations: Japanese yen denominated” are shownbelow:
Millions of yen
Translationinto millions
of U.S.dollars
March 31
2002 2003 2003
1.4% convertible at ¥4,308.60 per share—due 2003 . . . . . . . . . . . . . . . . ¥28,641 ¥ — $—1.01% warrant at ¥2,305.00 per share—due 2005 . . . . . . . . . . . . . . . . . . 2,631 2,631 22
At March 31, 2003, fixed-rate obligations are due between 2004 and 2014 at interest rates ranging from0.40% to 4.15%. Variable-rate obligations, which are generally based on LIBOR, are due between 2004 and 2015at interest rates ranging from 0.12% to 2.08%. Medium-term notes are due between 2004 and 2033 at interestrates ranging from 0.0% to 10.56%.
Bond agreements for convertible yen bonds issued by the Company stipulate, among other things, that, atthe option of the Company, the bonds are redeemable in whole or in part at specified prices or they may berepurchased.
Certain borrowing agreements of subsidiaries contain provisions whereby the borrowings are redeemable atthe option of the holder at specified dates prior to maturity.
Nomura enters into swap agreements to manage its exposure to interest rate and currency risks. Principally,bonds and notes issued by subsidiaries are effectively converted to LIBOR-based floating rate obligationsthrough such swap agreements.
F-36

NOMURA HOLDINGS
NOTES TO THE CONSOLIDATED FINANCIAL STATEMENTS—(Continued)
The effective weighted-average interest rates of borrowings, some of which include the effect of hedges, atMarch 31, 2002 and 2003 were as follows:
March 31
2002 2003
Short-term borrowings . . . . . . . . . . . . . . . . . . . . . . . . . . . . . . . . . . . . . . . . . . . . . . . . . . . . . . . . 0.49% 0.39%Long-term borrowings . . . . . . . . . . . . . . . . . . . . . . . . . . . . . . . . . . . . . . . . . . . . . . . . . . . . . . . . . 2.43% 0.43%
Fixed-rate obligations . . . . . . . . . . . . . . . . . . . . . . . . . . . . . . . . . . . . . . . . . . . . . . . . . . . . . 1.55% 0.62%Variable-rate obligations . . . . . . . . . . . . . . . . . . . . . . . . . . . . . . . . . . . . . . . . . . . . . . . . . . . 1.02% 0.64%Medium-term notes . . . . . . . . . . . . . . . . . . . . . . . . . . . . . . . . . . . . . . . . . . . . . . . . . . . . . . . 3.55% 0.23%
Trading balances
These balances represent bonds and notes issued by special purpose entities. These bonds and notes werenot issued for the purpose of Nomura’s funding but for trading purposes for Nomura to gain profits fromdistribution of such bonds and notes to investors. Such bonds and notes are secured by or referenced to certainassets held by the special purpose entities, and the interest rates and/or redemption values or maturity have beenlinked to the performance of these referenced assets. These assets are included in the consolidated balance sheetsas Securities inventory.
The aggregate annual maturities of long-term borrowings as of March 31, 2003 consist of the following:
Year ending March 31 Millions of yen
Translationinto
millions of U.S.dollars
2004 . . . . . . . . . . . . . . . . . . . . . . . . . . . . . . . . . . . . . . . . . . . . . . . . . . . . . . . . . ¥ 313,933 $ 2,6592005 . . . . . . . . . . . . . . . . . . . . . . . . . . . . . . . . . . . . . . . . . . . . . . . . . . . . . . . . . 220,113 1,8642006 . . . . . . . . . . . . . . . . . . . . . . . . . . . . . . . . . . . . . . . . . . . . . . . . . . . . . . . . . 213,025 1,8042007 . . . . . . . . . . . . . . . . . . . . . . . . . . . . . . . . . . . . . . . . . . . . . . . . . . . . . . . . . 176,283 1,4932008 . . . . . . . . . . . . . . . . . . . . . . . . . . . . . . . . . . . . . . . . . . . . . . . . . . . . . . . . . 224,411 1,9012009 and thereafter . . . . . . . . . . . . . . . . . . . . . . . . . . . . . . . . . . . . . . . . . . . . . 1,121,605 9,500
¥2,269,370 $19,221
Borrowing facilities
At March 31, 2002 and 2003, Nomura had unused committed lines of credit amounting to ¥904,491 millionand ¥921,385 million ($7,804 million), respectively.
8. Assets pledged:
In the normal course of business, certain of Nomura’s assets are pledged to collateralize borrowingtransactions, securities financing transactions, derivative transactions and for other purposes. At March 31, 2002and 2003, the carrying value of assets pledged, except for those disclosed in Note 4, are as follows:
Millions of yen
Translationinto millionsof U.S. dollars
March 31
2002 2003 2003
Trading securities . . . . . . . . . . . . . . . . . . . . . . . . . . . . . . . . . . . . . . . . ¥776,595 ¥773,267 $6,549Non-trading debt securities . . . . . . . . . . . . . . . . . . . . . . . . . . . . . . . . . 13,203 — —Land and buildings . . . . . . . . . . . . . . . . . . . . . . . . . . . . . . . . . . . . . . . 8,656 8,606 73
¥798,454 ¥781,873 $6,622
F-37

NOMURA HOLDINGS
NOTES TO THE CONSOLIDATED FINANCIAL STATEMENTS—(Continued)
Assets in the above table were mainly pledged to financial institutions for loan payable and derivativetransactions.
In addition, Nomura repledged ¥335,511 million and ¥168,472 million ($1,427 million) of securitiesborrowed at March 31, 2002 and 2003 as collateral for bank loans and other loans.
9. Lump-sum severance indemnities, pension plans and postretirement health care plans:
Employees of the Company and subsidiaries in Japan (“the Japanese entities”) who terminate employmentare usually entitled to lump-sum severance indemnities or pension payments, as described below.
The unfunded retirement plans generally provide lump-sum severance indemnities for employees in theJapanese entities with at least two years of service calculated by a formula based upon position, years of serviceand reason of retirement according to office regulations. The amounts of lump-sum severance indemnities underthe unfunded retirement plans are subject to certain deductions based on benefits payable under the pension plansdescribed below.
Some Japanese entities also have non-contributory defined benefit pension plans which provide annuitypayments subsequent to retirement or lump-sum payments at the time of retirement for employees who retire ator after the age of 53 with at least 20 years of service or for survivors according to office regulations. The annuityis payable commencing at the age of 60 and is guaranteed for 15 years or for life, whichever is longer. Lump-sumpayments are also provided to employees with at least 20 years of service. The annuity or lump-sum paymentsare calculated using a formula based upon position, years of service and reason of retirement.
In addition to the plans above, the Company and Nomura Securities Co., Ltd. adopted defined contributionpension plans in December 2001. Other Japanese entities started defined contribution pension plans in April 2002and December 2002.
PFG entities operate a number of defined benefit and defined contribution plans throughout the world,which are financed according to local practice. The majority of PFG entities’ defined benefit pension benefits areprovided for its employees and former employees in the UK, Norway, Sweden and Germany. In addition,retirement indemnities are provided for employees in France. Pension benefits provided for other overseasparticipants are, in general, either government-provided or defined contribution. Because of the restructuring ofPFG as of March 27, 2002 as described in Note 1, there are no pension obligations related to the PFG entities’plans on the consolidated balance sheets at March 31, 2002 and 2003.
F-38
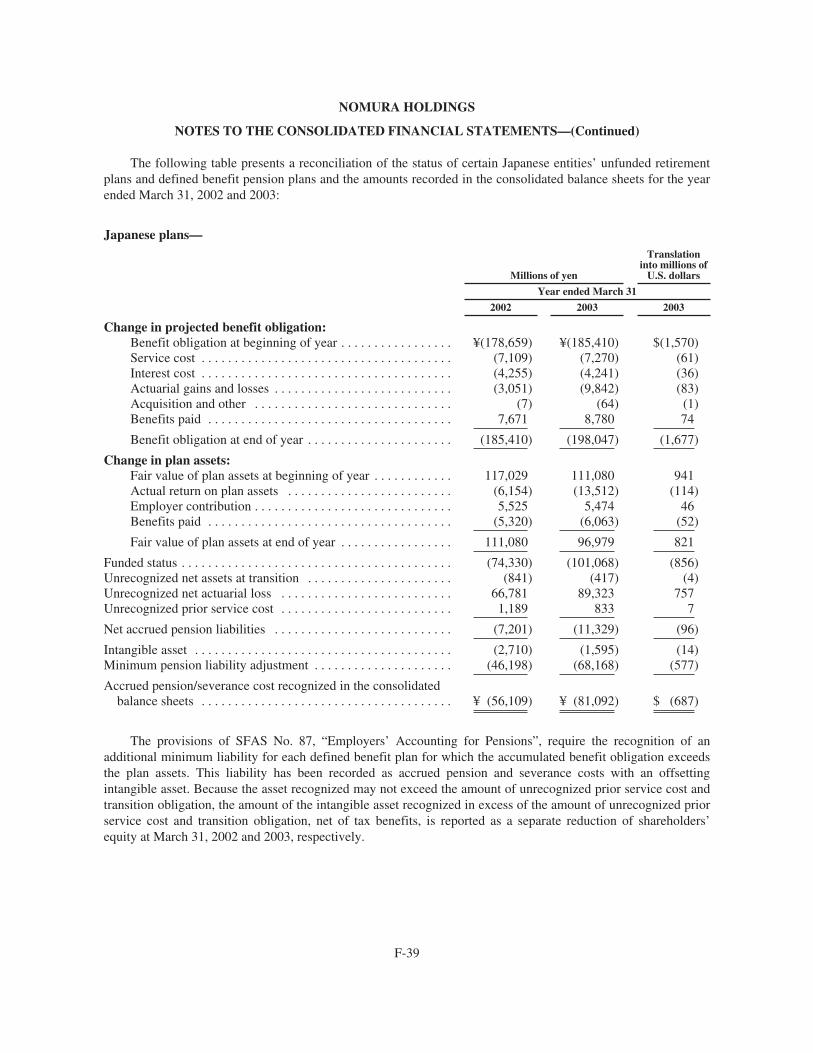
NOMURA HOLDINGS
NOTES TO THE CONSOLIDATED FINANCIAL STATEMENTS—(Continued)
The following table presents a reconciliation of the status of certain Japanese entities’ unfunded retirementplans and defined benefit pension plans and the amounts recorded in the consolidated balance sheets for the yearended March 31, 2002 and 2003:
Japanese plans—
Millions of yen
Translationinto millions ofU.S. dollars
Year ended March 31
2002 2003 2003
Change in projected benefit obligation:Benefit obligation at beginning of year . . . . . . . . . . . . . . . . . ¥(178,659) ¥(185,410) $(1,570)Service cost . . . . . . . . . . . . . . . . . . . . . . . . . . . . . . . . . . . . . . (7,109) (7,270) (61)Interest cost . . . . . . . . . . . . . . . . . . . . . . . . . . . . . . . . . . . . . . (4,255) (4,241) (36)Actuarial gains and losses . . . . . . . . . . . . . . . . . . . . . . . . . . . (3,051) (9,842) (83)Acquisition and other . . . . . . . . . . . . . . . . . . . . . . . . . . . . . . (7) (64) (1)Benefits paid . . . . . . . . . . . . . . . . . . . . . . . . . . . . . . . . . . . . . 7,671 8,780 74
Benefit obligation at end of year . . . . . . . . . . . . . . . . . . . . . . (185,410) (198,047) (1,677)
Change in plan assets:Fair value of plan assets at beginning of year . . . . . . . . . . . . 117,029 111,080 941Actual return on plan assets . . . . . . . . . . . . . . . . . . . . . . . . . (6,154) (13,512) (114)Employer contribution . . . . . . . . . . . . . . . . . . . . . . . . . . . . . . 5,525 5,474 46Benefits paid . . . . . . . . . . . . . . . . . . . . . . . . . . . . . . . . . . . . . (5,320) (6,063) (52)
Fair value of plan assets at end of year . . . . . . . . . . . . . . . . . 111,080 96,979 821
Funded status . . . . . . . . . . . . . . . . . . . . . . . . . . . . . . . . . . . . . . . . . (74,330) (101,068) (856)Unrecognized net assets at transition . . . . . . . . . . . . . . . . . . . . . . (841) (417) (4)Unrecognized net actuarial loss . . . . . . . . . . . . . . . . . . . . . . . . . . 66,781 89,323 757Unrecognized prior service cost . . . . . . . . . . . . . . . . . . . . . . . . . . 1,189 833 7
Net accrued pension liabilities . . . . . . . . . . . . . . . . . . . . . . . . . . . (7,201) (11,329) (96)
Intangible asset . . . . . . . . . . . . . . . . . . . . . . . . . . . . . . . . . . . . . . . (2,710) (1,595) (14)Minimum pension liability adjustment . . . . . . . . . . . . . . . . . . . . . (46,198) (68,168) (577)
Accrued pension/severance cost recognized in the consolidatedbalance sheets . . . . . . . . . . . . . . . . . . . . . . . . . . . . . . . . . . . . . . ¥ (56,109) ¥ (81,092) $ (687)
The provisions of SFAS No. 87, “Employers’ Accounting for Pensions”, require the recognition of anadditional minimum liability for each defined benefit plan for which the accumulated benefit obligation exceedsthe plan assets. This liability has been recorded as accrued pension and severance costs with an offsettingintangible asset. Because the asset recognized may not exceed the amount of unrecognized prior service cost andtransition obligation, the amount of the intangible asset recognized in excess of the amount of unrecognized priorservice cost and transition obligation, net of tax benefits, is reported as a separate reduction of shareholders’equity at March 31, 2002 and 2003, respectively.
F-39

NOMURA HOLDINGS
NOTES TO THE CONSOLIDATED FINANCIAL STATEMENTS—(Continued)
The aggregate benefit obligation of Japanese plans for those plans where the accumulated benefit obligationexceeded the fair value of plan assets at March 31, 2002 and 2003 was as follows:
Millions of yen
Translationinto millions ofU.S. dollars
March 31
2002 2003 2003
Accumulated benefit obligation . . . . . . . . . . . . . . . . . . . . . . . . . . ¥167,188 ¥178,071 $1,508
Assets of the plans are administered by several independent financial institutions and are investedprincipally in fixed income and equity securities. Certain Japanese entities’ policy is to fund amounts as arenecessary on an actuarial basis to provide assets sufficient to meet the benefits to be paid to plan members.
The weighted-average assumptions at the latest actuarial valuation date used in determining the presentvalues of the projected benefit obligation as of that date were as follows:
Japanese plans—
Year endedMarch 31
2002 2003
Discount rate . . . . . . . . . . . . . . . . . . . . . . . . . . . . . . . . . . . . . . . . . . . . . . . . . . . . 2.3% 2.0%Rate of increase in compensation levels . . . . . . . . . . . . . . . . . . . . . . . . . . . . . . . 4.1% 4.0%Expected long-term rate of return on plan assets . . . . . . . . . . . . . . . . . . . . . . . . 2.6% 2.6%
The net pension and severance costs of the benefit plans for the years ended March 31, 2001, 2002 and 2003included the following components:
Japanese plans—
Millions of yen
Translationinto
millions ofU.S. dollars
Year ended March 31
2001 2002 2003 2003
Service cost . . . . . . . . . . . . . . . . . . . . . . . . . . . . . . . . . . . . . . . . . ¥ 8,176 ¥ 7,109 ¥ 7,270 $ 62Interest cost . . . . . . . . . . . . . . . . . . . . . . . . . . . . . . . . . . . . . . . . . 4,229 4,255 4,241 36Expected return on plan assets . . . . . . . . . . . . . . . . . . . . . . . . . . (5,026) (3,111) (2,910) (25)Amortization of net transition assets . . . . . . . . . . . . . . . . . . . . . . (424) (424) (424) (4)Amortization of net actuarial losses . . . . . . . . . . . . . . . . . . . . . . 1,061 3,044 3,722 32Amortization of prior service cost . . . . . . . . . . . . . . . . . . . . . . . . 356 356 356 3
Net periodic pension and severance costs . . . . . . . . . . . . . . ¥ 8,372 ¥11,229 ¥12,255 $104
F-40

NOMURA HOLDINGS
NOTES TO THE CONSOLIDATED FINANCIAL STATEMENTS—(Continued)
PFG entities’ plans—Millions of yen
Year ended March 31
2001 2002
Service cost . . . . . . . . . . . . . . . . . . . . . . . . . . . . . . . . . . . . . . . . . . . . . . . . . . . . . . . . . . . . . ¥ 1,686 ¥ 2,163Interest cost . . . . . . . . . . . . . . . . . . . . . . . . . . . . . . . . . . . . . . . . . . . . . . . . . . . . . . . . . . . . . 7,755 7,293Expected return on plan assets . . . . . . . . . . . . . . . . . . . . . . . . . . . . . . . . . . . . . . . . . . . . . . (9,952) (8,816)Amortization of prior service cost . . . . . . . . . . . . . . . . . . . . . . . . . . . . . . . . . . . . . . . . . . . . — (55)Amortization of net actuarial gain . . . . . . . . . . . . . . . . . . . . . . . . . . . . . . . . . . . . . . . . . . . . (8) —
Net periodic pension costs . . . . . . . . . . . . . . . . . . . . . . . . . . . . . . . . . . . . . . . . . . . . . . ¥ (519) ¥ 585
Curtailment/settlement gain . . . . . . . . . . . . . . . . . . . . . . . . . . . . . . . . . . . . . . . . . . . . . . . . ¥ (174) ¥ (390)
The prior service cost is amortized on a straight-line basis over the average remaining service period ofactive participants. Gains and losses in excess of 10% of the greater of the benefit obligation or the fair value ofplan assets are amortized over the average remaining service period of active participants.
Japanese entities contributed ¥176 million and ¥724 million ($6 million) to the defined contribution pensionplans for the years ended March 31, 2002 and 2003, respectively.
Substantially all employees of the Japanese entities were covered under an industry-wide multi-employernon-contributory welfare pension plan, which is administered by the Japan Securities Dealers Employees PensionFund (JSDE Fund) in coordination with the contributory governmental welfare pension plan. Most of theJapanese entities withdrew from the JSDE Fund at the end of August 2001, and paid a special withdrawal chargeof ¥18,892 million that was charged to income in September 2001.
Additionally, the Company and certain subsidiaries provide certain health care benefits to both active andretired employees through its Nomura Securities Health Insurance Society (“NSHIS”), and these benefits arecurrently funded and provided through NSHIS. The Company and certain subsidiaries sponsor certain health carebenefits to retired employees (“Special Plan”) and these retirees are permitted to continue participation in thisSpecial Plan on a pay-all basis, i.e., by requiring a retiree contribution based on the estimated per capita cost ofcoverage. The Special Plan is administered together with NSHIS and the funded status of this Special Plan is notcomputed separately since the plan is jointly administered by NSHIS and the national government and, therefore,it is a multi-employer post-retirement plan. Therefore, although the Company and certain subsidiaries contributesome portion of cost of retiree health care benefits not covered through retiree contributions, the Company andcertain subsidiaries do not provide any provision for the future cost. As multi-employer plans, the netpostretirement benefit cost for the year is equivalent to the required contribution for the period.
Amounts charged to expenses and contributed to these plans were ¥6,570 million, ¥5,421 million and¥4,087 million ($35 million) for the years ended March 31, 2001, 2002 and 2003, respectively.
Substantially all overseas subsidiaries, excluding PFG entities, have various local defined contributionpension plans or defined benefit plans covering certain employees. The contributions to the defined contributionpension plans, which are charged to income, are ¥2,086 million, ¥2,631 million and ¥2,407 million ($20 million)for the years ended March 31, 2001, 2002 and 2003, respectively. The contribution to the defined benefit pensionplans is not material. “An additional minimum liability” amounting to ¥5,490 million ($46 million) has beenrecognized for one of the defined benefit pension plans in which the accumulated benefit obligation exceeds theplan assets at March 31, 2003.
F-41

NOMURA HOLDINGS
NOTES TO THE CONSOLIDATED FINANCIAL STATEMENTS—(Continued)
10. Stock-based compensation plans:
At March 31, 2003, the Company has two stock-based compensation plans (“Stock Option Plans”). Onecommenced in August 2000 and the other commenced in August 2002. In August 2000, upon the issuance ofunsecured bonds with detachable warrants, the Company purchased all of the detachable warrants and delivered2,619 warrants for the acquisition of 1.1 million shares to directors, statutory auditors and certain employees asstock options. The warrants vested 6 months after the date of grant. In August 2002, the Company granted 2,227stock acquisition rights as stock options for the acquisition of 2.2 million shares to directors, statutory auditors,and certain employees. The options vest two years after the date of grant.
The activity related to these Stock Option Plans for the years ended March 31, 2001, 2002 and 2003 aresummarized below:
Optionsoutstanding
Weighted averageexercise price
Weighted averageremaining life
(years)
Outstanding at March 31, 2000 . . . . . . . . . . . . . . . . . . . . . . . . . . . — — —Granted . . . . . . . . . . . . . . . . . . . . . . . . . . . . . . . . . . . . . . . . . . . . . . 1,136,225 ¥2,305Exercised . . . . . . . . . . . . . . . . . . . . . . . . . . . . . . . . . . . . . . . . . . . . — —Repurchased . . . . . . . . . . . . . . . . . . . . . . . . . . . . . . . . . . . . . . . . . . (2,603) 2,305Outstanding at March 31, 2001 . . . . . . . . . . . . . . . . . . . . . . . . . . . 1,133,622 2,305 3.4Granted . . . . . . . . . . . . . . . . . . . . . . . . . . . . . . . . . . . . . . . . . . . . . . — —Exercised . . . . . . . . . . . . . . . . . . . . . . . . . . . . . . . . . . . . . . . . . . . . (2,603) 2,305Repurchased . . . . . . . . . . . . . . . . . . . . . . . . . . . . . . . . . . . . . . . . . . (89,805) 2,305Outstanding at March 31, 2002 . . . . . . . . . . . . . . . . . . . . . . . . . . . 1,041,214 2,305 2.4Granted . . . . . . . . . . . . . . . . . . . . . . . . . . . . . . . . . . . . . . . . . . . . . . 2,227,000 1,807Exercised . . . . . . . . . . . . . . . . . . . . . . . . . . . . . . . . . . . . . . . . . . . . — —Repurchased . . . . . . . . . . . . . . . . . . . . . . . . . . . . . . . . . . . . . . . . . . (37,744) 2,305Outstanding at March 31, 2003 . . . . . . . . . . . . . . . . . . . . . . . . . . . 3,230,470 1,962 4.8
At March 31, 2001, 2002, and 2003, options exercisable were 1,133,622, 1,041,214, and 1,003,470,respectively.
The following table details the distribution of stock options at March 31, 2003:
Options outstanding Options exercisable
Exercise pricesOptions
outstandingWeighted-averageexercise price
Weighted-average remainingcontractual life (years)
Optionsexercisable
Weighted-averageexercise price
¥ 2,305 . . . . . . . . 1,003,470 ¥ 2,305 1.4 1,003,470 ¥ 2,305¥ 1,807 . . . . . . . . 2,227,000 ¥ 1,807 6.3 — ¥ —
Total . . . . . . . . . . 3,230,470 ¥ 1,962 4.8 1,003,470 ¥ 2,305
Effective April 1, 2002, Nomura adopted the fair value recognition provisions of SFAS 123. In December2002, the FASB issued SFAS No. 148, “Accounting for Stock-Based Compensation – Transition and Disclosure,an amendment of SFAS No. 123.” SFAS No. 148 permits three alternative methods of transition for voluntarychange to the fair value-based method of accounting for employee stock-based compensation. The prospectivemethod applies the fair value-based method for stock-based compensation from the first fiscal year of firstadoption, the modified prospective method, which recognizes stock-based compensation cost from the first fiscalyear of adoption assuming that the fair value based method had been adopted for all stock-based compensation,
F-42

NOMURA HOLDINGS
NOTES TO THE CONSOLIDATED FINANCIAL STATEMENTS—(Continued)
and the retroactive restatement method which restates for all periods from the original effective date of SFAS No.123. The transition guidance and annual disclosure provision of SFAS No. 148 are effective for fiscal yearsending after December 15, 2002.
Under the modified prospective method of SFAS 148, compensation cost recognition provisions of SFAS123 have been applied from its original effective date. Results for prior years have not been restated. Thefollowing table illustrates the effect on net income and earnings per share if the fair value based method had beenapplied to all outstanding and unvested awards in each period.
Millions of yen,except per share amounts
Translation intomillions of U.S.dollars, except
per shareamounts
Year ended March 31
2001 2002 2003 2003
Net income, as reported . . . . . . . . . . . . . . . . . . . . . . . . . . . . . . . ¥57,410 ¥168,046 ¥119,913 $1,016Add: Stock-based employee compensation expenseincluded in reported net income, net of related taxeffects . . . . . . . . . . . . . . . . . . . . . . . . . . . . . . . . . . . . . . . 109 — 349 3
Deduct: Total stock-based employee compensationexpense determined under fair value based method forall awards, net of related tax effects . . . . . . . . . . . . . . . . (883) — (349) (3)
Pro forma net income . . . . . . . . . . . . . . . . . . . . . . . . . . . . . . . . . ¥56,636 ¥168,046 ¥119,913 $1,016
Earnings per share:Basic, as reported . . . . . . . . . . . . . . . . . . . . . . . . . . . . . . ¥ 29.25 ¥ 85.57 ¥ 61.26 $ 0.52Basic, pro forma . . . . . . . . . . . . . . . . . . . . . . . . . . . . . . . ¥ 28.85 ¥ 85.57 ¥ 61.26 $ 0.52
Diluted, as reported . . . . . . . . . . . . . . . . . . . . . . . . . . . . ¥ 29.25 ¥ 85.32 ¥ 61.26 $ 0.52Diluted, pro forma . . . . . . . . . . . . . . . . . . . . . . . . . . . . . ¥ 28.85 ¥ 85.32 ¥ 61.26 $ 0.52
The fair value of options granted during the years ended March 31, 2001 and 2003 was ¥777 and ¥451($4)per share, respectively, at the grant date. Fair value as of the date of grant was estimated using a Black-Scholesoption-pricing model with the following assumptions:
Year ended March 31
2001 2003
Expected dividend yield . . . . . . . . . . . . . . . . . . . . . . . . . . . . . . . . . . . . . . 0.63% 0.99%Expected volatility . . . . . . . . . . . . . . . . . . . . . . . . . . . . . . . . . . . . . . . . . . 45.70% 43.72%Risk-free interest rate . . . . . . . . . . . . . . . . . . . . . . . . . . . . . . . . . . . . . . . . 1.11% 0.73%Expected lives . . . . . . . . . . . . . . . . . . . . . . . . . . . . . . . . . . . . . . . . . . . . . . 4 years 7 years
Subsequent event
The Company will issue additional stock acquisition rights as stock options (sinkabu-yoyaku-ken) asincentives for the directors, executive officers and employees of the Company and its subsidiaries to maintainhigh levels of performance and to recruit talented human resources. Issuance of stock acquisition rights as stockoptions (shinkabu-yoyaku-ken) without receipt of consideration in accordance with Articles 280-20 and 280-21of the Commercial Code of Japan was approved at the annual meeting of shareholders held on June 26, 2003.Pursuant to the approval, the Company will introduce the following two additional types of stock option plans,
F-43

NOMURA HOLDINGS
NOTES TO THE CONSOLIDATED FINANCIAL STATEMENTS—(Continued)
the “Stock Option A plan” and “Stock Option B plan”. According to the Stock Option A plan, the Company willgrant up to 2,500 stock acquisition rights as stock options (shinkabu-yoyaku-ken) for the acquisition of 2.5million shares. Each right will allow the holder to acquire 1,000 shares. The exercise price will be the amountthat is equal to 1.05 times the higher of either the average of the daily closing prices of the common stock of theCompany in regular trading at the Tokyo Stock Exchange during the calendar month immediately prior to themonth including the issue date of the stock acquisition rights, or the closing price on the issue date. According tothe Stock Option B plan, the Company will grant up to 2,500 stock acquisition rights as stock options (shinkabu-yoyaku-ken) for the acquisition of 2.5 million shares. Each right will allow the holder to acquire 1,000 shares.The exercise price shall be 1 yen per share.
11. Income taxes:
The components of income tax expense reflected in the consolidated income statements are as follows:
Millions of yen
Translationinto
millions ofU.S. dollars
Year ended March 31
2001 2002 2003 2003
Current:Domestic . . . . . . . . . . . . . . . . . . . . . . . . . . . . . . . . . . . . . . . . . . ¥39,983 ¥ 36,539 ¥ 21,570 $183Foreign . . . . . . . . . . . . . . . . . . . . . . . . . . . . . . . . . . . . . . . . . . . . 13,710 25,359 3,949 33
53,693 61,898 25,519 216
Deferred:Domestic . . . . . . . . . . . . . . . . . . . . . . . . . . . . . . . . . . . . . . . . . . 36,021 (72,650) 22,367 189Foreign . . . . . . . . . . . . . . . . . . . . . . . . . . . . . . . . . . . . . . . . . . . . 9,048 15,678 (10,591) (89)
45,069 (56,972) 11,776 100
Total . . . . . . . . . . . . . . . . . . . . . . . . . . . . . . . . . . . . . . . . . . ¥98,762 ¥ 4,926 ¥ 37,295 $316
The Company and subsidiaries in Japan were subject to a normal effective statutory tax rate ofapproximately 42% for the years ended March 31, 2001 and 2002.
From the year ended March 31, 2003, the Company and its wholly-owned domestic subsidiaries adopted theconsolidated tax return system. In addition to the basic corporate tax rate, a 2% surtax will be imposed until theyear ending March 31, 2004. As a result, the normal effective statutory tax rate was approximately 44% for theyear ended March 31, 2003.
New Japanese tax legislation was issued in March 2003, reducing the standard enterprise tax rate andcreating new taxes on capital and certain expenses defined in the law, which will be effective on April 1, 2004for the Company and its domestic subsidiaries. This legislation will reduce the domestic effective statutory taxrate to approximately 40%. The lower future effective tax rate decreased existing deferred tax assets, resulting inincreasing Income tax expense—Deferred by ¥7,935 million ($67 million) for the year ended March 31, 2003.
Foreign subsidiaries are subject to income taxes of the countries in which they operate. The relationshipbetween income tax expense and pretax accounting income is affected by a number of items, including varioustax credits, certain expenses not allowable for income tax purposes and different tax rates applicable to foreignsubsidiaries.
F-44

NOMURA HOLDINGS
NOTES TO THE CONSOLIDATED FINANCIAL STATEMENTS—(Continued)
A reconciliation of the effective income tax rate reflected in the consolidated income statements to thenormal effective statutory tax rate is as follows:
Year ended March 31
2001 2002 2003
Normal effective statutory tax rate . . . . . . . . . . . . . . . . . . . . . . . . . . . . . . . . . . . . . . . . . . . . . . 42.0% 42.0%44.0%Impact of:
Change in deferred tax valuation allowance . . . . . . . . . . . . . . . . . . . . . . . . . . . . . . . . . . . 19.4 19.5 12.4Non-deductible expenses . . . . . . . . . . . . . . . . . . . . . . . . . . . . . . . . . . . . . . . . . . . . . . . . . 8.2 1.9 6.6Dividends from subsidiaries . . . . . . . . . . . . . . . . . . . . . . . . . . . . . . . . . . . . . . . . . . . . . . . 0.1 1.3 2.1Amortization of negative goodwill . . . . . . . . . . . . . . . . . . . . . . . . . . . . . . . . . . . . . . . . . . (3.5) (3.2) —Contribution of PFG entities . . . . . . . . . . . . . . . . . . . . . . . . . . . . . . . . . . . . . . . . . . . . . . . — (25.4) —Non-taxable revenue . . . . . . . . . . . . . . . . . . . . . . . . . . . . . . . . . . . . . . . . . . . . . . . . . . . . . (2.4) (2.4) (6.0)Loss on sale/impairment of investments in subsidiaries and affiliates . . . . . . . . . . . . . . . (0.4) (18.2) —Tax effect of undistributed earnings of foreign subsidiaries . . . . . . . . . . . . . . . . . . . . . . (0.1) (0.4) (7.6)Different tax rate applicable to income (loss) of foreign subsidiaries . . . . . . . . . . . . . . . 2.7 (14.0) 10.3Effect of revision of future statutory tax rates . . . . . . . . . . . . . . . . . . . . . . . . . . . . . . . . . — — 15.5Others . . . . . . . . . . . . . . . . . . . . . . . . . . . . . . . . . . . . . . . . . . . . . . . . . . . . . . . . . . . . . . . . (2.8) 1.7 1.4
Effective tax rate . . . . . . . . . . . . . . . . . . . . . . . . . . . . . . . . . . . . . . . . . . . . . . . . . . . . . . . . . . . . 63.2% 2.8%78.7%
The net deferred tax assets of ¥132,808 million and ¥112,313 million ($951 million) included in theconsolidated balance sheets at March 31, 2002 and 2003, respectively, represent the total of the temporarydifferences in components of those tax jurisdictions with net deductible amounts in future years. The net deferredtax liabilities of ¥24,816 million and ¥4,367 million ($37 million) included in Other liabilities—Other in theconsolidated balance sheets at March 31, 2002 and 2003, respectively, represent the total of the temporarydifferences in components of those tax jurisdictions with net taxable amounts in future years.
F-45

NOMURA HOLDINGS
NOTES TO THE CONSOLIDATED FINANCIAL STATEMENTS—(Continued)
Details of deferred tax assets and liabilities at March 31, 2002 and 2003 are as follows:
Millions of yen
Translation intomillions of U.S.
dollars
March 31
2002 2003 2003
Deferred tax assetsDepreciation and amortization . . . . . . . . . . . . . . . . . . . . . . . . . . . . . ¥ 9,107 ¥ 12,335 $ 104Valuation of securities and derivatives . . . . . . . . . . . . . . . . . . . . . . 99,250 72,058 610Accrued expenses and provisions . . . . . . . . . . . . . . . . . . . . . . . . . . . 20,234 28,051 238Operating losses . . . . . . . . . . . . . . . . . . . . . . . . . . . . . . . . . . . . . . . . 174,178 131,504 1,114Accrued severance and pension costs . . . . . . . . . . . . . . . . . . . . . . . . 31,552 38,267 324Valuation of office buildings and land . . . . . . . . . . . . . . . . . . . . . . . 14,847 13,908 118Others . . . . . . . . . . . . . . . . . . . . . . . . . . . . . . . . . . . . . . . . . . . . . . . . 24,848 15,894 135
Gross deferred tax assets . . . . . . . . . . . . . . . . . . . . . . . . . . . . . . . . . 374,016 312,017 2,643Less — Valuation allowance . . . . . . . . . . . . . . . . . . . . . . . . . . . . . . (129,153) (127,747) (1,082)
Total deferred tax assets . . . . . . . . . . . . . . . . . . . . . . . . . . . . . . 244,863 184,270 1,561
Deferred tax liabilitiesValuation of securities and derivatives . . . . . . . . . . . . . . . . . . . . . . 97,551 56,914 482Undistributed earnings of foreign subsidiaries . . . . . . . . . . . . . . . . . 5,318 12,982 110Others . . . . . . . . . . . . . . . . . . . . . . . . . . . . . . . . . . . . . . . . . . . . . . . . 34,002 6,428 55
Total deferred tax liabilities . . . . . . . . . . . . . . . . . . . . . . . . . . . 136,871 76,324 647
Net deferred tax assets . . . . . . . . . . . . . . . . . . . . . . . . . . . . . . . . . . . . . . ¥ 107,992 ¥ 107,946 $ 914
The valuation allowance mainly relates to deferred tax assets of the consolidated subsidiaries with operatingloss carryforwards for tax purposes. Based on the cumulative and continuing losses of these subsidiariesmanagement of the Company believes that it is more likely than not that these deferred tax assets will not berealized. Changes in the valuation allowance for deferred tax assets for the years ended March 31, 2001, 2002and 2003 are shown below:
Millions of yen
Translation intomillions ofU.S. dollars
Year ended March 31
2001 2002 2003 2003
Balance at beginning of year . . . . . . . . . . . . . . . . . . . . . . . . . . ¥ 62,684 ¥176,837 ¥129,153 $1,094Net change during the year . . . . . . . . . . . . . . . . . . . . . . . . . . . 114,153 (47,684) (1,406) (12)
Balance at end of year . . . . . . . . . . . . . . . . . . . . . . . . . . . . . . . ¥176,837 ¥129,153 ¥127,747 $1,082
At March 31, 2003, no deferred income taxes have been provided on undistributed earnings of foreignsubsidiaries not expected to be remitted in the foreseeable future totaling ¥49,607 million ($420 million).
At March 31, 2003, Nomura has net operating loss carryforwards, for income tax purposes, of ¥430,612million ($3,647 million) resulting from operations primarily in Japan and the U.S. These losses, except for¥50,948 million ($431 million), which can be carried forward indefinitely, expire as follows: 2004 through
F-46

NOMURA HOLDINGS
NOTES TO THE CONSOLIDATED FINANCIAL STATEMENTS—(Continued)
2008—¥136,117 million ($1,153 million), 2009 and thereafter—¥243,547 million ($2,063 million). Nomurabelieves that it is more likely than not that these loss carryforwards, less valuation allowance, will be realized.
12. Common stock, legal reserve and retained earnings:
In accordance with the provisions of the Commercial Code of Japan, conversions of convertible debt intocommon stock are accounted for by crediting more than one-half of the conversion proceeds to the commonstock account and the remainder to the additional paid-in capital account.
The balance of retained earnings at March 31, 2002 and 2003 includes statutory legal reserves requiredunder the Japanese Commercial Code and Japanese Securities and Exchange Law that restricts the payments ofdividends under the Commercial Code to shareholders as of March 31, 2003. At March 31, 2003, ¥950,662million ($8,052 million) of statutory retained earnings of the Company is not subject to this restriction, whichwas based on the amount recorded in the Company’s statutory books of account maintained in accordance withaccounting principles and practices prevailing in Japan. The US GAAP adjustments incorporated in theaccompanying consolidated financial statements but not recorded in the statutory books of account have no effecton the determination of retained earnings restricted for dividends under the Commercial Code.
Retained earnings includes Nomura’s equity in undistributed earnings of affiliated companies accounted forby the equity method in the amount of ¥3,497 million ($30 million) at March 31, 2003.
Dividends declared on common stock were ¥17.5 per share for the year ended March 31, 2001, and ¥15.0($0.13) per share for the years ended March 31, 2002 and 2003, respectively.
The shareholders of the Company approved a stock repurchase program in accordance with Article 210 ofthe Commercial Code of Japan on June 26, 2002, as follows: (a) total number of shares authorized for repurchaseis up to 100 million shares, (b) total value of shares authorized for repurchase is up to ¥250 billion, (c) theCompany is authorized to repurchase its stock by the closing of the annual meeting of shareholders for the fiscalyear ended March 31, 2003.
Under the repurchase program pursuant to Article 210 of the Commercial Code of Japan, the Companyrepurchased, as of March 31, 2003, 22 million shares of common stock at a cost of ¥29,290 million ($248million). In addition, common stock held in treasury includes shares acquired from investors holding shares lessthan one standard trading unit. Common stock held in treasury also includes 755 thousand shares, or ¥1,531million ($13 million), held by affiliated companies at March 31, 2003.
Subsequent events
The shareholders of the Company approved a stock repurchase program in accordance with Article 210 ofthe Commercial Code of Japan on June 26, 2003, as follows: (a) total number of shares authorized for repurchaseis up to 100 million shares, (b) total value of shares authorized for repurchase is up to ¥150 billion ($1.3 billion),(c) the Company is authorized to repurchase its stock by the closing of the annual meeting of shareholders for thefiscal year ending March 31, 2004.
The appropriation of retained earnings with respect to the year ended March 31, 2003, which has beenincorporated in the accompanying consolidated financial statements, was approved at the annual meeting ofshareholders held on June 26, 2003 and has been recorded in the statutory books of account in accordance withthe Commercial Code after shareholders’ approval.
F-47

NOMURA HOLDINGS
NOTES TO THE CONSOLIDATED FINANCIAL STATEMENTS—(Continued)
13. Regulatory requirements and dividend limitation:
Under the Securities and Exchange Law, securities companies in Japan are subject to the capital adequacyrules of the Financial Services Agency. This rule requires the maintenance of a capital adequacy ratio, which isdefined as the ratio of adjusted capital to a quantified total of business risk, of not less than 120%. Adjustedcapital is defined as net worth (which includes shareholders’ equity, net unrealized gains and losses on securitiesheld, reserves and subordinated debts) less illiquid assets. The business risks are divided into three categories, (1)market risks, (2) counterparty risks, and (3) basic risks. Under this rule, there are no restrictions on the operationsof the companies provided that the resulting net capital adequacy ratio exceeds 120%. At March 31, 2002 and2003, the capital adequacy ratio of Nomura Securities Co., Ltd. exceeded 120%.
A securities company in Japan is required to segregate cash deposited by customers on securitiestransactions under the Japanese Securities and Exchange Law. At March 31, 2002, Nomura Securities Co., Ltd.segregated bonds with a market value of ¥344,442 million as a substitute for cash. At March 31, 2003, NomuraSecurities Co., Ltd. segregated bonds with a market value of ¥163,544 million ($1,385 million) and equities witha market value of ¥55,298 million ($468 million), which were either included in Securities inventory on theaccompanying consolidated balance sheet or borrowed under lending and borrowing securities contracts, as asubstitute for cash.
A subsidiary in the United States is registered as a broker-dealer with the Securities and ExchangeCommission (the “SEC”) and is subject to the SEC’s Uniform Net Capital Rule, which requires net capital, asdefined under the alternative method, of not less than the greater of 2% of aggregate debit items arising fromcustomers transactions, or 4% of funds required to be segregated for customers’ regulated commodity accounts.At March 31, 2002 and 2003, the subsidiary’s U.S. Government, agencies’ securities, and beneficiary certificateswith a market value of ¥24,112 million and ¥26,803 million ($227 million), respectively, were segregated forregulatory purposes. A subsidiary in the United Kingdom, a registered securities and futures firm, is subject tothe capital requirements of The Financial Services Authority of the United Kingdom. Certain other subsidiaries,including a banking subsidiary, are subject to various regulatory requirements that may limit cash dividends andadvances to Nomura and that establish minimum capital requirements. At March 31, 2002 and 2003, thesesubsidiaries were in compliance with all applicable regulatory capital adequacy requirements.
14. Investments in and transactions with affiliated companies:
Entities comprising a material portion of Nomura’s investments in affiliated companies or having a materialimpact on Nomura’s financial condition and results of operations include JAFCO Co., Ltd., Nomura ResearchInstitute, Ltd., Nomura Land and Building Co., Ltd. and Nomura Finance Co., Ltd.
JAFCO Co., Ltd. (“JAFCO”)—
JAFCO, which is a listed company in Japan, manages various venture capital funds and provides privateequity-related investment services to portfolio companies. Prior to the fiscal year ended March 31, 2000, theCompany had directly held 3.6% of the outstanding share capital of JAFCO. In February 2000, the Companyacquired an additional 3.9% equity interest in JAFCO for ¥67,399 million at quoted market prices. In March2000, the Company indirectly acquired an additional 4.8% equity interest in JAFCO through acquiring NomuraAsset Management Co., Ltd, (“NAM”), see Note 3. In February 2001, the Company acquired an additional 8.9%equity interest in JAFCO for ¥54,395 million at quoted market prices. As a result of these acquisitions, Nomuraheld 21.1% of the outstanding share capital at March 31, 2001 and adopted the equity method of accounting forthe investment in JAFCO in the consolidated financial statements. During the year ended March 31, 2002, theCompany acquired an additional 0.6% equity interest in JAFCO for a cash consideration of ¥2,122 million atquoted market prices. The unamortized balance of excess of the cost of the investments in affiliated company
F-48

NOMURA HOLDINGS
NOTES TO THE CONSOLIDATED FINANCIAL STATEMENTS—(Continued)
over JAFCO’s equity in the net assets at the dates of acquisition amounted to ¥36,356 million at March 31, 2002,and was being amortized over a 10 year period. During the year ended March 31, 2003, the Company acquired anadditional 3.6% equity interest in JAFCO from Nomura Land and Building Co., Ltd. The unamortized balance ofequity method goodwill arising from JAFCO was ¥22,184 million ($188 million) at March 31, 2003.
The valuation of Nomura’s investment in JAFCO has declined significantly. The Japanese and global capitalmarkets have slowed, limiting opportunities for financing activities and raising equity capital through initialpublic offerings. Nomura recorded impairment losses of ¥92,441 million and ¥21,165 million ($179 million)related to the write-down of its investment in JAFCO for the years ended March 31, 2002 and 2003, respectively,because these losses in value of the investment were other than temporary decline. The losses were included inNon-interest expenses—Other on the accompanying consolidated income statements.
Nomura Research Institute, Ltd. (“NRI”)—
NRI undertakes domestic and overseas economic research and also develops and maintains computernetworks. One of the major customers of NRI is Nomura. Prior to the fiscal year ended March 31, 2000, theCompany had directly held 5.0% of the outstanding share capital of NRI. In March 2000, the Company indirectlyacquired an additional 20.2% equity interest in NRI through acquiring NAM (see Note 3). As a result, Nomuraheld 25.2% of the outstanding share capital since March 31, 2000 and adopted the equity method of accountingfor the investment in NRI in the consolidated financial statements.
NRI was listed on the First Section of the Tokyo Stock Exchange on December 17, 2001 and completed aninitial public offering and issued 2 million shares of common stock to third parties at a price of ¥11,000 pershare. Nomura recognized a pretax gain of ¥3,504 million, due to the offering price exceeding Nomura’s carryingvalue per share, for the year ended March 31, 2002. As a result of this issuance, Nomura’s equity interest in NRIdeclined from 25.2% to 24.1%. The unamortized balance of excess of the cost of the investments in affiliatedcompany over NRI’s equity in the net assets at the dates of acquisition amounted to ¥10,284 million at March 31,2002, and was being amortized over a 10 year period.
During the year ended March 31, 2003, the Company acquired an additional 1.0% equity interest in NRIfrom Nomura Land and Building Co., Ltd. The unamortized balance of equity method goodwill arising from NRIwas ¥13,059 million ($111 million) at March 31, 2003.
Nomura Land and Building Co., Ltd. (“NLB”)—
NLB owns a substantial portion of Nomura’s leased office space in Japan. The lease transactions withNomura are disclosed in Note 15. Prior to the fiscal year ended March 31, 2000, the Company had directly held5.0% of the outstanding share capital of NLB. In March 2000, the Company indirectly acquired an additional19.9% equity interest in NLB through acquiring NAM (see Note 3). As a result, Nomura held 24.9% of theoutstanding share capital since March 31, 2000 and adopted the equity method of accounting for the investmentin NLB in the consolidated financial statements. During the year ended March 31, 2003, the Company acquiredan additional 4.4% equity interest in NLB from a financial institution for cash consideration of ¥102 million ($1million). The excess of the cost of the investments in NLB over Nomura’s equity in NLB’s net assets isimmaterial.
Nomura Finance Co., Ltd. (“NFC”)—
The Company and NAM, a consolidated subsidiary, had held 14.8% of the outstanding share capital ofNFC. NFC’s primary business was that of providing various types of collateralized loans to individuals and
F-49

NOMURA HOLDINGS
NOTES TO THE CONSOLIDATED FINANCIAL STATEMENTS—(Continued)
companies. The Company used the equity method of accounting for NFC, because the Company considered thatit had the ability to exercise influence over the operation of NFC.
In March 1999, Nomura announced its decision to provide financial assistance to NFC in its decisiverestructuring plan and to solve NFC’s non-performing loan problem. In connection with such financialassistance, Nomura recorded a special provision of ¥348,000 million for financial assistance to NFC, in theconsolidated financial statements for the year ended March 31, 1999. Under the plan, the financial assistance wasundertaken in the form of cash transfer, of ¥272,800 million and ¥59,000 million for the years ended March 31,2000 and 2001, respectively. Nomura recognized through the recording of the provision its participation in thelosses of NFC, at the time such loss occurred.
On December 4, 2000, the Company and NAM sold their shares of NFC to LSF Nikkei Holding, Ltd. As aconsequence of this transaction, Nomura recognized a gain on the sale of the NFC share of ¥3,452 million, andreversed the remained provision for financial assistance of ¥16,200 million, which were included in Non-interestexpenses—Other in the consolidated income statement for the year ended March 31, 2001.
A summary of balances and transactions with these affiliated companies, except for the lease transactionswith NLB, which are disclosed in Note 15, is presented below:
Millions of yen
Translationinto millionsof U.S. dollars
March 31
2002 2003 2003
Investments in affiliated companies . . . . . . . . . . . . . . . . . . . . . . . . . . . . . . . ¥124,513 ¥124,464 $1,054Advances to affiliated companies . . . . . . . . . . . . . . . . . . . . . . . . . . . . . . . . . 132,577 99,506 843
Millions of yen
Translationinto millionsof U.S. dollars
Year ended March 31
2001 2002 2003 2003
Revenues . . . . . . . . . . . . . . . . . . . . . . . . . . . . . . . . . . . . . . . . . . . . . . ¥ 4,217 ¥ 8,214 ¥ 3,592 $ 30Non-interest expenses . . . . . . . . . . . . . . . . . . . . . . . . . . . . . . . . . . . . 23,323 24,995 27,242 231Purchase of software and tangible assets . . . . . . . . . . . . . . . . . . . . . 34,527 26,013 27,946 237
Advances to affiliated companies consist mainly of loans to NLB, which amount to ¥132,550 million and¥99,500 million ($843 million), at March 31, 2002 and 2003, respectively. The interest rates of the long-termloans vary from 1.00% to 1.63% per annum, and the repayment dates will be between 2005 and 2007.
On March 31, 2001, the Company cancelled its leasehold agreement in relation to a training center buildingand incidental facilities used by Nomura. A penalty payment of ¥6,875 million was paid to NLB and charged toincome for the year ended March 31, 2001.
The aggregate carrying amount and market value of investments in affiliates for which a quoted marketprice is available are as follows:
Millions of yen
Translationinto millionsof U.S. dollars
March 31
2002 2003 2003
Carrying amount . . . . . . . . . . . . . . . . . . . . . . . . . . . . . . . . . . . . . . . . . . . . . . ¥121,843 ¥112,410 $ 952Market value . . . . . . . . . . . . . . . . . . . . . . . . . . . . . . . . . . . . . . . . . . . . . . . . . 279,284 129,111 1,094
F-50

NOMURA HOLDINGS
NOTES TO THE CONSOLIDATED FINANCIAL STATEMENTS—(Continued)
Dividends from affiliated companies accounted for by the equity method for the years ended March 31,2001, 2002, and 2003 were ¥277 million, ¥391 million and ¥504 million ($4 million), respectively.
15. Commitments, contingencies and guarantees:
Credit commitments—
In the normal course of its subsidiaries’ banking/financing activities, Nomura enters into contractualcommitments to extend credit, and underwriting commitments, which generally have a fixed expiration date. Inconnection with its investment banking activities, Nomura has entered into an agreement with a customer underwhich Nomura has committed to underwrite notes that may be issued by the customer. The outstandingcommitment under this agreement is included in Commitments to extend credit and note issuance facility.
Contractual amounts of these commitments at March 31, 2002 and 2003 were as follows:
Millions of yen
Translation intomillions of U.S.
dollars
March 31
2002 2003 2003
Commitments to extend credit and note issuance facility . . . . . . . . . . . . . . ¥138,599 ¥218,862 $1,854
At March 31, 2003, these commitments had the following expirations:
Millions of yen
Totalcontractualamount
Years to Maturity
Less than1 year
1 to 3years
4 to 5years
More than5 years
Commitments to extend credit and note issuancefacility . . . . . . . . . . . . . . . . . . . . . . . . . . . . . . . . . . . . . . ¥218,862 ¥44,663 ¥129,779 ¥1,082 ¥43,338
Translation into millions of U.S. dollars
Totalcontractualamount
Years to Maturity
Less than1 year
1 to 3years
4 to 5years
More than5 years
Commitments to extend credit and note issuance facility . . . . . $1,854 $379 $1,099 $9 $367
The contractual amounts of these commitments represent the amounts at risk should the contracts be fullydrawn upon, the customers default and the value of any existing collateral become worthless. The totalcontractual amount of these commitments may not represent future cash requirements since commitments mayexpire without being drawn upon. The credit risk associated with these commitments varies depending on thecustomers’ creditworthiness and the value of collateral held. Nomura evaluates each customer’s creditworthinesson a case-by-case basis. The amount of collateral obtained, if deemed necessary by Nomura upon extension ofcredit, is based on management’s credit evaluation of the counterparty.
Other commitments—
At March 31, 2003, Nomura has commitments to enter into resale and repurchase agreements of ¥1,957billion ($ 17 billion) and ¥3,514 billion ($30 billion), respectively.
F-51

NOMURA HOLDINGS
NOTES TO THE CONSOLIDATED FINANCIAL STATEMENTS—(Continued)
Nomura has ¥28 billion ($0.2 billion) of investment commitments in connection with its private equity andother merchant banking activities at March 31, 2003.
Leases—
Leases as lessee
Nomura leases its office space and certain employees’ residential facilities in Japan under cancelable leaseagreements which are customarily renewed upon expiration. Nomura also leases certain equipment and facilitiesunder noncancelable lease agreements. Rental expenses for the years ended March 31, 2001, 2002 and 2003 were¥46,081 million, ¥41,379 million and ¥40,678 million ($345 million), respectively. A substantial portion of suchrentals was paid to NLB, an affiliated company.
Lease deposits and rent paid to NLB were as follows:
Millions of yen
Translationinto millionsof U.S. dollars
March 31
2001 2002 2003 2003
Lease deposits . . . . . . . . . . . . . . . . . . . . . . . . . . . . . . . . . . . . . . . . . . ¥75,285 ¥55,744 ¥52,448 $444Rent paid during the year . . . . . . . . . . . . . . . . . . . . . . . . . . . . . . . . . 29,778 24,556 22,203 188
Presented below is a schedule of minimum future rentals under operating leases with initial or remainingterms exceeding one year:
Millions ofyen
Translationinto millionsof U.S. dollars
Year ending March 31 March 31, 2003
2004 . . . . . . . . . . . . . . . . . . . . . . . . . . . . . . . . . . . . . . . . . . . . . . . . . . . . . . . . . . . . . . . . . . ¥ 5,344 $ 452005 . . . . . . . . . . . . . . . . . . . . . . . . . . . . . . . . . . . . . . . . . . . . . . . . . . . . . . . . . . . . . . . . . . 4,630 392006 . . . . . . . . . . . . . . . . . . . . . . . . . . . . . . . . . . . . . . . . . . . . . . . . . . . . . . . . . . . . . . . . . . 3,694 312007 . . . . . . . . . . . . . . . . . . . . . . . . . . . . . . . . . . . . . . . . . . . . . . . . . . . . . . . . . . . . . . . . . . 3,223 282008 . . . . . . . . . . . . . . . . . . . . . . . . . . . . . . . . . . . . . . . . . . . . . . . . . . . . . . . . . . . . . . . . . . 3,448 292009 and thereafter . . . . . . . . . . . . . . . . . . . . . . . . . . . . . . . . . . . . . . . . . . . . . . . . . . . . . . 13,930 118
Total minimum lease payments . . . . . . . . . . . . . . . . . . . . . . . . . . . . . . . . . . . . . . . . 34,269 290Sub lease income . . . . . . . . . . . . . . . . . . . . . . . . . . . . . . . . . . . . . . . . . . . . . . . . . . . . 3,492 29
Net minimum lease payments . . . . . . . . . . . . . . . . . . . . . . . . . . . . . . . . . . . . . . ¥30,777 $261
Certain leases contain renewal options or escalation clauses providing for increased rental payments basedupon maintenance, utility, and tax increases.
Guarantees—
In November 2002, the FASB issued FIN No. 45. FIN No. 45 specifies the disclosures to be made aboutobligations under certain issued guarantees and requires a liability to be recognized for the fair value of a
F-52

NOMURA HOLDINGS
NOTES TO THE CONSOLIDATED FINANCIAL STATEMENTS—(Continued)
guarantee obligation. The recognition and measurement provisions of the interpretation apply prospectively toguarantees issued or amended after December 31, 2002. The disclosure provisions are effective with Nomura’syear ended March 31, 2003.
Nomura enters into, in the normal course of its subsidiaries’ banking/financing activities, various guaranteearrangements with counterparties in the form of standby letters of credit and other guarantees, which generallyhave a fixed expiration date.
In addition, Nomura enters into certain derivative contracts that meet the FIN No. 45 definition ofguarantees. FIN No. 45 defines guarantees to include derivative contracts that contingently require a guarantor tomake payment to a guaranteed party based on changes in an underlying that relate to an asset, liability or equitysecurity of a guaranteed party. These derivative contracts include certain written options and credit defaultswaps. Because Nomura does not track whether its clients enter into these derivative contracts for speculative orhedging purposes, Nomura has disclosed information about derivative contracts that could meet the FIN No. 45definition of guarantees.
For information about the maximum potential amount of future payments that Nomura could be required tomake under certain derivatives, the notional amount of contracts has been disclosed. However, the maximumpotential payout for certain derivative contracts, such as written interest rate caps and written currency options,cannot be estimated, as increases in interest or foreign exchange rates in the future could be theoreticallyunlimited.
Nomura records all derivative contracts at fair value on its consolidated balance sheets. Nomura does notmonitor its risk exposure to such derivative contracts based on notional amounts, rather Nomura manages its riskexposure on a fair value basis. Overall risk limits have been established and the extent of risk exposure isroutinely monitored against these limits. Nomura believes the notional amounts generally overstate its riskexposure.
The following table sets forth information about Nomura’s derivative contracts that could meet thedefinition of a guarantee and certain other guarantees as of March 31, 2003:
Millions of yen
Maximum Potential Payout/Notional
Carryingvalue
Years to Maturity
TotalLess than1 year 1 to 3 years 4 to 5 years
More than5 years
Derivative contracts . . . . . . . . . . . . ¥193,140 ¥6,898,950 ¥2,327,488 ¥2,262,152 ¥1,327,068 ¥982,242Standby letters of credit and otherguarantees(1) . . . . . . . . . . . . . . . . ¥ 11 ¥ 49,449 ¥ 49,209 — — ¥ 240
(1) Collateral held in connection with standby letters of credit and other guarantees was ¥255 million ($2million) as of March 31, 2003.
Translation into million of U.S. dollars
Maximum Potential Payout/Notional
Carryingvalue
Years to Maturity
TotalLess than1 year
1 to 3years
4 to 5years
More than5 years
Derivative contracts . . . . . . . . . . . . . . . . . . . . . . . $1,636 $58,431 $19,713 $19,159 $11,240 $8,319Standby letters of credit and other guarantees . . . $ 0 $ 419 $ 417 — — $ 2
F-53

NOMURA HOLDINGS
NOTES TO THE CONSOLIDATED FINANCIAL STATEMENTS—(Continued)
Litigation—
In the normal course of its business, Nomura is involved in lawsuits and other legal proceedings and, as aresult of such activities, is subject to ongoing legal risk. The management of Nomura believes that the ultimateresolution of such litigation will not be material to the financial statements.
September 11—
On September 11, 2001 terrorist attacks took place in New York City and Washington, D.C. The attack inNew York City caused the destruction of the World Trade Center and also damaged buildings in the surroundingarea, including the World Financial Center, the headquarters of Nomura’s North American operations. Itsapproximately 850 employees who work in the World Financial Center were relocated to its contingency sites,whereby operations were restored and maintained until its reoccupation of its restored facilities in the WorldFinancial Center in March 2002.
Nomura recorded a non-recurring charge related to the events of September 11. This charge included costsassociated with writing-off the destroyed and damaged property, costs incurred to clean and restore its officefacilities and costs incurred to maintain the World Financial Center facility while it was unoccupied. Costsassociated with operating the contingency sites are included in Occupancy and related depreciation in theconsolidated income statements. Additionally, Nomura purchased replacement equipment that has beencapitalized and will be depreciated over its future economic life, resulting in increased future depreciationexpense.
Nomura has received a total of ¥5,311 million ($45 million) of insurance recoveries by March 31, 2003. Thefinal insurance settlement was completed and no more recoveries will be received going forward. The net effectto the consolidated financial statements was immaterial.
16. Segment information:
Operating segments—
Nomura reports its results in three distinct core segments: Domestic Retail, Global Wholesale, and AssetManagement. Nomura structures its business segments based upon the nature of specific products and services,its main customer base and its management structure.
The accounting policies for segment information materially follow US GAAP, except as described below:
• The impact of unrealized gains/losses on long-term investments in equity securities held for relationshippurposes, which under US GAAP is included in net income, is excluded from segment information.
• Investments in the PFG entities and other private equity investee companies are treated as private equitypositions for management reporting purposes, as management views these entities not as operatingsubsidiaries but as investments held for ultimate sale and the realization of capital gains. Any changes inmanagement’s estimate of fair value of these investments are included in the non-interest revenue lineunder Global Wholesale. For the years ended March 31, 2001, 2002 (PFG entities only through March27, 2002) and 2003, these investments were not shown at fair value, but were consolidated at historicalcost under US GAAP. The impact of consolidating the PFG entities and other private equity investeecompanies, and the impact of deconsolidating PFG on March 27, 2002, including the elimination impactunder US GAAP, is excluded from the segment information and described in the reconciliation table.
Revenues and expenses directly associated with each business segment are included in determining theiroperating results. Revenues and expenses that are not directly attributable to a particular segment are allocated to
F-54

NOMURA HOLDINGS
NOTES TO THE CONSOLIDATED FINANCIAL STATEMENTS—(Continued)
each business segment or included in “Other” based upon Nomura’s allocation methodologies as used bymanagement to assess each segment’s performance.
Nomura introduced certain methodologies to allocate Headquarters expenses to the three business segmentseffective April 1, 2002. Several global Headquarters accounts were created and Nomura allocated expenses fromthese accounts to business segments according to benefits received by each business segment. This allocation ofHeadquarters expenses was made to improve segment reporting and includes items not previously allocated. HadNomura not applied the current allocation methodologies for the year ended March 31, 2003, income beforeincome taxes for Domestic Retail, Global Wholesale and Asset Management would have been ¥42,758 million($362 million), ¥99,734 million ($845 million) and ¥3,883 million ($33 million), respectively.
Business segments’ results for the years ended March 31, 2001, 2002 and 2003 are shown in the followingtable. Business segments’ information on total assets is not disclosed because management does not utilize suchinformation for its operating decisions and therefore, it is not reported to management.
Millions of yen
DomesticRetail
GlobalWholesale
AssetManagement
Other(Inc. elimination) Total
Year ended March 31, 2001Non-interest revenue . . . . . . . . . . . . . . . . . . . . . ¥260,193 ¥487,644 ¥58,237 ¥ (5,036) ¥801,038Net interest revenue . . . . . . . . . . . . . . . . . . . . . 6,236 (24,839) 1,810 21,510 4,717
Net revenue . . . . . . . . . . . . . . . . . . . . . . . . . . . . 266,429 462,805 60,047 16,474 805,755Non-interest expenses . . . . . . . . . . . . . . . . . . . . 215,638 210,062 39,537 76,929 542,166
Income (loss) before income taxes . . . . . . . . . . ¥ 50,791 ¥252,743 ¥20,510 ¥ (60,455) ¥263,589
Year ended March 31, 2002Non-interest revenue . . . . . . . . . . . . . . . . . . . . . ¥226,156 ¥385,430 ¥46,840 ¥ 11,171 ¥669,597Net interest revenue . . . . . . . . . . . . . . . . . . . . . 2,949 54,505 367 14,422 72,243
Net revenue . . . . . . . . . . . . . . . . . . . . . . . . . . . . 229,105 439,935 47,207 25,593 741,840Non-interest expenses . . . . . . . . . . . . . . . . . . . . 208,621 248,657 37,031 168,990 663,299
Income (loss) before income taxes . . . . . . . . . . ¥ 20,484 ¥191,278 ¥10,176 ¥(143,397) ¥ 78,541
Year ended March 31, 2003Non-interest revenue . . . . . . . . . . . . . . . . . . . . . ¥246,938 ¥196,675 ¥34,828 ¥ (2,966) ¥475,475Net interest revenue . . . . . . . . . . . . . . . . . . . . . 2,313 101,794 2,232 20,939 127,278
Net revenue . . . . . . . . . . . . . . . . . . . . . . . . . . . . 249,251 298,469 37,060 17,973 602,753Non-interest expenses . . . . . . . . . . . . . . . . . . . . 213,562 207,436 33,866 58,678 513,542
Income (loss) before income taxes . . . . . . . . . . ¥ 35,689 ¥ 91,033 ¥ 3,194 ¥ (40,705) ¥ 89,211
Translation into millions of U.S. dollars
Year ended March 31, 2003Non-interest revenue . . . . . . . . . . . . . . . . . . . . . $ 2,091 $ 1,666 $ 295 $ (25) $ 4,027Net interest revenue . . . . . . . . . . . . . . . . . . . . . 20 862 19 177 1,078
Net revenue . . . . . . . . . . . . . . . . . . . . . . . . . . . . 2,111 2,528 314 152 5,105Non-interest expenses . . . . . . . . . . . . . . . . . . . . 1,808 1,757 287 497 4,349
Income (loss) before income taxes . . . . . . . . . . $ 303 $ 771 $ 27 $ (345) $ 756
F-55

NOMURA HOLDINGS
NOTES TO THE CONSOLIDATED FINANCIAL STATEMENTS—(Continued)
Transactions between operating segments are recorded within segment results on commercial terms andconditions and are eliminated in the “Other” column.
The following table presents the major components of income/(loss) before income taxes in “Other.”
Millions of yen
Translationinto
millions ofU.S. dollars
Year ended March 31
2001 2002 2003 2003
Gain on undesignated hedging instruments included in Net gainon trading . . . . . . . . . . . . . . . . . . . . . . . . . . . . . . . . . . . . . . . . . . ¥ 7,877 ¥ 31,435 ¥ 2,065 $ 17
(Loss)/gain on investment securities . . . . . . . . . . . . . . . . . . . . . . . (4,404) 218 (561) (5)Equity in losses of affiliates . . . . . . . . . . . . . . . . . . . . . . . . . . . . . . (21,635) (9,551) (3,842) (33)Amortization of goodwill and negative goodwill . . . . . . . . . . . . . 13,040 13,316 — —Corporate items . . . . . . . . . . . . . . . . . . . . . . . . . . . . . . . . . . . . . . . (30,643) (41,730) (9,356) (79)Impairment loss on investment in an affiliated company . . . . . . . — (92,441) (21,165) (179)Impairment loss on long-lived assets . . . . . . . . . . . . . . . . . . . . . . . (25,232) (5,321) (305) (3)Multi-employer pension plan . . . . . . . . . . . . . . . . . . . . . . . . . . . . . — (18,720) — —Gain from changes in equity of an affiliated company . . . . . . . . . — 3,504 — —Others . . . . . . . . . . . . . . . . . . . . . . . . . . . . . . . . . . . . . . . . . . . . . . . 542 (24,107) (7,541) (63)
Total . . . . . . . . . . . . . . . . . . . . . . . . . . . . . . . . . . . . . . . . . . . . . . . . ¥(60,455) ¥(143,397) ¥(40,705) $(345)
The table below presents reconciliation of the combined business segments’ results included in thepreceding table to Nomura’s reported net revenue and income before income taxes and cumulative effect ofaccounting change in the consolidated income statements.
Millions of yen
Translationinto
millions ofU.S. dollars
Year ended March 31
2001 2002 2003 2003
Net revenue . . . . . . . . . . . . . . . . . . . . . . . . . . . . . . . . . . . . . . . . . ¥805,755 ¥ 741,840 ¥602,753 $5,105Unrealized loss on investments in equity securities held forrelationship purpose . . . . . . . . . . . . . . . . . . . . . . . . . . . . . . . . (87,390) (60,177) (43,017) (364)
Effect of consolidation/deconsolidation of the PFG entities andother private equity investee companies . . . . . . . . . . . . . . . . . 197,290 639,688 6,538 55
Consolidated net revenue . . . . . . . . . . . . . . . . . . . . . . . . . . . . . . ¥915,655 ¥1,321,351 ¥566,274 $4,796
Income before income taxes . . . . . . . . . . . . . . . . . . . . . . . . . . . . ¥263,589 ¥ 78,541 ¥ 89,211 $ 756Unrealized loss on investments in equity securities held forrelationship purpose . . . . . . . . . . . . . . . . . . . . . . . . . . . . . . . . (87,390) (60,177) (43,017) (364)
Effect of consolidation/deconsolidation of the PFG entities andother private equity investee companies . . . . . . . . . . . . . . . . . (20,027) 154,608 1,215 10
Consolidated income before income taxes and cumulativeeffect of accounting change . . . . . . . . . . . . . . . . . . . . . . . . . . . ¥156,172 ¥ 172,972 ¥ 47,409 $ 402
F-56

NOMURA HOLDINGS
NOTES TO THE CONSOLIDATED FINANCIAL STATEMENTS—(Continued)
Geographic Information—
In general, Nomura’s identifiable assets, revenues and expenses are allocated based on the country ofdomicile of the legal entity providing the service. However, because of the integration of the global capitalmarkets and the corresponding globalization of Nomura’s activities and services, it is not always possible tomake a precise separation by location. As a result, various assumptions, which are consistent among years, havebeen made in presenting the following geographic data.
The table below presents a geographic allocation of net revenue and income (loss) before income taxes andcumulative effect of accounting change from operations by geographic areas, and long-lived assets associatedwith Nomura’s operations. Net revenue in “Americas” and “Europe” substantially represents Nomura’soperations in the United States and the United Kingdom, respectively.
Millions of yen
Translationinto
millions ofU.S. dollars
Year ended March 31
2001 2002 2003 2003
Net revenue:Americas . . . . . . . . . . . . . . . . . . . . . . . . . . . . . . . . . . . . . . . . . . . ¥ 61,357 ¥ 20,772 ¥ 58,019 $ 491Europe . . . . . . . . . . . . . . . . . . . . . . . . . . . . . . . . . . . . . . . . . . . . . 295,540 845,775 47,872 406Asia and Oceania . . . . . . . . . . . . . . . . . . . . . . . . . . . . . . . . . . . . . 9,649 10,629 8,902 75
Sub-total . . . . . . . . . . . . . . . . . . . . . . . . . . . . . . . . . . . . . . . 366,546 877,176 114,793 972Japan . . . . . . . . . . . . . . . . . . . . . . . . . . . . . . . . . . . . . . . . . . . . . . 549,109 444,175 451,481 3,824
Consolidated . . . . . . . . . . . . . . . . . . . . . . . . . . . . . . . . . . . . . . . . ¥915,655 ¥1,321,351 ¥566,274 $4,796
Income (loss) before income taxes and cumulative effect ofaccounting change:
Americas . . . . . . . . . . . . . . . . . . . . . . . . . . . . . . . . . . . . . . . . . . . ¥ 4,084 ¥ (40,156) ¥ 14,851 $ 126Europe . . . . . . . . . . . . . . . . . . . . . . . . . . . . . . . . . . . . . . . . . . . . . (12,757) 225,002 (34,314) (291)Asia and Oceania . . . . . . . . . . . . . . . . . . . . . . . . . . . . . . . . . . . . . (11,045) (9,906) (10,026) (85)
Sub-total . . . . . . . . . . . . . . . . . . . . . . . . . . . . . . . . . . . . . . . (19,718) 174,940 (29,489) (250)Japan . . . . . . . . . . . . . . . . . . . . . . . . . . . . . . . . . . . . . . . . . . . . . . 175,890 (1,968) 76,898 652
Consolidated . . . . . . . . . . . . . . . . . . . . . . . . . . . . . . . . . . . . . . . . ¥156,172 ¥ 172,972 ¥ 47,409 $ 402
F-57
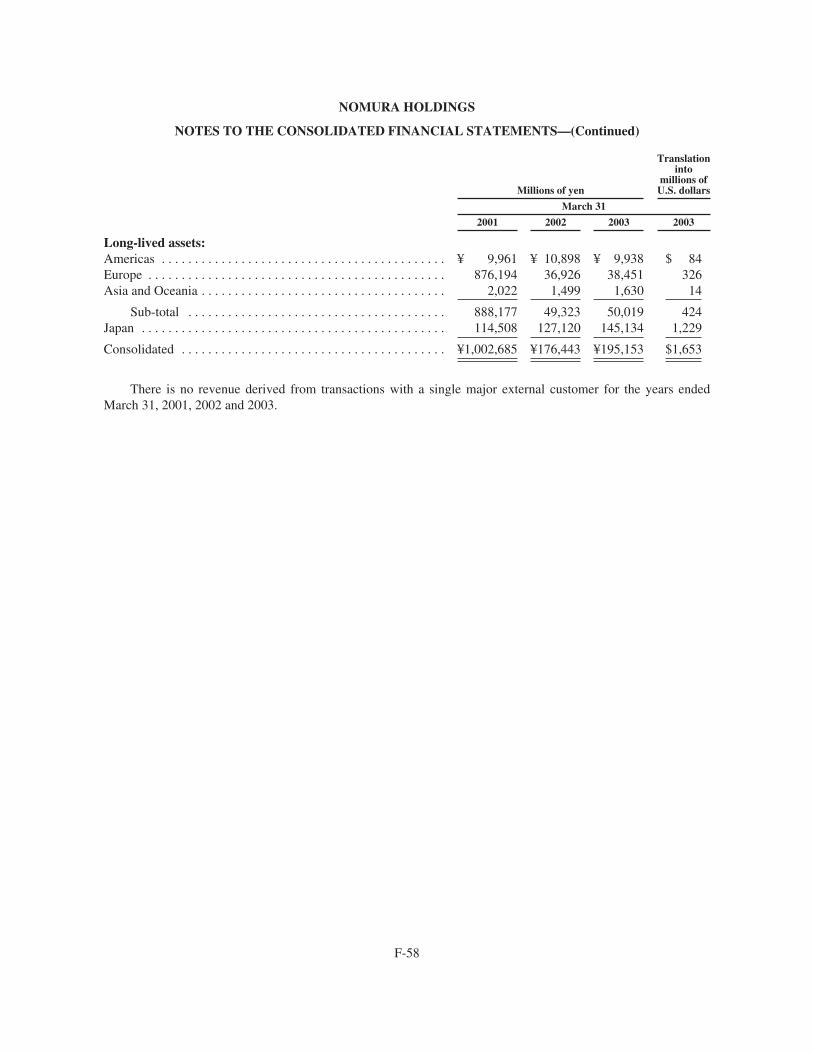
NOMURA HOLDINGS
NOTES TO THE CONSOLIDATED FINANCIAL STATEMENTS—(Continued)
Millions of yen
Translationinto
millions ofU.S. dollars
March 31
2001 2002 2003 2003
Long-lived assets:Americas . . . . . . . . . . . . . . . . . . . . . . . . . . . . . . . . . . . . . . . . . . . ¥ 9,961 ¥ 10,898 ¥ 9,938 $ 84Europe . . . . . . . . . . . . . . . . . . . . . . . . . . . . . . . . . . . . . . . . . . . . . 876,194 36,926 38,451 326Asia and Oceania . . . . . . . . . . . . . . . . . . . . . . . . . . . . . . . . . . . . . 2,022 1,499 1,630 14
Sub-total . . . . . . . . . . . . . . . . . . . . . . . . . . . . . . . . . . . . . . . 888,177 49,323 50,019 424Japan . . . . . . . . . . . . . . . . . . . . . . . . . . . . . . . . . . . . . . . . . . . . . . 114,508 127,120 145,134 1,229
Consolidated . . . . . . . . . . . . . . . . . . . . . . . . . . . . . . . . . . . . . . . . ¥1,002,685 ¥176,443 ¥195,153 $1,653
There is no revenue derived from transactions with a single major external customer for the years endedMarch 31, 2001, 2002 and 2003.
F-58

SIGNATURES
The registrant hereby certifies that it meets all of the requirements for filing on Form 20-F and that it hasduly caused and authorized the undersigned to sign this annual report on its behalf.
NOMURA HOLDINGS, INC.
By: /s/ NOBUYUKI KOGA
Name: Nobuyuki KogaTitle: President and Chief Executive Officer
Date: June 26, 2003

Certification
I, Nobuyuki Koga, certify that:
1. I have reviewed this annual report on Form 20-F of Nomura Holdings, Inc.;
2. Based on my knowledge, this annual report does not contain any untrue statement of a material fact or omitto state a material fact necessary to make the statements made, in light of the circumstances under whichsuch statements were made, not misleading with respect to the period covered by this annual report;
3. Based on my knowledge, the financial statements, and other financial information included in this annualreport, fairly present in all material respects the financial condition, results of operations and cash flows ofthe registrant as of, and for, the periods presented in this annual report;
4. The registrant’s other certifying officer and I are responsible for establishing and maintaining disclosurecontrols and procedures (as defined in Exchange Act Rules 13a-14 and 15d-14) for the registrant and have:
a) designed such disclosure controls and procedures to ensure that material information relating to theregistrant, including its consolidated subsidiaries, is made known to us by others within those entities,particularly during the period in which this annual report is being prepared;
b) evaluated the effectiveness of the registrant’s disclosure controls and procedures as of a date within 90days prior to the filing date of this annual report (the “Evaluation Date”); and
c) presented in this annual report our conclusions about the effectiveness of the disclosure controls andprocedures based on our evaluation as of the Evaluation Date;
5. The registrant’s other certifying officer and I have disclosed, based on our most recent evaluation, to theregistrant’s auditors and the audit committee of registrant’s board of directors (or persons performing theequivalent function):
a) all significant deficiencies in the design or operation of internal controls which could adversely affectthe registrant’s ability to record, process, summarize and report financial data and have identified forthe registrant’s auditors any material weaknesses in internal controls; and
b) any fraud, whether or not material, that involves management or other employees who have asignificant role in the registrant’s internal controls; and
6. The registrant’s other certifying officer and I have indicated in this annual report whether or not there weresignificant changes in internal controls or in other factors that could significantly affect internal controlssubsequent to the date of our most recent evaluation, including any corrective actions with regard tosignificant deficiencies and material weaknesses.
Date: June 26, 2003
/s/ NOBUYUKI KOGA
Nobuyuki KogaPresident and Chief Executive Officer

Certification
I, Akira Maruyama, certify that:
1. I have reviewed this annual report on Form 20-F of Nomura Holdings, Inc.;
2. Based on my knowledge, this annual report does not contain any untrue statement of a material fact or omitto state a material fact necessary to make the statements made, in light of the circumstances under whichsuch statements were made, not misleading with respect to the period covered by this annual report;
3. Based on my knowledge, the financial statements, and other financial information included in this annualreport, fairly present in all material respects the financial condition, results of operations and cash flows ofthe registrant as of, and for, the periods presented in this annual report;
4. The registrant’s other certifying officer and I are responsible for establishing and maintaining disclosurecontrols and procedures (as defined in Exchange Act Rules 13a-14 and 15d-14) for the registrant and have:
a) designed such disclosure controls and procedures to ensure that material information relating to theregistrant, including its consolidated subsidiaries, is made known to us by others within those entities,particularly during the period in which this annual report is being prepared;
b) evaluated the effectiveness of the registrant’s disclosure controls and procedures as of a date within 90days prior to the filing date of this annual report (the “Evaluation Date”); and
c) presented in this annual report our conclusions about the effectiveness of the disclosure controls andprocedures based on our evaluation as of the Evaluation Date;
5. The registrant’s other certifying officer and I have disclosed, based on our most recent evaluation, to theregistrant’s auditors and the audit committee of registrant’s board of directors (or persons performing theequivalent function):
a) all significant deficiencies in the design or operation of internal controls which could adversely affectthe registrant’s ability to record, process, summarize and report financial data and have identified forthe registrant’s auditors any material weaknesses in internal controls; and
b) any fraud, whether or not material, that involves management or other employees who have asignificant role in the registrant’s internal controls; and
6. The registrant’s other certifying officer and I have indicated in this annual report whether or not there weresignificant changes in internal controls or in other factors that could significantly affect internal controlssubsequent to the date of our most recent evaluation, including any corrective actions with regard tosignificant deficiencies and material weaknesses.
Date: June 26, 2003
/s/ AKIRA MARUYAMA
Akira MaruyamaSenior Managing Director and Chief Financial Officer
INDEX OF EXHIBITS
ExhibitNumber Description
1.1 Articles of Incorporation of the registrant (English translation)
1.2 Share Handling Regulations of the registrant (English translation)
1.3 Regulations of the Board of Directors of the registrant (English translation)
1.4 Regulations of the Nomination Committee (English translation)
1.5 Regulations of the Audit Committee (English translation)
1.6 Regulations of the Compensation Committee (English translation)
1.7 Liabilities Limitation Agreement (English translation) (*)
2.1 Specimen common stock certificates of the registrant (English translation)
2.2 Form of Deposit Agreement among the registrant, The Bank of New York as Depositary and all ownersand holders from time to time of American Depositary Receipts, including the form of AmericanDepositary Receipt (incorporated by reference to the Registration Statement on Form F-6 (File No.333-14178) filed on December 10, 2001)
8.1 Subsidiaries of the registrant
(*) Nomura and each of Masaharu Shibata, Hideaki Kubori, Haruo Tsuji and Koji Tajika entered into aLiabilities Limitation Agreement, dated June 26, 2003, in the form of this exhibit.


![[RTF]d1lge852tjjqow.cloudfront.netd1lge852tjjqow.cloudfront.net/CIK-0001095052/70d22d88-6c...The selected financial data should be read in conjunction with the financial statements](https://static.fdocuments.net/doc/165x107/5b054b2f7f8b9ae9628b74fb/rtf-selected-financial-data-should-be-read-in-conjunction-with-the-financial-statements.jpg)


