SECURITIES AND EXCHANGE COMMISSIONpdf.secdatabase.com/1862/0001193125-12-078137.pdfSecurities and...
313
Business Address 9705 PATUXENT WOODS DRIVE COLUMBIA MD 21046 410-312-8000 Mailing Address 9705 PATUXENT WOODS DRIVE COLUMBIA MD 21046 SECURITIES AND EXCHANGE COMMISSION FORM 10-K Annual report pursuant to section 13 and 15(d) Filing Date: 2012-02-24 | Period of Report: 2011-12-31 SEC Accession No. 0001193125-12-078137 (HTML Version on secdatabase.com) FILER ARBITRON INC CIK:109758| IRS No.: 520278528 | State of Incorp.:DE | Fiscal Year End: 1231 Type: 10-K | Act: 34 | File No.: 001-01969 | Film No.: 12638373 SIC: 8700 Engineering, accounting, research, management Copyright © 2014 www.secdatabase.com . All Rights Reserved. Please Consider the Environment Before Printing This Document
Transcript of SECURITIES AND EXCHANGE COMMISSIONpdf.secdatabase.com/1862/0001193125-12-078137.pdfSecurities and...
Business Address9705 PATUXENT WOODSDRIVECOLUMBIA MD 21046410-312-8000
Mailing Address9705 PATUXENT WOODSDRIVECOLUMBIA MD 21046
SECURITIES AND EXCHANGE COMMISSION
FORM 10-KAnnual report pursuant to section 13 and 15(d)
Filing Date: 2012-02-24 | Period of Report: 2011-12-31SEC Accession No. 0001193125-12-078137
(HTML Version on secdatabase.com)
FILERARBITRON INCCIK:109758| IRS No.: 520278528 | State of Incorp.:DE | Fiscal Year End: 1231Type: 10-K | Act: 34 | File No.: 001-01969 | Film No.: 12638373SIC: 8700 Engineering, accounting, research, management
Copyright © 2014 www.secdatabase.com. All Rights Reserved.Please Consider the Environment Before Printing This Document

Table of Contents
UNITED STATESSECURITIES AND EXCHANGE COMMISSION
Washington, DC 20549
FORM 10-Kx Annual Report Pursuant to Section 13 or 15(d) of the Securities Exchange Act of 1934
For the fiscal year ended December 31, 2011or
¨ Transition Report Pursuant to Section 13 or 15(d) of the Securities Exchange Act of 1934For the transition period from to
Commission file number: 1-1969
Arbitron Inc.(Exact name of registrant as specified in Its Charter)
Delaware 52-0278528(State or other jurisdiction of
incorporation or organization)
(I.R.S. Employer
Identification No.)
9705 Patuxent Woods DriveColumbia, Maryland 21046
(Address of principal executive offices) (Zip Code)
(410) 312-8000(Registrant��s telephone number, including area code)
Securities registered pursuant to Section 12(b) of the Act:Title of Each Class Registered Name of Each Exchange on Which Registered
Common Stock, par value $0.50 per share New York Stock Exchange
Securities registered pursuant to Section 12(g) of the Act:None
Indicate by check mark if the registrant is a well-known seasoned issuer, as defined in Rule 405 of the SecuritiesAct. Yes x No ¨
Indicate by check mark if the registrant is not required to file reports pursuant to Section 13 or Section 15(d) of theAct. Yes ¨ No x
Indicate by check mark whether the registrant (1) has filed all reports required to be filed by Section 13 or 15(d) of the SecuritiesExchange Act of 1934 during the preceding 12 months (or for such shorter period than the registrant was required to file such reports),and (2) has been subject to such filing requirements for the past 90 days. Yes x No ¨
Copyright © 2013 www.secdatabase.com. All Rights Reserved.Please Consider the Environment Before Printing This Document

Indicate by check mark whether the registrant has submitted electronically and posted on its corporate Web site, if any, everyInteractive Data File required to be submitted and posted pursuant to Rule 405 of Regulation S-T (§ 232.405 of this chapter) during thepreceding 12 months (or for such shorter period that the registrant was required to submit and post such files). Yes x No ¨
Indicate by check mark if disclosure of delinquent filers pursuant to Item 405 of Regulation S-K is not contained herein, and willnot be contained, to the best of registrant�s knowledge, in definitive proxy or information statements incorporated by reference inPart III of this Form 10-K or any amendment to this Form 10-K. x
Indicate by check mark whether the registrant is a large accelerated filer, an accelerated filer, a non-accelerated filer, or a smallerreporting company. See the definitions of �large accelerated filer,� �accelerated filer� and �smaller reporting company� in Rule 12b-2of the Exchange Act. (Check one):
Large accelerated filer x Accelerated filer ¨
Non-accelerated filer ¨ (Do not check if a smaller reporting company) Smaller reporting company ¨
Indicate by check mark whether the registrant is a shell company (as defined in Rule 12b-2 of the ExchangeAct). Yes ¨ No x
The aggregate market value of the registrant�s common stock as of June 30, 2011, the last business day of the registrant�s mostrecently completed second fiscal quarter (based upon the closing sale price of Arbitron�s common stock as reported by the New YorkStock Exchange on that date), held by nonaffiliates, was $1,114,729,697.86.
The number of shares outstanding of the registrant�s common stock, par value $0.50 per share, as of the latest practicable date,February 17, 2012: 27,310,588 shares.
DOCUMENTS INCORPORATED BY REFERENCE
Part III incorporates certain information by reference from the registrant�s definitive proxy statement for the 2012 annual meetingof stockholders, which proxy statement will be filed no later than 120 days after the end of the registrant�s fiscal year endedDecember 31, 2011.
Copyright © 2013 www.secdatabase.com. All Rights Reserved.Please Consider the Environment Before Printing This Document

Table of ContentsTABLE OF CONTENTS
Page No.
FORWARD-LOOKING STATEMENTS 4PART I
ITEM 1. BUSINESS 5Overview 5Corporate Strategy 6Industry Background and Markets 6Portable People Meter Technology 7Syndicated Radio Ratings Services 8Other Media Services 10Local Market Qualitative Consumer Information Services 11Data and Software Services 12International Operations 13Customers, Sales and Marketing 13Competition 14Intellectual Property 15Research and Development 16Governmental Regulation 16Media Rating Council Accreditation 16Employees 17Seasonality 17Privacy and Data Security 19Available Information 19
ITEM 1A. RISK FACTORS 19Risk Factors Relating to Our Business and the Industry in Which We Operate 19Risk Factors Relating to Our Indebtedness 29Risk Factors Relating to Owning Our Common Stock 30
ITEM 1B. UNRESOLVED STAFF COMMENTS 31ITEM 2. PROPERTIES 31ITEM 3. LEGAL PROCEEDINGS 31ITEM 4. MINE SAFETY DISCLOSURE 32
PART IIITEM 5. MARKET FOR REGISTRANT��S COMMON EQUITY, RELATED STOCKHOLDER MATTERS
AND ISSUER PURCHASES OF EQUITY SECURITIES 32ITEM 6. SELECTED FINANCIAL DATA 32ITEM 7. MANAGEMENT��S DISCUSSION AND ANALYSIS OF FINANCIAL CONDITION AND
RESULTS OF OPERATIONS 33Overview 33Zokem Oy 34Credit Facility 34General Economic Conditions 34Critical Accounting Policies and Estimates 35Results of Operations 36Liquidity and Capital Resources 39Off-Balance Sheet Arrangements 43New Accounting Pronouncements 43
Copyright © 2013 www.secdatabase.com. All Rights Reserved.Please Consider the Environment Before Printing This Document
ITEM 7A. QUANTITATIVE AND QUALITATIVE DISCLOSURES ABOUT MARKET RISK 44ITEM 8. FINANCIAL STATEMENTS AND SUPPLEMENTARY DATA 45ITEM 9. CHANGES IN AND DISAGREEMENTS WITH ACCOUNTANTS ON ACCOUNTING AND
FINANCIAL DISCLOSURE 84ITEM 9A. CONTROLS AND PROCEDURES 84
Evaluation of Disclosure Controls and Procedures 84Management�s Report on Internal Control Over Financial Reporting 84Changes in Internal Control Over Financial Reporting 84
ITEM 9B. OTHER INFORMATION 84PART III
ITEM 10. DIRECTORS, EXECUTIVE OFFICERS AND CORPORATE GOVERNANCE 84ITEM 11. EXECUTIVE COMPENSATION 85ITEM 12. SECURITY OWNERSHIP OF CERTAIN BENEFICIAL OWNERS AND MANAGEMENT AND
RELATED STOCKHOLDER MATTERS 85ITEM 13. CERTAIN RELATIONSHIPS AND RELATED TRANSACTIONS AND DIRECTOR
INDEPENDENCE 85ITEM 14. PRINCIPAL ACCOUNTANT FEES AND SERVICES 85
PART IVITEM 15. EXHIBITS AND FINANCIAL STATEMENT SCHEDULES 85SIGNATURES 91
2
Copyright © 2013 www.secdatabase.com. All Rights Reserved.Please Consider the Environment Before Printing This Document

Table of Contents
Arbitron owns or has the rights to various trademarks, trade names or service marks used in its radio audience ratings business andsubsidiaries, including the following: the Arbitron name and logo, ArbitrendsSM, RetailDirect®, RADAR®, TAPSCANTM, TAPSCANWORLDWIDETM, LocalMotion®, Maximi$er®, Maximi$er® Plus, Arbitron PD Advantage®, SmartPlus®, Arbitron Mobile�, ArbitronMobile IndexTM, Arbitron Mobile Trends PanelsTM, Portable People MeterTM, PPMTM, Arbitron PPMTM, Arbitron PPM®, PPM 360TM,Marketing Resources Plus®, PrintPlus®, MapMAKER DirectSM, Media ProfessionalSM, Media Professional PlusSM, QUALITAPSM,Schedule-ItSM, and Zokem�.
The trademarks Windows®, MscoreTM, Audience Reaction�, Media Monitors® and Media Rating Council® referred to in thisAnnual Report on Form 10-K are the registered trademarks of others.
3
Copyright © 2013 www.secdatabase.com. All Rights Reserved.Please Consider the Environment Before Printing This Document
Table of ContentsFORWARD-LOOKING STATEMENTS
The following discussion should be read in conjunction with our audited consolidated financial statements and the notes thereto inthis Annual Report on Form 10-K.
In this report, Arbitron Inc. and its subsidiaries may be referred to as �Arbitron,� or the �Company,� or �we,� or �us,� or �our.�
This Annual Report on Form 10-K contains forward-looking statements within the meaning of the Private Securities LitigationReform Act of 1995. The statements regarding Arbitron in this document that are not historical in nature, particularly those that utilizeterminology such as �may,� �will,� �should,� �likely,� �expects,� �intends,� �anticipates,� �estimates,� �believes,� or �plans� orcomparable terminology, are forward-looking statements based on current expectations about future events, which we have derived frominformation currently available to us. These forward-looking statements involve known and unknown risks and uncertainties that maycause our results to be materially different from results implied by such forward-looking statements. These risks and uncertaintiesinclude, in no particular order, whether we will be able to:
� successfully obtain and/or maintain Media Rating Council, Inc. (�MRC�) accreditation for our audience ratings services;
� renew contracts with key customers;
� collect, manage, and process the consumer information we utilize in our media marketing and information services incompliance with applicable data protection and privacy statutes, regulations, and other requirements;
� successfully execute and maintain our cross platform and mobile measurement initiatives;
� support our current and future services by designing, recruiting, and maintaining research samples that appropriately balancequality, size and, operational cost;
� successfully develop, implement, and fund initiatives designed to enhance sample quality;
� successfully manage costs associated with cell phone household recruitment, targeted in-person recruitment, and address-based sampling;
� successfully maintain and promote industry usage of our media and marketing information services, a critical mass ofbroadcaster encoding, and the proper understanding of our services and methodologies in light of governmental actions,including investigation, regulation, legislation or litigation, customer or industry group activism, or adverse community orpublic relations efforts;
� successfully manage the impact on our business of the current economic environment generally, and in the advertisingmarket, including, without limitation, the insolvency of any of our customers or the impact of economic environment on ourcustomers� ability to fulfill their payment obligations to us;
� successfully integrate acquired operations, including differing levels of management and internal control effectiveness at theacquired entity;
� effectively respond to rapidly changing technologies by creating proprietary systems to support our research initiatives andby developing new services that meet marketplace demands in a timely manner;
� successfully execute our business strategies, including evaluating and, where appropriate, entering into potential acquisition,joint-venture or other material third-party agreements;
� successfully develop and implement technology solutions to identify and report consumer use of new and existing forms ofmedia content and delivery, and advertising in an increasingly competitive environment; and
� compete with companies that may have financial, marketing, sales, technical or other advantages over us.
There are a number of additional important factors that could cause actual events or our actual results to differ materially fromthose indicated by such forward-looking statements, including, without limitation, the factors set forth in �Item 1A. � Risk Factors� inthis report, and other factors noted in Management�s Discussion and Analysis of Financial Condition and Results of Operations,
Copyright © 2013 www.secdatabase.com. All Rights Reserved.Please Consider the Environment Before Printing This Document

particularly those noted under �Critical Accounting Policies and Estimates,� and elsewhere, and any subsequent periodic or currentreports filed by us with the Securities and Exchange Commission.
4
Copyright © 2013 www.secdatabase.com. All Rights Reserved.Please Consider the Environment Before Printing This Document
Table of ContentsIn addition, any forward-looking statements represent our expectations only as of the day we first filed this annual report with the
Securities and Exchange Commission and should not be relied upon as representing our expectations as of any subsequent date. Whilewe may elect to update forward-looking statements at some point in the future, we specifically disclaim any obligation to do so, even ifour expectations change.
PART I
ITEM 1. BUSINESS
Arbitron Inc., a Delaware corporation, was formerly known as Ceridian Corporation (�Ceridian�). Ceridian was formed in 1957,though a predecessor began operating in 1912. We commenced our audience research business in 1949. Our principal executive officesare located at 9705 Patuxent Woods Drive, Columbia, Maryland 21046 and our telephone number is (410) 312-8000.
Overview
We are a leading media and marketing information services firm primarily serving radio, advertisers, advertising agencies, cableand broadcast television, retailers, out-of-home media, online media, mobile media, telecommunications providers, and print media. Wecurrently provide four main services:
� estimating the size and composition of radio audiences in local markets and of audiences to network radio programming andcommercials in the United States;
� estimating the size and composition of audiences to media other than radio, including mobile media, television viewed out-of-home, and content distributed on multiple platforms;
� providing qualitative information about consumers, including their lifestyles, shopping patterns, and use of media; and
� providing software to access and analyze media audience and marketing information data.
We refer to our local and network radio audience ratings services, collectively, as our �syndicated radio ratings services.� Weprovide our syndicated radio ratings services in local markets in the United States to radio broadcasters, advertising agencies, andadvertisers. Our national services estimate the size and demographic composition of national radio audiences and the size andcomposition of audiences of network radio programs and commercials. Broadcasters use our data primarily to price and sell advertisingtime, and advertising agencies and advertisers use our data in purchasing advertising time.
We offer services estimating the size and demographic composition of audiences of media other than radio, such as mobile mediaand television viewed out-of-home. We generally refer to these services, collectively, as our �other media services.� In July 2011, weacquired Zokem Oy, a Finland-based mobile audience measurement company, which we now operate as Arbitron Mobile Oy (�ArbitronMobile�). We also offer services estimating the media consumption and behavior of audiences to content distributed on multipleplatforms. We generally refer to these services, as our �cross platform services.�
In addition to the services described above, we also provide qualitative information about consumers, including their lifestyles,shopping patterns, and use of media in local markets and across the United States. Generally referred to as �qualitative services,� wemarket these services to customers of our syndicated radio ratings services who wish to demonstrate the value of their advertisingpropositions. We also market our quantitative and qualitative audience and consumer information to customers outside of our traditionalbase, such as the advertising sales organizations of local cable television companies, national cable and broadcast television networks,and out-of-home media sales organizations.
We provide software applications allowing our customers to access our proprietary databases of media and marketing information.These applications enable our customers to analyze this information more effectively for sales, management, and programmingpurposes. Some of our software applications also allow our customers to access data owned by third parties, provided the customershave a separate license to use such third-party data.
Copyright © 2013 www.secdatabase.com. All Rights Reserved.Please Consider the Environment Before Printing This Document

5
Copyright © 2013 www.secdatabase.com. All Rights Reserved.Please Consider the Environment Before Printing This Document
Table of ContentsWe have developed our electronic Arbitron Portable People MeterTM (�PPMTM�) technology, which we deploy across many of our
customer offerings and have licensed to media information services companies to use in their media audience ratings services incountries outside of the United States. See �� Syndicated Radio Ratings Services � Portable People Meter Service� below. We havecommercialized our PPM ratings service in 48 of the largest United States radio markets. We may choose to commercialize our PPMratings service in additional markets in the future. We refer to each of the 48 United States radio markets in which we havecommercialized our PPM service as a �PPM Market� and collectively, as the �PPM Markets.� For more information regarding thestatus of our MRC Accreditation, see �� Media Rating Council Accreditation� below.
Our syndicated radio ratings services have historically accounted for a substantial majority of our revenue. The syndicated radioratings services and related software represented approximately 88 percent of total revenue in each of 2011, 2010, and 2009.Approximately 77 percent of our total revenue is derived from local radio ratings services, of which approximately 74 percent is fromthe PPM Markets and 26 percent is from the Diary markets. Our revenue from domestic sources and international sources wasapproximately 98 percent and two percent of total revenue for the year ended December 31, 2011, 99 percent and one percent for theyear ended December 31, 2010, and 98 percent and two percent for the year ended December 31, 2009, respectively. Ten customersaccount for approximately 50 percent of our revenue. Additional information regarding revenues by service and by geographical area isprovided in Note 16 in the Notes to Consolidated Financial Statements contained in this Annual Report on Form 10-K.
Corporate Strategy
Our leading strategic objectives include strengthening our syndicated radio ratings business, maintaining a competitive position,and expanding our other media and cross platform services to a broader range of customers and media, including broadcast television,cable, out-of-home media, satellite radio and television, Internet, mobile, place-based and other media. Key elements of our strategy topursue these objectives include:
� Enhancing the value of our services for our radio customers. We intend to continue to invest in research and qualityenhancements while increasing utility in our radio ratings services. We plan to facilitate this by engaging with our customers,listening to and understanding their needs and requirements, and providing competitive solutions based on price, quality, andvalue.
� Leveraging our PPM technology to expand into new services. Building on our experience in the radio audience ratingsindustry, we are engaged in other media and cross platform initiatives to explore opportunities to deploy our PPM technologyto develop new information services for additional types of media and for content delivered on multiple platforms.
� Diversifying revenues. We believe growth opportunities exist in adjacent markets. We intend to work to expand ourcustomer base by developing and marketing new information services designed to assist customers in implementingmarketing strategies. We continue to explore opportunities to further license our audience measurement technologies,including internationally.
� Developing and commercializing the next-generation data collection and processing techniques. Our businesses requiresophisticated data collection and processing systems, software and other technology. In light of the dynamic nature of themedia industry, including in the digital space, we will need to continue to evolve our data collection, processing and softwaresystems.
� Deploying resources. We compete against companies that are larger and have greater capital and other resources. We willexplore and evaluate strategic opportunities to efficiently and effectively deploy our resources to better enable us to competewith such companies.
Industry Background and Markets
Since 1965, we have delivered to the radio industry timely and actionable radio audience estimates and other information based oninformation collected from a representative sample of radio listeners. The presence of independent audience estimates in the radioindustry has helped radio broadcasters to price and sell advertising time, and advertising agencies and advertisers to purchase
Copyright © 2013 www.secdatabase.com. All Rights Reserved.Please Consider the Environment Before Printing This Document

advertising time. Arbitron ratings have also become a valuable tool for use in radio programming, distribution, and schedulingdecisions.
In recent years, multiple sources of media have competed for consumers� attention. As audiences have become more fragmented,advertisers have increasingly sought to tailor their advertising strategies to target specific demographic groups through specific mediaand across multiple types of media. The audience information needs of radio broadcasters, advertising agencies, and advertisers have
6
Copyright © 2013 www.secdatabase.com. All Rights Reserved.Please Consider the Environment Before Printing This Document

Table of Contentscorrespondingly become more complex. Increased competition, including from nontraditional media, such as the Internet, and morecomplex informational requirements have heightened the desire of radio broadcasters for more frequent and timely data delivery,improved information management systems, larger sample sizes, and more sophisticated means to analyze this information. In addition,there is a continuing demand for radio and television audience information from the increasing number of commercial, noncommercial,and public broadcasters in other countries.
As the importance of reaching specific audiences with targeted marketing strategies increases, broadcasters, publishers, advertisingagencies, and advertisers increasingly require that information regarding exposure to content in advertising is provided on a moregranular basis and is coupled with more detailed information regarding lifestyles and purchasing behavior of consumers. We believe thedesire to integrate purchase data information with advertising exposure information and our ability to estimate a single consumer�scross platform advertising exposure may create future opportunities for innovative approaches to satisfy these information demands.
Portable People Meter Technology
In recent years, we have evolved our audience ratings services in the largest markets from diaries, which are completed by handand returned by mail from survey participants, to portable electronic ratings devices, which passively collect information regardingexposure of survey participants (whom we refer to as �panelists�) to encoded media without additional manual effort by the panelistsbeyond carrying the device. We have pursued this strategy to improve quality by taking advantage of new technological capabilities andto address the vast proliferation of media delivery vehicles, both inside and outside of the home. We use our PPM technology to produceradio audience estimates in 48 of the largest United States local markets and out-of-home television. Outside of radio and television, ourPPM technology can be further leveraged to measure audiences of out-of-home media, print, new digital platforms, mobile, time-shiftedbroadcasts (such as media recorded for later consumption using a DVR or similar technology), and broadcasts in retail, sports, music,and other venues.
Our proprietary PPM technology is capable of collecting data regarding panelists� exposure to encoded media for cross platformprogramming and advertising purposes including, among others, broadcast and satellite radio, broadcast, cable and satellite television,Internet, mobile, and retail in-store audio and video broadcasts. The PPM device automatically detects proprietary codes that areinaudible to the human ear, which broadcasters insert in the audio portion of their programming using technology and encoders wegenerally license to the broadcasters at no cost. We refer to the insertion of our proprietary codes into the audio portion of broadcasters�programming as �encoding� the broadcast. These proprietary codes identify the encoded media to which a panelist is exposedthroughout the day and when the panelist is exposed to it without the panelist having to engage in any recall-based manual recordingactivities. The PPM device sends the collected codes to Arbitron for tabulation and use in creating our audience estimates.
We believe there are many advantages to our PPM technology. It is simple and easy for panelists to use. It requires no buttonpushing, recall, or other effort by the panelist to identify and record media to which they are exposed. The PPM technology canpassively detect exposure to encoded media by identifying each source using our unique identification codes. We believe the PPMservice can help support the media industry�s increased focus on providing accountability for the investments made by advertisers. Ithelps to shorten the time period between when programming runs and when audience estimates are reported, and can be utilized toprovide cross platform ratings from the same panelist. The PPM technology also produces high-quality compliance data, which webelieve is an additional advantage that makes the PPM data more accountable to advertisers than various recall-based data collectionmethods, such as diaries. The PPM technology can produce more granular data than the recall-based data collection methods, includingminute by minute exposure data, which we believe can be of particular value to media programmers. Because our PPM ratings servicepanels have larger weekly and monthly samples than our Diary service, the audience estimates exhibit more stable listening trendsbetween survey reports.
We have begun executing on our plan to gradually deploy in our PPM panels our PPM 360TM device, which uses wireless cellulartechnology to transmit media exposure data without the need for panelists to dock the PPM device in a base station.
The Audience Reaction� service offered by Media Monitors, LLC (�Media Monitors�), an affiliate of Clear ChannelCommunications, Inc. (�Clear Channel�), allows Media Monitors to combine our PPM data with its airplay information to provide a
Copyright © 2013 www.secdatabase.com. All Rights Reserved.Please Consider the Environment Before Printing This Document

service designed to help radio programmers, who also license our data, hear what audio was broadcast while observing changes in theaudience estimates. Media Monitors uses minute-level data from our PPM ratings service for the MscoreTM index, which estimates howmuch a particular song aids in radio listenership retention. We receive a royalty from Media Monitors in connection with the license ofthese services.
Get-a-GRiP is a new service available to radio stations, advertisers and advertising agencies which combines our PPM radioratings with Media Monitors® commercial occurrence data to deliver a unique view on Gross Rating Point (GRP) performance,including daily point levels for radio advertising campaigns that run in the PPM Markets.
7
Copyright © 2013 www.secdatabase.com. All Rights Reserved.Please Consider the Environment Before Printing This Document

Table of ContentsSyndicated Radio Ratings Services
Challenges
In our syndicated radio services we recruit a representative survey group from a random probability sample of the market to bemeasured. We seek to ensure the selected group of persons is representative of the behaviors and characteristics of the entire populationin the applicable market and covers all of the demographic segments requested by our clients. Based on the information provided fromthe representative sample, we estimate the size and demographic composition of the radio audience in the relevant market using ourproprietary methodologies. We face a number of challenges in our syndicated radio audience ratings services. Response rates are onemeasure of our effectiveness in obtaining consent from persons to participate in our surveys and panels. Overall response rates forsurvey research, in general, have declined over the past several decades, and it has become increasingly difficult and more costly for usto obtain consent from persons to participate in our surveys and panels. We have been adversely impacted by these industry trends.Another measure often employed by users of our data to assess quality in our ratings is sample proportionality, which refers to how wellthe distribution of the group participating in any individual survey compares to the distribution of the population in the local market. Westrive to achieve a level of both response rates and sample proportionality in our surveys sufficient to maintain confidence in our ratingsand acceptance by the industry, and to support accreditation by the MRC. If response rates continue to decline or we are unable tomaintain sample proportionality in our surveys or the costs of recruitment initiatives significantly increase, our radio audience ratingsbusiness could be adversely affected.
As we have previously disclosed, over the past several years, we have engaged in dialogue and other interactions withgovernmental entities, including several state Attorneys General, the Federal Communications Commission (�FCC�), Committees ofthe U.S. House Representatives, and the PPM Coalition, a group of broadcasters and trade associations representing certain broadcastersand advertising agencies. Generally, these groups had alleged that the PPM methodology undercounts minority radio listeners andwould harm minority radio broadcasters. We have denied these allegations and while we believe our PPM methodology is valid andreliable, we have agreed with certain of these groups to implement methodological changes designed to enhance our PPM ratingsservice, including implementation of increased cell phone household recruiting, targeted in-person recruiting, and address-basedsampling.
We established internal benchmarks we strive to achieve for response rates and sample proportionality. It is more expensive for usto recruit survey participants in the manners described above as compared to our historical methods. Because we intend to continue toincrease the number of cell phone households in our samples and the level of address-based and targeted in-person recruiting, we expectthe expenditures required to support these methods will be material. We currently anticipate that the aggregate cost of cell phonehousehold recruitment for the PPM and Diary services, address-based sampling and targeted in-person recruitment for the PPM servicewill be approximately $18.0 million in 2012, as compared to $15.5 million in 2011.
Portable People Meter Ratings Service
Collection of Listener Data Through PPM Methodology. In our PPM service, we gather data regarding panelists� exposure toencoded audio material using our PPM devices. We recruit a panel of households to participate in the service (all persons aged six andolder in the household) from a random probability sample of persons living in the PPM Markets. We ask the household members toparticipate in the panel for a period of up to two years, carrying our devices throughout their day. Panelists earn points based on theircompliance with the task of carrying the device. Longer carry time results in greater points, which are the basis for monthly cashincentives we pay to our panelists. Demographic subgroups that our experience indicates may be less likely to comply with the surveytask of carrying the device, such as younger adults, are offered higher premiums based on their compliance with the survey task. Weconsider the amount of the cash incentive we pay to our PPM panelists to be proprietary information.
The PPM system collects the codes and adds a date/time stamp and indication of whether the listener was at home or out-of-hometo each listening occasion and the information is transmitted to us for processing, tabulation, and analysis in producing our audienceestimates. We issue a ratings report in each measured market for 13 unique four-week ratings periods per year. We also issue interimweekly reports to station subscribers for programming information. Users access our ratings estimates through an Internet-basedsoftware system that we provide.
Copyright © 2013 www.secdatabase.com. All Rights Reserved.Please Consider the Environment Before Printing This Document

2011 PPM Ratings Service Quality Improvement Initiatives. In operating our PPM ratings service, we have experienced and expectto continue to experience operational challenges similar to those we have historically faced in our Diary-based service, including severalof the challenges related to sample proportionality and response rates described above in �� Syndicated Radio Ratings Services� Challenges.� We expect to continue to implement additional measures to address these challenges.
8
Copyright © 2013 www.secdatabase.com. All Rights Reserved.Please Consider the Environment Before Printing This Document

Table of ContentsSince launching our PPM ratings service, we have implemented a series of initiatives and announced additional initiatives. We
believe these initiatives reflect our commitment to ongoing improvement and our responsiveness to feedback from several governmentaland customer entities. We believe these commitments and enhancements are consistent with our ongoing efforts to obtain and maintainMRC accreditation and to continuously improve our syndicated radio ratings services. We expect these initiatives will likely requireexpenditures that will be material in the aggregate.
Since 2010, we have been introducing a multimodal recruitment approach that is intended to increase the participation rate of keysegments of our sample that are more likely to be comprised of youth and minorities. We have added targeted in-person recruitment toour multi-faceted PPM panelist recruitment approach that had previously included mailings and phone calls. We believe in-personrecruitment can benefit all broadcasters as it targets population segments that are more likely to be reachable only by cell phone �including youths and minorities. We are also using address-based sampling to further improve geographic proportionality. By the end of2011, we implemented address-based sampling and expanded targeted in-person recruiting across all of our PPM Markets. We alsoenhanced sampling controls in PPM Markets with a finer level of geographic control through �Geo Zones�, which are clusters of zipcodes nested within a single sampling unit. In March 2011, we introduced Geo Zones in all high density areas and by August 2011, weexpanded the use of Geo Zones to all PPM geographies.
Throughout 2011, we invested in other PPM ratings service quality enhancements. We implemented a two percent sample targetincrease in PPM Markets, which was in addition to an eight percent sample target increase in 2010.
We continue to operate in a highly challenging business environment. Our future performance will be impacted by our ability toaddress a variety of challenges and opportunities in the markets and industries we serve, including our ability to continue to maintainand improve the quality of our PPM ratings service, and manage increased costs for data collection, arising, among other ways, fromincreased cell phone household recruiting and targeted in-person recruiting. We maintain an ongoing commitment to continuousimprovement and obtaining and/or maintaining MRC accreditation in all of our PPM Markets, and strive to develop and implementeffective and efficient technological solutions to measure cross platform media and advertising.
International PPM. We have entered into arrangements with media information services companies pursuant to which thosecompanies use our PPM technology in their audience ratings services in specific countries outside of the United States. We currentlyhave arrangements with Kantar Media, which is owned by WPP Group plc, a global communications services group, and BBM Canada,a not for profit, member owned tri-partite industry organization. Generally, under these arrangements we sell PPM hardware andequipment to the company for use in its media measurement services and collect a royalty once the service is deemed commercial. OurPPM technology is currently being used for media ratings in seven countries in addition to the U.S. � Belgium, Canada, Denmark,Iceland, Kazakhstan, Norway, and Singapore. Five of the countries, Belgium, Canada, Denmark, Iceland, and Norway, use PPMtechnology for measuring both television and radio. Kantar Media has been awarded a six-year contract for the provision of a newelectronic radio measurement service in Sweden. The first measurement report using PPM technology will be made available toSwedish broadcasters in August 2012 when the contract begins.
Diary Service
Collection of Listener Data Through Diary Methodology. We use listener diaries to gather radio listening data from a randomprobability sample group of persons aged 12 and over in households in the 284 United States local markets as of the Fall 2011 survey inwhich we currently provide Diary-based radio ratings, and we contact them by telephone and/or mail to solicit their agreement toparticipate in the survey. When participants in our Diary survey (whom we refer to as �diarykeepers�) agree to take part in a survey, wemail them a small, pocket-sized diary and ask them to record their listening in the diary over the course of a seven-day period. We askdiarykeepers to report in their diary the station(s) to which they listened, when they listened and where they listened, such as home, car,work, or other place. Although survey periods are 12 weeks long, no participant keeps a diary for more than seven days. Eachdiarykeeper receives a diary, instructions for filling it out and a small cash incentive. The incentive varies according to markets anddemographic group and may include certain incentives designed to encourage response from demographic groups less likely to returndiaries. In addition to the cash incentives included with the diaries, further cash incentives are used at other points in the survey processalong with other communications such as follow-up letters and phone calls to maximize response rates. Diarykeepers mail the diaries to
Copyright © 2013 www.secdatabase.com. All Rights Reserved.Please Consider the Environment Before Printing This Document

our operations center, where we conduct a series of quality control checks, enter the information into our database, and use it to produceperiodic audience listening estimates. In 2011, we received and processed more than 880,000 diaries to produce our audience listeningestimates. We measure each of our local markets at least twice each year, and larger markets four times per year.
9
Copyright © 2013 www.secdatabase.com. All Rights Reserved.Please Consider the Environment Before Printing This Document
Table of ContentsFor information regarding MRC accreditation of our Diary service, see �� Media Rating Council Accreditation� below.
2011 Diary Service Quality Improvement Initiatives. Throughout 2011, we invested in Diary service quality enhancements, someof which are set forth below. As part of our continuous improvement program, we intend to invest in Diary service qualityenhancements going forward. As the needs of our customers and the service continues to evolve, we may choose to focus on differentareas for improvement during 2012 and beyond.
In 2011, we continued our testing of a week-long, web/mobile based survey as the primary means of data collection for the Diaryservice.
Effective with the Summer 2011 survey, high definition multicast and radio Internet streams that meet minimum reportingstandards became eligible for reporting in diary markets. In the Fall 2011 survey, high definition multicast and radio Internet streamsthat met minimum reporting standards became eligible for reporting in our national services.
Effective with the Fall 2011 survey, we increased the percentage of cell phone households in the diary surveys from an average of17% to an average of 20% across the aggregate of all diary metros.
Other Syndicated Radio Ratings Services
RADAR. Our RADAR service provides an estimate of national radio audiences and the audience size of network radio programsand commercials. We provide the audience estimates for a wide variety of demographics and dayparts for total radio listening and formore than 50 separate radio networks.
We provide network audience estimates by merging the radio listening of selected survey respondents and panelists with thereported times that network programs and commercials are aired on each affiliated station. We utilize the data produced by our Diaryand PPM ratings services in producing these network audience estimates. We deliver the RADAR estimates through our RADARSoftware Suite software application, which includes a number of tools for sophisticated analysis of network audiences. We provide thisservice to radio networks, advertising agencies and network radio advertisers on a quarterly basis.
For information regarding MRC accreditation of our RADAR service, see �� Media Rating Council Accreditation� below.
Nationwide. Nationwide is our national radio audience service that provides information on the size and demographic compositionof radio audiences for commercial and public radio networks. Nationwide average quarter hour ratings estimates are based on a samplesize of more than 350,000 Arbitron respondents and panelists for each 12-week reporting period.
Nationwide gives clients the ability to monitor trends in national radio network. It also gives customers a resource that helps todetermine how various affiliates perform in different local markets.
For information regarding MRC accreditation of our Nationwide service, see �� Media Rating Council Accreditation� below.
Other Media Services
Except as indicated below, the following other media services are not part of a regular syndicated rating service accredited by theMRC, and we have not requested accreditation. Arbitron does provide one or more syndicated services that are accredited by the MRC.
Mobile Audience Services. In July 2011, we purchased Zokem Oy, a Finland-based mobile audience measurement company,which now operates as Arbitron Mobile Oy. Arbitron Mobile has developed a mobile software meter compatible with most mobiledevices offered by major manufacturers, mobile device operating systems, and wireless service provider protocols. The Arbitron Mobilesoftware meter can measure consumers� mobile experience, online and offline, and includes the ability to measure the incidence andduration of software application usage and methods of processing mobile datasets. Arbitron Mobile�s customer base includes: mediameasurement companies, wireless service providers; Internet service providers; software service providers; wireless devicemanufacturers, media content owners, and advertising agencies and advertisers. As with our other research services, we plan to recruit
Copyright © 2013 www.secdatabase.com. All Rights Reserved.Please Consider the Environment Before Printing This Document

panels of consumers who will agree to download the software meter onto their mobile device. Arbitron Mobile has historically licensedits intellectual property and provided largely custom research services to customers outside the United States.
10
Copyright © 2013 www.secdatabase.com. All Rights Reserved.Please Consider the Environment Before Printing This Document
Table of ContentsOut-of-Home Television Services. We use our PPM technology to measure panelists� exposure to television outside of their
home, including in restaurants, bars, hotels, airports, and the workplace. The out-of-home television services are designed to improvevisibility into out-of-home television audiences for media companies and advertisers.
Cross Platform Services
Our cross platform initiative is designed to explore opportunities to deploy our PPM technology for application to other types ofmedia and/or cross platform media. The focus of this initiative is to provide a more complete view of consumers� interaction amongmultiple media, including television, radio, Internet, mobile, place-based, and other media. By leveraging the mobility and utility of ourPPM technologies, we believe the cross platform services can complement existing data services, offer media greater insight into whatconstitutes their total audience, and help advertisers plan how to reach that audience.
In 2011, we provided local television plus radio audience studies and national television plus radio studies. In September 2011,ESPN signed a new three-year agreement that continues our cross-media measurement of the NFL and college football games theybroadcast on television and radio.
In February 2011, the Coalition for Innovative Media Measurement announced that it selected us to administer athree-screen pilottest to measure participants� behavior with content and advertising across television, Internet, and mobile media. As of December 31,2011, we had recruited a unique panel of over 500 participants who agreed to carry a PPM device and download PC and mobile metersonto their personal computers and smartphones.
Local Market Qualitative Consumer Information Services
In our radio ratings service, we provide primarily quantitative data, such as how many people are listening. We also providequalitative data, such as consumer and media usage information to radio stations, cable companies, television stations, out-of-homemedia, magazine and newspaper publishers, advertising agencies and advertisers. The qualitative data on listeners, viewers and readersprovide more detailed socioeconomic information and information on what survey participants buy, where they shop and what forms ofmedia they use. We provide these measures of consumer demographics, retail behavior, and media usage in local markets throughout theUnited States.
We provide qualitative services tailored to fit a customer�s specific market size and marketing requirements, such as:
� the Scarborough Report, which is offered in larger markets, and the Scarborough Mid-Tier Local Market Consumer Study,which is offered in medium-sized markets;
� the RetailDirect Service, which is offered in medium-sized markets;
� the Qualitative Diary Service/LocalMotion Service, which is offered in smaller markets; and
� Non-Syndicated Research Services.
Each service profiles a market, the consumers and the media choices in terms of key characteristics. These services cover majorretail and media usage categories. We also provide training and support services that help our customers understand and use the localmarket consumer information we provide.
Scarborough. The MRC-accredited Scarborough service is provided through a joint venture between Arbitron and a subsidiary ofThe Nielsen Company (�Nielsen�) and is governed by a partnership agreement, which will automatically renew for an additional threeyear term in December 2012 unless either party provides advance written notice of its intent to terminate the partnership. Although ourequity interest in the Scarborough Research joint venture is 49.5 percent, partnership voting rights and earnings are divided equallybetween Arbitron and Nielsen. The Scarborough service provides detailed information about media usage, retail and shopping habits,demographics and lifestyles in 77 large United States local markets, based on a sample of consumers in the relevant markets.
Copyright © 2013 www.secdatabase.com. All Rights Reserved.Please Consider the Environment Before Printing This Document

Scarborough data feature more than 2,000 media, retail and lifestyle characteristics, which can help radio stations, televisionstations, cable companies, advertising agencies and advertisers, newspaper and magazine publishers and out-of-home media companiesdevelop an in-depth profile of their consumers. Examples of Scarborough categories include retail shopping (e.g., major
11
Copyright © 2013 www.secdatabase.com. All Rights Reserved.Please Consider the Environment Before Printing This Document
Table of Contentsstores shopped or purchases during the past 30 days), auto purchases (e.g., plan to buy new auto or truck), leisure activities (e.g.,attended sporting events) and personal activities (e.g., golfing). Media information includes broadcast and cable television viewing,radio listenership, newspaper readership and integrated online audiences. This information is provided twice each year to newspapers,radio and television broadcasters, cable companies, out-of-home media, advertising agencies and advertisers in the form of theScarborough Report. Scarborough also provides a Mid-Tier Local Market Consumer Study regarding media usage, retail and shoppinghabits, demographics, and lifestyles of adult consumers in 40 United States local markets.
We are the exclusive marketer of the Scarborough Report to radio broadcasters, cable companies, out-of-home media, andadvertisers, and advertising agencies. Scarborough Research markets the Scarborough Report to newspapers, sports marketers andonline service providers. Nielsen markets the Scarborough Report to television broadcasters.
RetailDirect Service. Our RetailDirect service is a locally oriented purchase data and media usage research service provided in 18midsized United States local markets. This service, which utilizes diaries and telephone surveys, provides a profile of the audience interms of local media, retail and consumer preferences so that local radio and television broadcasters, out-of-home media and cablecompanies have information to help them develop targeted sales and programming strategies. Retail categories include automotive,audio-video, furniture and appliances, soft drinks and beer, fast food, department stores, grocery stores, banks and hospitals. Mediausage categories include local radio, broadcast television, cable networks, out-of-home media, newspapers, yellow pages andadvertising circulars.
Qualitative Diary Service/LocalMotion Service. Our Qualitative Diary Service collects consumer and media usage informationfrom Arbitron radio diarykeepers in 159 smaller United States local markets. The same persons who report their radio listenership in themarket also answer 27 demographic, product and service questions. We collect consumer behavior information for key local marketretail categories, such as automotive sales, grocery, fast food, furniture and bedding stores, beer, soft drinks and banking. TheQualitative Diary Service also collects information about other media, such as television news viewership, cable television viewership,out-of-home media exposure and newspaper readership. This qualitative service provided for cable television companies is known asLocalMotion.
Non-Syndicated Research Services. In addition to the cross platform services described above under �� Cross PlatformServices,� our non-syndicated or custom research services serve companies seeking to demonstrate the value of their advertisingpropositions. For example, we have provided non-syndicated research services for subscribers including sports play-by-playbroadcasters, digital out-of-home and place-based media companies, and radio station properties. Through our non-syndicated researchservices, we are also exploring additional applications of PPM data, including nonratings programming and marketing. We are alsoexploring providing services for companies that sell advertising on in-store (retail) media and sports arenas.
Data and Software Services
We provide our audience estimates in a number of different reports we publish and license to our customers. The cornerstone ofour radio audience ratings services is the Radio Market Report, which is available in all local markets for which we currently provideradio ratings. The estimates contained in our Diary-based Radio Market Report service are accredited by and subject to the review of theMRC. The PPM-based Radio Market Report is currently accredited in nine markets and the service is subject to review by the MRC.The Radio Market Report provides audience estimates for those stations in a market that meet our minimum reporting standards. Theestimates cover a wide variety of demographics and dayparts, which are the time periods for which we report audience estimates. EachRadio Market Report contains estimates to help radio stations, advertising agencies and advertisers understand who is listening to theradio, which stations they are listening to, and where and when they are listening. Our proprietary data regarding radio audience sizeand demographics are generally provided to customers through multiyear license agreements.
Software Applications. In addition to our data, we license software applications that provide our customers access to the audienceestimates in our databases. These applications include Maximi$er®, TAPSCANTM and PD Advantage®, which are services for radiostations, and Media ProfessionalSM and SmartPlus®, which are services for advertising agencies and advertisers. The PPM Analysis Toolis used by both radio stations and advertising agencies. Broadcasters use these software applications to more effectively analyze and
Copyright © 2013 www.secdatabase.com. All Rights Reserved.Please Consider the Environment Before Printing This Document

understand ratings information for sales, management and programming purposes. Advertisers and agencies use these softwareapplications to help them plan and buy radio advertising. Some of our software applications also allow our customers to access dataowned by third parties, provided the customers have a separate license to use such third-party data. For information regarding the statusof our MRC Accreditation for the PPM Analysis Tool, see �� Media Rating Council Accreditation� below.
12
Copyright © 2013 www.secdatabase.com. All Rights Reserved.Please Consider the Environment Before Printing This Document

Table of ContentsThe Maximi$er service includes a Windows-based application to access a market�s Arbitron radio Diary database on a client�s
personal computer. Radio stations use the Maximi$er service to produce information about their stations and programming nototherwise available in Arbitron�s published Radio Market Reports.
The TAPSCAN software is one of the advertising industry�s leading radio analysis applications. It can help create illustrativetables, charts and graphs that make complex information more useful to potential advertisers. The software uses respondent-level data,and it includes cost-efficiency analyses, hour-by-hour estimates and trending, and automatic scheduling and goal tracking. In addition tolocal Arbitron Radio Report ratings estimates, the TAPSCAN Web service also allows radio stations, advertisers and advertisingagencies to access our National Regional Database to analyze ratings information for customer-defined groupings of stations acrossmultiple markets and custom groupings of counties. Our TAPSCAN Sales Management service provides software systems that helpradio stations manage their advertising sales process and automate the daily tasks in a sales department. The TAPSCAN SalesManagement applications combine a customer relationship management system with scheduling and research applications andinventory/pricing management tools. Another TAPSCAN service, QUALITAP, is also made available to television and cable outlets inthe United States under a licensing arrangement with Marketron International, Inc.
The PPM Analysis Tool enables subscribers of PPM respondent level data to analyze PPM data at the most discrete level ofgranularity available to customers. Researchers and programming consultants use this tool to gain valuable insights through a variety ofreports that present detailed analysis of PPM panelist behavior.
Our PD Advantage service offers radio station program directors in Diary markets the ability to create a variety of reports that helpanalyze the market, the audience, and their competition. PDA Web is a comparable service for radio program directors in PPM Markets.
Our SmartPlus and Media Professional services provide media buying software systems to local and regional advertising agenciesfor broadcast and print media. The Media Professional and SmartPlus services are designed to help advertising agencies and advertisersplan and buy radio advertising time quickly and easily. These services integrate radio planning and buying into one comprehensiveresearch and media-buying tool. They allow advertising agencies and advertisers to uncover key areas critical to the buying process,including determining the most effective media target, understanding market trends and identifying potential new business. In additionto the licensing above, we offer third-party software providers and customers licenses to use proprietary software that will enableenhanced access to our respondent-level data.
International Operations
Finland. We currently operate a wholly-owned subsidiary, Arbitron Mobile Oy, organized under the laws of Finland. For moreinformation regarding Arbitron Mobile Oy, see �Other Media Services � Mobile Audience Services� above.
India. We currently operate a wholly-owned subsidiary organized under the laws of India, which currently provides softwaredevelopment and testing services in India. During 2011, we increased staffing to perform these and additional duties.
Customers, Sales and Marketing
Our customers are primarily radio, cable and television broadcasters, advertising agencies, advertisers, buying services, retailers,out-of-home media, online media, mobile media, and print media. One customer, Clear Channel, represented approximately 19 percentof our revenue in 2011. We believe we are well positioned to provide new services and other offerings to meet the emerging needs ofbroadcasting groups.
We market our services in the United States through 105 sales account managers, customer trainers and client servicesrepresentatives, as of December 31, 2011.
We have entered into a number of agreements with third parties to assist in marketing and selling our services in the United States.For example, Marketron International, Inc. distributes, on an exclusive basis, our QUALITAP software to television and cable outlets inthe United States and Media Monitors uses minute-level radio data from our PPM ratings service for the Audience Reaction andMscoreTM services.
Copyright © 2013 www.secdatabase.com. All Rights Reserved.Please Consider the Environment Before Printing This Document

We support our sales and marketing efforts through the following:
� conducting direct-marketing programs directed toward radio stations, cable companies, advertising agencies, televisionstations, out-of-home companies, broadcast groups and corporate advertisers;
13
Copyright © 2013 www.secdatabase.com. All Rights Reserved.Please Consider the Environment Before Printing This Document

Table of Contents� promoting Arbitron and the industries we serve through public relations programs aimed at the trade press of the
broadcasting, out-of-home media, Internet, advertising and marketing industries, as well as select local and nationalconsumer and business press;
� gathering and publishing studies, which we make available for no charge on our Web site, on national summaries of radiolistening, emerging trends in the radio industry, Internet streaming, out-of-home and other media industries, as well as themedia habits of radio listeners and television, cable and Internet viewers;
� participating in and sponsoring key industry and government forums, trade association meetings, and interest groups, such asthe Advertising Research Foundation, the American Association of Advertising Agencies, the National Association ofBroadcasters, the Association of National Advertisers, the Radio Advertising Bureau, the European Society for Opinion andMarketing Research, the Coalition for Innovative Media Measurement, the Television Bureau of Advertising, theCabletelevision Advertising Bureau, Alliance for Women in Media, Women in Cable Telecommunications, the Cable &Telecommunications Association for Marketing, the National Association of Black Owned Broadcasters, Minority Media andTelecommunications Council, the Emma Bowen Foundation, the International Radio and Television Society, Media RatingCouncil, Committee on Local Radio Audience Measurement, Committee on Local Television Audience Measurement,national Radio Research Committee and the Outdoor Advertising Association of America, as well as numerous state andlocal advertising and broadcaster associations;
� participating in the digital industry groups, such as the Interactive Advertising Bureau, South by Southwest festival, Ad Tech,and RAIN Summits;
� participating in activities and strengthening relationships with national and local chapters of grassroots organizations, such asthe National Council of La Raza, the National Urban League, the National Association for the Advancement of ColoredPeople, and the Rainbow/PUSH Coalition; and
� maintaining a presence at major industry conventions, such as those sponsored by the National Association of Broadcasters,the Radio Advertising Bureau, the American Association of Advertising Agencies, the Advertising Research Foundation, theAssociation of National Advertisers, the Cable Advertising Bureau and the Outdoor Advertising Association of America,Mobile World Congress, Pacific Telecommunications Council, Mobile Marketing Association, International Conference onMobile Ubiquitous Computing, Systems, Services and Technologies, INfocmm Industry Forum and CTIA.
Competition
We believe the principal competitive factors in our markets are the credibility, reliability, utility, and wide acceptance by buyersand sellers of media advertisers of our audience research, the ability to provide quality analytical services for use with the audienceinformation, and the end-user experience with services and price.
We are the leader in the radio audience ratings business in the United States. During 2011, we competed in the radio audienceratings business in some small United States markets with Eastlan Resources, a privately held research company.
We are aware of at least four companies: Civolution, GfK AG, Ipsos SA, and Nielsen, which are developing technologies thatcould compete with our PPM ratings service. Additionally, we are aware of several companies, including Anite plc, Ascom, CarrierIQ,Inc., comScore, Inc., Experian Simmons, Lumi Mobile, M:Metrics, Inc,, Médiamétrie, Nokia Siemens Networks, Nurago GmbH (GfKAG is the majority owner), Spirent Communications, and Telephia (a subsidiary of Nielsen) that compete with Arbitron Mobile�smobile audience services.
Additionally, we compete with a large number of other providers of applications software, qualitative data, and proprietaryqualitative studies used by broadcasters, cable companies, advertising agencies, advertisers, and out-of-home media companies. Thesecompetitors include Edison Research, Marketron Inc., and STRATA Marketing Inc., in the area of proprietary research, Donovan DataSystems, Interactive Media Systems, and Telmar Information Services Corp., in the area of applications software, and The Media Audit(a division of International Demographics, Inc.), GfK Mediamark Research and Intelligence LLC (a subsidiary of GfK AG) andSimmons Market Research Bureau (a subsidiary of Experian Marketing Solutions) in the area of qualitative data.
Copyright © 2013 www.secdatabase.com. All Rights Reserved.Please Consider the Environment Before Printing This Document

14
Copyright © 2013 www.secdatabase.com. All Rights Reserved.Please Consider the Environment Before Printing This Document

Table of ContentsIn our cross platform services, we currently compete with several companies offering media measurement, return on investment
and/or advertising targeting solutions, including among others, comScore, Inc., Canoe Ventures, Kantar Media, Nielsen, RentrakCorporation, TiVo, TRA Global, Inc. (�TRA�), and Media Behavior Institute LLC (joint venture of Nielsen and Gfk AG/MRI).
Intellectual Property
Our intellectual property is, in the aggregate, of material importance to our business and those of our subsidiaries. We rely upon acombination of patents, copyrights, trademarks, service marks, trade secret laws, license agreements, confidentiality procedures andother contractual restrictions to establish and protect proprietary rights in our methods and services as well as those of our subsidiaries.As of December 31, 2011, 44 United States patents were issued and active and 62 United States patent applications were pending on ourbehalf. Internationally, 189 foreign patents were issued and active and 225 foreign patent applications were pending on our behalf. Ourpatents relate to our data collection, processing systems, software and hardware applications, mobile measurement technology, PC-based measurement technology, the PPM technology and its methods, and other intellectual property assets. Some patents relating to thePPM technology and its methods expire at various times beginning in mid-2012. These include patents relating to previous generationsand some elements of our current PPM technology and its methods, including some spread spectrum encoding, motion sensing, andbasic audio and video matching. We do not believe these patents are core to the PPM technology or that the expiration of these patentswill materially adversely affect our business. Our rights to limit others from practicing the methods covered by the expiring patents maybe limited.
Our audience listening estimates are original works of authorship protectable under United States federal and state copyright laws.We publish the Radio Market Report monthly, quarterly or semiannually, depending on the Arbitron market surveyed, while we publishthe Radio County Coverage Report annually. We seek copyright registration for each Radio Market Report and for each Radio CountyCoverage Report published in the United States. We may also seek copyright protection for our proprietary software and for databasescomprising the Radio Market Report and other services containing our audience estimates and respondent-level data. We generallyprovide our proprietary data regarding audience size and demographics to customers through multiyear license agreements.
We market a number of our services under United States federally registered trademarks that are helpful in creating brandrecognition in the marketplace. Some of our registered trademarks and service marks include: the Arbitron name and logo, Maximi$er,RetailDirect and RADAR. The Arbitron name and logo is of material importance to our business. We have a registration pending forArbitron PPM in class 35 (conducting audience measurement services). We also have a number of common-law trademarks, includingMedia Professional, and QUALITAP. We have registered our name as a trademark in the United Kingdom, Mexico, the EuropeanUnion, Australia, Singapore, Brazil, Canada, Argentina, Columbia, Russia, New Zealand, Taiwan, Hong Kong, Israel, Kazakhstan,Kenya, Chile and Japan, and are exploring the registration of our marks in other foreign countries.
We have filed applications to register Arbitron Mobile, Arbitron Mobile Index, and Arbitron Mobile Trends Panels name inArgentina, Australia, Bahrain, Brazil, Canada, Chile, China, Egypt, European Community, Hong Kong, India, Indonesia, Japan, Jordan,Kuwait, Lebanon, Malaysia, Mexico, Norway, Oman, Pakistan, Qatar, Russia, Saudi Arabia, Singapore, South Africa, South Korea,Switzerland, Taiwan, Turkey, UAE and the United States, in classes 9 and 35.
The laws of some countries might not protect our intellectual property rights to the same extent as the laws of the United States.Effective patent, copyright, trademark and trade secret protection may not be available in every country in which we market or licenseour data and services.
We believe our success depends primarily on the innovative skills, technical competence, customer service and marketing abilitiesof our personnel. We enter into confidentiality and assignment-of-inventions agreements with substantially all of our employees andenter into nondisclosure agreements with substantially all of our suppliers and customers to limit access to and disclosure of ourproprietary information.
We must protect against the unauthorized use or misappropriation of our audience estimates, databases and technology by thirdparties. There can be no assurance that the copyright laws and other statutory and contractual arrangements we currently depend uponwill provide us sufficient protection to prevent the use or misappropriation of our audience estimates, databases and technology in the
Copyright © 2013 www.secdatabase.com. All Rights Reserved.Please Consider the Environment Before Printing This Document

future. The failure to protect our proprietary information, intellectual property rights and, in particular, our audience estimates anddatabases, could severely harm our business.
15
Copyright © 2013 www.secdatabase.com. All Rights Reserved.Please Consider the Environment Before Printing This Document

Table of ContentsAdditionally, claims by third parties that our current or future products or services infringe upon their intellectual property rights
may harm our business. Intellectual property litigation is complex and expensive, and the outcome of such litigation is difficult topredict. We have been involved in litigation relating to the enforcement of our copyrights covering our radio listening estimates andpatents covering our proprietary technology. Although we have generally been successful in these cases, there can be no assurance thatthe copyright laws and other statutory and contractual arrangements we currently depend upon will provide us sufficient protection toprevent the use or misappropriation of our audience estimates, databases and technology in the future. Litigation, regardless of outcome,may result in substantial expense and a significant diversion of our management and technical personnel. Any adverse determination inany litigation may subject us to significant liabilities to third parties, require us to license disputed rights from other parties, if licensesto these rights could be obtained, or require us to cease using certain technology.
Research and Development
Our research and development activities have related primarily to the development of new services, customer software, PPMequipment and maintenance and enhancement of our legacy operations and reporting systems. We expect that we will continue researchand development activities on an ongoing basis, particularly in light of the rapid technological changes affecting our business. Weexpect that the majority of the effort will be dedicated to improving the overall quality and efficiency of our data collection andprocessing systems, developing new software applications that will assist our customers in realizing the full potential of our audienceratings services, developing our PPM technology and developing a single-source service that will be able to measure audience and otherinformation from a number of different forms of media and media delivery methods. Research and development expenses during fiscalyears 2011, 2010 and 2009 totaled $38.4 million, $39.1 million, and $42.0 million, respectively.
Governmental Regulation
Our PPM equipment has been certified to meet FCC requirements relating to emissions standards and standards for modemconnectivity. Additionally, all PPM equipment has been certified to meet the safety standards of Underwriters Laboratories Inc.(commonly referred to as UL), as well as Canadian and European safety and environmental standards.
Our media research activities are subject to an agreement with the United States Federal Trade Commission in accordance with aDecision and Order issued in 1962 to CEIR, Inc., a predecessor company. This order originally arose in connection with a televisionratings business, and we believe that today it applies to our media ratings services. The order requires full disclosure of themethodologies we use and prohibits us from making representations in selling or offering to sell an audience ratings service withoutproper qualifications and limitations regarding probability sample, sampling error and accuracy or reliability of data. It prohibits us frommaking statements that any steps or precautions are taken to ensure the proper maintenance of diaries unless such steps or precautionsare in fact taken. It also prohibits us from making overly broad statements regarding the media behavior a survey reflects. The orderfurther prohibits us from representing the data as anything other than estimates and from making a statement that the data are accurate toany precise mathematical value. The order requires that we make affirmative representations in our reports regarding nonresponse bysurvey participants and the effect of this nonresponse on the data, the hearsay nature of a survey participant�s response, the fact thatprojections have been made, and the limitations and deficiencies of the techniques or procedures used. We believe that we haveconducted and continue to conduct our radio audience ratings services in compliance with the order.
Federal and state regulations restrict telemarketing to individuals who request to be included on a do-not-call list. Currently, theseregulations do not apply to survey research, but there can be no assurance that these regulations will not be made applicable to surveyresearch in the future. In addition, federal regulations prohibit calls made by autodialers to wireless lines without consent from thesubscriber. Because consumers are able to transfer a wireless number to a landline carrier or a landline number to a wireless carrier, itcan be difficult for us to identify efficiently wireless numbers in advance of placing an autodialed call.
Media Rating Council Accreditation
The MRC is a voluntary, nonprofit organization, comprised of broadcasters, advertisers, advertising agencies, and other users ofmedia research, which reviews and accredits audience ratings services. The MRC accreditation process is voluntary and there is no
Copyright © 2013 www.secdatabase.com. All Rights Reserved.Please Consider the Environment Before Printing This Document

requirement, legal or otherwise, that rating services seek accreditation or submit to an MRC audit. MRC accreditation is not aprerequisite to commercialization of any of our audience ratings services.
Although accreditation is not required, we are pursuing MRC accreditation for several of our syndicated audience ratings services.We currently intend to continue to use commercially reasonable efforts in good faith to pursue MRC accreditation of our PPM ratingsservice in each PPM Market where we have commercialized or may commercialize the service in the future.
16
Copyright © 2013 www.secdatabase.com. All Rights Reserved.Please Consider the Environment Before Printing This Document

Table of ContentsAs of the date we filed this Annual Report on Form 10-K with the Securities and Exchange Commission, the quarter-hour-based
radio ratings data produced by the PPM ratings service is accredited by the MRC in nine local markets, Atlanta; Cincinnati; Houston-Galveston; Kansas City; Milwaukee-Racine; Minneapolis-St. Paul; Philadelphia; Phoenix; and St. Louis. At the end of 2011, the MRCaccredited the quarter-hour-based radio ratings data produced by the PPM ratings service in fourteen local markets, five of which,Cleveland, Portland, OR, Riverside-San-Bernardino, Salt Lake City-Ogden-Provo, and Tampa-St. Petersburg-Clearwater, subsequentlylost accreditation in February 2012. We have applied for accreditation in all PPM Markets. As we have disclosed, the MRC haspreviously denied accreditation in certain of the markets and we continue to seek accreditation in all unaccredited PPM Markets.
Our Diary-based Radio Market Report service is accredited by and subject to the review of the MRC. The MRC has accredited ourDiary-based Radio Market Report service since 1968. On December 6, 2010, we announced the MRC had withdrawn its accreditationof our RADAR and Nationwide services. For information regarding MRC accreditation status, see � Media Rating CouncilAccreditation.�
In March 2011, we announced the MRC had also accredited the Arbitron PPM Analysis Tool. Designed specifically for accreditedmonthly average-quarter-hour PPM data, the PPM Analysis Tool is a software application providing standard audience analysis reportsincluding rankers, trend reports, and audience composition reports.
In April 2011, we announced the MRC had accredited our TAPSCAN Web software, a Web-based sales proposal and analysissoftware system for radio. Reports created using the software and MRC accredited data indicate the report is accredited by the MRC.However, reports created using data from the 39 unaccredited PPM markets are not MRC-accredited.
Additional Arbitron services that are currently accredited by the MRC are Scarborough, Maximi$er and Media Professionalsoftware, the Custom Survey Area Report (�CSAR�) and the Radio County Coverage services.
The MRC accreditation review is ongoing and continuous. To obtain or to merit continued accreditation of our services, we must:(1) adhere to the MRC�s minimum standards for Media Rating Research; (2) supply full information to the MRC regarding details ofour operations; (3) conduct our media ratings services substantially in accordance with representations to our subscribers and the MRC;(4) submit to, and pay the cost of, thorough annual audits of our accredited services by certified public accounting firms engaged by theMRC; and (5) commit to continuous improvement of our media ratings services.
Employees
As of December 31, 2011, we employed 954 people on a full-time basis and approximately 420 people on a part-time basis in theUnited States and 251 people on a full-time basis internationally. None of our U.S. or India employees are covered by a collectivebargaining agreement. Our employees in Finland are covered by a collective bargaining agreement. We believe our employee relationsare good.
Seasonality
Revenue
We recognize revenue for services over the term of license agreements as services are delivered while expenses are recognized asincurred. As of Fall 2011 we gather radio-listening data in 284 U.S. local markets, including 236 Diary markets and 48 PPM Markets.
In PPM Markets, we deliver ratings 13 times per year, with four PPM ratings reports delivered in the fourth quarter in 2011. As aresult, we expect to recognize more revenue in PPM Markets in the fourth quarter than in each of the first three quarters of the year.
During the transition period from Diary service to PPM service in each PPM Market, there were changes in the seasonality patternbecause during the initial quarter in which the PPM ratings service was commercialized in a market, we recognized revenue based onthe delivery of both the final quarterly Diary ratings and the initial monthly PPM ratings for that market.
Copyright © 2013 www.secdatabase.com. All Rights Reserved.Please Consider the Environment Before Printing This Document

All 236 Diary markets are measured at least twice per year (April-May-June for the �Spring Survey� and October-November-December for the �Fall Survey�). In addition, we measure 48 larger Diary markets an additional two times per year (January-February-March for the �Winter Survey� and July-August-September for the �Summer Survey�). We generally deliver our Diary
17
Copyright © 2013 www.secdatabase.com. All Rights Reserved.Please Consider the Environment Before Printing This Document
Table of Contentsratings reports and recognize the related revenue in the quarter after the survey is measured. Consequently, our Diary revenue isgenerally higher in the first and third quarters as a result of the delivery of the Fall Survey and Spring Survey to all Diary marketscompared to revenue in the second and fourth quarters, when delivery of the Winter Survey and Summer Survey, respectively, is madeonly to 48 larger Diary markets.
Revenue related to the sale of Scarborough services by Arbitron is recognized predominantly in the second and fourth quarterswhen the substantial majority of services are delivered.
As a result of the various seasonal impacts mentioned above consolidated revenue is typically highest in the fourth quarter andlowest in the second quarter of each year.
Costs and expenses
The transition from Diary service to PPM service in the PPM Markets also had an impact on the seasonality of costs and expenses.PPM costs and expenses generally increased six to nine months in advance of the commercialization of each market as we built thePPM panels. These build-up costs were incremental to the costs associated with our Diary-based ratings service and we recognizedthese increased costs as incurred rather than upon the delivery of a particular survey.
Now that all our planned PPM Markets are commercialized, and because we conduct our PPM services continuous throughout theyear, we do not expect significant seasonality in PPM costs and expenses. In our Diary service, our expenses are generally higher in thesecond and fourth quarters as we conduct the Spring and Fall Surveys for all 236 of our Diary Markets.
18
Copyright © 2013 www.secdatabase.com. All Rights Reserved.Please Consider the Environment Before Printing This Document

Table of ContentsEquity earnings/losses in Scarborough Research
Our affiliate, Scarborough, typically experiences losses during the first and third quarters of each year because revenue isrecognized predominantly in the second and fourth quarters when the substantial majority of services are delivered. Scarborough royaltycosts, which are recognized in cost of revenue, are also higher during the second and fourth quarters.
Privacy and Data Security
We are currently subject to U.S. and international data protection and privacy statutes, rules, and regulations, and may in the futurebecome subject to additional such statutes, rules, and regulations. These statutes, rules, and regulations may affect our collection, use,storage, and transfer of personally identifiable information. Complying with these laws may require us to make certain investments,make modifications to existing services, or prohibit us from offering certain types of services. Failing to comply could result in civil andcriminal liability, negative publicity, data being blocked from use, and liability under contracts with our customers, vendors, andpartners.
Available Information
We routinely post important information on our Web site at www.arbitron.com, and interested persons may obtain, free of charge,copies of filings (including our annual report on Form 10-K, quarterly reports on Form 10-Q, current reports on Form 8-K, and anyamendments to those reports) that we have made with the Securities and Exchange Commission through a hyperlink at this site to athird-party Securities and Exchange Commission filings Web site (as soon as reasonably practicable after such filings are filed with, orfurnished to, the Securities and Exchange Commission). The Securities and Exchange Commission maintains an Internet site thatcontains our reports, proxy and information statements, and other information. The Securities and Exchange Commission�s Web siteaddress is www.sec.gov. Also available on our Web site are our Corporate Governance Policies and Guidelines, Code of Ethics for theChief Executive Officer and Financial Managers, Code of Ethics and Conduct, Stock Ownership Guidelines for Executive Officers andNon-Employee Managers, the Audit Committee Charter, the Nominating and Corporate Governance Committee Charter and theCompensation and Human Resources Committee Charter. Copies of these documents are also available in print, free of charge, to anystockholder who requests a copy by contacting our Treasury Manager.
ITEM 1A. RISK FACTORS
Risk Factors Relating to Our Business and the Industry in Which We Operate
Our business, financial position, and operating results are dependent on the performance of our quantitative radio audienceratings service.
Our quantitative radio audience ratings service and related software sales represented 88 percent of our total revenue for 2011. Weexpect such sales related to our radio audience ratings service will continue to represent a substantial portion of our revenue for theforeseeable future. Any factors adversely affecting the pricing of, demand for, or market acceptance of our quantitative radio audienceratings service and related software, such as competition, technological change, legislation or regulation, alternative means of valuingadvertising transactions, economic challenges, or further ownership shifts in the radio industry, could adversely impact our business,financial position, and operating results.
We may be unsuccessful in obtaining and/or maintaining MRC accreditation for our ratings services, and we may be requiredto expend significant resources in order to obtain and/or maintain MRC accreditation for our ratings services, any of which couldadversely impact our business.
As of the date we filed this Annual Report on Form 10-K with the Securities and Exchange Commission, the MRC accredited thequarter-hour-based radio ratings data produced by the PPM ratings service in nine local markets: Atlanta; Cincinnati; Houston-Galveston; Kansas City; Milwaukee-Racine; Minneapolis-St. Paul; Philadelphia; Phoenix; and St. Louis. At the end of 2011, the MRCaccredited the quarter-hour-based radio ratings data produced by the PPM ratings service in fourteen local markets, five of which,Cleveland, Portland, OR, Riverside-San-Bernardino, Salt Lake City-Ogden-Provo, and Tampa-St. Petersburg-Clearwater, lost
Copyright © 2013 www.secdatabase.com. All Rights Reserved.Please Consider the Environment Before Printing This Document

accreditation in February 2012. The MRC has accredited our Diary-based ratings service. On December 6, 2010, we announced theMRC withdrew its accreditation of our RADAR and Nationwide services.
19
Copyright © 2013 www.secdatabase.com. All Rights Reserved.Please Consider the Environment Before Printing This Document
Table of ContentsIf the efforts required to obtain and/or maintain MRC accreditation of our services are substantially greater than our current
expectations, or if we are required to make significant changes with respect to methodology and panel composition and management inorder to establish the service meets the MRC accreditation standards in any current or future market, or for any other reason, we may berequired to make additional expenditures, the amount of which could be material.
These or any future denials or revocations of accreditation could cause users of our audience estimates to experience reducedconfidence in our ratings or otherwise negatively impact demand for our services, any of which could adversely impact our financialperformance.
Privacy and data protection laws may restrict our activities and increase our costs.
Various statutes and rules regulate conduct in areas such as privacy and data protection which may affect our collection, use,storage, and transfer of personally identifiable information both abroad and in the United States. Compliance with these laws andregulations may require us to make certain investments or may dictate that we not offer certain types of products and services or onlyoffer such services or products after making necessary modifications. Failure to comply with these laws and regulations may result in,among other things, civil and criminal liability, negative publicity, data being blocked from use, and liability under contractualwarranties. In addition, there is an increasing public concern regarding data and consumer protection issues, and the number ofjurisdictions with data protection laws has been increasing. There is also the possibility that the scope of existing privacy laws may beexpanded. For example, several countries including the United States have regulations that restrict telemarketing to individuals whorequest to be included on a do-not-call list. Typically, these regulations target sales activity and do not apply to survey research. If thelaws were extended to include survey research, our ability to recruit research participants could be adversely affected. These or futureinitiatives may adversely affect our ability to generate or assemble data or to develop or market current or future products or services,which could negatively impact our business.
Concern over data security and privacy, including any violations of privacy laws, perceived misuse of personal information, orfailure to adhere to the privacy commitments that we make, could cause public relations problems and could impair our ability torecruit panelists or maintain panels of sufficient size and scope, which in turn could adversely affect our ability to provide ourproducts.
Any perception of our practices as an invasion of privacy, whether legal or illegal, may subject us to public criticism. Existing andfuture privacy laws and increasing sensitivity of consumers to unauthorized disclosures and the collection or use of personal informationand media usage information may create negative public reaction related to our business practices. U.S. legislators and various mediasources have expressed concern over the collection of media usage and behavioral information from online, mobile, andtelecommunications providers. In addition, U.S. and European lawmakers and regulators have expressed concern over the collection ofpersonally identifiable information and have issued directives regulating these activities across the European Union. Such actions mayhave a negative effect on businesses that collect or use media usage information generally or substantially increase the cost ofmaintaining a business that collects or uses media usage information. Additionally, public concern has grown regarding certain kinds ofdownloadable software known as �spyware.� These concerns might cause panelists to refrain from downloading software from theInternet, including our proprietary technology, which could make it difficult to recruit additional panelists or maintain a panel ofsufficient size and scope to provide meaningful marketing intelligence. Any resulting reputational harm, potential claims assertedagainst us or decrease in the size or scope of our panel could reduce the demand for our services, increase the cost of recruiting panelistsand adversely affect our ability to provide our services to our customers. Any of these effects could harm our business.
Our services involve the storage and transmission of proprietary information. If our security measures are breached andunauthorized access is obtained, our services may be perceived as not being secure and panelists and survey respondents may holdus liable for disclosure of personal data, and customers and venture partners may hold us liable or reduce their use of our services.
We store and transmit large volumes of proprietary information and data that contains personally identifiable information aboutindividuals. Security breaches could expose us to a risk of loss of this information, litigation, and possible liability and our reputationcould be damaged. For example, hackers or individuals who attempt to breach our network security could, if successful, misappropriate
Copyright © 2013 www.secdatabase.com. All Rights Reserved.Please Consider the Environment Before Printing This Document

proprietary information or cause interruptions in our services. If we experience any breaches of our network security or sabotage, wemight be required to expend significant capital and resources to protect against or to alleviate problems. We may not be able to remedyany problems caused by hackers or saboteurs in a timely manner, or at all. Techniques used to obtain unauthorized access or to sabotagesystems change frequently and generally are not recognized until launched against a target and, as a result, we may be unable toanticipate these techniques or to implement adequate preventive measures. If an actual or perceived breach of our security occurs, theperception of the effectiveness of our security measures could be harmed and we could lose current and potential clients.
20
Copyright © 2013 www.secdatabase.com. All Rights Reserved.Please Consider the Environment Before Printing This Document

Table of ContentsAny unauthorized disclosure or theft of private information we gather could harm our business.
Unauthorized disclosure of personally identifiable information regarding our panelists and survey respondents, whether throughbreach of our secure network by an unauthorized party, employee theft or misuse, or otherwise, could harm our business. If there werean inadvertent disclosure of personally identifiable information, or client confidential information, or if a third party were to gainunauthorized access to the personally identifiable or client confidential information we possess, our operations could be seriouslydisrupted and we could be subject to claims or litigation arising from damages suffered by panel members or pursuant to the agreementswith our customers. In addition, we could incur significant costs in complying with the multitude of state, federal and foreign lawsregarding the unauthorized disclosure of personal information. Finally, any perceived or actual unauthorized disclosure of theinformation we collect could harm our reputation, substantially impair our ability to attract and retain panelists and have an adverseimpact on our business.
We launched a cross platform initiative, which is a developing area where we have limited experience. If we are not successfulin developing the cross platform initiative, it could have a material adverse impact on our business.
We launched a cross platform media initiative in 2009, which leverages our PPM technology and panels. We do not havesignificant experience in designing, operating, maintaining or integrating cross platform services among television, radio, Internet,mobile, place-based, and other media. We are uncertain of the demand for these services, whether these services will be accepted in themarketplace, and the price at which customers would be willing to subscribe. This initiative may fail, or incur significant losses. Ourentry into cross platform may bring risks of which we are currently unaware and could have a material adverse impact on our business.
We may acquire or invest in other companies, products or technologies, which may be costly, dilutive to our earnings and, inthe event we experience difficulties in assimilating and integrating the personnel, technologies, operating systems and products andservices of acquired businesses, less beneficial than we anticipate.
As part of our business strategy, we may acquire or invest in other companies, products or technologies that complement ourcurrent product and service offerings, enhance our technical capabilities, expand our operations into new markets, or offer other growthopportunities. Such acquisitions may be costly and potentially dilutive to existing shareholders in the event we offer capital stock asconsideration in an acquisition. Acquisitions could also pose risks to our operations and operating results, including the possibilities of:
� increased costs relating to the integration of acquired businesses or technologies;
� difficulties assimilating the acquired operations, personnel, technologies or products into our company;
� loss of key personnel at an acquired business who decide not to work for us;
� diversion of management�s attention from our existing operations;
� adverse effects on relationships with our existing suppliers, customers or partners;
� a need for additional capital or debt financing to complete acquisitions; and
� the impairment of the investment or intangible assets acquired.
The described risks would be magnified as the size of an acquisition increases or if the acquisitions are in geographic or businessmarkets in which we have little or no prior experience. As a result of these and other challenges, we may not realize any anticipatedbenefits from acquisitions even if we can find suitable acquisition opportunities at what we believe to be attractive valuations, whichcannot be assured.
21
Copyright © 2013 www.secdatabase.com. All Rights Reserved.Please Consider the Environment Before Printing This Document

Table of ContentsTechnological change may render our services obsolete and it may be difficult for us to develop new services or enhance
existing ones.
We operate in businesses that require sophisticated data collection, processing systems, software and other technology. Some of thetechnologies supporting the industries we serve are changing rapidly. We will be required to adapt to changing technologies, either bydeveloping and marketing new products and services or by enhancing our existing products and services, to meet client demand.Additionally, advertising-supported media may be challenged by new technologies that could have an effect on the advertising industry,our customers, and our services. Our continued success will depend on our ability to adapt to changing technologies and to improve theperformance, features, and reliability of our services in response to changing customer and industry demands.
Moreover, the introduction of new products and services embodying new technologies and the emergence of new industrystandards could render existing products and services obsolete. Our continued success will depend on our ability to adapt to changingtechnologies, manage and process ever-increasing amounts of data and information and improve the performance, features andreliability of our existing products and services in response to changing client and industry demands. We may experience difficultiesthat could delay or prevent the successful design, development, testing, introduction or marketing of our products and services. Newproducts and services, or enhancements to existing products and services, may not adequately meet the requirements of current andprospective clients or achieve any degree of significant market acceptance. If we fail to meet marketplace needs, other companies mayprovide competitive products and services, which could reduce demand for our offerings.
The success of our business depends on our ability to recruit persons to participate in our research surveys.
Our businesses use meters and diaries to gather data from participants. It is increasingly difficult and costly to obtain consent frompersons to participate in our research. In addition, it is increasingly difficult and costly to ensure the selected probability sample ofpersons mirrors the behaviors and characteristics of the entire population and covers all of the demographic segments requested by ourclients. Additionally, as consumers adopt modes of communication other than traditional telephone service, such as mobile, cable andInternet calling, it may become more difficult for our services to reach and recruit participants for our audience measurement services. Ifwe are unsuccessful in our efforts to recruit appropriate participants and maintain adequate participation levels, our clients may loseconfidence in our ratings services and we could lose the support of the relevant industry groups. If this were to happen, our audiencemeasurement services may be materially and adversely affected.
We have limited experience designing, recruiting and maintaining PPM panels. If we are unable to operate and maintain PPMpanels that appropriately balance research quality, panel size and operational cost, our financial results may suffer.
The commercial viability of our PPM ratings service and, potentially, other new business initiatives, is dependent on our ability todesign, recruit, and maintain panels of persons to carry our Portable People Meters, and to ensure appropriate panel composition toaccommodate a broad variety of media research services. Our research methodologies require us to maintain panels of sufficient sizeand appropriately representative demographic composition. Our research methodologies also require our panelists to comply withcertain standards, such as carrying the meter for a minimum number of hours each day and other survey tasks, in order for us to use thedata collected by the meter in estimating ratings.
We have commercialized the PPM ratings service in 48 PPM Markets. Maintaining the panels may prove to be more complex andresource intensive for us to manage than we currently anticipate.
Participation in a PPM panel requires panelist households to make a longer-term commitment than participation in our Diary-basedratings service. Designing, recruiting, and maintaining PPM panels are substantially different than recruiting participants for our Diary-based ratings service. We have limited experience in operating such PPM panels and we may encounter unanticipated difficulties as weattempt to do so. Without historical benchmarks on key sample performance metrics, it will be challenging for us to maintain theappropriate balance of research quality, panel size, and operational costs. Designing, recruiting, and maintaining such panels may alsocause us to incur expenses substantially in excess of our current expectations.
Copyright © 2013 www.secdatabase.com. All Rights Reserved.Please Consider the Environment Before Printing This Document

If we are unable to successfully design, recruit and maintain such PPM panels, or if we are required to incur expenses substantiallyin excess of our current expectations in order to do so, it could adversely impact our ability to obtain and/or maintain MRC accreditationof our PPM ratings service, adversely impact our ongoing dialogues with regulatory and governmental entities, or otherwise adverselyimpact our business, financial position and operating results.
22
Copyright © 2013 www.secdatabase.com. All Rights Reserved.Please Consider the Environment Before Printing This Document

Table of ContentsIn 2011, we began implementing certain methodological enhancements. If we are unable to implement the enhancements as
designed and for the anticipated cost or if the enhancements do not have the results we anticipate, our business could be adverselyimpacted.
During 2010, we committed to methodological enhancements designed to enhance our recruitment of participants, includingtargeted in-person recruiting and the implementation of a pure address-based sample frame. In 2011, we began implementing theseenhancements. If we are unable to implement the enhancements as we have designed them and for the cost we anticipate, our businesscould be adversely impacted. Additionally, if the methodological enhancements do not provide the results we anticipate, we may have tospend more money to produce the desired results by using a different method, which could adversely impact our business.
Data collection costs are increasing faster than has been our historical experience and if we are unable to become moreefficient in our data collection and our management of associated costs, our operating margins and results of operations couldsuffer.
Our success will depend on our ability to reach and recruit participants and to achieve response rates sufficient to maintain ouraudience ratings services. As consumers adopt modes of communication other than telephone landlines, such as cell phones and cable orInternet calling, it is becoming increasingly difficult for us to reach and recruit participants. Recent government estimates have indicatedthe percentage of cell-phone-only households has been increasing nationally. We seek to include in our samples a statisticallyrepresentative number of persons that reside in cell-phone-only households. We recruit cell-phone-only households based on thegovernment estimates, and thus, our ability to recruit is based on available data, which may not be up-to-date and is only provided inregional estimates, not market-by-market. It has been our experience that recruiting cell phone households and recruiting potentialpanelists in person is significantly more expensive than recruiting landline households. We have announced initiatives to increase thepercentage of our cell phone households in our Diary and PPM samples and to increase our in person recruitment efforts, which couldadversely impact our operating margins and results of operations.
We currently acquire our cell phone sample from a single vendor and if our sample volume increases or we are unable toutilize this vendor, it could be more expensive for us to acquire the necessary sample and may delay the full implementation of ourimprovement initiatives for cell phone sampling, which may harm our business.
We use an address-based sampling methodology to recruit cell phone households. We currently acquire the sample from a singlevendor. As our address-based sample volume increases, it may be more difficult for our vendor and more expensive for us to acquire thenecessary sample. If this vendor is unable to satisfy all of our requirements, we would have to bring some or all of the operations in-house or hire and train one or more additional vendors, which could increase expenses and delay the full implementation ofimprovement initiatives focused on cell phone sampling, which could harm our business.
We are subject to governmental oversight or influence, which may harm our business.
Federal, state, and local governmental entities, including state attorneys general, have asserted that our operations are subject tooversight or influence by them. Our ratings services in 48 large markets have undergone a change from manual, recall-based Diarymethodology to electronic, PPM-based methodology. This change has been subject to public attention, in particular, our PPM ratingsservice has been subject to increasing scrutiny by governmental entities. We expect continued governmental oversight relating to thisbusiness.
The governmental oversight environment could have a significant effect on us and our business. Among other things, we could befined or required to make other payments, prohibited from engaging in some of our business activities, or subject to limitations orconditions on our business activities. Significant governmental oversight action against us could have material adverse financial effects,cause significant reputational harm, or harm business prospects. New laws or regulations or changes in the enforcement of existing lawsor regulations applicable to us may also adversely affect our business.
Foreign currency exchange rates may adversely affect our results of operations and financial condition.
Copyright © 2013 www.secdatabase.com. All Rights Reserved.Please Consider the Environment Before Printing This Document

Sales and purchases in currencies other than the U.S. dollar expose us to fluctuations in foreign currencies relative to the U.S.dollar and may adversely affect our results of operations and financial condition. Increased strength of the U.S. dollar will increase theeffective price of our services sold in U.S. dollars into other countries, which may require us to lower our prices or adversely affect salesto the extent we do not increase local currency prices. Decreased strength of the U.S. dollar could adversely affect the cost of materials,products and services purchased overseas. Our international sales and expenses are also translated into U.S. dollars for reportingpurposes and the strengthening or weakening of the U.S. dollar could result in unfavorable translation effects.
23
Copyright © 2013 www.secdatabase.com. All Rights Reserved.Please Consider the Environment Before Printing This Document

Table of ContentsCriticism of our audience ratings service by various governmental entities, industry groups, and market segments could
adversely impact our business.
Due to the high-profile nature of our services in the media and marketing information services industry, we could become thetarget of additional government regulation, legislation, litigation, activism, or negative public relations efforts by various industrygroups, market segments, and other interested parties. We strive to be fair, transparent, and impartial in the production of our audiencemeasurement services, and the quality of our U.S. ratings services are voluntarily subject to review and accreditation by the MediaRating Council, a voluntary trade organization, whose members include many of our key client constituencies. However, criticism ofour business by special interests, and by clients with competing and often conflicting demands on our measurement services, couldresult in government regulation. While we believe that further government interactions and regulation are unnecessary, no assurance canbe given that legislation will not be enacted in the future that would subject our business to regulation, which could adversely affect ourbusiness.
We expect to operate in new business areas that require sophisticated data collection, processing systems, software, and rapidly-changing technology, which may require us to make significant investments in research and development and intellectual property.If we are not successful in doing so, it could adversely affect our business.
As traditional methods of media consumption evolve, we expect to operate in business areas that involve technology, methods, andservices that are new to us. We may not achieve a significant degree of market acceptance for these new technologies, methods, andservices, nor can we be certain that we will not infringe the intellectual property rights of third parties when offering future services inthese new areas. Our existing intellectual property rights may not cover any new technologies, methods, and services that we develop.We may face an increased number of intellectual property rights claims. The terms of the resolution of any such legal proceedings andclaims could:
� prohibit us from utilizing such technologies and methods or offering such services;
� require us to redesign or rebrand such technologies, methods, or services;
� require us to pay substantial damages;
� divert resources (financial, time, and personnel) to defend; or
� require us to expend financial resources to obtain licenses to use a third party�s intellectual property rights (and there is nocertainty that a financial licensing arrangement may be even available to us on acceptable terms, or at all).
As a result, we may be required to make significant investments in research and development as we design and develop or acquirenew technology, methods, and services.
We have operations outside of the United States that subject us to legal, business, political, cultural and other risks ofinternational operations.
We are expanding our international business activities, which subjects us to a number of risks and burdens, including:
� staffing and managing international operations across different geographic areas;
� multiple, conflicting and changing governmental laws and regulations;
� the possibility of protectionist laws and business practices that favor local companies;
� price and currency exchange rates and controls;
� taxes and tariffs;
� different business practices and legal standards, particularly with respect to intellectual property;
24
Copyright © 2013 www.secdatabase.com. All Rights Reserved.Please Consider the Environment Before Printing This Document

Table of Contents� difficulties in collecting accounts receivable, including longer payment cycles;
� political, social, and economic instability;
� designing and maintaining effective operating and financial controls;
� the possibility of failure of internal controls, including any failure to detect unauthorized transactions; and
� increased costs relating to personnel management as a result of government and other regulations.
In addition, economic conditions in our overseas markets may negatively impact the demand for our products abroad and benefitswe receive from those operations.
Work stoppages, union and works council campaigns, labor disputes and other matters associated with our internationalemployees could adversely impact our results of operations and cause us to incur incremental costs.
Certain of our international employees are subject to non-U.S. collective labor arrangements. We are subject to potential workstoppages, union and works council campaigns and potential labor disputes, any of which could adversely impact our productivity andresults of operations.
If the recent difficult economic environment worsens, it could adversely impact demand for our services, our customers��revenues or their ability to pay for our services.
Our customers derive most of their revenue from transactions involving the sale or purchase of advertising. During recentchallenging economic times, advertisers have reduced advertising expenditures, impacting advertising agencies and media. As a result,advertising agencies and media companies have been and may continue to be less likely to purchase our services, which has and couldcontinue to adversely impact our business, financial position, and operating results.
Continued market disruptions could cause broader economic downturns, which also may lead to lower demand for our services orto our customers that have expiring contracts with us not to renew or to renew for fewer services, increased incidence of customers�inability to pay their accounts, an increase in our provision for doubtful accounts, an increase in collection cycles for accountsreceivable, insolvency, or bankruptcy of our customers, any of which could adversely affect our results of operations, liquidity, cashflows, and financial condition. If the economic environment worsens or does not improve for an extended period into the future, it mayalso lead to an increase of incidences of customers� inability to pay their accounts, an increase in our provision for doubtful accounts,and a further increase in collection cycles for accounts receivable or insolvency of our customers. Additionally, we periodically receiverequests from our customers for pricing concessions. The current economic environment could exacerbate the level of requests.
If the recent difficult economic environment worsens, potential disruptions in the credit markets could adversely affect ourbusiness, including the availability and cost of short-term funds for liquidity requirements and our ability to meet long-termcommitments, which could adversely affect our results of operations, cash flows, and financial condition.
If internal funds are not available from our operations, we may be required to rely on the banking and credit markets to meet ourfinancial commitments and short-term liquidity needs. Disruptions in the capital and credit markets, as were experienced in recent years,could adversely affect our ability to draw on our revolving credit facility. Our access to funds under that credit facility is dependent onthe ability of the banks that are parties to the facility to meet their funding commitments. Those banks may not be able to meet theirfunding commitments to us if they experience shortages of capital and liquidity or if they experience excessive volumes of borrowingrequests from Arbitron and other borrowers within a short period of time.
Longer-term disruptions in the capital and credit markets as a result of uncertainty, changing or increased regulation, reducedalternatives, or failures of significant financial institutions could adversely affect our access to liquidity needed for our business. Anydisruption could require us to take measures to conserve cash until the markets stabilize or until alternative credit arrangements or otherfunding for our business needs can be arranged. Such measures could include deferring capital expenditures and investments, andreducing or eliminating future share repurchases, dividend payments or other discretionary uses of cash. Any disruption and themeasures we take in response could adversely affect our business.
Copyright © 2013 www.secdatabase.com. All Rights Reserved.Please Consider the Environment Before Printing This Document

25
Copyright © 2013 www.secdatabase.com. All Rights Reserved.Please Consider the Environment Before Printing This Document
Table of ContentsWe may fail to attract or retain the qualified research, sales, marketing, information technology, and managerial personnel,
and key executive officers required to operate our business successfully.
Our success is largely dependent on the skills, experience, and efforts of our senior management and certain other key personnel.If, for any reason, one or more senior executives or key personnel were not to remain active in our company, our results of operationscould be adversely affected.
Our success will depend on our ability to protect our intellectual property rights, which may require substantial expense toobtain, enforce and defend our intellectual property rights which could adversely affect our business.
We believe that the success of our business will depend, in part, on:
� obtaining patent protection for our technology, proprietary methods, and services, and in particular, our PPM ratings service;
� defending and enforcing our patents once obtained;
� preserving our trade secrets;
� defending and enforcing our copyrights for our data services and audience estimates;
� operating without infringing upon patents and proprietary rights held by others; and
� acquiring, developing and enhancing various intellectual property rights associated with services and products acrossmultiple forms of media apart from radio.
We rely on a combination of contractual provisions, confidentiality procedures and patent, copyright, trademark, service mark andtrade secret laws to protect the proprietary aspects of our technology, data and estimates. Some patents related to our PPM technologyand its methods expire at various times beginning in 2012. Our patents, when viewed in the aggregate, are of material importance to us.These legal measures afford only limited protection, and competitors may gain access to our intellectual property and proprietaryinformation. Litigation may be necessary to enforce our intellectual property rights, to protect our trade secrets and to determine thevalidity and scope of our proprietary rights. We have been involved in litigation relating to the enforcement of the copyrights coveringour radio listening estimates. Although we have generally been successful in these cases, there can be no assurance that the copyrightlaws and other statutory and contractual arrangements we currently depend upon will provide us sufficient protection to prevent the useor misappropriation of our audience estimates, databases and technology in the future. Litigation, regardless of outcome, could result insubstantial expense and a significant diversion of resources with no assurance of success and could adversely impact our business,financial position and operating results.
In addition, despite the foregoing efforts to obtain, protect and enforce our intellectual property rights, Arbitron may be required todefend against third-party claims that our technology potentially infringes their proprietary rights, or that our issued patents are invalid,or other issues related to our intellectual property rights. As a result, we may incur substantial expense in defending against suchallegations and/or in settling such claims. Such claims could divert management�s attention and require significant expenditures with noassurances of success.
Costs or judgments associated with significant legal proceedings may adversely affect our results of operations.
We are party to a number of legal proceedings and governmental entity investigations and other interactions. It is possible that theeffect of these unresolved matters or costs and/or judgments incurred by us in connection with such proceedings or interactions could bematerial to our consolidated results of operations. For a discussion of these unresolved matters, see �Item 3. Legal Proceedings.� Thesematters have resulted in, and may continue to result in, a diversion of our management�s time and attention as well as significant costsand expenses.
26
Copyright © 2013 www.secdatabase.com. All Rights Reserved.Please Consider the Environment Before Printing This Document
Table of ContentsOur future growth and success will depend on our ability to compete successfully with companies that may have financial,
marketing, technical, and other advantages over us.
We compete with many companies, some of which are larger and have access to greater capital resources. We believe our futuregrowth and success will depend on our ability to compete successfully with other companies that provide similar services in the samemarkets, some of which may have financial, marketing, technical, and other advantages. We cannot provide any assurance we will beable to compete successfully, and the failure to do so could have a material adverse impact on our business, financial position, andoperating results.
The loss or insolvency of any of our key customers would significantly reduce our revenue and operating results.
We are dependent on a number of key customers, the loss or insolvency of which would significantly reduce our revenue andoperating results. In 2011, Clear Channel represented approximately 19 percent of our revenue. Several other large customersrepresented significant portions of our 2011 revenue.
We cannot provide any assurances we could replace the revenue that would be lost if any of our key customers failed to renew allor part of their agreements with us. The loss or insolvency of any of our key customers would materially and adversely impact ourbusiness, financial position and operating results.
Our agreements with our customers are not exclusive and contain no renewal obligations. The failure of our customers torenew all or part of their contracts could have an adverse impact on our business, financial position and operating results.
Our customer agreements do not prohibit our customers from entering into agreements with any other competing service provider,and once the term of the agreement (usually one to seven years) expires, there is generally no automatic renewal feature in our customercontracts. It is not unusual for our customer contracts to expire before renewal negotiations are concluded. Therefore, there may besignificant uncertainty as to whether a particular customer will renew all or part of its contract and, if so, the particular terms of suchrenewal. If a customer owning stations in a significant number of markets does not renew its contracts, this would have an adverseimpact on our business, financial position and operating results.
Long-term agreements with our customers limit our ability to increase the prices we charge for our services if our costsincrease.
We generally enter into long-term contracts with our customers, including contracts for delivery of our radio audience ratingsservices. The term of these customer agreements usually ranges from one to seven years. Over the term of these agreements our costs ofproviding services may increase, or increase at rates faster than our historical experience. Although our customer contracts generallyprovide for annual price increases, there can be no assurance these contractual revenue increases will exceed any increased cost ofproviding our services, which could have an adverse impact on our business, financial position and operating results.
The success of our radio audience ratings business depends on diarykeepers who record their listening habits in diaries andreturn these diaries to us and on panelists who carry our PPM devices. Our failure to collect these diaries or to recruit compliantparticipants could adversely impact our business.
We use listener diaries and electronic data gathered from participants who agree to carry our PPM devices to gather radio listeningdata from sample households in the United States local markets for which we currently provide radio ratings. A representative sample ofthe population in each local market is randomly selected for each survey. To encourage their participation in our surveys, we giveparticipants a cash incentive. It is becoming increasingly difficult and more costly to obtain consent from the sample to participate in thesurveys, especially among younger demographic groups. Achieving adequate response rates is important to maintain confidence in ourratings, the support of the industry and accreditation by the MRC. Our failure to successfully recruit compliant survey participants couldadversely impact our business, financial position and operating results. Our survey and panel participants do so, on a voluntary basisonly, and there can be no assurance they will continue to do so.
Copyright © 2013 www.secdatabase.com. All Rights Reserved.Please Consider the Environment Before Printing This Document

Errors, defects or disruptions in the hardware or software used to produce or deliver our services could diminish demand forour services and subject us to substantial liability.
Because our services are complex and we have deployed a variety of new computer hardware and software, both developed in-house and acquired from third-party vendors, our hardware or software used to produce or deliver our services may have errors ordefects that could result in unanticipated downtime for our subscribers and harm our reputation and our business. We have from time totime found defects in the hardware or software used to produce or deliver our services and new errors in our existing software servicesmay be detected in the future. In addition, our customers may use our software services in unanticipated ways that may cause
27
Copyright © 2013 www.secdatabase.com. All Rights Reserved.Please Consider the Environment Before Printing This Document
Table of Contentsa disruption in software service for other customers attempting to access our data. Because the services we provide are important to ourcustomers� businesses, any errors, defects, or disruptions in the hardware or software used to produce or deliver our services could hurtour reputation and may damage our customers� businesses. If that occurs, customers could elect not to renew, or delay or withholdpayment to us, we could lose future sales, or customers may make claims against us, which could adversely impact our business,financial position, and results of operations.
Interruptions, delays, or unreliability in the delivery of our services could adversely affect our reputation and reduce ourrevenues.
Our customers currently access our services via the Internet. We currently rely on third parties to provide data services and disasterrecovery data services. Despite any precautions we may take, any unsuccessful or delayed data transfers may impair the delivery of ourservices. Further, any damage to, or failure of, our systems generally could result in interruptions in our service. Interruptions in ourservice may reduce our revenue, cause us to issue credits or pay penalties, cause customers to terminate their subscriptions andadversely affect our renewal rates and our ability to attract new customers. Our business may be further harmed if customers andpotential customers believe our services are unreliable.
We rely on third parties to provide data and services in connection with our current business and we may require additionalthird-party data and services to expand our business in the future, which, if unavailable for our use or not available to us onacceptable terms, could adversely impact our business.
In the event that third-party data and services are unavailable for our use or are not available to us on acceptable terms, ourbusiness could be adversely impacted. Further, in order for us to build on our experience in the radio audience ratings industry andexpand into ratings for other types of media, we may need to enter into agreements with third parties. Our inability to enter into theseagreements with third parties at all or upon favorable terms, when necessary, could adversely impact our growth and business.
We are dependent on our proprietary software and hardware systems for current and future business requirements. Significantdelays in the completion of these systems, cost overages and/or inadequate performance or failure of the systems once completedcould adversely impact our business, financial position and operating results.
We are increasingly reliant on our proprietary software and hardware systems. We are engaged in an effort to upgrade, enhance,and, where necessary, replace our internal processing software for Diary and PPM ratings services, and our client software. Significantdelays in the completion of these systems, or cost overages, could have an adverse impact on our business and inadequate performanceor failure of these systems, once completed, could adversely impact our business, financial position and operating results.
If our proprietary systems such as PPM devices, in-home beacons, media encoders, or related firmware inadequately perform orfail, our ability to provide our PPM ratings services could be significantly impacted and such impact could materially and adverselyimpact our business, financial position and operating results.
Operation of the PPM ratings service is dependent on a limited number of vendors that assemble the PPM equipmentaccording to our proprietary design as well as on those who manufacture parts.
We will need to purchase equipment used in the PPM ratings service and we are currently dependent on two vendors to assembleour PPM equipment. The equipment must be assembled by the vendors in a timely manner, in the quantities needed and with the qualitynecessary to function appropriately in the market. Certain specialized parts used in the PPM equipment may impact the manufacturingand the timing of the delivery of the equipment to us. We may become liable for design or manufacturing defects in the PPM equipment.In addition, if countries and states enact additional regulations limiting certain materials, we may be required to redesign some of ourPPM components to meet these regulations. A redesign process, whether as a result of changed environmental regulations or our abilityto obtain quality parts, may impact the manufacturing and timing of the delivery of the equipment to us. Our failure to obtain, in atimely manner, sufficient quantities of quality equipment to meet our needs could adversely impact the commercial deployment of thePPM ratings service and therefore could adversely impact our operating results.
Copyright © 2013 www.secdatabase.com. All Rights Reserved.Please Consider the Environment Before Printing This Document

Ownership shifts in the radio broadcasting industry may put pressure on the pricing of our quantitative radio audience ratingsservice and related software sales, thereby leading to decreased earnings growth.
Ownership shifts in the radio broadcasting industry could put pressure on the pricing of our quantitative radio audience ratingsservice and related software sales, from which we derive a substantial portion of our total revenue. We price our quantitative radio
28
Copyright © 2013 www.secdatabase.com. All Rights Reserved.Please Consider the Environment Before Printing This Document
Table of Contentsaudience ratings service and related software applications on a per radio station, per service or per product basis, negotiating licensesand pricing with the owner of each radio station or group of radio stations. If we agree to make substantial price concessions, it couldadversely impact our business, financial position and operating results.
The marketing of enhanced access to our respondent-level data to third-party data processors could adversely impact therevenue derived from our existing software licenses.
We market our respondent-level database and the related software we use to calculate our audience estimates to certain thirdparties, which allows them enhanced access to our respondent-level database. Previously, limited access to our respondent-level datawas available only to those customers who licensed certain software services directly from us. As we license our enhanced access to therespondent-level data and software, sales of our existing software services may be adversely impacted.
Advertisers are pursuing increased accountability from the media industry for a return on their investments made in media,which could reduce demand for our services.
If advertisers see radio as less accountable, advertisers may shift advertising expenditures away from media that they perceive asless accountable. As a result, advertising agencies and radio stations may be less likely to purchase our media information services,which could have an adverse impact on our business, financial position and operating results.
Long-term disruptions in the mail, public utilities, telecommunication infrastructure and/or air service could adversely impactour business.
Our business is dependent on the use of the mail, public utilities, telecommunication infrastructure and air service. Long-termdisruptions in one or more of these services, or orders of civil authority, which could be caused by events such as weather, naturaldisasters, the outbreak of war, the escalation of hostilities and/or acts of terrorism could adversely impact our business, financialposition and operating results.
If the lump-sum payments made to retiring participants in our defined benefit plans exceed the total of the service cost and theinterest cost in any year, we would need to record a loss, which may materially reduce our operating results.
Our defined benefit plans allow participants to receive a lump-sum distribution for benefits earned in lieu of annuity paymentswhen they retire from Arbitron. If the lump-sum distributions made for a calendar year exceed the total of the service cost and interestcost, we must recognize in that year�s results of operations the pro rata portion of unrecognized actuarial loss equal to the percentagereduction of the projected benefit obligation. During the years ended December 31, 2010, 2009, and 2008, lump-sum payments incertain of our defined benefit plans exceeded the total of the service cost and the interest cost. This resulted in the recognition of a lossin the amount of $1.2 million, $1.8 million, and $1.7 million for the years ended December 31, 2010, 2009, and 2008, respectively.While this did not occur in 2011, we cannot predict if or when the lump-sum payments in certain of our defined benefit plans may againexceed the total of the service cost and the interest cost. Any resulting adjustment could materially reduce operating results. See Note 12in the Notes to Consolidated Financial Statements contained in this Annual Report on Form 10-K for more information regarding ourretirement plans.
If our subsidiary in India fails to attract or retain talented software developers and is not successful, we may incur losses.
The success of our subsidiary in India may be dependent on our ability to attract and retain talented software developers. Themarket for highly skilled workers in software development in India is becoming increasingly more competitive. If we are unable toattract and retain employees, we may need to shut down the facility, and this could adversely impact our financial position and operatingresults.
Risk Factors Relating to Our Indebtedness
Our credit facility contains restrictive covenants that limit our financial flexibility, which could adversely affect our ability toconduct our business.
Copyright © 2013 www.secdatabase.com. All Rights Reserved.Please Consider the Environment Before Printing This Document

On November 21, 2011, we entered into a five-year, $150.0 million revolving credit facility that contains financial terms,covenants and operating restrictions that could restrict our financial flexibility and could adversely impact our ability to conduct ourbusiness. These include:
� the requirement that we maintain certain leverage and coverage ratios; and
29
Copyright © 2013 www.secdatabase.com. All Rights Reserved.Please Consider the Environment Before Printing This Document

Table of Contents� restrictions on our ability to sell certain assets, incur additional indebtedness and grant or incur liens on our assets.
These restrictions may limit or prohibit our ability to raise additional debt capital when needed or could prevent us from investingin growth initiatives. Our ability to comply with these financial requirements and other restrictions may be affected by events beyondour control, and our inability to comply with them could result in a default under the terms of the agreement.
If a default occurs, either because we are unable to generate sufficient cash flow to service debt or because we fail to comply withone or more of the restrictive covenants, the lenders could elect to declare all of the then-outstanding borrowings, as well as accruedinterest and fees, to be immediately due and payable. In addition, a default may result in the application of higher rates of interest on theamounts due, resulting in higher interest expense being incurred by us.
Further, as discussed above in �Risk Factors Relating to Our Business and the Industry in Which We Operate,� continued orintensified disruption in the credit markets may adversely affect our ability to draw on our credit facility, which could adversely affectour business.
Risk Factors Relating to Owning Our Common Stock
Changes in market conditions, or sales of our common stock, could adversely impact the market price of our common stock.
The market price of our common stock depends on various financial and market conditions, which may change from time to timeand which are outside of our control.
Sales of a substantial number of shares of our common stock, or the perception that such sales could occur, also could adverselyimpact prevailing market prices for our common stock. In addition to the possibility that we may sell shares of our common stock in apublic offering at any time, we also may issue shares of common stock in connection with grants of restricted stock or upon exercise ofstock options that we grant to our directors, officers and employees. All of these shares will be available for sale in the public marketsfrom time to time.
It may be difficult for a third party to acquire us, which could depress the stock price of our common stock.
Delaware corporate law and our Amended and Restated Certificate of Incorporation and Bylaws contain provisions that could havethe effect of delaying, deferring or preventing a change in control of Arbitron or the removal of existing management or directors and,as a result, could prevent our stockholders from being paid a premium for their common stock over the then-prevailing market price.These provisions could also limit the price that investors might be willing to pay in the future for shares of our common stock. Theseinclude:
� a stockholders� rights plan, which likely will limit, through November 21, 2012, the ability of a third party to acquire asubstantial amount of our common stock without prior approval by the Board of Directors;
� restriction from engaging in a �business combination� with an �interested stockholder� for a period of three years after thedate of the transaction in which the person became an interested stockholder under Section 203 of the Delaware GeneralCorporation Law;
� authorization to issue one or more classes of preferred stock that can be created and issued by the Board of Directors withoutprior stockholder approval, with rights senior to common stockholders;
� advance notice requirements for the submission by stockholders of nominations for election to the Board of Directors and forproposing matters that can be acted upon by stockholders at a meeting; and
� requirement of a supermajority vote of 80 percent of the stockholders to exercise the stockholders� right to amend theBylaws.
Our Amended and Restated Certificate of Incorporation also contains the following provisions, which could prevent transactionsthat are in the best interest of stockholders:
Copyright © 2013 www.secdatabase.com. All Rights Reserved.Please Consider the Environment Before Printing This Document

� requirement of a supermajority vote of two-thirds of the stockholders to approve some mergers and other businesscombinations; and
30
Copyright © 2013 www.secdatabase.com. All Rights Reserved.Please Consider the Environment Before Printing This Document

Table of Contents� restriction from engaging in a �business combination� with a �controlling person� unless either a modified supermajority
vote is received or the business combination will result in the termination of ownership of all shares of our common stockand the receipt of consideration equal to at least �fair market value.�
ITEM 1B. UNRESOLVED STAFF COMMENTS
None.
ITEM 2. PROPERTIES
Our headquarters is located at 9705 Patuxent Woods Drive, Columbia, Maryland. In addition, we have five regional sales officeslocated in the metropolitan areas of New York City, New York; Atlanta, Georgia; Chicago, Illinois; Dallas, Texas; and Los Angeles,California; and operations offices in Dallas, Texas; Birmingham, Alabama; Espoo, Finland; and Kochi, India. We conduct all of ouroperations in leased facilities. Most of these leases contain renewal options and require payments for taxes, insurance and maintenancein addition to base rental payments. We believe that our facilities are sufficient for their intended purposes and are adequatelymaintained.
ITEM 3. LEGAL PROCEEDINGS
We are involved, from time to time, in litigation and proceedings, including with governmental authorities, arising out of theordinary course of business. Legal costs for services rendered in the course of these proceedings are charged to expense as they areincurred.
On April 30, 2008, Plumbers and Pipefitters Local Union No. 630 Pension-Annuity Trust Fund filed a securities class actionlawsuit in the United States District Court for the Southern District of New York on behalf of a purported Class of all purchasers ofArbitron common stock between July 19, 2007, and November 26, 2007. The plaintiff asserts that Arbitron, Stephen B. Morris (ourformer Chairman, President and Chief Executive Officer), and Sean R. Creamer (currently our Executive Vice President, ChiefOperating Officer and formerly Chief Financial Officer) violated federal securities laws. The plaintiff alleges misrepresentations andomissions relating, among other things, to the delay in commercialization of our PPM ratings service in November 2007, as well asstock sales during the period by company insiders who were not named as defendants and Messrs. Morris and Creamer. The plaintiffsought class certification, compensatory damages plus interest and attorneys� fees, among other remedies. On September 22, 2008 theplaintiff filed an Amended Class Action Complaint. On November 25, 2008, Arbitron, Mr. Morris, and Mr. Creamer each filed Motionsto Dismiss the Amended Class Action Complaint. In September 2009, the plaintiff sought leave to file a Second Amended Class ActionComplaint in lieu of oral argument on the pending Motions to Dismiss. The court granted leave to file a Second Amended Class ActionComplaint and denied the pending Motions to Dismiss without prejudice. On or about October 19, 2009, the plaintiff filed a SecondAmended Class Action Complaint. Briefing on motions to dismiss the Second Amended Class Action Complaint was completed inMarch 2010. Arbitron and each of Mr. Morris and Mr. Creamer again moved to dismiss the Second Amended Class Action Complaint.On September 24, 2010, the Court granted Mr. Creamer�s motion to dismiss the plaintiff�s claims against him, and all claims againstMr. Creamer were dismissed with prejudice. The motions to dismiss the Second Amended Class Action Complaint by Arbitron andMr. Morris were denied. Arbitron and Mr. Morris each then filed answers denying the claims. On September 6, 2011, the Court enteredan order granting the plaintiff�s motion to certify the action as a class action, to appoint the lead plaintiff as class representative, and toappoint its counsel as lead counsel. The court defined the class as all purchasers of common stock of the Company who were damagedthrough purchasing stock during the period July 19, 2007 through November 26, 2007. On February 3, 2012, as a result of a mediationprocess overseen by an independent mediator, the Company and its insurers agreed to settle the case for $7 million, which will befunded by insurance. Because this is a class action, settlements of this type are subject to preliminary and final review by the Court withan opportunity for class members to respond to the proposed settlement and object if they so desire. That process typically takes 4-5months and has not yet begun.
On or about June 13, 2008, a purported stockholder derivative lawsuit, Pace v. Morris, et al., was filed against Arbitron, as anominal defendant, each of our directors, and certain of our current and former executive officers in the Supreme Court of the State of
Copyright © 2013 www.secdatabase.com. All Rights Reserved.Please Consider the Environment Before Printing This Document

New York for New York County. The derivative lawsuit is based on essentially the same substantive allegations as the securities classaction lawsuit. The derivative lawsuit asserts claims against the defendants for misappropriation of information, breach of fiduciaryduty, abuse of control, and unjust enrichment. On July 28, 2011 the derivative plaintiff filed an amended complaint that reiterates, in
31
Copyright © 2013 www.secdatabase.com. All Rights Reserved.Please Consider the Environment Before Printing This Document
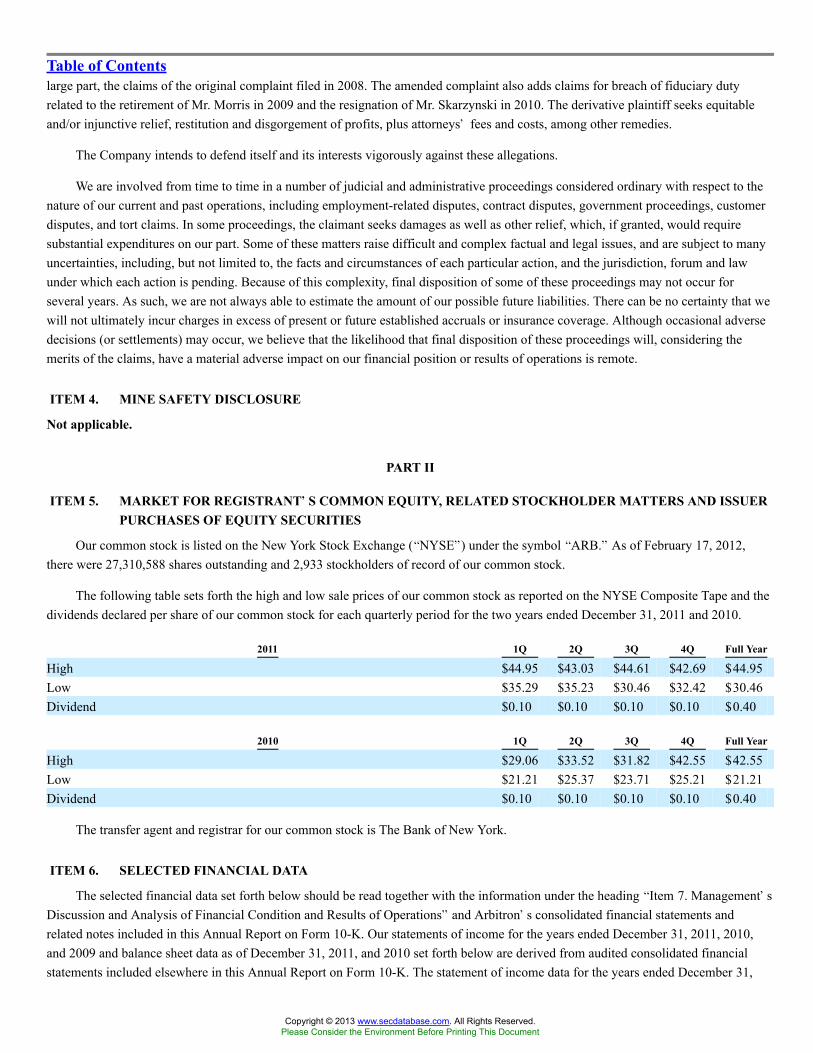
Table of Contentslarge part, the claims of the original complaint filed in 2008. The amended complaint also adds claims for breach of fiduciary dutyrelated to the retirement of Mr. Morris in 2009 and the resignation of Mr. Skarzynski in 2010. The derivative plaintiff seeks equitableand/or injunctive relief, restitution and disgorgement of profits, plus attorneys� fees and costs, among other remedies.
The Company intends to defend itself and its interests vigorously against these allegations.
We are involved from time to time in a number of judicial and administrative proceedings considered ordinary with respect to thenature of our current and past operations, including employment-related disputes, contract disputes, government proceedings, customerdisputes, and tort claims. In some proceedings, the claimant seeks damages as well as other relief, which, if granted, would requiresubstantial expenditures on our part. Some of these matters raise difficult and complex factual and legal issues, and are subject to manyuncertainties, including, but not limited to, the facts and circumstances of each particular action, and the jurisdiction, forum and lawunder which each action is pending. Because of this complexity, final disposition of some of these proceedings may not occur forseveral years. As such, we are not always able to estimate the amount of our possible future liabilities. There can be no certainty that wewill not ultimately incur charges in excess of present or future established accruals or insurance coverage. Although occasional adversedecisions (or settlements) may occur, we believe that the likelihood that final disposition of these proceedings will, considering themerits of the claims, have a material adverse impact on our financial position or results of operations is remote.
ITEM 4. MINE SAFETY DISCLOSURE
Not applicable.
PART II
ITEM 5. MARKET FOR REGISTRANT��S COMMON EQUITY, RELATED STOCKHOLDER MATTERS AND ISSUERPURCHASES OF EQUITY SECURITIES
Our common stock is listed on the New York Stock Exchange (�NYSE�) under the symbol �ARB.� As of February 17, 2012,there were 27,310,588 shares outstanding and 2,933 stockholders of record of our common stock.
The following table sets forth the high and low sale prices of our common stock as reported on the NYSE Composite Tape and thedividends declared per share of our common stock for each quarterly period for the two years ended December 31, 2011 and 2010.
2011 1Q 2Q 3Q 4Q Full Year
High $44.95 $43.03 $44.61 $42.69 $44.95Low $35.29 $35.23 $30.46 $32.42 $30.46Dividend $0.10 $0.10 $0.10 $0.10 $0.40
2010 1Q 2Q 3Q 4Q Full Year
High $29.06 $33.52 $31.82 $42.55 $42.55Low $21.21 $25.37 $23.71 $25.21 $21.21Dividend $0.10 $0.10 $0.10 $0.10 $0.40
The transfer agent and registrar for our common stock is The Bank of New York.
ITEM 6. SELECTED FINANCIAL DATA
The selected financial data set forth below should be read together with the information under the heading �Item 7. Management�sDiscussion and Analysis of Financial Condition and Results of Operations� and Arbitron�s consolidated financial statements andrelated notes included in this Annual Report on Form 10-K. Our statements of income for the years ended December 31, 2011, 2010,and 2009 and balance sheet data as of December 31, 2011, and 2010 set forth below are derived from audited consolidated financialstatements included elsewhere in this Annual Report on Form 10-K. The statement of income data for the years ended December 31,
Copyright © 2013 www.secdatabase.com. All Rights Reserved.Please Consider the Environment Before Printing This Document

2008, and 2007 and balance sheet data as of December 31, 2009, 2008, and 2007 are derived from audited consolidated financialstatements of Arbitron not included in this Annual Report on Form 10-K.
32
Copyright © 2013 www.secdatabase.com. All Rights Reserved.Please Consider the Environment Before Printing This Document
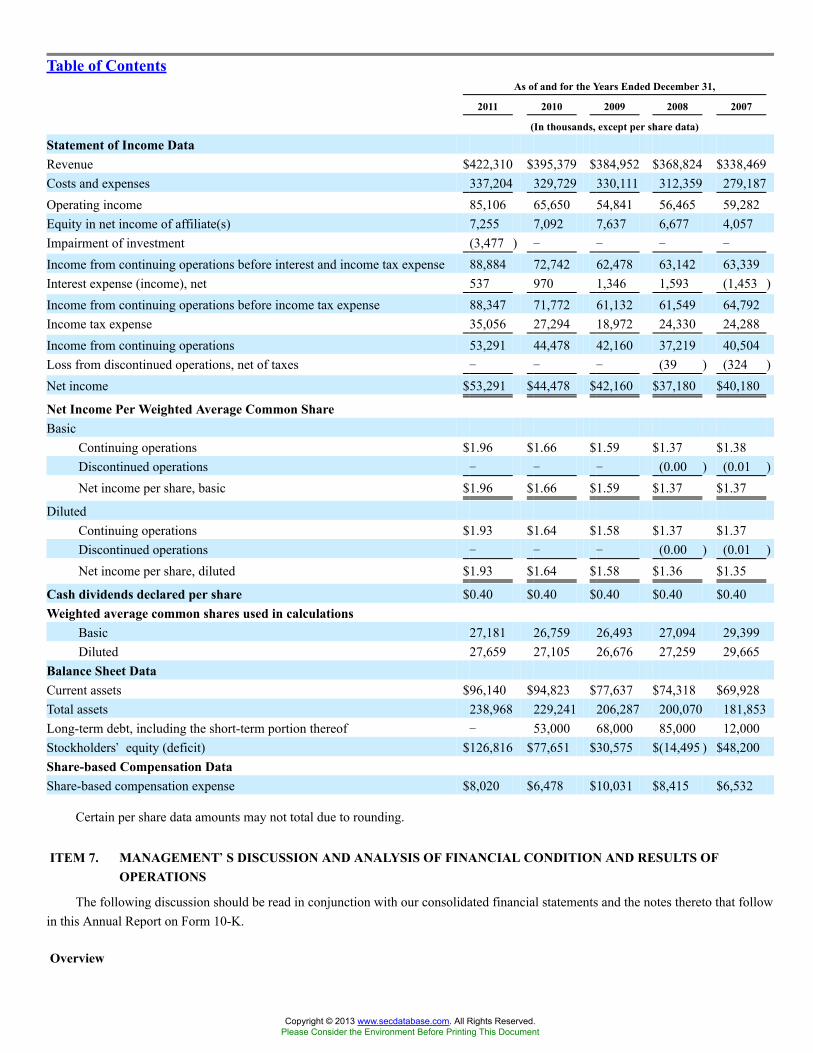
Table of ContentsAs of and for the Years Ended December 31,
2011 2010 2009 2008 2007
(In thousands, except per share data)
Statement of Income DataRevenue $422,310 $395,379 $384,952 $368,824 $338,469Costs and expenses 337,204 329,729 330,111 312,359 279,187Operating income 85,106 65,650 54,841 56,465 59,282Equity in net income of affiliate(s) 7,255 7,092 7,637 6,677 4,057Impairment of investment (3,477 ) � � � �
Income from continuing operations before interest and income tax expense 88,884 72,742 62,478 63,142 63,339Interest expense (income), net 537 970 1,346 1,593 (1,453 )Income from continuing operations before income tax expense 88,347 71,772 61,132 61,549 64,792Income tax expense 35,056 27,294 18,972 24,330 24,288Income from continuing operations 53,291 44,478 42,160 37,219 40,504Loss from discontinued operations, net of taxes � � � (39 ) (324 )Net income $53,291 $44,478 $42,160 $37,180 $40,180
Net Income Per Weighted Average Common ShareBasic
Continuing operations $1.96 $1.66 $1.59 $1.37 $1.38Discontinued operations � � � (0.00 ) (0.01 )Net income per share, basic $1.96 $1.66 $1.59 $1.37 $1.37
DilutedContinuing operations $1.93 $1.64 $1.58 $1.37 $1.37Discontinued operations � � � (0.00 ) (0.01 )Net income per share, diluted $1.93 $1.64 $1.58 $1.36 $1.35
Cash dividends declared per share $0.40 $0.40 $0.40 $0.40 $0.40Weighted average common shares used in calculations
Basic 27,181 26,759 26,493 27,094 29,399Diluted 27,659 27,105 26,676 27,259 29,665
Balance Sheet DataCurrent assets $96,140 $94,823 $77,637 $74,318 $69,928Total assets 238,968 229,241 206,287 200,070 181,853Long-term debt, including the short-term portion thereof � 53,000 68,000 85,000 12,000Stockholders� equity (deficit) $126,816 $77,651 $30,575 $(14,495 ) $48,200Share-based Compensation DataShare-based compensation expense $8,020 $6,478 $10,031 $8,415 $6,532
Certain per share data amounts may not total due to rounding.
ITEM 7. MANAGEMENT��S DISCUSSION AND ANALYSIS OF FINANCIAL CONDITION AND RESULTS OFOPERATIONS
The following discussion should be read in conjunction with our consolidated financial statements and the notes thereto that followin this Annual Report on Form 10-K.
Overview
Copyright © 2013 www.secdatabase.com. All Rights Reserved.Please Consider the Environment Before Printing This Document

Historically, our quantitative radio ratings services and related software have accounted for a substantial majority of our revenue.Our quantitative radio ratings services and related software accounted for approximately 88 percent of our total revenue in each of theyears ended December 31, 2011, 2010, and 2009. We have one segment which meets the quantitative thresholds for being a reportablesegment. While we expect our quantitative radio ratings services and related software licensing will continue to account for the majorityof our revenue for the foreseeable future, we are actively seeking opportunities to diversify our revenue base by, among other things,leveraging the investment we have made in our PPM ratings service and technology.
33
Copyright © 2013 www.secdatabase.com. All Rights Reserved.Please Consider the Environment Before Printing This Document
Table of ContentsWe have commercialized our PPM ratings service in 48 of the largest United States radio markets. We may choose to
commercialize our PPM ratings service in additional markets in the future. These agreements provide for a higher fee for PPM-basedratings than we charged for our Diary-based ratings. Our customer contracts are typically structured to phase in higher PPM servicerates over multiple years, including 2012 for some customers.
As we commercialized the PPM ratings service over several years, we incurred expenses to build the PPM panel in each PPMMarket in the months before commercializing the service in that market. These costs were incremental to the costs associated with ourDiary-based ratings service during those periods. With the completion of our previously announced commercialization plan as ofDecember 31, 2010, our future performance will be impacted by our ability to address a variety of challenges and opportunities in themarkets and industries we serve, including our ability to continue to maintain and improve the quality of our PPM and Diary ratingsservice, and manage increased costs for data collection, arising among other ways, from address-based sampling, targeted in-personrecruiting and increased numbers of cell phone households, which are more expensive for us to recruit than households with landlinephones. We currently anticipate that the aggregate cost of cell phone household recruitment for the PPM and Diary services, address-based sampling in PPM Markets, and targeted in-person recruitment for the PPM service will be approximately $18.0 million in 2012,as compared to approximately $15.5 million in 2011.
In addition, we are currently subject to U.S. and international data protection and privacy statutes, rules, and regulations, and mayin the future become subject to additional such statutes, rules, and regulations. Complying with these laws may require us to makecertain investments, make modifications to existing services, or prohibit us from offering certain types of services, any of which may bematerial and adversely impact our financial results. Failing to comply could result in civil and criminal liability, negative publicity, databeing blocked from use, and liability under contracts with our customers, vendors, and partners.
Zokem Oy
On July 28, 2011, we acquired Zokem Oy, a Finland-based mobile audience measurement and analytics firm, which is nowArbitron Mobile Oy. The purchase price for the acquisition was approximately $10.6 million in cash plus a contingent considerationarrangement which we currently estimate has a fair value of approximately $0.9 million. The arrangement provides for possibleadditional cash payments to be made by us to the former Zokem shareholders through 2015 of up to $12.0 million, contingent uponArbitron Mobile reaching certain future financial performance targets.
Credit Facility
On November 21, 2011, the Company terminated its credit facility agreement originally signed on December 20, 2006, which wasscheduled to expire on December 20, 2011 (�2006 Credit Facility�). There were no outstanding borrowings under the 2006 CreditFacility at the time of the termination. Also, on November 21, 2011, the Company entered into a new agreement with a consortium oflenders to provide up to $150.0 million of financing through a five-year, unsecured revolving credit facility expiring on November 21,2016. The agreement contains an expansion feature to increase the total financing available by up to $75.0 million to an aggregate of$225.0 million. See �� Liquidity and Capital Resources � Credit Facility� below for further information regarding the terms of ourcurrent credit facility agreement.
General Economic Conditions
Many of our customers derive most of their revenue from transactions involving the sale or purchase of advertising. During recentchallenging economic times, advertisers have reduced advertising expenditures, impacting advertising agencies and media. As a result,advertising agencies and media companies have been and may continue to be less likely to purchase our services, which has and couldcontinue to adversely impact our business, financial position, and operating results. If the recovery from the recent economic downturnslows or if the economy experiences another downturn in the foreseeable future, it may also lead to an increase of incidences ofcustomers� inability to pay their accounts, an increase in our provision for doubtful accounts, and a further increase in collection cyclesfor accounts receivable or insolvency of our customers.
Copyright © 2013 www.secdatabase.com. All Rights Reserved.Please Consider the Environment Before Printing This Document

We depend on a limited number of key customers for our ratings services and related software. For example, in 2011, ClearChannel represented approximately 19 percent of our total revenue. Additionally, although the amount of contract term revenueassociated with customer contracts expiring in 2012 is lower, as compared to historical standards, if one or more key customers do notrenew all or part of their contracts as they expire, we could experience a significant decrease in our operating results.
34
Copyright © 2013 www.secdatabase.com. All Rights Reserved.Please Consider the Environment Before Printing This Document

Table of ContentsCritical Accounting Policies and Estimates
Critical accounting policies and estimates are those that are both important to the presentation of our financial position or results ofoperations, and require our most difficult, complex or subjective judgments.
Software development costs. We capitalize software development costs with respect to significant internal use software initiativesor enhancements from the time the preliminary project stage is completed and management considers it probable the software will beused to perform the function intended, until the time the software is placed in service for its intended use. Once the software is placed inservice, the capitalized costs are amortized over periods of three to five years. We perform an assessment quarterly to determine if it isprobable all capitalized software will be used to perform its intended function. If an impairment exists, the software cost is written downto estimated fair value. As of December 31, 2011, and 2010, our capitalized software developed for internal use had carrying amounts of$28.9 million and $24.4 million, respectively, including $10.4 million and $12.4 million, respectively, of software related to the PPMservice.
Deferred income taxes. We use the asset and liability method of accounting for income taxes. Under this method, income taxexpense is recognized for the amount of taxes payable or refundable for the current year and for deferred tax assets and liabilities for thefuture tax consequences of events that have been recognized in an entity�s financial statements or tax returns. We must makeassumptions, judgments and estimates to determine the current provision for income taxes and also deferred tax assets and liabilities andany valuation allowance to be recorded against a deferred tax asset. Our assumptions, judgments, and estimates relative to the currentprovision for income taxes take into account current tax laws, interpretation of current tax laws and possible outcomes of current andfuture audits conducted by domestic and foreign tax authorities. Changes in tax law or interpretation of tax laws and the resolution ofcurrent and future tax audits could significantly impact the amounts provided for income taxes in the consolidated financial statements.Our assumptions, judgments and estimates relative to the value of a deferred tax asset take into account forecasts of the amount andnature of future taxable income. Actual operating results and the underlying amount and nature of income in future years could rendercurrent assumptions, judgments and estimates of recoverable net deferred tax assets inaccurate. We believe it is more likely than not thatwe will realize the benefits of these deferred tax assets. Any of the assumptions, judgments and estimates mentioned above could causeactual income tax obligations to differ from estimates, thus impacting our financial position and results of operations.
We include, in our tax calculation methodology, an assessment of the uncertainty in income taxes by establishing recognitionthresholds for our tax positions. Inherent in our calculation are critical judgments by management related to the determination of thebasis for our tax positions. For further information regarding our unrecognized tax benefits, see Note 11 in the Notes to ConsolidatedFinancial Statements contained in this Annual Report on Form 10-K.
Insurance receivables. During 2008, we became involved in two securities-law civil actions and a governmental interactionprimarily related to the commercialization of our PPM service. Since 2008, we have incurred a total of $12.1 million in legal fees andexpenses in connection with these matters. As of December 31, 2011, we have received an aggregate of $7.9 million in insurancereimbursements related to these legal fees and expenses. As of December 31, 2011, and 2010, our insurance claims receivable related tothese legal actions was approximately $1.0 million and $0.6 million, respectively, and these amounts are included in our prepaidexpenses and other current assets on our balance sheet. See Note 6 in our Notes to Consolidated Financial Statements for additionalinformation concerning our insurance recovery receivables.
Cost method investment. We account for our investment in TRA�s preferred stock using the cost method of accounting. TRA isclosely held and there is not an efficient market in which buyers and sellers determine the fair value of these securities. We periodicallyassess the fair value of our investment in TRA through comparative analysis and analysis of TRA�s actual and projected financialresults. Our assessment of the fair value of TRA requires the use of estimates and judgment. During the fourth quarter endedDecember 31, 2011, we determined that the fair value of our investment in TRA fell below its carrying value and we recorded a $3.5million impairment charge.
Contingent consideration. The agreement governing the acquisition of Zokem Oy, now Arbitron Mobile Oy, provides for possibleadditional cash payments to be made by us to the former Zokem shareholders through 2015 of up to $12.0 million, contingent uponArbitron Mobile reaching certain financial performance targets in the future. We estimated the fair value of this contingent consideration
Copyright © 2013 www.secdatabase.com. All Rights Reserved.Please Consider the Environment Before Printing This Document

to be approximately $0.9 million as of the July 28, 2011 acquisition date. We periodically estimate the fair value of the contingentconsideration and any change in fair value will be recognized in our consolidated financial results of operations. An increase in the earn-out expected to be paid will result in a charge to operations in the quarter the anticipated fair value of contingent considerationincreases, while a decrease in the earn-out expected to be paid will result in a credit to operations in the quarter the anticipated fair valueof contingent consideration decreases. The estimate of the fair value of contingent consideration requires subjective assumptions to bemade of future operating results. We estimated that the fair value of the earn-out decreased less than $0.1 million during the period fromthe date of acquisition to December 31, 2011. Future revisions to these assumptions could materially change our estimate of the fairvalue of contingent consideration and therefore materially affect our future financial results and financial condition.
35
Copyright © 2013 www.secdatabase.com. All Rights Reserved.Please Consider the Environment Before Printing This Document
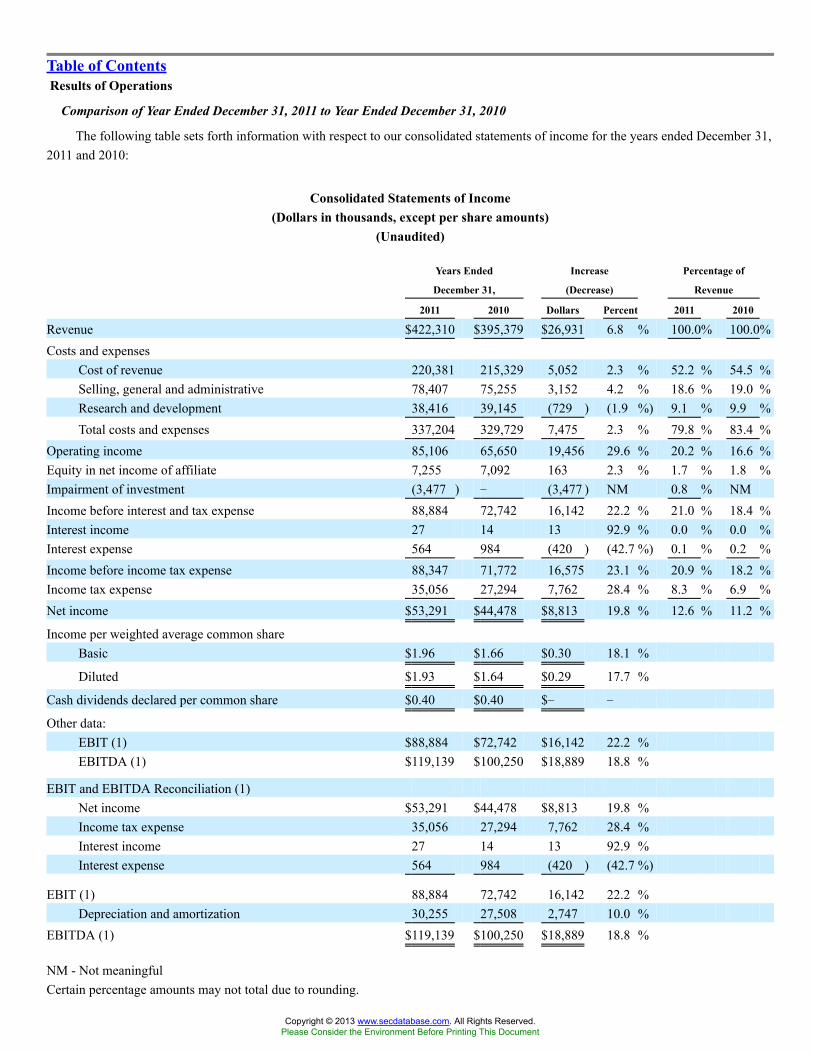
Table of ContentsResults of Operations
Comparison of Year Ended December 31, 2011 to Year Ended December 31, 2010
The following table sets forth information with respect to our consolidated statements of income for the years ended December 31,2011 and 2010:
Consolidated Statements of Income(Dollars in thousands, except per share amounts)
(Unaudited)
Years Ended Increase Percentage of
December 31, (Decrease) Revenue
2011 2010 Dollars Percent 2011 2010
Revenue $422,310 $395,379 $26,931 6.8 % 100.0% 100.0%Costs and expenses
Cost of revenue 220,381 215,329 5,052 2.3 % 52.2 % 54.5 %Selling, general and administrative 78,407 75,255 3,152 4.2 % 18.6 % 19.0 %Research and development 38,416 39,145 (729 ) (1.9 %) 9.1 % 9.9 %Total costs and expenses 337,204 329,729 7,475 2.3 % 79.8 % 83.4 %
Operating income 85,106 65,650 19,456 29.6 % 20.2 % 16.6 %Equity in net income of affiliate 7,255 7,092 163 2.3 % 1.7 % 1.8 %Impairment of investment (3,477 ) � (3,477 ) NM 0.8 % NMIncome before interest and tax expense 88,884 72,742 16,142 22.2 % 21.0 % 18.4 %Interest income 27 14 13 92.9 % 0.0 % 0.0 %Interest expense 564 984 (420 ) (42.7 %) 0.1 % 0.2 %Income before income tax expense 88,347 71,772 16,575 23.1 % 20.9 % 18.2 %Income tax expense 35,056 27,294 7,762 28.4 % 8.3 % 6.9 %Net income $53,291 $44,478 $8,813 19.8 % 12.6 % 11.2 %
Income per weighted average common shareBasic $1.96 $1.66 $0.30 18.1 %
Diluted $1.93 $1.64 $0.29 17.7 %
Cash dividends declared per common share $0.40 $0.40 $� �
Other data:EBIT (1) $88,884 $72,742 $16,142 22.2 %EBITDA (1) $119,139 $100,250 $18,889 18.8 %
EBIT and EBITDA Reconciliation (1)Net income $53,291 $44,478 $8,813 19.8 %Income tax expense 35,056 27,294 7,762 28.4 %Interest income 27 14 13 92.9 %Interest expense 564 984 (420 ) (42.7 %)
EBIT (1) 88,884 72,742 16,142 22.2 %Depreciation and amortization 30,255 27,508 2,747 10.0 %
EBITDA (1) $119,139 $100,250 $18,889 18.8 %
NM - Not meaningfulCertain percentage amounts may not total due to rounding.
Copyright © 2013 www.secdatabase.com. All Rights Reserved.Please Consider the Environment Before Printing This Document

(1) EBIT (earnings before interest and income taxes) and EBITDA (earnings before interest, income taxes, depreciation andamortization) are non-GAAP financial measures that we believe are useful to investors in evaluating our results. For furtherdiscussion of these non-GAAP financial measures, see paragraph below entitled �� EBIT and EBITDA.�
36
Copyright © 2013 www.secdatabase.com. All Rights Reserved.Please Consider the Environment Before Printing This Document

Table of ContentsRevenue. Revenue increased by 6.8% or $26.9 million for the year ended December 31, 2011, as compared to the same period in
2010. PPM-based ratings service revenue increased by $51.3 million primarily due to a full year impact for the 15 PPM Marketscommercialized during 2010, as well as price escalators in other PPM Markets commercialized prior to 2010. In addition, revenue for2011 was impacted by a $1.6 million increase in software service revenue, and a $1.0 million increase in PPM International revenue.These increases in revenue were partially offset by a $27.5 million decrease in revenue related to the transition from our Diary-basedratings service.
Cost of Revenue. Cost of revenue increased by 2.3% or $5.1 million for the year ended December 31, 2011, as compared to thesame period in 2010. Cost of revenue increased primarily due to a $1.5 million increase related to our computer center operations, a$1.3 million increase in labor costs, a $1.3 million increase in PPM-related costs, a $0.8 million increase in cross platform servicescosts, a $0.6 million increase in PPM International costs, and $0.5 million associated with our Arbitron Mobile service acquired duringthe third quarter of 2011. These increases in cost of revenue were partially offset by a $2.0 million decrease for Diary-based servicecosts related primarily to the corresponding reduction in the number of Diary markets.
Selling, General, and Administrative. Selling, general, and administrative increased by 4.2% or $3.2 million for the year endedDecember 31, 2011, as compared to the same period in 2010. Selling, general, and administrative increased primarily due to $2.7million in Arbitron Mobile-related costs and expenses incurred during 2011, a $2.5 million increase in share-based and long-termemployee incentive compensation expense, a $2.0 million increase in short-term employee incentive compensation expense, and a $0.9million increase in bad debt expense incurred in 2011 as compared to 2010. These increases were partially offset by a $3.7 milliondecrease in employee separation charges, and a $1.2 million supplemental retirement plan settlement charge incurred during 2010, butnot in 2011.
Research and Development. Research and development decreased by 1.9% or $0.7 million for the year ended December 31, 2011,as compared to the same period in 2010. Research and development decreased primarily due to a $2.9 million reduction in developmentcosts related to our Diary service, partially offset by a $1.0 million increase in labor and royalty costs associated with acquisition ofassets from IMMI, which was completed during the second quarter of 2010, and $0.7 million in Arbitron Mobile-related costs andexpenses incurred during 2011. See Note 5 in our Notes to Consolidated Financial Statements for additional information concerning ouracquisitions.
Impairment of investment. During the fourth quarter ended December 31, 2011, we determined that the fair value of ourinvestment in TRA fell below its carrying value and we recorded a $3.5 million pre-tax impairment charge. No such impairment chargewas recorded in 2010.
Income tax expense. Income tax expense increased by 28.4% or $7.8 million for the year ended December 31, 2011, as comparedto the same period in 2010. The effective tax rate increased from 38.0% in 2010 to 39.7% in 2011 primarily due to a valuationallowance with respect to the U.S. deferred tax asset arising from the 2011 net operating loss incurred by Arbitron Mobile.
EBIT and EBITDA. We believe presenting EBIT and EBITDA, both non-GAAP financial measures, as supplemental informationhelps investors, analysts and others, if they so choose, understand and evaluate our operating performance in some of the same ways wedo because EBIT and EBITDA exclude certain items not directly related to our core operating performance. We reference these non-GAAP financial measures in assessing current performance and making decisions about internal budgets, resource allocation andfinancial goals. EBIT is calculated by deducting interest income from net income and adding back interest expense and income taxexpense to net income. EBITDA is calculated by deducting interest income from net income and adding back interest expense, incometax expense, and depreciation and amortization to net income. EBIT and EBITDA margins are calculated as percentages of revenue.EBIT and EBITDA should not be considered substitutes either for net income, as indicators of our operating performance, or for cashflow, as measures of our liquidity. In addition, because EBIT and EBITDA may not be calculated identically by all companies, thepresentation here may not be comparable to other similarly titled measures reported by other companies.
Copyright © 2013 www.secdatabase.com. All Rights Reserved.Please Consider the Environment Before Printing This Document

EBIT increased by 22.2% or $16.1 million for the year ended December 31, 2011, as compared to the same period in 2010,primarily due to higher revenue from PPM price escalators in 2011. EBITDA increased by 18.8% or $18.9 million because this non-GAAP financial measure excludes depreciation and amortization, which for 2011 increased by $2.7 million as compared to 2010.
37
Copyright © 2013 www.secdatabase.com. All Rights Reserved.Please Consider the Environment Before Printing This Document
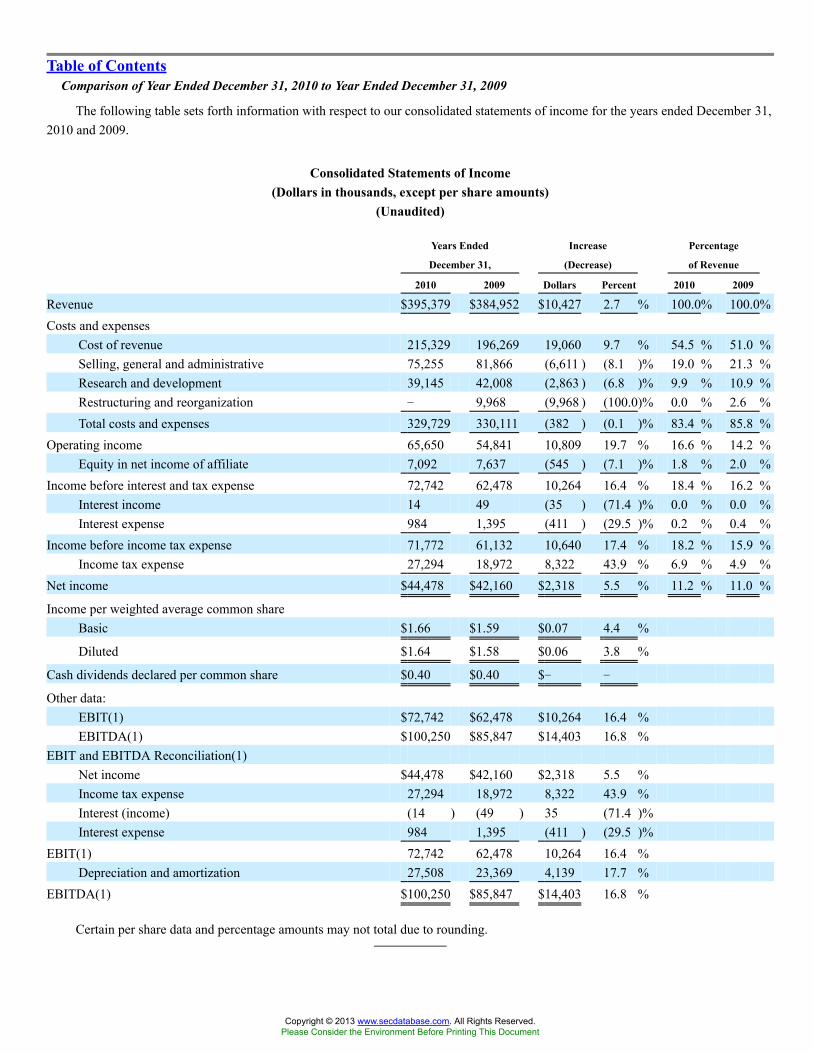
Table of ContentsComparison of Year Ended December 31, 2010 to Year Ended December 31, 2009
The following table sets forth information with respect to our consolidated statements of income for the years ended December 31,2010 and 2009.
Consolidated Statements of Income(Dollars in thousands, except per share amounts)
(Unaudited)
Years Ended
December 31,
Increase
(Decrease)
Percentage
of Revenue
2010 2009 Dollars Percent 2010 2009
Revenue $395,379 $384,952 $10,427 2.7 % 100.0% 100.0%Costs and expenses
Cost of revenue 215,329 196,269 19,060 9.7 % 54.5 % 51.0 %Selling, general and administrative 75,255 81,866 (6,611 ) (8.1 )% 19.0 % 21.3 %Research and development 39,145 42,008 (2,863 ) (6.8 )% 9.9 % 10.9 %Restructuring and reorganization � 9,968 (9,968 ) (100.0)% 0.0 % 2.6 %Total costs and expenses 329,729 330,111 (382 ) (0.1 )% 83.4 % 85.8 %
Operating income 65,650 54,841 10,809 19.7 % 16.6 % 14.2 %Equity in net income of affiliate 7,092 7,637 (545 ) (7.1 )% 1.8 % 2.0 %
Income before interest and tax expense 72,742 62,478 10,264 16.4 % 18.4 % 16.2 %Interest income 14 49 (35 ) (71.4 )% 0.0 % 0.0 %Interest expense 984 1,395 (411 ) (29.5 )% 0.2 % 0.4 %
Income before income tax expense 71,772 61,132 10,640 17.4 % 18.2 % 15.9 %Income tax expense 27,294 18,972 8,322 43.9 % 6.9 % 4.9 %
Net income $44,478 $42,160 $2,318 5.5 % 11.2 % 11.0 %
Income per weighted average common shareBasic $1.66 $1.59 $0.07 4.4 %
Diluted $1.64 $1.58 $0.06 3.8 %
Cash dividends declared per common share $0.40 $0.40 $� �
Other data:EBIT(1) $72,742 $62,478 $10,264 16.4 %EBITDA(1) $100,250 $85,847 $14,403 16.8 %
EBIT and EBITDA Reconciliation(1)Net income $44,478 $42,160 $2,318 5.5 %Income tax expense 27,294 18,972 8,322 43.9 %Interest (income) (14 ) (49 ) 35 (71.4 )%Interest expense 984 1,395 (411 ) (29.5 )%
EBIT(1) 72,742 62,478 10,264 16.4 %Depreciation and amortization 27,508 23,369 4,139 17.7 %
EBITDA(1) $100,250 $85,847 $14,403 16.8 %
Certain per share data and percentage amounts may not total due to rounding.
Copyright © 2013 www.secdatabase.com. All Rights Reserved.Please Consider the Environment Before Printing This Document

(1) EBIT (earnings before interest and income taxes) and EBITDA (earnings before interest, income taxes, depreciation andamortization) are non-GAAP financial measures we believe are useful to investors in evaluating our results. For further discussionof these non-GAAP financial measures, see paragraph below entitled �� EBIT and EBITDA.�
Revenue. Revenue increased by 2.7% or $10.4 million for the year ended December 31, 2010, as compared to the same period in2009 primarily due to higher fees charged for PPM-based ratings than for Diary-based ratings within the PPM Markets commercialized.PPM-based ratings service revenue increased by $70.2 million primarily due to the partial year impact of the 15 PPM Marketscommercialized during 2010 and the full year impact of the 19 PPM Markets commercialized in 2009, as well as price escalators in allPPM commercialized markets. Included in the above net increase in revenue related to our PPM service is a $4.0 million decrease inpre-currency revenue from $7.9 million for 19 PPM Markets commercialized during 2009 to $3.9 million for the 15 smaller PPMMarkets commercialized during 2010.
38
Copyright © 2013 www.secdatabase.com. All Rights Reserved.Please Consider the Environment Before Printing This Document
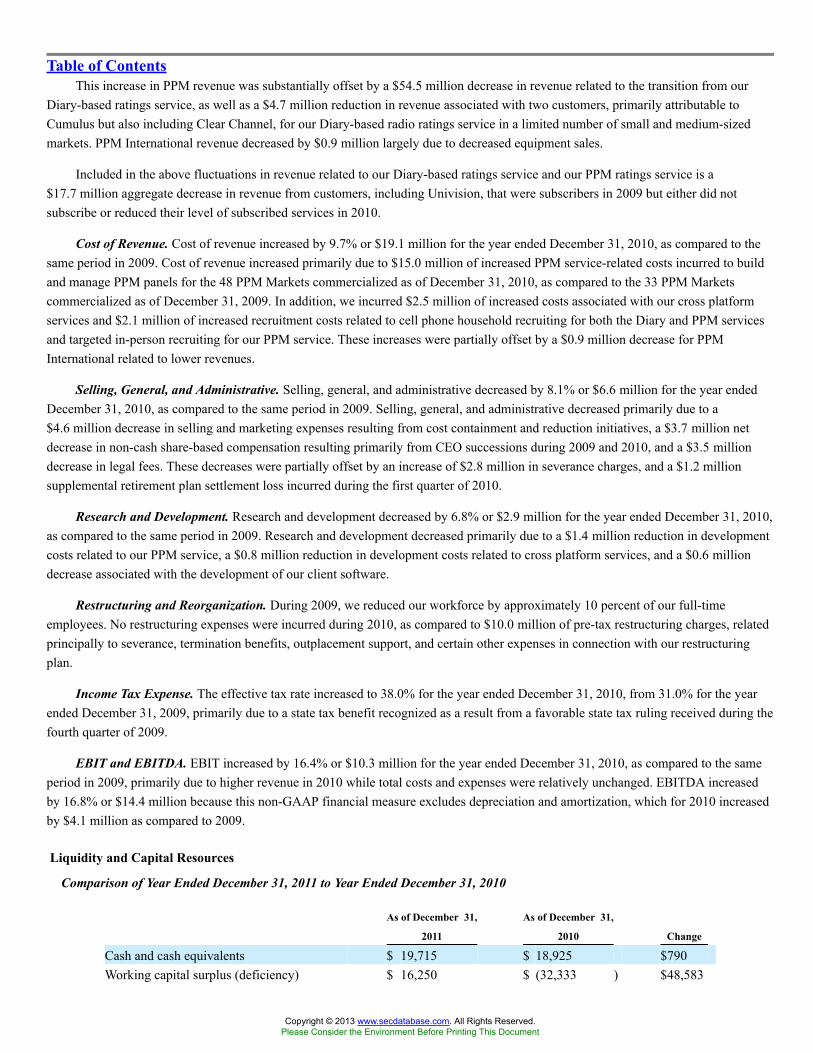
Table of ContentsThis increase in PPM revenue was substantially offset by a $54.5 million decrease in revenue related to the transition from our
Diary-based ratings service, as well as a $4.7 million reduction in revenue associated with two customers, primarily attributable toCumulus but also including Clear Channel, for our Diary-based radio ratings service in a limited number of small and medium-sizedmarkets. PPM International revenue decreased by $0.9 million largely due to decreased equipment sales.
Included in the above fluctuations in revenue related to our Diary-based ratings service and our PPM ratings service is a$17.7 million aggregate decrease in revenue from customers, including Univision, that were subscribers in 2009 but either did notsubscribe or reduced their level of subscribed services in 2010.
Cost of Revenue. Cost of revenue increased by 9.7% or $19.1 million for the year ended December 31, 2010, as compared to thesame period in 2009. Cost of revenue increased primarily due to $15.0 million of increased PPM service-related costs incurred to buildand manage PPM panels for the 48 PPM Markets commercialized as of December 31, 2010, as compared to the 33 PPM Marketscommercialized as of December 31, 2009. In addition, we incurred $2.5 million of increased costs associated with our cross platformservices and $2.1 million of increased recruitment costs related to cell phone household recruiting for both the Diary and PPM servicesand targeted in-person recruiting for our PPM service. These increases were partially offset by a $0.9 million decrease for PPMInternational related to lower revenues.
Selling, General, and Administrative. Selling, general, and administrative decreased by 8.1% or $6.6 million for the year endedDecember 31, 2010, as compared to the same period in 2009. Selling, general, and administrative decreased primarily due to a$4.6 million decrease in selling and marketing expenses resulting from cost containment and reduction initiatives, a $3.7 million netdecrease in non-cash share-based compensation resulting primarily from CEO successions during 2009 and 2010, and a $3.5 milliondecrease in legal fees. These decreases were partially offset by an increase of $2.8 million in severance charges, and a $1.2 millionsupplemental retirement plan settlement loss incurred during the first quarter of 2010.
Research and Development. Research and development decreased by 6.8% or $2.9 million for the year ended December 31, 2010,as compared to the same period in 2009. Research and development decreased primarily due to a $1.4 million reduction in developmentcosts related to our PPM service, a $0.8 million reduction in development costs related to cross platform services, and a $0.6 milliondecrease associated with the development of our client software.
Restructuring and Reorganization. During 2009, we reduced our workforce by approximately 10 percent of our full-timeemployees. No restructuring expenses were incurred during 2010, as compared to $10.0 million of pre-tax restructuring charges, relatedprincipally to severance, termination benefits, outplacement support, and certain other expenses in connection with our restructuringplan.
Income Tax Expense. The effective tax rate increased to 38.0% for the year ended December 31, 2010, from 31.0% for the yearended December 31, 2009, primarily due to a state tax benefit recognized as a result from a favorable state tax ruling received during thefourth quarter of 2009.
EBIT and EBITDA. EBIT increased by 16.4% or $10.3 million for the year ended December 31, 2010, as compared to the sameperiod in 2009, primarily due to higher revenue in 2010 while total costs and expenses were relatively unchanged. EBITDA increasedby 16.8% or $14.4 million because this non-GAAP financial measure excludes depreciation and amortization, which for 2010 increasedby $4.1 million as compared to 2009.
Liquidity and Capital Resources
Comparison of Year Ended December 31, 2011 to Year Ended December 31, 2010
As of December 31,
2011
As of December 31,
2010 Change
Cash and cash equivalents $ 19,715 $ 18,925 $790Working capital surplus (deficiency) $ 16,250 $ (32,333 ) $48,583
Copyright © 2013 www.secdatabase.com. All Rights Reserved.Please Consider the Environment Before Printing This Document

Working capital, excluding deferred revenueand current portion of credit facility $ 53,330 $ 57,146 $(3,816 )
Total debt $ � $ 53,000 $(53,000)
We have relied upon our cash flow from operations, supplemented by borrowings under our available revolving credit facility(�Credit Facility�) as needed, to fund our dividends, capital expenditures, and contractual obligations. We expect, based on current
39
Copyright © 2013 www.secdatabase.com. All Rights Reserved.Please Consider the Environment Before Printing This Document
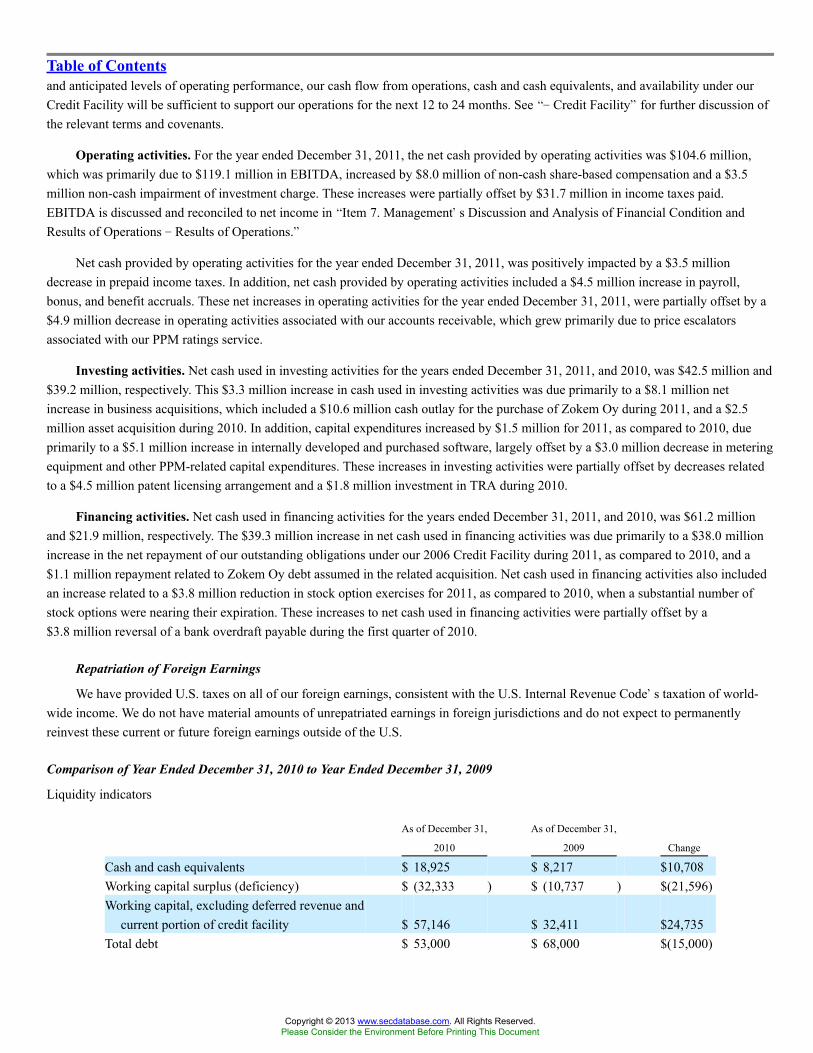
Table of Contentsand anticipated levels of operating performance, our cash flow from operations, cash and cash equivalents, and availability under ourCredit Facility will be sufficient to support our operations for the next 12 to 24 months. See �� Credit Facility� for further discussion ofthe relevant terms and covenants.
Operating activities. For the year ended December 31, 2011, the net cash provided by operating activities was $104.6 million,which was primarily due to $119.1 million in EBITDA, increased by $8.0 million of non-cash share-based compensation and a $3.5million non-cash impairment of investment charge. These increases were partially offset by $31.7 million in income taxes paid.EBITDA is discussed and reconciled to net income in �Item 7. Management�s Discussion and Analysis of Financial Condition andResults of Operations � Results of Operations.�
Net cash provided by operating activities for the year ended December 31, 2011, was positively impacted by a $3.5 milliondecrease in prepaid income taxes. In addition, net cash provided by operating activities included a $4.5 million increase in payroll,bonus, and benefit accruals. These net increases in operating activities for the year ended December 31, 2011, were partially offset by a$4.9 million decrease in operating activities associated with our accounts receivable, which grew primarily due to price escalatorsassociated with our PPM ratings service.
Investing activities. Net cash used in investing activities for the years ended December 31, 2011, and 2010, was $42.5 million and$39.2 million, respectively. This $3.3 million increase in cash used in investing activities was due primarily to a $8.1 million netincrease in business acquisitions, which included a $10.6 million cash outlay for the purchase of Zokem Oy during 2011, and a $2.5million asset acquisition during 2010. In addition, capital expenditures increased by $1.5 million for 2011, as compared to 2010, dueprimarily to a $5.1 million increase in internally developed and purchased software, largely offset by a $3.0 million decrease in meteringequipment and other PPM-related capital expenditures. These increases in investing activities were partially offset by decreases relatedto a $4.5 million patent licensing arrangement and a $1.8 million investment in TRA during 2010.
Financing activities. Net cash used in financing activities for the years ended December 31, 2011, and 2010, was $61.2 millionand $21.9 million, respectively. The $39.3 million increase in net cash used in financing activities was due primarily to a $38.0 millionincrease in the net repayment of our outstanding obligations under our 2006 Credit Facility during 2011, as compared to 2010, and a$1.1 million repayment related to Zokem Oy debt assumed in the related acquisition. Net cash used in financing activities also includedan increase related to a $3.8 million reduction in stock option exercises for 2011, as compared to 2010, when a substantial number ofstock options were nearing their expiration. These increases to net cash used in financing activities were partially offset by a$3.8 million reversal of a bank overdraft payable during the first quarter of 2010.
Repatriation of Foreign Earnings
We have provided U.S. taxes on all of our foreign earnings, consistent with the U.S. Internal Revenue Code�s taxation of world-wide income. We do not have material amounts of unrepatriated earnings in foreign jurisdictions and do not expect to permanentlyreinvest these current or future foreign earnings outside of the U.S.
Comparison of Year Ended December 31, 2010 to Year Ended December 31, 2009
Liquidity indicators
As of December 31,
2010
As of December 31,
2009 Change
Cash and cash equivalents $ 18,925 $ 8,217 $10,708Working capital surplus (deficiency) $ (32,333 ) $ (10,737 ) $(21,596)Working capital, excluding deferred revenue and
current portion of credit facility $ 57,146 $ 32,411 $24,735Total debt $ 53,000 $ 68,000 $(15,000)
Copyright © 2013 www.secdatabase.com. All Rights Reserved.Please Consider the Environment Before Printing This Document

We have relied upon our cash flow from operations, supplemented by borrowings under our Credit Facility as needed, to fund ourdividends, capital expenditures, and contractual obligations. See �Credit Facility� for further discussion of the relevant terms andcovenants.
40
Copyright © 2013 www.secdatabase.com. All Rights Reserved.Please Consider the Environment Before Printing This Document

Table of ContentsOperating activities. For the year ended December 31, 2010, the net cash provided by operating activities was $71.8 million,
which was primarily due to $100.3 million in EBITDA, increased by $6.5 million of non-cash share-based compensation. Theseincreases were partially offset by $24.9 million in income taxes paid. EBITDA is discussed and reconciled to net income in �Item 7.Management�s Discussion and Analysis of Financial Condition and Results of Operations � Results of Operations.�
Net cash provided by operating activities was negatively impacted by $8.6 million due to increased accounts receivable balances,which resulted substantially from increased billings related to the completion of our plan to commercialize our PPM ratings service inthe PPM Markets.
Investing activities. Net cash used in investing activities for the years ended December 31, 2010, and 2009, was $39.2 million and$35.1 million, respectively. This $4.1 million increase in cash used in investing activities was due to a $4.5 million licensingarrangement entered during the first quarter of 2010, as well as a $2.5 million asset acquisition during the second quarter of 2010,partially offset by a $1.6 million decrease in purchases of equity and other investments.
Net cash used in investing activities for 2010 as compared to 2009 was also offset by a $1.3 million decrease in capitalexpenditures, primarily consisting of decreases of $0.9 million in software development and purchased costs and $0.4 million related tolower leasehold improvement purchases.
Financing activities. Net cash used in financing activities for the years ended December 31, 2010, and 2009, was $21.9 millionand $22.8 million, respectively. This $0.9 million decrease in net cash used in financing activities was due primarily to a $6.6 millionincrease in proceeds from stock option exercises and stock purchase plans, which resulted from an increase in our company stock priceduring 2010, as well as a $2.0 million decrease in the net repayment of our outstanding obligations under our Credit Facility during2010 as compared to 2009. These decreases to net cash used in financing activities were substantially offset by a $7.7 million changerelated to the recording of a bank overdraft payable in 2009.
Credit Facility
On November 21, 2011, we terminated our credit facility agreement originally signed on December 20, 2006 (the �2006 CreditFacility�). Also, on November 21, 2011, we entered into the Credit Facility, a new agreement with a consortium of lenders to provide upto $150.0 million of financing through a five-year, unsecured revolving credit facility expiring on November 21, 2016. The agreementcontains an expansion feature to increase the total financing available under the Credit Facility by up to $75.0 million to an aggregate of$225.0 million. Such increased financing would be provided by one or more existing Credit Facility lending institutions, subject to theapproval of the lending banks, and/or in combination with one or more new lending institutions, subject to the approval of the CreditFacility�s administrative agent. Interest on borrowings under the Credit Facility is calculated based on a floating rate for a duration ofup to six months, at which time the interest rate is reset based upon the LIBOR (or, with the consent of each lender, nine or 12 months).
Our Credit Facility contains financial terms, covenants and operating restrictions that potentially restrict our financial flexibility.The material debt covenants under our Credit Facility include both a maximum leverage ratio and a minimum interest coverage ratio.The leverage ratio is a non-GAAP financial measure equal to the amount of our consolidated total indebtedness, as defined in our CreditFacility, divided by a contractually defined adjusted Earnings Before Interest, Taxes, Depreciation and Amortization and non- cashcompensation (�Consolidated EBITDA�) for the trailing four-quarter period. The interest coverage ratio is a non-GAAP financialmeasure equal to Consolidated EBITDA divided by total interest expense. Both ratios are designed as measures of our ability to meetcurrent and future debt obligations. The following table presents the actual ratios and their threshold limits as defined by the CreditFacility as of December 31, 2011:
Covenant Threshold Actual
Maximum leverage ratio 3.25 0.00Minimum interest coverage ratio 3.00 226.0
As of December 31, 2011, based upon these financial covenants, there was no default or limit on our ability to borrow the unusedportion of our Credit Facility.
Copyright © 2013 www.secdatabase.com. All Rights Reserved.Please Consider the Environment Before Printing This Document

Our Credit Facility contains customary events of default, including nonpayment and breach covenants. In the event of default,repayment of borrowings under the Credit Facility could be accelerated. Our Credit Facility also contains cross default provisions
41
Copyright © 2013 www.secdatabase.com. All Rights Reserved.Please Consider the Environment Before Printing This Document
Table of Contentswhereby a default on any material indebtedness, as defined in the Credit Facility, could result in the acceleration of our outstanding debtand the termination of any unused commitment under the Credit Facility. The agreement potentially limits, among other things, ourability to sell assets, incur additional indebtedness, and grant or incur liens on our assets. Under the terms of the Credit Facility, all ofour material domestic subsidiaries, if any, must guarantee the commitment. Currently, we do not have any material domestic subsidiariesas defined under the terms of the Credit Facility. Although we do not believe the terms of our Credit Facility limit the operation of ourbusiness in any material respect, the terms of the Credit Facility may restrict or prohibit our ability to raise additional debt when neededor could prevent us from investing in other growth initiatives. As of December 31, 2011, we had outstanding letters of credit of $0.2million. There were no outstanding borrowings under the Credit Facility as of December 31, 2011. As of December 31, 2010, ouroutstanding borrowings under the 2006 Credit Facility were $53.0 million. We have been in compliance with the terms of the 2006Credit Facility and our current Credit Facility since the inception of each agreement. As of February 24, 2012, we had no outstandingborrowings under the Credit Facility.
42
Copyright © 2013 www.secdatabase.com. All Rights Reserved.Please Consider the Environment Before Printing This Document

Table of ContentsContractual Obligations
The following table summarizes our contractual cash obligations as of December 31, 2011 (in thousands):
Payments Due By Period
Less Than
1 Year
1 - 3
Years
3 - 5
Years
More Than
5 Years Total
Operating leases (A) 7,991 11,404 10,291 13,427 43,113Purchase obligations (B) 5,624 � � � 5,624Contributions for retirement plans (C) 2,865 � � � 2,865Unrecognized tax benefits (D) 678 381 241 � 1,300
$17,158 $11,785 $10,532 $13,427 $52,902
(A) See Note 10 in the Notes to Consolidated Financial Statements.(B) Other than for PPM equipment purchases, we generally do not make unconditional, noncancelable purchase commitments. We
enter into purchase orders in the normal course of business, and they generally do not exceed one-year terms.(C) Amount represents an estimate of our cash contribution for 2012 for our retirement plans. Future cash contributions will be
determined based upon the funded status of the plan. See Note 12 in the Notes to Consolidated Financial Statements.(D) The amount related to unrecognized tax benefits in the table includes $0.2 million of interest and penalties. See Note 11 in the
Notes to the Consolidated Financial Statements.
Off-Balance Sheet Arrangements
We did not enter into any off-balance sheet arrangements during the years ended December 31, 2011, 2010 or 2009, nor did wehave any off-balance sheet arrangements outstanding as of December 31, 2011, or 2010.
New Accounting Pronouncements
Testing Goodwill for Impairment. In September 2011, the Financial Accounting Standards Board (FASB) issued AccountingStandards Update No. 2011-08, Intangibles � Goodwill and Other (Topic 350) � Testing Goodwill for Impairment (�ASU 2011-08�), toallow entities to use a qualitative approach to test goodwill for impairment. ASU 2011-08 permits an entity to first perform a qualitativeassessment to determine whether it is more likely than not that the fair value of a reporting unit is less than its carrying value. If it isconcluded this is the case, it is necessary to perform the currently prescribed two-step goodwill impairment test. Otherwise, the two-stepgoodwill impairment test is not required. ASU 2011-08 is effective for the Company for interim and annual periods ended during 2012,with earlier application permitted. The Company does not expect its pending adoption of this guidance to have a material impact on theCompany�s consolidated financial statements.
Amendments to Achieve Common Fair Value Measurement and Disclosure Requirements. In May 2011, the FASB issuedAccounting Standards Update No. 2011-04, Amendments to Achieve Common Fair Value Measurement and Disclosure Requirements inU.S. GAAP and International Financial Reporting Standards (Topic 820) � Fair Value Measurement (�ASU 2011-04�), to provide aconsistent definition of fair value and ensure that the fair value measurement and disclosure requirements are similar between U.S.Generally Accepted Accounting Principles (�GAAP�) and International Financial Reporting Standards. ASU 2011-04 changes certainfair value measurement principles and enhances the disclosure requirements particularly for Level 3 fair value measurements. ASU2011-04 is effective for the Company for interim and annual periods ended during 2012 and will be applied prospectively. TheCompany does not expect its pending adoption of this guidance to have a material impact on the Company�s consolidated financialstatements.
43
Copyright © 2013 www.secdatabase.com. All Rights Reserved.Please Consider the Environment Before Printing This Document

Table of ContentsITEM 7A. QUANTITATIVE AND QUALITATIVE DISCLOSURES ABOUT MARKET RISK
Interest Rate Risk
Our interest income and expense are sensitive to fluctuations in the general level of interest rates. As such, changes in interest ratesaffect the interest earned on the Company�s cash and cash equivalents and other highly liquid investments, as well as the value of thoseinvestments.
In November 2011, we entered into our Credit Facility with a consortium of lenders to provide us up to $150.0 million offinancing. Interest on borrowings under the Credit Facility is calculated based on a floating rate for a duration of up to six months, atwhich time the interest rate is reset based upon the LIBOR. As of December 31, 2011, we reported no outstanding borrowings under theCredit Facility. Therefore, a hypothetical market interest rate change of 1% would have zero impact on our results of operations over a12-month period. A hypothetical market interest rate change of 1% would have no impact on either the carrying amount or the fair valueof the Credit Facility. We do not use derivatives for speculative or trading purposes.
Foreign Currency Risk
We are exposed to the translation of foreign currency earnings to the U.S. dollar. Our principal exposures are to the euro via ourFinland subsidiary and the Indian rupee via our India subsidiary. If we expand our foreign operations in both India and Finland, ourexposure to foreign currency exchange rate trends could increase, resulting in higher or lower translation impacts to our financial resultsand position.
As of December 31, 2011, we have $4.0 million in recorded intercompany balances on our Finnish and Indian subsidiary balancesheets, which are impacted by fluctuations in currency exchange rates. As the exchange rates increase or decrease, our intercompanybalances will be exposed to translation adjustment charges and/or credits, which will be recognized in our financial earning results.
The translation of the statements of income and balance sheets of our international subsidiaries is made using the foreign currencyexchange rates as of the end of each reporting period and the translation adjustments are recorded in accumulated other comprehensiveincome (loss) on our consolidated balance sheet until the net investment in such foreign subsidiaries is liquidated. As of December 31,2011, the cumulative net currency translation adjustment recorded on our balance sheet reduced our shareholders� equity by $2.2million.
44
Copyright © 2013 www.secdatabase.com. All Rights Reserved.Please Consider the Environment Before Printing This Document
Table of ContentsITEM 8. FINANCIAL STATEMENTS AND SUPPLEMENTARY DATA
The report of the independent registered public accounting firm and financial statements are set forth below (see Item 15(a) for alist of financial statements and financial statement schedules):
ARBITRON INC.INDEX TO CONSOLIDATED FINANCIAL STATEMENTS
Page
Reports of Independent Registered Public Accounting Firm 46Consolidated Balance Sheets as of December 31, 2011 and 2010 48Consolidated Statements of Income for the Years Ended December 31, 2011, 2010 and 2009 49Consolidated Statements of Stockholders� Equity (Deficit) for the Years Ended December 31, 2011, 2010 and 2009 50Consolidated Statements of Comprehensive Income for the Years Ended December 31, 2011, 2010 and 2009 51Consolidated Statements of Cash Flows for the Years Ended December 31, 2011, 2010 and 2009 52Notes to Consolidated Financial Statements 53Consolidated Schedule of Valuation and Qualifying Accounts 83
45
Copyright © 2013 www.secdatabase.com. All Rights Reserved.Please Consider the Environment Before Printing This Document

Table of ContentsReport of Independent Registered Public Accounting Firm
The Board of Directors and Stockholders
Arbitron Inc.:
We have audited the accompanying consolidated balance sheets of Arbitron Inc. and subsidiaries as of December 31, 2011 and2010, and the related consolidated statements of income, stockholders� equity (deficit), comprehensive income and cash flows for eachof the years in the three-year period ended December 31, 2011. In connection with our audits of the consolidated financial statements,we also have audited the financial statement schedule listed under item 15(a)(2). These consolidated financial statements and financialstatement schedule are the responsibility of the Company�s management. Our responsibility is to express an opinion on theseconsolidated financial statements and financial statement schedule based on our audits.
We conducted our audits in accordance with the standards of the Public Company Accounting Oversight Board (United States).Those standards require that we plan and perform the audit to obtain reasonable assurance about whether the financial statements arefree of material misstatement. An audit includes examining, on a test basis, evidence supporting the amounts and disclosures in thefinancial statements. An audit also includes assessing the accounting principles used and significant estimates made by management, aswell as evaluating the overall financial statement presentation. We believe that our audits provide a reasonable basis for our opinion.
In our opinion, the consolidated financial statements referred to above present fairly, in all material respects, the financial positionof Arbitron Inc. and subsidiaries as of December 31, 2011 and 2010, and the results of their operations and their cash flows for each ofthe years in the three-year period ended December 31, 2011, in conformity with U.S. generally accepted accounting principles. Also inour opinion, the related financial statement schedule, when considered in relation to the basic consolidated financial statements taken asa whole, presents fairly, in all material respects, the information set forth therein.
We also have audited, in accordance with the standards of the Public Company Accounting Oversight Board (United States),Arbitron Inc.�s internal control over financial reporting as of December 31, 2011, based on criteria established in Internal Control �Integrated Framework issued by the Committee of Sponsoring Organizations of the Treadway Commission, and our report datedFebruary 24, 2012, expressed an unqualified opinion on the effectiveness of the Company�s internal control over financial reporting.
/s/ KPMG LLP
Baltimore, MarylandFebruary 24, 2012
46
Copyright © 2013 www.secdatabase.com. All Rights Reserved.Please Consider the Environment Before Printing This Document

Table of ContentsReport of Independent Registered Public Accounting Firm
The Board of Directors and Stockholders
Arbitron Inc.:
We have audited Arbitron Inc.�s internal control over financial reporting as of December 31, 2011, based on criteria established inInternal Control � Integrated Framework issued by the Committee of Sponsoring Organizations of the Treadway Commission (COSO).Arbitron Inc.�s management is responsible for maintaining effective internal control over financial reporting and for its assessment ofthe effectiveness of internal control over financial reporting, included in the accompanying Management�s Report on Internal Controlover Financial Reporting. Our responsibility is to express an opinion on the Company�s internal control over financial reporting basedon our audit.
We conducted our audit in accordance with the standards of the Public Company Accounting Oversight Board (United States).Those standards require that we plan and perform the audit to obtain reasonable assurance about whether effective internal control overfinancial reporting was maintained in all material respects. Our audit included obtaining an understanding of internal control overfinancial reporting, assessing the risk that a material weakness exists, and testing and evaluating the design and operating effectivenessof internal control based on the assessed risk. Our audit also included performing such other procedures as we considered necessary inthe circumstances. We believe that our audit provides a reasonable basis for our opinion.
A company�s internal control over financial reporting is a process designed to provide reasonable assurance regarding thereliability of financial reporting and the preparation of financial statements for external purposes in accordance with generally acceptedaccounting principles. A company�s internal control over financial reporting includes those policies and procedures that (1) pertain tothe maintenance of records that, in reasonable detail, accurately and fairly reflect the transactions and dispositions of the assets of thecompany; (2) provide reasonable assurance that transactions are recorded as necessary to permit preparation of financial statements inaccordance with generally accepted accounting principles, and that receipts and expenditures of the company are being made only inaccordance with authorizations of management and directors of the company; and (3) provide reasonable assurance regardingprevention or timely detection of unauthorized acquisition, use, or disposition of the company�s assets that could have a material effecton the financial statements.
Because of its inherent limitations, internal control over financial reporting may not prevent or detect misstatements. Also,projections of any evaluation of effectiveness to future periods are subject to the risk that controls may become inadequate because ofchanges in conditions, or that the degree of compliance with the policies or procedures may deteriorate.
In our opinion, Arbitron Inc. maintained, in all material respects, effective internal control over financial reporting as ofDecember 31, 2011, based on criteria established in Internal Control � Integrated Framework issued by the Committee of SponsoringOrganizations of the Treadway Commission.
We also have audited, in accordance with the standards of the Public Company Accounting Oversight Board (United States), theconsolidated balance sheets of Arbitron Inc. as of December 31, 2011 and 2010, and the related consolidated statements of income,stockholders� equity (deficit), comprehensive income and cash flows for each of the years in the three-year period ended December 31,2011, and our report dated February 24, 2012, expressed an unqualified opinion on those consolidated financial statements.
/s/ KPMG LLP
Baltimore, MarylandFebruary 24, 2012
47
Copyright © 2013 www.secdatabase.com. All Rights Reserved.Please Consider the Environment Before Printing This Document

Table of ContentsARBITRON INC.
Consolidated Balance SheetsDecember 31, 2011 and 2010
(In thousands, except par value data)
2011 2010
AssetsCurrent assets
Cash and cash equivalents $19,715 $18,925Trade accounts receivable, net of allowance for doubtful accounts of $4,615 in 2011 and $4,708 in
2010 62,886 59,808Prepaid expenses and other current assets 7,141 11,332Deferred tax assets 6,398 4,758
Total current assets 96,140 94,823Equity and other investments 14,913 18,385Property and equipment, net 70,651 70,332Goodwill, net 45,430 38,895Other intangibles, net 10,526 6,272Other noncurrent assets 1,308 534
Total assets $238,968 $229,241
Liabilities and Stockholders�� EquityCurrent liabilities
Accounts payable $10,534 $10,007Accrued expenses and other current liabilities 32,276 27,670Current portion of long-term debt � 53,000Deferred revenue 37,080 36,479
Total current liabilities 79,890 127,156Noncurrent deferred tax liabilities 1,302 2,695Other noncurrent liabilities 30,960 21,739
Total liabilities 112,152 151,590Commitments and contingencies � �
Stockholders� equityPreferred stock, $100.00 par value, 750 shares authorized, no shares issued � �
Common stock, $0.50 par value, 500,000 shares authorized, 32,338 shares issued as of December 31,2011, and 2010 16,169 16,169
Retained earnings 128,772 74,184Common stock held in treasury, 5,048 shares in 2011 and 5,285 shares in 2010 (2,524 ) (2,642 )Accumulated other comprehensive loss (15,601 ) (10,060 )
Total stockholders� equity 126,816 77,651Total liabilities and stockholders� equity $238,968 $229,241
See accompanying notes to consolidated financial statements.
48
Copyright © 2013 www.secdatabase.com. All Rights Reserved.Please Consider the Environment Before Printing This Document

Table of ContentsARBITRON INC.
Consolidated Statements of IncomeYears Ended December 31, 2011, 2010, and 2009
(In thousands, except per share data)
2011 2010 2009
Revenue $422,310 $395,379 $384,952Costs and expenses
Cost of revenue 220,381 215,329 196,269Selling, general and administrative 78,407 75,255 81,866Research and development 38,416 39,145 42,008Restructuring and reorganization � � 9,968
Total costs and expenses 337,204 329,729 330,111Operating income 85,106 65,650 54,841
Equity in net income of affiliate 7,255 7,092 7,637Impairment of investment (3,477 ) � �
Income before interest and income tax expense 88,884 72,742 62,478Interest income 27 14 49Interest expense 564 984 1,395
Income before income tax expense 88,347 71,772 61,132Income tax expense 35,056 27,294 18,972
Net income $53,291 $44,478 $42,160
Income per weighted-average common shareBasic $1.96 $1.66 $1.59Diluted $1.93 $1.64 $1.58
Weighted-average common shares used in calculationsBasic 27,181 26,759 26,493Potentially dilutive securities 478 346 183Diluted 27,659 27,105 26,676
Dividends declared per common share outstanding $0.40 $0.40 $0.40
See accompanying notes to consolidated financial statements.
49
Copyright © 2013 www.secdatabase.com. All Rights Reserved.Please Consider the Environment Before Printing This Document
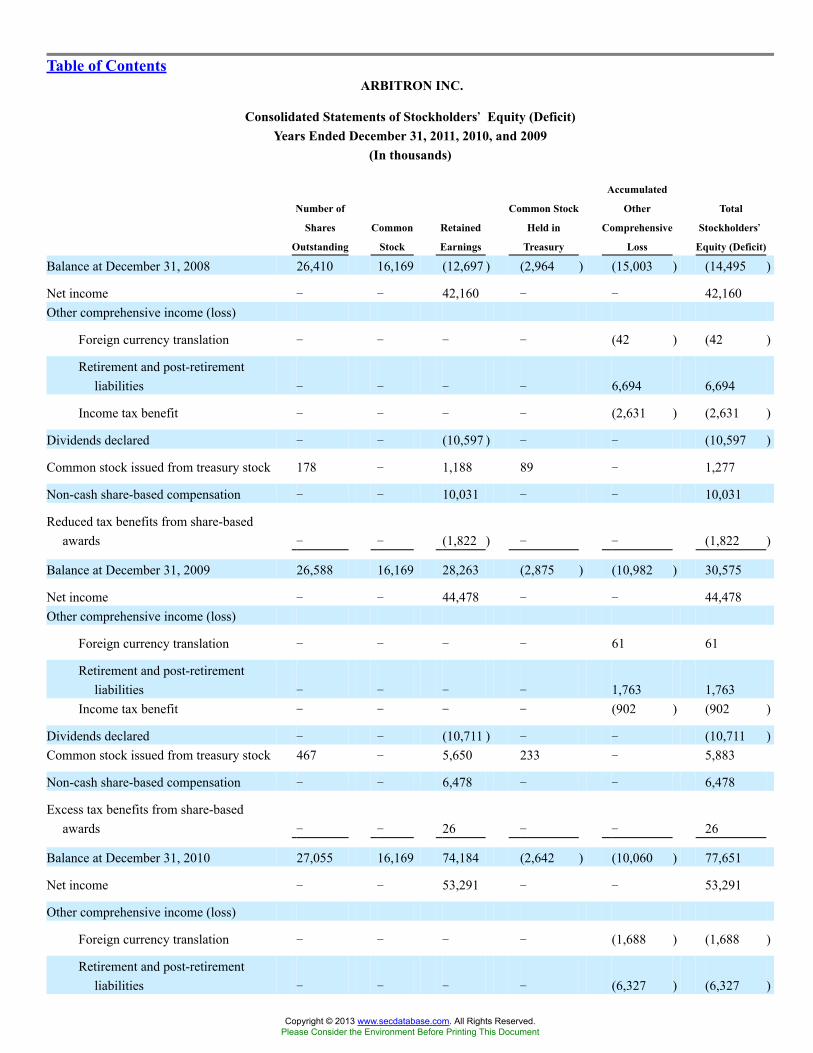
Table of ContentsARBITRON INC.
Consolidated Statements of Stockholders�� Equity (Deficit)Years Ended December 31, 2011, 2010, and 2009
(In thousands)
Number of
Shares
Outstanding
Common
Stock
Retained
Earnings
Common Stock
Held in
Treasury
Accumulated
Other
Comprehensive
Loss
Total
Stockholders��
Equity (Deficit)
Balance at December 31, 2008 26,410 16,169 (12,697 ) (2,964 ) (15,003 ) (14,495 )
Net income � � 42,160 � � 42,160Other comprehensive income (loss)
Foreign currency translation � � � � (42 ) (42 )
Retirement and post-retirementliabilities � � � � 6,694 6,694
Income tax benefit � � � � (2,631 ) (2,631 )
Dividends declared � � (10,597 ) � � (10,597 )
Common stock issued from treasury stock 178 � 1,188 89 � 1,277
Non-cash share-based compensation � � 10,031 � � 10,031
Reduced tax benefits from share-basedawards � � (1,822 ) � � (1,822 )
Balance at December 31, 2009 26,588 16,169 28,263 (2,875 ) (10,982 ) 30,575
Net income � � 44,478 � � 44,478Other comprehensive income (loss)
Foreign currency translation � � � � 61 61
Retirement and post-retirementliabilities � � � � 1,763 1,763
Income tax benefit � � � � (902 ) (902 )
Dividends declared � � (10,711 ) � � (10,711 )Common stock issued from treasury stock 467 � 5,650 233 � 5,883
Non-cash share-based compensation � � 6,478 � � 6,478
Excess tax benefits from share-basedawards � � 26 � � 26
Balance at December 31, 2010 27,055 16,169 74,184 (2,642 ) (10,060 ) 77,651
Net income � � 53,291 � � 53,291
Other comprehensive income (loss)
Foreign currency translation � � � � (1,688 ) (1,688 )
Retirement and post-retirementliabilities � � � � (6,327 ) (6,327 )
Copyright © 2013 www.secdatabase.com. All Rights Reserved.Please Consider the Environment Before Printing This Document

Income tax benefit � � � � 2,474 2,474
Dividends declared � � (10,879 ) � � (10,879 )
Common stock issued from treasury stock 235 � 3,229 118 � 3,347
Non-cash share-based compensation � � 8,020 � � 8,020Excess tax benefits from share-based
awards � � 927 � � 927
Balance at December 31, 2011 27,290 $16,169 $128,772 $ (2,524 ) $ (15,601 ) $ 126,816
See accompanying notes to consolidated financial statements.
50
Copyright © 2013 www.secdatabase.com. All Rights Reserved.Please Consider the Environment Before Printing This Document
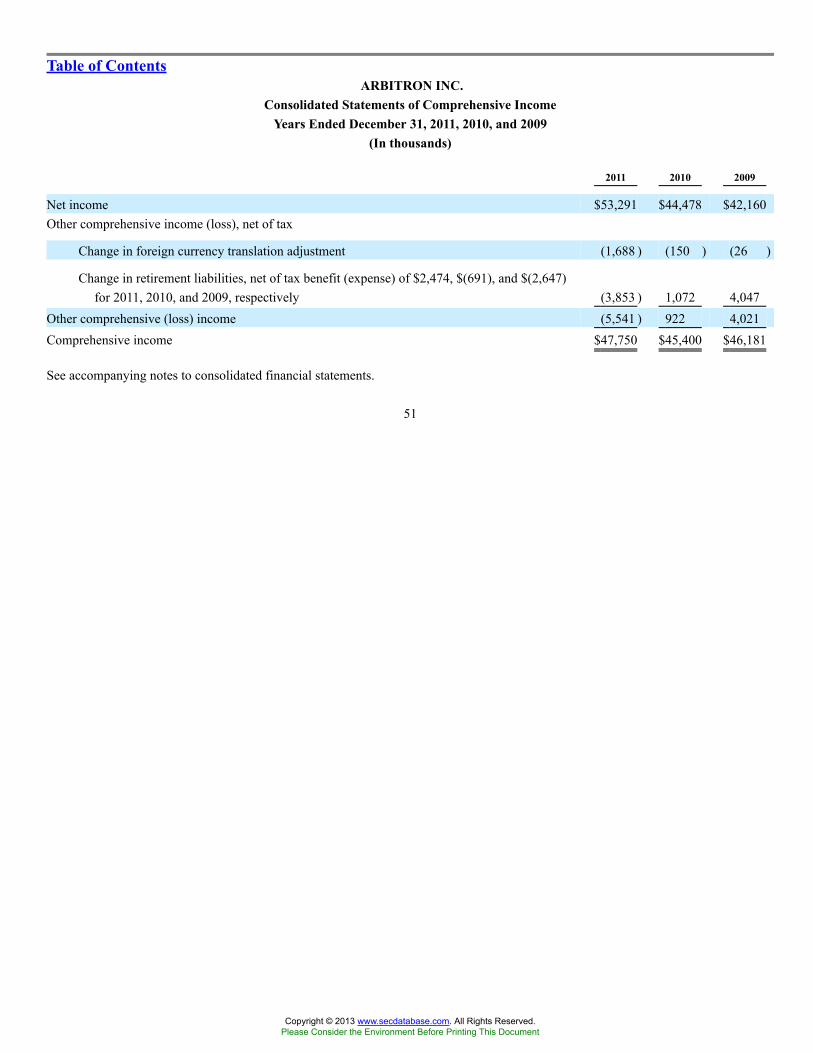
Table of ContentsARBITRON INC.
Consolidated Statements of Comprehensive IncomeYears Ended December 31, 2011, 2010, and 2009
(In thousands)
2011 2010 2009
Net income $53,291 $44,478 $42,160Other comprehensive income (loss), net of tax
Change in foreign currency translation adjustment (1,688 ) (150 ) (26 )
Change in retirement liabilities, net of tax benefit (expense) of $2,474, $(691), and $(2,647)for 2011, 2010, and 2009, respectively (3,853 ) 1,072 4,047
Other comprehensive (loss) income (5,541 ) 922 4,021Comprehensive income $47,750 $45,400 $46,181
See accompanying notes to consolidated financial statements.
51
Copyright © 2013 www.secdatabase.com. All Rights Reserved.Please Consider the Environment Before Printing This Document

Table of ContentsARBITRON INC.
Consolidated Statements of Cash FlowsYears Ended December 31, 2011, 2010, and 2009
(in thousands)
2011 2010 2009
Cash flows from operating activitiesNet income $53,291 $44,478 $42,160
Adjustments to reconcile net income to net cash provided by operating activitiesDepreciation and amortization of property and equipment 28,542 26,686 23,228Amortization of other intangible assets 1,713 822 141Loss on asset disposals and impairments of property and equipment 2,123 3,011 2,088Loss due to retirement plan settlements � 1,222 1,803Loss on impairment of investment 3,477 � �
Deferred income taxes (1,707 ) 6,147 (1,690 )Reduced tax benefits on share-based awards � � (1,822 )Equity in net income of affiliate (7,255 ) (7,092 ) (7,637 )Distributions from affiliate 7,250 7,425 9,000Bad debt expense 2,234 1,375 2,723Non-cash share-based compensation 8,020 6,478 10,031Changes in operating assets and liabilities
Trade accounts receivable (4,884 ) (8,576 ) (5,293 )Prepaid expenses and other assets 4,211 70 2,020Accounts payable 1,340 (1,959 ) (3,157 )Accrued expense and other current liabilities 2,817 (1,465 ) 312Deferred revenue 601 (6,669 ) (14,156)Other noncurrent liabilities 2,825 (143 ) (2,427 )
Net cash provided by operating activities 104,598 71,810 57,324
Cash flows from investing activitiesAdditions to property and equipment (31,967 ) (30,425) (31,681)License of other intangible assets � (4,500 ) �
Purchases of equity and other investments � (1,780 ) (3,400 )Payments for business acquisitions, net of cash acquired (10,553 ) (2,500 ) �
Net cash used in investing activities (42,520 ) (39,205) (35,081)
Cash flows from financing activitiesProceeds from stock option exercises and stock purchase plan 3,775 7,560 988Tax benefits realized from share-based awards 927 26 �
Payments for deferred financing costs (998 ) � �
Dividends paid to stockholders (10,849 ) (10,667) (10,584)Change in bank overdraft payables � (3,833 ) 3,833Debt borrowings 15,000 10,000 33,000Debt repayments (69,103 ) (25,000) (50,000)
Net cash used in financing activities (61,248 ) (21,914) (22,763)
Effect of exchange rate changes on cash and cash equivalents (40 ) 17 79Net increase (decrease) in cash and cash equivalents 790 10,708 (441 )Cash and cash equivalents at beginning of year 18,925 8,217 8,658
Copyright © 2013 www.secdatabase.com. All Rights Reserved.Please Consider the Environment Before Printing This Document

Cash and cash equivalents at end of year $19,715 $18,925 $8,217
See accompanying notes to consolidated financial statements.
52
Copyright © 2013 www.secdatabase.com. All Rights Reserved.Please Consider the Environment Before Printing This Document
Table of ContentsARBITRON INC.
Notes to Consolidated Financial Statements
1. Basis of Presentation
Basis of Consolidation
The consolidated financial statements of Arbitron Inc. (�Arbitron� or the �Company�) for the year ended December 31, 2011,reflect the consolidated financial position, results of operations and cash flows of the Company and its wholly-owned subsidiaries:Arbitron Holdings Inc., Arbitron Mobile Oy, Astro West LLC, Cardinal North LLC, Ceridian Infotech (India) Private Limited, ArbitronInternational, LLC, and Arbitron Technology Services India Private Limited. All significant intercompany balances and transactionshave been eliminated in consolidation. The Company has one segment which meets the quantitative thresholds for being a reportablesegment.
Description of Business
Arbitron is a leading media and marketing information services firm primarily serving radio, advertisers, advertising agencies,cable and broadcast television, retailers, out-of-home media, online media, mobile media, telecommunications providers, and printmedia. The Company currently provides four main services:
� estimating the size and demographics of radio audiences in local markets and of network radio programming andcommercials in the United States;
� estimating the size and demographics of audiences of other media services, including mobile media and out-of-hometelevision viewing, and measuring usage and estimating the size and demographics of audiences across multiple platforms ofmedia;
� providing qualitative consumer, shopping, and media usage information services; and
� providing software used for accessing and analyzing the Company�s media audience and marketing information data.
2. Summary of Significant Accounting Policies
Revenue Recognition
Syndicated or recurring products and services are licensed on a contractual basis. Revenues for such products and services arerecognized over the term of the license agreement as products or services are delivered. Customer billings in advance of delivery arerecorded as a deferred revenue liability. Deferred revenue relates primarily to quantitative radio measurement surveys which aredelivered to customers in the subsequent quarterly or monthly period. Software revenue is recognized ratably over the life of theagreement. Through the standard software license agreement, customers are provided enhancements and upgrades, if any, that occurduring their license term at no additional cost. Customer agreements with multiple licenses are reviewed for separate revenuerecognition for deliverables specified by the agreements. Sales tax charged to customers is presented on a net basis within theconsolidated income statement and excluded from revenues.
Expense Recognition
Direct costs associated with the Company�s data collection, diary processing and maintenance of the Company�s Portable PeopleMeter� (PPM�) ratings service are recognized when incurred and are included in cost of revenue. Selling, general, and administrativeexpenses are recognized when incurred. Research and development expenses are recognized when incurred and consist primarily ofexpenses associated with the development of new products and customer software and other technical expenses including maintenanceof operations and reporting systems.
Cash Equivalents
Copyright © 2013 www.secdatabase.com. All Rights Reserved.Please Consider the Environment Before Printing This Document

Cash equivalents consist primarily of highly liquid investments with insignificant interest rate risk and original maturities of threemonths or less.
53
Copyright © 2013 www.secdatabase.com. All Rights Reserved.Please Consider the Environment Before Printing This Document
Table of ContentsTrade Accounts Receivable
Trade accounts receivable are recorded at invoiced amounts. The allowance for doubtful accounts is estimated based on historicaltrends of past due accounts and write-offs, as well as a review of specific accounts.
Inventories
Inventories consist of PPM equipment held for resale to international licensees of the PPM service. The inventory is accounted foron a first-in, first-out (FIFO) basis, and is included in prepaids and other current assets in the accompanying consolidated balance sheet.
Property and Equipment
Property and equipment are recorded at cost and depreciated or amortized on a straight-line basis over the estimated useful lives ofthe assets, which are as follows:
Computer equipment 3 yearsPurchased and internally developed software 3 � 5 yearsLeasehold improvements Shorter of useful life or life of leaseMachinery, furniture and fixtures 3 � 6 years
Repairs and maintenance are charged to expense as incurred. Gains and losses on dispositions are included in the consolidatedresults of operations at the date of disposal.
Expenditures for significant software purchases and software developed for internal use are capitalized. For software developed forinternal use, external direct costs for materials and services and certain payroll and related fringe benefit costs are capitalized as well.The costs are capitalized from the time that the preliminary project stage is completed and management considers it probable that thesoftware will be used to perform the function intended until the time the software is placed in service for its intended use. Once thesoftware is placed in service, the capitalized costs are amortized over periods of three to five years. Management performs anassessment quarterly to determine if it is probable that all capitalized software will be used to perform its intended function. If animpairment exists, the software cost is written down to estimated fair value.
Equity and Other Investments
Equity and other investments are accounted for using either the equity method or the cost method, depending upon the nature ofthe Company�s investment interests. The equity method is used when the Company has an ownership interest of 50% or less and theability to exercise significant influence or has a majority ownership interest but does not have the ability to exercise effective control.The cost method is used when the Company has an ownership interest of 20% or less and does not have the ability to exercisesignificant influence.
Goodwill and Other Intangible Assets
Goodwill represents the excess of costs over fair value of assets of businesses acquired. Goodwill and other intangible assetsacquired in a purchase business combination and determined to have an indefinite useful life are not amortized. Intangible assets withestimable useful lives are amortized over their respective estimated useful lives to their estimated residual values, and are regularlyreviewed for impairment.
Goodwill and intangible assets not subject to amortization are tested annually for impairment or more frequently if events andcircumstances indicate that the asset might be impaired. The Company performs its annual impairment test at the reporting unit level asof January 1st for each fiscal year. An impairment loss is recognized to the extent that the carrying amount of the asset exceeds its fairvalue.
Impairment of Long-Lived Assets
Copyright © 2013 www.secdatabase.com. All Rights Reserved.Please Consider the Environment Before Printing This Document

Long-lived assets, such as property, plant, and equipment, and purchased intangibles subject to amortization, are reviewed forimpairment whenever events or changes in circumstances indicate that the carrying amount of an asset may not be recoverable.Recoverability of assets to be held and used is measured by a comparison of the carrying amount of an asset to estimated undiscountedfuture cash flows expected to be generated by the asset. If the carrying amount of an asset exceeds its estimated future cash flows, an
54
Copyright © 2013 www.secdatabase.com. All Rights Reserved.Please Consider the Environment Before Printing This Document

Table of Contentsimpairment charge is recognized in the amount by which the carrying amount of the asset exceeds the fair value of the asset. Assets tobe disposed of are reported at the lower of the carrying amount or fair value less costs to sell, and effective with the date classified asheld for sale, are no longer depreciated. The assets and liabilities of a disposal group classified as held for sale, as well as the results ofoperations and cash flows of the disposal group, if any, are presented separately in the appropriate sections of the consolidated financialstatements for all periods presented.
Income Taxes
Income taxes are accounted for using the asset and liability method. Deferred tax assets and liabilities are recognized based on thefuture tax consequences attributable to differences between financial statement carrying amounts of existing assets and liabilities andtheir respective tax bases and operating loss and tax credit carryforwards. Deferred tax assets and liabilities are measured using enactedtax rates expected to be applied to taxable income in years in which those temporary differences are expected to be recovered or settled.The effect on deferred tax assets and liabilities of a change in tax rate is recognized in income in the period that includes the enactmentdate. The Company recognizes the effect of income tax positions only if those positions are more likely than not of being sustained.Recognized income tax positions are measured at the largest amount that is greater than 50% likely of being realized. Changes inrecognition or measurement are reflected in the period in which the change in judgment occurs.
Net Income per Weighted Average Common Share
The computations of basic and diluted net income per weighted-average common share for 2011, 2010, and 2009 are based on theCompany�s weighted-average shares of common stock and potentially dilutive securities outstanding. Potentially dilutive securities arecalculated in accordance with the treasury stock method, which assumes the proceeds from the exercise of all stock options are used torepurchase the Company�s common stock at the average market price for the period. As of December 31, 2011, 2010, and 2009, therewere stock options to purchase 2,043,774 shares, 2,020,767 shares, and 2,852,161 shares of the Company�s common stock outstanding,respectively, of which stock options to purchase 1,116,106 shares, 1,179,840 shares, and 2,052,132 shares of the Company�s commonstock, respectively, were excluded from the computation of the diluted net income per weighted-average common share, either becausethe stock options� exercise prices were greater than the average market price of the Company�s common shares or assumed repurchasesfrom proceeds from the stock options� exercise were antidilutive.
Translation of Foreign Currencies
Financial statements of foreign subsidiaries are translated into United States dollars at current rates at the end of the period exceptthat revenue and expenses are translated at average current exchange rates during each reporting period. Net translation exchange gainsor losses and the effect of exchange rate changes on intercompany transactions of a long-term nature are recorded in accumulated othercomprehensive loss in stockholders� equity. Gains and losses from translation of assets and liabilities denominated in other than thefunctional currency of the operation are recorded in income as incurred.
Advertising Expense
The Company recognizes advertising expense the first time advertising takes place. Advertising expense for the years endedDecember 31, 2011, 2010 and 2009, was $1.4 million, $1.0 million, and $2.3 million, respectively.
Accounting Estimates
The preparation of the consolidated financial statements in conformity with accounting principles generally accepted in the UnitedStates of America requires management to make estimates and assumptions that affect the reported amounts of assets and liabilities anddisclosure of contingent assets and liabilities at the date of the consolidated financial statements and the reported amounts of revenuesand expenses during the reporting period. Significant items, if any, subject to such estimates and assumptions may include: valuationallowances for receivables and deferred income tax assets, loss contingencies, and assets and obligations related to employee benefits.Actual results could differ from those estimates.
Legal Matters
Copyright © 2013 www.secdatabase.com. All Rights Reserved.Please Consider the Environment Before Printing This Document

The Company is involved, from time to time, in litigation and proceedings arising out of the ordinary course of business. Legalcosts for services rendered in the course of these proceedings are charged to expense as they are incurred.
55
Copyright © 2013 www.secdatabase.com. All Rights Reserved.Please Consider the Environment Before Printing This Document
Table of ContentsLeases
The Company conducts all of its operations in leased facilities and leases certain equipment which have minimum leaseobligations under noncancelable operating leases. Certain of these leases contain rent escalations based on specified percentages. Mostof the leases contain renewal options and require payments for taxes, insurance and maintenance. Rent expense is charged to operationsas incurred except for escalating rents, which are charged to operations on a straight-line basis over the life of the lease.
New Accounting Pronouncements
Testing Goodwill for Impairment. In September 2011, the Financial Accounting Standards Board (FASB) issued AccountingStandards Update No. 2011-08, Intangibles � Goodwill and Other (Topic 350) � Testing Goodwill for Impairment (�ASU 2011-08�), toallow entities to use a qualitative approach to test goodwill for impairment. ASU 2011-08 permits an entity to first perform a qualitativeassessment to determine whether it is more likely than not that the fair value of a reporting unit is less than its carrying value. If it isconcluded that this is the case, it is necessary to perform the currently prescribed two-step goodwill impairment test. Otherwise, the two-step goodwill impairment test is not required. ASU 2011-08 is effective for the Company for interim and annual periods ended during2012, with earlier application permitted. The Company does not expect its pending adoption of this guidance to have a material impactto the Company�s consolidated financial statements.
Amendments to Achieve Common Fair Value Measurement and Disclosure Requirements. In May 2011, the FASB issuedAccounting Standards Update No. 2011-04, Amendments to Achieve Common Fair Value Measurement and Disclosure Requirements inU.S. GAAP and International Financial Reporting Standards (Topic 820) � Fair Value Measurement (�ASU 2011-04�), to provide aconsistent definition of fair value and ensure that the fair value measurement and disclosure requirements are similar between U.S.Generally Accepted Accounting Principles (�GAAP�) and International Financial Reporting Standards. ASU 2011-04 changes certainfair value measurement principles and enhances the disclosure requirements particularly for Level 3 fair value measurements. ASU2011-04 is effective for the Company for interim and annual periods ended during 2012 and will be applied prospectively. TheCompany does not expect its pending adoption of this guidance to have a material impact to the Company�s consolidated financialstatements.
56
Copyright © 2013 www.secdatabase.com. All Rights Reserved.Please Consider the Environment Before Printing This Document
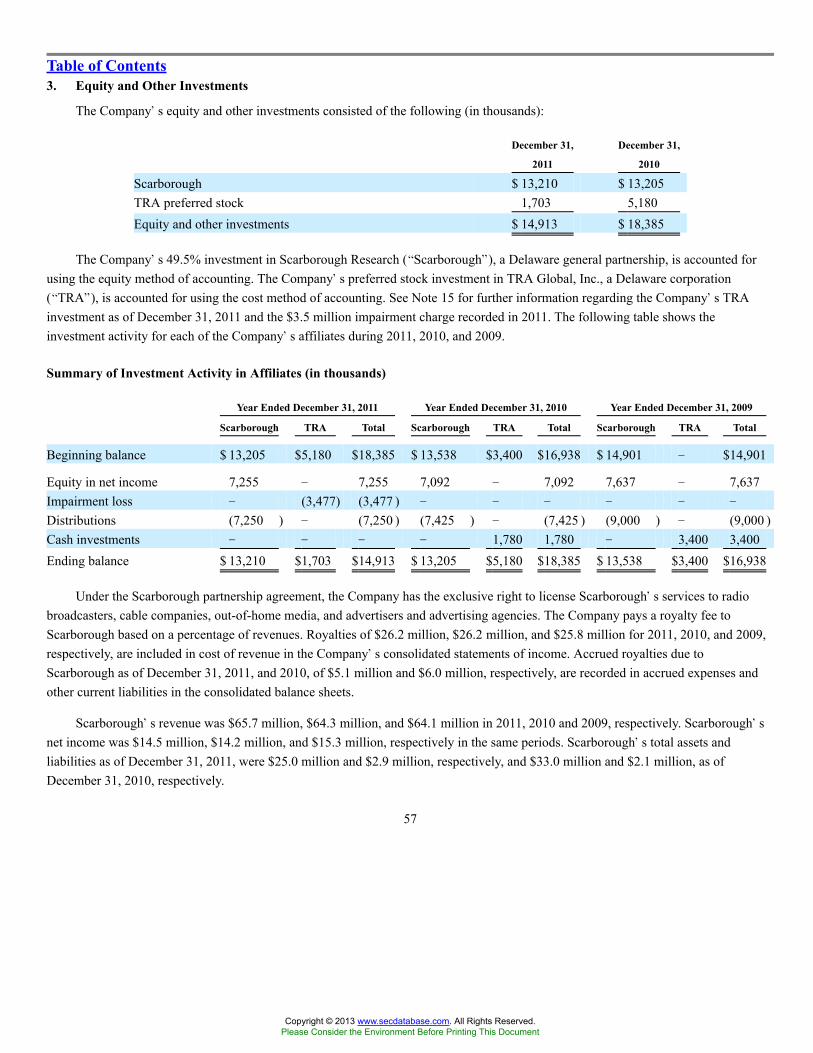
Table of Contents3. Equity and Other Investments
The Company�s equity and other investments consisted of the following (in thousands):
December 31,
2011
December 31,
2010
Scarborough $ 13,210 $ 13,205TRA preferred stock 1,703 5,180Equity and other investments $ 14,913 $ 18,385
The Company�s 49.5% investment in Scarborough Research (�Scarborough�), a Delaware general partnership, is accounted forusing the equity method of accounting. The Company�s preferred stock investment in TRA Global, Inc., a Delaware corporation(�TRA�), is accounted for using the cost method of accounting. See Note 15 for further information regarding the Company�s TRAinvestment as of December 31, 2011 and the $3.5 million impairment charge recorded in 2011. The following table shows theinvestment activity for each of the Company�s affiliates during 2011, 2010, and 2009.
Summary of Investment Activity in Affiliates (in thousands)
Year Ended December 31, 2011 Year Ended December 31, 2010 Year Ended December 31, 2009
Scarborough TRA Total Scarborough TRA Total Scarborough TRA Total
Beginning balance $ 13,205 $5,180 $18,385 $ 13,538 $3,400 $16,938 $ 14,901 � $14,901
Equity in net income 7,255 � 7,255 7,092 � 7,092 7,637 � 7,637Impairment loss � (3,477) (3,477 ) � � � � � �
Distributions (7,250 ) � (7,250 ) (7,425 ) � (7,425 ) (9,000 ) � (9,000 )Cash investments � � � � 1,780 1,780 � 3,400 3,400Ending balance $ 13,210 $1,703 $14,913 $ 13,205 $5,180 $18,385 $ 13,538 $3,400 $16,938
Under the Scarborough partnership agreement, the Company has the exclusive right to license Scarborough�s services to radiobroadcasters, cable companies, out-of-home media, and advertisers and advertising agencies. The Company pays a royalty fee toScarborough based on a percentage of revenues. Royalties of $26.2 million, $26.2 million, and $25.8 million for 2011, 2010, and 2009,respectively, are included in cost of revenue in the Company�s consolidated statements of income. Accrued royalties due toScarborough as of December 31, 2011, and 2010, of $5.1 million and $6.0 million, respectively, are recorded in accrued expenses andother current liabilities in the consolidated balance sheets.
Scarborough�s revenue was $65.7 million, $64.3 million, and $64.1 million in 2011, 2010 and 2009, respectively. Scarborough�snet income was $14.5 million, $14.2 million, and $15.3 million, respectively in the same periods. Scarborough�s total assets andliabilities as of December 31, 2011, were $25.0 million and $2.9 million, respectively, and $33.0 million and $2.1 million, as ofDecember 31, 2010, respectively.
57
Copyright © 2013 www.secdatabase.com. All Rights Reserved.Please Consider the Environment Before Printing This Document
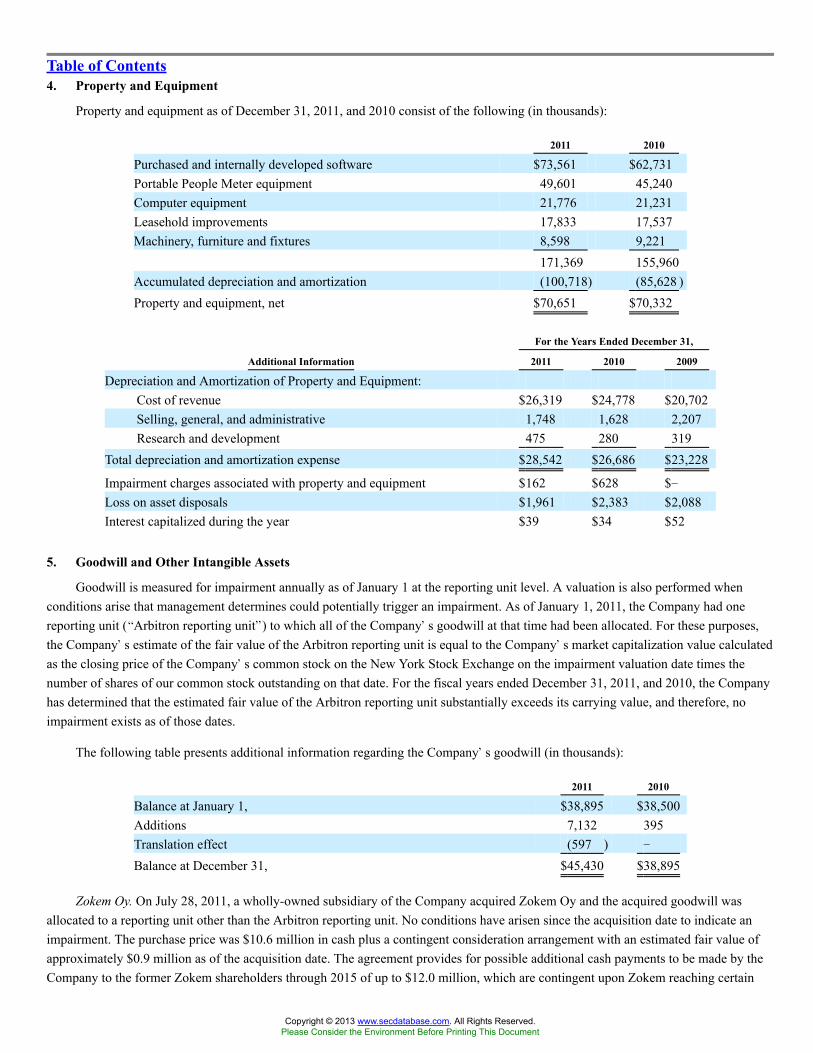
Table of Contents4. Property and Equipment
Property and equipment as of December 31, 2011, and 2010 consist of the following (in thousands):
2011 2010
Purchased and internally developed software $73,561 $62,731Portable People Meter equipment 49,601 45,240Computer equipment 21,776 21,231Leasehold improvements 17,833 17,537Machinery, furniture and fixtures 8,598 9,221
171,369 155,960Accumulated depreciation and amortization (100,718) (85,628 )Property and equipment, net $70,651 $70,332
For the Years Ended December 31,
Additional Information 2011 2010 2009
Depreciation and Amortization of Property and Equipment:Cost of revenue $26,319 $24,778 $20,702Selling, general, and administrative 1,748 1,628 2,207Research and development 475 280 319
Total depreciation and amortization expense $28,542 $26,686 $23,228
Impairment charges associated with property and equipment $162 $628 $�Loss on asset disposals $1,961 $2,383 $2,088Interest capitalized during the year $39 $34 $52
5. Goodwill and Other Intangible Assets
Goodwill is measured for impairment annually as of January 1 at the reporting unit level. A valuation is also performed whenconditions arise that management determines could potentially trigger an impairment. As of January 1, 2011, the Company had onereporting unit (�Arbitron reporting unit�) to which all of the Company�s goodwill at that time had been allocated. For these purposes,the Company�s estimate of the fair value of the Arbitron reporting unit is equal to the Company�s market capitalization value calculatedas the closing price of the Company�s common stock on the New York Stock Exchange on the impairment valuation date times thenumber of shares of our common stock outstanding on that date. For the fiscal years ended December 31, 2011, and 2010, the Companyhas determined that the estimated fair value of the Arbitron reporting unit substantially exceeds its carrying value, and therefore, noimpairment exists as of those dates.
The following table presents additional information regarding the Company�s goodwill (in thousands):
2011 2010
Balance at January 1, $38,895 $38,500Additions 7,132 395Translation effect (597 ) �
Balance at December 31, $45,430 $38,895
Zokem Oy. On July 28, 2011, a wholly-owned subsidiary of the Company acquired Zokem Oy and the acquired goodwill wasallocated to a reporting unit other than the Arbitron reporting unit. No conditions have arisen since the acquisition date to indicate animpairment. The purchase price was $10.6 million in cash plus a contingent consideration arrangement with an estimated fair value ofapproximately $0.9 million as of the acquisition date. The agreement provides for possible additional cash payments to be made by theCompany to the former Zokem shareholders through 2015 of up to $12.0 million, which are contingent upon Zokem reaching certain
Copyright © 2013 www.secdatabase.com. All Rights Reserved.Please Consider the Environment Before Printing This Document

financial performance targets in the future. The approximate $0.9 million fair value estimate was determined by applying the incomeapproach method. The key assumptions used in the fair value valuation include a probability-weighted range of performance targets forthe four-year measurement period of 2012 through 2015 and an adjusted discount rate. The Company periodically reassesses the fairvalue of the contingent consideration.
58
Copyright © 2013 www.secdatabase.com. All Rights Reserved.Please Consider the Environment Before Printing This Document
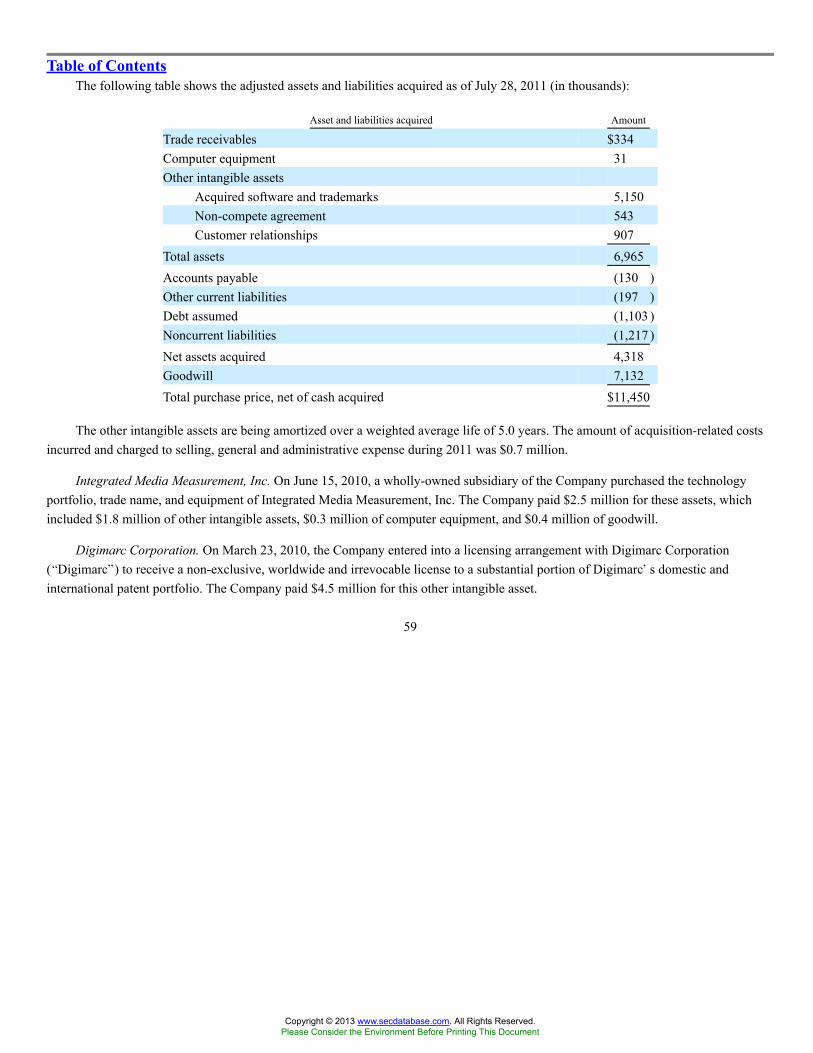
Table of ContentsThe following table shows the adjusted assets and liabilities acquired as of July 28, 2011 (in thousands):
Asset and liabilities acquired Amount
Trade receivables $334Computer equipment 31Other intangible assets
Acquired software and trademarks 5,150Non-compete agreement 543Customer relationships 907
Total assets 6,965Accounts payable (130 )Other current liabilities (197 )Debt assumed (1,103 )Noncurrent liabilities (1,217 )Net assets acquired 4,318Goodwill 7,132Total purchase price, net of cash acquired $11,450
The other intangible assets are being amortized over a weighted average life of 5.0 years. The amount of acquisition-related costsincurred and charged to selling, general and administrative expense during 2011 was $0.7 million.
Integrated Media Measurement, Inc. On June 15, 2010, a wholly-owned subsidiary of the Company purchased the technologyportfolio, trade name, and equipment of Integrated Media Measurement, Inc. The Company paid $2.5 million for these assets, whichincluded $1.8 million of other intangible assets, $0.3 million of computer equipment, and $0.4 million of goodwill.
Digimarc Corporation. On March 23, 2010, the Company entered into a licensing arrangement with Digimarc Corporation(�Digimarc�) to receive a non-exclusive, worldwide and irrevocable license to a substantial portion of Digimarc�s domestic andinternational patent portfolio. The Company paid $4.5 million for this other intangible asset.
59
Copyright © 2013 www.secdatabase.com. All Rights Reserved.Please Consider the Environment Before Printing This Document
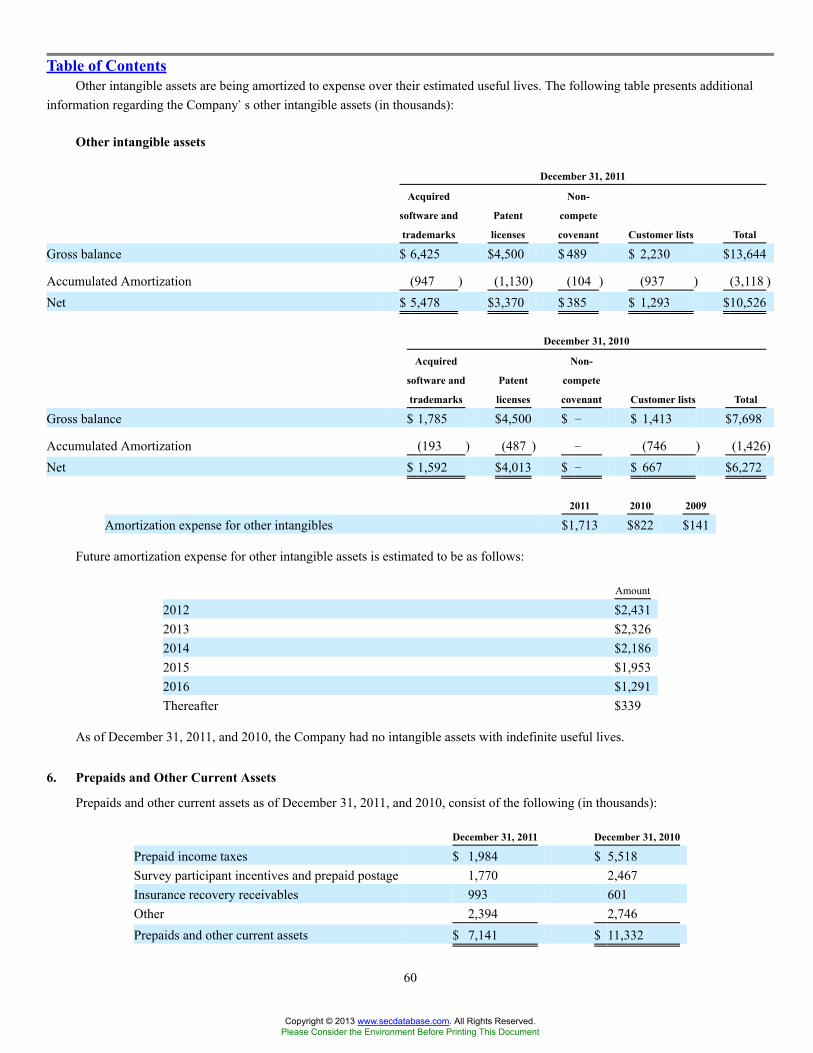
Table of ContentsOther intangible assets are being amortized to expense over their estimated useful lives. The following table presents additional
information regarding the Company�s other intangible assets (in thousands):
Other intangible assets
December 31, 2011
Acquired
software and
trademarks
Patent
licenses
Non-
compete
covenant Customer lists Total
Gross balance $ 6,425 $4,500 $ 489 $ 2,230 $13,644
Accumulated Amortization (947 ) (1,130) (104 ) (937 ) (3,118 )Net $ 5,478 $3,370 $ 385 $ 1,293 $10,526
December 31, 2010
Acquired
software and
trademarks
Patent
licenses
Non-
compete
covenant Customer lists Total
Gross balance $ 1,785 $4,500 $ � $ 1,413 $7,698
Accumulated Amortization (193 ) (487 ) � (746 ) (1,426)Net $ 1,592 $4,013 $ � $ 667 $6,272
2011 2010 2009
Amortization expense for other intangibles $1,713 $822 $141
Future amortization expense for other intangible assets is estimated to be as follows:
Amount
2012 $2,4312013 $2,3262014 $2,1862015 $1,9532016 $1,291Thereafter $339
As of December 31, 2011, and 2010, the Company had no intangible assets with indefinite useful lives.
6. Prepaids and Other Current Assets
Prepaids and other current assets as of December 31, 2011, and 2010, consist of the following (in thousands):
December 31, 2011 December 31, 2010
Prepaid income taxes $ 1,984 $ 5,518Survey participant incentives and prepaid postage 1,770 2,467Insurance recovery receivables 993 601Other 2,394 2,746Prepaids and other current assets $ 7,141 $ 11,332
60
Copyright © 2013 www.secdatabase.com. All Rights Reserved.Please Consider the Environment Before Printing This Document
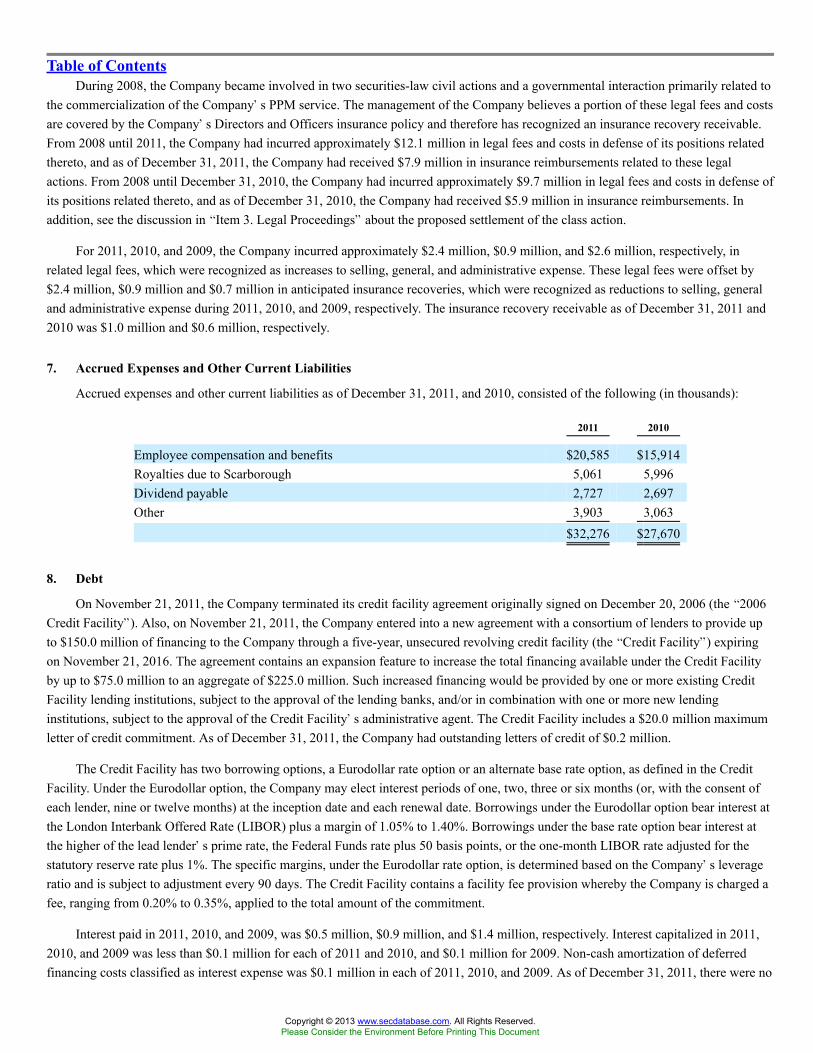
Table of ContentsDuring 2008, the Company became involved in two securities-law civil actions and a governmental interaction primarily related to
the commercialization of the Company�s PPM service. The management of the Company believes a portion of these legal fees and costsare covered by the Company�s Directors and Officers insurance policy and therefore has recognized an insurance recovery receivable.From 2008 until 2011, the Company had incurred approximately $12.1 million in legal fees and costs in defense of its positions relatedthereto, and as of December 31, 2011, the Company had received $7.9 million in insurance reimbursements related to these legalactions. From 2008 until December 31, 2010, the Company had incurred approximately $9.7 million in legal fees and costs in defense ofits positions related thereto, and as of December 31, 2010, the Company had received $5.9 million in insurance reimbursements. Inaddition, see the discussion in �Item 3. Legal Proceedings� about the proposed settlement of the class action.
For 2011, 2010, and 2009, the Company incurred approximately $2.4 million, $0.9 million, and $2.6 million, respectively, inrelated legal fees, which were recognized as increases to selling, general, and administrative expense. These legal fees were offset by$2.4 million, $0.9 million and $0.7 million in anticipated insurance recoveries, which were recognized as reductions to selling, generaland administrative expense during 2011, 2010, and 2009, respectively. The insurance recovery receivable as of December 31, 2011 and2010 was $1.0 million and $0.6 million, respectively.
7. Accrued Expenses and Other Current Liabilities
Accrued expenses and other current liabilities as of December 31, 2011, and 2010, consisted of the following (in thousands):
2011 2010
Employee compensation and benefits $20,585 $15,914Royalties due to Scarborough 5,061 5,996Dividend payable 2,727 2,697Other 3,903 3,063
$32,276 $27,670
8. Debt
On November 21, 2011, the Company terminated its credit facility agreement originally signed on December 20, 2006 (the �2006Credit Facility�). Also, on November 21, 2011, the Company entered into a new agreement with a consortium of lenders to provide upto $150.0 million of financing to the Company through a five-year, unsecured revolving credit facility (the �Credit Facility�) expiringon November 21, 2016. The agreement contains an expansion feature to increase the total financing available under the Credit Facilityby up to $75.0 million to an aggregate of $225.0 million. Such increased financing would be provided by one or more existing CreditFacility lending institutions, subject to the approval of the lending banks, and/or in combination with one or more new lendinginstitutions, subject to the approval of the Credit Facility�s administrative agent. The Credit Facility includes a $20.0 million maximumletter of credit commitment. As of December 31, 2011, the Company had outstanding letters of credit of $0.2 million.
The Credit Facility has two borrowing options, a Eurodollar rate option or an alternate base rate option, as defined in the CreditFacility. Under the Eurodollar option, the Company may elect interest periods of one, two, three or six months (or, with the consent ofeach lender, nine or twelve months) at the inception date and each renewal date. Borrowings under the Eurodollar option bear interest atthe London Interbank Offered Rate (LIBOR) plus a margin of 1.05% to 1.40%. Borrowings under the base rate option bear interest atthe higher of the lead lender�s prime rate, the Federal Funds rate plus 50 basis points, or the one-month LIBOR rate adjusted for thestatutory reserve rate plus 1%. The specific margins, under the Eurodollar rate option, is determined based on the Company�s leverageratio and is subject to adjustment every 90 days. The Credit Facility contains a facility fee provision whereby the Company is charged afee, ranging from 0.20% to 0.35%, applied to the total amount of the commitment.
Interest paid in 2011, 2010, and 2009, was $0.5 million, $0.9 million, and $1.4 million, respectively. Interest capitalized in 2011,2010, and 2009 was less than $0.1 million for each of 2011 and 2010, and $0.1 million for 2009. Non-cash amortization of deferredfinancing costs classified as interest expense was $0.1 million in each of 2011, 2010, and 2009. As of December 31, 2011, there were no
Copyright © 2013 www.secdatabase.com. All Rights Reserved.Please Consider the Environment Before Printing This Document

outstanding borrowings under the Credit Facility. As of December 31, 2010, the outstanding borrowings under the 2006 Credit Facilitywere $53.0 million and the related interest rate on such borrowings was 0.83%.
The Credit Facility contains certain financial covenants, and limits, among other things, the Company�s ability to sell certainassets, incur additional indebtedness, and grant or incur liens on its assets. The material debt covenants under the Company�s CreditFacility include both a maximum leverage ratio (�leverage ratio�) and a minimum interest coverage ratio (�interest coverage ratio�).The
61
Copyright © 2013 www.secdatabase.com. All Rights Reserved.Please Consider the Environment Before Printing This Document
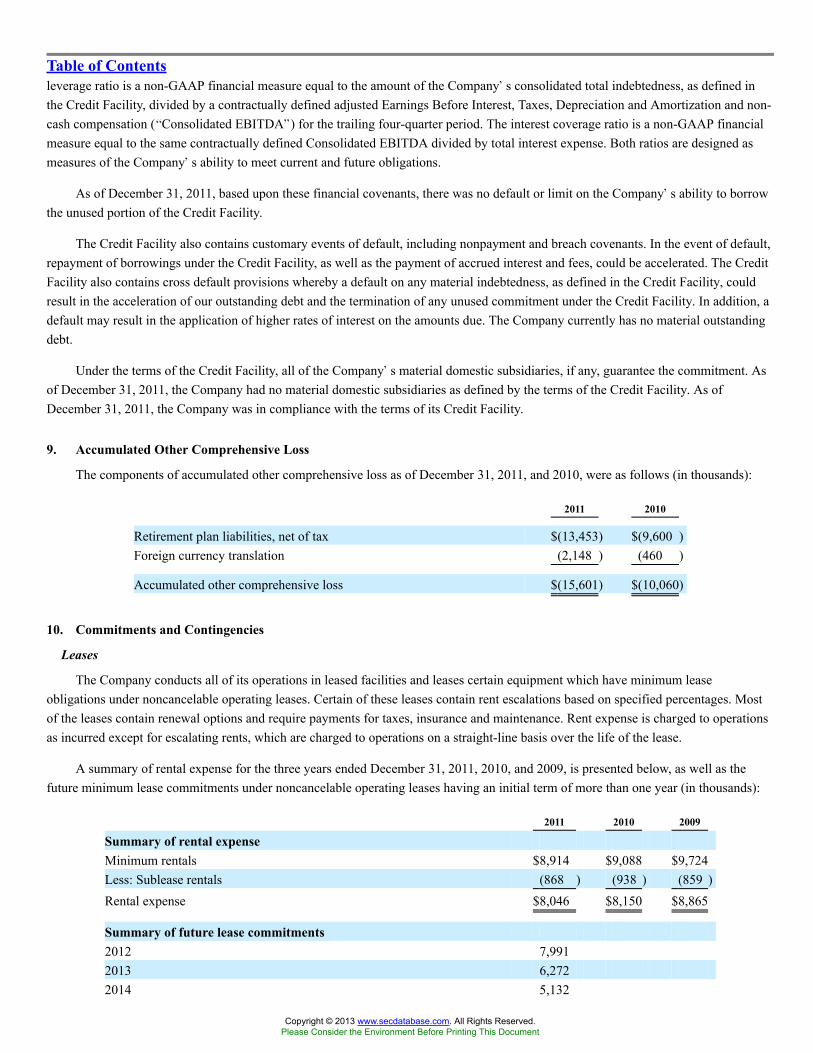
Table of Contentsleverage ratio is a non-GAAP financial measure equal to the amount of the Company�s consolidated total indebtedness, as defined inthe Credit Facility, divided by a contractually defined adjusted Earnings Before Interest, Taxes, Depreciation and Amortization and non-cash compensation (�Consolidated EBITDA�) for the trailing four-quarter period. The interest coverage ratio is a non-GAAP financialmeasure equal to the same contractually defined Consolidated EBITDA divided by total interest expense. Both ratios are designed asmeasures of the Company�s ability to meet current and future obligations.
As of December 31, 2011, based upon these financial covenants, there was no default or limit on the Company�s ability to borrowthe unused portion of the Credit Facility.
The Credit Facility also contains customary events of default, including nonpayment and breach covenants. In the event of default,repayment of borrowings under the Credit Facility, as well as the payment of accrued interest and fees, could be accelerated. The CreditFacility also contains cross default provisions whereby a default on any material indebtedness, as defined in the Credit Facility, couldresult in the acceleration of our outstanding debt and the termination of any unused commitment under the Credit Facility. In addition, adefault may result in the application of higher rates of interest on the amounts due. The Company currently has no material outstandingdebt.
Under the terms of the Credit Facility, all of the Company�s material domestic subsidiaries, if any, guarantee the commitment. Asof December 31, 2011, the Company had no material domestic subsidiaries as defined by the terms of the Credit Facility. As ofDecember 31, 2011, the Company was in compliance with the terms of its Credit Facility.
9. Accumulated Other Comprehensive Loss
The components of accumulated other comprehensive loss as of December 31, 2011, and 2010, were as follows (in thousands):
2011 2010
Retirement plan liabilities, net of tax $(13,453) $(9,600 )Foreign currency translation (2,148 ) (460 )
Accumulated other comprehensive loss $(15,601) $(10,060)
10. Commitments and Contingencies
Leases
The Company conducts all of its operations in leased facilities and leases certain equipment which have minimum leaseobligations under noncancelable operating leases. Certain of these leases contain rent escalations based on specified percentages. Mostof the leases contain renewal options and require payments for taxes, insurance and maintenance. Rent expense is charged to operationsas incurred except for escalating rents, which are charged to operations on a straight-line basis over the life of the lease.
A summary of rental expense for the three years ended December 31, 2011, 2010, and 2009, is presented below, as well as thefuture minimum lease commitments under noncancelable operating leases having an initial term of more than one year (in thousands):
2011 2010 2009
Summary of rental expenseMinimum rentals $8,914 $9,088 $9,724Less: Sublease rentals (868 ) (938 ) (859 )Rental expense $8,046 $8,150 $8,865
Summary of future lease commitments2012 7,9912013 6,2722014 5,132
Copyright © 2013 www.secdatabase.com. All Rights Reserved.Please Consider the Environment Before Printing This Document

2015 5,2502016 5,041Thereafter 13,427Minimum payments required (a) $43,113
(a) Minimum payments have not been reduced by sublease rentals of $2,117 due in future years under noncancelable subleases.
62
Copyright © 2013 www.secdatabase.com. All Rights Reserved.Please Consider the Environment Before Printing This Document

Table of ContentsLegal Matters
The Company is involved, from time to time, in litigation and proceedings arising out of the ordinary course of business. Legalcosts for services rendered in the course of these proceedings are charged to expense as they are incurred.
The Company is involved in a number of governmental interactions primarily related to the commercialization of our PPMservice. A contingent loss in the amount of $0.4 million and $0.5 million for these claims was recorded in accrued expenses and othercurrent liabilities on the Company�s consolidated balance sheets as of December 31, 2011, and December 31, 2010, respectively.
11. Income Taxes
The provision for income taxes is based on income recognized for consolidated financial statement purposes and includes theeffects of permanent and temporary differences between such income and income recognized for income tax return purposes. As a resultof the reverse spin-off from Ceridian, deferred tax assets consisting of net operating loss (�NOL�) and credit carryforwards weretransferred from Ceridian to the Company, along with temporary differences related to the Company�s business. The NOLcarryforwards will expire in various amounts from 2012 to 2029. Arbitron Mobile also incurred losses in 2011 available for U.S.carryforward subject to the separate return limitation year rules.
The components of income before income tax expense and a reconciliation of the statutory federal income tax rate to the incometax rate on income before income tax expense for the years ended December 31, 2011, 2010, and 2009 are as follows (dollars inthousands):
2011 2010 2009
Income (loss) before income tax expense:U.S. $89,188 $70,657 $59,853International (841 ) 1,115 1,279Total $88,347 $71,772 $61,132
Income tax expense (benefit):Current:
U.S. $32,871 $18,706 $18,464State, local and foreign 3,892 2,441 2,198Total 36,763 21,147 20,662
Deferred:U.S. (3,783 ) 3,700 1,310State, local and foreign 2,076 2,447 (3,000 )Total (1,707 ) 6,147 (1,690 )
$35,056 $27,294 $18,972
U.S. statutory rate 35.0 % 35.0 % 35.0 %Income tax expense at U.S. statutory rate $30,921 $25,120 $21,396State income taxes, net of federal benefit 3,452 2,834 2,904Meals and entertainment 198 187 199
Change in valuation allowance for foreign tax credit and capital loss 1,099 (169 ) �
State NOL�s recognized � � (4,801 )Adjustments to tax liabilities (279 ) 202 207Other (335 ) (880 ) (933 )
Income tax expense $35,056 $27,294 $18,972
Effective tax rate 39.7 % 38.0 % 31.0 %
Copyright © 2013 www.secdatabase.com. All Rights Reserved.Please Consider the Environment Before Printing This Document

63
Copyright © 2013 www.secdatabase.com. All Rights Reserved.Please Consider the Environment Before Printing This Document
Table of ContentsThe effective tax rate increased from 38.0% in 2010 to 39.7% in 2011 primarily due to a valuation allowance with respect to the
U.S. deferred tax asset arising from the 2011 net operating loss incurred by Arbitron Mobile.
The Company�s Indian operations are conducted in a Special Economic Zone (SEZ) providing for a reduction of tax rates oncertain classes of income when certain conditions are met. The Company was in compliance with these conditions as of December 31,2011. Beginning April of 2011, the Company became subject to a Minimum Alternate Tax in India due to a change in legislationaffecting all SEZ operating companies. The earnings from our foreign operations in India are subject to a tax holiday which partiallyexpires in fiscal year 2013. A deferred tax liability was recognized for the cumulative undistributed earnings which the Company doesnot expect to permanently reinvest outside of the U.S. Therefore, the Company�s reduction of tax expense due to the tax holiday inIndia was immaterial during fiscal years 2011 and 2010.
64
Copyright © 2013 www.secdatabase.com. All Rights Reserved.Please Consider the Environment Before Printing This Document

Table of ContentsThe following table summarizes the activity related to the Company�s unrecognized tax benefits as of December 31, 2011, and
2010 (in thousands):
2011 2010
Balance at January 1 $1,896 $2,210Increases related to current year tax positions 107 270Decreases related to prior years� tax positions (537 ) (353 )Expiration of the statute of limitations for the assessment of taxes (166 ) (231 )Balance at December 31 $1,300 $1,896
During 2011, certain liabilities for tax contingencies related to prior periods were recognized. Certain other liabilities werereversed due to the settlement and completion of income tax audits and returns and the expiration of audit statutes during the year. TheCompany�s net unrecognized tax benefits for these changes and other items decreased by $0.6 million to $1.3 million as ofDecember 31, 2011. If recognized, the $1.3 million of unrecognized tax benefits would reduce the Company�s effective tax rate infuture periods.
The Company accrues potential interest and penalties and recognizes income tax expense where, under relevant tax law, interestand penalties would be assessed if the uncertain tax position ultimately were not sustained. The Company has recorded a liability forpotential interest and penalties of $0.2 million as of December 31, 2011.
Management determined it is reasonably possible that certain unrecognized tax benefits as of December 31, 2011, will decreaseduring the subsequent 12 months due to the expiration of statutes of federal and state limitations and due to the settlement of certainstate audit examinations. The estimated decrease in these unrecognized federal tax benefits and the estimated decrease in unrecognizedtax benefits from various states are both immaterial.
The Company files numerous income tax returns, primarily in the United States, including federal, state, and local jurisdictions,and certain foreign jurisdictions. Tax years ended December 31, 2008 through December 31, 2010, remain open for assessment by theInternal Revenue Service. Generally, the Company is not subject to state, local, or foreign examination for years prior to 2006.However, tax years 1992 through 2005 remain open for assessment for certain state taxing jurisdictions where NOL carryforwards wereutilized on income tax returns for such states since 2006.
Temporary differences and the resulting deferred income tax assets as of December 31, 2011, and 2010, were as follows (inthousands):
2011 2010
Deferred tax assetsCurrent deferred tax assetsAccruals $5,084 $3,315Net operating loss carryforwards 1,314 1,443
6,398 4,758
Noncurrent deferred tax assetsBenefit plans $11,237 $8,744
Accruals 2,372 1,192Net operating loss carryforwards 760 1,575Share-based compensation 7,573 5,742Partnership interest 1,851 2,002Investment impairment 1,355 �
Other 1,316 72426,464 19,979
Copyright © 2013 www.secdatabase.com. All Rights Reserved.Please Consider the Environment Before Printing This Document

Less valuation allowance (1,262 ) (163 )Total deferred tax assets 31,600 24,574
Deferred tax liabilitiesNoncurrent deferred tax liabilitiesBasis differences in intangible assets and property and equipment $(22,860) $(19,346)Benefit plans (2,476 ) (2,431 )Other (1,168 ) (734 )Total deferred tax liabilities (26,504) (22,511)
Net deferred tax assets $5,096 $2,063
65
Copyright © 2013 www.secdatabase.com. All Rights Reserved.Please Consider the Environment Before Printing This Document

Table of ContentsIn assessing the realizability of deferred tax assets, management considers whether it is more likely than not that some portion or
all of the deferred tax assets will be realized. The ultimate realization of the deferred tax assets is dependent upon the generation offuture taxable income during periods in which the temporary differences become deductible and before tax credits or net operating losscarryforwards expire. Management considered the historical results of the Company during the previous three years and projected futureU.S. and foreign taxable income and determined that a valuation allowance of $1.3 million and $0.2 million was required as ofDecember 31, 2011 and 2010, respectively, for net operating losses, specific capital losses and foreign tax credit carryforwards.
Income taxes paid in 2011, 2010, and 2009 were $31.7 million, $24.9 million, and $23.7 million, respectively.
12. Retirement Plans
Pension Benefits
Certain of the Company�s U.S. employees participate in a defined benefit pension plan that closed to new participants effectiveJanuary 1, 1995. Benefits under the plan for most eligible employees are calculated using the highest five-year average salary of theemployee. Employees participate in this plan by means of salary reduction contributions. Vested benefits are based on an employee�sexpected date of retirement. Retirement plan funding amounts are based on independent consulting actuaries� determination of theEmployee Retirement Income Security Act of 1974 funding requirements.
For purposes of measuring the Company�s benefit obligation as of December 31, 2011, and 2010, a discount rate of 4.41% and5.09%, respectively, was used. These discount rates were chosen using an analysis of the Hewitt Bond Universe yield curve that reflectsthe plan�s projected cash flows. The fair value of plan assets increased by $1.6 million as of December 31, 2011, as compared toDecember 31, 2010, as employer contributions and investment gains exceeded benefits paid during the year. The plan�s projectedbenefit obligation increased by a net amount of $7.6 million, due primarily to the use of a lower discount rate as of December 31, 2011.The Company�s projected benefit obligations exceeded plan assets by $15.8 million and $9.8 million as of December 31, 2011, and2010, respectively. Pension cost, excluding any pension settlement charges incurred during the year, was $1.9 million, $1.5 million and$1.5 million for 2011, 2010, and 2009, respectively.
The Company�s projected benefit obligation was estimated using an expected long-term rate of return on assets of 8.0%. TheCompany employs a total return investment approach whereby a mix of equities and fixed income investments is used to maximize thelong-term return of plan assets for a prudent level of risk. The intent of this strategy is to minimize plan expenses by outperforming planliabilities over the long run. Risk tolerance is established through careful consideration of plan liabilities, plan funded status, andcorporate financial condition. The Company�s investment strategy is to diversify assets so that adverse results from one asset or assetclass will not have an unduly detrimental effect on the entire portfolio. Diversification includes by type, by characteristic, and bynumber of investments, as well as by investment style of management organization.
The investment portfolio contains a diversified blend of common collective trust fund investments, which include both equity andfixed income type investments. Equity investments are diversified across U.S. and non-U.S. stocks, as well as growth and value stocks.Fixed income investments are diversified across asset-backed and mortgage-backed securities, U.S. treasury securities, and corporatebonds. Investment risk is measured and monitored on an ongoing basis through annual liability measurements, periodic asset/liabilitystudies and periodic investment performance reviews.
The Financial Accounting Standards Board provides a fair value hierarchy that prioritizes the inputs to valuation techniques usedto measure fair value. The hierarchy gives the highest priority to unadjusted quoted prices in active markets for identical assets orliabilities (level 1 measurements) and the lowest priority to unobservable inputs (level 3 measurements). The three levels of the fairvalue hierarchy are described below:
Level 1 � Inputs to the valuation methodology are unadjusted quoted prices for identical assets or liabilities in active markets.
Level 2 � Inputs to the valuation methodology include:
� Quoted prices for similar assets or liabilities in active markets;
Copyright © 2013 www.secdatabase.com. All Rights Reserved.Please Consider the Environment Before Printing This Document

� Quoted prices for identical or similar assets or liabilities in inactive markets;
66
Copyright © 2013 www.secdatabase.com. All Rights Reserved.Please Consider the Environment Before Printing This Document

Table of Contents� Inputs other than quoted prices that are observable for the asset or liability;
� Inputs that are derived principally from or corroborated by observable market data by correlation or other means.
Level 3 � Inputs to the valuation methodology are unobservable and significant to the fair value measurement.
The following is a description of the valuation methodologies used for pension plan assets measured at fair value.
Money market fund: The investment in the money market fund is valued at the net asset value of shares held at year end.
Collective investment funds: Investments in collective investment funds are valued at the last reported transaction price per unit.
The fair values of the Company�s pension plan assets at December 31, 2011, and 2010, by asset category are as follows (inthousands):
As of December 31, 2011
Total
Fair
Value
Quoted
prices in
active
markets
Level 1
Significant
observable
inputs
Level 2
Significant
unobservable
inputs
Level 3
Asset CategoryCollective investment funds
Fixed income (a) $11,062 $ � $11,062 $ �
U.S. equity growth 6,945 � 6,945 �
U.S. equity value 6,952 � 6,952 �
Foreign equity 2,810 � 2,810 �
Money market fund 702 702 � �
Pension assets at December 31, 2011 $28,471 $ 702 $27,769 $ �
(a) As of December 31, 2011, the fixed income fund consisted of a 34% investment in asset and mortgage-backed securities, a 41%investment in U.S. treasury securities, and a 25% investment in corporate bonds.
As of December 31, 2010
Total
Fair
Value
Quoted
prices in
active
markets
Level 1
Significant
observable
inputs
Level 2
Significant
unobservable
inputs
Level 3
Asset CategoryCollective investment funds
Fixed income (b) $10,626 $ � $10,626 $ �
U.S. equity growth 6,607 � 6,607 �
U.S. equity value 6,622 � 6,622 �
Foreign equity 2,658 � 2,658 �
Money market fund 345 345 � �
Pension assets at December 31, 2010 $26,858 $ 345 $26,513 $ �
(b) As of December 31, 2010, the fixed income fund consisted of a 35% investment in asset and mortgage-backed securities, a 41%investment in U.S. treasury securities, and a 24% investment in corporate bonds.
Copyright © 2013 www.secdatabase.com. All Rights Reserved.Please Consider the Environment Before Printing This Document

67
Copyright © 2013 www.secdatabase.com. All Rights Reserved.Please Consider the Environment Before Printing This Document

Table of ContentsCash held and intended to pay benefits is considered to be a residual asset in the asset mix, and therefore, compliance with the
ranges and targets specified shall be calculated excluding such assets. Assets of the plan do not include securities issued by theCompany. The target allocation for each asset class is 60% equity securities and 40% debt securities.
The components of net periodic cost and other comprehensive loss (income) for the years ended December 31, 2011, 2010,and 2009, are as follows (in thousands):
2011 2010 2009
Net periodic costService cost of benefits $774 $731 $790Interest cost 1,819 1,883 1,847Expected return on plan assets (2,051) (2,118) (2,172)Amortization of net actuarial loss 1,370 1,052 992Amortization of prior service cost � � 22Total $1,912 $1,548 $1,479
Other changes in plan assets and projected benefit obligationrecognized in other comprehensive loss (income)
Net actuarial loss (gain) arising this year 7,449 281 (2,295)Actuarial loss charged to expense due to settlement � � (1,521)Net actuarial loss amortized this year (1,370) (1,052) (992 )Prior service cost amortized this year � � (22 )Recognized in other comprehensive loss (income) 6,079 (771 ) (4,830)
Recognized in net periodic pension cost and other comprehensive loss(income) $7,991 $777 $(3,351)
The Company�s estimate for contributions to be paid in 2012 is $2.6 million. The expected benefit payments are as follows(in thousands):
2012 $2,0532013 $2,1922014 $2,1442015 $2,1272016 $2,7902017 - 2021 $13,973
The accumulated benefit obligation for the defined benefit pension plan was $40.3 million and $32.6 million as ofDecember 31, 2011, and 2010, respectively.
68
Copyright © 2013 www.secdatabase.com. All Rights Reserved.Please Consider the Environment Before Printing This Document

Table of ContentsThe funded status of the plan as of the measurement dates of December 31, 2011, and 2010, and the change in funded status for the
measurement periods ended December 31, 2011, and 2010, are shown in the accompanying table for the Company�s pension plan,along with the assumptions used in the calculations (dollars in thousands):
Pension Plan
2011 2010
Change in projected benefit obligationAt beginning of year $36,690 $34,760Service cost 774 731Interest cost 1,819 1,883Plan participants� contributions 238 231Actuarial loss 6,122 965Benefits paid (1,397 ) (1,880 )At end of year $44,246 $36,690
Change in fair value of plan assetsAt beginning of year $26,858 $24,587Actual return on plan assets 724 2,802Employer contribution 2,048 1,118Plan participants� contributions 238 231Benefits paid (1,397 ) (1,880 )At end of year $28,471 $26,858
Funded status - net pension liability at year end $(15,775) $(9,832 )
Amounts recognized in accumulated other comprehensive lossNet actuarial loss $19,744 $13,665
Estimated amounts of accumulated other comprehensive loss tobe recognized as net periodic cost during the subsequent year
Net actuarial loss $1,885 $1,370
Weighted-average assumptionsDiscount rate - components of cost 5.09 % 5.52 %Discount rate - benefit obligations 4.41 % 5.09 %Expected return on plan assets 8.00 % 8.00 %Rate of compensation increase N/A N/A
69
Copyright © 2013 www.secdatabase.com. All Rights Reserved.Please Consider the Environment Before Printing This Document

Table of ContentsSupplemental Retirement Benefits
During the years ended December 31, 2011, 2010, and 2009, the Company sponsored the Benefit Equalization Plan (�BEP�), thepurpose of which is to ensure that pension plan participants will not be deprived of benefits otherwise payable under the pension planbut for the operation of the provisions of Internal Revenue Code sections 415 and 401. The accumulated benefit obligation for the BEPas of December 31, 2011, and 2010, was $3.3 million and $2.9 million, respectively.
As of December 31, 2011, and 2010, prepaid pension cost related to the BEP of $0.3 million and $0.2 million, respectively, washeld in a benefit protection trust and included in other noncurrent assets in the consolidated balance sheets. The Company�s estimate forcontributions to be paid for the BEP in 2012 is $0.2 million. The expected benefit payments for the BEP are as follows (in thousands):
2012 $1612013 $1612014 $1612015 $1912016 $1922017 - 2021 $966
For the years ended December 31, 2010 and 2009, in addition to the BEP, the Company also sponsored a Supplemental ExecutiveRetirement Plan ( �SERP� individually or �Supplemental Plans� when combined with the BEP). The SERP was a supplementalretirement plan for a former chief executive officer, who retired from the Company on December 31, 2009. The Company�s $0.7million SERP obligation was paid during 2010.
The Supplemental Plans are nonqualified, unfunded supplemental retirement plans. The components of net periodic SupplementalPlan cost and other comprehensive (income) loss for the years ended December 31, 2011, 2010, and 2009 are as follows (in thousands):
2011 2010 2009
Net periodic costService cost of benefits $20 $16 $93Interest cost 159 192 318Amortization of net actuarial loss 153 148 431Amortization of prior service credit � � (16 )Total $332 $356 $826
Other changes in plan assets and projected benefit obligationrecognized in other comprehensive loss (income)
Net actuarial loss (gain) arising this year $464 $493 $(1,104)Net actuarial loss amortized this year (153) (148 ) (431 )Actuarial loss due to settlement � (1,222) (267 )Prior service credit due to curtailment � � 6Prior service credit amortized this year � � 16Recognized in other comprehensive loss (income) $311 $(877 ) $(1,780)
Recognized in net periodic cost and other comprehensive loss (income) $643 $(521 ) $(954 )
70
Copyright © 2013 www.secdatabase.com. All Rights Reserved.Please Consider the Environment Before Printing This Document

Table of ContentsThe funded status and the change in funded status for the measurement periods ended December 31, 2011, and 2010 are shown in
the accompanying table for the Company�s supplemental retirement plans, along with the assumptions used in the calculations (dollarsin thousands):
Supplemental Plans
2011 2010
Change in projected benefit obligationAt beginning of year $3,204 $5,720Service cost 20 16Interest cost 159 192Plan participants� contributions 11 6Actuarial loss 464 493Benefits paid (158 ) (3,223)At end of year $3,700 $3,204
Change in fair value of plan assetsAt beginning of year � �
Actual return on plan assets � �
Employer contribution 147 3,217Plan participants� contributions 11 6Benefits paid (158 ) (3,223)At end of year $� $�
Funded status - net liability at year end $3,700 $3,204
Amounts recognized in accumulated other comprehensive lossNet actuarial loss $1,863 $1,552
Estimated amounts of accumulated other comprehensive loss to berecognized as net periodic cost during the subsequent year
Net actuarial loss $192 $153
Weighted-average assumptionsDiscount rate
Components of cost 5.09 % 5.52 %Benefit obligations 4.41 % 5.09 %
Expected return on plan assets N/A N/ARate of compensation increase N/A N/A
71
Copyright © 2013 www.secdatabase.com. All Rights Reserved.Please Consider the Environment Before Printing This Document
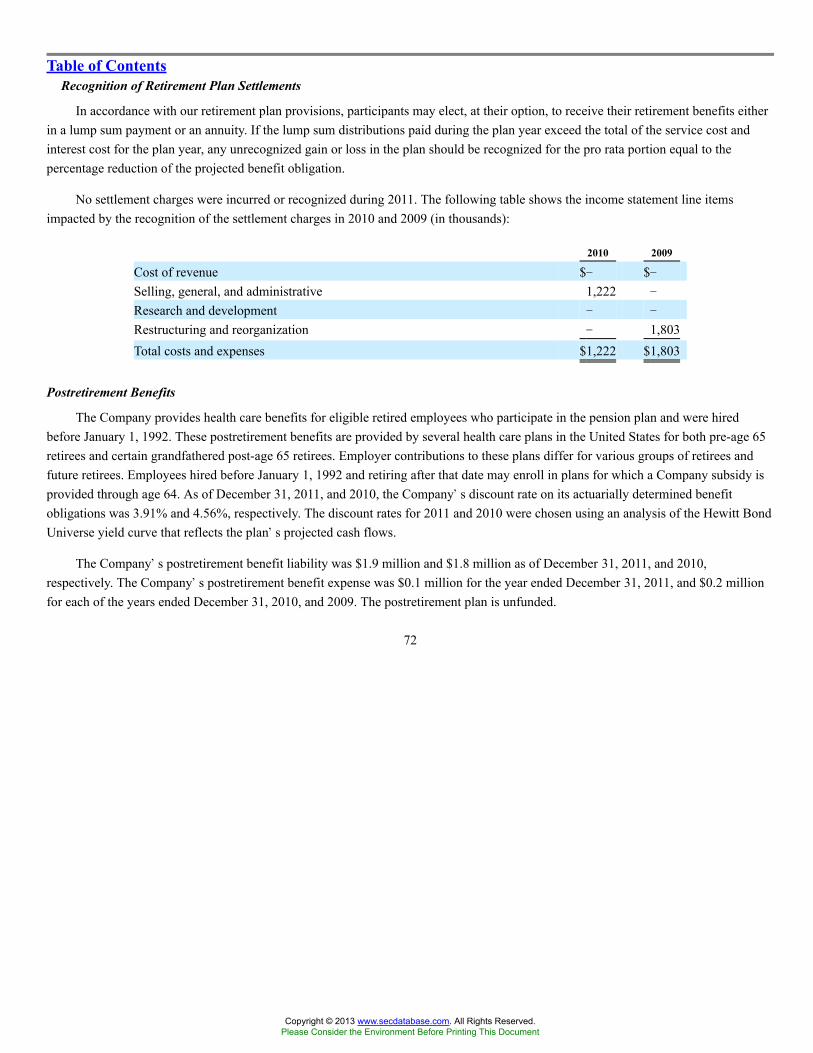
Table of ContentsRecognition of Retirement Plan Settlements
In accordance with our retirement plan provisions, participants may elect, at their option, to receive their retirement benefits eitherin a lump sum payment or an annuity. If the lump sum distributions paid during the plan year exceed the total of the service cost andinterest cost for the plan year, any unrecognized gain or loss in the plan should be recognized for the pro rata portion equal to thepercentage reduction of the projected benefit obligation.
No settlement charges were incurred or recognized during 2011. The following table shows the income statement line itemsimpacted by the recognition of the settlement charges in 2010 and 2009 (in thousands):
2010 2009
Cost of revenue $� $�Selling, general, and administrative 1,222 �
Research and development � �
Restructuring and reorganization � 1,803Total costs and expenses $1,222 $1,803
Postretirement Benefits
The Company provides health care benefits for eligible retired employees who participate in the pension plan and were hiredbefore January 1, 1992. These postretirement benefits are provided by several health care plans in the United States for both pre-age 65retirees and certain grandfathered post-age 65 retirees. Employer contributions to these plans differ for various groups of retirees andfuture retirees. Employees hired before January 1, 1992 and retiring after that date may enroll in plans for which a Company subsidy isprovided through age 64. As of December 31, 2011, and 2010, the Company�s discount rate on its actuarially determined benefitobligations was 3.91% and 4.56%, respectively. The discount rates for 2011 and 2010 were chosen using an analysis of the Hewitt BondUniverse yield curve that reflects the plan�s projected cash flows.
The Company�s postretirement benefit liability was $1.9 million and $1.8 million as of December 31, 2011, and 2010,respectively. The Company�s postretirement benefit expense was $0.1 million for the year ended December 31, 2011, and $0.2 millionfor each of the years ended December 31, 2010, and 2009. The postretirement plan is unfunded.
72
Copyright © 2013 www.secdatabase.com. All Rights Reserved.Please Consider the Environment Before Printing This Document

Table of ContentsThe Company expects to make $0.1 million in contributions in 2012. The expected benefit payments are as follows (in thousands):
2012 $1202013 $1282014 $1462015 $1572016 $1392017-2021 $763
The components of net periodic postretirement plan cost and other comprehensive loss (income) for the years ended December 31,2011, 2010, and 2009, are as follows (in thousands):
2011 2010 2009
Net periodic costService cost of benefits $38 $38 $49Interest cost 81 89 92Amortization of net actuarial loss 28 36 43Total $147 $163 $184
Other changes in plan assets and projected benefit obligation recognized inother comprehensive loss (income)
Net actuarial loss (gain) arising this year $(35 ) $(79 ) $(41 )Net actuarial loss amortized this year (28 ) (36 ) (43 )Recognized in other comprehensive loss (income) $(63 ) $(115) $(84 )
Recognized in net periodic cost and other comprehensive loss (income) $84 $48 $100
73
Copyright © 2013 www.secdatabase.com. All Rights Reserved.Please Consider the Environment Before Printing This Document

Table of ContentsThe accompanying table presents the balances of and changes in the postretirement benefit obligation as of the measurement dates
of December 31, 2011, and 2010 (dollars in thousands):
Postretirement Plan
2011 2010
Change in projected benefit obligationAt beginning of year $1,837 $1,783Service cost 38 38Interest cost 81 89Plan participants� contributions 55 59Actuarial gain (35 ) (79 )Benefits paid (69 ) (53 )At end of year $1,907 $1,837
Change in fair value of plan assetsAt beginning of year $� $�Employer contribution 14 (6 )Plan participants� contributions 55 59Benefits paid (69 ) (53 )At end of year $� $�
Funded status - net liability at year end $1,907 $1,837
Amounts recognized in accumulated other comprehensive lossNet actuarial loss $348 $411
Estimated amounts of accumulated other comprehensive loss to berecognized as net periodic cost during the subsequent year
Net actuarial loss $21 $25
Weighted-average assumptionsDiscount rate
Components of cost 4.56 % 5.17 %Benefit obligations 3.91 % 4.56 %
Expected return on plan assets N/A N/ARate of compensation increase N/A N/A
The assumed health care cost trend rate used in measuring the post retirement benefit obligation was 8.50% for pre-age 65 andpost-age 65 in 2011, with pre-age and post-age 65 rates declining to an ultimate rate of 5.00% in 2018. A 1.0% change in this rate wouldchange the benefit obligation by up to approximately $0.2 million and the aggregate service and interest cost by less than $0.1 million.
74
Copyright © 2013 www.secdatabase.com. All Rights Reserved.Please Consider the Environment Before Printing This Document

Table of Contents401(k) Plan
The Company�s employees may participate in a defined contribution plan sponsored by the Company. For the period endedDecember 31, 2011, there was no plan limitation on the percentage of eligible earnings a participant could contribute to the plan, otherthan those limitations set by the Internal Revenue Code. For the period ended December 31, 2010, the plan generally provided foremployee salary deferral contributions of up to 17% of eligible employee compensation.
Under the terms of the plan, the Company contributes a matching contribution of 50% up to a maximum of 3% of eligibleemployee compensation related to employees who are pension participants and up to a maximum of 6% of eligible employeecompensation related to employees who are not pension participants. The Company may also make an additional discretionary matchingcontribution of up to 30% up to the maximum eligible employee compensation. The Company�s costs with respect to its contributionsto the defined contribution plan were $2.7 million, $2.1 million and $2.0 million in 2011, 2010, and 2009, respectively.
13. Share-Based Compensation
The following table sets forth information with regard to the income statement recognition of share-based compensation (inthousands):
2011 2010 2009
Cost of revenue $592 $418 $451Selling, general and administrative 7,057 5,767 9,438Research and development 371 293 142Total share-based compensation $8,020 $6,478 $10,031
The total income tax benefit recognized in the income statement for share-based compensation arrangements was $3.2 million,$2.5 million, and $3.9 million for the years ended December 31, 2011, 2010, and 2009, respectively. No share-based compensation costwas capitalized during the years ended December 31, 2011, 2010, and 2009. The increase (decrease) in net excess tax benefits realizedfor the tax deductions from stock options exercised and stock awards vesting during the year was $0.9 million, less than $0.1 millionand $(1.8) million for the years ended December 31, 2011, 2010, and 2009, respectively.
The Company had two active stock incentive plans (�SIP� individually or �SIPs� collectively) from which awards of stockoptions, nonvested share awards and performance awards were available for grant to eligible participants during 2011: the 2001 SIP, anon-stockholder-approved plan; and the 2008 Equity Compensation Plan, a stockholder-approved plan. The Company believes that suchawards align the interests of its employees with those of its stockholders. Eligible recipients in the SIPs include all employees of theCompany and any non-employee director, consultant and independent contractor of the Company. As of December 31, 2011, thenumber of shares available for future grants was 2,965,033 shares under the 2008 Equity Compensation Plan, which has an expirationdate of May 25, 2020.
The Company�s policy for issuing shares upon exercise of stock options or the vesting of its share awards and/or conversion ofdeferred stock units under all of the Company�s SIPs is to issue new shares of common stock, unless treasury stock is available at thetime of exercise or conversion.
75
Copyright © 2013 www.secdatabase.com. All Rights Reserved.Please Consider the Environment Before Printing This Document
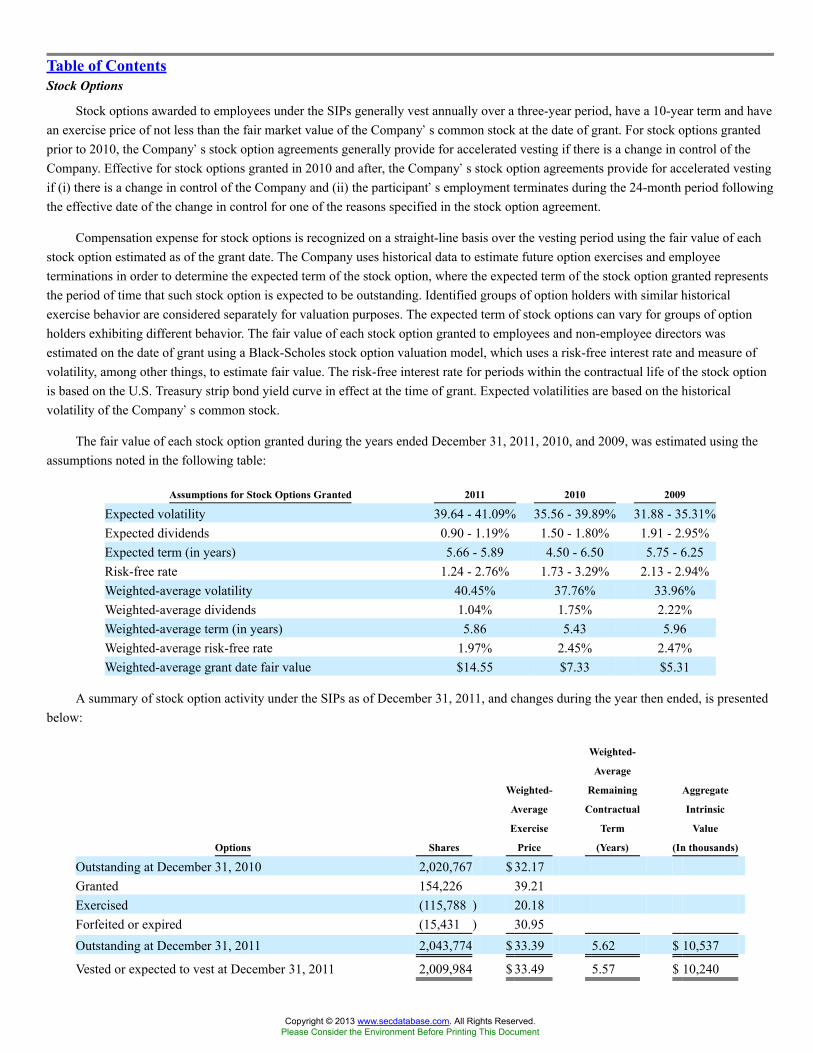
Table of ContentsStock Options
Stock options awarded to employees under the SIPs generally vest annually over a three-year period, have a 10-year term and havean exercise price of not less than the fair market value of the Company�s common stock at the date of grant. For stock options grantedprior to 2010, the Company�s stock option agreements generally provide for accelerated vesting if there is a change in control of theCompany. Effective for stock options granted in 2010 and after, the Company�s stock option agreements provide for accelerated vestingif (i) there is a change in control of the Company and (ii) the participant�s employment terminates during the 24-month period followingthe effective date of the change in control for one of the reasons specified in the stock option agreement.
Compensation expense for stock options is recognized on a straight-line basis over the vesting period using the fair value of eachstock option estimated as of the grant date. The Company uses historical data to estimate future option exercises and employeeterminations in order to determine the expected term of the stock option, where the expected term of the stock option granted representsthe period of time that such stock option is expected to be outstanding. Identified groups of option holders with similar historicalexercise behavior are considered separately for valuation purposes. The expected term of stock options can vary for groups of optionholders exhibiting different behavior. The fair value of each stock option granted to employees and non-employee directors wasestimated on the date of grant using a Black-Scholes stock option valuation model, which uses a risk-free interest rate and measure ofvolatility, among other things, to estimate fair value. The risk-free interest rate for periods within the contractual life of the stock optionis based on the U.S. Treasury strip bond yield curve in effect at the time of grant. Expected volatilities are based on the historicalvolatility of the Company�s common stock.
The fair value of each stock option granted during the years ended December 31, 2011, 2010, and 2009, was estimated using theassumptions noted in the following table:
Assumptions for Stock Options Granted 2011 2010 2009
Expected volatility 39.64 - 41.09% 35.56 - 39.89% 31.88 - 35.31%Expected dividends 0.90 - 1.19% 1.50 - 1.80% 1.91 - 2.95%Expected term (in years) 5.66 - 5.89 4.50 - 6.50 5.75 - 6.25Risk-free rate 1.24 - 2.76% 1.73 - 3.29% 2.13 - 2.94%Weighted-average volatility 40.45% 37.76% 33.96%Weighted-average dividends 1.04% 1.75% 2.22%Weighted-average term (in years) 5.86 5.43 5.96Weighted-average risk-free rate 1.97% 2.45% 2.47%Weighted-average grant date fair value $14.55 $7.33 $5.31
A summary of stock option activity under the SIPs as of December 31, 2011, and changes during the year then ended, is presentedbelow:
Options Shares
Weighted-
Average
Exercise
Price
Weighted-
Average
Remaining
Contractual
Term
(Years)
Aggregate
Intrinsic
Value
(In thousands)
Outstanding at December 31, 2010 2,020,767 $ 32.17Granted 154,226 39.21Exercised (115,788 ) 20.18Forfeited or expired (15,431 ) 30.95Outstanding at December 31, 2011 2,043,774 $ 33.39 5.62 $ 10,537
Vested or expected to vest at December 31, 2011 2,009,984 $ 33.49 5.57 $ 10,240
Copyright © 2013 www.secdatabase.com. All Rights Reserved.Please Consider the Environment Before Printing This Document
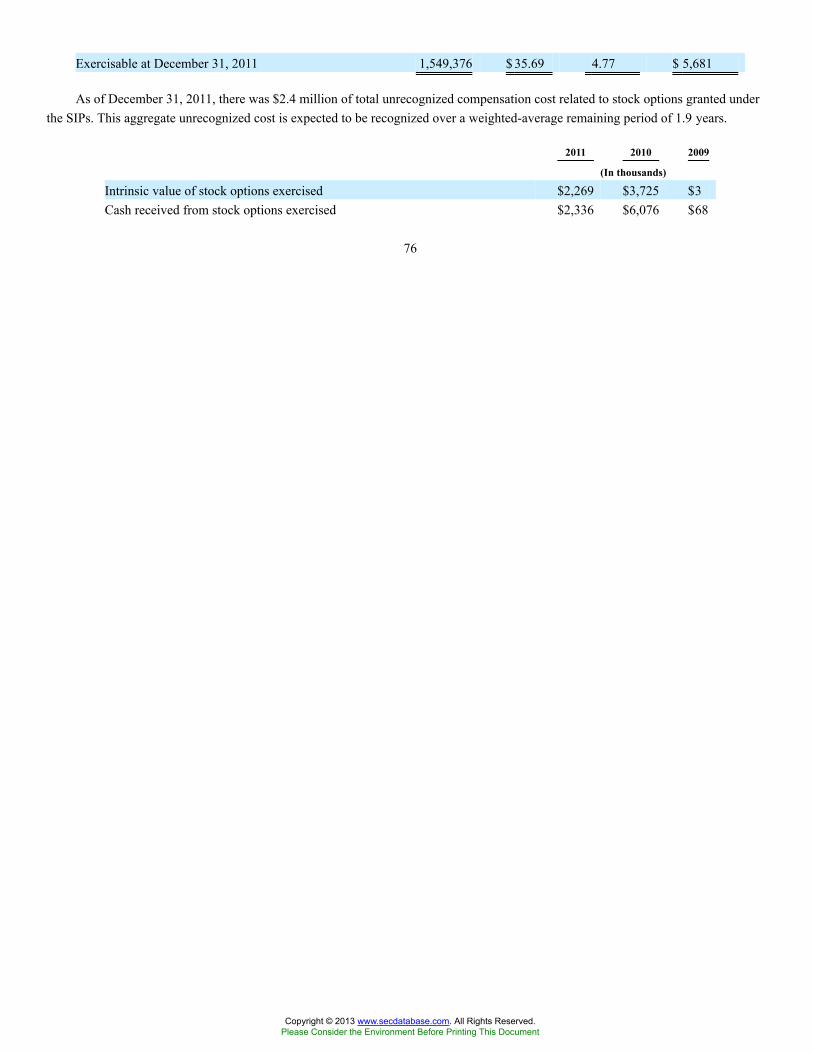
Exercisable at December 31, 2011 1,549,376 $ 35.69 4.77 $ 5,681
As of December 31, 2011, there was $2.4 million of total unrecognized compensation cost related to stock options granted underthe SIPs. This aggregate unrecognized cost is expected to be recognized over a weighted-average remaining period of 1.9 years.
2011 2010 2009
(In thousands)
Intrinsic value of stock options exercised $2,269 $3,725 $3Cash received from stock options exercised $2,336 $6,076 $68
76
Copyright © 2013 www.secdatabase.com. All Rights Reserved.Please Consider the Environment Before Printing This Document

Table of ContentsService and Performance Award Units
Service award units. The Company granted service award units under the SIPs. These service award units (i) were issued at the fairmarket value of the Company�s common stock on the date of grant, (ii) vest in four equal annual installments beginning on the firstanniversary date of the grant, and (iii) for any unvested units, expire without vesting if the employee is no longer employed by theCompany. For those service award units granted prior to 2010, the service award units generally provide for accelerated vesting if thereis a change in control of the Company. Effective for service award units granted in 2010 and after, the service award units provide foraccelerated vesting if (i) there is a change in control of the Company and (ii) the participant�s employment terminates during the24-month period following the effective date of the change in control for one of the reasons specified in the restricted stock unitagreement.
A summary of the status of the Company�s service awards as of December 31, 2011, and changes during the year endedDecember 31, 2011, is presented below:
Service Award Units Shares
Weighted-
Average
Grant-Date
Fair Value
Outstanding at December 31, 2010 169,203 $ 21.07Granted 18,434 42.72Vested (58,819 ) 26.99Cancellations (1,581 ) 22.46Nonvested at December 31, 2011 127,237 $ 21.45
Expected to vest at December 31, 2011 119,577 $ 21.45
Compensation expense for service award units is recognized on a straight-line basis over the vesting period using the fair marketvalue of the Company�s common stock on the date of grant. As of December 31, 2011, there was $2.0 million of total unrecognizedcompensation cost related to service award units granted under the SIPs. This aggregate unrecognized cost for service award units isexpected to be recognized over a weighted-average period of 1.93 years. The total fair value of service awards vested, using the fairvalue on vest date, during the years ended December 31, 2011, 2010, and 2009, was $2.6 million, $2.3 million, and $2.0 million,respectively.
Performance award units. During 2011 and 2010, the Company granted performance award units under the SIPs. Theseperformance award units (i) were issued at the fair market value of the Company�s common stock on the date of grant, (ii) will expirewithout vesting if the Company�s return on invested capital (�ROIC�) for the annual performance period does not exceed 12 percent,which is an approximation of the Company�s weighted average cost of capital, (iii) will, if the Company�s ROIC exceeds 12 percent,vest in four equal annual installments beginning on the first anniversary date of the grant, and (iv) for any unvested units, expire withoutvesting if the recipient is no longer employed by the Company. The Company�s performance award units provide for acceleratedvesting if (i) there is a change in control of the Company and (ii) the recipient�s employment terminates during the 24-month periodfollowing the effective date of the change in control for one of the reasons specified in the performance-based restricted stock unitagreement.
A summary of the status of the Company�s performance awards as of December 31, 2011, and changes during the year endedDecember 31, 2011, is presented below:
Performance Award Units Shares
Weighted-
Average
Grant-Date
Fair Value
Outstanding at December 31, 2010 78,974 $ 26.33
Copyright © 2013 www.secdatabase.com. All Rights Reserved.Please Consider the Environment Before Printing This Document

Granted 52,503 42.77Vested (19,765 ) 26.33Cancellations (2,191 ) 35.93Nonvested at December 31, 2011 109,521 $ 34.29
Expected to vest at December 31, 2011 102,928 $ 34.29
Compensation expense for performance award units is recognized using the fair market value of the Company�s common stock onthe date of grant and on an accelerated basis. The Company recognizes expense for these performance award units under the assumptionthat the performance ROIC target will be achieved. If it appears probable such performance ROIC target will not be met, the Companywill stop recognizing any further compensation cost and any previously recognized compensation cost would be reversed.
77
Copyright © 2013 www.secdatabase.com. All Rights Reserved.Please Consider the Environment Before Printing This Document

Table of ContentsAs of December 31, 2011, there was $2.0 million of total unrecognized compensation cost related to performance award units
granted under the SIPs. This aggregate unrecognized cost is expected to be recognized over a weighted-average period of 3.04 years.The total fair value of performance awards vested, using the fair value on vest date, during the year ended December 31, 2011, was $0.8million. No performance award units vested during 2010 and 2009.
78
Copyright © 2013 www.secdatabase.com. All Rights Reserved.Please Consider the Environment Before Printing This Document

Table of ContentsDeferred Stock Units
Service DSU grant to CEO. During 2011 and 2010, the Company granted service-based deferred stock unit awards (�ServiceDSUs�) under the SIPs to its CEO. Service DSUs are issued at the fair market value of the Company�s stock on the date of grant, andgenerally vest annually over a four-year period on each anniversary date of the grant. The Service DSUs, if vested, will be convertibleinto shares of the Company�s common stock following the holder�s termination of employment. The Service DSUs provide foraccelerated vesting upon termination without cause or the CEO�s retirement as defined in his employment agreement. No Service DSUswere converted into shares of the Company�s common stock during 2011.
Service DSU Units Granted to CEO Shares
Weighted-
Average
Grant-Date
Fair Value
Outstanding at December 31, 2010 60,144 $ 24.94Granted 900 44.44Vested (15,936) 26.04Total at December 31, 2011 45,108 $ 24.94
Expected to vest at December 31, 2011 45,108 $ 24.94
Compensation expense for Service DSUs is recognized on a straight-line basis over the vesting period using the fair market valueof the Company�s common stock on the date of grant. As of December 31, 2011, there was less than $0.1 million of total unrecognizedcompensation cost related to Service DSUs. This aggregate unrecognized cost is expected to be recognized over the weighted-averageremaining period of 0.03 years. The total fair value of Service DSUs vested, using the fair value on vest date, during the year endedDecember 31, 2011, was $0.7 million. No Service DSUs vested during 2010 and 2009.
Performance DSU grant to CEO. During 2011 and 2010, the Company granted performance-based deferred stock unit awards(�Performance DSUs�) under the SIPs to its CEO. These Performance DSUs (i) were issued at the fair market value of the Company�scommon stock on the date of grant, (ii) will expire without vesting if the Company�s return on invested capital (�ROIC�) for the annualperformance period does not exceed 12 percent, which is an approximation of the Company�s weighted average cost of capital,(iii) will, if the Company�s ROIC exceeds 12 percent, vest in four equal annual installments beginning on the first anniversary date ofthe grant, and (iv) provide for accelerated vesting upon termination without cause or the CEO�s retirement as defined in hisemployment agreement. These Performance DSUs, if vested, will be convertible into shares of the Company�s common stock,subsequent to termination of employment.
Performance DSUs Granted to CEO Shares
Weighted-
Average
Grant-Date
Fair Value
Outstanding at December 31, 2010 23,004 $ 22.17Granted 24,122 44.44Vested (5,751 ) 22.17Total at December 31, 2011 41,375 $ 35.15
Expected to vest at December 31, 2011 41,375 $ 35.15
Compensation expense for Performance DSUs is recognized using the fair market value of the Company�s common stock on thedate of grant and on an accelerated basis. The Company recognizes expense for these Performance DSUs under the assumption that theperformance target will be achieved. If it appears probable such performance target will not be met, the Company will stop recognizingany further compensation cost and any previously recognized compensation cost would be reversed. As of December 31, 2011, therewas $0.5 million of total unrecognized compensation cost related to Performance DSUs. This aggregate unrecognized cost is expected
Copyright © 2013 www.secdatabase.com. All Rights Reserved.Please Consider the Environment Before Printing This Document

to be recognized over the weighted-average remaining period of 1.02 years. The total fair value of Performance DSUs vested, using thefair value on vest date, during the year ended December 31, 2011, was $0.2 million. No Performance DSUs vested during 2010 and2009.
Awards for service on Board of Directors (�Board�). The Company issues deferred stock units to its Board of Directors (�BoardDSUs�) under the SIPs. These Board DSUs (i) were issued at the fair market value of the Company�s common stock on the date ofgrant and (ii) if vested, will be convertible to shares of the Company�s common stock subsequent to termination of service as a director.Annual grants of Board DSUs vest annually in three equal installments over a three-year period.
In addition to receiving Board DSU grants annually, the Board members have the right to elect to receive all or a portion of theirretainer and meeting attendance fees as cash and/or Board DSUs, which vest immediately. Board DSUs are only granted to non-employee Directors.
79
Copyright © 2013 www.secdatabase.com. All Rights Reserved.Please Consider the Environment Before Printing This Document

Table of ContentsA summary of the status of the Company�s nonvested Board DSUs as of December 31, 2011, and changes during the year ended
December 31, 2011, is presented below:
Nonvested Board DSUs Shares
Weighted-
Average
Grant-Date
Fair Value
Outstanding at December 31, 2010 32,961 $ 28.43Granted 30,397 39.89Vested (17,212) 31.46Nonvested at December 31, 2011 46,146 $ 34.85
Vested at December 31, 2011 65,433 $ 30.15
Expected to vest at December 31, 2011 43,262 $ 34.85
Compensation expense for Board DSUs is recognized on a straight-line basis over the vesting period using the fair market value ofthe Company�s common stock on the date of grant. As of December 31, 2011, there was $1.2 million of total unrecognizedcompensation cost related to Board DSUs granted to non-employee directors. This aggregate unrecognized cost is expected to berecognized over the weighted-average period of 2.07 years. The total fair value of share awards vested, using the fair value on vest date,during the years ended December 31, 2011, 2010, and 2009, was $0.7 million, $0.2 million, and $1.4 million, respectively.
Employee Stock Purchase Plan
The Company has an Employee Stock Purchase Plan (�ESPP�) under which full time employees may purchase shares from theCompany at a discount to the fair market value. As of December 31, 2011, the number of shares of the Company�s common stockavailable for issuance under the ESPP was 333,603. The purchase price of the stock to ESPP participants is 85% of the lesser of the fairmarket value on either the first day or the last day of the applicable three-month offering period. Other ESPP information for the yearsended December 31, 2011, 2010, and 2009 is noted in the following table (dollars in thousands):
2011 2010 2009
Number of ESPP shares issued 42,443 56,279 102,081Amount of proceeds received from employees $1,288 $1,207 $1,233Share-based compensation expense $352 $332 $385
80
Copyright © 2013 www.secdatabase.com. All Rights Reserved.Please Consider the Environment Before Printing This Document

Table of Contents14. Significant Customers and Concentration of Credit Risk
Arbitron is a leading media and marketing information services firm primarily serving radio, advertisers, advertising agencies,cable and broadcast television, retailers, out-of-home media, online media, mobile media, telecommunications providers, and printmedia. The Company�s quantitative radio ratings services and related software accounted for approximately 88 percent of its totalrevenue in each of the years ended December 31, 2011, 2010, and 2009.
The Company had one customer that individually represented approximately 19%, 20%, and 19% of its annual revenue for theyears ended December 31, 2011, 2010, and 2009, respectively. The Company had two customers that individually representedapproximately 23% and 11% of the Company�s total accounts receivable as of December 31, 2011, and two customers that individuallyrepresented approximately 24% and 11% of the Company�s total accounts receivable as of December 31, 2010. The Company hashistorically experienced a high level of contract renewals.
15. Financial Instruments
The management of the Company believes that the fair market value of the TRA investment approximates the carrying value of$1.7 million and $5.2 million as of December 31, 2011, and 2010, respectively. The Company accounts for its $1.7 million investmentin TRA�s preferred stock using the cost method of accounting. TRA is closely held and there is not an efficient market in which buyersand sellers determine the fair value of these shares. The Company periodically assesses the fair value of its investment in TRA throughcomparative analysis and analysis of TRA�s actual and projected financial results. During the fourth quarter ended December 31, 2011,the Company determined that the fair value of its investment in TRA fell below its carrying value and the Company recorded a $3.5million impairment charge.
Fair values of accounts receivable and accounts payable approximate carrying values due to their short-term nature. Due to thefloating rate nature of the Company�s revolving obligation under its Credit Facility, the fair value of $53.0 million in outstandingborrowings as of December 31, 2010, approximated its carrying amount. There were no outstanding borrowings as of December 31,2011 under the Company�s Credit Facility.
16. Enterprise-Wide Information
The following table sets forth the revenue for each group of services provided to our external customers for the years endedDecember 31, 2011, 2010, and 2009 (in thousands):
2011 2010 2009
Radio audience ratings services $340,479 $317,606 $307,217Local market consumer information services 35,173 35,187 34,991Software applications 35,676 34,138 33,809All other services 10,982 8,448 8,935Total revenue $422,310 $395,379 $384,952
The following table sets forth geographic information for the years ended December 31, 2011, 2010, and 2009 (in thousands):
United States International(1) Total
2011Revenues $415,869 $ 6,441 $422,3102010Revenues $390,424 $ 4,955 $395,3792009Revenues $379,055 $ 5,897 $384,952
(1) The revenues of the individual countries comprising these amounts are not significant.
Copyright © 2013 www.secdatabase.com. All Rights Reserved.Please Consider the Environment Before Printing This Document

81
Copyright © 2013 www.secdatabase.com. All Rights Reserved.Please Consider the Environment Before Printing This Document

Table of Contents17. Quarterly Information (Unaudited) (dollars in thousands, except per share data):
Three Months Ended
March 31 June 30 September 30 December 31
2011Revenue $100,869 $95,737 $ 105,563 $120,141Gross profit 55,190 34,712 56,175 55,852Net income 16,247 7,584 15,351 14,109Net income per weighted average common share
Basic $0.60 $0.28 $ 0.56 $0.52Diluted $0.59 $0.27 $ 0.55 $0.51
Dividends per common share $0.10 $0.10 $ 0.10 $0.10
2010Revenue $95,896 $88,339 $ 99,470 $111,674Gross profit 52,743 28,835 49,086 49,386Net income 13,748 3,799 11,328 15,603Net income per weighted average common share
Basic $0.52 $0.14 $ 0.42 $0.58Diluted $0.51 $0.14 $ 0.42 $0.57
Dividends per common share $0.10 $0.10 $ 0.10 $0.10
Per share data are computed independently for each of the quarters presented. Therefore, the sum of the quarterly net income pershare will not necessarily equal the total for the year. Per share data may not total due to rounding.
82
Copyright © 2013 www.secdatabase.com. All Rights Reserved.Please Consider the Environment Before Printing This Document

Table of ContentsArbitron Inc.
Consolidated Schedule of Valuation and Qualifying AccountsFor the Years Ended December 31, 2011, 2010, and 2009
(In thousands)
2011 2010 2009
Allowance for doubtful trade accounts receivable:Balance at beginning of year $4,708 $4,708 $2,598Additions charged to expenses 2,234 1,375 2,723Write-offs net of recoveries (2,327) (1,375) (613 )
Balance at end of year $4,615 $4,708 $4,708
Deferred tax asset valuation allowance:Balance at beginning of year $163 $332 $332Addition charged to expenses 1,099 � �
Deferred tax assets utilized � (169 ) �
Balance at end of year $1,262 $163 $332
83
Copyright © 2013 www.secdatabase.com. All Rights Reserved.Please Consider the Environment Before Printing This Document
Table of ContentsITEM 9. CHANGES IN AND DISAGREEMENTS WITH ACCOUNTANTS ON ACCOUNTING AND FINANCIAL
DISCLOSURE
There have been no changes in, or disagreements with, accountants on accounting and financial disclosure.
ITEM 9A. CONTROLS AND PROCEDURES
Evaluation of Disclosure Controls and Procedures
The Company�s management, with the participation of the Company�s chief executive officer and chief financial officer,evaluated the effectiveness of the Company�s disclosure controls and procedures as of December 31, 2011. The term �disclosurecontrols and procedures,� as defined in Rules 13a-15(e) and 15d-15(e) under the Securities Exchange Act of 1934, as amended(�Exchange Act�), means controls and other procedures of a company that are designed to ensure that information required to bedisclosed by a company in the reports that it files or submits under the Exchange Act is recorded, processed, summarized and reported,within the time periods specified in the Securities and Exchange Commission�s rules and forms. Disclosure controls and proceduresinclude, without limitation, controls and procedures designed to ensure that information required to be disclosed by a company in thereports that it files or submits under the Exchange Act is accumulated and communicated to the company�s management, including itsprincipal executive and principal financial officers, as appropriate to allow timely decisions regarding required disclosure. Managementrecognizes that any controls and procedures, no matter how well designed and operated, can provide only reasonable assurance ofachieving their objectives and management necessarily applies its judgment in evaluating the cost-benefit relationship of possiblecontrols and procedures. Based on the evaluation of the Company�s disclosure controls and procedures as of December 31, 2011, theCompany�s chief executive officer and chief financial officer concluded that, as of such date, the Company�s disclosure controls andprocedures were effective at the reasonable assurance level.
Management��s Report on Internal Control Over Financial Reporting
Arbitron�s management is responsible for establishing and maintaining adequate internal control over financial reporting (asdefined in Rule 13a-15(f) under the Exchange Act). Our management assessed the effectiveness of our internal control over financialreporting as of December 31, 2011. In making this assessment, our management used the criteria set forth by the Committee ofSponsoring Organizations of the Treadway Commission in �Internal Control-Integrated Framework.� Based upon that assessment, ourmanagement has concluded that, as of December 31, 2011, our internal control over financial reporting is effective based on thesecriteria.
The attestation report of KPMG LLP, our independent registered public accounting firm, on the effectiveness of our internalcontrol over financial reporting is set forth on page 52 of this Annual Report on Form 10-K, and is incorporated herein by reference.
Changes in Internal Control Over Financial Reporting
There were no changes in the Company�s internal control over financial reporting (as defined in Rules 13a-15(f) and 15d-15(f)under the Exchange Act) that occurred during the quarterly period ended December 31, 2011, that have materially affected, or arereasonably likely to materially affect, the Company�s internal control over financial reporting.
ITEM 9B. OTHER INFORMATION �� NONE
PART III
ITEM 10. DIRECTORS, EXECUTIVE OFFICERS AND CORPORATE GOVERNANCE
Information related to directors, nominees for directorships, and executive officers required by this Item is included in the sectionsentitled �Election of Directors� and �Executive Compensation and Other Information� of the definitive proxy statement for the AnnualStockholders Meeting to be held in 2012 (the �proxy statement�), which is incorporated herein by reference and will be filed with theSecurities and Exchange Commission not later than 120 days after the close of Arbitron�s fiscal year ended December 31, 2011.
Copyright © 2013 www.secdatabase.com. All Rights Reserved.Please Consider the Environment Before Printing This Document

84
Copyright © 2013 www.secdatabase.com. All Rights Reserved.Please Consider the Environment Before Printing This Document
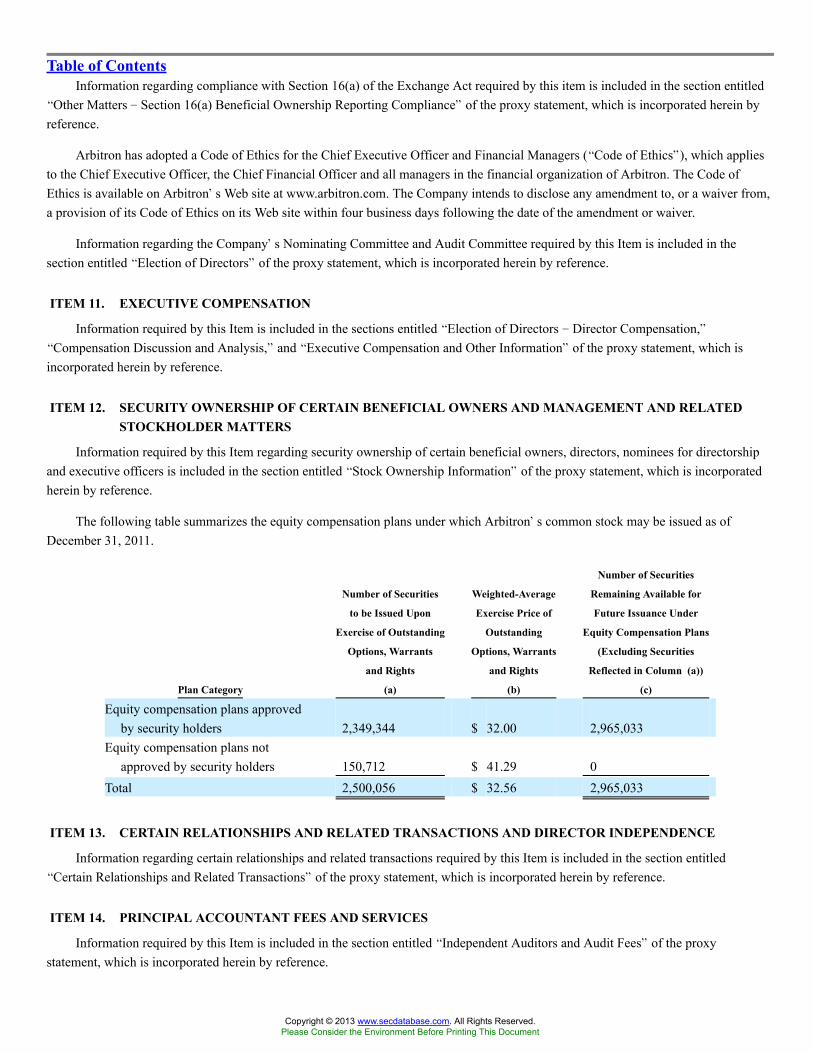
Table of ContentsInformation regarding compliance with Section 16(a) of the Exchange Act required by this item is included in the section entitled
�Other Matters � Section 16(a) Beneficial Ownership Reporting Compliance� of the proxy statement, which is incorporated herein byreference.
Arbitron has adopted a Code of Ethics for the Chief Executive Officer and Financial Managers (�Code of Ethics�), which appliesto the Chief Executive Officer, the Chief Financial Officer and all managers in the financial organization of Arbitron. The Code ofEthics is available on Arbitron�s Web site at www.arbitron.com. The Company intends to disclose any amendment to, or a waiver from,a provision of its Code of Ethics on its Web site within four business days following the date of the amendment or waiver.
Information regarding the Company�s Nominating Committee and Audit Committee required by this Item is included in thesection entitled �Election of Directors� of the proxy statement, which is incorporated herein by reference.
ITEM 11. EXECUTIVE COMPENSATION
Information required by this Item is included in the sections entitled �Election of Directors � Director Compensation,��Compensation Discussion and Analysis,� and �Executive Compensation and Other Information� of the proxy statement, which isincorporated herein by reference.
ITEM 12. SECURITY OWNERSHIP OF CERTAIN BENEFICIAL OWNERS AND MANAGEMENT AND RELATEDSTOCKHOLDER MATTERS
Information required by this Item regarding security ownership of certain beneficial owners, directors, nominees for directorshipand executive officers is included in the section entitled �Stock Ownership Information� of the proxy statement, which is incorporatedherein by reference.
The following table summarizes the equity compensation plans under which Arbitron�s common stock may be issued as ofDecember 31, 2011.
Plan Category
Number of Securities
to be Issued Upon
Exercise of Outstanding
Options, Warrants
and Rights
(a)
Weighted-Average
Exercise Price of
Outstanding
Options, Warrants
and Rights
(b)
Number of Securities
Remaining Available for
Future Issuance Under
Equity Compensation Plans
(Excluding Securities
Reflected in Column (a))
(c)
Equity compensation plans approvedby security holders 2,349,344 $ 32.00 2,965,033
Equity compensation plans notapproved by security holders 150,712 $ 41.29 0
Total 2,500,056 $ 32.56 2,965,033
ITEM 13. CERTAIN RELATIONSHIPS AND RELATED TRANSACTIONS AND DIRECTOR INDEPENDENCE
Information regarding certain relationships and related transactions required by this Item is included in the section entitled�Certain Relationships and Related Transactions� of the proxy statement, which is incorporated herein by reference.
ITEM 14. PRINCIPAL ACCOUNTANT FEES AND SERVICES
Information required by this Item is included in the section entitled �Independent Auditors and Audit Fees� of the proxystatement, which is incorporated herein by reference.
Copyright © 2013 www.secdatabase.com. All Rights Reserved.Please Consider the Environment Before Printing This Document

PART IV
ITEM 15. EXHIBITS AND FINANCIAL STATEMENT SCHEDULES
(a) Documents filed as part of this report
(1) Financial Statements: The following financial statements, together with the report thereon of independent auditors, areincluded in this Report:
� Independent Registered Public Accounting Firm Reports
85
Copyright © 2013 www.secdatabase.com. All Rights Reserved.Please Consider the Environment Before Printing This Document

Table of Contents� Consolidated Balance Sheets as of December 31, 2011 and 2010
� Consolidated Statements of Income for the Years Ended December 31, 2011, 2010, and 2009
� Consolidated Statements of Stockholders� Equity Deficit for the Years Ended December 31, 2011, 2010, and 2009
� Consolidated Statements of Cash Flows for the Years Ended December 31, 2011, 2010, and 2009
� Notes to Consolidated Financial Statements for the Years Ended December 31, 2011, 2010, and 2009
(2) Consolidated Financial Statement Schedule of Valuation and Qualifying Accounts
(3) Exhibits:
Incorporated by Reference
Exhibit
No. Exhibit Description Form
SEC File
No. Exhibit
Filing
Date Filed Herewith
3.1 Restated Certificate of Incorporation of Arbitron Inc. (formerly known asCeridian Corporation) S-8 33-54379 4.01 6/30/94
3.2 Certificate of Amendment of Restated Certificate of Incorporation ofArbitron Inc. (formerly known as Ceridian Corporation) 10-Q 1-1969 3 8/13/96
3.3 Certificate of Amendment of Restated Certificate of Incorporation ofArbitron Inc. (formerly known as Ceridian Corporation) 10-Q 1-1969 3.01 8/11/99
3.4 Certificate of Amendment of the Restated Certificate of Incorporation ofArbitron Inc. (formerly known as Ceridian Corporation) 10-K 1-1969 3.4 4/02/01
3.5 Third Amended and Restated Bylaws of Arbitron Inc., effective as ofNovember 16, 2011 8-K 1-1969 3.1 11/22/11
4.1 Specimen of Common Stock Certificate 10-K 1-1969 4.1 4/02/01
4.2 Rights Agreement, dated as of November 21, 2002, between Arbitron Inc.and The Bank of New York, as Rights Agent, which includes the form ofCertificate of Designation of the Series B Junior Participating PreferredStock as Exhibit A, the Summary of Rights to Purchase Series B JuniorParticipating Preferred Shares as Exhibit B and the Form of RightsCertificate as Exhibit C 8-K 1-1969 99.1 11/22/02
4.3 Amendment No. 1 to Rights Agreement, dated as of January 31, 2007,between Arbitron Inc. and The Bank of New York, as Rights Agent 10-K 1-1969 4.3 2/27/07
4.4 Amendment No. 2 to Rights Agreement, dated as of May 13, 2010, betweenArbitron Inc. and The Bank of New York Mellon, as Rights Agent 10-Q 1-1969 4.1 8/5/10
4.5 Amendment No. 3 to Rights Agreement, dated as of August 2, 2010,between Arbitron Inc. and The Bank of New York Mellon, as Rights Agent 10-Q 1-969 4.2 8/5/10
10.1 Arbitron Executive Investment Plan, effective as of January 1, 2001 10-K 1-1969 10.10 3/08/05
86
Copyright © 2013 www.secdatabase.com. All Rights Reserved.Please Consider the Environment Before Printing This Document

Table of Contents10.2 Form of Non-Qualified Stock Option Agreement 8-K 1-1969 10.1 2/23/05
10.3 Form of Non-Qualified Stock Option Agreement for Annual Non-EmployeeDirector Stock Option Grants 8-K 1-1969 10.2 2/23/05
10.4 Form of Non-Qualified Stock Option Agreement for Initial Non-EmployeeDirector Stock Option Grants 8-K 1-1969 10.3 2/23/05
10.5 Form of Nonqualified Stock Option Agreement for Non-Employee DirectorStock Options in lieu of Fees Grants 8-K 1-1969 10.4 2/23/05
10.6 Form of Deferred Stock Unit Agreement for Non-Employee Director Stock-for-Fees Deferred Stock Unit 8-K 1-1969 10.5 2/23/05
10.7 Amended and Restated Arbitron Inc. Director Deferred CompensationProcedures 10-K 1-1969 10.18 2/27/06
10.8 1999 Stock Incentive Plan, Amended as of May 15, 2007 10-Q 1-1969 10.2 8/03/07
10.9 1999 Stock Incentive Plan Form of Restricted Stock Agreement 8-K 1-1969 10.1 2/28/06
10.10 Form of Restricted Stock Unit Agreement Granted under the 1999 StockIncentive Plan 10-Q 1-1969 10.2 5/04/07
10.11 Form of CEO Restricted Stock Unit Grant Agreement Granted Under the1999 Stock Incentive Plan 10-Q 1-1969 10.3 5/04/07
10.12 Form of 2008 CEO Restricted Stock Unit Agreement Granted Under the 1999Stock Incentive Plan 10-Q 1-1969 10.2 5/06/08
10.13 Arbitron Benefit Equalization Plan, effective as of January 1, 2001 10-K 1-1969 10.20 3/08/05
10.14 Arbitron Inc. 2001 Broad Based Stock Incentive Plan 10-Q 1-1969 10.14 5/15/01
10.15 Form of Performance-Based Restricted Stock Unit Agreement Under the2001 Broad Based Stock Incentive Plan 10-Q 1-1969 10.3 8/5/10
10.16 Arbitron Inc. 2008 Equity Compensation Plan, amended and restated as ofMay 25, 2010 10-Q 1-1969 10.1 8/5/10
10.17 Form of Non-Statutory Stock Option Agreement Under the 2008 EquityCompensation Plan 10-K 1-1969 10.25 3/02/09
10.18 Form of 2008 Equity Compensation Plan Non-Statutory Stock OptionAgreement (Annual Director Grant) 10-Q 1-1969 10.1 5/07/09
10.19 Form of 2008 Equity Compensation Plan Director Deferred Stock UnitAgreement 10-Q 1-1969 10.2 5/07/09
10.20 Form of 2008 Equity Compensation Plan Non-Statutory Stock OptionAgreement (Director Grant in Lieu of Fees) 10-Q 1-1969 10.3 5/07/09
10.21 Form of 2008 Equity Compensation Plan Non-Statutory Stock OptionAgreement (Non-Executive Officers) 10-Q 1-1969 10.1 8/05/09
87
Copyright © 2013 www.secdatabase.com. All Rights Reserved.Please Consider the Environment Before Printing This Document
Table of Contents10.22 Form of 2008 Equity Compensation Plan Restricted Stock Unit Agreement
(Executive Officers) 10-Q 1-1969 10.2 8/05/09
10.23 Form of 2008 Equity Compensation Plan Restricted Stock Unit Agreement(Non-Executive Officers) 10-Q 1-1969 10.3 8/05/09
10.24 Form of 2008 Equity Compensation Plan Director Deferred Stock UnitAgreement � Initial Grant 10-K 1-1969 10.1 11/04/10
10.25 Form of 2008 Equity Compensation Plan Director Deferred Stock UnitAgreement � Annual Grant 10-K 1-1969 10.2 11/04/10
10.26 Arbitron Inc. 2008 Equity Compensation Plan Form of Non-Statutory StockOption Agreement 10-Q 1-1969 10.1 5/6/10
10.27 Arbitron Inc. 2008 Equity Compensation Plan Form of Performance-BasedRestricted Stock Unit Agreement 10-Q 1-1969 10.2 5/6/10
10.28 Arbitron Inc. 2008 Equity Compensation Plan Form of Performance-BasedDeferred Stock Unit Agreement for William T. Kerr 10-Q 1-1969 10.3 5/6/10
10.29 Arbitron Inc. Performance Cash Award Program 10-Q 1-1969 10.4 5/6/10
10.30 Arbitron Inc. Form of Performance Cash Award Letter 10-Q 1-1969 10.5 5/6/10
10.31 Form of Executive Retention Agreement 10-Q 1-1969 10.3 11/04/08
10.32 Arbitron Inc. Employee Stock Purchase Plan, amended and restated as ofMay 25, 2010 10-Q 1-1969 10.2 8/5/10
10.33 Credit Agreement dated as of November 21, 2011 by and among ArbitronInc., JPMorgan Chase Bank, N.A. as Administrative Agent, U.S. BankNational Association and Citibank, N.A. as Co-Syndication Agents, J.P.Morgan Securities LLC as Sole Bookrunner and Sole Lead Arranger, and theLenders party thereto 8-K 1-1969 10.1 11/22/11
10.34 Radio Station License Agreement to Receive and Use Arbitron PPM Dataand Estimates, effective May 18, 2006, by and between Arbitron Inc. andCBS Radio Inc. ** 10-Q 1-1969 10.2 8/03/06
10.35 Master Station License Agreement to Receive and Use Arbitron RadioAudience Estimates, effective May 18, 2006, by and between Arbitron Inc.and CBS Radio Inc. ** 10-Q 1-1969 10.3 8/03/06
10.36 Master Station License Agreement to Receive and Use Arbitron RadioAudience Estimates by and between Arbitron and Clear ChannelCommunications, Inc., dated December 8, 2010** 10-K 1-1969 10.38 2/24/11
10.37 Radio Station License Agreement to Receive and Use Arbitron PPM(TM)Data and Estimates by and between Arbitron and Clear ChannelCommunications, Inc., dated December 8, 2010** 10-K 1-1969 10.39 2/24/11
10.38 Form of Deferred Stock Unit Agreement for Non-Employee Directors (Non-Employee Directors Post-2005 Stock-for-Fees Deferred Stock Unit) 10-K 1-1969 10.19 2/27/06
88
Copyright © 2013 www.secdatabase.com. All Rights Reserved.Please Consider the Environment Before Printing This Document
Table of Contents10.39 Form of Waiver and Amendment of Executive Retention Agreement 10-Q 1-1969 10.4 8/05/09
10.40 Executive Employment Agreement, effective as of February 11, 2010, by andbetween Arbitron Inc. and William T. Kerr 10-K 1-1969 10.43 3/01/10
10.41 CEO Non-Statutory Stock-Option Agreement, entered into and effective as ofFebruary 11, 20010, by and between Arbitron Inc. and William T. Kerr 10-K 1-1969 10.44 3/01/10
10.42 CEO Deferred Stock Unit Agreement � Initial Grant, entered into andeffective as of February 11, 2010, by and between Arbitron Inc. and WilliamT. Kerr 10-K 1-1969 10.45 3/01/10
10.43 Amended and Restated Executive Employment Agreement, effective as ofFebruary 8, 2011, by and between Arbitron Inc. and William T. Kerr 10-K 1-1969 10.48 2/24/11
10.44 Offer Letter, effective as of February 2, 2011, by and between Arbitron Inc.and Richard J. Surratt 10-K 1-1969 10.49 2/24/11
10.45 Offer Letter, effective as of October 20, 2010, by and between Arbitron Inc.and Gregg Lindner 10-K 1-1969 10.50 2/24/11
10.46 Form of 2008 Equity Compensation Plan Restricted Stock Unit Agreement(Executive and Non-Executive Officers) 10-K 1-1969 10.52 2/24/11
10.47 Updated Form of Executive Retention Agreement 10-K 1-1969 10.53 2/24/11
10.48 Form of 2008 Equity Compensation Plan Non-Statutory Stock OptionAgreement (Executive and Non-Executive Officers) 10-Q 1-1969 10.1 11/3/11
10.49 Form of 2008 Equity Compensation Plan Non-Statutory Stock OptionAgreement (Executive and Non-Executive Officers � 2012) *
10.50 Form of 2008 Equity Compensation Plan Restricted Stock Unit Agreement(Executive and Non-Executive Officers - 2012) *
10.51 Form of 2008 Equity Compensation Plan Performance-Based RestrictedStock Unit Agreement (Executive and Non-Executive Officers - 2012) *
10.52 Amended and Restated Schedule of Non-Employee Director Compensation *
10.53 Form of 2008 Equity Compensation Plan Director Stock Unit Agreement(2012) *
21 Subsidiaries of Arbitron Inc. *
23 Consent of Independent Registered Public Accounting Firm *
24 Power of Attorney *
31.1 Certification of Chief Executive Officer pursuant to Securities Exchange Actof 1934 Rule 13a � 14(a) *
89
Copyright © 2013 www.secdatabase.com. All Rights Reserved.Please Consider the Environment Before Printing This Document

Table of Contents31.2 Certification of Chief Financial Officer pursuant to Securities Exchange Act
of 1934 Rule 13a � 14(a) *
32.1 Certifications of Chief Executive Officer and Chief Financial Officer pursuantto 18 U.S.C. Section 1350, as adopted pursuant to Section 906 of the SarbanesOxley Act of 2002 *
101*** The following materials from the Company�s Annual Report on Form 10-Kfor the fiscal year ended December 31, 2011, formatted in XBRL (eXtensibleBusiness Reporting Language):
(i) Consolidated Balance Sheets as of December 31, 2011 and 2010;
(ii) Consolidated Statements of Income for the Years Ended December 31,2011, 2010 and 2009;
(iii) Consolidated Statements of Stockholders� Equity (Deficit) for the YearsEnded December 31, 2011, 2010 and 2009;
(iv) Consolidated Statements of Comprehensive Income for the Years EndedDecember 31, 2011, 2010 and 2009;
(v) Consolidated Statements of Cash Flows for the Years Ended December 31,2011, 2010 and 2009;
(vi) Notes to Consolidated Financial Statements, tagged as block of text; and
(vii) Consolidated Schedule of Valuation and Qualifying Accounts *
* Filed or furnished herewith.** A request for confidential treatment has been submitted with respect to this exhibit. The copy filed as an exhibit omits the
information subject to the request for confidential treatment.*** Pursuant to Rule 406T of Regulation S-T, the Interactive Data Files on Exhibit 101 hereto are deemed not filed or part of a
registration statement or prospectus for purposes of Sections 11 or 12 of the Securities Act of 1933, as amended, are deemed notfiled for purposes of Section 18 of the Securities Exchange Act of 1934, as amended, and otherwise are not subject to liabilityunder those sections.
90
Copyright © 2013 www.secdatabase.com. All Rights Reserved.Please Consider the Environment Before Printing This Document

Table of ContentsSIGNATURES
Pursuant to the requirements of Section 13 or 15(d) of the Securities Exchange Act of 1934, we have duly caused this report to besigned on behalf by the undersigned, thereunto duly authorized.
ARBITRON INC.
By: /s/ William T. KerrWilliam T. KerrChief Executive Officer and President
Date: February 24, 2012
Pursuant to the requirements of the Securities Exchange Act of 1934, this Report has been signed below by the following personson behalf of the Company in the capacities and on the dates indicated.
Signature Title Date
/s/ William T. KerrWilliam T. Kerr
Chief Executive Officer, President and Director(Principal Executive Officer)
February 24, 2012
/s/ Richard J. SurrattRichard J. Surratt
Executive Vice President and Chief Financial Officer(Principal Financial and Principal Accounting Officer)
February 24, 2012
Director*Shellye L. Archambeau
*David W. Devonshire
Director
*John A. Dimling
Director
*Erica Farber
Director
*Ronald G. Garriques
Director
*Philip Guarascio
Chairman and Director
*Larry E. Kittelberger
Director
*Luis B. Nogales
Director
*Richard A. Post
Director
Copyright © 2013 www.secdatabase.com. All Rights Reserved.Please Consider the Environment Before Printing This Document

* By: /s/ Timothy T. SmithTimothy T. SmithAttorney-in-Fact
February 24, 2012
91
Copyright © 2013 www.secdatabase.com. All Rights Reserved.Please Consider the Environment Before Printing This Document

Exhibit 10.49
ARBITRON INC. 2008 EQUITY COMPENSATION PLANNON-STATUTORY STOCK OPTION AGREEMENT
THIS AGREEMENT evidences the grant by Arbitron Inc. (the �Company�) on , 201 (the �Date of Grant�) to(the �Optionee�) of an option to purchase shares of the Company�s common stock.
A. The Company has adopted the Arbitron Inc. 2008 Equity Compensation Plan (as may be amended or supplemented, the�Plan�) authorizing the Board of Directors of the Company, or a committee as provided for in the Plan (the Board or such a committeeto be referred to as the �Committee�), to grant stock options to employees of the Company and its Subsidiaries (as defined in the Plan).
B. The Company desires to give the Optionee an inducement to acquire a proprietary interest in the Company and an addedincentive to advance the interests of the Company by granting to the Optionee an option to purchase shares of common stock of theCompany pursuant to the Plan.
Accordingly, the parties agree as follows:
1. Grant of Option.
The Company has granted to the Optionee the right, privilege and option (the �Option�) to purchase [Shares] shares (the �OptionShares�) of the Company�s common stock, $0.50 par value (the �Common Stock�), according to the terms and subject to theconditions hereinafter set forth and as set forth in the Plan. The Option is not intended to be an incentive stock option within themeaning of Section 422 of the Internal Revenue Code of 1986, as amended (the �Code�).
2. Option Exercise Price.
The per share price to be paid by Optionee in the event of an exercise of the Option will be $ .
3. Duration of Option and Time of Exercise.
3.1 Initial Period of Exercisability. Except as provided in Sections 3.2 and 3.3 hereof, the Option shall become exercisable withrespect to one-third of the Option Shares on each of the first, second and third anniversaries of the Date of Grant, assuming theOptionee�s continued employment. The foregoing rights to exercise the Option will be cumulative with respect to the Option Sharesbecoming exercisable on each such date, but in no event will the Option be exercisable after and, subject to the following sentences, theOption will become void and expire as to all unexercised Option Shares at, 5:00 p.m. (Eastern Standard Time) on the tenth anniversaryof the Date of Grant (the �Time of Option Termination�). Except as otherwise provided by the Administrator or as otherwise directedby the Optionee in writing to the Company, if the Option is (a) outstanding on the business day on which falls the Time of OptionTermination [or, if such date is not a business day, on the last business day prior to such date] (such date, the �Automatic ExerciseDate�) and, (b) has an exercise price per Option Share that is less than the Fair Market Value of a share of Common Stock as of theAutomatic Exercise Date, the Option shall automatically and without further action by the Optionee or the Company be exercised
Copyright © 2013 www.secdatabase.com. All Rights Reserved.Please Consider the Environment Before Printing This Document

on the Automatic Exercise Date. In the event of automatic exercise, payment of the exercise price of the Option shall be made by theCompany retaining shares with a Fair Market Value on the Automatic Exercise Date equal to the exercise price, and the Company shallsimilarly retain shares with a Fair Market Value on the Automatic Exercise Date equal to the amount of the minimum tax withholdingobligation associated with such exercise in accordance with Section 10(e) of the Plan. For the avoidance of doubt, if the Option has anexercise price per share that is equal to or greater than the Fair Market Value per Option Share of Common Stock on the AutomaticExercise Date shall not be automatically exercised pursuant to this Section 3.1.
3.2 Termination of Employment.
(a) Termination Due to Death or Disability. In the event the Optionee�s employment with the Company and all Subsidiariesis terminated by reason of death or Disability, the Option will become immediately exercisable in full and remain exercisable untilthe Time of Option Termination.
(b) Termination by Optionee as Retirement. In the event the Optionee�s employment with the Company and all Subsidiariesends through the Optionee�s Retirement, the Option will continue to vest as though the Optionee remained employed and willremain exercisable as of and after such vesting until the Time of Option Termination.
(c) Termination by the Company without Cause or through Voluntary Resignation other than on Retirement. In the event thatthe Optionee�s employment with the Company and all Subsidiaries ends by the Optionee�s termination without Cause or throughhis or her resignation other than on a Retirement, any unvested portions of the Option will expire on employment termination andthe vested portions of the Option will remain exercisable as of and after such vesting until the earlier of the 90th day followingsuch resignation or the Time of Option Termination.
(d) Termination by the Company for Cause. In the event that the Optionee�s employment with the Company and allSubsidiaries is terminated by the Company for Cause, any vested or unvested portions of the Option will immediately expire andbe forfeited.
(e) 280G; Release Requirement. Any acceleration, vesting, or extension under this Section 3.2 is subject, as applicable, to the280G provisions in Exhibit I hereto and to compliance with any requirement that otherwise applies to the Optionee to provide arelease of claims.
3.3 Change in Control.
(a) Impact of Change in Control.
(i) If a Change in Control Event of the Company occurs, the Committee, in its sole discretion and without the consent ofthe Optionee, may determine that the Optionee will receive, with respect to some or all of the Option Shares, as of theeffective date of any such Change in Control Event of the Company, cash in an amount equal to the excess of the Fair MarketValue (as defined in the Plan) of such Option Shares as determined by taking into account such Change in Control Event ofthe Company over the option exercise price per share of the Option.
2
Copyright © 2013 www.secdatabase.com. All Rights Reserved.Please Consider the Environment Before Printing This Document

(ii) If a Change in Control Event occurs and the Option is not assumed or replaced, it shall immediately become fullyexercisable. If the Option is assumed or replaced, exercisability fully accelerates if, within 24 months following the closingof the Change in Control Event, the Optionee�s employment is terminated without Cause or, if his or her employment orother individual agreement provides for resignation for �Good Reason,� upon a resignation for Good Reason during the sameperiod.
(b) Authority to Modify Change in Control Provisions. Prior to a Change in Control Event, the Optionee will have no rightsunder this Section 3.3, and the Committee will have the authority, in its sole discretion, to rescind, modify, or amend thisSection 3.3 without the consent of the Optionee.
4. Manner of Option Exercise.
4.1 Notice. This Option may be exercised by the Optionee in whole or in part from time to time, subject to the conditionscontained in the Plan and in this Agreement, by delivery, in person, by facsimile or electronic transmission or through the mail, to theCompany at its principal executive office in Columbia, Maryland (Attention: Corporate Secretary), of a written notice of exercise. Suchnotice must be in a form satisfactory to the Committee, must identify the Option, must specify the number of Option Shares with respectto which the Option is being exercised, and must be signed by the person or persons so exercising the Option. In the event that theOption is being exercised, as provided by the Plan and Section 3.2 of this Agreement, by any person or persons other than the Optionee,the notice must be accompanied by appropriate proof of right of such person or persons to exercise the Option. If the Optionee retainsthe Option Shares purchased, as soon as practicable after the effective exercise of the Option, the Optionee will be recorded on the stocktransfer books of the Company as the owner of the Option Shares purchased.
4.2 Payment. At the time of exercise of the Option, the Optionee must pay the total exercise price of the Option Shares to bepurchased entirely in cash (including a check, bank draft or money order, payable to the order of the Company), though a cashlessexercise as described in Section 5(f)(2) of the Plan, by such other method approved by the Committee, or by a combination of suchmethods.
5. Rights and Restrictions of Optionee; Transferability.
5.1 Employment. Nothing in this Agreement will interfere with or limit in any way the right of the Company or any Subsidiary toterminate the employment of the Optionee at any time, nor confer upon the Optionee any right to continue in the employ of theCompany or any Subsidiary at any particular position or rate of pay or for any particular period of time.
5.2 Rights as a Stockholder; Effect on Running the Business. The Optionee will have no rights as a stockholder unless and until allconditions to the effective exercise of the Option (including, without limitation, the conditions set forth in Sections 4 and 6 of thisAgreement) have been satisfied and the Optionee has become the holder of record of such shares. No adjustment will be made fordividends or distributions with respect to the Option Shares as to which there is a record date preceding the date the Optionee becomesthe holder of record of such Option Shares, except as may otherwise be provided in the Plan or determined by the Committee in its solediscretion. The Optionee understands and agrees that the existence of an Option will not affect in any way the right or power of theCompany or its stockholders to make or authorize any adjustments, recapitalizations, reorganizations, or other changes in theCompany�s capital structure or its business, or any merger or consolidation of the Company, or any
3
Copyright © 2013 www.secdatabase.com. All Rights Reserved.Please Consider the Environment Before Printing This Document

issuance of bonds, debentures, preferred or other stock, with preference ahead of or convertible into, or otherwise affecting theCompany�s common stock or the rights thereof, or the dissolution or liquidation of the Company, or any sale or transfer of all or anypart of its assets or business, or any other corporate act or proceeding, whether or not of a similar character to those described above.
5.3 Restrictions on Transfer. Except pursuant to testamentary will or the laws of descent and distribution or as otherwise expresslypermitted by the Plan, no right or interest of the Optionee in the Option prior to exercise may be assigned or transferred, or subjected toany lien, during the lifetime of the Optionee, either voluntarily or involuntarily, directly or indirectly, by operation of law or otherwise.The Optionee will, however, subject to applicable laws be entitled to designate a beneficiary to receive the Option upon suchOptionee�s death in the manner provided by the Plan, and, in the event of the Optionee�s death, exercise of the Option (to the extentpermitted pursuant to Section 3.2(a) of this Agreement) may be made by the Optionee�s designated beneficiary.
5.4 Restrictions Regarding Employment.
(a) The Optionee agrees that he or she will not take any Adverse Actions (as defined below) against the Company or anySubsidiary at any time during the period that the Option is or may yet become exercisable in whole or in part or at any time beforeone year following the Optionee�s cessation of employment with the Company or any Subsidiary, whichever is later (the�Restricted Period�). The Optionee acknowledges that damages that may arise from a breach of this Section 5.4 may beimpossible to ascertain or prove with certainty. Notwithstanding anything in this Agreement or the Plan to the contrary, in theevent that the Company determines in its sole discretion that the Optionee has taken Adverse Actions against the Company or anySubsidiary at any time during the Restricted Period, in addition to other legal remedies that may be available, (i) the Company willbe entitled to an immediate injunction from a court of competent jurisdiction to end such Adverse Action, without further proof ofdamage, (ii) the Committee will have the authority in its sole discretion to terminate immediately all rights of the Optionee underthe Plan and this Agreement without notice of any kind, and (iii) the Committee will have the authority in its sole discretion torescind the exercise of all or any portion of the Option to the extent that such exercise occurred within six months prior to the datethe Optionee first commences any such Adverse Actions and require the Optionee to disgorge any profits (however defined by theCommittee) realized by the Optionee relating to such exercised portion of the Option or any Option Shares issued or issuable uponsuch exercise. Such disgorged profits paid to the Company must be made in cash (including check, bank draft or money order) or,with the Committee�s consent, shares of Common Stock with a Fair Market Value on the date of payment equal to the amount ofsuch payment. The Company will be entitled to withhold and deduct from future wages of the Optionee (or from other amountsthat may be due and owing to the Optionee from the Company or a Subsidiary) or make other arrangements for the collection ofall amounts necessary to satisfy such payment obligation.
(b) For purposes of this Agreement, an �Adverse Action� will mean any of the following: (i) engaging in any commercialactivity in competition with any part of the business of the Company or any Subsidiary as conducted during the Restricted Periodfor which the Optionee has or had access to trade secrets and/or confidential information; (ii) diverting or attempting to divert fromthe Company or any Subsidiary any business of any kind, including, without limitation, interference with any businessrelationships with suppliers, customers, licensees, licensors, clients or contractors; (iii) participating in the ownership, operation orcontrol of, or being employed by, or connected in any manner with any person or entity that solicits, offers or provides anyservices or products similar to those which the Company or any Subsidiary offers to its customers or prospective customers,(iv) making, or causing or attempting to cause any other person or entity to make, any statement, either written or oral, or conveyany information about the Company or any Subsidiary that is disparaging or that in any way reflects negatively on the Company orany
4
Copyright © 2013 www.secdatabase.com. All Rights Reserved.Please Consider the Environment Before Printing This Document
Subsidiary; or (v) engaging in any other activity that is hostile, contrary or harmful to the interests of the Company or anySubsidiary, including, without limitation, influencing or advising any person who is employed by or in the service of the Companyor any Subsidiary to leave such employment or service to compete with the Company or any Subsidiary or to enter into theemployment or service of any actual or prospective competitor of the Company or any Subsidiary, influencing or advising anycompetitor of the Company or any Subsidiary to employ to otherwise engage the services of any person who is employed by or inthe service of the Company or any Subsidiary, or improperly disclosing or otherwise misusing any trade secrets or confidentialinformation regarding the Company or any Subsidiary.
(c) Should any provision of this Section 5.4 of the Agreement be held invalid or illegal, such illegality shall not invalidate thewhole of this Section 5.4 of the Agreement, but, rather, the Agreement shall be construed as if it did not contain the illegal part ornarrowed to permit its enforcement, and the rights and obligations of the parties shall be construed and enforced accordingly. Infurtherance of and not in limitation of the foregoing, the Optionee expressly agrees that should the duration of or businessactivities covered by, any provision of this Agreement be in excess of that which is valid or enforceable under applicable law, thensuch provision shall be construed to cover only that duration, extent or activities that may validly or enforceably be covered. TheOptionee acknowledges the uncertainty of the law in this respect and expressly stipulates that this Agreement shall be construed ina manner that renders its provisions valid and enforceable to the maximum extent (not exceeding its express terms) possible underapplicable law. This Section 5.4 of the Agreement does not replace and is in addition to any other agreements the Optionee mayhave with the Company or any of its Subsidiaries on the matters addressed herein.
6. Securities Law and Other Restrictions.
Notwithstanding any other provision of the Plan or this Agreement, the Company will not be required to issue, and the Optioneemay not sell, assign, transfer or otherwise dispose of, any Option Shares, unless (a) there is in effect with respect to the Option Shares aregistration statement under the Securities Act of 1933, as amended, and any applicable state or foreign securities laws or an exemptionfrom such registration, and (b) there has been obtained any other consent, approval or permit from any other regulatory body which theCommittee, in its sole discretion, deems necessary or advisable. The Company may condition such issuance, sale or transfer upon thereceipt of any representations or agreements from the parties involved, and the placement of any legends on certificates representingOption Shares, as may be deemed necessary or advisable by the Company in order to comply with such securities law or otherrestrictions.
7. Withholding Taxes.
The Company is entitled to (a) withhold and deduct from future wages of the Optionee (or from other amounts that may bedue and owing to the Optionee from the Company), or make other arrangements for the collection of, all legally required amountsnecessary to satisfy any federal or provincial withholding tax requirements attributable to the Option, or (b) require the Optioneepromptly to remit the amount of such withholding to the Company before acting on the Optionee�s notice of exercise of the Option. Inthe event that the Company is unable to withhold such amounts, for whatever
5
Copyright © 2013 www.secdatabase.com. All Rights Reserved.Please Consider the Environment Before Printing This Document

reason, the Optionee agrees to pay to the Company an amount equal to the amount the Company would otherwise be required towithhold under federal, state or local law.
8. Certain Definitions. For purposes of this Agreement, the following additional definitions will apply:
(a) �Cause� will have the meaning set forth in any employment or other agreement or policy applicable to the Optionee or, ifno such agreement or policy exists, will mean (i) dishonesty, fraud, misrepresentation, theft, embezzlement or injury or attemptedinjury, in each case related to the Company or any Subsidiary, (ii) any unlawful or criminal activity of a serious nature, (iii) anybreach of duty, habitual neglect of duty or unreasonable job performance, or (iv) any material breach of any employment, service,confidentiality or noncompete agreement entered into with the Company or any Subsidiary.
(b) �Change in Control Event� will have the meaning set forth in the Plan plus such other event or transaction as the Boardshall determine constitutes a Change in Control, or such other meaning as may be adopted by the Committee from time to time inits sole discretion.
(c) �Disability� means the disability of the Optionee such as would entitle the Optionee to receive disability income benefitspursuant to the long-term disability plan of the Company or Subsidiary then covering the Optionee or, if no such plan exists or isapplicable to the Optionee, the permanent and total disability of the Optionee within the meaning of Section 22(e)(3) of the Code.
(d) �Retirement� means the termination (other than for Cause or by reason of death or Disability) of an Optionee�semployment or other service on or after the date on which the Optionee has attained the age of 55 and has completed 10 years ofcontinuous service to the Company or any Subsidiary (such period of service to be determined in accordance with the retirement/pension plan or practice of the Company or Subsidiary then covering the Optionee, provided that if the Optionee is not covered byany such plan or practice, the Optionee will be deemed to be covered by the Company�s plan or practice for purposes of thisdetermination).
9. Subject to Plan.
The Option and the Option Shares granted and issued pursuant to this Agreement have been granted and issued under, and aresubject to the terms of, the Plan. The terms of the Plan are incorporated by reference in this Agreement in their entirety, and theOptionee, by execution of this Agreement, acknowledges having received a copy of the Plan. The provisions of this Agreement will beinterpreted in a manner consistent with the Plan, and any ambiguities in this Agreement will be interpreted by reference to the Plan. Inthe event that any provision of this Agreement is inconsistent with the terms of the Plan, the terms of the Plan will prevail.
10. Miscellaneous.
10.1 Binding Effect. This Agreement will be binding upon the heirs, executors, administrators and successors of the parties to thisAgreement.
10.2 Governing Law. This Agreement and all rights and obligations under this Agreement will be construed in accordance with thePlan and governed by the laws of the State of Delaware, without regard to conflicts or choice of law rule or principle that mightotherwise refer construction or interpretation of this Agreement to the substantive laws of another jurisdiction.
6
Copyright © 2013 www.secdatabase.com. All Rights Reserved.Please Consider the Environment Before Printing This Document

10.3 Entire Agreement. This Agreement and the Plan set forth the entire agreement and understanding of the parties to thisAgreement with respect to the grant and exercise of the Option and the administration of the Plan and supersede all prior agreements,arrangements, plans and understandings relating to the grant and exercise of the Option and the administration of the Plan.
10.4 Amendment and Waiver. Other than as provided in the Plan, this Agreement may be amended, waived, modified or canceledonly by a written instrument executed by the parties to this Agreement or, in the case of a waiver, by the party waiving compliance.
IN WITNESS WHEREOF, the Company has caused this option to be executed under its corporate seal by its duly authorizedofficer. This option shall take effect as a sealed instrument.
ARBITRON INC.
By:
Name:Title:
7
Copyright © 2013 www.secdatabase.com. All Rights Reserved.Please Consider the Environment Before Printing This Document

OPTIONEE��S ACCEPTANCE
The undersigned hereby accepts the foregoing option and agrees to the terms and conditions thereof. The undersigned herebyacknowledges receipt of a copy of the Plan.
OPTIONEE:
8
Copyright © 2013 www.secdatabase.com. All Rights Reserved.Please Consider the Environment Before Printing This Document

Exhibit 10.50
Grant No.
¨ Participant�s Copy
¨ Company�s Copy
ARBITRON INC.2008 EQUITY COMPENSATION PLAN
RESTRICTED STOCK UNIT AGREEMENT
To :
Arbitron Inc. (the �Company�) has granted you (the �Grant�) restricted stock units (�RSUs�) as set forth on Exhibit A to thisAgreement (the �RSUs�) under its 2008 Equity Compensation Plan (the �Plan�), subject to the Vesting Schedule specified onExhibit A.
The Grant is subject in all respects to the applicable provisions of the Plan. This Agreement does not cover all of the rules thatapply to the Grant under the Plan, and the Plan defines any capitalized terms in this Agreement that this Agreement does not define.
In addition to the Plan�s terms and restrictions, the following terms and restrictions apply:
Vesting Schedule The Grant becomes nonforfeitable (�Vested�) as to some or all of the RSUs only as provided on Exhibit A.
Distribution Dates You will receive a distribution of shares (the �Shares�) of Company common stock (�Common Stock�)equivalent to your Vested RSUs as soon as practicable following the dates on which you become Vested (the�Distribution Dates�) as provided in Exhibit A, subject to any overriding provisions in the Plan.
Limited Status You understand and agree that the Company will not consider you a shareholder for any purpose with respectto the Shares, unless and until the Shares have been issued to you on the Distribution Date(s). You will,however, receive dividend equivalents (�Dividend Equivalent Rights�) with respect to the Vested RSUs,measured using the Shares they represent, with the amounts convertible into full or fractional additionalVested RSUs based on dividing the Dividend Equivalent Rights by the Fair Market Value (as defined in thePlan) as of the date of dividend distribution and holding the resulting additional Vested RSUs for distributionas provided for the RSUs with respect to which they were issued.
Voting RSUs cannot be voted. You may not vote the Shares unless and until the Shares are distributed to you.
Transfer Restrictions You may not sell, assign, pledge, encumber, or otherwise transfer any interest (�Transfer�) in the Sharesuntil the Shares are distributed to you.
Copyright © 2013 www.secdatabase.com. All Rights Reserved.Please Consider the Environment Before Printing This Document

and Forfeiture Any attempted Transfer that precedes the Distribution Date for such Shares is invalid.
Unless the Administrator determines otherwise at any time or Exhibit A provides otherwise, if your servicewith the Company terminates for any reason before all of your RSUs are Vested, then you will forfeit suchunvested RSUs (and the Shares to which they relate) to the extent that such RSUs do not otherwise vest as aresult of the termination. The forfeited RSUs will then immediately revert to the Company. You will receiveno payment for RSUs that you forfeit.
Your receipt of and retaining the RSUs and any Common Stock issued thereunder are also subject to yourcompliance with the restrictive covenants set out in Exhibit B to this award.
Additional Conditionsto Receipt
The Company may postpone issuing and delivering any Shares for so long as the Company determines to beadvisable to satisfy the following:
its completing or amending any securities registration or qualification of the Shares or its or yoursatisfying any exemption from registration under any Federal or state law, rule, or regulation;
its receiving proof it considers satisfactory that a person or entity seeking to receive the Shares afteryour death is entitled to do so;
your complying with any requests for representations under the Grant and the Plan; and
its or your complying with any federal, state, or local tax withholding obligations.
Taxes andWithholding
The RSUs provide tax deferral, meaning that they are not taxable to you until you actually receive Shares onor around each Distribution Date. You will then owe taxes at ordinary income tax rates as of eachDistribution Date at the Shares� value.
The Company is required to withhold (in cash from salary or other amounts owed you) the applicablepercentage of the value of the Shares on the Distribution Date, regardless of whether you sell them. If theCompany does not choose to do so, you agree to arrange for payment of the withholding taxes and/orconfirm that the Company is arranging for appropriate withholding.
Unless you determine to satisfy the tax withholding obligation by some other means approved by theCompany, the Company will, if permissible under applicable law, withhold from those Shares otherwiseissuable to you the whole number of Shares sufficient to satisfy the minimum applicable tax withholdingobligation. You acknowledge that the withheld Shares may not be sufficient to satisfy your minimum taxwithholding obligation. Accordingly, you agree to pay the Company as soon as
- 2 -
Copyright © 2013 www.secdatabase.com. All Rights Reserved.Please Consider the Environment Before Printing This Document
practicable, including through additional payroll withholding, any amount of the tax withholding obligationthat is not satisfied by the withholding of Shares described above.
AdditionalRepresentations fromYou
If you receive Shares at a time when the Company does not have a current registration statement (generallyon Form S-8) under the Act that covers issuances of Shares to you, you must comply with the followingbefore the Company will release the Shares to you. You must:
represent to the Company, in a manner satisfactory to the Company�s counsel, that you are acquiringthe Shares for your own account and not with a view to reselling or distributing the Shares; and
agree that you will not sell, transfer, or otherwise dispose of the Shares unless:
a registration statement under the Act is effective at the time of disposition with respect to theShares you propose to sell, transfer, or otherwise dispose of; or
the Company has received an opinion of counsel or other information and representations itconsiders satisfactory to the effect that, because of Rule 144 under the Act or otherwise, noregistration under the Act is required.
AdditionalRestrictions
You will not receive the Shares if issuing the Shares would violate any applicable federal or state securitieslaws or other laws or regulations. Any acceleration, vesting, or extension under this Grant is subject, asapplicable, to the 280G provisions in Exhibit C hereto and to compliance with any requirement thatotherwise applies to you to provide a release of claims.
No Effect onEmployment or OtherRelationship
Nothing in this Agreement restricts the Company�s rights or those of any of its affiliates to terminate youremployment or other relationship at any time, with or without cause. The termination of your relationship,whether by the Company or any of its affiliates or otherwise, and regardless of the reason for suchtermination, has the consequences provided for under the Plan and any applicable employment or severanceagreement or plan.
No Effect onRunning Business
You understand and agree that the existence of the RSU will not affect in any way the right or power of theCompany or its stockholders to make or authorize any adjustments, recapitalizations, reorganizations, orother changes in the Company�s capital structure or its business, or any merger or consolidation of theCompany, or any issuance of bonds, debentures, preferred or other stock, with preference ahead of orconvertible into, or otherwise affecting the Company�s common stock or the rights thereof, or thedissolution or liquidation of the Company, or any sale or transfer of all or any part of its assets or business, orany other corporate act or
- 3 -
Copyright © 2013 www.secdatabase.com. All Rights Reserved.Please Consider the Environment Before Printing This Document

proceeding, whether or not of a similar character to those described above.
Section 409A This Agreement is intended to comply with the requirements of Section 409A of the Internal Revenue Codeand must be construed consistently with that section. Notwithstanding anything in the Plan or thisAgreement to the contrary, if the Vested portion is increased in connection with your �separation fromservice� within the meaning of Section 409A, as determined by the Company), other than due to death, andif (x) you are then a �specified employee� within the meaning of Section 409A at the time of such separationfrom service (as determined by the Company, by which determination you agree you are bound) and (y) thepayment under such accelerated RSUs will result in the imposition of additional tax under Section 409A ifpaid to you within the six month period following your separation from service, then the payment under suchaccelerated RSUs will not be made until the earlier of (i) the date six months and one day following the dateof your separation from service or (ii) the 10th day after your date of death, and will be paid within 10 daysthereafter. Neither the Company nor you shall have the right to accelerate or defer the delivery of any suchpayments or benefits except to the extent specifically permitted or required by Section 409A. In any event,the Company makes no representations or warranty and shall have no liability to you or any other person, ifany provisions of or payments under this Agreement are determined to constitute deferred compensationsubject to Code Section 409A but not to satisfy the conditions of that section.
Unsecured Creditor This Agreement creates a contractual obligation on the part of the Company to make payment under theRSUs credited to your account at the time provided for in this Agreement. Neither you nor any other partyclaiming an interest in deferred compensation hereunder shall have any interest whatsoever in any specificassets of the Company. Your right to receive payments hereunder is that of an unsecured general creditor ofCompany.
Governing Law The laws of the State of Delaware will govern all matters relating to this Agreement, without regard to theprinciples of conflict of laws.
Notices Any notice you give to the Company must follow the procedures then in effect. If no other procedures apply,you must send your notice in writing by hand or by mail to the office of the Company�s Secretary. If mailed,you should address it to the Company�s Secretary at the Company�s then corporate headquarters, unless theCompany directs participants to send notices to another corporate department or to a third partyadministrator or specifies another method of transmitting notice. The Company and the Administrator willaddress any notices to you at your office or home address as reflected on the Company�s personnel or otherbusiness records. You and the Company may change the address for notice by like notice to the other, andthe Company can also change the address for notice by general announcements to participants.
- 4 -
Copyright © 2013 www.secdatabase.com. All Rights Reserved.Please Consider the Environment Before Printing This Document

Plan Governs Wherever a conflict may arise between the terms of this Agreement and the terms of the Plan, the terms ofthe Plan will control.
ARBITRON INC.
Date: By:
- 5 -
Copyright © 2013 www.secdatabase.com. All Rights Reserved.Please Consider the Environment Before Printing This Document

ACKNOWLEDGMENT
I acknowledge I received a copy of the Plan. I represent that I have read and am familiar with the Plan�s terms. I accept the Grantsubject to all of the terms and provisions of this Agreement and of the Plan under which the Grant is made, as the Plan may be amendedin accordance with its terms. I agree to accept as binding, conclusive, and final all decisions or interpretations of the Administratorconcerning any questions arising under the Plan with respect to the Grant.
Date:
Name:
NO ONE MAY SELL, TRANSFER, OR DISTRIBUTE THE SECURITIES COVERED BY THE GRANT WITHOUT AN EFFECTIVE
REGISTRATION STATEMENT RELATING THERETO OR AN OPINION OF COUNSEL SATISFACTORY TO THE COMPANY OR OTHER
INFORMATION AND REPRESENTATIONS SATISFACTORY TO THE COMPANY THAT SUCH REGISTRATION IS NOT REQUIRED.
- 6 -
Copyright © 2013 www.secdatabase.com. All Rights Reserved.Please Consider the Environment Before Printing This Document
Grant No.
Arbitron Inc.2008 Equity Compensation Plan
Restricted Stock Unit
Exhibit A
Recipient Information:
Name:
Signature: X
Grant Information:
RSUs: Date of Grant:
Vesting Schedule The Grant is Vested as to one-fourth of the RSUs on each of the next four one year anniversaries of the Dateof Grant (each a �Vesting Date�), assuming you remain a service provider to the Company through thosedates.
Grant Expiration Rules Except as otherwise provided in an employment, retention, or other individual agreement covering you, youwill forfeit any unvested portions of the Grant immediately when you cease to be employed by (or amember of the Board of) the Company for reasons other than death, disability, or your Retirement. If youremployment ends for death, Disability, or your Retirement, you will become fully Vested at that date.
�Cause� will have the meaning set forth in any employment or other agreement or policy applicable to youor, if no such agreement or policy exists, will mean (i) dishonesty, fraud, misrepresentation, theft,embezzlement or injury or attempted injury, in each case related to the Company or any Subsidiary, (ii) anyunlawful or criminal activity of a serious nature, (iii) any breach of duty, habitual neglect of duty orunreasonable job performance, or (iv) any material breach of any employment, service, confidentiality ornoncompete agreement entered into with the Company or any Subsidiary.
�Disability� means your disability such as would entitle you to receive disability income benefits pursuantto the long-term disability plan of the Company or Subsidiary then covering you or, if no such plan exists oris applicable to you, your permanent and total disability within the meaning of Section 22(e)(3) of the Code;provided, however, that the disability must also comply with the requirements of Treas. Reg.§ 1.409A-3(i)(4).
- 7 -
Copyright © 2013 www.secdatabase.com. All Rights Reserved.Please Consider the Environment Before Printing This Document
�Retirement� means the termination (other than for Cause or by reason of death or Disability) of youremployment or other service on or after the date on which you have attained the age of 55 and havecompleted 10 years of continuous service to the Company or any Subsidiary (such period of service to bedetermined in accordance with the retirement/pension plan or practice of the Company or Subsidiary thencovering you, provided that if you are not covered by any such plan or practice, you will be deemed to becovered by the Company�s plan or practice for purposes of this determination).
If a Change in Control Event occurs before the final Distribution Date and the Change in Control Event alsowould be an event described in Treas. Reg. Section 1.409A-3(i)(5) (a �409A Change in Control Event�), anyunvested RSUs you then hold will Vest earlier than their scheduled Vesting Dates only as provided in thisparagraph. A Change in Control Event that does not comport with that regulation will not cause anacceleration in Vesting Dates unless otherwise permitted by Section 409A. Subject to the foregoing rules, if aChange in Control Event occurs and the RSU is not continued, assumed or replaced, it shall immediatelybecome fully Vested and the final Vesting Date will be the closing of the Change in Control Event. Alsosubject to the foregoing rules, if the RSU is continued, assumed or replaced, Vesting fully accelerates and thefinal Vesting Date will be your last day of employment if, within 24 months following the closing of theChange in Control Event, the Company terminates your employment without Cause or, if your employmentor other individual agreement provides for resignation for �Good Reason,� you resign for Good Reasonduring the same period.
Distribution Dates The Distribution Date for Shares will be the date the Company selects that is as soon as administrativelypracticable following the applicable Vesting Date (and is, in any event, no later than March 15 of thefollowing calendar year).
- 8 -
Copyright © 2013 www.secdatabase.com. All Rights Reserved.Please Consider the Environment Before Printing This Document
Exhibit 10.51
Grant No.
¨ Participant�s Copy
¨ Company�s Copy
ARBITRON INC.2008 EQUITY COMPENSATION PLAN
PERFORMANCE-BASED RESTRICTED STOCK UNIT AGREEMENT
To :
Arbitron Inc. (the �Company�) has granted you (the �Grant�) restricted stock units (�RSUs�) as set forth on Exhibit A to thisAgreement (the �RSUs�) under its 2008 Equity Compensation Plan (the �Plan�), subject to the Vesting Schedule and requirementsspecified on Exhibit A.
The Grant is subject in all respects to the applicable provisions of the Plan. This Agreement does not cover all of the rules thatapply to the Grant under the Plan, and the Plan defines any capitalized terms in this Agreement that this Agreement does not define.
In addition to the Plan�s terms and restrictions, the following terms and restrictions apply:
Vesting Schedule The Grant becomes nonforfeitable (�Vested�) as to some or all of the RSUs only as provided on Exhibit A.
Distribution Dates You will receive a distribution of shares (the �Shares�) of Company common stock (�Common Stock�)equivalent to your Vested RSUs as soon as practicable following the dates on which you become Vested (the�Distribution Dates�) as provided in Exhibit A, subject to any overriding provisions in the Plan.
Limited Status You understand and agree that the Company will not consider you a shareholder for any purpose with respectto the Shares, unless and until the Shares have been issued to you on the Distribution Date(s). You will,however, receive dividend equivalents (�Dividend Equivalent Rights�) with respect to the Vested RSUs,measured using the Shares they represent, with the amounts convertible into full or fractional additionalVested RSUs based on dividing the Dividend Equivalent Rights by the Fair Market Value (as defined in thePlan) as of the date of dividend distribution and holding the resulting additional Vested RSUs for distributionas provided for the RSUs with respect to which they were issued.
Voting RSUs cannot be voted. You may not vote the Shares unless and until the Shares are distributed to you.
Transfer Restrictions You may not sell, assign, pledge, encumber, or otherwise transfer any interest (�Transfer�) in the Sharesuntil the Shares are distributed to you.
Copyright © 2013 www.secdatabase.com. All Rights Reserved.Please Consider the Environment Before Printing This Document
and Forfeiture Any attempted Transfer that precedes the Distribution Date for such Shares is invalid.
Unless the Administrator determines otherwise at any time or Exhibit A provides otherwise, if your servicewith the Company terminates for any reason before all of your RSUs are Vested, then you will forfeit suchunvested RSUs (and the Shares to which they relate) to the extent that such RSUs do not otherwise vest as aresult of the termination. The forfeited RSUs will then immediately revert to the Company. You will receiveno payment for RSUs that you forfeit.
Your receipt of and retaining the RSUs and any Common Stock issued thereunder are also subject to yourcompliance with the restrictive covenants set out in Exhibit B to this award.
Additional Conditionsto Receipt
The Company may postpone issuing and delivering any Shares for so long as the Company determines to beadvisable to satisfy the following:
its completing or amending any securities registration or qualification of the Shares or its or yoursatisfying any exemption from registration under any Federal or state law, rule, or regulation;
its receiving proof it considers satisfactory that a person or entity seeking to receive the Shares afteryour death is entitled to do so;
your complying with any requests for representations under the Grant and the Plan; and
its or your complying with any federal, state, or local tax withholding obligations.
Taxes andWithholding
The RSUs provide tax deferral, meaning that they are not taxable to you until you actually receive Shares onor around each Distribution Date. You will then owe taxes at ordinary income tax rates as of eachDistribution Date at the Shares� value.
The Company is required to withhold (in cash from salary or other amounts owed you) the applicablepercentage of the value of the Shares on the Distribution Date, regardless of whether you sell them. If theCompany does not choose to do so, you agree to arrange for payment of the withholding taxes and/orconfirm that the Company is arranging for appropriate withholding.
Unless you determine to satisfy the tax withholding obligation by some other means approved by theCompany, the Company will, if permissible under applicable law, withhold from those Shares otherwiseissuable to you the whole number of Shares sufficient to satisfy the minimum applicable tax withholdingobligation. You acknowledge that the withheld Shares may not be sufficient to satisfy your minimum taxwithholding obligation. Accordingly, you agree to pay the Company as soon as
- 2 -
Copyright © 2013 www.secdatabase.com. All Rights Reserved.Please Consider the Environment Before Printing This Document

practicable, including through additional payroll withholding, any amount of the tax withholding obligationthat is not satisfied by the withholding of Shares described above.
AdditionalRepresentations fromYou
If you receive Shares at a time when the Company does not have a current registration statement (generallyon Form S-8) under the Act that covers issuances of Shares to you, you must comply with the followingbefore the Company will release the Shares to you. You must:
represent to the Company, in a manner satisfactory to the Company�s counsel, that you are acquiringthe Shares for your own account and not with a view to reselling or distributing the Shares; and
agree that you will not sell, transfer, or otherwise dispose of the Shares unless:
a registration statement under the Act is effective at the time of disposition with respect to theShares you propose to sell, transfer, or otherwise dispose of; or
the Company has received an opinion of counsel or other information and representations itconsiders satisfactory to the effect that, because of Rule 144 under the Act or otherwise, noregistration under the Act is required.
Additional Restriction You will not receive the Shares if issuing the Shares would violate any applicable federal or state securitieslaws or other laws or regulations.
No Effect onEmployment or OtherRelationship
Nothing in this Agreement restricts the Company�s rights or those of any of its affiliates to terminate youremployment or other relationship at any time, with or without cause. The termination of your relationship,whether by the Company or any of its affiliates or otherwise, and regardless of the reason for suchtermination, has the consequences provided for under the Plan and any applicable employment or severanceagreement or plan.
No Effect on RunningBusiness
You understand and agree that the existence of the RSU will not affect in any way the right or power of theCompany or its stockholders to make or authorize any adjustments, recapitalizations, reorganizations, orother changes in the Company�s capital structure or its business, or any merger or consolidation of theCompany, or any issuance of bonds, debentures, preferred or other stock, with preference ahead of orconvertible into, or otherwise affecting the Company�s common stock or the rights thereof, or thedissolution or liquidation of the Company, or any sale or transfer of all or any part of its assets or business, orany other corporate act or proceeding, whether or not of a similar character to those described above.
- 3 -
Copyright © 2013 www.secdatabase.com. All Rights Reserved.Please Consider the Environment Before Printing This Document

Section 409A This Agreement is intended to comply with the requirements of Section 409A of the Internal Revenue Codeand must be construed consistently with that section. Notwithstanding anything in the Plan or thisAgreement to the contrary, if the Vested portion is increased in connection with your �separation fromservice� within the meaning of Section 409A, as determined by the Company), other than due to death, andif (x) you are then a �specified employee� within the meaning of Section 409A at the time of such separationfrom service (as determined by the Company, by which determination you agree you are bound) and (y) thepayment under such accelerated RSUs will result in the imposition of additional tax under Section 409A ifpaid to you within the six month period following your separation from service, then the payment under suchaccelerated RSUs will not be made until the earlier of (i) the date six months and one day following the dateof your separation from service or (ii) the 10th day after your date of death, and will be paid within 10 daysthereafter. Neither the Company nor you shall have the right to accelerate or defer the delivery of any suchpayments or benefits except to the extent specifically permitted or required by Section 409A. In any event,the Company makes no representations or warranty and shall have no liability to you or any other person, ifany provisions of or payments under this Agreement are determined to constitute deferred compensationsubject to Code Section 409A but not to satisfy the conditions of that section.
Unsecured Creditor This Agreement creates a contractual obligation on the part of the Company to make payment under theRSUs credited to your account at the time provided for in this Agreement. Neither you nor any other partyclaiming an interest in deferred compensation hereunder shall have any interest whatsoever in any specificassets of the Company. Your right to receive payments hereunder is that of an unsecured general creditor ofCompany.
AdditionalRestrictions
Any acceleration, vesting, or extension under this Grant is subject, as applicable, to the 280G provisions inExhibit C hereto and to compliance with any requirement that otherwise applies to you to provide a releaseof claims.
Governing Law The laws of the State of Delaware will govern all matters relating to this Agreement, without regard to theprinciples of conflict of laws.
Notices Any notice you give to the Company must follow the procedures then in effect. If no other procedures apply,you must send your notice in writing by hand or by mail to the office of the Company�s Secretary. If mailed,you should address it to the Company�s Secretary at the Company�s then corporate headquarters, unless theCompany directs participants to send notices to another corporate department or to a third partyadministrator or specifies another method of transmitting notice. The Company and the Administrator willaddress any notices to you at your office or home address as reflected on the Company�s personnel or otherbusiness records. You and the Company may change the address for notice by
- 4 -
Copyright © 2013 www.secdatabase.com. All Rights Reserved.Please Consider the Environment Before Printing This Document

like notice to the other, and the Company can also change the address for notice by general announcementsto participants.
Plan Governs Wherever a conflict may arise between the terms of this Agreement and the terms of the Plan, the terms ofthe Plan will control.
ARBITRON INC.
Date: By:
- 5 -
Copyright © 2013 www.secdatabase.com. All Rights Reserved.Please Consider the Environment Before Printing This Document

ACKNOWLEDGMENT
I acknowledge I received a copy of the Plan. I represent that I have read and am familiar with the Plan�s terms. I accept the Grantsubject to all of the terms and provisions of this Agreement and of the Plan under which the Grant is made, as the Plan may be amendedin accordance with its terms. I agree to accept as binding, conclusive, and final all decisions or interpretations of the Administratorconcerning any questions arising under the Plan with respect to the Grant.
Date:
Name:
NO ONE MAY SELL, TRANSFER, OR DISTRIBUTE THE SECURITIES COVERED BY THE GRANT WITHOUT AN EFFECTIVE
REGISTRATION STATEMENT RELATING THERETO OR AN OPINION OF COUNSEL SATISFACTORY TO THE COMPANY OR OTHER
INFORMATION AND REPRESENTATIONS SATISFACTORY TO THE COMPANY THAT SUCH REGISTRATION IS NOT REQUIRED.
- 6 -
Copyright © 2013 www.secdatabase.com. All Rights Reserved.Please Consider the Environment Before Printing This Document

Grant No.
Arbitron Inc.2008 Equity Compensation Plan
Performance-Based Restricted Stock Unit
Exhibit A
Recipient Information:
Name:
Signature: X
Grant Information:
RSUs: Date of Grant:
Vesting Schedule
Performance Condition The Grant will expire without Vesting if the one-year performance goal (the �PerformanceGoal�) is not satisfied by the first anniversary of the Date of Grant. The CompensationCommittee will have the full and sole discretion to determine whether the Company has met thePerformance Goal and how each of its components is calculated. In accordance with Section10(i)(3) of Plan, the Committee may adjust the Performance Goal to exclude any one or more of(i) extraordinary items; (ii) gains or losses on the dispositions of discontinued operations; (iii) thecumulative effects of changes in accounting principles; (iv) the writedown of any asset; and(v) charges for restructuring and rationalization programs.
The Performance Goal is specified on Schedule I to this Exhibit A.
Service Condition If the Performance Goal is met, the Grant will become Vested as to one-fourth of the RSUs oneach of the four one year anniversaries of the Date of Grant (each a �Vesting Date�), assumingyou remain a service provider to the Company through those dates.
Grant Expiration Rules Except as otherwise provided in an employment, retention, or other individual agreement covering you,you will forfeit any unvested portions of the Grant immediately when you cease to be employed by (ora member of the Board of) the Company for reasons other than death or Disability or Retirement. Ifyour
- 7 -
Copyright © 2013 www.secdatabase.com. All Rights Reserved.Please Consider the Environment Before Printing This Document
employment ends for death or Disability, you will become fully Vested at that date. If your employmentends on your Retirement, you will continue to Vest in the Grant as though you had remained employedand subject to achievement of the Performance Goal.
Definitions �Cause� will have the meaning set forth in any employment or other agreement or policyapplicable to you or, if no such agreement or policy exists, will mean (i) dishonesty, fraud,misrepresentation, theft, embezzlement or injury or attempted injury, in each case related to theCompany or any Subsidiary, (ii) any unlawful or criminal activity of a serious nature, (iii) anybreach of duty, habitual neglect of duty or unreasonable job performance, or (iv) any materialbreach of any employment, service, confidentiality or noncompete agreement entered into withthe Company or any Subsidiary.
�Disability� means your disability such as would entitle you to receive disability income benefitspursuant to the long-term disability plan of the Company or Subsidiary then covering you or, ifno such plan exists or is applicable to you, your permanent and total disability within themeaning of Section 22(e)(3) of the Code; provided, however, that the disability must also complywith the requirements of Treas. Reg. § 1.409A-3(i)(4).
�Retirement� means the termination (other than for Cause or by reason of death or Disability) ofyour employment or other service on or after the date on which you have attained the age of 55and have completed 10 years of continuous service to the Company or any Subsidiary (suchperiod of service to be determined in accordance with the retirement/pension plan or practice ofthe Company or Subsidiary then covering you, provided that if you are not covered by any suchplan or practice, you will be deemed to be covered by the Company�s plan or practice forpurposes of this determination).
Change in Control If a Change in Control Event (as defined in the Plan) occurs before the final Distribution Date and theChange in Control Event also would be an event described in Treas. Reg. Section 1.409A-3(i)(5), anyunvested RSUs you then hold will Vest as provided in this paragraph. A Change in Control Event thatdoes not comport with that regulation will not cause full Vesting unless otherwise permitted by Section409A. Subject to the foregoing rules, if a Change in Control Event occurs and the RSU is not assumedor replaced, it shall immediately become fully Vested. Also subject to the foregoing rules, if the RSU isassumed or replaced, Vesting fully accelerates if, within 24 months following the closing of the Changein Control Event, the Company terminates your employment without Cause or, if your employment orother
- 8 -
Copyright © 2013 www.secdatabase.com. All Rights Reserved.Please Consider the Environment Before Printing This Document

individual agreement provides for resignation for �Good Reason,� you resign for Good Reason duringthe same period.
If a Change in Control Event occurs before the first anniversary of the Date of Grant, the PerformanceGoal will be deemed to have been met.
Distribution Dates The Distribution Date for Shares will be the date the Company selects within 90 days following eachapplicable Vesting Date.
- 9 -
Copyright © 2013 www.secdatabase.com. All Rights Reserved.Please Consider the Environment Before Printing This Document

Exhibit 10.52
Arbitron Inc. 2012 Board of Director Compensation
Arbitron Non-Employee Board of Directors receive the following compensation for 2012:
Annual Retainer Fee $30,000
Independent Chairman of the Board Additional AnnualRetainer
$95,000
Committee Chair Retainer Audit Committee: $20,000Compensation and Human Resources Committee: $15,000Nominating and Corporate Governance Committee: $15,000Technology Strategy Committee: $20,000
Board Meeting Fees (In person or by telephone) $1,500
Committee Meeting Fees (In person) $1,500
Committee Meeting Fees (By telephone) $750
Initial Deferred Stock Unit Award Each newly elected non-employee director will receive a one-time grant of 4,500 deferred stock units, which deferred stockunits will vest in three equal annual installments of 1,500deferred stock units beginning on the first anniversary of the dateof grant and will be payable within 30 days after the director�stermination of service as a director.
Annual Deferred Stock Unit Awards Beginning the annual meeting after initial election to the board ofdirectors, each continuing non-employee director will receive, athis or her election, either:
(1) a grant of $100,000 worth of deferred stock units, whichdeferred stock units will vest in full on the first anniversary fromthe date of grant. Directors may elect to defer the receipt ofshares of common stock from these deferred stock units until 30days after:
� the first anniversary of the vesting date;� the third anniversary of the vesting date;� the fifth anniversary of the vesting date; or� the director�s termination of service as a director
or (2) a grant of $100,000 worth of restricted stock units, whichrestricted stock units will vest in four equal annual installmentsbeginning on the first anniversary of the date of grant and will bepayable within 30 days from the vesting date.
All cash retainer fees and meeting fees payable to non-employee directors may be paid, at the election of each director, in the form ofdeferred stock units or stock, in lieu of cash. The deferred stock units vest immediately. Directors may elect to defer the receipt of sharesof common stock from these deferred stock units until 30 days after (1) the first anniversary of the grant date; (2) the third anniversaryof the grant date; (3) the fifth anniversary of the grant date; or (4) the director�s termination of service as a director of the Company.
All permitted elections with regard to the form of compensation or deferral thereof are made by directors in the year prior to earningsuch compensation.
Copyright © 2013 www.secdatabase.com. All Rights Reserved.Please Consider the Environment Before Printing This Document
Exhibit 10.53
Grant No.
¨ Participant�s Copy
¨ Company�s Copy
ARBITRON INC.2008 EQUITY COMPENSATION PLAN
DIRECTOR STOCK UNIT AGREEMENT
To :
Arbitron Inc. (the �Company�) has granted you (the �Grant�) either Restricted Stock Units (�RSUs�) or Deferred Stock Units(�DSUs�) as set forth on Exhibit A to this Agreement (the �Units�) under its 2008 Equity Compensation Plan (the �Plan�).
The Grant is subject in all respects to the applicable provisions of the Plan. This Agreement does not cover all of the rules thatapply to the Grant under the Plan, and the Plan defines any capitalized terms in this Agreement that this Agreement does not define.
In addition to the Plan�s terms and restrictions, the following terms and restrictions apply:
Vesting Schedule [USE FOR THE INITIAL GRANT: The Grant vests in three equal installments over a three-year periodsuch that one-third of the Grant will be scheduled to vest on the first anniversary of the Grant Date set forthon Exhibit A, one-third will be scheduled to vest on the second anniversary of the Grant Date, and the finalone-third will be scheduled to vest on the third anniversary of the Grant Date (each such date referred toherein as a �Vesting Date�), in each case subject to your remaining a director through the applicable VestingDate.]
[USE FOR THE ANNUAL GRANT: The Grant will be scheduled to vest in one installment on the firstanniversary of the Grant Date set forth on Exhibit A (the �Vesting Date�) subject to your remaining adirector through the applicable Vesting Date. Notwithstanding the foregoing, if you terminate your service asa director voluntarily for any reason or the Company terminates your service as a director for any reasonother than Cause, you will vest in a pro-rata portion of the Grant as of the date of your termination and suchdate shall be deemed the �Vesting Date� for purposes of this Agreement. The pro-rated amount described inthe preceding sentence will be determined by multiplying the total number of Units subject to the Grant by afraction the numerator of which is the number of calendar days that have elapsed since the Grant Date up tothe date of your termination as a director and the denominator of which is 365. For this purpose, �Cause�will mean (i) dishonesty, fraud, misrepresentation, theft, embezzlement or injury or attempted injury, in eachcase related to the Company or any Subsidiary, (ii) any unlawful or criminal activity of a serious nature,(iii) any breach of duty, habitual neglect of duty or unreasonable job performance, or (iv) any material breachof any employment, service, confidentiality or noncompete agreement entered into with the Company or anySubsidiary.]
[USE FOR GRANTS MADE IN LIEU OF ANNUAL RETAINER AND MEETING FEES: The Grantis one hundred percent (100%) vested as of the Grant Date set forth on Exhibit A (the �Vesting Date�).]
- 1 -
Copyright © 2013 www.secdatabase.com. All Rights Reserved.Please Consider the Environment Before Printing This Document

Distribution Date You will receive a distribution of shares (the �Shares�) of Company common stock (�Common Stock�)equivalent to the vested portion of your Units as indicated on Exhibit A, the �Distribution Date,� subject toany overriding provisions in the Plan.
Limited Status You understand and agree that the Company will not consider you a shareholder for any purpose with respectto the Shares, unless and until the Shares have been issued to you on the Distribution Date(s). You will,however, receive dividend equivalents (�Dividend Equivalent Rights�) with respect to the Units, measuredusing the Shares they represent, with the amounts convertible into full or fractional additional Units based ondividing the dividends by the Fair Market Value (as defined in the Plan) as of the date of dividenddistribution and holding the resulting additional Units for distribution as provided for the other Units.
Voting Units cannot be voted. You may not vote the Shares unless and until the Shares are distributed to you.
Transfer Restrictions You may not sell, assign, pledge, encumber, or otherwise transfer any interest (�Transfer�) in the Sharesuntil the Shares are distributed to you.
Any attempted Transfer that precedes the Distribution Date for such Shares is invalid.
Additional Conditionsto Receipt
The Company may postpone issuing and delivering any Shares for so long as the Company determines to beadvisable to satisfy the following:
its completing or amending any securities registration or qualification of the Shares or its or yoursatisfying any exemption from registration under any Federal or state law, rule, or regulation;
its receiving proof it considers satisfactory that a person or entity seeking to receive the Shares afteryour death is entitled to do so;
your complying with any requests for representations under the Grant and the Plan; and
its or your complying with any federal, state, or local tax withholding obligations.
Taxes andWithholding
The Units are not taxable to you until you actually receive Shares on or around each Distribution Date. Youwill then owe taxes at ordinary income tax rates as of each Distribution Date at the Shares� value.
If you become employed by the Company before a Distribution Date, the Company will be required towithhold (in cash from salary or other amounts owed you) the applicable percentage of the value of theShares on the Distribution Date. If the Company does not choose to do so, you agree to arrange for paymentof the withholding taxes and/or confirm that the Company is arranging for appropriate withholding.
AdditionalRepresentations fromYou
If you receive Shares at a time when the Company does not have a current registration statement (generallyon Form S-8) under the Act that covers issuance of Shares to you, you must comply with the followingbefore the Company will release the Shares to you. You must:
represent to the Company, in a manner satisfactory to the Company�s counsel, that you are acquiringthe Shares for your own account and not with a view to reselling or distributing the Shares; and
- 2 -
Copyright © 2013 www.secdatabase.com. All Rights Reserved.Please Consider the Environment Before Printing This Document

agree that you will not sell, transfer, or otherwise dispose of the Shares unless:
a registration statement under the Act is effective at the time of disposition with respect to theShares you propose to sell, transfer, or otherwise dispose of; or
the Company has received an opinion of counsel or other information and representations itconsiders satisfactory to the effect that, because of Rule 144 under the Act or otherwise, noregistration under the Act is required.
Additional Restriction You will not receive the Shares if issuing the Shares would violate any applicable federal or state securitieslaws or other laws or regulations.
No Effect on ServiceProviding Relationship
Nothing in this Agreement restricts the Company�s rights or those of any of its affiliates to terminate yourservice on the Company�s Board of Directors or other relationship at any time, with or without cause. Thetermination of your relationship, whether by the Company or any of its affiliates or otherwise, and regardlessof the reason for such termination, has the consequences provided for under the Plan.
No Effect on RunningBusiness
You understand and agree that the existence of the Unit will not affect in any way the right or power of theCompany or its stockholders to make or authorize any adjustments, recapitalizations, reorganizations, orother changes in the Company�s capital structure or its business, or any merger or consolidation of theCompany, or any issuance of bonds, debentures, preferred or other stock, with preference ahead of orconvertible into, or otherwise affecting the Company�s common stock or the rights thereof, or thedissolution or liquidation of the Company, or any sale or transfer of all or any part of its assets or business, orany other corporate act or proceeding, whether or not of a similar character to those described above.
Section 409A [USE FOR THE INITIAL GRANT: The Units and this Agreement are intended to be exempt from Section409A of the Internal Revenue Code in accordance with the �short-term deferral� rule set forth in Section1.409A-1(b)(4) of the Treasury Regulations. The Company makes no representations or warranty and shallhave no liability to you or any other person, if any provisions of or payments under this Agreement aredetermined to constitute deferred compensation subject to Code Section 409A but not to satisfy theconditions of that section.]
[USE FOR THE ANNUAL GRANT AND ANY GRANTS MADE IN LIEU OF ANNUAL RETAINERAND MEETING FEES: The Units and this Agreement are intended to comply with the requirements ofSection 409A of the Internal Revenue Code and this Agreement must be construed consistently with thatsection. Notwithstanding anything in the Plan or this Agreement to the contrary, if (x) you are a �specifiedemployee� within the meaning of Section 409A at the time of your separation from service (as determinedby the Company, by which determination you agree you are bound) and (y) the payment under the Units willresult in the imposition of additional tax under Section 409A if paid to you within the six month periodfollowing your separation from service, then the payment under such accelerated Units will not be madeuntil the earlier of (i) the date six months and one day following the date of your separation from service or(ii) the 10th day after your date of death, and will be paid within 10 days thereafter. Neither the Company noryou shall have the right to defer the delivery of any such payments or benefits except to the extentspecifically permitted or required by Section 409A. In addition, neither the Company nor you shall have theright to accelerate the delivery of any such payments or benefits except to the extent specifically permitted orrequired by Section 409A. In any event, the Company makes no representations or
- 3 -
Copyright © 2013 www.secdatabase.com. All Rights Reserved.Please Consider the Environment Before Printing This Document

warranty and shall have no liability to you or any other person, if any provisions of or payments under thisAgreement are determined to constitute deferred compensation subject to Code Section 409A but not tosatisfy the conditions of that section.]
Unsecured Creditor This Agreement creates a contractual obligation on the part of the Company to make payment under theUnits credited to your account at the time provided for in this Agreement. Neither you nor any other partyclaiming an interest in the compensation hereunder, whether deferred or not, shall have any interestwhatsoever in any specific assets of the Company. Your right to receive payments hereunder is that of anunsecured general creditor of Company.
Governing Law The laws of the State of Delaware will govern all matters relating to this Agreement, without regard to theprinciples of conflict of laws.
Notices Any notice you give to the Company must follow the procedures then in effect. If no other procedures apply,you must send your notice in writing by hand or by mail to the office of the Company�s Secretary. If mailed,you should address it to the Company�s Secretary at the Company�s then corporate headquarters, unless theCompany directs participants to send notices to another corporate department or to a third partyadministrator or specifies another method of transmitting notice. The Company and the Administrator willaddress any notices to you at your office or home address as reflected on the Company�s business records.You and the Company may change the address for notice by like notice to the other, and the Company canalso change the address for notice by general announcements to participants.
Plan Governs Wherever a conflict may arise between the terms of this Agreement and the terms of the Plan, the terms ofthe Plan will control.
ARBITRON INC.
Date: By:
- 4 -
Copyright © 2013 www.secdatabase.com. All Rights Reserved.Please Consider the Environment Before Printing This Document

ACKNOWLEDGMENT
I acknowledge I received a copy of the Plan. I represent that I have read and am familiar with the Plan�s terms. I accept the Grantsubject to all of the terms and provisions of this Agreement and of the Plan under which the Grant is made, as the Plan may be amendedin accordance with its terms. I agree to accept as binding, conclusive, and final all decisions or interpretations of the Administratorconcerning any questions arising under the Plan with respect to the Grant.
Date:
Name:
NO ONE MAY SELL, TRANSFER, OR DISTRIBUTE THE SECURITIES COVERED BY THE GRANT WITHOUT AN EFFECTIVE
REGISTRATION STATEMENT RELATING THERETO OR AN OPINION OF COUNSEL SATISFACTORY TO THE COMPANY OR OTHER
INFORMATION AND REPRESENTATIONS SATISFACTORY TO THE COMPANY THAT SUCH REGISTRATION IS NOT REQUIRED.
- 5 -
Copyright © 2013 www.secdatabase.com. All Rights Reserved.Please Consider the Environment Before Printing This Document

Grant No.
Arbitron Inc.2008 Equity Compensation Plan
Stock Unit
Exhibit A
Recipient Information:
Name:
Signature: X
Grant Information:
Units: Grant Date:
Type of Units: Restricted Stock UnitsDeferred Stock Units
Distribution Date(s)for RSUs
As your RSUs vest in accordance with the Vesting Schedule, your Distribution Date for such vested RSUswill be a date within 30 days after the Vesting Date for such RSUs.
[USE FOR THE INITIAL GRANT: If a Change in Control Event (as defined in the Plan) occurs beforethe final Distribution Date, full payment for outstanding RSUs will be made in connection with the closingof the Change in Control Event. The payment will be in cash (unless the Board determines otherwise) equalto the value per share of the consideration received in the Change in Control Event multiplied by the numberof outstanding RSUs, at which point the RSUs will expire without further obligation to you. The Board willhave the authority to value any consideration received in the Change in Control Event to the extent neithercash nor readily marketable securities.]
[USE FOR THE ANNUAL GRANT: If a Change in Control Event (as defined in the Plan) occurs beforethe Distribution Date and the Change in Control Event also would be an event described in Treas. Reg.Section 1.409A-3(i)(5), all unvested RSUs will accelerate and full payment for outstanding RSUs will bemade in connection with the closing of the Change in Control Event. If the Change in Control Event does notcomport with that regulation, all unvested RSUs will accelerate as of the closing of the Change in ControlEvent but full payment for RSUs outstanding as of immediately prior to the closing will not be made untilthe earlier of the first anniversary of the Grant Date or the date your service with the Company as a directorterminates (whether voluntarily or involuntarily). The payment will be in cash (unless the Board determinesotherwise) equal to the value per share of the consideration received in the Change in Control Eventmultiplied by the number of outstanding RSUs, at which point the RSUs will expire without furtherobligation to you. The Board will have the authority to value any consideration received in the Change inControl Event to the extent neither cash nor readily marketable securities.]
Distribution Date for Your Distribution Date for all of your vested DSUs will be a date within 30 days
- 6 -
Copyright © 2013 www.secdatabase.com. All Rights Reserved.Please Consider the Environment Before Printing This Document
DSUs after the following (check one):
One (1) year anniversary of the Vesting Date
Three (3) year anniversary of the Vesting Date
Five (5) year anniversary of the Vesting Date
The date you cease to serve as a director of the Company
If a Change in Control Event (as defined in the Plan) occurs before the Distribution Date and the Change inControl Event also would be an event described in Treas. Reg. Section 1.409A-3(i)(5), full payment for anyoutstanding DSUs will be made in connection with the closing of the Change in Control Event. A Change inControl Event that does not comport with that regulation will not affect the payment timing. The paymentwill be in cash (unless the Board determines otherwise) equal to the value per share of the considerationreceived in the Change in Control Event multiplied by the number of outstanding DSUs, at which point theDSUs will expire without further obligation to you. The Board will have the authority to value anyconsideration received in the Change in Control Event to the extent neither cash nor readily marketablesecurities.
- 7 -
Copyright © 2013 www.secdatabase.com. All Rights Reserved.Please Consider the Environment Before Printing This Document

Exhibit 21
ARBITRON INC.
SUBSIDIARIES
Subsidiaries and Their Affiliates:
State or
Other Jurisdiction
of Incorporation
Arbitron Holdings Inc. DelawareArbitron International, LLC (1) DelawareArbitron Mobile Oy (2) FinlandArbitron Technology Services India Private Limited (1) IndiaAstro West LLC (3) DelawareCardinal North LLC (3) DelawareCeridian Infotech (India) Private Limited India
(1) Is a subsidiary of Arbitron Inc. and Arbitron Holdings, Inc.(2) Is a subsidiary of Cardinal North LLC(3) Is a subsidiary of Arbitron Inc.
Copyright © 2013 www.secdatabase.com. All Rights Reserved.Please Consider the Environment Before Printing This Document
Exhibit 23
Consent of Independent Registered Public Accounting Firm
The Board of DirectorsArbitron Inc.:
We consent to the incorporation by reference in the registration statements (Nos. 333-58143, 333-89565, 333-56296, 333-85492,333-124663, 333-149441, 333-155577, 333-155578, 333-170318, 333-170319) on Form S-8 of Arbitron Inc. of our reports datedFebruary 24, 2012, with respect to the consolidated balance sheets of Arbitron Inc., as of December 31, 2011 and 2010, and the relatedconsolidated statements of income, stockholders� equity (deficit), comprehensive income and cash flows for each of the years in thethree-year period ended December 31, 2011, and the related financial statement schedule and the effectiveness of internal control overfinancial reporting as of December 31, 2011, which reports appear in the December 31, 2011 annual report on Form 10-K of Arbitron.
/s/ KPMG LLPBaltimore, MarylandFebruary 24, 2012
Copyright © 2013 www.secdatabase.com. All Rights Reserved.Please Consider the Environment Before Printing This Document

Exhibit 24
POWER OF ATTORNEY
The undersigned, a Director of Arbitron Inc. (the �Company�), a Delaware corporation, does hereby make, nominate and appointRICHARD J. SURRATT and TIMOTHY T. SMITH, and each of them, to be my attorney-in-fact for six months from the date hereof,with full power and authority to execute for and on behalf of the undersigned the Company�s Annual Report on Form 10-K for thefiscal year ended December 31, 2011, to be filed with the Securities and Exchange Commission pursuant to the Securities Exchange Actof 1934, as amended; provided that such Form 10-K is first reviewed by the Audit Committee of the Board of Directors of the Companyand by my attorney-in-fact, and his/her name, when thus signed, shall have the same force and effect as though I had manually signedsuch Form 10-K.
I have signed this Power of Attorney as of December 5, 2011.
/s/ Shellye L. ArchambeauShellye L. Archambeau
/s/ David W. DevonshireDavid W. Devonshire
/s/ John A. DimlingJohn A. Dimling
/s/ Erica FarberErica Farber
/s/ Ronald G. GarriquesRonald G. Garriques
/s/ Philip GuarascioPhilip Guarascio
/s/ Larry E. KittelbergerLarry E. Kittelberger
/s/ Luis G. NogalesLuis G. Nogales
/s/ Richard A. PostRichard A. Post
Copyright © 2013 www.secdatabase.com. All Rights Reserved.Please Consider the Environment Before Printing This Document
Exhibit 31.1302(a) CERTIFICATION
I, William T. Kerr, certify that:
1. I have reviewed this annual report on Form 10-K of Arbitron Inc.;
2. Based on my knowledge, this report does not contain any untrue statement of a material fact or omit to state a material fact necessaryto make the statements made, in light of the circumstances under which such statements were made, not misleading with respect to theperiod covered by this report;
3. Based on my knowledge, the financial statements, and other financial information included in this report, fairly present in all materialrespects the financial condition, results of operations and cash flows of the registrant as of, and for, the periods presented in this report;
4. The registrant�s other certifying officer and I are responsible for establishing and maintaining disclosure controls and procedures (asdefined in Exchange Act Rules 13a-15(e) and 15d-15(e)) and internal control over financial reporting (as defined in Exchange ActRules 13a-15(f) and 15d-15(f)) for the registrant and have:
a) Designed such disclosure controls and procedures, or caused such disclosure controls and procedures to be designed under oursupervision, to ensure that material information relating to the registrant, including its consolidated subsidiaries, is made known to us byothers within those entities, particularly during the period in which this report is being prepared;
b) Designed such internal control over financial reporting, or caused such internal control over financial reporting to be designedunder our supervision, to provide reasonable assurance regarding the reliability of financial reporting and the preparation of financialstatements for external purposes in accordance with generally accepted accounting principles;
c) Evaluated the effectiveness of the registrant�s disclosure controls and procedures and presented in this report our conclusionsabout the effectiveness of the disclosure controls and procedures, as of the end of the period covered by this report based on suchevaluation; and
d) Disclosed in this report any change in the registrant�s internal control over financial reporting that occurred during theregistrant�s most recent fiscal quarter (the registrant�s fourth fiscal quarter in the case of an annual report) that has materially affected,or is reasonably likely to materially affect, the registrant�s internal control over financial reporting; and
5. The registrant�s other certifying officer and I have disclosed, based on our most recent evaluation of internal control over financialreporting, to the registrant�s auditors and the audit committee of the registrant�s board of directors (or persons performing theequivalent functions):
a) All significant deficiencies and material weaknesses in the design or operation of internal control over financial reporting whichare reasonably likely to adversely affect the registrant�s ability to record, process, summarize and report financial information; and
b) Any fraud, whether or not material, that involves management or other employees who have a significant role in the registrant�sinternal control over financial reporting.
Date: February 24, 2012 /s/ William T. KerrWilliam T. KerrChief Executive Officer, President and Director
Copyright © 2013 www.secdatabase.com. All Rights Reserved.Please Consider the Environment Before Printing This Document

Exhibit 31.2302(a) CERTIFICATION
I, Richard J. Surratt, certify that:
1. I have reviewed this annual report on Form 10-K of Arbitron Inc.;
2. Based on my knowledge, this report does not contain any untrue statement of a material fact or omit to state a material fact necessaryto make the statements made, in light of the circumstances under which such statements were made, not misleading with respect to theperiod covered by this report;
3. Based on my knowledge, the financial statements, and other financial information included in this report, fairly present in all materialrespects the financial condition, results of operations and cash flows of the registrant as of, and for, the periods presented in this report;
4. The registrant�s other certifying officer and I are responsible for establishing and maintaining disclosure controls and procedures (asdefined in Exchange Act Rules 13a-15(e) and 15d-15(e)) and internal control over financial reporting (as defined in Exchange ActRules 13a-15(f) and 15d-15(f)) for the registrant and have:
a) Designed such disclosure controls and procedures, or caused such disclosure controls and procedures to be designed under oursupervision, to ensure that material information relating to the registrant, including its consolidated subsidiaries, is made known to us byothers within those entities, particularly during the period in which this report is being prepared;
b) Designed such internal control over financial reporting, or caused such internal control over financial reporting to be designedunder our supervision, to provide reasonable assurance regarding the reliability of financial reporting and the preparation of financialstatements for external purposes in accordance with generally accepted accounting principles;
c) Evaluated the effectiveness of the registrant�s disclosure controls and procedures and presented in this report our conclusionsabout the effectiveness of the disclosure controls and procedures, as of the end of the period covered by this report based on suchevaluation; and
d) Disclosed in this report any change in the registrant�s internal control over financial reporting that occurred during theregistrant�s most recent fiscal quarter (the registrant�s fourth fiscal quarter in the case of an annual report) that has materially affected,or is reasonably likely to materially affect, the registrant�s internal control over financial reporting; and
5. The registrant�s other certifying officer and I have disclosed, based on our most recent evaluation of internal control over financialreporting, to the registrant�s auditors and the audit committee of the registrant�s board of directors (or persons performing theequivalent functions):
a) All significant deficiencies and material weaknesses in the design or operation of internal control over financial reporting whichare reasonably likely to adversely affect the registrant�s ability to record, process, summarize and report financial information; and
b) Any fraud, whether or not material, that involves management or other employees who have a significant role in the registrant�sinternal control over financial reporting.
Date: February 24, 2012 /s/ Richard J. SurrattRichard J. SurrattExecutive Vice President and Chief Financial Officer
Copyright © 2013 www.secdatabase.com. All Rights Reserved.Please Consider the Environment Before Printing This Document

Exhibit 32.1
WRITTEN STATEMENT OF CHIEF EXECUTIVE OFFICERAND CHIEF FINANCIAL OFFICER
PURSUANT TO SECTION 906 OF THESARBANES-OXLEY ACT OF 2002
(18 U.S.C. Section 1350)
The undersigned, the Chief Executive Officer and the Chief Financial Officer of Arbitron Inc. (the �Company�), each hereby certifiesthat, to his knowledge, on the date hereof:
(a) the Annual Report on Form 10-K of the Company for the year ended December 31, 2011, filed on the date hereof with theSecurities and Exchange Commission (the �Annual Report�) fully complies with the requirements of Section 13(a) or 15(d) of theSecurities Exchange Act of 1934; and
(b) the information contained in the Annual Report fairly presents, in all material respects, the financial condition and results ofoperations of the Company.
/s/ William T. KerrWilliam T. KerrChief Executive OfficerDate: February 24, 2012
/s/ Richard J. SurrattRichard J. SurrattChief Financial OfficerDate: February 24, 2012
Copyright © 2013 www.secdatabase.com. All Rights Reserved.Please Consider the Environment Before Printing This Document
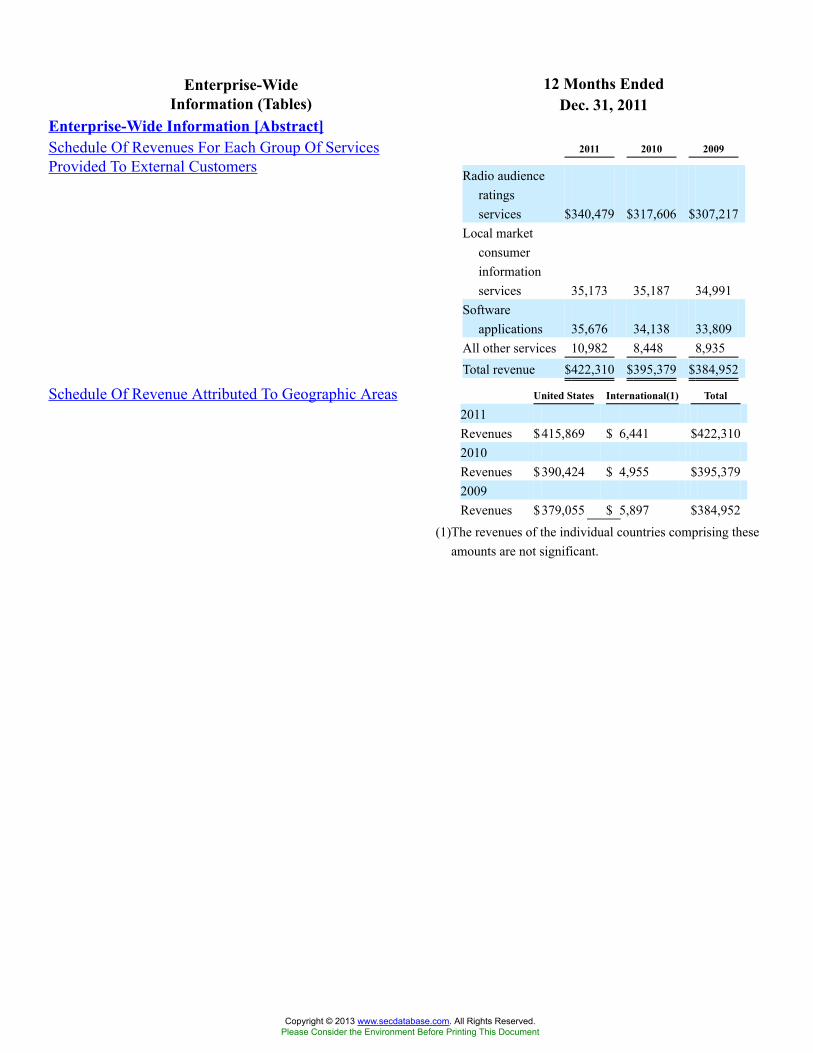
12 Months EndedEnterprise-WideInformation (Tables) Dec. 31, 2011
Enterprise-Wide Information [Abstract]Schedule Of Revenues For Each Group Of ServicesProvided To External Customers
2011 2010 2009
Radio audienceratingsservices $340,479 $317,606 $307,217
Local marketconsumerinformationservices 35,173 35,187 34,991
Softwareapplications 35,676 34,138 33,809
All other services 10,982 8,448 8,935Total revenue $422,310 $395,379 $384,952
Schedule Of Revenue Attributed To Geographic Areas United States International(1) Total
2011Revenues $415,869 $ 6,441 $422,3102010Revenues $390,424 $ 4,955 $395,3792009Revenues $379,055 $ 5,897 $384,952
(1)The revenues of the individual countries comprising theseamounts are not significant.
Copyright © 2013 www.secdatabase.com. All Rights Reserved.Please Consider the Environment Before Printing This Document
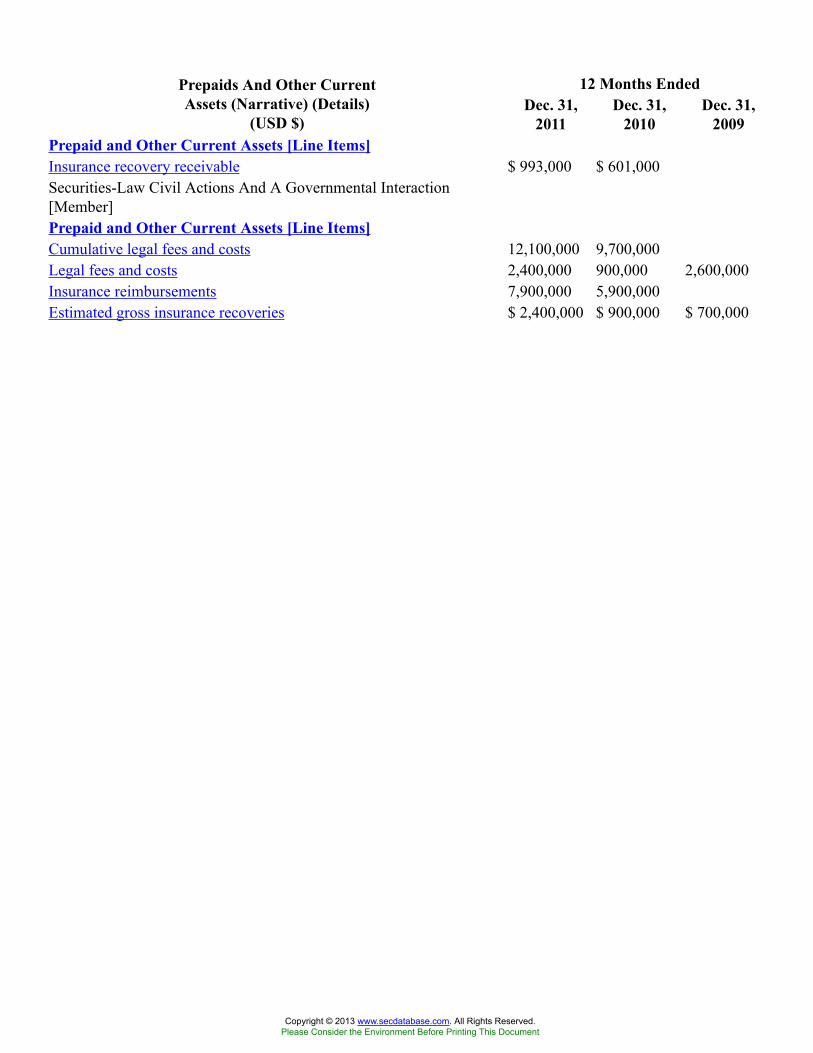
12 Months EndedPrepaids And Other CurrentAssets (Narrative) (Details)
(USD $)Dec. 31,
2011Dec. 31,
2010Dec. 31,
2009Prepaid and Other Current Assets [Line Items]Insurance recovery receivable $ 993,000 $ 601,000Securities-Law Civil Actions And A Governmental Interaction[Member]Prepaid and Other Current Assets [Line Items]Cumulative legal fees and costs 12,100,000 9,700,000Legal fees and costs 2,400,000 900,000 2,600,000Insurance reimbursements 7,900,000 5,900,000Estimated gross insurance recoveries $ 2,400,000 $ 900,000 $ 700,000
Copyright © 2013 www.secdatabase.com. All Rights Reserved.Please Consider the Environment Before Printing This Document

12 Months Ended 1 MonthsEnded
0 MonthsEnded
1 MonthsEnded
12MonthsEnded
Goodwill And OtherIntangible Assets (Narrative)
(Details) (USD $) Dec. 31,2011
Dec. 31,2010
Jul. 28,2011
Mar. 23,2010
LicensingArrangement
WithDigimarc
Corporation[Member]
Jun. 15, 2010Purchase OfTechnologyPortfolio,
Trade Name,And
EquipmentOf Integrated
MediaMeasurement
[Member]
Jul. 28,2011
ZokemOy
[Member]
Dec. 31,2011
ZokemOy
[Member]years
Acquired Finite-LivedIntangible Assets [LineItems]Payment for other intangibleassets
$4,500,000 $ 4,500,000
Amortization of intangibleassets, years 5.0
Payment for acquisition ofassets 10,553,0002,500,000 2,500,000
Acquisition of other intangibleassets 1,800,000
Acquisition of computerequipment 31,000 300,000
Acquisition of goodwill 7,132,000 400,000Indefinite- lived intangibleassets 0 0
Impairment loss on goodwill 0 0Contingent consideration withan estimated fair value 900,000
Possible additional cashpayments made 12,000,000
Measurement period forweighted range ofperformance targets, years
4
Acquisition related costs $ 700,000
Copyright © 2013 www.secdatabase.com. All Rights Reserved.Please Consider the Environment Before Printing This Document
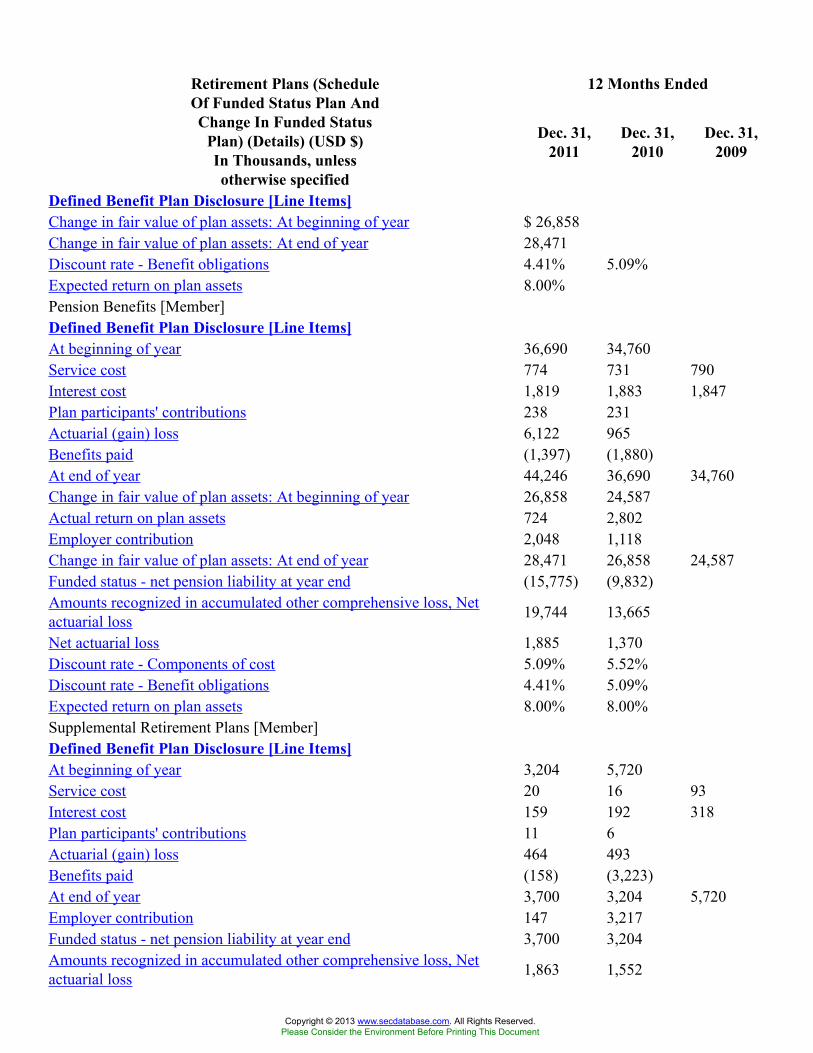
12 Months EndedRetirement Plans (ScheduleOf Funded Status Plan AndChange In Funded Status
Plan) (Details) (USD $)In Thousands, unlessotherwise specified
Dec. 31,2011
Dec. 31,2010
Dec. 31,2009
Defined Benefit Plan Disclosure [Line Items]Change in fair value of plan assets: At beginning of year $ 26,858Change in fair value of plan assets: At end of year 28,471Discount rate - Benefit obligations 4.41% 5.09%Expected return on plan assets 8.00%Pension Benefits [Member]Defined Benefit Plan Disclosure [Line Items]At beginning of year 36,690 34,760Service cost 774 731 790Interest cost 1,819 1,883 1,847Plan participants' contributions 238 231Actuarial (gain) loss 6,122 965Benefits paid (1,397) (1,880)At end of year 44,246 36,690 34,760Change in fair value of plan assets: At beginning of year 26,858 24,587Actual return on plan assets 724 2,802Employer contribution 2,048 1,118Change in fair value of plan assets: At end of year 28,471 26,858 24,587Funded status - net pension liability at year end (15,775) (9,832)Amounts recognized in accumulated other comprehensive loss, Netactuarial loss 19,744 13,665
Net actuarial loss 1,885 1,370Discount rate - Components of cost 5.09% 5.52%Discount rate - Benefit obligations 4.41% 5.09%Expected return on plan assets 8.00% 8.00%Supplemental Retirement Plans [Member]Defined Benefit Plan Disclosure [Line Items]At beginning of year 3,204 5,720Service cost 20 16 93Interest cost 159 192 318Plan participants' contributions 11 6Actuarial (gain) loss 464 493Benefits paid (158) (3,223)At end of year 3,700 3,204 5,720Employer contribution 147 3,217Funded status - net pension liability at year end 3,700 3,204Amounts recognized in accumulated other comprehensive loss, Netactuarial loss 1,863 1,552
Copyright © 2013 www.secdatabase.com. All Rights Reserved.Please Consider the Environment Before Printing This Document
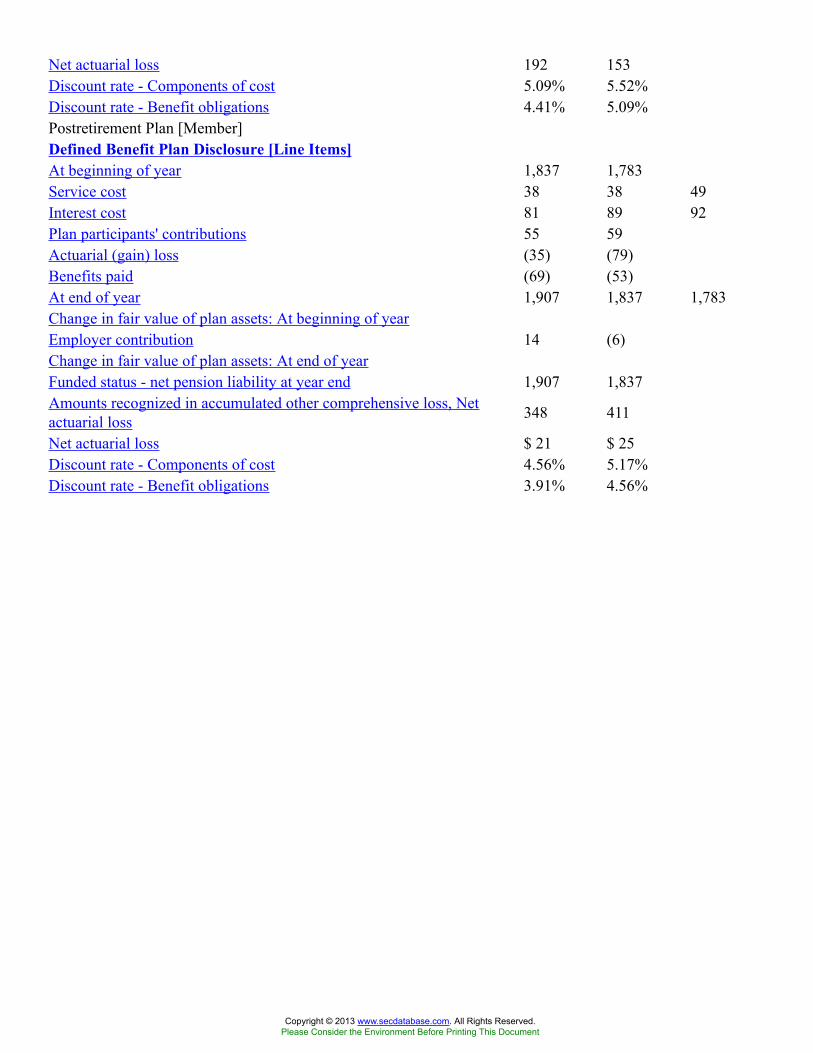
Net actuarial loss 192 153Discount rate - Components of cost 5.09% 5.52%Discount rate - Benefit obligations 4.41% 5.09%Postretirement Plan [Member]Defined Benefit Plan Disclosure [Line Items]At beginning of year 1,837 1,783Service cost 38 38 49Interest cost 81 89 92Plan participants' contributions 55 59Actuarial (gain) loss (35) (79)Benefits paid (69) (53)At end of year 1,907 1,837 1,783Change in fair value of plan assets: At beginning of yearEmployer contribution 14 (6)Change in fair value of plan assets: At end of yearFunded status - net pension liability at year end 1,907 1,837Amounts recognized in accumulated other comprehensive loss, Netactuarial loss 348 411
Net actuarial loss $ 21 $ 25Discount rate - Components of cost 4.56% 5.17%Discount rate - Benefit obligations 3.91% 4.56%
Copyright © 2013 www.secdatabase.com. All Rights Reserved.Please Consider the Environment Before Printing This Document

Prepaids And Other CurrentAssets (Schedule Of PrepaidsAnd Other Current Assets)
(Details) (USD $)In Thousands, unlessotherwise specified
Dec. 31, 2011Dec. 31, 2010
Prepaids And Other Current Assets [Abstract]Prepaid income taxes $ 1,984 $ 5,518Survey participant incentives and prepaid postage 1,770 2,467Insurance recovery receivable 993 601Other 2,394 2,746Prepaids and other current assets $ 7,141 $ 11,332
Copyright © 2013 www.secdatabase.com. All Rights Reserved.Please Consider the Environment Before Printing This Document

12 Months EndedShare-Based Compensation(Schedule Of NonvestedDeferred Stock Units)(Details) (NonvestedDeferred Stock Units
[Member], USD $)
Dec. 31, 2011
Nonvested Deferred Stock Units [Member]Schedule Of Nonvested Deferred Stock Units [Line Items]Outstanding, Shares 32,961Granted, Shares 30,397Vested, Shares (17,212)Nonvested, Shares 46,146Vested at December 31, 2011, shares 65,433Expected to vest, Shares 43,262Outstanding, Weighted-Average Grant-Date Fair Value $ 28.43Granted, Weighted-Average Grant-Date Fair Value $ 39.89Vested, Weighted-Average Grant-Date Fair Value $ 31.46Nonvested, Weighted-Average Grant-Date Fair Value $ 34.85Vested at December 31, 2011, Weighted Average Grant Date Fair Value $ 30.15Expected to vest, Weighted-Average Grant-Date Fair Value $ 34.85
Copyright © 2013 www.secdatabase.com. All Rights Reserved.Please Consider the Environment Before Printing This Document

Property And Equipment(Schedule Of Property AndEquipment) (Details) (USD
$)In Thousands, unlessotherwise specified
Dec. 31, 2011Dec. 31, 2010
Property And Equipment [Abstract]Purchased and internally developed software $ 73,561 $ 62,731Portable People Meter equipment 49,601 45,240Computer equipment 21,776 21,231Leasehold improvements 17,833 17,537Machinery, furniture and fixtures 8,598 9,221Property and equipment, Gross 171,369 155,960Accumulated depreciation and amortization (100,718) (85,628)Property and equipment, net $ 70,651 $ 70,332
Copyright © 2013 www.secdatabase.com. All Rights Reserved.Please Consider the Environment Before Printing This Document

12 Months EndedAccrued Expenses AndOther Current Liabilities
(Tables) Dec. 31, 2011
Accrued Expenses And Other Current Liabilities [Abstract]Schedule Of Accrued Expenses And Other Current Liabilities 2011 2010
Employeecompensation andbenefits $20,585 $15,914
Royalties due toScarborough 5,061 5,996
Dividend payable 2,727 2,697Other 3,903 3,063
$32,276 $27,670
Copyright © 2013 www.secdatabase.com. All Rights Reserved.Please Consider the Environment Before Printing This Document
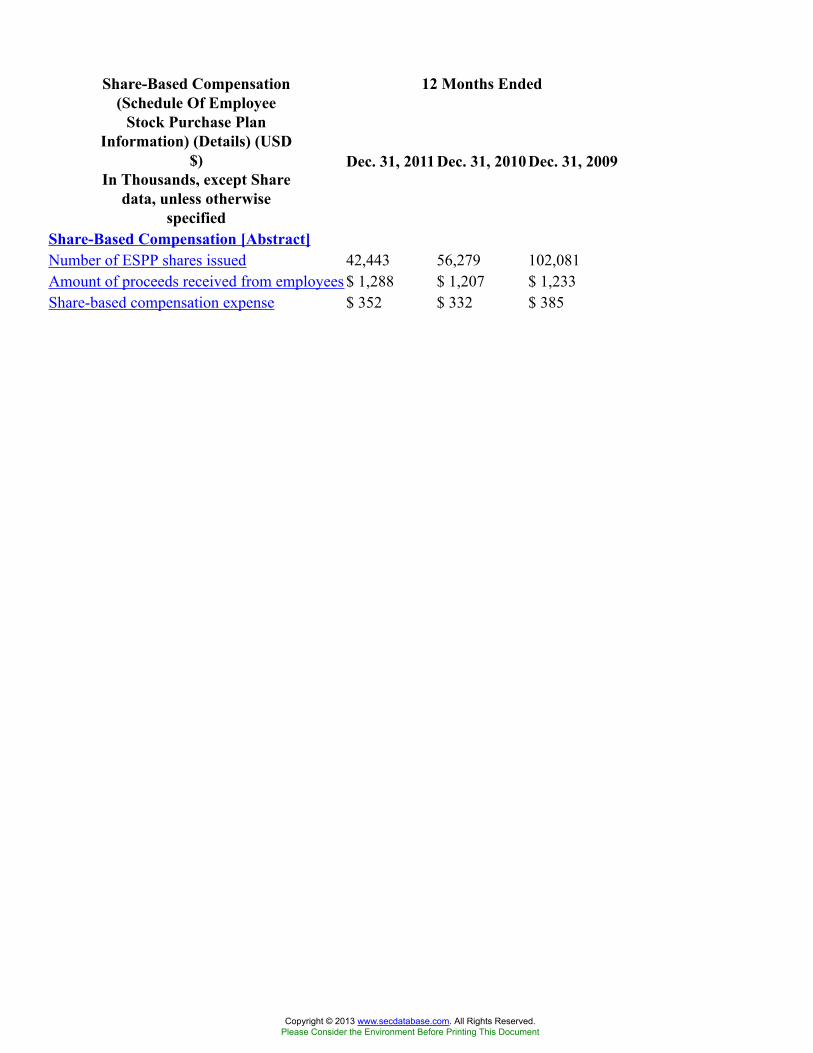
12 Months EndedShare-Based Compensation(Schedule Of Employee
Stock Purchase PlanInformation) (Details) (USD
$)In Thousands, except Share
data, unless otherwisespecified
Dec. 31, 2011Dec. 31, 2010 Dec. 31, 2009
Share-Based Compensation [Abstract]Number of ESPP shares issued 42,443 56,279 102,081Amount of proceeds received from employees $ 1,288 $ 1,207 $ 1,233Share-based compensation expense $ 352 $ 332 $ 385
Copyright © 2013 www.secdatabase.com. All Rights Reserved.Please Consider the Environment Before Printing This Document

12 Months EndedShare-Based Compensation(Schedule Of Assumptions
For Stock Options Granted)(Details) (USD $)
Dec. 31,2011
Dec. 31,2010
Dec. 31,2009
Share-based Compensation, Shares Authorized under Stock Option Plans,Exercise Price Range [Line Items]Expected volatility, minimum 39.64% 35.56% 31.88%Expected volatility, maximum 41.09% 39.89% 35.31%Expected term (in years), minimum 5.66 4.50 5.75Expected term (in years), maximum 5.89 6.50 6.25Risk-free rate, minimum 1.24% 1.73% 2.13%Risk-free rate, maximum 2.76% 3.29% 2.94%Weighted-average volatility 40.45% 37.76% 33.96%Weighted-average dividends 1.04% 1.75% 2.22%Weighted-average term (in years) 5.86 5.43 5.96Weighted-average risk-free rate 1.97% 2.45% 2.47%Weighted-average grant date fair value $ 14.55 $ 7.33 $ 5.31Minimum [Member]Share-based Compensation, Shares Authorized under Stock Option Plans,Exercise Price Range [Line Items]Expected dividends 0.90% 1.50% 1.91%Maximum [Member]Share-based Compensation, Shares Authorized under Stock Option Plans,Exercise Price Range [Line Items]Expected dividends 1.19% 1.80% 2.95%
Copyright © 2013 www.secdatabase.com. All Rights Reserved.Please Consider the Environment Before Printing This Document
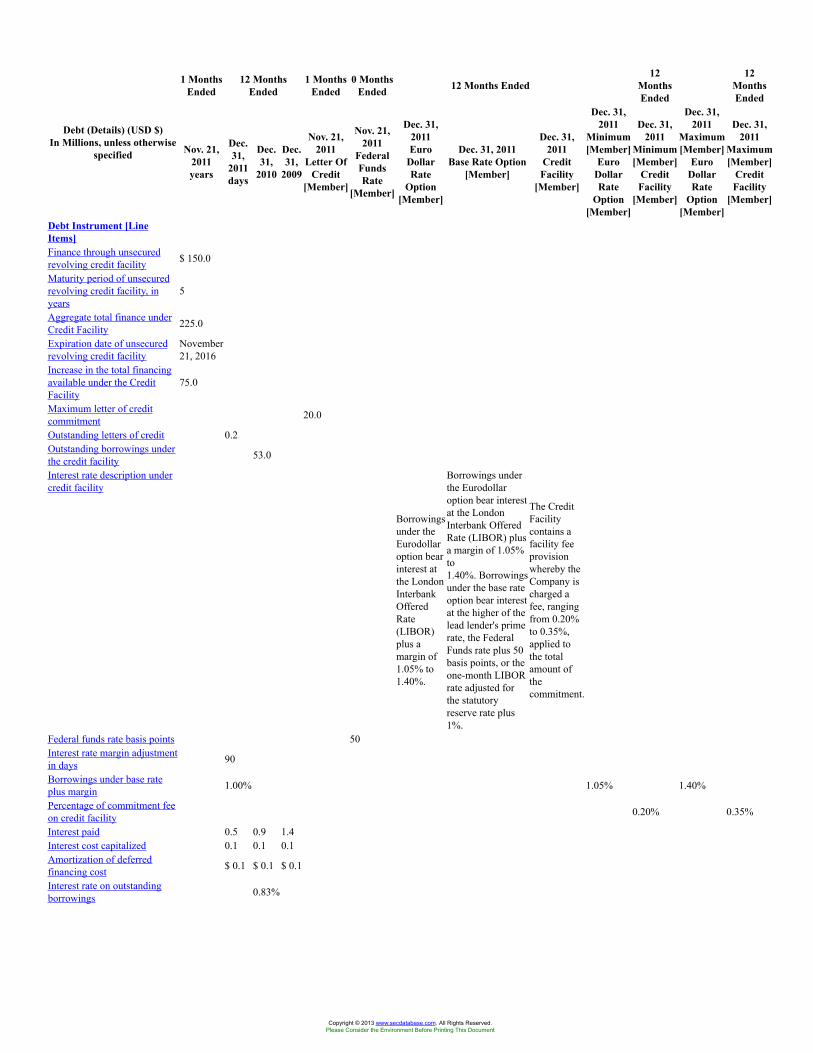
1 MonthsEnded
12 MonthsEnded
1 MonthsEnded
0 MonthsEnded 12 Months Ended
12MonthsEnded
12MonthsEnded
Debt (Details) (USD $)In Millions, unless otherwise
specified Nov. 21,2011years
Dec.31,
2011days
Dec.31,
2010
Dec.31,
2009
Nov. 21,2011
Letter OfCredit
[Member]
Nov. 21,2011
FederalFundsRate
[Member]
Dec. 31,2011Euro
DollarRate
Option[Member]
Dec. 31, 2011Base Rate Option
[Member]
Dec. 31,2011
CreditFacility
[Member]
Dec. 31,2011
Minimum[Member]
EuroDollarRate
Option[Member]
Dec. 31,2011
Minimum[Member]
CreditFacility
[Member]
Dec. 31,2011
Maximum[Member]
EuroDollarRate
Option[Member]
Dec. 31,2011
Maximum[Member]
CreditFacility
[Member]
Debt Instrument [LineItems]Finance through unsecuredrevolving credit facility $ 150.0
Maturity period of unsecuredrevolving credit facility, inyears
5
Aggregate total finance underCredit Facility 225.0
Expiration date of unsecuredrevolving credit facility
November21, 2016
Increase in the total financingavailable under the CreditFacility
75.0
Maximum letter of creditcommitment 20.0
Outstanding letters of credit 0.2Outstanding borrowings underthe credit facility 53.0
Interest rate description undercredit facility
Borrowingsunder theEurodollaroption bearinterest atthe LondonInterbankOfferedRate(LIBOR)plus amargin of1.05% to1.40%.
Borrowings underthe Eurodollaroption bear interestat the LondonInterbank OfferedRate (LIBOR) plusa margin of 1.05%to1.40%. Borrowingsunder the base rateoption bear interestat the higher of thelead lender's primerate, the FederalFunds rate plus 50basis points, or theone-month LIBORrate adjusted forthe statutoryreserve rate plus1%.
The CreditFacilitycontains afacility feeprovisionwhereby theCompany ischarged afee, rangingfrom 0.20%to 0.35%,applied tothe totalamount ofthecommitment.
Federal funds rate basis points 50Interest rate margin adjustmentin days 90
Borrowings under base rateplus margin 1.00% 1.05% 1.40%
Percentage of commitment feeon credit facility 0.20% 0.35%
Interest paid 0.5 0.9 1.4Interest cost capitalized 0.1 0.1 0.1Amortization of deferredfinancing cost $ 0.1 $ 0.1 $ 0.1
Interest rate on outstandingborrowings 0.83%
Copyright © 2013 www.secdatabase.com. All Rights Reserved.Please Consider the Environment Before Printing This Document

12 Months EndedShare-Based Compensation(Schedule Of Service Award
Units) (Details) (USD $) Dec. 31, 2011
Service Award Units [Member]Share-based Compensation Arrangement by Share-based Payment Award [Line Items]Outstanding, Shares 169,203Granted, Shares 18,434Vested, Shares (58,819)Cancellations, Shares (1,581)Nonvested, Shares 127,237Expected to vest, Shares 119,577Outstanding, Weighted-Average Grant-Date Fair Value $ 21.07Granted, Weighted-Average Grant-Date Fair Value $ 42.72Vested, Weighted-Average Grant-Date Fair Value $ 26.99Cancellations, Weighted-Average Grant-Date Fair Value $ 22.46Nonvested, Weighted-Average Grant-Date Fair Value $ 21.45Expected to vest, Weighted-Average Grant-Date Fair Value $ 21.45Chief Executive Officer [Member] | DSU Service Award [Member]Share-based Compensation Arrangement by Share-based Payment Award [Line Items]Outstanding, Shares 60,144Granted, Shares 900Vested, Shares (15,936)Nonvested, Shares 45,108Expected to vest, Shares 45,108Outstanding, Weighted-Average Grant-Date Fair Value $ 24.94Granted, Weighted-Average Grant-Date Fair Value $ 44.44Vested, Weighted-Average Grant-Date Fair Value $ 26.04Nonvested, Weighted-Average Grant-Date Fair Value $ 24.94Expected to vest, Weighted-Average Grant-Date Fair Value $ 24.94
Copyright © 2013 www.secdatabase.com. All Rights Reserved.Please Consider the Environment Before Printing This Document

12 Months EndedFinancial Instruments(Details) (USD $) Dec. 31, 2011 Dec. 31, 2010
TRA investment carrying value $ 1,700,000Investment in TRA's preferred stock using cost method of accounting 1,700,000Impairment charge 3,477,000Revolving obligation under Credit Facility 53,000,000TRA Investment [Member]TRA investment carrying value 1,700,000 5,200,000Investment in TRA's preferred stock using cost method of accounting $ 1,700,000 $ 5,200,000
Copyright © 2013 www.secdatabase.com. All Rights Reserved.Please Consider the Environment Before Printing This Document

12 Months EndedShare-Based Compensation(Schedule Of Performance
Award Units) (Details) (USD$)
Dec. 31, 2011
Performance Award Units [Member]Schedule Of Performance Award Units [Line Items]Outstanding, Shares 78,974Granted, Shares 52,503Vested, Shares (19,765)Cancellations, Shares (2,191)Nonvested, Shares 109,521Expected to vest, Shares 102,928Outstanding, Weighted-Average Grant-Date Fair Value $ 26.33Granted, Weighted-Average Grant-Date Fair Value $ 42.77Vested, Weighted-Average Grant-Date Fair Value $ 26.33Cancellations, Weighted-Average Grant-Date Fair Value $ 35.93Nonvested, Weighted-Average Grant-Date Fair Value $ 34.29Expected to vest, Weighted-Average Grant-Date Fair Value $ 34.29Chief Executive Officer [Member] | DSU Performance Award [Member]Schedule Of Performance Award Units [Line Items]Outstanding, Shares 23,004Granted, Shares 24,122Vested, Shares (5,751)Nonvested, Shares 41,375Expected to vest, Shares 41,375Outstanding, Weighted-Average Grant-Date Fair Value $ 22.17Granted, Weighted-Average Grant-Date Fair Value $ 44.44Vested, Weighted-Average Grant-Date Fair Value $ 22.17Nonvested, Weighted-Average Grant-Date Fair Value $ 35.15Expected to vest, Weighted-Average Grant-Date Fair Value $ 35.15
Copyright © 2013 www.secdatabase.com. All Rights Reserved.Please Consider the Environment Before Printing This Document

12 Months EndedShare-Based Compensation(Narrative) (Details) (USD $)
In Millions, except Sharedata, unless otherwise
specified
Dec. 31, 2011 Dec. 31,2010
Dec. 31,2009
Share-based Compensation Arrangement by Share-basedPayment Award [Line Items]Income tax benefit recognized for share-based compensationarrangements $ 3.2 $ 2.5 $ 3.9
Capitalized share-based compensation cost 0 0 0Increase (decrease) in net excess tax benefits realized 0.9 0.1 (1.8)Weighted-average period for which cost is expected to berecognized, in years 1.93
2008 Equity Compensation Plan [Member]Share-based Compensation Arrangement by Share-basedPayment Award [Line Items]Number of shares available for future grants 2,965,033Expiration date of shares available for future grant May 25, 2020Stock Options [Member]Share-based Compensation Arrangement by Share-basedPayment Award [Line Items]Share-based compensation options awarded, vesting period over a three-year periodStock options term in years 10Total unrecognized compensation cost related to grants 2.4Weighted-average period for which cost is expected to berecognized, in years 1.9
Service Award Units [Member]Share-based Compensation Arrangement by Share-basedPayment Award [Line Items]Share-based compensation options awarded, vesting period vest in four equal annual
installmentsTotal unrecognized compensation cost related to grants 2.0Total fair value of share awards vested 2.6 2.3 2.0Performance Award Units [Member]Share-based Compensation Arrangement by Share-basedPayment Award [Line Items]Share-based compensation options awarded, vesting period vest in four equal annual
installmentsTotal unrecognized compensation cost related to grants 2.0Weighted-average period for which cost is expected to berecognized, in years 3.04
Total fair value of share awards vested 0.8Maximum percentage to return on invested capital for annualperformance period 12.00%
DSU Service Award [Member]
Copyright © 2013 www.secdatabase.com. All Rights Reserved.Please Consider the Environment Before Printing This Document

Share-based Compensation Arrangement by Share-basedPayment Award [Line Items]Share-based compensation options awarded, vesting period over a four-year periodTotal unrecognized compensation cost related to grants 0.1Weighted-average period for which cost is expected to berecognized, in years 0.03
Total fair value of share awards vested 0.7DSU Performance Award [Member]Share-based Compensation Arrangement by Share-basedPayment Award [Line Items]Share-based compensation options awarded, vesting period vest in four equal annual
installmentsTotal unrecognized compensation cost related to grants 0.5Weighted-average period for which cost is expected to berecognized, in years 1.02
Total fair value of share awards vested 0.2Maximum percentage to return on invested capital for annualperformance period 12.00%
Nonvested Deferred Stock Units [Member]Share-based Compensation Arrangement by Share-basedPayment Award [Line Items]Total unrecognized compensation cost related to grants 1.2Weighted-average period for which cost is expected to berecognized, in years 2.07
Total fair value of share awards vested $ 0.7 $ 0.2 $ 1.4Employee Stock Purchase Plan [Member]Share-based Compensation Arrangement by Share-basedPayment Award [Line Items]Percentage of lesser of fair market value the applicable three-month offering period 85.00%
Maximum New Limit [Member] | Employee Stock Purchase Plan[Member]Share-based Compensation Arrangement by Share-basedPayment Award [Line Items]Number of shares of company common stock available forissuance 333,603
Copyright © 2013 www.secdatabase.com. All Rights Reserved.Please Consider the Environment Before Printing This Document
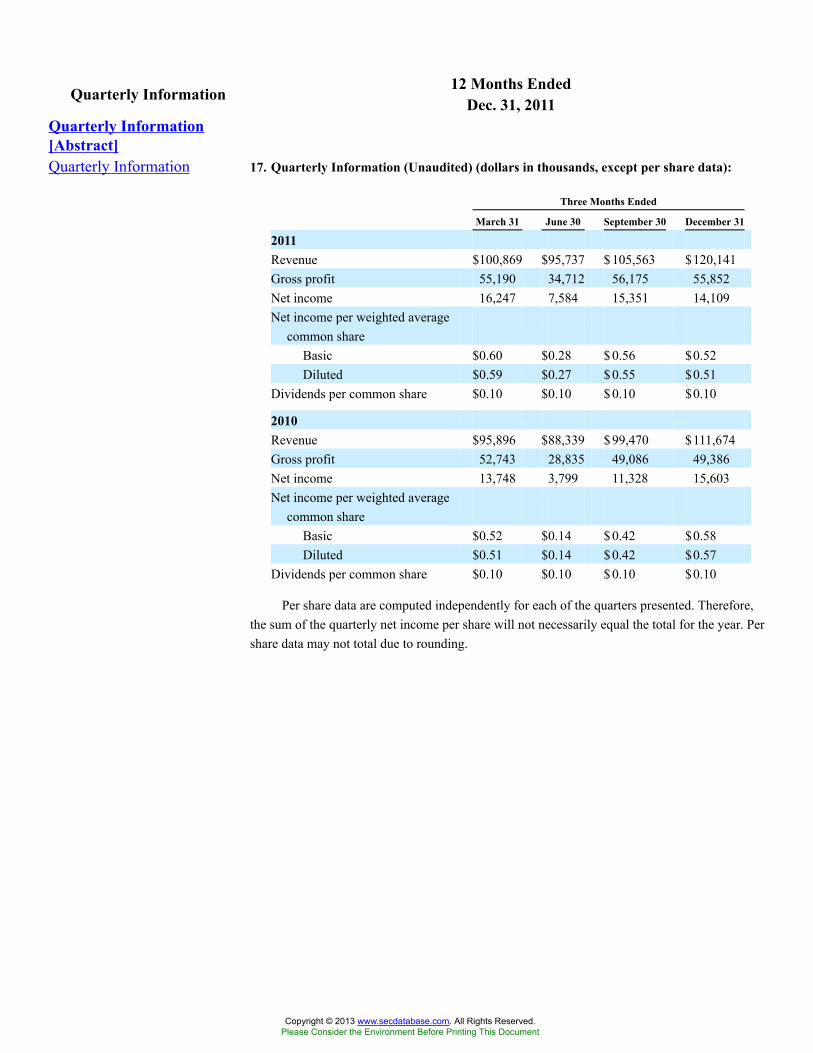
12 Months EndedQuarterly Information Dec. 31, 2011Quarterly Information[Abstract]Quarterly Information 17. Quarterly Information (Unaudited) (dollars in thousands, except per share data):
Three Months Ended
March 31 June 30 September 30 December 31
2011Revenue $100,869 $95,737 $ 105,563 $120,141Gross profit 55,190 34,712 56,175 55,852Net income 16,247 7,584 15,351 14,109Net income per weighted average
common shareBasic $0.60 $0.28 $ 0.56 $0.52Diluted $0.59 $0.27 $ 0.55 $0.51
Dividends per common share $0.10 $0.10 $ 0.10 $0.10
2010Revenue $95,896 $88,339 $ 99,470 $111,674Gross profit 52,743 28,835 49,086 49,386Net income 13,748 3,799 11,328 15,603Net income per weighted average
common shareBasic $0.52 $0.14 $ 0.42 $0.58Diluted $0.51 $0.14 $ 0.42 $0.57
Dividends per common share $0.10 $0.10 $ 0.10 $0.10
Per share data are computed independently for each of the quarters presented. Therefore,the sum of the quarterly net income per share will not necessarily equal the total for the year. Pershare data may not total due to rounding.
Copyright © 2013 www.secdatabase.com. All Rights Reserved.Please Consider the Environment Before Printing This Document
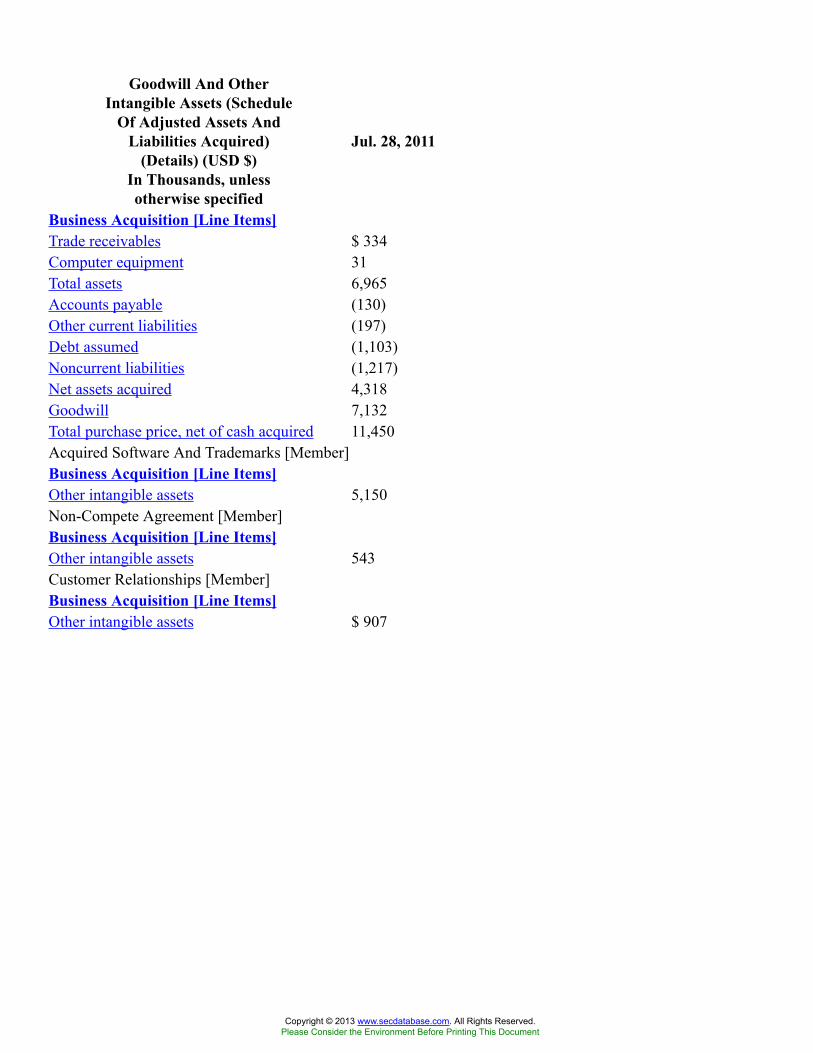
Goodwill And OtherIntangible Assets (Schedule
Of Adjusted Assets AndLiabilities Acquired)
(Details) (USD $)In Thousands, unlessotherwise specified
Jul. 28, 2011
Business Acquisition [Line Items]Trade receivables $ 334Computer equipment 31Total assets 6,965Accounts payable (130)Other current liabilities (197)Debt assumed (1,103)Noncurrent liabilities (1,217)Net assets acquired 4,318Goodwill 7,132Total purchase price, net of cash acquired 11,450Acquired Software And Trademarks [Member]Business Acquisition [Line Items]Other intangible assets 5,150Non-Compete Agreement [Member]Business Acquisition [Line Items]Other intangible assets 543Customer Relationships [Member]Business Acquisition [Line Items]Other intangible assets $ 907
Copyright © 2013 www.secdatabase.com. All Rights Reserved.Please Consider the Environment Before Printing This Document

12 Months EndedSummary Of SignificantAccounting Policies
(Schedule Of Useful Lives OfProperty And Equipment)
(Details)
Dec. 31, 2011years
Computer Equipment [Member]Property, Plant and Equipment [Line Items]Estimated useful life of assets, years 3Purchased And Internally Developed Software [Member]Property, Plant and Equipment [Line Items]Estimated useful life of assets, Minimum, years 3Estimated useful life of assets, Maximum, years 5Leasehold Improvements [Member]Property, Plant and Equipment [Line Items]Estimated useful life of assets, description Shorter of useful life or life of leaseMachinery, Furniture And Fixtures [Member]Property, Plant and Equipment [Line Items]Estimated useful life of assets, Minimum, years 3Estimated useful life of assets, Maximum, years 6
Copyright © 2013 www.secdatabase.com. All Rights Reserved.Please Consider the Environment Before Printing This Document

12 Months EndedShare-Based Compensation(Schedule Of Information
Related To OptionsExercised) (Details) (USD $)
In Thousands, unlessotherwise specified
Dec. 31, 2011Dec. 31, 2010 Dec. 31, 2009
Intrinsic value of stock options exercised $ 2,269 $ 3,725 $ 3Stock Options [Member]Cash received from stock options exercised $ 2,336 $ 6,076 $ 68
Copyright © 2013 www.secdatabase.com. All Rights Reserved.Please Consider the Environment Before Printing This Document

12 Months EndedRetirement Plans (Tables) Dec. 31, 2011 Dec. 31, 2010Defined Benefit PlanDisclosure [Line Items]Fair Value Of Pension PlanAssets By Asset Category
As of December 31, 2011
Total
Fair
Value
Quoted
prices in
active
markets
Level 1
Significant
observable
inputs
Level 2
Significant
unobservable
inputs
Level 3
Asset CategoryCollective
investmentfunds
Fixedincome(a) $11,062 $ — $11,062 $ —
U.S.equitygrowth 6,945 — 6,945 —
U.S.equityvalue 6,952 — 6,952 —
Foreignequity 2,810 — 2,810 —
Money marketfund 702 702 — —
Pension assets atDecember 31,2011 $28,471 $ 702 $27,769 $ —
(a)As of December 31, 2011, the fixed income fund consistedof a 34% investment in asset and mortgage-backedsecurities, a 41% investment in U.S. treasury securities,and a 25% investment in corporate bonds.
As of December 31, 2010
Total
Fair
Value
Quoted
prices in
active
markets
Level 1
Significant
observable
inputs
Level 2
Significant
unobservable
inputs
Level 3
Asset CategoryCollective
investmentfunds
Fixedincome(b) $10,626 $ — $10,626 $ —
U.S.equitygrowth 6,607 — 6,607 —
U.S.equityvalue 6,622 — 6,622 —
Foreignequity 2,658 — 2,658 —
Money marketfund 345 345 — —
Pension assets atDecember 31,2010 $26,858 $ 345 $26,513 $ —
(b)As of December 31, 2010, the fixed income fund consistedof a 35% investment in asset and mortgage-backedsecurities, a 41% investment in U.S. treasury securities,and a 24% investment in corporate bonds.
Schedule Of Impacted IncomeStatement Line Items By TheRecognition Of RetirementPlan Settlement Charges
2010 2009
Cost of revenue $— $—Selling, general, and
administrative 1,222 —Research and development — —Restructuring and
reorganization — 1,803Total costs and expenses $1,222 $1,803
Pension Benefits [Member]Defined Benefit PlanDisclosure [Line Items]Components Of Net PeriodicCost And OtherComprehensive Loss (Income)
2011 2010 2009
Net periodic costService cost of
benefits $774 $731 $790Interest cost 1,819 1,883 1,847Expected return on
plan assets (2,051) (2,118) (2,172)Amortization of net
actuarial loss 1,370 1,052 992
Copyright © 2013 www.secdatabase.com. All Rights Reserved.Please Consider the Environment Before Printing This Document

Amortization ofprior service cost — — 22
Total $1,912 $1,548 $1,479
Other changes inplan assets andprojected benefitobligationrecognized inothercomprehensiveloss (income)
Net actuarial loss(gain) arising thisyear 7,449 281 (2,295)
Actuarial losscharged toexpense due tosettlement — — (1,521)
Net actuarial lossamortized thisyear (1,370) (1,052) (992 )
Prior service costamortized thisyear — — (22 )
Recognized in othercomprehensiveloss (income) 6,079 (771 ) (4,830)
Recognized in netperiodic pensioncost and othercomprehensiveloss (income) $7,991 $777 $(3,351)
Schedule Of Expected BenefitPayments
2012 $2,0532013 $2,1922014 $2,1442015 $2,1272016 $2,7902017 - 2021 $13,973
Schedule Of Funded StatusPlan And Change In FundedStatus Plan
Pension Plan
2011 2010
Change inprojected benefitobligation
At beginning of year $36,690 $34,760Service cost 774 731Interest cost 1,819 1,883Plan participants'
contributions 238 231Actuarial loss 6,122 965Benefits paid (1,397 ) (1,880 )At end of year $44,246 $36,690
Change in fairvalue of planassets
At beginning of year $26,858 $24,587
Copyright © 2013 www.secdatabase.com. All Rights Reserved.Please Consider the Environment Before Printing This Document
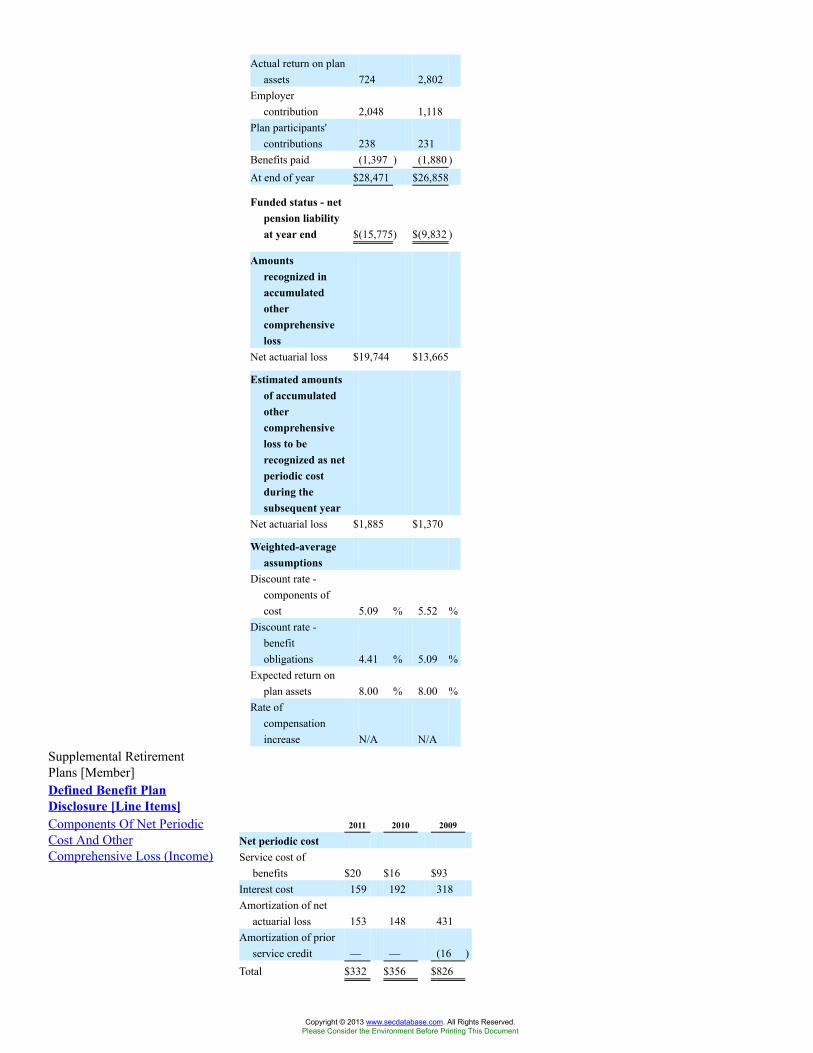
Actual return on planassets 724 2,802
Employercontribution 2,048 1,118
Plan participants'contributions 238 231
Benefits paid (1,397 ) (1,880 )At end of year $28,471 $26,858
Funded status - netpension liabilityat year end $(15,775) $(9,832 )
Amountsrecognized inaccumulatedothercomprehensiveloss
Net actuarial loss $19,744 $13,665
Estimated amountsof accumulatedothercomprehensiveloss to berecognized as netperiodic costduring thesubsequent year
Net actuarial loss $1,885 $1,370
Weighted-averageassumptions
Discount rate -components ofcost 5.09 % 5.52 %
Discount rate -benefitobligations 4.41 % 5.09 %
Expected return onplan assets 8.00 % 8.00 %
Rate ofcompensationincrease N/A N/A
Supplemental RetirementPlans [Member]Defined Benefit PlanDisclosure [Line Items]Components Of Net PeriodicCost And OtherComprehensive Loss (Income)
2011 2010 2009
Net periodic costService cost of
benefits $20 $16 $93Interest cost 159 192 318Amortization of net
actuarial loss 153 148 431Amortization of prior
service credit — — (16 )Total $332 $356 $826
Copyright © 2013 www.secdatabase.com. All Rights Reserved.Please Consider the Environment Before Printing This Document

Other changes inplan assets andprojected benefitobligationrecognized inothercomprehensiveloss (income)
Net actuarial loss(gain) arising thisyear $464 $493 $(1,104)
Net actuarial lossamortized thisyear (153) (148 ) (431 )
Actuarial loss due tosettlement — (1,222) (267 )
Prior service creditdue to curtailment — — 6
Prior service creditamortized thisyear — — 16
Recognized in othercomprehensiveloss (income) $311 $(877 ) $(1,780)
Recognized in netperiodic cost andothercomprehensiveloss (income) $643 $(521 ) $(954 )
Schedule Of Funded StatusPlan And Change In FundedStatus Plan
Supplemental Plans
2011 2010
Change in projectedbenefit obligation
At beginning of year $3,204 $5,720Service cost 20 16Interest cost 159 192Plan participants'
contributions 11 6Actuarial loss 464 493Benefits paid (158 ) (3,223)At end of year $3,700 $3,204
Change in fair valueof plan assets
At beginning of year — —Actual return on plan
assets — —Employer contribution 147 3,217Plan participants'
contributions 11 6Benefits paid (158 ) (3,223)At end of year $— $—
Funded status - netliability at yearend $3,700 $3,204
Copyright © 2013 www.secdatabase.com. All Rights Reserved.Please Consider the Environment Before Printing This Document

Amounts recognizedin accumulatedothercomprehensiveloss
Net actuarial loss $1,863 $1,552
Estimated amountsof accumulatedothercomprehensiveloss to berecognized as netperiodic costduring thesubsequent year
Net actuarial loss $192 $153
Weighted-averageassumptions
Discount rateComponents of
cost 5.09 % 5.52 %Benefit
obligations 4.41 % 5.09 %Expected return on
plan assets N/A N/ARate of compensation
increase N/A N/APostretirement Plan [Member]Defined Benefit PlanDisclosure [Line Items]Components Of Net PeriodicCost And OtherComprehensive Loss (Income)
2011 2010 2009
Net periodic costService cost of benefits $38 $38 $49Interest cost 81 89 92Amortization of net
actuarial loss 28 36 43Total $147 $163 $184
Other changes in planassets and projectedbenefit obligationrecognized in othercomprehensive loss(income)
Net actuarial loss (gain)arising this year $(35 ) $(79 ) $(41 )
Net actuarial lossamortized this year (28 ) (36 ) (43 )
Recognized in othercomprehensive loss(income) $(63 ) $(115) $(84 )
Recognized in net periodiccost and othercomprehensive loss(income) $84 $48 $100
Schedule Of Expected BenefitPayments
2012 $1202013 $128
Copyright © 2013 www.secdatabase.com. All Rights Reserved.Please Consider the Environment Before Printing This Document

2014 $1462015 $1572016 $1392017-2021 $763
Schedule Of Funded StatusPlan And Change In FundedStatus Plan
Postretirement Plan
2011 2010
Change in projectedbenefit obligation
At beginning of year $1,837 $1,783Service cost 38 38Interest cost 81 89Plan participants'
contributions 55 59Actuarial gain (35 ) (79 )Benefits paid (69 ) (53 )At end of year $1,907 $1,837
Change in fair value ofplan assets
At beginning of year $— $—Employer contribution 14 (6 )Plan participants'
contributions 55 59Benefits paid (69 ) (53 )At end of year $— $—
Funded status - netliability at year end $1,907 $1,837
Amounts recognizedin accumulatedothercomprehensive loss
Net actuarial loss $348 $411
Estimated amounts ofaccumulated othercomprehensive lossto be recognized asnet periodic costduring thesubsequent year
Net actuarial loss $21 $25
Weighted-averageassumptions
Discount rateComponents of
cost 4.56 % 5.17 %Benefit
obligations 3.91 % 4.56 %Expected return on plan
assets N/A N/ARate of compensation
increase N/A N/ABenefit Equalization Plan[Member]Defined Benefit PlanDisclosure [Line Items]
Copyright © 2013 www.secdatabase.com. All Rights Reserved.Please Consider the Environment Before Printing This Document

Schedule Of Expected BenefitPayments
2012 $1612013 $1612014 $1612015 $1912016 $1922017 - 2021 $966
Copyright © 2013 www.secdatabase.com. All Rights Reserved.Please Consider the Environment Before Printing This Document

12 Months EndedGoodwill And OtherIntangible Assets (ScheduleOf Amortization Expense
For Other Intangibles)(Details) (USD $)
In Thousands, unlessotherwise specified
Dec. 31, 2011Dec. 31, 2010 Dec. 31, 2009
Goodwill And Other Intangible Assets [Abstract]Amortization expense for other intangibles $ 1,713 $ 822 $ 141
Copyright © 2013 www.secdatabase.com. All Rights Reserved.Please Consider the Environment Before Printing This Document

12 Months EndedRetirement Plans (Fair ValueOf Pension Plan Assets ByAsset Category) (Details)
(USD $)In Thousands, unlessotherwise specified
Dec. 31,2011
Dec. 31,2010
Defined Benefit Plan Disclosure [Line Items]Pension plan assets 28,471 26,858Fixed Income [Member]Defined Benefit Plan Disclosure [Line Items]Pension plan assets 11,062 [1] 10,626 [2]
U.S. Equity Growth [Member]Defined Benefit Plan Disclosure [Line Items]Pension plan assets 6,945 6,607U.S. Equity Value [Member]Defined Benefit Plan Disclosure [Line Items]Pension plan assets 6,952 6,622Foreign Equity [Member]Defined Benefit Plan Disclosure [Line Items]Pension plan assets 2,810 2,658Money Market Fund [Member]Defined Benefit Plan Disclosure [Line Items]Pension plan assets 702 345Quoted Prices In Active Markets Level 1 [Member]Defined Benefit Plan Disclosure [Line Items]Pension plan assets 702 345Quoted Prices In Active Markets Level 1 [Member] | Money Market Fund[Member]Defined Benefit Plan Disclosure [Line Items]Pension plan assets 702 345Significant Observable Inputs Level 2 [Member]Defined Benefit Plan Disclosure [Line Items]Pension plan assets 27,769 26,513Significant Observable Inputs Level 2 [Member] | Fixed Income [Member]Defined Benefit Plan Disclosure [Line Items]Pension plan assets 11,062 [1] 10,626 [2]
Significant Observable Inputs Level 2 [Member] | U.S. Equity Growth [Member]Defined Benefit Plan Disclosure [Line Items]Pension plan assets 6,945 6,607Significant Observable Inputs Level 2 [Member] | U.S. Equity Value [Member]Defined Benefit Plan Disclosure [Line Items]Pension plan assets 6,952 6,622Significant Observable Inputs Level 2 [Member] | Foreign Equity [Member]
Copyright © 2013 www.secdatabase.com. All Rights Reserved.Please Consider the Environment Before Printing This Document

Defined Benefit Plan Disclosure [Line Items]Pension plan assets 2,810 2,658Significant Unobservable Inputs Level 3 [Member]Defined Benefit Plan Disclosure [Line Items]Pension plan assetsSignificant Unobservable Inputs Level 3 [Member] | Fixed Income [Member]Defined Benefit Plan Disclosure [Line Items]Pension plan assets [2]
Significant Unobservable Inputs Level 3 [Member] | U.S. Equity Growth [Member]Defined Benefit Plan Disclosure [Line Items]Pension plan assetsSignificant Unobservable Inputs Level 3 [Member] | U.S. Equity Value [Member]Defined Benefit Plan Disclosure [Line Items]Pension plan assetsSignificant Unobservable Inputs Level 3 [Member] | Foreign Equity [Member]Defined Benefit Plan Disclosure [Line Items]Pension plan assetsSignificant Unobservable Inputs Level 3 [Member] | Money Market Fund [Member]Defined Benefit Plan Disclosure [Line Items]Pension plan assetsU.S. Treasury Securities [Member]Defined Benefit Plan Disclosure [Line Items]Percentage of fixed income fund in asset and other securities 41.00% 41.00%Corporate Bonds [Member]Defined Benefit Plan Disclosure [Line Items]Percentage of fixed income fund in asset and other securities 25.00% 24.00%Asset And Mortgage-Backed Securities [Member]Defined Benefit Plan Disclosure [Line Items]Percentage of fixed income fund in asset and other securities 34.00%Mortgage-Backed Securities [Member]Defined Benefit Plan Disclosure [Line Items]Percentage of fixed income fund in asset and other securities 35.00%[1] As of December 31, 2011, the fixed income fund consisted of a 34% investment in asset and mortgage-
backed securities, a 41% investment in U.S. treasury securities, and a 25% investment in corporate bonds.[2] As of December 31, 2010, the fixed income fund consisted of a 35% investment in asset and mortgage-
backed securities, a 41% investment in U.S. treasury securities, and a 24% investment in corporate bonds.
Copyright © 2013 www.secdatabase.com. All Rights Reserved.Please Consider the Environment Before Printing This Document
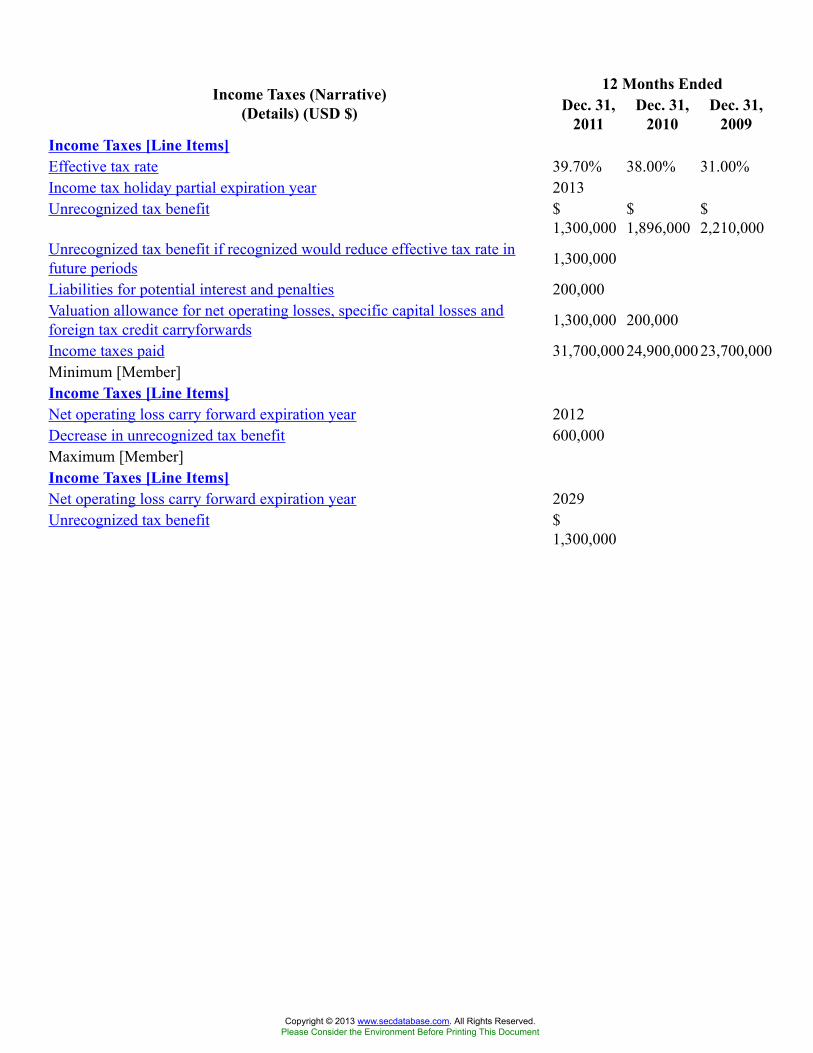
12 Months EndedIncome Taxes (Narrative)(Details) (USD $) Dec. 31,
2011Dec. 31,
2010Dec. 31,
2009Income Taxes [Line Items]Effective tax rate 39.70% 38.00% 31.00%Income tax holiday partial expiration year 2013Unrecognized tax benefit $
1,300,000$1,896,000
$2,210,000
Unrecognized tax benefit if recognized would reduce effective tax rate infuture periods 1,300,000
Liabilities for potential interest and penalties 200,000Valuation allowance for net operating losses, specific capital losses andforeign tax credit carryforwards 1,300,000 200,000
Income taxes paid 31,700,00024,900,00023,700,000Minimum [Member]Income Taxes [Line Items]Net operating loss carry forward expiration year 2012Decrease in unrecognized tax benefit 600,000Maximum [Member]Income Taxes [Line Items]Net operating loss carry forward expiration year 2029Unrecognized tax benefit $
1,300,000
Copyright © 2013 www.secdatabase.com. All Rights Reserved.Please Consider the Environment Before Printing This Document

12 Months EndedProperty And Equipment(Schedule Of Property And
Equipment AdditionalInformation) (Details) (USD
$)In Thousands, unlessotherwise specified
Dec. 31, 2011Dec. 31, 2010 Dec. 31, 2009
Property, Plant and Equipment [Line Items]Total depreciation and amortization expense $ 28,542 $ 26,686 $ 23,228Impairment charges associated with property and equipment 162 628Loss on asset disposals 1,961 2,383 2,088Interest capitalized during the year 39 34 52Cost Of Revenue [Member]Property, Plant and Equipment [Line Items]Total depreciation and amortization expense 26,319 24,778 20,702Selling, General, And Administrative [Member]Property, Plant and Equipment [Line Items]Total depreciation and amortization expense 1,748 1,628 2,207Research And Development [Member]Property, Plant and Equipment [Line Items]Total depreciation and amortization expense $ 475 $ 280 $ 319
Copyright © 2013 www.secdatabase.com. All Rights Reserved.Please Consider the Environment Before Printing This Document
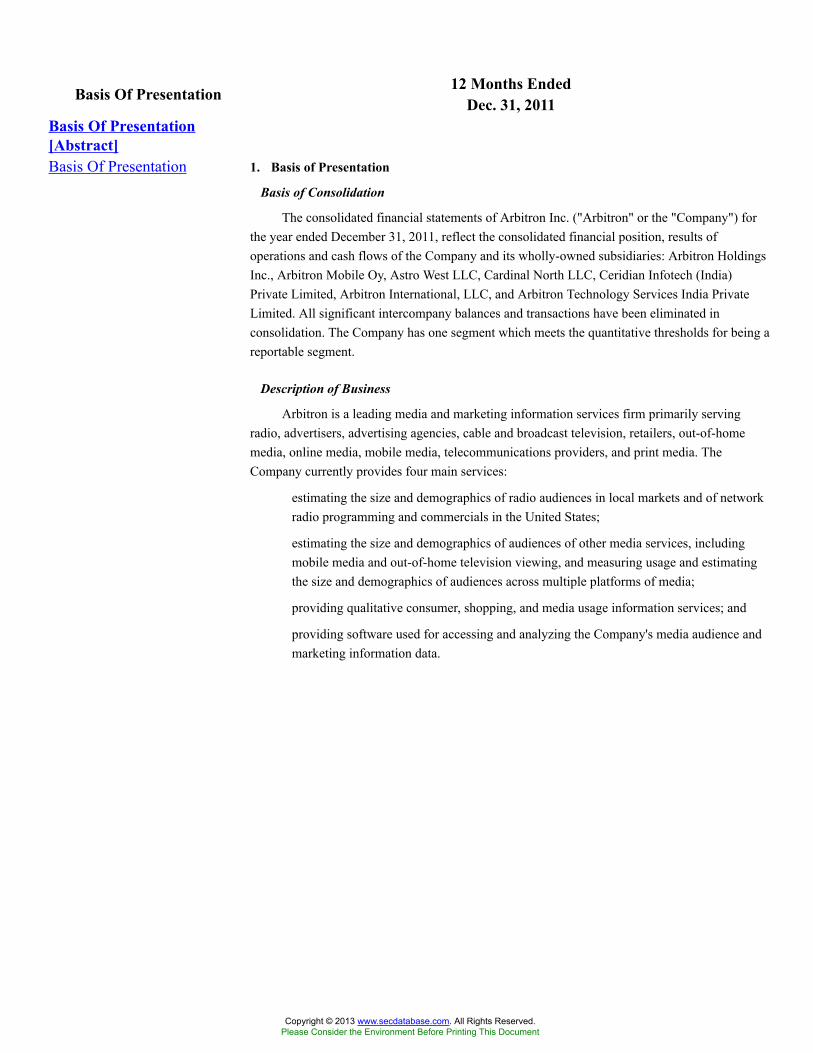
12 Months EndedBasis Of Presentation Dec. 31, 2011Basis Of Presentation[Abstract]Basis Of Presentation 1. Basis of Presentation
Basis of Consolidation
The consolidated financial statements of Arbitron Inc. ("Arbitron" or the "Company") forthe year ended December 31, 2011, reflect the consolidated financial position, results ofoperations and cash flows of the Company and its wholly-owned subsidiaries: Arbitron HoldingsInc., Arbitron Mobile Oy, Astro West LLC, Cardinal North LLC, Ceridian Infotech (India)Private Limited, Arbitron International, LLC, and Arbitron Technology Services India PrivateLimited. All significant intercompany balances and transactions have been eliminated inconsolidation. The Company has one segment which meets the quantitative thresholds for being areportable segment.
Description of Business
Arbitron is a leading media and marketing information services firm primarily servingradio, advertisers, advertising agencies, cable and broadcast television, retailers, out-of-homemedia, online media, mobile media, telecommunications providers, and print media. TheCompany currently provides four main services:
� estimating the size and demographics of radio audiences in local markets and of networkradio programming and commercials in the United States;
� estimating the size and demographics of audiences of other media services, includingmobile media and out-of-home television viewing, and measuring usage and estimatingthe size and demographics of audiences across multiple platforms of media;
� providing qualitative consumer, shopping, and media usage information services; and
� providing software used for accessing and analyzing the Company's media audience andmarketing information data.
Copyright © 2013 www.secdatabase.com. All Rights Reserved.Please Consider the Environment Before Printing This Document

12 Months EndedIncome Taxes (ComponentsOf Income Before Income
Tax Expense And AReconciliation Of The
Statutory Federal IncomeTax Rate To The Income Tax
Rate) (Details) (USD $)In Thousands, unlessotherwise specified
Dec. 31, 2011Dec. 31, 2010 Dec. 31, 2009
Income Taxes [Abstract]U.S. $ 89,188 $ 70,657 $ 59,853International (841) 1,115 1,279Income before income tax expense 88,347 71,772 61,132Current, U.S. 32,871 18,706 18,464Current, State, local and foreign 3,892 2,441 2,198Current, Total 36,763 21,147 20,662Deferred, U.S. (3,783) 3,700 1,310Deferred, State, local and foreign 2,076 2,447 (3,000)Deferred, Total (1,707) 6,147 (1,690)Income tax expense (benefit) 35,056 27,294 18,972U.S. statutory rate 35.00% 35.00% 35.00%Income tax expense at U.S. statutory rate 30,921 25,120 21,396State income taxes, net of federal benefit 3,452 2,834 2,904Meals and entertainment 198 187 199Change in valuation allowance for foreign tax credit and capital loss 1,099 (169)State NOL's recognized (4,801)Adjustments to tax liabilities (279) 202 207Other $ (335) $ (880) $ (933)Effective tax rate 39.70% 38.00% 31.00%
Copyright © 2013 www.secdatabase.com. All Rights Reserved.Please Consider the Environment Before Printing This Document
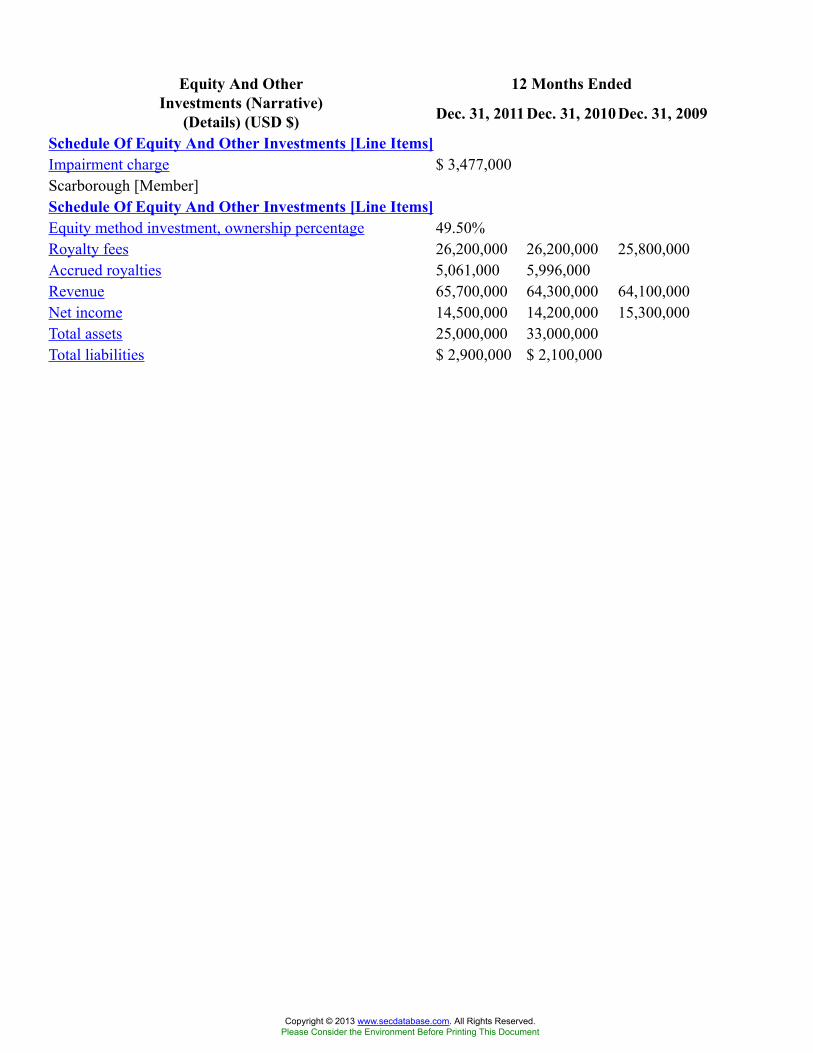
12 Months EndedEquity And OtherInvestments (Narrative)
(Details) (USD $) Dec. 31, 2011Dec. 31, 2010 Dec. 31, 2009
Schedule Of Equity And Other Investments [Line Items]Impairment charge $ 3,477,000Scarborough [Member]Schedule Of Equity And Other Investments [Line Items]Equity method investment, ownership percentage 49.50%Royalty fees 26,200,000 26,200,000 25,800,000Accrued royalties 5,061,000 5,996,000Revenue 65,700,000 64,300,000 64,100,000Net income 14,500,000 14,200,000 15,300,000Total assets 25,000,000 33,000,000Total liabilities $ 2,900,000 $ 2,100,000
Copyright © 2013 www.secdatabase.com. All Rights Reserved.Please Consider the Environment Before Printing This Document

12 Months EndedEquity And OtherInvestments (Tables) Dec. 31, 2011
Equity And OtherInvestments [Abstract]Schedule Of Equity And OtherInvestments
December 31,
2011
December 31,
2010
Scarborough $ 13,210 $ 13,205TRA preferred stock 1,703 5,180Equity and other investments $ 14,913 $ 18,385
Equity And Other Investments[Text Block]
Year Ended December 31, 2011 Year Ended December 31, 2010 Year Ended December 31, 2009
Scarborough TRA Total Scarborough TRA Total Scarborough TRA Total
Beginningbalance $ 13,205 $5,180 $18,385 $ 13,538 $3,400 $16,938 $ 14,901 — $14,901
Equity in netincome 7,255 — 7,255 7,092 — 7,092 7,637 — 7,637
Impairmentloss — (3,477) (3,477 ) — — — — — —
Distributions (7,250 ) — (7,250 ) (7,425 ) — (7,425 ) (9,000 ) — (9,000 )Cash
investments — — — — 1,780 1,780 — 3,400 3,400Ending balance $ 13,210 $1,703 $14,913 $ 13,205 $5,180 $18,385 $ 13,538 $3,400 $16,938
Copyright © 2013 www.secdatabase.com. All Rights Reserved.Please Consider the Environment Before Printing This Document

12 Months EndedSummary Of SignificantAccounting Policies (Tables) Dec. 31, 2011
Summary Of Significant Accounting Policies[Abstract]Schedule Of Useful Lives Of Property AndEquipment
Computerequipment 3 years
Purchased andinternallydevelopedsoftware 3 – 5 years
Leaseholdimprovements Shorter of useful life or life of lease
Machinery,furniture andfixtures 3 – 6 years
Copyright © 2013 www.secdatabase.com. All Rights Reserved.Please Consider the Environment Before Printing This Document
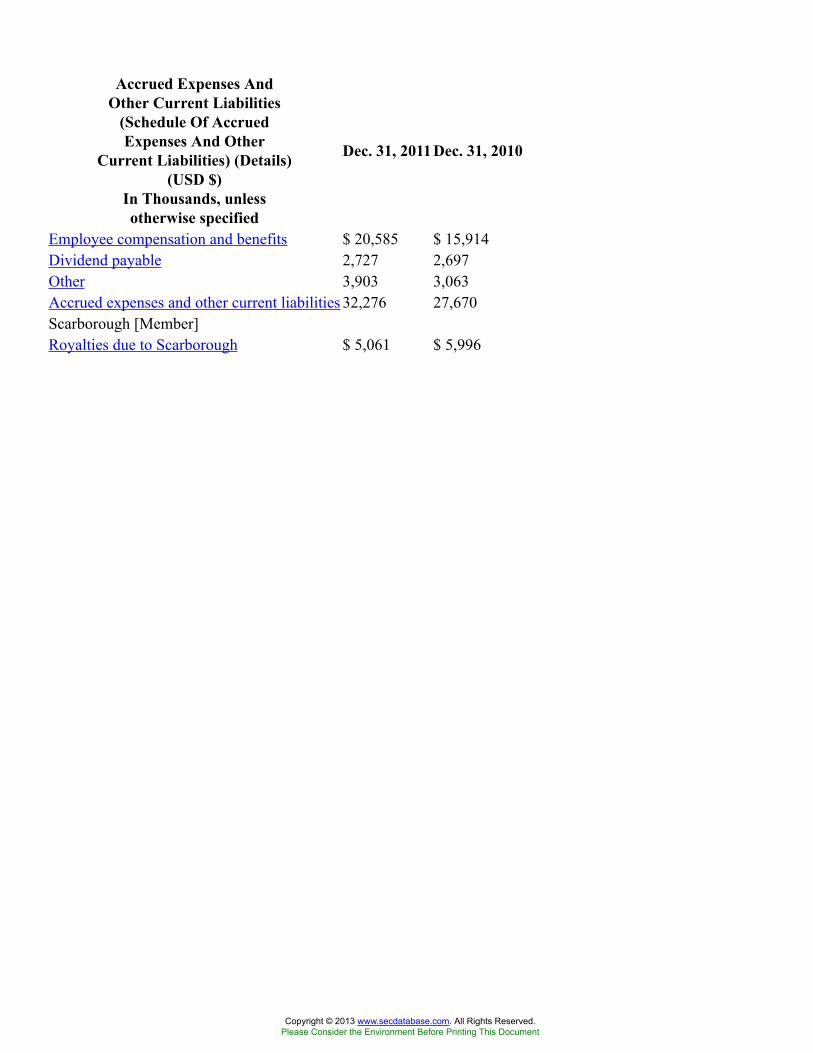
Accrued Expenses AndOther Current Liabilities
(Schedule Of AccruedExpenses And Other
Current Liabilities) (Details)(USD $)
In Thousands, unlessotherwise specified
Dec. 31, 2011Dec. 31, 2010
Employee compensation and benefits $ 20,585 $ 15,914Dividend payable 2,727 2,697Other 3,903 3,063Accrued expenses and other current liabilities 32,276 27,670Scarborough [Member]Royalties due to Scarborough $ 5,061 $ 5,996
Copyright © 2013 www.secdatabase.com. All Rights Reserved.Please Consider the Environment Before Printing This Document
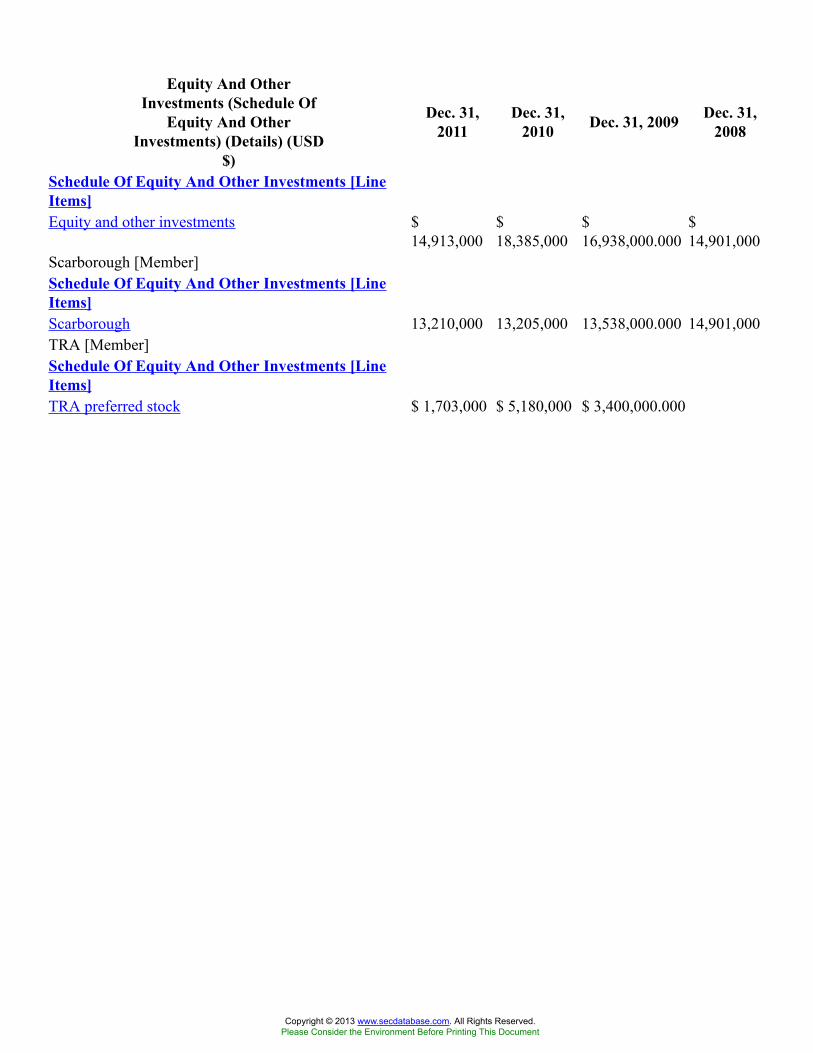
Equity And OtherInvestments (Schedule Of
Equity And OtherInvestments) (Details) (USD
$)
Dec. 31,2011
Dec. 31,2010 Dec. 31, 2009 Dec. 31,
2008
Schedule Of Equity And Other Investments [LineItems]Equity and other investments $
14,913,000$18,385,000
$16,938,000.000
$14,901,000
Scarborough [Member]Schedule Of Equity And Other Investments [LineItems]Scarborough 13,210,000 13,205,000 13,538,000.000 14,901,000TRA [Member]Schedule Of Equity And Other Investments [LineItems]TRA preferred stock $ 1,703,000 $ 5,180,000 $ 3,400,000.000
Copyright © 2013 www.secdatabase.com. All Rights Reserved.Please Consider the Environment Before Printing This Document

12 Months EndedProperty And Equipment(Tables) Dec. 31, 2011
Property And Equipment [Abstract]Schedule Of Property And Equipment 2011 2010
Purchased and internallydeveloped software $73,561 $62,731
Portable People Meterequipment 49,601 45,240
Computer equipment 21,776 21,231Leasehold improvements 17,833 17,537Machinery, furniture and
fixtures 8,598 9,221171,369 155,960
Accumulated depreciationand amortization (100,718) (85,628 )
Property and equipment, net $70,651 $70,332
Schedule Of Property And Equipment AdditionalInformation
For the Years Ended December 31,
Additional Information 2011 2010 2009
Depreciation andAmortization of Propertyand Equipment:
Cost of revenue $26,319 $24,778 $20,702Selling, general, and
administrative 1,748 1,628 2,207Research and
development 475 280 319Total depreciation and
amortization expense $28,542 $26,686 $23,228
Impairment chargesassociated with propertyand equipment $162 $628 $—
Loss on asset disposals $1,961 $2,383 $2,088Interest capitalized during
the year $39 $34 $52
Copyright © 2013 www.secdatabase.com. All Rights Reserved.Please Consider the Environment Before Printing This Document
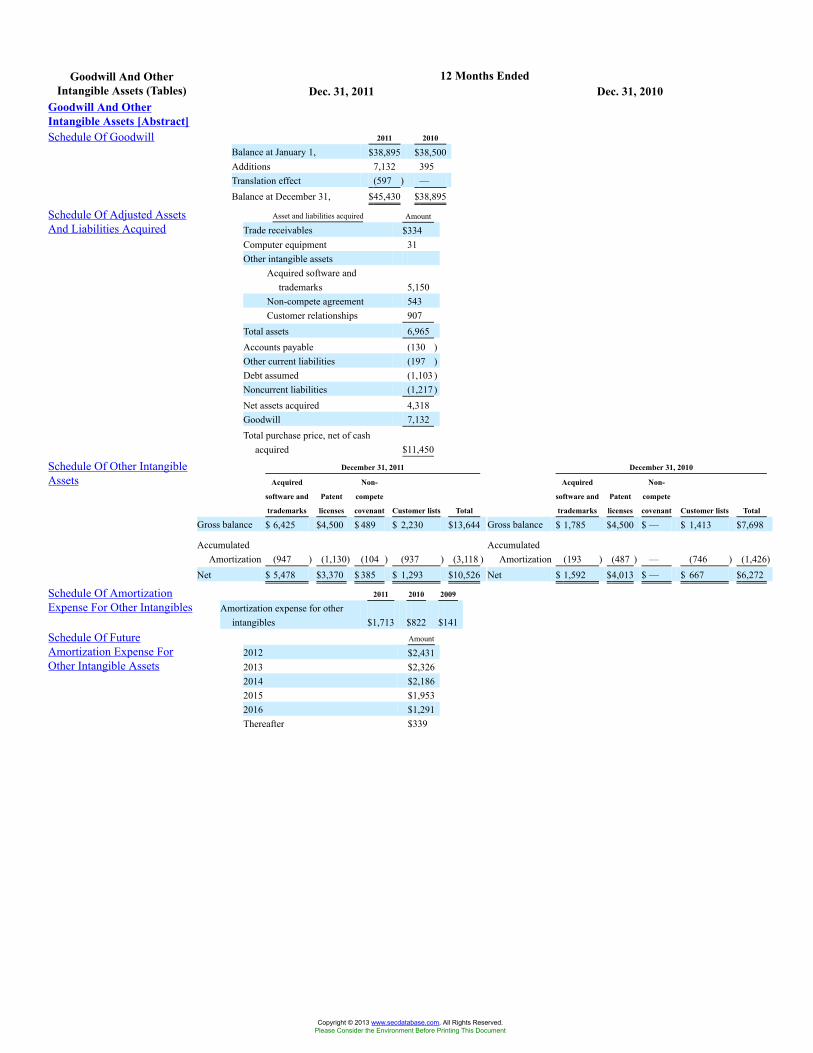
12 Months EndedGoodwill And OtherIntangible Assets (Tables) Dec. 31, 2011 Dec. 31, 2010
Goodwill And OtherIntangible Assets [Abstract]Schedule Of Goodwill 2011 2010
Balance at January 1, $38,895 $38,500Additions 7,132 395Translation effect (597 ) —Balance at December 31, $45,430 $38,895
Schedule Of Adjusted AssetsAnd Liabilities Acquired
Asset and liabilities acquired Amount
Trade receivables $334Computer equipment 31Other intangible assets
Acquired software andtrademarks 5,150
Non-compete agreement 543Customer relationships 907
Total assets 6,965Accounts payable (130 )Other current liabilities (197 )Debt assumed (1,103 )Noncurrent liabilities (1,217 )Net assets acquired 4,318Goodwill 7,132Total purchase price, net of cash
acquired $11,450
Schedule Of Other IntangibleAssets
December 31, 2011
Acquired
software and
trademarks
Patent
licenses
Non-
compete
covenant Customer lists Total
Gross balance $ 6,425 $4,500 $ 489 $ 2,230 $13,644
AccumulatedAmortization (947 ) (1,130) (104 ) (937 ) (3,118 )
Net $ 5,478 $3,370 $ 385 $ 1,293 $10,526
December 31, 2010
Acquired
software and
trademarks
Patent
licenses
Non-
compete
covenant Customer lists Total
Gross balance $ 1,785 $4,500 $ — $ 1,413 $7,698
AccumulatedAmortization (193 ) (487 ) — (746 ) (1,426)
Net $ 1,592 $4,013 $ — $ 667 $6,272
Schedule Of AmortizationExpense For Other Intangibles
2011 2010 2009
Amortization expense for otherintangibles $1,713 $822 $141
Schedule Of FutureAmortization Expense ForOther Intangible Assets
Amount
2012 $2,4312013 $2,3262014 $2,1862015 $1,9532016 $1,291Thereafter $339
Copyright © 2013 www.secdatabase.com. All Rights Reserved.Please Consider the Environment Before Printing This Document

12 Months EndedConsolidated Statements OfCash Flows (USD $)In Thousands, unlessotherwise specified
Dec. 31,2011
Dec. 31,2010
Dec. 31,2009
Cash flows from operating activitiesNet income $ 53,291 $ 44,478 $ 42,160Adjustments to reconcile net income to net cash provided by operatingactivitiesDepreciation and amortization of property and equipment 28,542 26,686 23,228Amortization of other intangible assets 1,713 822 141Loss on asset disposals and impairments of property and equipment 2,123 3,011 2,088Loss due to retirement plan settlements 1,222 1,803Loss on impairment of investment 3,477Deferred income taxes (1,707) 6,147 (1,690)Reduced tax benefits on share-based awards (1,822)Equity in net income of affiliate (7,255) (7,092) (7,637)Distributions from affiliate 7,250 7,425 9,000Bad debt expense 2,234 1,375 2,723Non-cash share-based compensation 8,020 6,478 10,031Changes in operating assets and liabilitiesTrade accounts receivable (4,884) (8,576) (5,293)Prepaid expenses and other assets 4,211 70 2,020Accounts payable 1,340 (1,959) (3,157)Accrued expense and other current liabilities 2,817 (1,465) 312Deferred revenue 601 (6,669) (14,156)Other noncurrent liabilities 2,825 (143) (2,427)Net cash provided by operating activities 104,598 71,810 57,324Cash flows from investing activitiesAdditions to property and equipment (31,967) (30,425) (31,681)License of other intangible assets (4,500)Purchases of equity and other investments (1,780) (3,400)Payments for business acquisitions, net of cash acquired (10,553) (2,500)Net cash used in investing activities (42,520) (39,205) (35,081)Cash flows from financing activitiesProceeds from stock option exercises and stock purchase plan 3,775 7,560 988Tax benefits realized from share-based awards 927 26Payments for deferred financing costs (998)Dividends paid to stockholders (10,849) (10,667) (10,584)Change in bank overdraft payables (3,833) 3,833Debt borrowings 15,000 10,000 33,000Debt repayments (69,103) (25,000) (50,000)Net cash used in financing activities (61,248) (21,914) (22,763)Effect of exchange rate changes on cash and cash equivalents (40) 17 79Net increase (decrease) in cash and cash equivalents 790 10,708 (441)
Copyright © 2013 www.secdatabase.com. All Rights Reserved.Please Consider the Environment Before Printing This Document

Cash and cash equivalents at beginning of year 18,925 8,217 8,658Cash and cash equivalents at end of year $ 19,715 $ 18,925 $ 8,217
Copyright © 2013 www.secdatabase.com. All Rights Reserved.Please Consider the Environment Before Printing This Document

12 Months EndedPrepaids And Other CurrentAssets (Tables) Dec. 31, 2011
Prepaids And Other Current Assets[Abstract]Schedule Of Prepaids And Other CurrentAssets
December 31, 2011 December 31, 2010
Prepaid incometaxes $ 1,984 $ 5,518
Survey participantincentives andprepaid postage 1,770 2,467
Insurance recoveryreceivables 993 601
Other 2,394 2,746Prepaids and other
current assets $ 7,141 $ 11,332
Copyright © 2013 www.secdatabase.com. All Rights Reserved.Please Consider the Environment Before Printing This Document
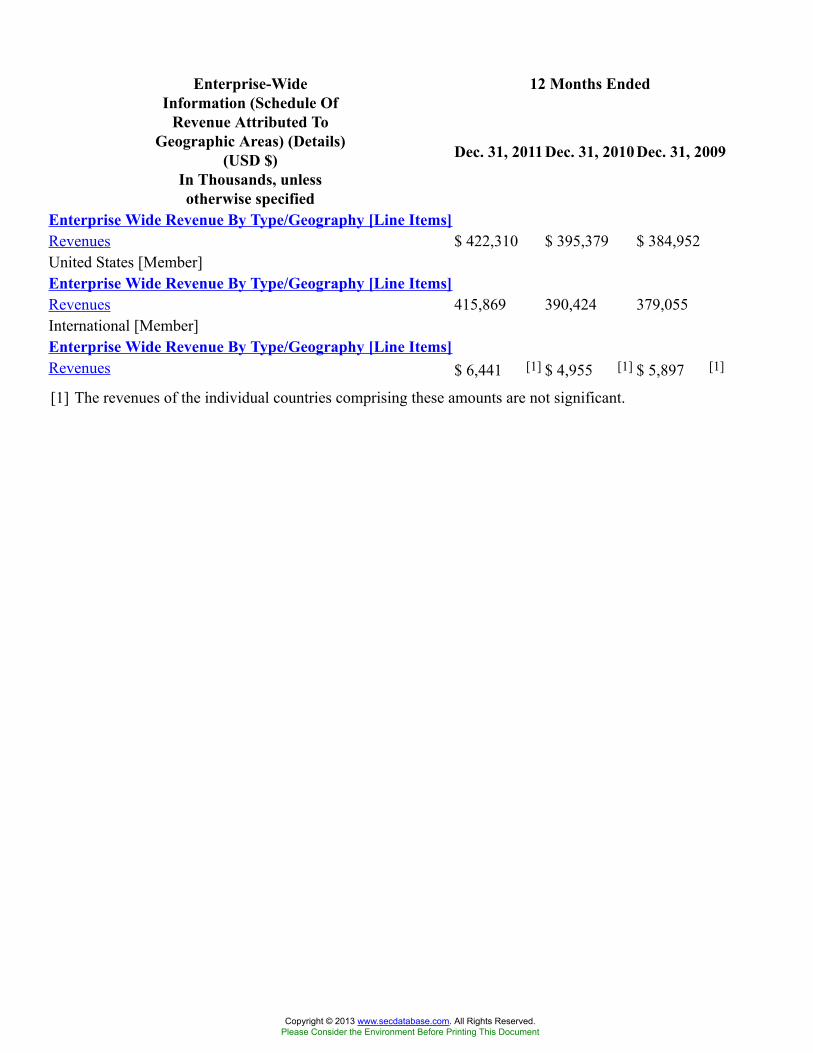
12 Months EndedEnterprise-WideInformation (Schedule Of
Revenue Attributed ToGeographic Areas) (Details)
(USD $)In Thousands, unlessotherwise specified
Dec. 31, 2011Dec. 31, 2010 Dec. 31, 2009
Enterprise Wide Revenue By Type/Geography [Line Items]Revenues $ 422,310 $ 395,379 $ 384,952United States [Member]Enterprise Wide Revenue By Type/Geography [Line Items]Revenues 415,869 390,424 379,055International [Member]Enterprise Wide Revenue By Type/Geography [Line Items]Revenues $ 6,441 [1] $ 4,955 [1] $ 5,897 [1]
[1] The revenues of the individual countries comprising these amounts are not significant.
Copyright © 2013 www.secdatabase.com. All Rights Reserved.Please Consider the Environment Before Printing This Document

12 Months EndedQuarterly Information(Tables) Dec. 31, 2011
Quarterly Information[Abstract]Schedule Of QuarterlyInformation
Three Months Ended
March 31 June 30 September 30 December 31
2011Revenue $100,869 $95,737 $ 105,563 $120,141Gross profit 55,190 34,712 56,175 55,852Net income 16,247 7,584 15,351 14,109Net income per weighted
average common shareBasic $0.60 $0.28 $ 0.56 $0.52Diluted $0.59 $0.27 $ 0.55 $0.51
Dividends per common share $0.10 $0.10 $ 0.10 $0.10
2010Revenue $95,896 $88,339 $ 99,470 $111,674Gross profit 52,743 28,835 49,086 49,386Net income 13,748 3,799 11,328 15,603Net income per weighted
average common shareBasic $0.52 $0.14 $ 0.42 $0.58Diluted $0.51 $0.14 $ 0.42 $0.57
Dividends per common share $0.10 $0.10 $ 0.10 $0.10
Copyright © 2013 www.secdatabase.com. All Rights Reserved.Please Consider the Environment Before Printing This Document
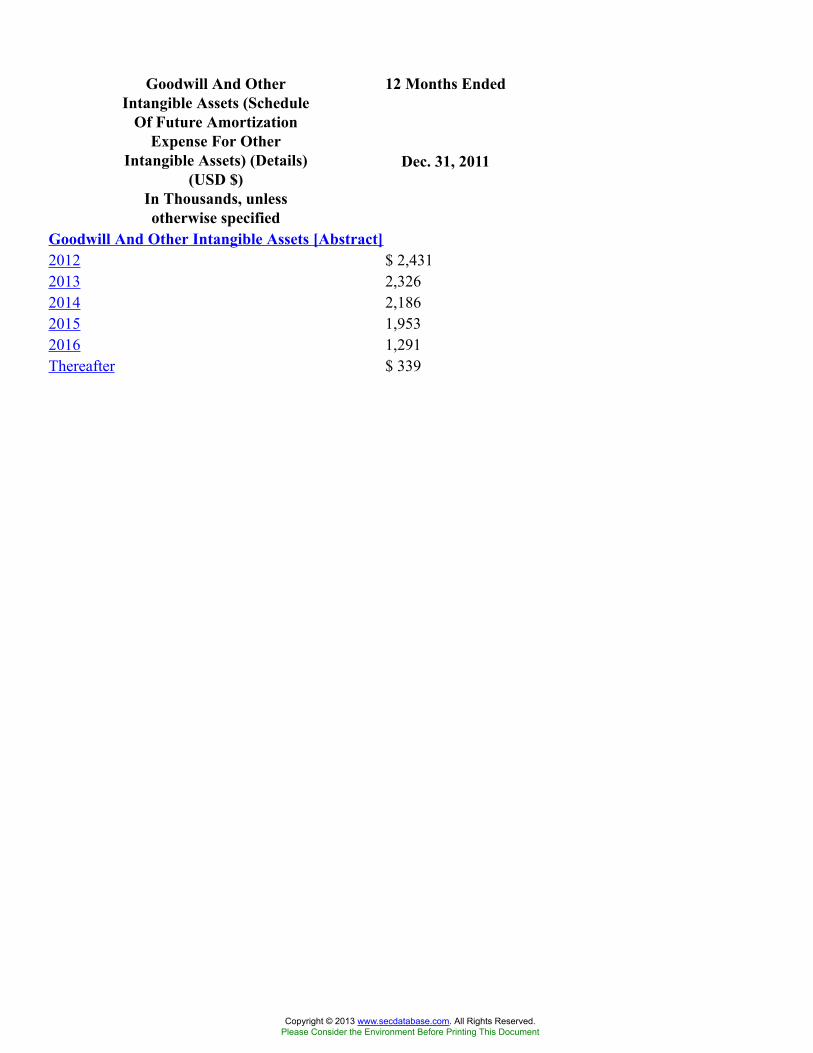
12 Months EndedGoodwill And OtherIntangible Assets (Schedule
Of Future AmortizationExpense For Other
Intangible Assets) (Details)(USD $)
In Thousands, unlessotherwise specified
Dec. 31, 2011
Goodwill And Other Intangible Assets [Abstract]2012 $ 2,4312013 2,3262014 2,1862015 1,9532016 1,291Thereafter $ 339
Copyright © 2013 www.secdatabase.com. All Rights Reserved.Please Consider the Environment Before Printing This Document
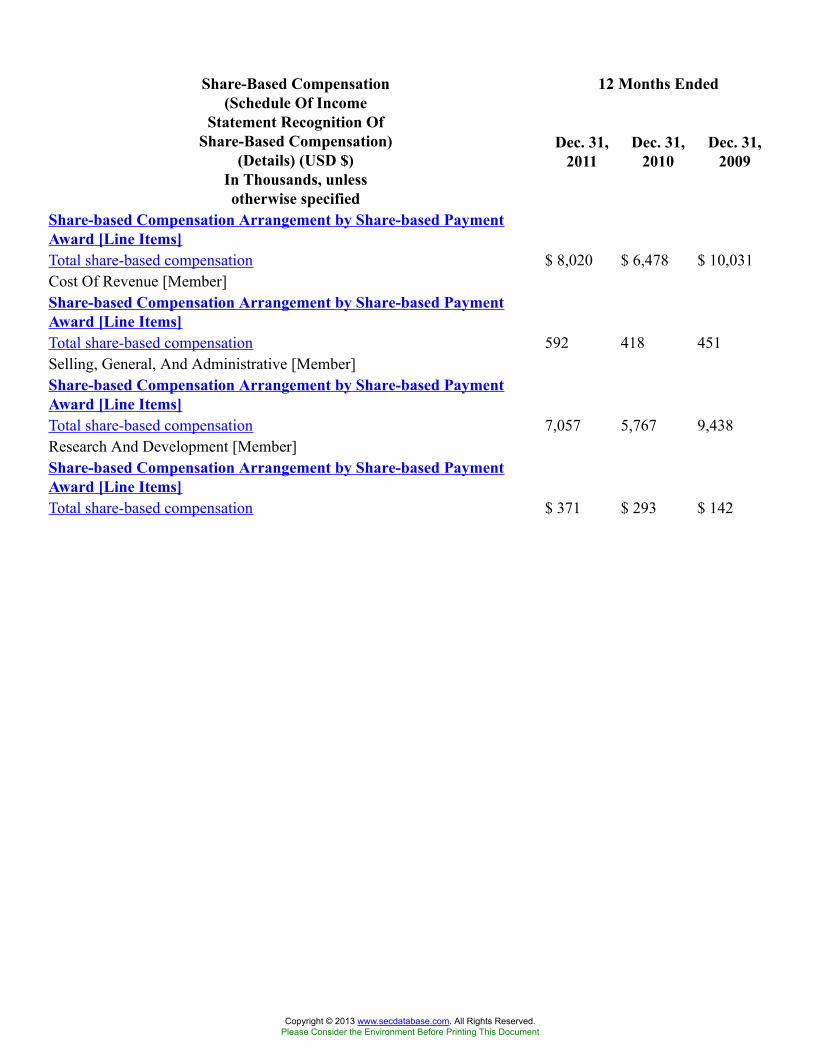
12 Months EndedShare-Based Compensation(Schedule Of Income
Statement Recognition OfShare-Based Compensation)
(Details) (USD $)In Thousands, unlessotherwise specified
Dec. 31,2011
Dec. 31,2010
Dec. 31,2009
Share-based Compensation Arrangement by Share-based PaymentAward [Line Items]Total share-based compensation $ 8,020 $ 6,478 $ 10,031Cost Of Revenue [Member]Share-based Compensation Arrangement by Share-based PaymentAward [Line Items]Total share-based compensation 592 418 451Selling, General, And Administrative [Member]Share-based Compensation Arrangement by Share-based PaymentAward [Line Items]Total share-based compensation 7,057 5,767 9,438Research And Development [Member]Share-based Compensation Arrangement by Share-based PaymentAward [Line Items]Total share-based compensation $ 371 $ 293 $ 142
Copyright © 2013 www.secdatabase.com. All Rights Reserved.Please Consider the Environment Before Printing This Document
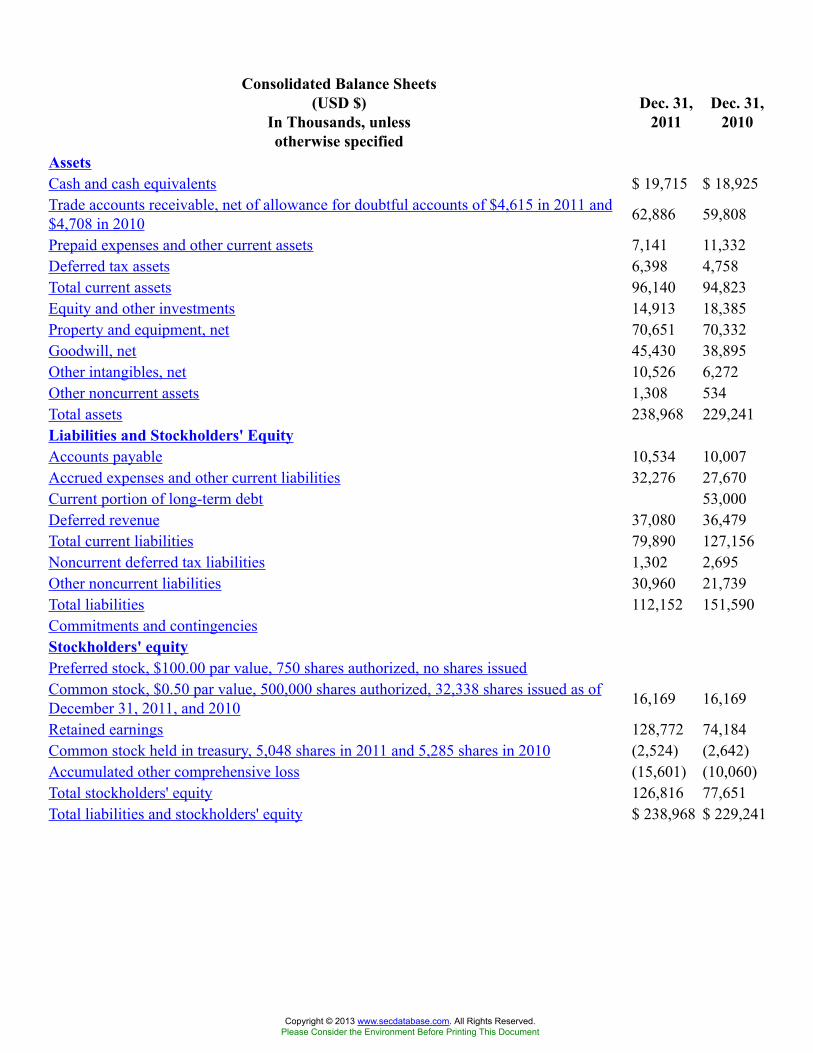
Consolidated Balance Sheets(USD $)
In Thousands, unlessotherwise specified
Dec. 31,2011
Dec. 31,2010
AssetsCash and cash equivalents $ 19,715 $ 18,925Trade accounts receivable, net of allowance for doubtful accounts of $4,615 in 2011 and$4,708 in 2010 62,886 59,808
Prepaid expenses and other current assets 7,141 11,332Deferred tax assets 6,398 4,758Total current assets 96,140 94,823Equity and other investments 14,913 18,385Property and equipment, net 70,651 70,332Goodwill, net 45,430 38,895Other intangibles, net 10,526 6,272Other noncurrent assets 1,308 534Total assets 238,968 229,241Liabilities and Stockholders' EquityAccounts payable 10,534 10,007Accrued expenses and other current liabilities 32,276 27,670Current portion of long-term debt 53,000Deferred revenue 37,080 36,479Total current liabilities 79,890 127,156Noncurrent deferred tax liabilities 1,302 2,695Other noncurrent liabilities 30,960 21,739Total liabilities 112,152 151,590Commitments and contingenciesStockholders' equityPreferred stock, $100.00 par value, 750 shares authorized, no shares issuedCommon stock, $0.50 par value, 500,000 shares authorized, 32,338 shares issued as ofDecember 31, 2011, and 2010 16,169 16,169
Retained earnings 128,772 74,184Common stock held in treasury, 5,048 shares in 2011 and 5,285 shares in 2010 (2,524) (2,642)Accumulated other comprehensive loss (15,601) (10,060)Total stockholders' equity 126,816 77,651Total liabilities and stockholders' equity $ 238,968 $ 229,241
Copyright © 2013 www.secdatabase.com. All Rights Reserved.Please Consider the Environment Before Printing This Document
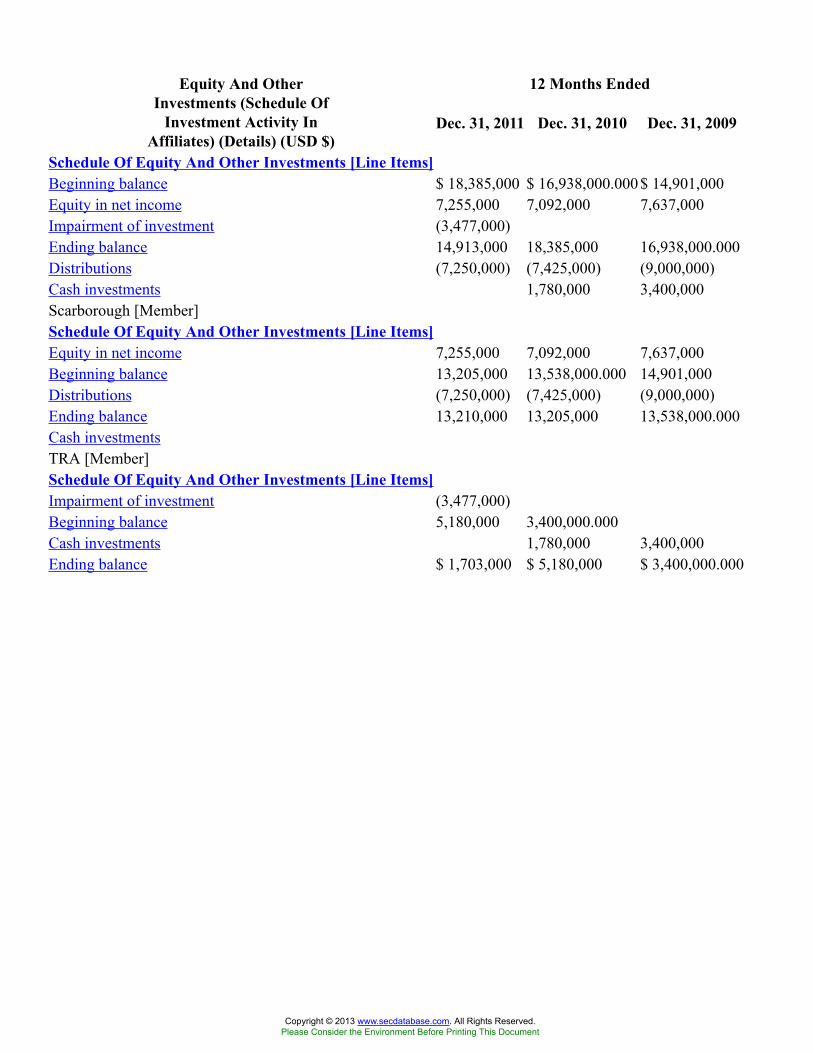
12 Months EndedEquity And OtherInvestments (Schedule Of
Investment Activity InAffiliates) (Details) (USD $)
Dec. 31, 2011 Dec. 31, 2010 Dec. 31, 2009
Schedule Of Equity And Other Investments [Line Items]Beginning balance $ 18,385,000 $ 16,938,000.000$ 14,901,000Equity in net income 7,255,000 7,092,000 7,637,000Impairment of investment (3,477,000)Ending balance 14,913,000 18,385,000 16,938,000.000Distributions (7,250,000) (7,425,000) (9,000,000)Cash investments 1,780,000 3,400,000Scarborough [Member]Schedule Of Equity And Other Investments [Line Items]Equity in net income 7,255,000 7,092,000 7,637,000Beginning balance 13,205,000 13,538,000.000 14,901,000Distributions (7,250,000) (7,425,000) (9,000,000)Ending balance 13,210,000 13,205,000 13,538,000.000Cash investmentsTRA [Member]Schedule Of Equity And Other Investments [Line Items]Impairment of investment (3,477,000)Beginning balance 5,180,000 3,400,000.000Cash investments 1,780,000 3,400,000Ending balance $ 1,703,000 $ 5,180,000 $ 3,400,000.000
Copyright © 2013 www.secdatabase.com. All Rights Reserved.Please Consider the Environment Before Printing This Document
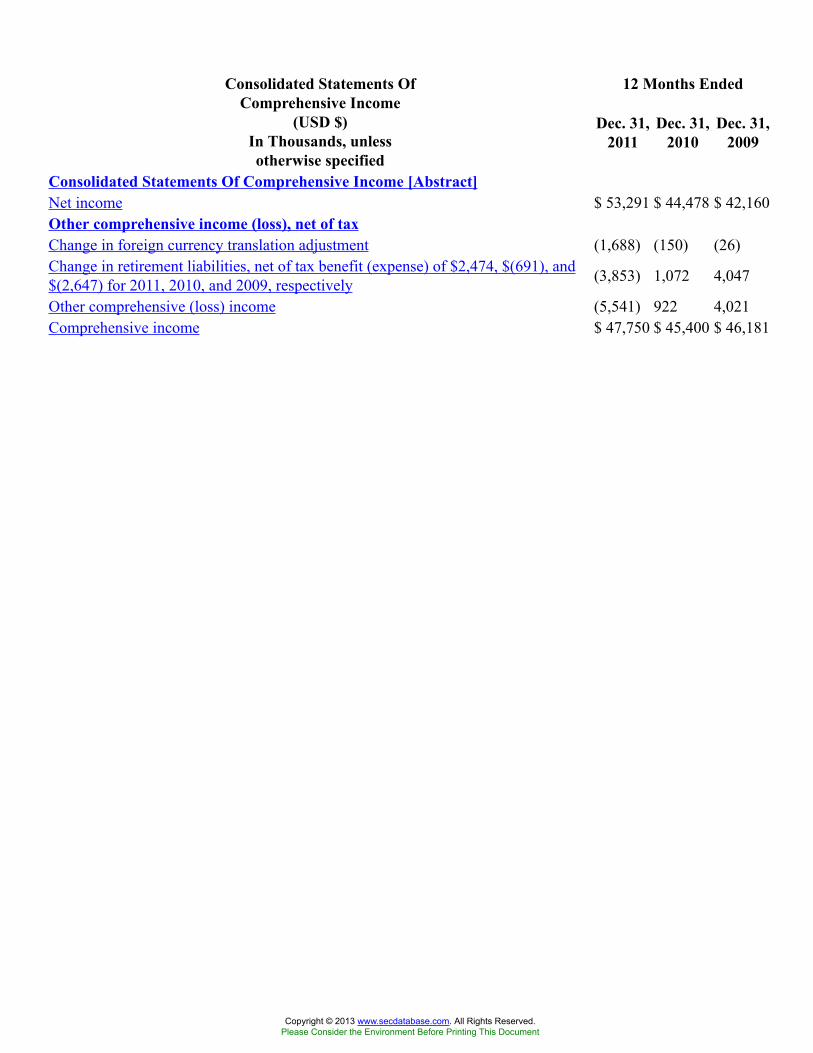
12 Months EndedConsolidated Statements OfComprehensive Income
(USD $)In Thousands, unlessotherwise specified
Dec. 31,2011
Dec. 31,2010
Dec. 31,2009
Consolidated Statements Of Comprehensive Income [Abstract]Net income $ 53,291 $ 44,478 $ 42,160Other comprehensive income (loss), net of taxChange in foreign currency translation adjustment (1,688) (150) (26)Change in retirement liabilities, net of tax benefit (expense) of $2,474, $(691), and$(2,647) for 2011, 2010, and 2009, respectively (3,853) 1,072 4,047
Other comprehensive (loss) income (5,541) 922 4,021Comprehensive income $ 47,750 $ 45,400 $ 46,181
Copyright © 2013 www.secdatabase.com. All Rights Reserved.Please Consider the Environment Before Printing This Document
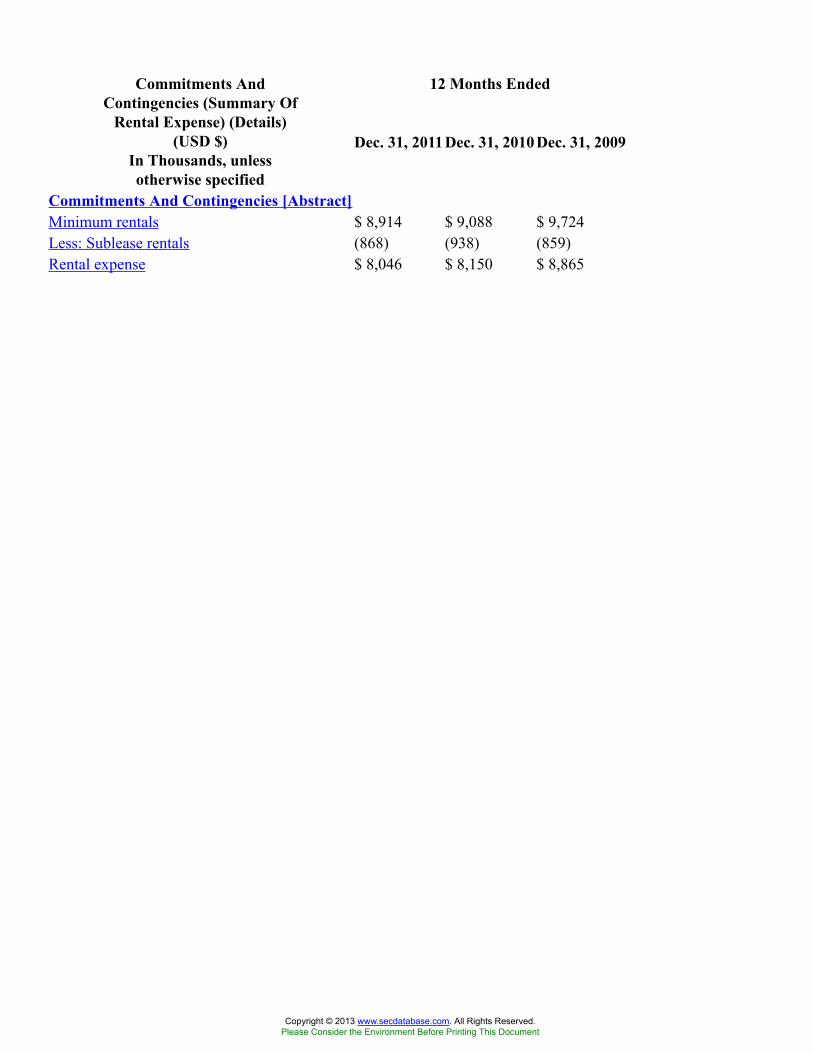
12 Months EndedCommitments AndContingencies (Summary Of
Rental Expense) (Details)(USD $)
In Thousands, unlessotherwise specified
Dec. 31, 2011Dec. 31, 2010 Dec. 31, 2009
Commitments And Contingencies [Abstract]Minimum rentals $ 8,914 $ 9,088 $ 9,724Less: Sublease rentals (868) (938) (859)Rental expense $ 8,046 $ 8,150 $ 8,865
Copyright © 2013 www.secdatabase.com. All Rights Reserved.Please Consider the Environment Before Printing This Document

12 Months EndedCommitments AndContingencies (Tables) Dec. 31, 2011
Commitments AndContingencies [Abstract]Summary Of Rental Expense 2011 2010 2009
Summary of rental expenseMinimum rentals $8,914 $9,088 $9,724Less: Sublease rentals (868 ) (938 ) (859 )Rental expense $8,046 $8,150 $8,865
Summary Of Future LeaseCommitments
Summary of future lease commitments2012 7,9912013 6,2722014 5,1322015 5,2502016 5,041Thereafter 13,427Minimum payments required (a) $43,113
(a) Minimum payments have not been reduced by sublease rentals of $2,117 due in futureyears under noncancelable subleases.
Copyright © 2013 www.secdatabase.com. All Rights Reserved.Please Consider the Environment Before Printing This Document

12 Months EndedRetirement Plans (Narrative)
(Details) (USD $)Dec. 31,
2011years
Dec. 31,2010
Dec. 31,2009
Defined Benefit Plan Disclosure [Line Items]Increase in the fair value of plan assets $ 1,600,000Increase in projected benefit obligation 7,600,000Expected long-term rate of return on assets 8.00%Target allocation of percentage, equity securities 60.00%Target allocation of percentage, debt securities 40.00%Discount rate on benefit obligation 4.41% 5.09%Age limit of retired employees to receive company subsidy 64Postretirement benefit liability 1,900,000 1,800,000Postretirement benefit expense 100,000 200,000 200,000Assumed health care cost trend rate used in measuring the postretirement benefit obligation 8.50%
Ultimate rate of health care cost trend 5.00%Year on which rate declining to ultimate rate 2018Percent of change in health care trend rate 1.00%Change in health care trend rate would change benefit obligation 200,000Change in health care trend rate would change aggregate service andinterest cost 100,000
Pre-Age Retirees [Member]Defined Benefit Plan Disclosure [Line Items]Age eligibility for retired employees to participate in health care plans 65Grandfathered Post-Age Retirees [Member]Defined Benefit Plan Disclosure [Line Items]Age eligibility for retired employees to participate in health care plans 65Pension Benefits [Member]Defined Benefit Plan Disclosure [Line Items]Projected benefit obligation (44,246,000) (36,690,000) (34,760,000)Defined benefit cost excluding settlement charges 1,912,000 1,548,000 1,479,000Expected long-term rate of return on assets 8.00% 8.00%Estimated for future contributions 2,600,000Accumulated benefit obligation 40,300,000 32,600,000Discount rate on benefit obligation 4.41% 5.09%Defined contribution 2,048,000 1,118,000Postretirement Plan [Member]Defined Benefit Plan Disclosure [Line Items]Projected benefit obligation (1,907,000) (1,837,000) (1,783,000)Defined benefit cost excluding settlement charges 147,000 163,000 184,000Estimated for future contributions 100,000Discount rate on benefit obligation 3.91% 4.56%Defined contribution 14,000 (6,000)
Copyright © 2013 www.secdatabase.com. All Rights Reserved.Please Consider the Environment Before Printing This Document

Benefit Equalization Plan [Member]Defined Benefit Plan Disclosure [Line Items]Estimated for future contributions 200,000Accumulated benefit obligation 3,300,000 2,900,000Prepaid pension cost 300,000 200,000Supplemental Executive Retirement Plan [Member]Defined Benefit Plan Disclosure [Line Items]Payoff of Company's SERP obligation 700,000401(k) Plan [Member]Defined Benefit Plan Disclosure [Line Items]Plan generally provides for employee salary deferral contributions 17.00%Matching contribution contributed by the company under the terms of theplan 50.00%
Percent of maximum contribution by the employer for eligible employeecompensation for participant employee under the plan 3.00%
Percent of maximum contribution by the employer for eligible employeecompensation for non participant employee under the plan 6.00%
Percent of maximum additional discretionary matching contribution bythe employer up to the maximum eligible employee compensation 30.00%
Defined contribution $ 2,700,000 $ 2,100,000 $ 2,000,000
Copyright © 2013 www.secdatabase.com. All Rights Reserved.Please Consider the Environment Before Printing This Document
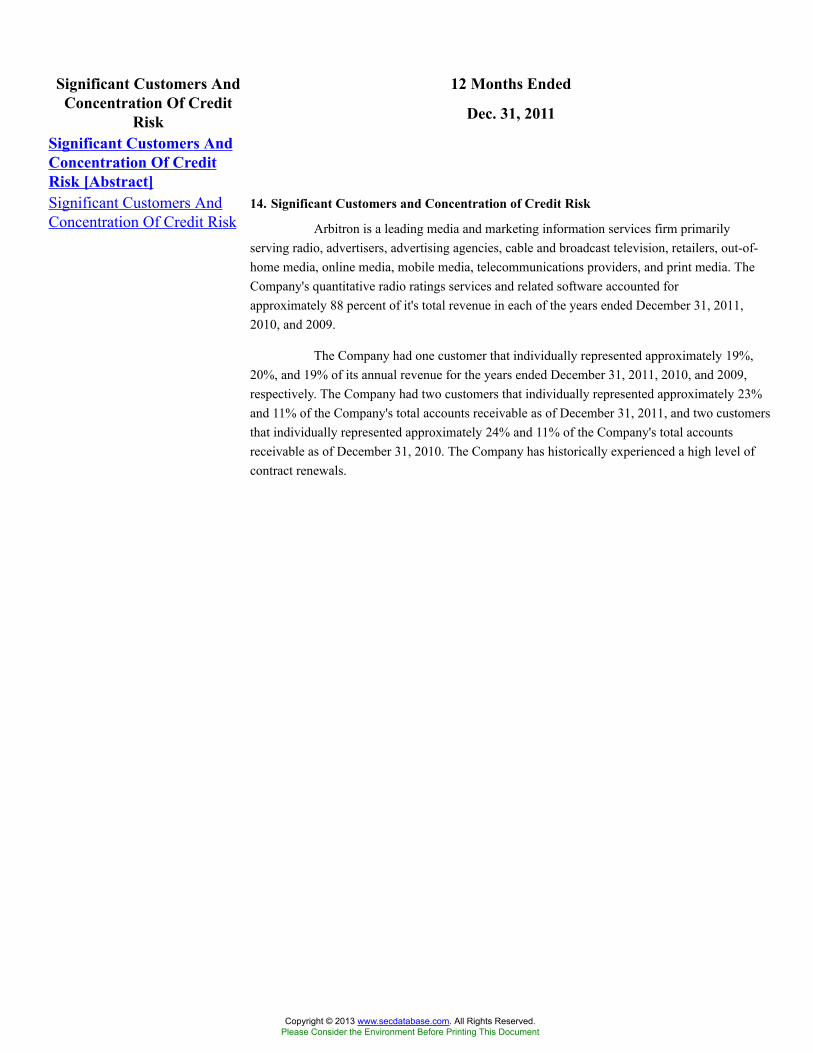
12 Months EndedSignificant Customers AndConcentration Of Credit
Risk Dec. 31, 2011
Significant Customers AndConcentration Of CreditRisk [Abstract]Significant Customers AndConcentration Of Credit Risk
14. Significant Customers and Concentration of Credit Risk
Arbitron is a leading media and marketing information services firm primarilyserving radio, advertisers, advertising agencies, cable and broadcast television, retailers, out-of-home media, online media, mobile media, telecommunications providers, and print media. TheCompany's quantitative radio ratings services and related software accounted forapproximately 88 percent of it's total revenue in each of the years ended December 31, 2011,2010, and 2009.
The Company had one customer that individually represented approximately 19%,20%, and 19% of its annual revenue for the years ended December 31, 2011, 2010, and 2009,respectively. The Company had two customers that individually represented approximately 23%and 11% of the Company's total accounts receivable as of December 31, 2011, and two customersthat individually represented approximately 24% and 11% of the Company's total accountsreceivable as of December 31, 2010. The Company has historically experienced a high level ofcontract renewals.
Copyright © 2013 www.secdatabase.com. All Rights Reserved.Please Consider the Environment Before Printing This Document

12 Months EndedIncome Taxes (Tables) Dec. 31, 2011Income Taxes [Abstract]Components Of Income Before Income Tax Expense And AReconciliation Of The Statutory Federal Income Tax RateTo The Income Tax Rate
2011 2010 2009
Income (loss) beforeincome tax expense:
U.S. $89,188 $70,657 $59,853International (841 ) 1,115 1,279Total $88,347 $71,772 $61,132
Income tax expense(benefit):
Current:U.S. $32,871 $18,706 $18,464State,
localandforeign 3,892 2,441 2,198
Total 36,763 21,147 20,662Deferred:
U.S. (3,783 ) 3,700 1,310State,
localandforeign 2,076 2,447 (3,000 )
Total (1,707 ) 6,147 (1,690 )$35,056 $27,294 $18,972
U.S. statutory rate 35.0 % 35.0 % 35.0 %Income tax expense at U.S.
statutory rate $30,921 $25,120 $21,396State income taxes, net of
federal benefit 3,452 2,834 2,904Meals and entertainment 198 187 199
Change in valuationallowance for foreign taxcredit and capital loss 1,099 (169 ) —
State NOL's recognized — — (4,801 )Adjustments to tax
liabilities (279 ) 202 207Other (335 ) (880 ) (933 )
Income tax expense $35,056 $27,294 $18,972
Effective tax rate 39.7 % 38.0 % 31.0 %
Schedule Of Unrecognized Tax Benefits 2011 2010
Balance at January 1 $1,896 $2,210Increases related to current
year tax positions 107 270
Copyright © 2013 www.secdatabase.com. All Rights Reserved.Please Consider the Environment Before Printing This Document

Decreases related to prioryears' tax positions (537 ) (353 )
Expiration of the statute oflimitations for theassessment of taxes (166 ) (231 )
Balance at December 31 $1,300 $1,896
Schedule Of Temporary Differences And ResultingDeferred Income Tax Assets
2011 2010
Deferred tax assetsCurrent deferred
tax assetsAccruals $5,084 $3,315Net operating
losscarryforwards 1,314 1,443
6,398 4,758
Noncurrentdeferred taxassets
Benefit plans $11,237 $8,744
Accruals 2,372 1,192Net operating
losscarryforwards 760 1,575
Share-basedcompensation 7,573 5,742
Partnershipinterest 1,851 2,002
Investmentimpairment 1,355 —
Other 1,316 72426,464 19,979
Less valuationallowance (1,262 ) (163 )
Total deferred taxassets 31,600 24,574
Deferred tax liabilitiesNoncurrent
deferred taxliabilities
Basis differencesin intangibleassets andproperty andequipment $(22,860) $(19,346)
Benefit plans (2,476 ) (2,431 )Other (1,168 ) (734 )
Copyright © 2013 www.secdatabase.com. All Rights Reserved.Please Consider the Environment Before Printing This Document

Total deferred taxliabilities (26,504) (22,511)
Net deferred tax assets $5,096 $2,063
Copyright © 2013 www.secdatabase.com. All Rights Reserved.Please Consider the Environment Before Printing This Document

12 Months EndedEnterprise-WideInformation Dec. 31, 2011
Enterprise-WideInformation [Abstract]Enterprise-Wide Information 16. Enterprise-Wide Information
The following table sets forth the revenue for each group of services provided to ourexternal customers for the years ended December 31, 2011, 2010, and 2009 (in thousands):
2011 2010 2009
Radio audience ratings services $340,479 $317,606 $307,217Local market consumer information
services 35,173 35,187 34,991Software applications 35,676 34,138 33,809All other services 10,982 8,448 8,935Total revenue $422,310 $395,379 $384,952
The following table sets forth geographic information for the years ended December 31,2011, 2010, and 2009 (in thousands):
United States International(1) Total
2011Revenues $415,869 $ 6,441 $422,3102010Revenues $390,424 $ 4,955 $395,3792009Revenues $379,055 $ 5,897 $384,952
(1) The revenues of the individual countries comprising these amounts are not significant.
Copyright © 2013 www.secdatabase.com. All Rights Reserved.Please Consider the Environment Before Printing This Document

12 Months EndedRetirement Plans(Components Of Net
Periodic Cost And OtherComprehensive Loss
(Income)) (Details) (USD $)In Thousands, unlessotherwise specified
Dec. 31,2011
Dec. 31,2010
Dec. 31,2009
Pension Benefits [Member]Defined Benefit Plan Disclosure [Line Items]Service cost of benefits $ 774 $ 731 $ 790Interest cost 1,819 1,883 1,847Expected return on plan assets (2,051) (2,118) (2,172)Amortization of net actuarial loss 1,370 1,052 992Amortization of prior service cost 22Total 1,912 1,548 1,479Net actuarial loss (gain) arising this year 7,449 281 (2,295)Actuarial loss charged to expense due to settlement (1,521)Net actuarial loss amortized this year (1,370) (1,052) (992)Prior service cost amortized this year (22)Recognized in other comprehensive loss (income) 6,079 (771) (4,830)Recognized in net periodic cost and other comprehensive loss(income) 7,991 777 (3,351)
Supplemental Retirement Plans [Member]Defined Benefit Plan Disclosure [Line Items]Service cost of benefits 20 16 93Interest cost 159 192 318Amortization of net actuarial loss 153 148 431Amortization of prior service cost (16)Total 332 356 826Net actuarial loss (gain) arising this year 464 493 (1,104)Actuarial loss charged to expense due to settlement (1,222) (267)Net actuarial loss amortized this year (153) (148) (431)Prior service credit due to curtailment 6Prior service cost amortized this year 16Recognized in other comprehensive loss (income) 311 (877) (1,780)Recognized in net periodic cost and other comprehensive loss(income) 643 (521) (954)
Postretirement Plan [Member]Defined Benefit Plan Disclosure [Line Items]Service cost of benefits 38 38 49Interest cost 81 89 92Amortization of net actuarial loss 28 36 43Total 147 163 184Net actuarial loss (gain) arising this year (35) (79) (41)
Copyright © 2013 www.secdatabase.com. All Rights Reserved.Please Consider the Environment Before Printing This Document

Net actuarial loss amortized this year (28) (36) (43)Recognized in other comprehensive loss (income) (63) (115) (84)Recognized in net periodic cost and other comprehensive loss(income) $ 84 $ 48 $ 100
Copyright © 2013 www.secdatabase.com. All Rights Reserved.Please Consider the Environment Before Printing This Document

12 Months EndedConsolidated Statements OfComprehensive Income(Parenthetical) (USD $)
In Thousands, unlessotherwise specified
Dec. 31, 2011Dec. 31, 2010 Dec. 31, 2009
Consolidated Statements Of Comprehensive Income [Abstract]Change in retirement liabilities, tax benefit (expense) $ 2,474 $ (691) $ (2,647)
Copyright © 2013 www.secdatabase.com. All Rights Reserved.Please Consider the Environment Before Printing This Document

Consolidated Balance Sheets(Parenthetical) (USD $)
In Thousands, except PerShare data, unless otherwise
specified
Dec. 31, 2011Dec. 31, 2010
Consolidated Balance Sheets [Abstract]Allowance for doubtful accounts receivable $ 4,615 $ 4,708Preferred stock, par value $ 100 $ 100Preferred stock, shares authorized 750 750Preferred stock, shares issued 0 0Common stock, par value $ 0.5 $ 0.5Common stock, shares authorized 500,000 500,000Common stock, shares issued 32,338 32,338Treasury stock, shares 5,048 5,285
Copyright © 2013 www.secdatabase.com. All Rights Reserved.Please Consider the Environment Before Printing This Document
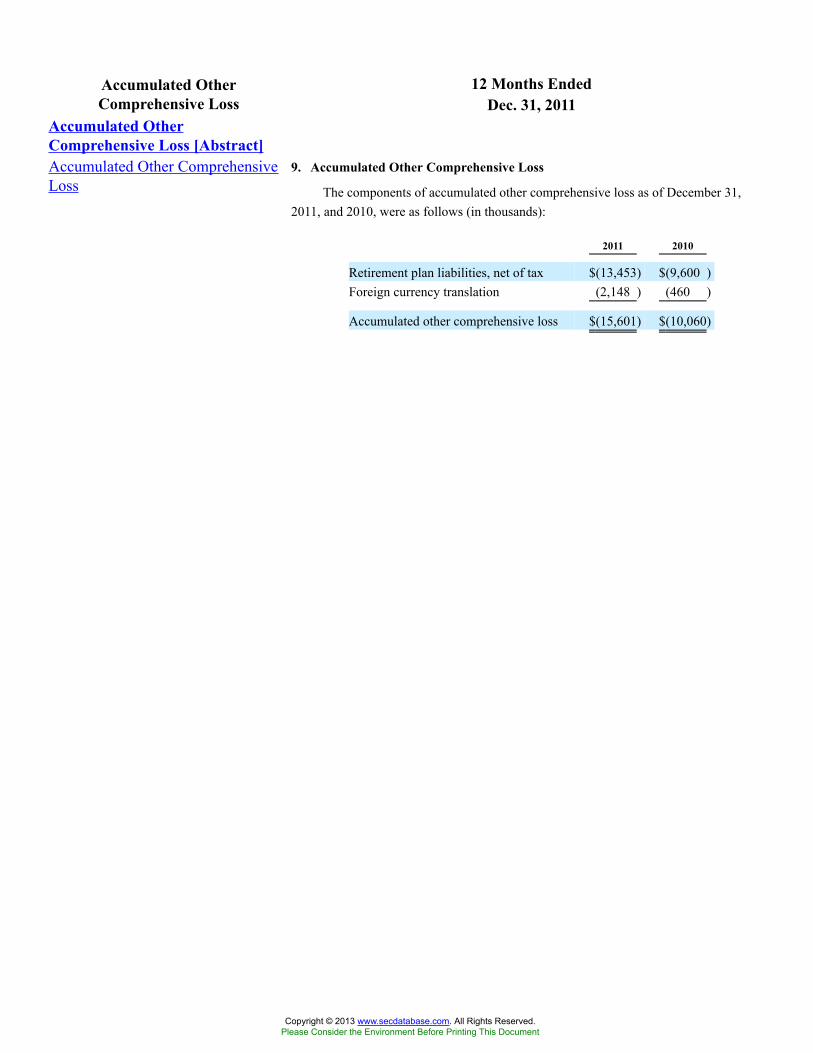
12 Months EndedAccumulated OtherComprehensive Loss Dec. 31, 2011
Accumulated OtherComprehensive Loss [Abstract]Accumulated Other ComprehensiveLoss
9. Accumulated Other Comprehensive Loss
The components of accumulated other comprehensive loss as of December 31,2011, and 2010, were as follows (in thousands):
2011 2010
Retirement plan liabilities, net of tax $(13,453) $(9,600 )Foreign currency translation (2,148 ) (460 )
Accumulated other comprehensive loss $(15,601) $(10,060)
Copyright © 2013 www.secdatabase.com. All Rights Reserved.Please Consider the Environment Before Printing This Document
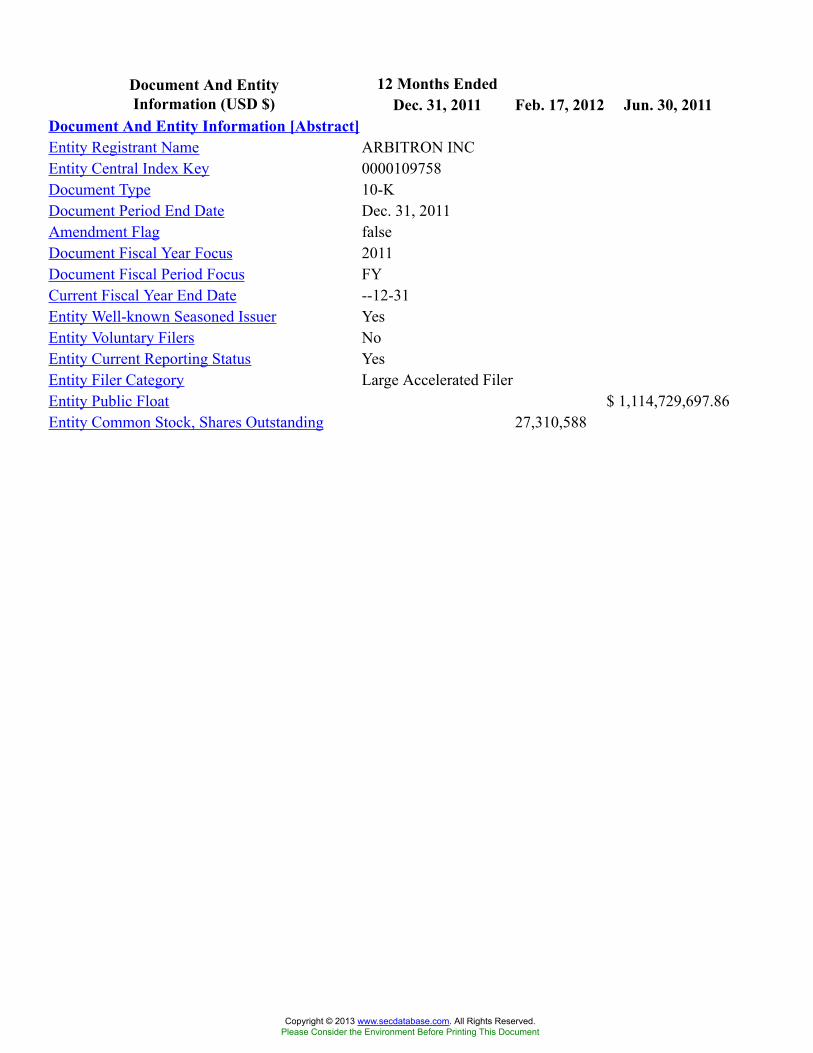
12 Months EndedDocument And EntityInformation (USD $) Dec. 31, 2011 Feb. 17, 2012 Jun. 30, 2011
Document And Entity Information [Abstract]Entity Registrant Name ARBITRON INCEntity Central Index Key 0000109758Document Type 10-KDocument Period End Date Dec. 31, 2011Amendment Flag falseDocument Fiscal Year Focus 2011Document Fiscal Period Focus FYCurrent Fiscal Year End Date --12-31Entity Well-known Seasoned Issuer YesEntity Voluntary Filers NoEntity Current Reporting Status YesEntity Filer Category Large Accelerated FilerEntity Public Float $ 1,114,729,697.86Entity Common Stock, Shares Outstanding 27,310,588
Copyright © 2013 www.secdatabase.com. All Rights Reserved.Please Consider the Environment Before Printing This Document
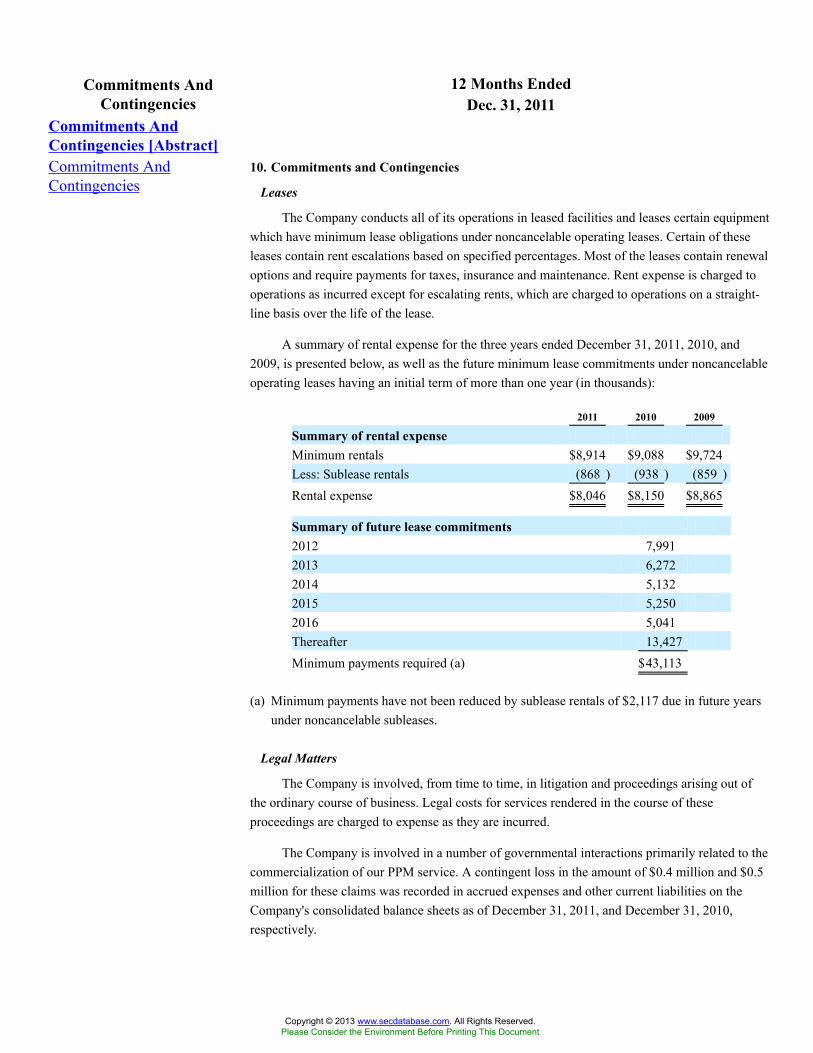
12 Months EndedCommitments AndContingencies Dec. 31, 2011
Commitments AndContingencies [Abstract]Commitments AndContingencies
10. Commitments and Contingencies
Leases
The Company conducts all of its operations in leased facilities and leases certain equipmentwhich have minimum lease obligations under noncancelable operating leases. Certain of theseleases contain rent escalations based on specified percentages. Most of the leases contain renewaloptions and require payments for taxes, insurance and maintenance. Rent expense is charged tooperations as incurred except for escalating rents, which are charged to operations on a straight-line basis over the life of the lease.
A summary of rental expense for the three years ended December 31, 2011, 2010, and2009, is presented below, as well as the future minimum lease commitments under noncancelableoperating leases having an initial term of more than one year (in thousands):
2011 2010 2009
Summary of rental expenseMinimum rentals $8,914 $9,088 $9,724Less: Sublease rentals (868 ) (938 ) (859 )Rental expense $8,046 $8,150 $8,865
Summary of future lease commitments2012 7,9912013 6,2722014 5,1322015 5,2502016 5,041Thereafter 13,427Minimum payments required (a) $43,113
(a) Minimum payments have not been reduced by sublease rentals of $2,117 due in future yearsunder noncancelable subleases.
Legal Matters
The Company is involved, from time to time, in litigation and proceedings arising out ofthe ordinary course of business. Legal costs for services rendered in the course of theseproceedings are charged to expense as they are incurred.
The Company is involved in a number of governmental interactions primarily related to thecommercialization of our PPM service. A contingent loss in the amount of $0.4 million and $0.5million for these claims was recorded in accrued expenses and other current liabilities on theCompany's consolidated balance sheets as of December 31, 2011, and December 31, 2010,respectively.
Copyright © 2013 www.secdatabase.com. All Rights Reserved.Please Consider the Environment Before Printing This Document

12 Months EndedSignificant Customers AndConcentration Of Credit
Risk (Details)Dec. 31,
2011Dec. 31,
2010Dec. 31,
2009Concentration Risk [Line Items]Percentage of quantitative radio ratings services and related software tototal revenue 88.00% 88.00% 88.00%
Customer One [Member]Concentration Risk [Line Items]Percentage of accounts receivable from one customer out of total accountsreceivable 23.00% 24.00%
Customer Two [Member]Concentration Risk [Line Items]Percentage of accounts receivable from one customer out of total accountsreceivable 11.00% 11.00%
Customer Concentration Risk [Member]Concentration Risk [Line Items]Percentage of revenue from one customer out of total revenue 19.00% 20.00% 19.00%
Copyright © 2013 www.secdatabase.com. All Rights Reserved.Please Consider the Environment Before Printing This Document

12 Months EndedConsolidated Statements OfIncome (USD $)
In Thousands, except PerShare data, unless otherwise
specified
Dec. 31, 2011Dec. 31, 2010 Dec. 31, 2009
Consolidated Statements Of Income [Abstract]Revenue $ 422,310 $ 395,379 $ 384,952Costs and expensesCost of revenue 220,381 215,329 196,269Selling, general and administrative 78,407 75,255 81,866Research and development 38,416 39,145 42,008Restructuring and reorganization 9,968Total costs and expenses 337,204 329,729 330,111Operating income 85,106 65,650 54,841Equity in net income of affiliate 7,255 7,092 7,637Impairment of investment (3,477)Income before interest and income tax expense 88,884 72,742 62,478Interest income 27 14 49Interest expense 564 984 1,395Income before income tax expense 88,347 71,772 61,132Income tax expense 35,056 27,294 18,972Net income $ 53,291 $ 44,478 $ 42,160Income per weighted-average common shareBasic $ 1.96 $ 1.66 $ 1.59Diluted $ 1.93 $ 1.64 $ 1.58Weighted-average common shares used in calculationsBasic 27,181 26,759 26,493Potentially dilutive securities 478 346 183Diluted 27,659 27,105 26,676Dividends declared per common share outstanding $ 0.40 $ 0.40 $ 0.40
Copyright © 2013 www.secdatabase.com. All Rights Reserved.Please Consider the Environment Before Printing This Document
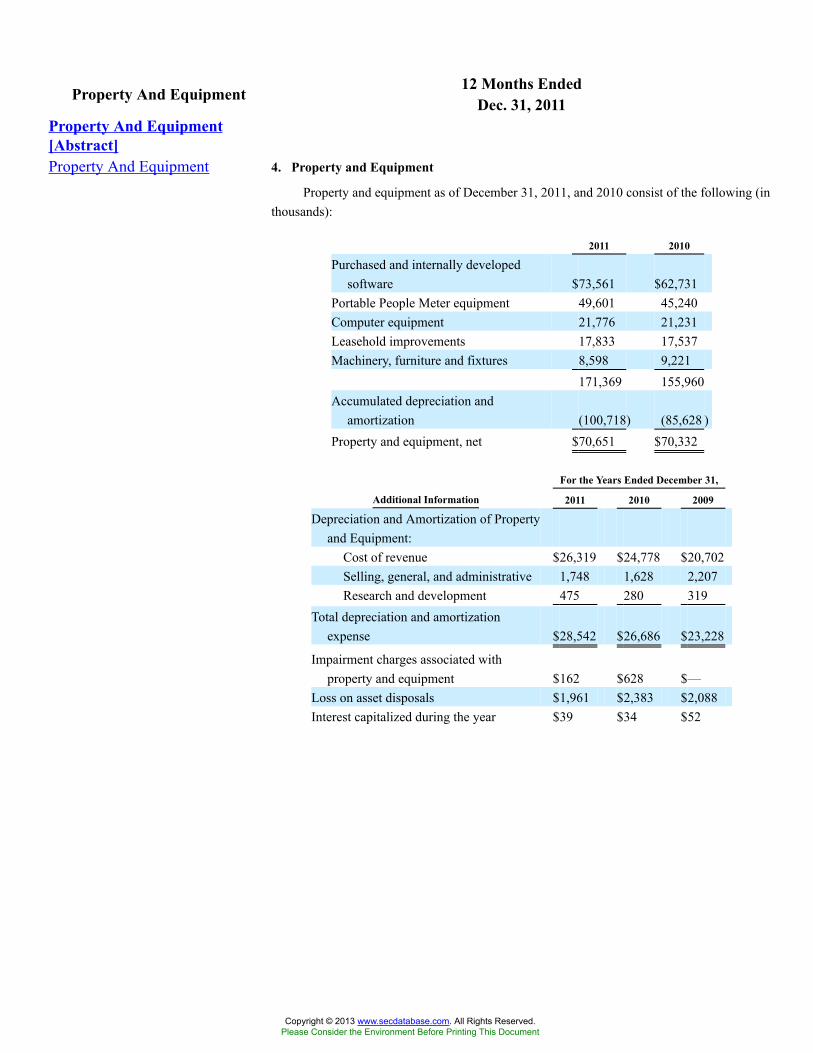
12 Months EndedProperty And Equipment Dec. 31, 2011Property And Equipment[Abstract]Property And Equipment 4. Property and Equipment
Property and equipment as of December 31, 2011, and 2010 consist of the following (inthousands):
2011 2010
Purchased and internally developedsoftware $73,561 $62,731
Portable People Meter equipment 49,601 45,240Computer equipment 21,776 21,231Leasehold improvements 17,833 17,537Machinery, furniture and fixtures 8,598 9,221
171,369 155,960Accumulated depreciation and
amortization (100,718) (85,628 )Property and equipment, net $70,651 $70,332
For the Years Ended December 31,
Additional Information 2011 2010 2009
Depreciation and Amortization of Propertyand Equipment:
Cost of revenue $26,319 $24,778 $20,702Selling, general, and administrative 1,748 1,628 2,207Research and development 475 280 319
Total depreciation and amortizationexpense $28,542 $26,686 $23,228
Impairment charges associated withproperty and equipment $162 $628 $—
Loss on asset disposals $1,961 $2,383 $2,088Interest capitalized during the year $39 $34 $52
Copyright © 2013 www.secdatabase.com. All Rights Reserved.Please Consider the Environment Before Printing This Document

12 Months EndedEquity And OtherInvestments Dec. 31, 2011
Equity And OtherInvestment [Abstract]Equity And Other Investments 3. Equity and Other Investments
The Company's equity and other investments consisted of the following (in thousands):
December 31,
2011
December 31,
2010
Scarborough $ 13,210 $ 13,205TRA preferred stock 1,703 5,180Equity and other investments $ 14,913 $ 18,385
The Company's 49.5% investment in Scarborough Research ("Scarborough"), a Delaware generalpartnership, is accounted for using the equity method of accounting. The Company's preferred stock investmentin TRA Global, Inc., a Delaware corporation ("TRA"), is accounted for using the cost method of accounting. SeeNote 15 for further information regarding the Company's TRA investment as of December 31, 2011 and the $3.5million impairment charge recorded in 2011. The following table shows the investment activity for each of theCompany's affiliates during 2011, 2010, and 2009.
Summary of Investment Activity in Affiliates (in thousands)
Year Ended December 31, 2011 Year Ended December 31, 2010 Year Ended December 31, 2009
Scarborough TRA Total Scarborough TRA Total Scarborough TRA Total
Beginningbalance $ 13,205 $5,180 $18,385 $ 13,538 $3,400 $16,938 $ 14,901 — $14,901
Equity in netincome 7,255 — 7,255 7,092 — 7,092 7,637 — 7,637
Impairmentloss — (3,477) (3,477 ) — — — — — —
Distributions (7,250 ) — (7,250 ) (7,425 ) — (7,425 ) (9,000 ) — (9,000 )Cash
investments — — — — 1,780 1,780 — 3,400 3,400Ending balance $ 13,210 $1,703 $14,913 $ 13,205 $5,180 $18,385 $ 13,538 $3,400 $16,938
Under the Scarborough partnership agreement, the Company has the exclusive right to licenseScarborough's services to radio broadcasters, cable companies, out-of-home media, and advertisers andadvertising agencies. The Company pays a royalty fee to Scarborough based on a percentage of revenues.Royalties of $26.2 million, $26.2 million, and $25.8 million for 2011, 2010, and 2009, respectively, are includedin cost of revenue in the Company's consolidated statements of income. Accrued royalties due to Scarborough asof December 31, 2011, and 2010, of $5.1 million and $6.0 million, respectively, are recorded in accrued expensesand other current liabilities in the consolidated balance sheets.
Scarborough's revenue was $65.7 million, $64.3 million, and $64.1 million in 2011, 2010 and 2009,respectively. Scarborough's net income was $14.5 million, $14.2 million, and $15.3 million, respectively in thesame periods. Scarborough's total assets and liabilities as of December 31, 2011, were $25.0 million and $2.9million, respectively, and $33.0 million and $2.1 million, as of December 31, 2010, respectively.
Copyright © 2013 www.secdatabase.com. All Rights Reserved.Please Consider the Environment Before Printing This Document

12 Months EndedFinancial Instruments Dec. 31, 2011Financial Instruments[Abstract]Financial Instruments 15. Financial Instruments
The management of the Company believes that the fair market value of the TRAinvestment approximates the carrying value of $1.7 million and $5.2 million as of December 31,2011, and 2010, respectively. The Company accounts for its $1.7 million investment in TRA'spreferred stock using the cost method of accounting. TRA is closely held and there is not anefficient market in which buyers and sellers determine the fair value of these shares. TheCompany periodically assesses the fair value of its investment in TRA through comparativeanalysis and analysis of TRA's actual and projected financial results. During the fourth quarterended December 31, 2011, the Company determined that the fair value of its investment in TRAfell below its carrying value and the Company recorded a $3.5 million impairment charge.
Fair values of accounts receivable and accounts payable approximate carrying values due totheir short-term nature. Due to the floating rate nature of the Company's revolving obligationunder its Credit Facility, the fair value of $53.0 million in outstanding borrowings as of December31, 2010, approximated its carrying amount. There were no outstanding borrowings as ofDecember 31, 2011 under the Company's Credit Facility.
Copyright © 2013 www.secdatabase.com. All Rights Reserved.Please Consider the Environment Before Printing This Document
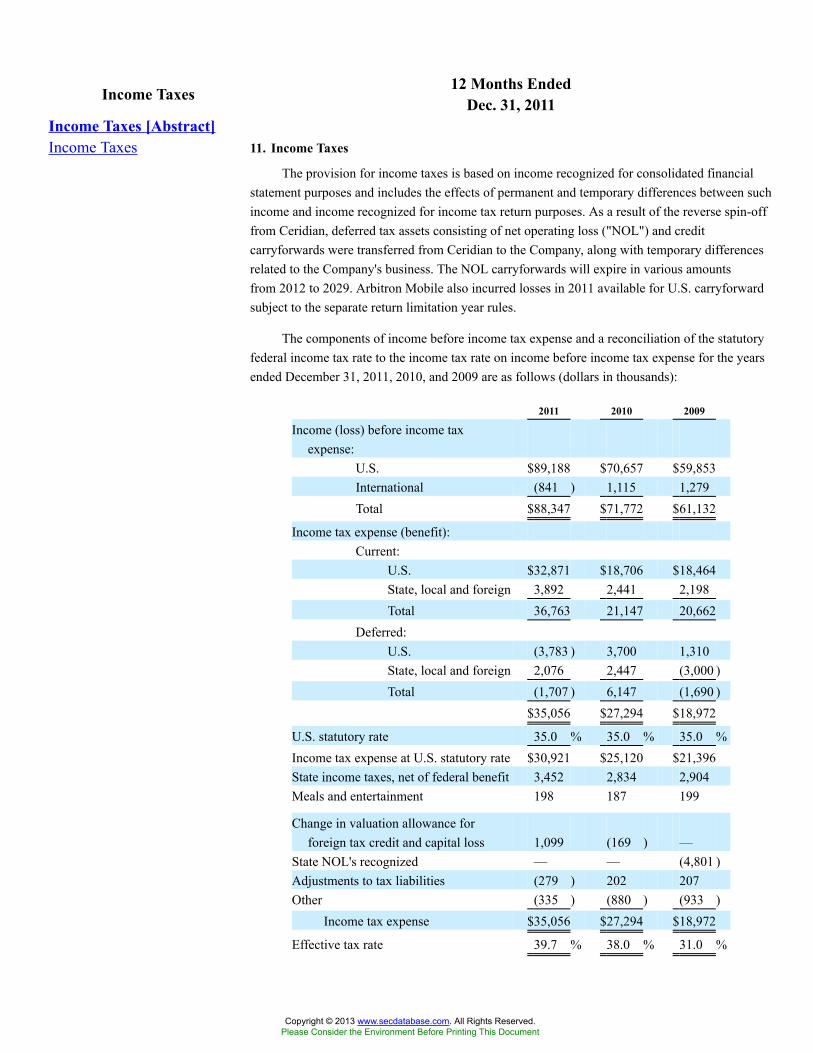
12 Months EndedIncome Taxes Dec. 31, 2011Income Taxes [Abstract]Income Taxes 11. Income Taxes
The provision for income taxes is based on income recognized for consolidated financialstatement purposes and includes the effects of permanent and temporary differences between suchincome and income recognized for income tax return purposes. As a result of the reverse spin-offfrom Ceridian, deferred tax assets consisting of net operating loss ("NOL") and creditcarryforwards were transferred from Ceridian to the Company, along with temporary differencesrelated to the Company's business. The NOL carryforwards will expire in various amountsfrom 2012 to 2029. Arbitron Mobile also incurred losses in 2011 available for U.S. carryforwardsubject to the separate return limitation year rules.
The components of income before income tax expense and a reconciliation of the statutoryfederal income tax rate to the income tax rate on income before income tax expense for the yearsended December 31, 2011, 2010, and 2009 are as follows (dollars in thousands):
2011 2010 2009
Income (loss) before income taxexpense:
U.S. $89,188 $70,657 $59,853International (841 ) 1,115 1,279Total $88,347 $71,772 $61,132
Income tax expense (benefit):Current:
U.S. $32,871 $18,706 $18,464State, local and foreign 3,892 2,441 2,198Total 36,763 21,147 20,662
Deferred:U.S. (3,783 ) 3,700 1,310State, local and foreign 2,076 2,447 (3,000 )Total (1,707 ) 6,147 (1,690 )
$35,056 $27,294 $18,972
U.S. statutory rate 35.0 % 35.0 % 35.0 %Income tax expense at U.S. statutory rate $30,921 $25,120 $21,396State income taxes, net of federal benefit 3,452 2,834 2,904Meals and entertainment 198 187 199
Change in valuation allowance forforeign tax credit and capital loss 1,099 (169 ) —
State NOL's recognized — — (4,801 )Adjustments to tax liabilities (279 ) 202 207Other (335 ) (880 ) (933 )
Income tax expense $35,056 $27,294 $18,972
Effective tax rate 39.7 % 38.0 % 31.0 %
Copyright © 2013 www.secdatabase.com. All Rights Reserved.Please Consider the Environment Before Printing This Document
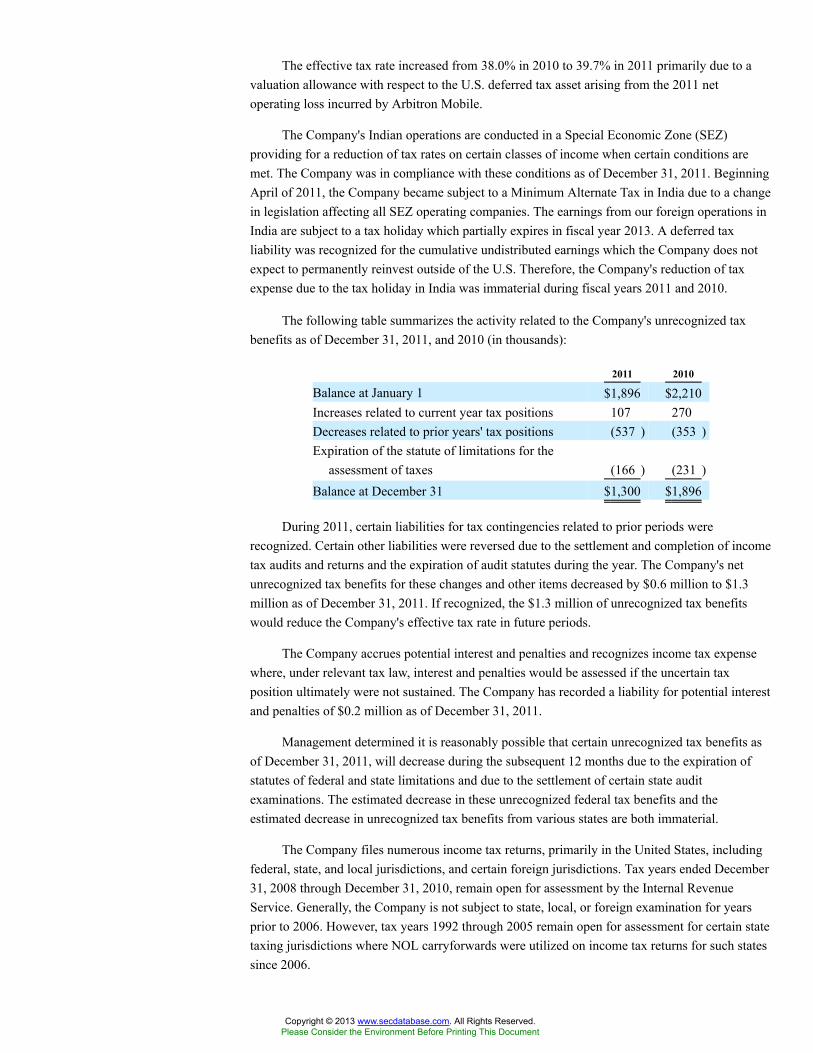
The effective tax rate increased from 38.0% in 2010 to 39.7% in 2011 primarily due to avaluation allowance with respect to the U.S. deferred tax asset arising from the 2011 netoperating loss incurred by Arbitron Mobile.
The Company's Indian operations are conducted in a Special Economic Zone (SEZ)providing for a reduction of tax rates on certain classes of income when certain conditions aremet. The Company was in compliance with these conditions as of December 31, 2011. BeginningApril of 2011, the Company became subject to a Minimum Alternate Tax in India due to a changein legislation affecting all SEZ operating companies. The earnings from our foreign operations inIndia are subject to a tax holiday which partially expires in fiscal year 2013. A deferred taxliability was recognized for the cumulative undistributed earnings which the Company does notexpect to permanently reinvest outside of the U.S. Therefore, the Company's reduction of taxexpense due to the tax holiday in India was immaterial during fiscal years 2011 and 2010.
The following table summarizes the activity related to the Company's unrecognized taxbenefits as of December 31, 2011, and 2010 (in thousands):
2011 2010
Balance at January 1 $1,896 $2,210Increases related to current year tax positions 107 270Decreases related to prior years' tax positions (537 ) (353 )Expiration of the statute of limitations for the
assessment of taxes (166 ) (231 )Balance at December 31 $1,300 $1,896
During 2011, certain liabilities for tax contingencies related to prior periods wererecognized. Certain other liabilities were reversed due to the settlement and completion of incometax audits and returns and the expiration of audit statutes during the year. The Company's netunrecognized tax benefits for these changes and other items decreased by $0.6 million to $1.3million as of December 31, 2011. If recognized, the $1.3 million of unrecognized tax benefitswould reduce the Company's effective tax rate in future periods.
The Company accrues potential interest and penalties and recognizes income tax expensewhere, under relevant tax law, interest and penalties would be assessed if the uncertain taxposition ultimately were not sustained. The Company has recorded a liability for potential interestand penalties of $0.2 million as of December 31, 2011.
Management determined it is reasonably possible that certain unrecognized tax benefits asof December 31, 2011, will decrease during the subsequent 12 months due to the expiration ofstatutes of federal and state limitations and due to the settlement of certain state auditexaminations. The estimated decrease in these unrecognized federal tax benefits and theestimated decrease in unrecognized tax benefits from various states are both immaterial.
The Company files numerous income tax returns, primarily in the United States, includingfederal, state, and local jurisdictions, and certain foreign jurisdictions. Tax years ended December31, 2008 through December 31, 2010, remain open for assessment by the Internal RevenueService. Generally, the Company is not subject to state, local, or foreign examination for yearsprior to 2006. However, tax years 1992 through 2005 remain open for assessment for certain statetaxing jurisdictions where NOL carryforwards were utilized on income tax returns for such statessince 2006.
Copyright © 2013 www.secdatabase.com. All Rights Reserved.Please Consider the Environment Before Printing This Document
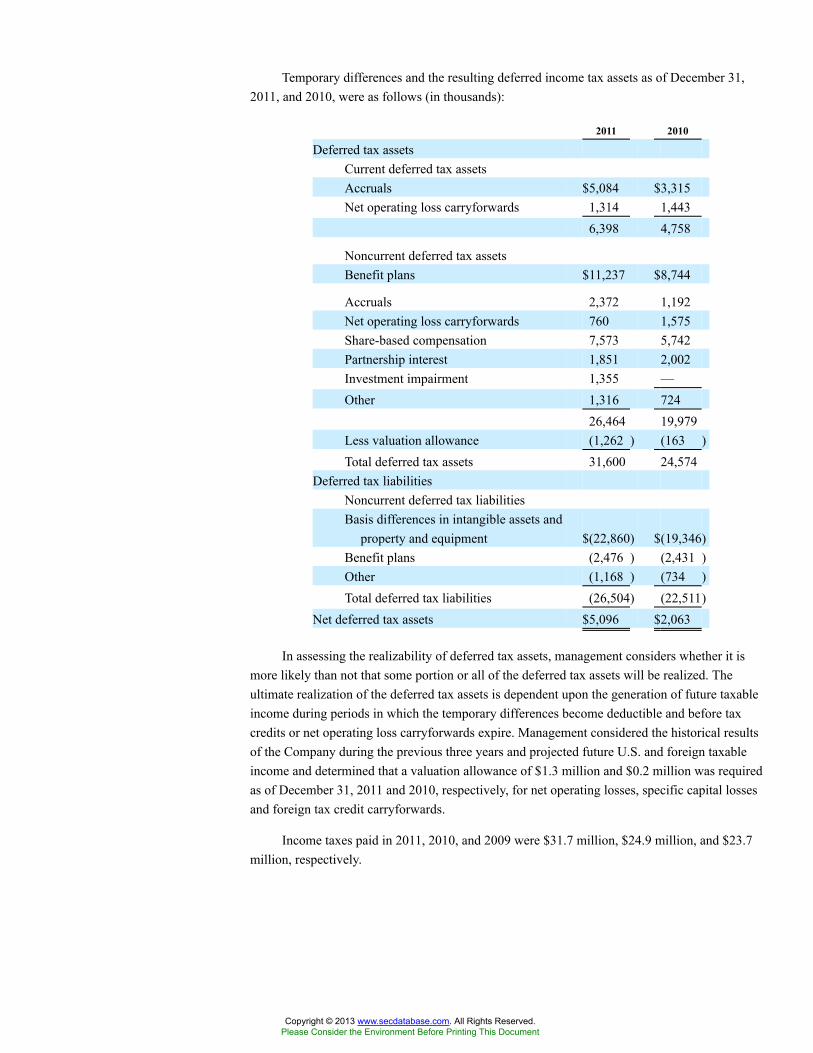
Temporary differences and the resulting deferred income tax assets as of December 31,2011, and 2010, were as follows (in thousands):
2011 2010
Deferred tax assetsCurrent deferred tax assetsAccruals $5,084 $3,315Net operating loss carryforwards 1,314 1,443
6,398 4,758
Noncurrent deferred tax assetsBenefit plans $11,237 $8,744
Accruals 2,372 1,192Net operating loss carryforwards 760 1,575Share-based compensation 7,573 5,742Partnership interest 1,851 2,002Investment impairment 1,355 —Other 1,316 724
26,464 19,979Less valuation allowance (1,262 ) (163 )Total deferred tax assets 31,600 24,574
Deferred tax liabilitiesNoncurrent deferred tax liabilitiesBasis differences in intangible assets and
property and equipment $(22,860) $(19,346)Benefit plans (2,476 ) (2,431 )Other (1,168 ) (734 )Total deferred tax liabilities (26,504) (22,511)
Net deferred tax assets $5,096 $2,063
In assessing the realizability of deferred tax assets, management considers whether it ismore likely than not that some portion or all of the deferred tax assets will be realized. Theultimate realization of the deferred tax assets is dependent upon the generation of future taxableincome during periods in which the temporary differences become deductible and before taxcredits or net operating loss carryforwards expire. Management considered the historical resultsof the Company during the previous three years and projected future U.S. and foreign taxableincome and determined that a valuation allowance of $1.3 million and $0.2 million was requiredas of December 31, 2011 and 2010, respectively, for net operating losses, specific capital lossesand foreign tax credit carryforwards.
Income taxes paid in 2011, 2010, and 2009 were $31.7 million, $24.9 million, and $23.7million, respectively.
Copyright © 2013 www.secdatabase.com. All Rights Reserved.Please Consider the Environment Before Printing This Document

3 Months Ended 12 Months EndedQuarterly Information(Schedule Of Quarterly
Information) (Details) (USD$)
In Thousands, except PerShare data, unless otherwise
specified
Dec.31,
2011
Sep.30,
2011
Jun.30,
2011
Mar.31,
2011
Dec.31,
2010
Sep.30,
2010
Jun.30,
2010
Mar.31,
2010
Dec.31,
2011
Dec.31,
2010
Dec.31,
2009
Quarterly Information[Abstract]Revenue $
120,141$105,563
$95,737
$100,869
$111,674
$99,470
$88,339
$95,896
$422,310
$395,379
$384,952
Gross profit 55,852 56,175 34,71255,190 49,386 49,08628,83552,743Net income $
14,109$15,351
$7,584
$16,247
$15,603
$11,328
$3,799
$13,748
$53,291
$44,478
$42,160
Basic $ 0.52 $ 0.56 $ 0.28 $ 0.60 $ 0.58 $ 0.42 $ 0.14 $ 0.52 $ 1.96 $ 1.66 $ 1.59Diluted $ 0.51 $ 0.55 $ 0.27 $ 0.59 $ 0.57 $ 0.42 $ 0.14 $ 0.51 $ 1.93 $ 1.64 $ 1.58Dividends per common share $ 0.10 $ 0.10 $ 0.10 $ 0.10 $ 0.10 $ 0.10 $ 0.10 $ 0.10 $ 0.40 $ 0.40 $ 0.40
Copyright © 2013 www.secdatabase.com. All Rights Reserved.Please Consider the Environment Before Printing This Document

12 Months EndedAccrued Expenses AndOther Current Liabilities Dec. 31, 2011
Accrued Expenses And Other CurrentLiabilities [Abstract]Accrued Expenses And Other CurrentLiabilities
7. Accrued Expenses and Other Current Liabilities
Accrued expenses and other current liabilities as of December 31, 2011, and2010, consisted of the following (in thousands):
2011 2010
Employee compensation and benefits $20,585 $15,914Royalties due to Scarborough 5,061 5,996Dividend payable 2,727 2,697Other 3,903 3,063
$32,276 $27,670
Copyright © 2013 www.secdatabase.com. All Rights Reserved.Please Consider the Environment Before Printing This Document
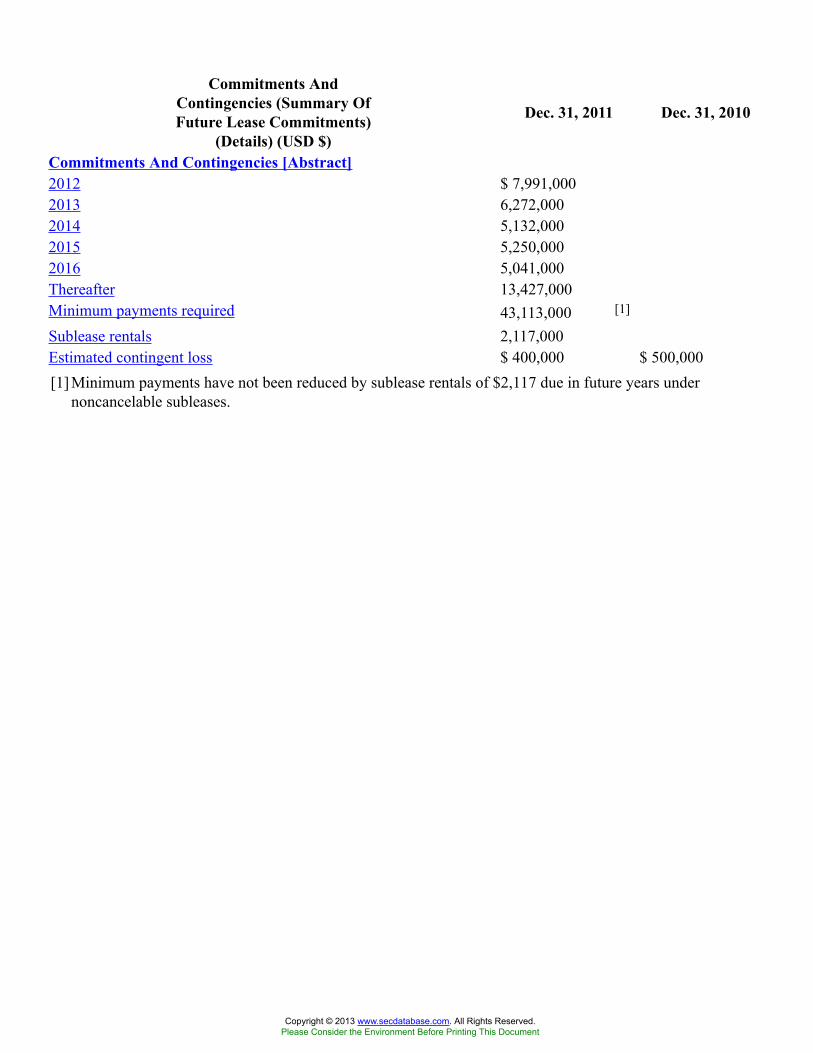
Commitments AndContingencies (Summary OfFuture Lease Commitments)
(Details) (USD $)
Dec. 31, 2011 Dec. 31, 2010
Commitments And Contingencies [Abstract]2012 $ 7,991,0002013 6,272,0002014 5,132,0002015 5,250,0002016 5,041,000Thereafter 13,427,000Minimum payments required 43,113,000 [1]
Sublease rentals 2,117,000Estimated contingent loss $ 400,000 $ 500,000[1] Minimum payments have not been reduced by sublease rentals of $2,117 due in future years under
noncancelable subleases.
Copyright © 2013 www.secdatabase.com. All Rights Reserved.Please Consider the Environment Before Printing This Document
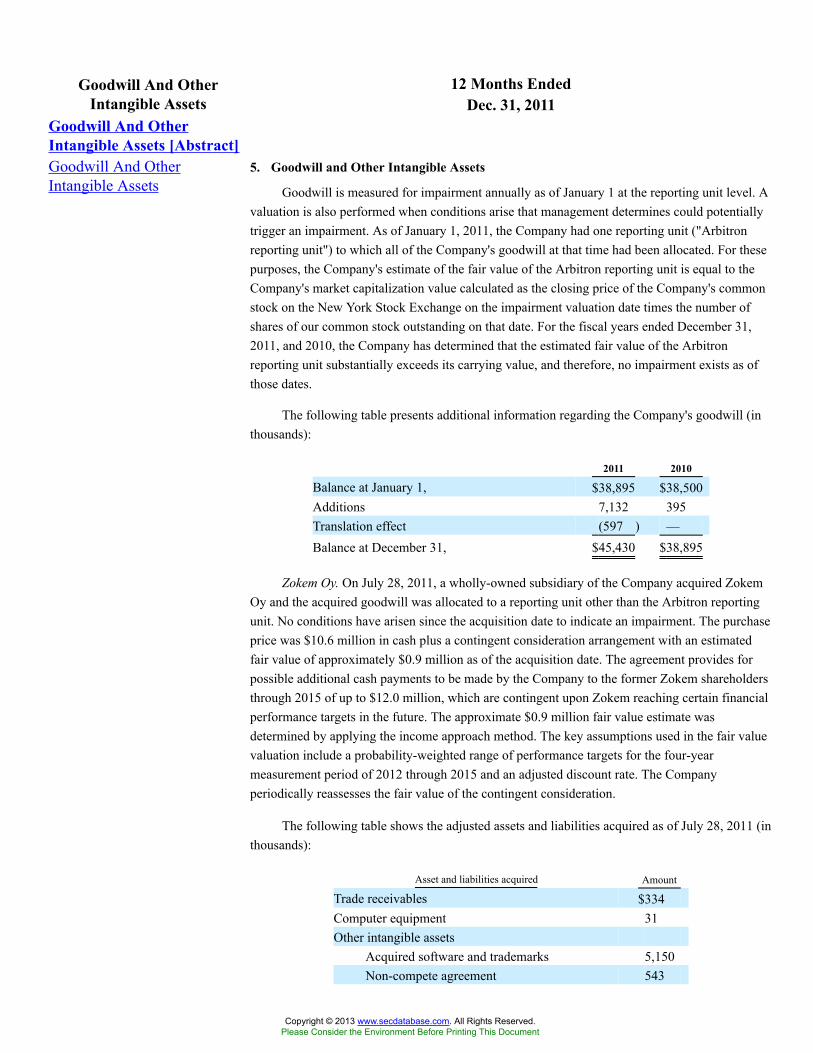
12 Months EndedGoodwill And OtherIntangible Assets Dec. 31, 2011
Goodwill And OtherIntangible Assets [Abstract]Goodwill And OtherIntangible Assets
5. Goodwill and Other Intangible Assets
Goodwill is measured for impairment annually as of January 1 at the reporting unit level. Avaluation is also performed when conditions arise that management determines could potentiallytrigger an impairment. As of January 1, 2011, the Company had one reporting unit ("Arbitronreporting unit") to which all of the Company's goodwill at that time had been allocated. For thesepurposes, the Company's estimate of the fair value of the Arbitron reporting unit is equal to theCompany's market capitalization value calculated as the closing price of the Company's commonstock on the New York Stock Exchange on the impairment valuation date times the number ofshares of our common stock outstanding on that date. For the fiscal years ended December 31,2011, and 2010, the Company has determined that the estimated fair value of the Arbitronreporting unit substantially exceeds its carrying value, and therefore, no impairment exists as ofthose dates.
The following table presents additional information regarding the Company's goodwill (inthousands):
2011 2010
Balance at January 1, $38,895 $38,500Additions 7,132 395Translation effect (597 ) —Balance at December 31, $45,430 $38,895
Zokem Oy. On July 28, 2011, a wholly-owned subsidiary of the Company acquired ZokemOy and the acquired goodwill was allocated to a reporting unit other than the Arbitron reportingunit. No conditions have arisen since the acquisition date to indicate an impairment. The purchaseprice was $10.6 million in cash plus a contingent consideration arrangement with an estimatedfair value of approximately $0.9 million as of the acquisition date. The agreement provides forpossible additional cash payments to be made by the Company to the former Zokem shareholdersthrough 2015 of up to $12.0 million, which are contingent upon Zokem reaching certain financialperformance targets in the future. The approximate $0.9 million fair value estimate wasdetermined by applying the income approach method. The key assumptions used in the fair valuevaluation include a probability-weighted range of performance targets for the four-yearmeasurement period of 2012 through 2015 and an adjusted discount rate. The Companyperiodically reassesses the fair value of the contingent consideration.
The following table shows the adjusted assets and liabilities acquired as of July 28, 2011 (inthousands):
Asset and liabilities acquired Amount
Trade receivables $334Computer equipment 31Other intangible assets
Acquired software and trademarks 5,150Non-compete agreement 543
Copyright © 2013 www.secdatabase.com. All Rights Reserved.Please Consider the Environment Before Printing This Document

Customer relationships 907Total assets 6,965Accounts payable (130 )Other current liabilities (197 )Debt assumed (1,103 )Noncurrent liabilities (1,217 )Net assets acquired 4,318Goodwill 7,132Total purchase price, net of cash acquired $11,450
The other intangible assets are being amortized over a weighted average life of 5.0 years.The amount of acquisition-related costs incurred and charged to selling, general andadministrative expense during 2011 was $0.7 million.
Integrated Media Measurement, Inc. On June 15, 2010, a wholly-owned subsidiary of theCompany purchased the technology portfolio, trade name, and equipment of Integrated MediaMeasurement, Inc. The Company paid $2.5 million for these assets, which included $1.8 millionof other intangible assets, $0.3 million of computer equipment, and $0.4 million of goodwill.
Digimarc Corporation. On March 23, 2010, the Company entered into a licensingarrangement with Digimarc Corporation ("Digimarc") to receive a non-exclusive, worldwide andirrevocable license to a substantial portion of Digimarc's domestic and international patentportfolio. The Company paid $4.5 million for this other intangible asset.
Other intangible assets are being amortized to expense over their estimated useful lives.The following table presents additional information regarding the Company's other intangibleassets (in thousands):
Other intangible assets
December 31, 2011
Acquired
software and
trademarks
Patent
licenses
Non-
compete
covenant Customer lists Total
Gross balance $ 6,425 $4,500 $ 489 $ 2,230 $13,644
Accumulated Amortization (947 ) (1,130) (104 ) (937 ) (3,118 )Net $ 5,478 $3,370 $ 385 $ 1,293 $10,526
December 31, 2010
Acquired
software and
trademarks
Patent
licenses
Non-
compete
covenant Customer lists Total
Gross balance $ 1,785 $4,500 $ — $ 1,413 $7,698
Accumulated Amortization (193 ) (487 ) — (746 ) (1,426)Net $ 1,592 $4,013 $ — $ 667 $6,272
2011 2010 2009
Amortization expense for other intangibles $1,713 $822 $141
Copyright © 2013 www.secdatabase.com. All Rights Reserved.Please Consider the Environment Before Printing This Document
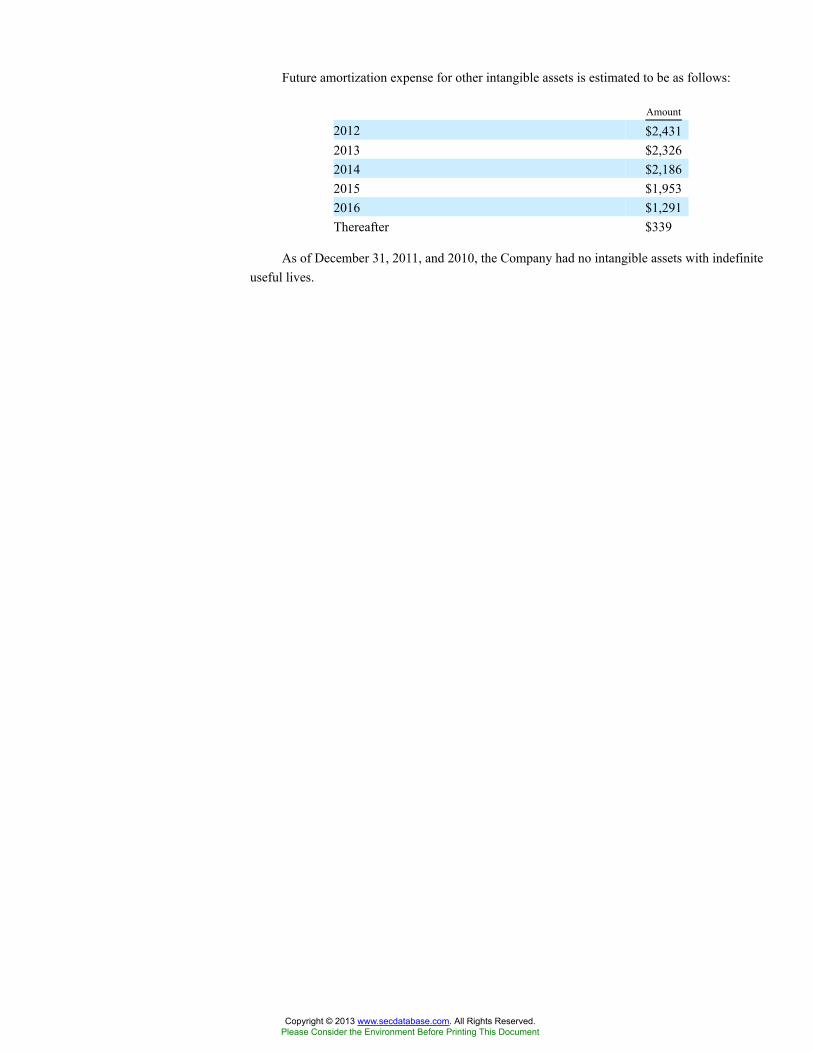
Future amortization expense for other intangible assets is estimated to be as follows:
Amount
2012 $2,4312013 $2,3262014 $2,1862015 $1,9532016 $1,291Thereafter $339
As of December 31, 2011, and 2010, the Company had no intangible assets with indefiniteuseful lives.
Copyright © 2013 www.secdatabase.com. All Rights Reserved.Please Consider the Environment Before Printing This Document

12 Months EndedPrepaids And Other CurrentAssets Dec. 31, 2011
Prepaids And Other CurrentAssets [Abstract]Prepaids And Other CurrentAssets
6. Prepaids and Other Current Assets
Prepaids and other current assets as of December 31, 2011, and 2010, consist of thefollowing (in thousands):
December 31, 2011 December 31, 2010
Prepaid income taxes $ 1,984 $ 5,518Survey participant
incentives and prepaidpostage 1,770 2,467
Insurance recoveryreceivables 993 601
Other 2,394 2,746Prepaids and other current
assets $ 7,141 $ 11,332
During 2008, the Company became involved in two securities-law civil actions and agovernmental interaction primarily related to the commercialization of the Company's PPMservice. The management of the Company believes a portion of these legal fees and costs arecovered by the Company's Directors and Officers insurance policy and therefore has recognizedan insurance recovery receivable. From 2008 until 2011, the Company had incurredapproximately $12.1 million in legal fees and costs in defense of its positions related thereto, andas of December 31, 2011, the Company had received $7.9 million in insurance reimbursementsrelated to these legal actions. From 2008 until December 31, 2010, the Company had incurredapproximately $9.7 million in legal fees and costs in defense of its positions related thereto, andas of December 31, 2010, the Company had received $5.9 million in insurance reimbursements.In addition, see the discussion in "Item 3. Legal Proceedings" about the proposed settlement ofthe class action.
For 2011, 2010, and 2009, the Company incurred approximately $2.4 million, $0.9 million,and $2.6 million, respectively, in related legal fees, which were recognized as increases to selling,general, and administrative expense. These legal fees were offset by $2.4 million, $0.9 millionand $0.7 million in anticipated insurance recoveries, which were recognized as reductions toselling, general and administrative expense during 2011, 2010, and 2009, respectively. Theinsurance recovery receivable as of December 31, 2011 and 2010 was $1.0 million and $0.6million, respectively.
Copyright © 2013 www.secdatabase.com. All Rights Reserved.Please Consider the Environment Before Printing This Document
12 Months EndedDebt Dec. 31, 2011Debt [Abstract]Debt 8. Debt
On November 21, 2011, the Company terminated its credit facility agreement originallysigned on December 20, 2006 (the "2006 Credit Facility"). Also, on November 21, 2011, theCompany entered into a new agreement with a consortium of lenders to provide up to $150.0million of financing to the Company through a five-year, unsecured revolving credit facility (the"Credit Facility") expiring on November 21, 2016. The agreement contains an expansion featureto increase the total financing available under the Credit Facility by up to $75.0 million to anaggregate of $225.0 million. Such increased financing would be provided by one or more existingCredit Facility lending institutions, subject to the approval of the lending banks, and/or incombination with one or more new lending institutions, subject to the approval of the CreditFacility's administrative agent. The Credit Facility includes a $20.0 million maximum letter ofcredit commitment. As of December 31, 2011, the Company had outstanding letters of credit of$0.2 million.
The Credit Facility has two borrowing options, a Eurodollar rate option or an alternate baserate option, as defined in the Credit Facility. Under the Eurodollar option, the Company may electinterest periods of one, two, three or six months (or, with the consent of each lender, nine ortwelve months) at the inception date and each renewal date. Borrowings under the Eurodollaroption bear interest at the London Interbank Offered Rate (LIBOR) plus a margin of 1.05% to1.40%. Borrowings under the base rate option bear interest at the higher of the lead lender's primerate, the Federal Funds rate plus 50 basis points, or the one-month LIBOR rate adjusted for thestatutory reserve rate plus 1%. The specific margins, under the Eurodollar rate option, isdetermined based on the Company's leverage ratio and is subject to adjustment every 90days. The Credit Facility contains a facility fee provision whereby the Company is charged a fee,ranging from 0.20% to 0.35%, applied to the total amount of the commitment.
Interest paid in 2011, 2010, and 2009, was $0.5 million, $0.9 million, and $1.4 million,respectively. Interest capitalized in 2011, 2010, and 2009 was less than $0.1 million for each of2011 and 2010, and $0.1 million for 2009. Non-cash amortization of deferred financing costsclassified as interest expense was $0.1 million in each of 2011, 2010, and 2009. As of December31, 2011, there were no outstanding borrowings under the Credit Facility. As of December 31,2010, the outstanding borrowings under the 2006 Credit Facility were $53.0 million and therelated interest rate on such borrowings was 0.83%.
The Credit Facility contains certain financial covenants, and limits, among other things, theCompany's ability to sell certain assets, incur additional indebtedness, and grant or incur liens onits assets. The material debt covenants under the Company's Credit Facility include both amaximum leverage ratio ("leverage ratio") and a minimum interest coverage ratio ("interestcoverage ratio"). The leverage ratio is a non-GAAP financial measure equal to the amount of theCompany's consolidated total indebtedness, as defined in the Credit Facility, divided by acontractually defined adjusted Earnings Before Interest, Taxes, Depreciation and Amortizationand non-cash compensation ("Consolidated EBITDA") for the trailing four-quarter period. Theinterest coverage ratio is a non-GAAP financial measure equal to the same contractually definedConsolidated EBITDA divided by total interest expense. Both ratios are designed as measures ofthe Company's ability to meet current and future obligations.
Copyright © 2013 www.secdatabase.com. All Rights Reserved.Please Consider the Environment Before Printing This Document

As of December 31, 2011, based upon these financial covenants, there was no default orlimit on the Company's ability to borrow the unused portion of the Credit Facility.
The Credit Facility also contains customary events of default, including nonpayment andbreach covenants. In the event of default, repayment of borrowings under the Credit Facility, aswell as the payment of accrued interest and fees, could be accelerated. The Credit Facility alsocontains cross default provisions whereby a default on any material indebtedness, as defined inthe Credit Facility, could result in the acceleration of our outstanding debt and the termination ofany unused commitment under the Credit Facility. In addition, a default may result in theapplication of higher rates of interest on the amounts due. The Company currently has no materialoutstanding debt.
Under the terms of the Credit Facility, all of the Company's material domestic subsidiaries,if any, guarantee the commitment. As of December 31, 2011, the Company had no materialdomestic subsidiaries as defined by the terms of the Credit Facility. As of December 31, 2011, theCompany was in compliance with the terms of its Credit Facility.
Copyright © 2013 www.secdatabase.com. All Rights Reserved.Please Consider the Environment Before Printing This Document
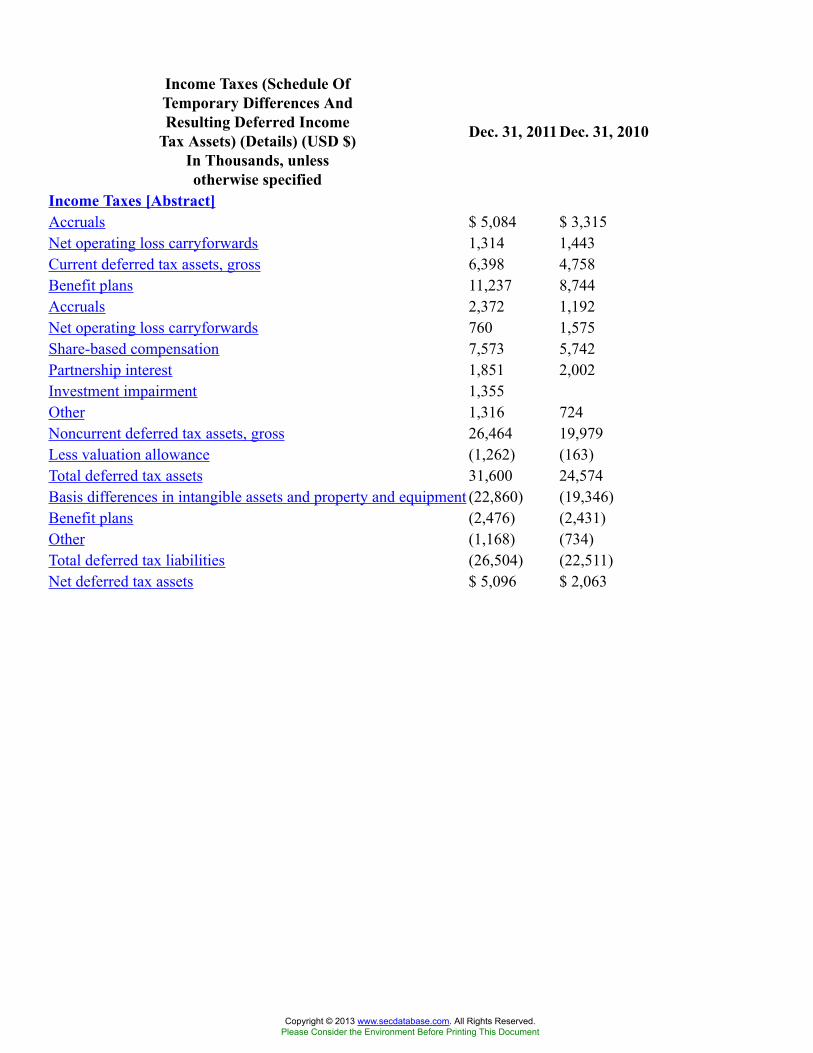
Income Taxes (Schedule OfTemporary Differences AndResulting Deferred Income
Tax Assets) (Details) (USD $)In Thousands, unlessotherwise specified
Dec. 31, 2011Dec. 31, 2010
Income Taxes [Abstract]Accruals $ 5,084 $ 3,315Net operating loss carryforwards 1,314 1,443Current deferred tax assets, gross 6,398 4,758Benefit plans 11,237 8,744Accruals 2,372 1,192Net operating loss carryforwards 760 1,575Share-based compensation 7,573 5,742Partnership interest 1,851 2,002Investment impairment 1,355Other 1,316 724Noncurrent deferred tax assets, gross 26,464 19,979Less valuation allowance (1,262) (163)Total deferred tax assets 31,600 24,574Basis differences in intangible assets and property and equipment (22,860) (19,346)Benefit plans (2,476) (2,431)Other (1,168) (734)Total deferred tax liabilities (26,504) (22,511)Net deferred tax assets $ 5,096 $ 2,063
Copyright © 2013 www.secdatabase.com. All Rights Reserved.Please Consider the Environment Before Printing This Document
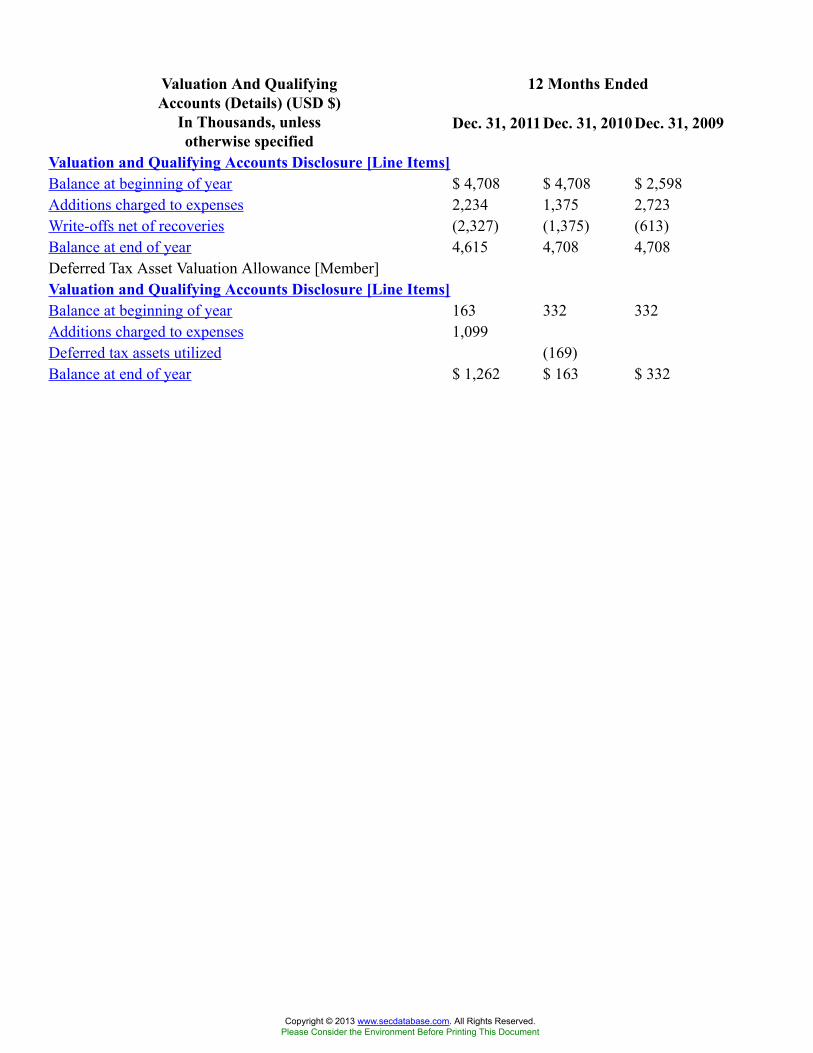
12 Months EndedValuation And QualifyingAccounts (Details) (USD $)
In Thousands, unlessotherwise specified
Dec. 31, 2011Dec. 31, 2010 Dec. 31, 2009
Valuation and Qualifying Accounts Disclosure [Line Items]Balance at beginning of year $ 4,708 $ 4,708 $ 2,598Additions charged to expenses 2,234 1,375 2,723Write-offs net of recoveries (2,327) (1,375) (613)Balance at end of year 4,615 4,708 4,708Deferred Tax Asset Valuation Allowance [Member]Valuation and Qualifying Accounts Disclosure [Line Items]Balance at beginning of year 163 332 332Additions charged to expenses 1,099Deferred tax assets utilized (169)Balance at end of year $ 1,262 $ 163 $ 332
Copyright © 2013 www.secdatabase.com. All Rights Reserved.Please Consider the Environment Before Printing This Document
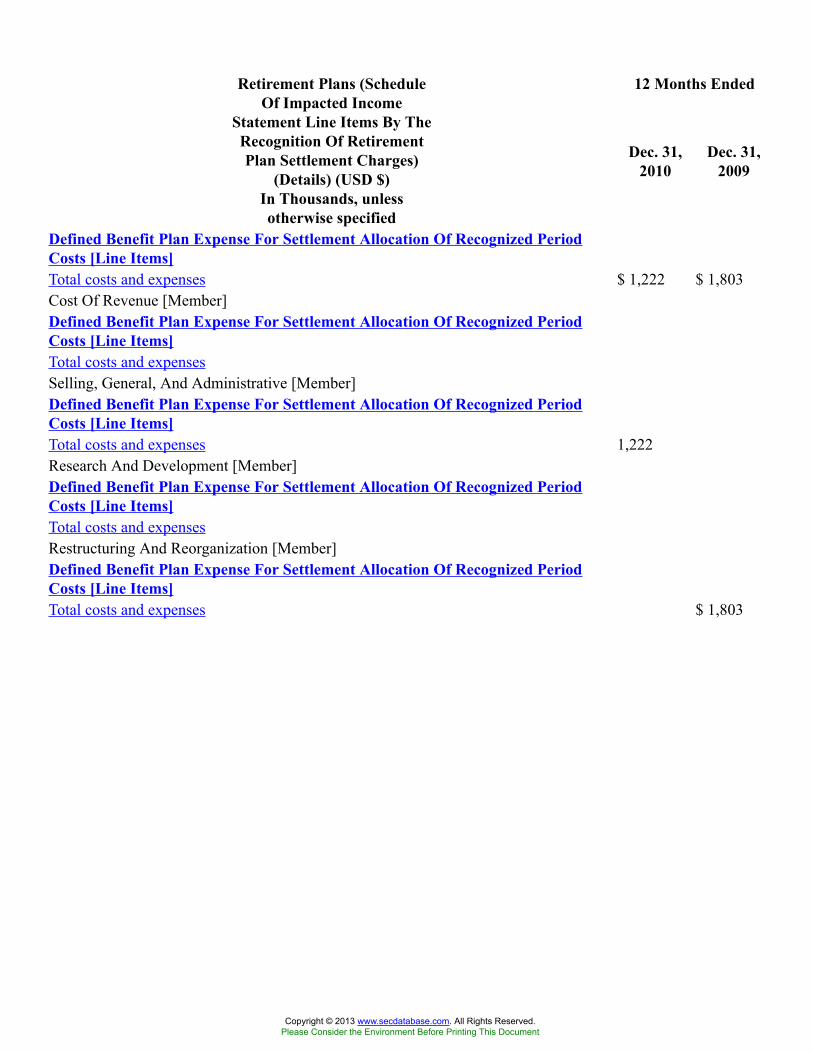
12 Months EndedRetirement Plans (ScheduleOf Impacted Income
Statement Line Items By TheRecognition Of RetirementPlan Settlement Charges)
(Details) (USD $)In Thousands, unlessotherwise specified
Dec. 31,2010
Dec. 31,2009
Defined Benefit Plan Expense For Settlement Allocation Of Recognized PeriodCosts [Line Items]Total costs and expenses $ 1,222 $ 1,803Cost Of Revenue [Member]Defined Benefit Plan Expense For Settlement Allocation Of Recognized PeriodCosts [Line Items]Total costs and expensesSelling, General, And Administrative [Member]Defined Benefit Plan Expense For Settlement Allocation Of Recognized PeriodCosts [Line Items]Total costs and expenses 1,222Research And Development [Member]Defined Benefit Plan Expense For Settlement Allocation Of Recognized PeriodCosts [Line Items]Total costs and expensesRestructuring And Reorganization [Member]Defined Benefit Plan Expense For Settlement Allocation Of Recognized PeriodCosts [Line Items]Total costs and expenses $ 1,803
Copyright © 2013 www.secdatabase.com. All Rights Reserved.Please Consider the Environment Before Printing This Document
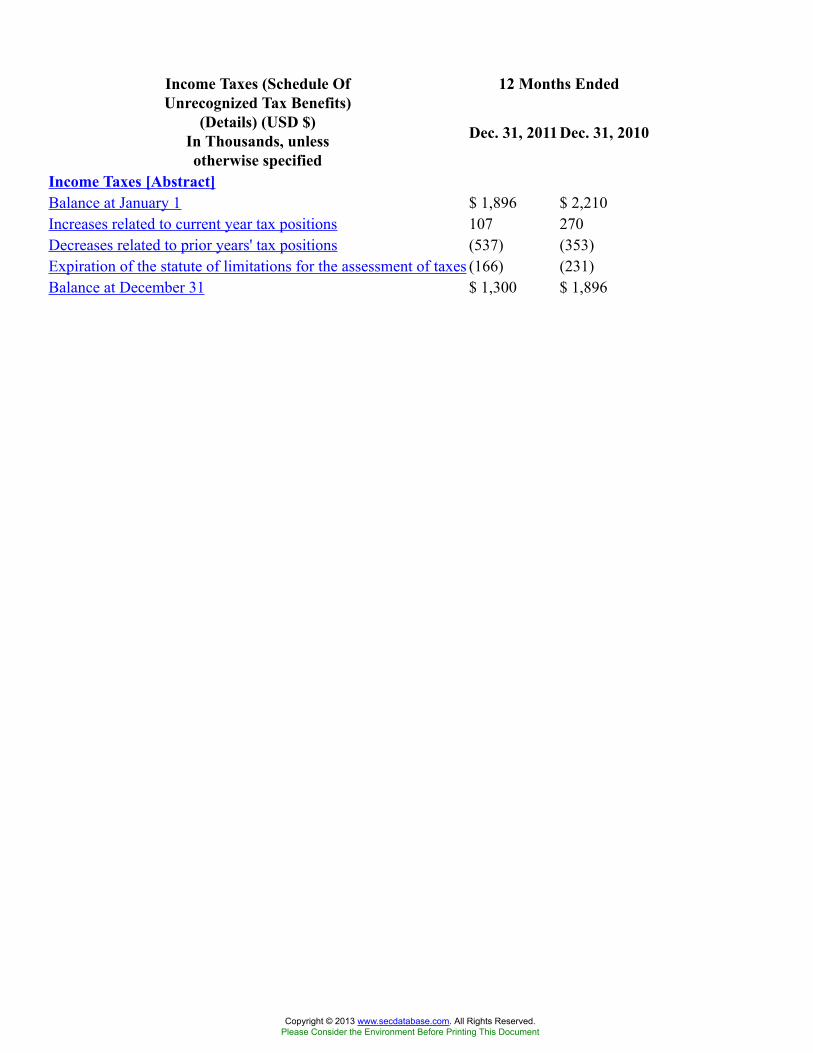
12 Months EndedIncome Taxes (Schedule OfUnrecognized Tax Benefits)
(Details) (USD $)In Thousands, unlessotherwise specified
Dec. 31, 2011Dec. 31, 2010
Income Taxes [Abstract]Balance at January 1 $ 1,896 $ 2,210Increases related to current year tax positions 107 270Decreases related to prior years' tax positions (537) (353)Expiration of the statute of limitations for the assessment of taxes (166) (231)Balance at December 31 $ 1,300 $ 1,896
Copyright © 2013 www.secdatabase.com. All Rights Reserved.Please Consider the Environment Before Printing This Document

12 Months EndedAccumulated OtherComprehensive Loss
(Tables) Dec. 31, 2011
Accumulated Other Comprehensive Loss [Abstract]Schedule Of Accumulated Other Comprehensive Loss 2011 2010
Retirement planliabilities, net of tax $(13,453) $(9,600 )
Foreign currencytranslation (2,148 ) (460 )
Accumulated othercomprehensive loss $(15,601) $(10,060)
Copyright © 2013 www.secdatabase.com. All Rights Reserved.Please Consider the Environment Before Printing This Document

Goodwill And OtherIntangible Assets (ScheduleOf Other Intangible Assets)
(Details) (USD $)In Thousands, unlessotherwise specified
Dec. 31, 2011Dec. 31, 2010
Finite-Lived Intangible Assets [Line Items]Gross balance $ 13,644 $ 7,698Accumulated Amortization (3,118) (1,426)Net 10,526 6,272Acquired Software And Trademarks [Member]Finite-Lived Intangible Assets [Line Items]Gross balance 6,425 1,785Accumulated Amortization (947) (193)Net 5,478 1,592Patent Licenses [Member]Finite-Lived Intangible Assets [Line Items]Gross balance 4,500 4,500Accumulated Amortization (1,130) (487)Net 3,370 4,013Non-Compete Covenant [Member]Finite-Lived Intangible Assets [Line Items]Gross balance 489Accumulated Amortization (104)Net 385Customer Lists [Member]Finite-Lived Intangible Assets [Line Items]Gross balance 2,230 1,413Accumulated Amortization (937) (746)Net $ 1,293 $ 667
Copyright © 2013 www.secdatabase.com. All Rights Reserved.Please Consider the Environment Before Printing This Document
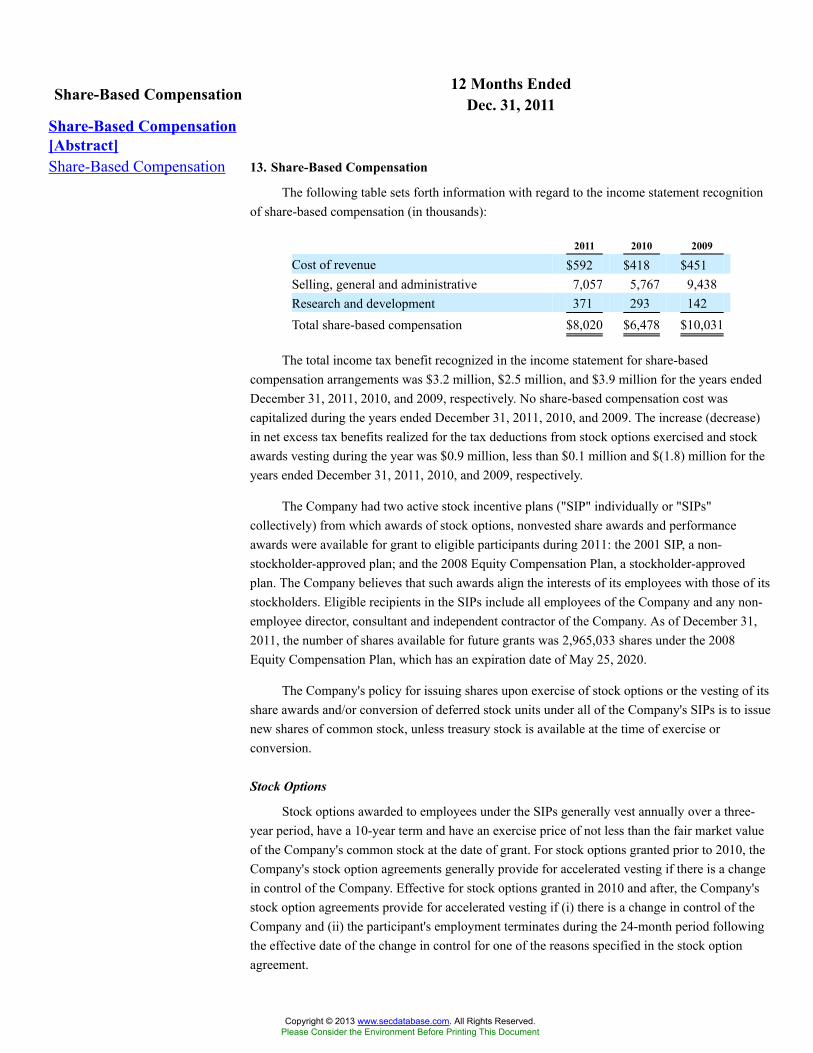
12 Months EndedShare-Based Compensation Dec. 31, 2011Share-Based Compensation[Abstract]Share-Based Compensation 13. Share-Based Compensation
The following table sets forth information with regard to the income statement recognitionof share-based compensation (in thousands):
2011 2010 2009
Cost of revenue $592 $418 $451Selling, general and administrative 7,057 5,767 9,438Research and development 371 293 142Total share-based compensation $8,020 $6,478 $10,031
The total income tax benefit recognized in the income statement for share-basedcompensation arrangements was $3.2 million, $2.5 million, and $3.9 million for the years endedDecember 31, 2011, 2010, and 2009, respectively. No share-based compensation cost wascapitalized during the years ended December 31, 2011, 2010, and 2009. The increase (decrease)in net excess tax benefits realized for the tax deductions from stock options exercised and stockawards vesting during the year was $0.9 million, less than $0.1 million and $(1.8) million for theyears ended December 31, 2011, 2010, and 2009, respectively.
The Company had two active stock incentive plans ("SIP" individually or "SIPs"collectively) from which awards of stock options, nonvested share awards and performanceawards were available for grant to eligible participants during 2011: the 2001 SIP, a non-stockholder-approved plan; and the 2008 Equity Compensation Plan, a stockholder-approvedplan. The Company believes that such awards align the interests of its employees with those of itsstockholders. Eligible recipients in the SIPs include all employees of the Company and any non-employee director, consultant and independent contractor of the Company. As of December 31,2011, the number of shares available for future grants was 2,965,033 shares under the 2008Equity Compensation Plan, which has an expiration date of May 25, 2020.
The Company's policy for issuing shares upon exercise of stock options or the vesting of itsshare awards and/or conversion of deferred stock units under all of the Company's SIPs is to issuenew shares of common stock, unless treasury stock is available at the time of exercise orconversion.
Stock Options
Stock options awarded to employees under the SIPs generally vest annually over a three-year period, have a 10-year term and have an exercise price of not less than the fair market valueof the Company's common stock at the date of grant. For stock options granted prior to 2010, theCompany's stock option agreements generally provide for accelerated vesting if there is a changein control of the Company. Effective for stock options granted in 2010 and after, the Company'sstock option agreements provide for accelerated vesting if (i) there is a change in control of theCompany and (ii) the participant's employment terminates during the 24-month period followingthe effective date of the change in control for one of the reasons specified in the stock optionagreement.
Copyright © 2013 www.secdatabase.com. All Rights Reserved.Please Consider the Environment Before Printing This Document

Compensation expense for stock options is recognized on a straight-line basis over thevesting period using the fair value of each stock option estimated as of the grant date. TheCompany uses historical data to estimate future option exercises and employee terminations inorder to determine the expected term of the stock option, where the expected term of the stockoption granted represents the period of time that such stock option is expected to be outstanding.Identified groups of option holders with similar historical exercise behavior are consideredseparately for valuation purposes. The expected term of stock options can vary for groups ofoption holders exhibiting different behavior. The fair value of each stock option granted toemployees and non-employee directors was estimated on the date of grant using a Black-Scholesstock option valuation model, which uses a risk-free interest rate and measure of volatility, amongother things, to estimate fair value. The risk-free interest rate for periods within the contractuallife of the stock option is based on the U.S. Treasury strip bond yield curve in effect at the time ofgrant. Expected volatilities are based on the historical volatility of the Company's common stock.
The fair value of each stock option granted during the years ended December 31, 2011,2010, and 2009, was estimated using the assumptions noted in the following table:
Assumptions for Stock Options Granted 2011 2010 2009
Expected volatility 39.64 - 41.09% 35.56 - 39.89% 31.88 - 35.31%Expected dividends 0.90- 1.19% 1.50- 1.80% 1.91- 2.95%Expected term (in years) 5.66- 5.89 4.50- 6.50 5.75- 6.25Risk-free rate 1.24- 2.76% 1.73- 3.29% 2.13- 2.94%Weighted-average volatility 40.45% 37.76% 33.96%Weighted-average dividends 1.04% 1.75% 2.22%Weighted-average term (in years) 5.86 5.43 5.96Weighted-average risk-free rate 1.97% 2.45% 2.47%Weighted-average grant date fair
value $14.55 $7.33 $5.31
A summary of stock option activity under the SIPs as of December 31, 2011, and changesduring the year then ended, is presented below:
Options Shares
Weighted-
Average
Exercise
Price
Weighted-
Average
Remaining
Contractual
Term
(Years)
Aggregate
Intrinsic
Value
(In thousands)
Outstanding at December 31,2010 2,020,767 $ 32.17
Granted 154,226 39.21Exercised (115,788 ) 20.18Forfeited or expired (15,431 ) 30.95Outstanding at December 31,
2011 2,043,774 $ 33.39 5.62 $ 10,537
Vested or expected to vest atDecember 31, 2011 2,009,984 $ 33.49 5.57 $ 10,240
Exercisable at December 31,2011 1,549,376 $ 35.69 4.77 $ 5,681
Copyright © 2013 www.secdatabase.com. All Rights Reserved.Please Consider the Environment Before Printing This Document
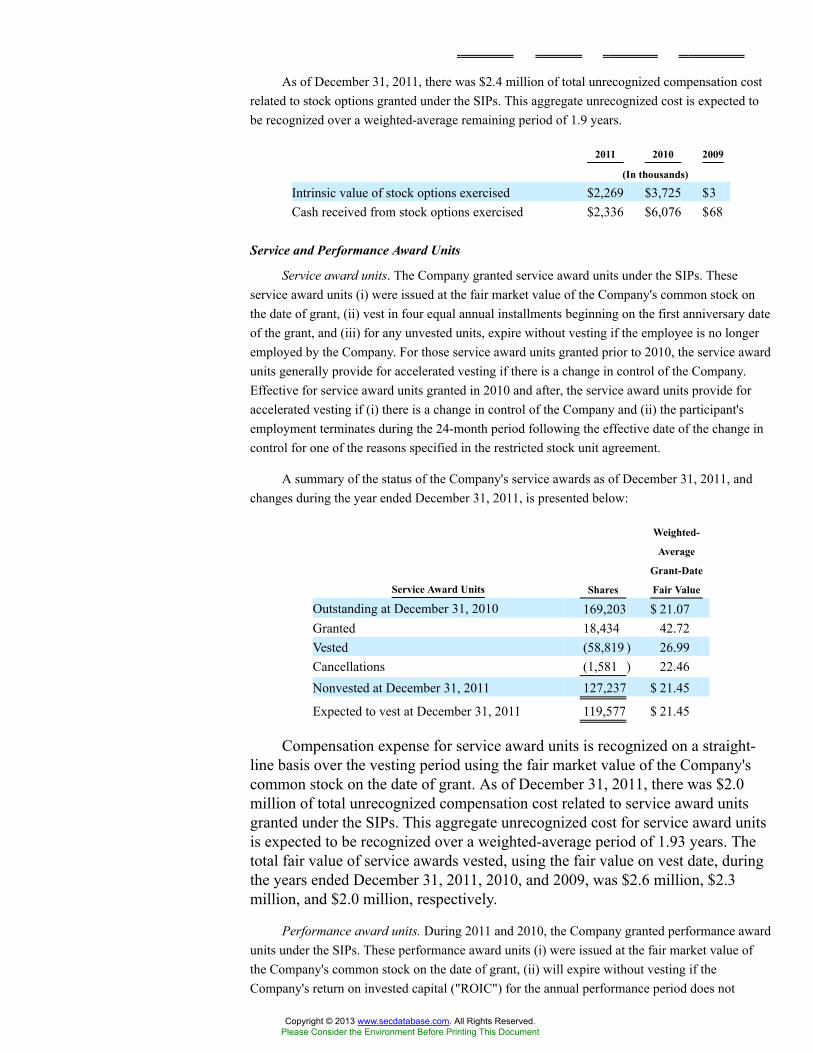
As of December 31, 2011, there was $2.4 million of total unrecognized compensation costrelated to stock options granted under the SIPs. This aggregate unrecognized cost is expected tobe recognized over a weighted-average remaining period of 1.9 years.
2011 2010 2009
(In thousands)
Intrinsic value of stock options exercised $2,269 $3,725 $3Cash received from stock options exercised $2,336 $6,076 $68
Service and Performance Award Units
Service award units. The Company granted service award units under the SIPs. Theseservice award units (i) were issued at the fair market value of the Company's common stock onthe date of grant, (ii) vest in four equal annual installments beginning on the first anniversary dateof the grant, and (iii) for any unvested units, expire without vesting if the employee is no longeremployed by the Company. For those service award units granted prior to 2010, the service awardunits generally provide for accelerated vesting if there is a change in control of the Company.Effective for service award units granted in 2010 and after, the service award units provide foraccelerated vesting if (i) there is a change in control of the Company and (ii) the participant'semployment terminates during the 24-month period following the effective date of the change incontrol for one of the reasons specified in the restricted stock unit agreement.
A summary of the status of the Company's service awards as of December 31, 2011, andchanges during the year ended December 31, 2011, is presented below:
Service Award Units Shares
Weighted-
Average
Grant-Date
Fair Value
Outstanding at December 31, 2010 169,203 $ 21.07Granted 18,434 42.72Vested (58,819 ) 26.99Cancellations (1,581 ) 22.46Nonvested at December 31, 2011 127,237 $ 21.45
Expected to vest at December 31, 2011 119,577 $ 21.45
Compensation expense for service award units is recognized on a straight-line basis over the vesting period using the fair market value of the Company'scommon stock on the date of grant. As of December 31, 2011, there was $2.0million of total unrecognized compensation cost related to service award unitsgranted under the SIPs. This aggregate unrecognized cost for service award unitsis expected to be recognized over a weighted-average period of 1.93 years. Thetotal fair value of service awards vested, using the fair value on vest date, duringthe years ended December 31, 2011, 2010, and 2009, was $2.6 million, $2.3million, and $2.0 million, respectively.
Performance award units. During 2011 and 2010, the Company granted performance awardunits under the SIPs. These performance award units (i) were issued at the fair market value ofthe Company's common stock on the date of grant, (ii) will expire without vesting if theCompany's return on invested capital ("ROIC") for the annual performance period does not
Copyright © 2013 www.secdatabase.com. All Rights Reserved.Please Consider the Environment Before Printing This Document

exceed 12 percent, which is an approximation of the Company's weighted average cost of capital,(iii) will, if the Company's ROIC exceeds 12 percent, vest in four equal annual installmentsbeginning on the first anniversary date of the grant, and (iv) for any unvested units, expirewithout vesting if the recipient is no longer employed by the Company. The Company'sperformance award units provide for accelerated vesting if (i) there is a change in control of theCompany and (ii) the recipient's employment terminates during the 24-month period followingthe effective date of the change in control for one of the reasons specified in the performance-based restricted stock unit agreement.
A summary of the status of the Company's performance awards as of December 31, 2011,and changes during the year ended December 31, 2011, is presented below:
Performance Award Units Shares
Weighted-
Average
Grant-Date
Fair Value
Outstanding at December 31, 2010 78,974 $ 26.33Granted 52,503 42.77Vested (19,765 ) 26.33Cancellations (2,191 ) 35.93Nonvested at December 31, 2011 109,521 $ 34.29
Expected to vest at December 31, 2011 102,928 $ 34.29
Compensation expense for performance award units is recognized using thefair market value of the Company's common stock on the date of grant and on anaccelerated basis. The Company recognizes expense for these performance awardunits under the assumption that the performance ROIC target will be achieved. Ifit appears probable such performance ROIC target will not be met, the Companywill stop recognizing any further compensation cost and any previouslyrecognized compensation cost would be reversed.
As of December 31, 2011, there was $2.0 million of total unrecognized compensation costrelated to performance award units granted under the SIPs. This aggregate unrecognized cost isexpected to be recognized over a weighted-average period of 3.04 years. The total fair value ofperformance awards vested, using the fair value on vest date, during the year ended December 31,2011, was $0.8 million. No performance award units vested during 2010 and 2009.
Deferred Stock Units
Service DSU grant to CEO. During 2011 and 2010, the Company granted service-baseddeferred stock unit awards ("Service DSUs") under the SIPs to its CEO. Service DSUs are issuedat the fair market value of the Company's stock on the date of grant, and generally vestannually over a four-year period on each anniversary date of the grant. The Service DSUs, ifvested, will be convertible into shares of the Company's common stock following the holder'stermination of employment. The Service DSUs provide for accelerated vesting upon terminationwithout cause or the CEO's retirement as defined in his employment agreement. No ServiceDSUs were converted into shares of the Company's common stock during 2011.
Service DSU Units Granted to CEO Shares
Weighted-
Average
Copyright © 2013 www.secdatabase.com. All Rights Reserved.Please Consider the Environment Before Printing This Document
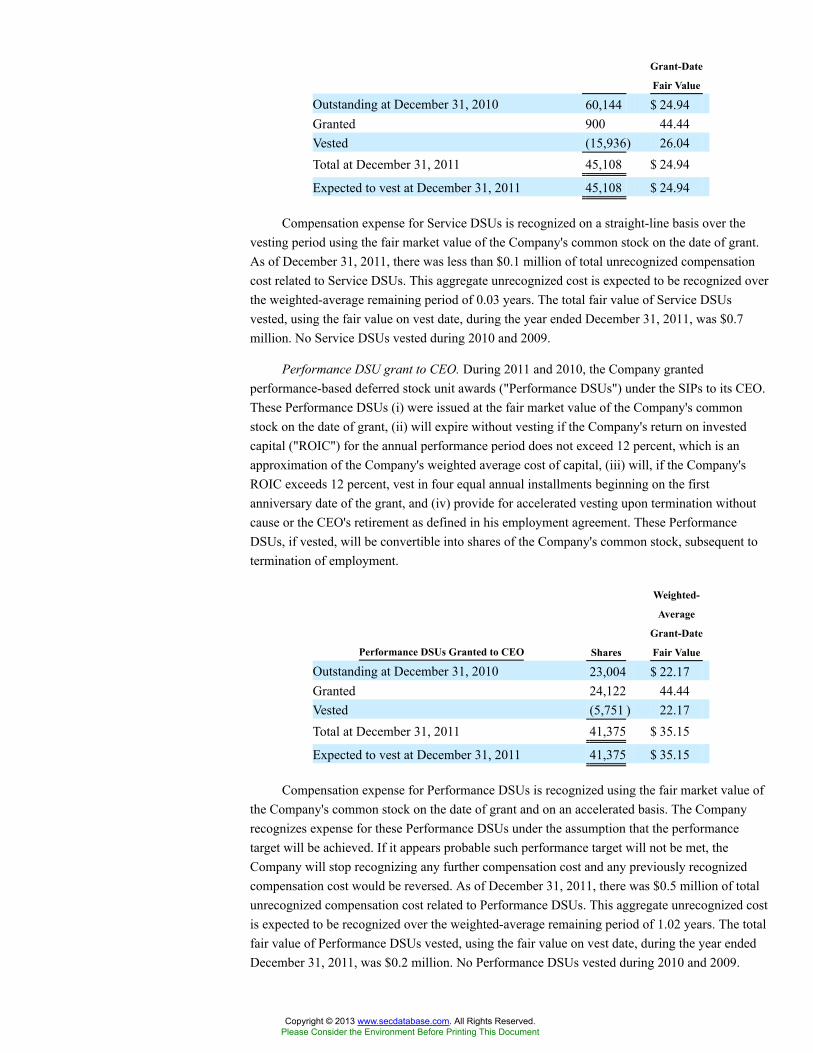
Grant-Date
Fair Value
Outstanding at December 31, 2010 60,144 $ 24.94Granted 900 44.44Vested (15,936) 26.04Total at December 31, 2011 45,108 $ 24.94
Expected to vest at December 31, 2011 45,108 $ 24.94
Compensation expense for Service DSUs is recognized on a straight-line basis over thevesting period using the fair market value of the Company's common stock on the date of grant.As of December 31, 2011, there was less than $0.1 million of total unrecognized compensationcost related to Service DSUs. This aggregate unrecognized cost is expected to be recognized overthe weighted-average remaining period of 0.03 years. The total fair value of Service DSUsvested, using the fair value on vest date, during the year ended December 31, 2011, was $0.7million. No Service DSUs vested during 2010 and 2009.
Performance DSU grant to CEO. During 2011 and 2010, the Company grantedperformance-based deferred stock unit awards ("Performance DSUs") under the SIPs to its CEO.These Performance DSUs (i) were issued at the fair market value of the Company's commonstock on the date of grant, (ii) will expire without vesting if the Company's return on investedcapital ("ROIC") for the annual performance period does not exceed 12 percent, which is anapproximation of the Company's weighted average cost of capital, (iii) will, if the Company'sROIC exceeds 12 percent, vest in four equal annual installments beginning on the firstanniversary date of the grant, and (iv) provide for accelerated vesting upon termination withoutcause or the CEO's retirement as defined in his employment agreement. These PerformanceDSUs, if vested, will be convertible into shares of the Company's common stock, subsequent totermination of employment.
Performance DSUs Granted to CEO Shares
Weighted-
Average
Grant-Date
Fair Value
Outstanding at December 31, 2010 23,004 $ 22.17Granted 24,122 44.44Vested (5,751 ) 22.17Total at December 31, 2011 41,375 $ 35.15
Expected to vest at December 31, 2011 41,375 $ 35.15
Compensation expense for Performance DSUs is recognized using the fair market value ofthe Company's common stock on the date of grant and on an accelerated basis. The Companyrecognizes expense for these Performance DSUs under the assumption that the performancetarget will be achieved. If it appears probable such performance target will not be met, theCompany will stop recognizing any further compensation cost and any previously recognizedcompensation cost would be reversed. As of December 31, 2011, there was $0.5 million of totalunrecognized compensation cost related to Performance DSUs. This aggregate unrecognized costis expected to be recognized over the weighted-average remaining period of 1.02 years. The totalfair value of Performance DSUs vested, using the fair value on vest date, during the year endedDecember 31, 2011, was $0.2 million. No Performance DSUs vested during 2010 and 2009.
Copyright © 2013 www.secdatabase.com. All Rights Reserved.Please Consider the Environment Before Printing This Document
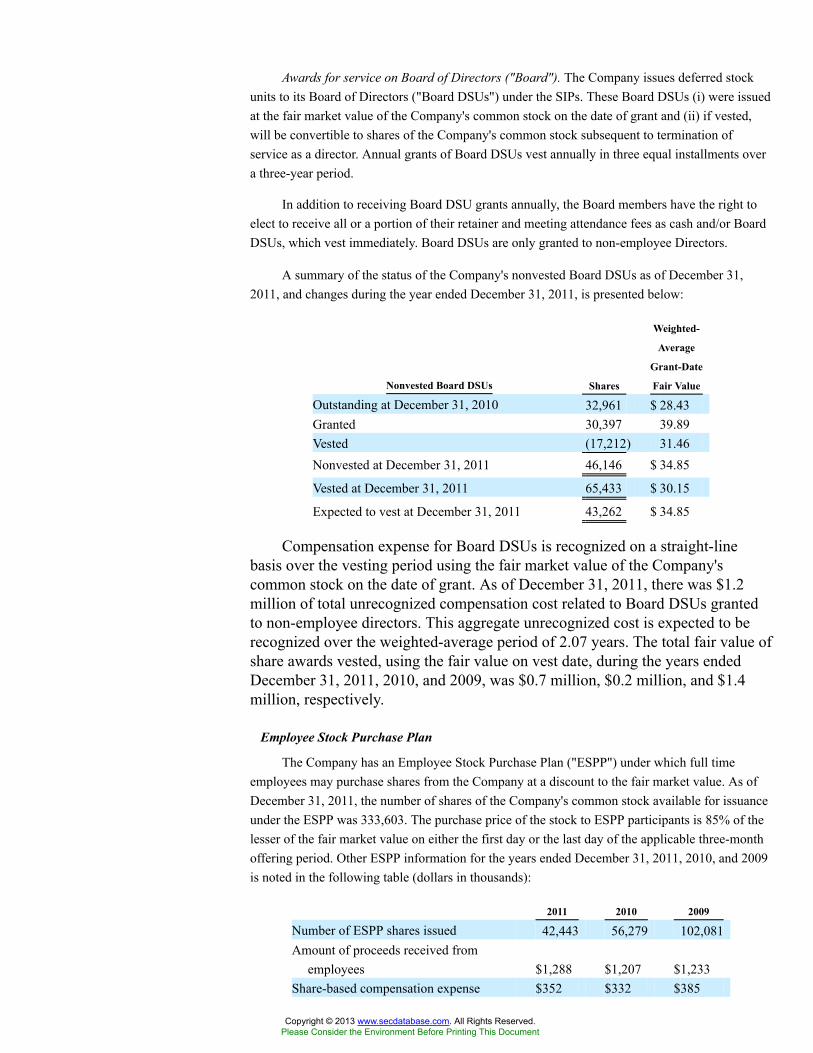
Awards for service on Board of Directors ("Board"). The Company issues deferred stockunits to its Board of Directors ("Board DSUs") under the SIPs. These Board DSUs (i) were issuedat the fair market value of the Company's common stock on the date of grant and (ii) if vested,will be convertible to shares of the Company's common stock subsequent to termination ofservice as a director. Annual grants of Board DSUs vest annually in three equal installments overa three-year period.
In addition to receiving Board DSU grants annually, the Board members have the right toelect to receive all or a portion of their retainer and meeting attendance fees as cash and/or BoardDSUs, which vest immediately. Board DSUs are only granted to non-employee Directors.
A summary of the status of the Company's nonvested Board DSUs as of December 31,2011, and changes during the year ended December 31, 2011, is presented below:
Nonvested Board DSUs Shares
Weighted-
Average
Grant-Date
Fair Value
Outstanding at December 31, 2010 32,961 $ 28.43Granted 30,397 39.89Vested (17,212) 31.46Nonvested at December 31, 2011 46,146 $ 34.85
Vested at December 31, 2011 65,433 $ 30.15
Expected to vest at December 31, 2011 43,262 $ 34.85
Compensation expense for Board DSUs is recognized on a straight-linebasis over the vesting period using the fair market value of the Company'scommon stock on the date of grant. As of December 31, 2011, there was $1.2million of total unrecognized compensation cost related to Board DSUs grantedto non-employee directors. This aggregate unrecognized cost is expected to berecognized over the weighted-average period of 2.07 years. The total fair value ofshare awards vested, using the fair value on vest date, during the years endedDecember 31, 2011, 2010, and 2009, was $0.7 million, $0.2 million, and $1.4million, respectively.
Employee Stock Purchase Plan
The Company has an Employee Stock Purchase Plan ("ESPP") under which full timeemployees may purchase shares from the Company at a discount to the fair market value. As ofDecember 31, 2011, the number of shares of the Company's common stock available for issuanceunder the ESPP was 333,603. The purchase price of the stock to ESPP participants is 85% of thelesser of the fair market value on either the first day or the last day of the applicable three-monthoffering period. Other ESPP information for the years ended December 31, 2011, 2010, and 2009is noted in the following table (dollars in thousands):
2011 2010 2009
Number of ESPP shares issued 42,443 56,279 102,081Amount of proceeds received from
employees $1,288 $1,207 $1,233Share-based compensation expense $352 $332 $385
Copyright © 2013 www.secdatabase.com. All Rights Reserved.Please Consider the Environment Before Printing This Document

12 Months EndedValuation And QualifyingAccounts Dec. 31, 2011
Valuation And Qualifying Accounts[Abstract]Valuation And Qualifying Accounts Arbitron Inc.
Consolidated Schedule of Valuation and Qualifying AccountsFor the Years Ended December 31, 2011, 2010, and 2009
(In thousands)
2011 2010 2009
Allowance for doubtful trade accountsreceivable:
Balance at beginning of year $4,708 $4,708 $2,598Additions charged to expenses 2,234 1,375 2,723Write-offs net of recoveries (2,327) (1,375) (613 )
Balance at end of year $4,615 $4,708 $4,708
Deferred tax asset valuationallowance:
Balance at beginning of year $163 $332 $332Addition charged to expenses 1,099 — —Deferred tax assets utilized — (169 ) —
Balance at end of year $1,262 $163 $332
Copyright © 2013 www.secdatabase.com. All Rights Reserved.Please Consider the Environment Before Printing This Document
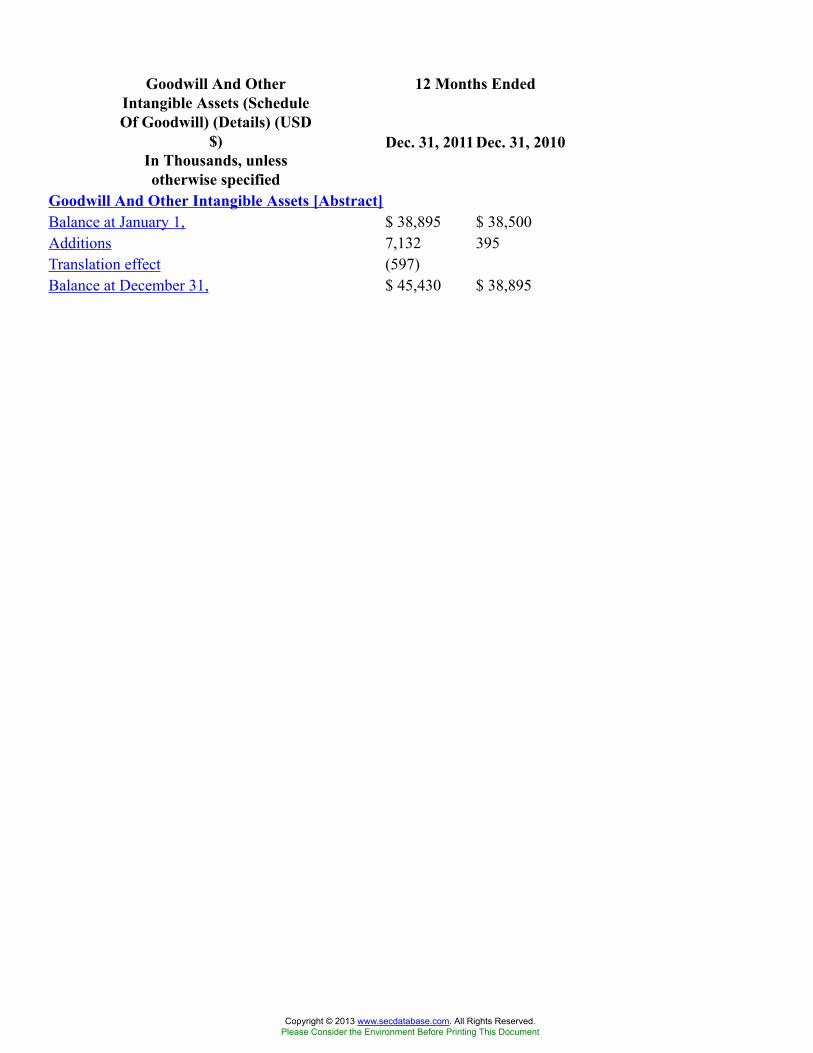
12 Months EndedGoodwill And OtherIntangible Assets (ScheduleOf Goodwill) (Details) (USD
$)In Thousands, unlessotherwise specified
Dec. 31, 2011Dec. 31, 2010
Goodwill And Other Intangible Assets [Abstract]Balance at January 1, $ 38,895 $ 38,500Additions 7,132 395Translation effect (597)Balance at December 31, $ 45,430 $ 38,895
Copyright © 2013 www.secdatabase.com. All Rights Reserved.Please Consider the Environment Before Printing This Document

12 Months EndedSummary Of SignificantAccounting Policies
(Narrative) (Details) (USD $)In Millions, except Share
data, unless otherwisespecified
Dec. 31,2011
Dec. 31,2010
Dec. 31,2009
Summary Of Significant Accounting Policies [Line Items]Recognized income tax positions largest amount likely of being realized 50.00%Stock options to purchase common stock 2,043,774 2,020,767 2,852,161Shares excluded from the computation of the diluted net income per weighted-average common share 1,116,106 1,179,840 2,052,132
Advertising expense $ 1.4 $ 1.0 $ 2.3Equity Method Investments [Member]Summary Of Significant Accounting Policies [Line Items]Ownership interest 50.00%Cost Method Investments [Member]Summary Of Significant Accounting Policies [Line Items]Ownership interest 20.00%
Copyright © 2013 www.secdatabase.com. All Rights Reserved.Please Consider the Environment Before Printing This Document
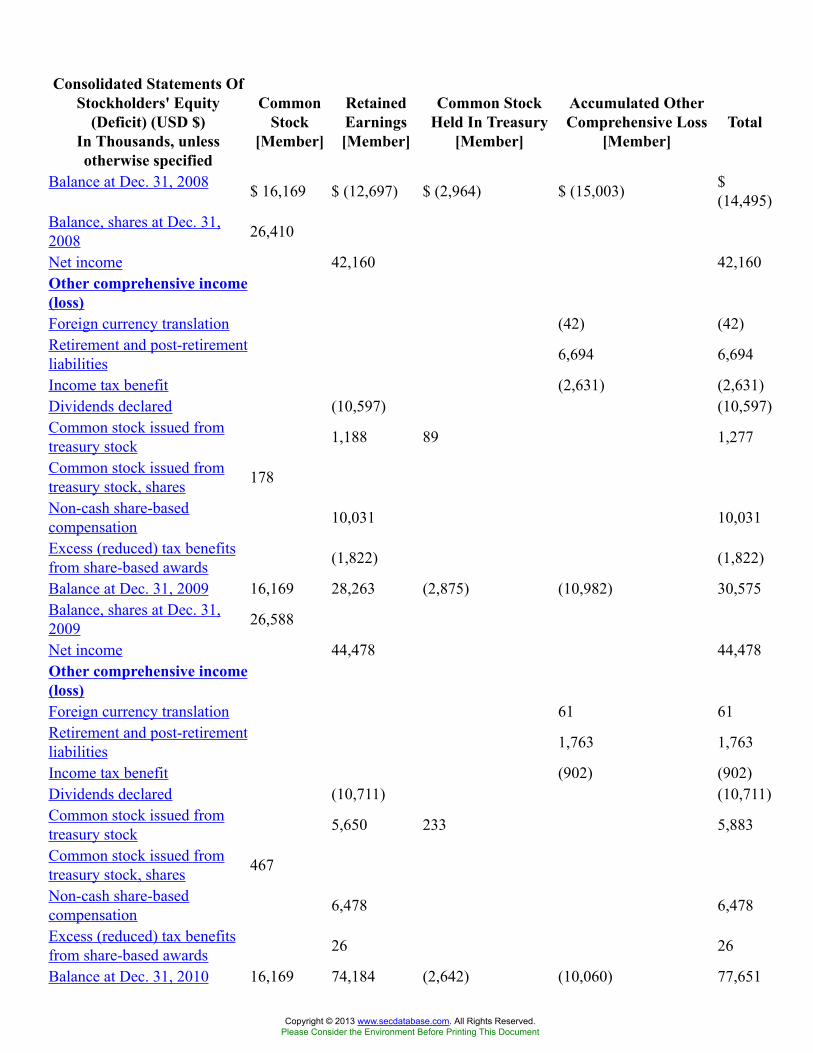
Consolidated Statements OfStockholders' Equity
(Deficit) (USD $)In Thousands, unlessotherwise specified
CommonStock
[Member]
RetainedEarnings[Member]
Common StockHeld In Treasury
[Member]
Accumulated OtherComprehensive Loss
[Member]Total
Balance at Dec. 31, 2008 $ 16,169 $ (12,697) $ (2,964) $ (15,003) $(14,495)
Balance, shares at Dec. 31,2008 26,410
Net income 42,160 42,160Other comprehensive income(loss)Foreign currency translation (42) (42)Retirement and post-retirementliabilities 6,694 6,694
Income tax benefit (2,631) (2,631)Dividends declared (10,597) (10,597)Common stock issued fromtreasury stock 1,188 89 1,277
Common stock issued fromtreasury stock, shares 178
Non-cash share-basedcompensation 10,031 10,031
Excess (reduced) tax benefitsfrom share-based awards (1,822) (1,822)
Balance at Dec. 31, 2009 16,169 28,263 (2,875) (10,982) 30,575Balance, shares at Dec. 31,2009 26,588
Net income 44,478 44,478Other comprehensive income(loss)Foreign currency translation 61 61Retirement and post-retirementliabilities 1,763 1,763
Income tax benefit (902) (902)Dividends declared (10,711) (10,711)Common stock issued fromtreasury stock 5,650 233 5,883
Common stock issued fromtreasury stock, shares 467
Non-cash share-basedcompensation 6,478 6,478
Excess (reduced) tax benefitsfrom share-based awards 26 26
Balance at Dec. 31, 2010 16,169 74,184 (2,642) (10,060) 77,651
Copyright © 2013 www.secdatabase.com. All Rights Reserved.Please Consider the Environment Before Printing This Document
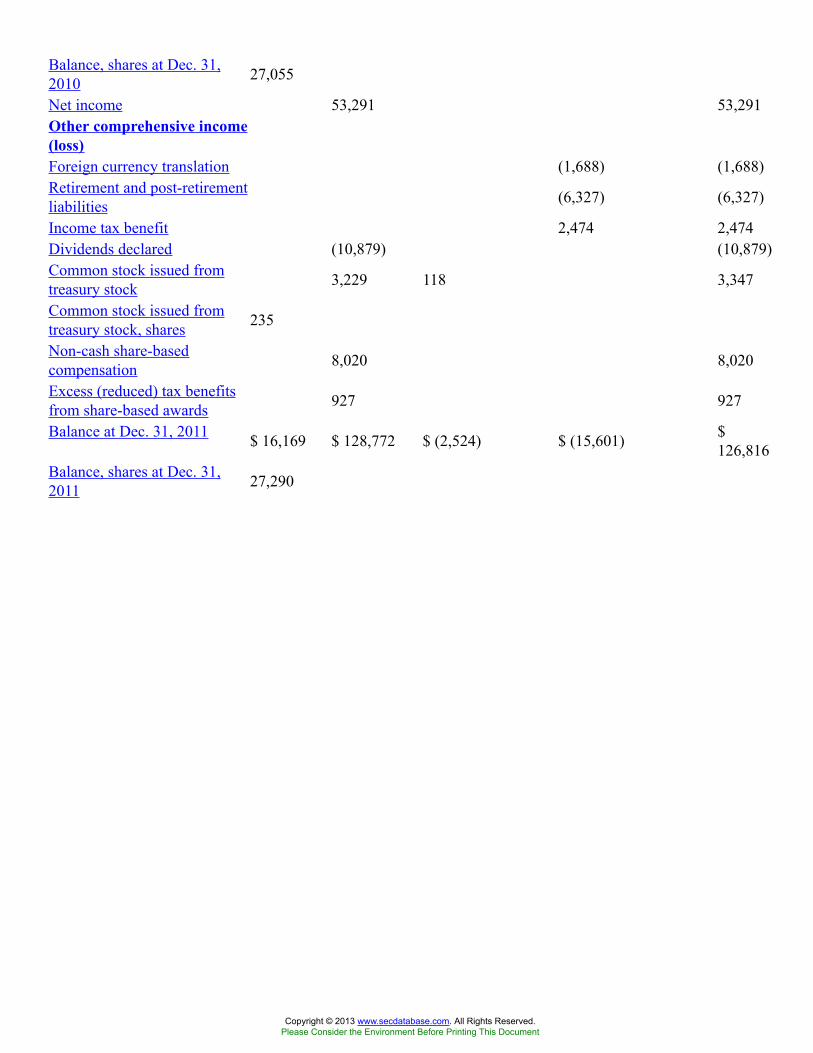
Balance, shares at Dec. 31,2010 27,055
Net income 53,291 53,291Other comprehensive income(loss)Foreign currency translation (1,688) (1,688)Retirement and post-retirementliabilities (6,327) (6,327)
Income tax benefit 2,474 2,474Dividends declared (10,879) (10,879)Common stock issued fromtreasury stock 3,229 118 3,347
Common stock issued fromtreasury stock, shares 235
Non-cash share-basedcompensation 8,020 8,020
Excess (reduced) tax benefitsfrom share-based awards 927 927
Balance at Dec. 31, 2011 $ 16,169 $ 128,772 $ (2,524) $ (15,601) $126,816
Balance, shares at Dec. 31,2011 27,290
Copyright © 2013 www.secdatabase.com. All Rights Reserved.Please Consider the Environment Before Printing This Document
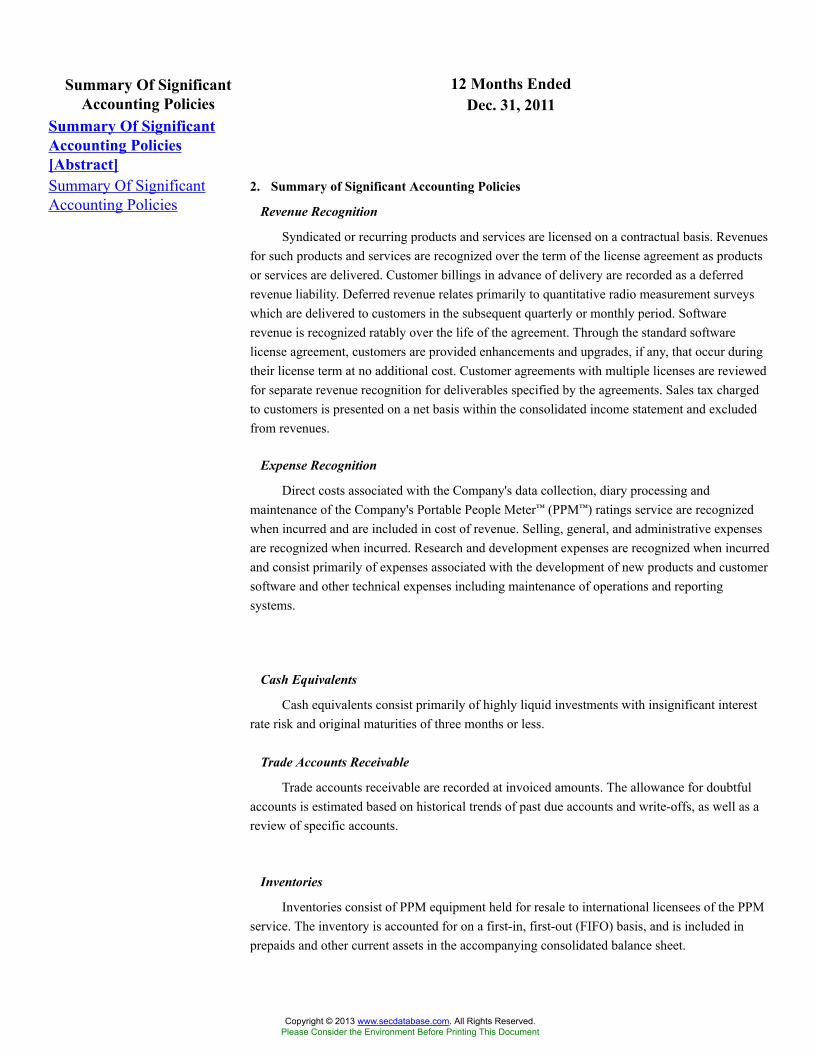
12 Months EndedSummary Of SignificantAccounting Policies Dec. 31, 2011
Summary Of SignificantAccounting Policies[Abstract]Summary Of SignificantAccounting Policies
2. Summary of Significant Accounting Policies
Revenue Recognition
Syndicated or recurring products and services are licensed on a contractual basis. Revenuesfor such products and services are recognized over the term of the license agreement as productsor services are delivered. Customer billings in advance of delivery are recorded as a deferredrevenue liability. Deferred revenue relates primarily to quantitative radio measurement surveyswhich are delivered to customers in the subsequent quarterly or monthly period. Softwarerevenue is recognized ratably over the life of the agreement. Through the standard softwarelicense agreement, customers are provided enhancements and upgrades, if any, that occur duringtheir license term at no additional cost. Customer agreements with multiple licenses are reviewedfor separate revenue recognition for deliverables specified by the agreements. Sales tax chargedto customers is presented on a net basis within the consolidated income statement and excludedfrom revenues.
Expense Recognition
Direct costs associated with the Company's data collection, diary processing andmaintenance of the Company's Portable People Meter™ (PPM™) ratings service are recognizedwhen incurred and are included in cost of revenue. Selling, general, and administrative expensesare recognized when incurred. Research and development expenses are recognized when incurredand consist primarily of expenses associated with the development of new products and customersoftware and other technical expenses including maintenance of operations and reportingsystems.
Cash Equivalents
Cash equivalents consist primarily of highly liquid investments with insignificant interestrate risk and original maturities of three months or less.
Trade Accounts Receivable
Trade accounts receivable are recorded at invoiced amounts. The allowance for doubtfulaccounts is estimated based on historical trends of past due accounts and write-offs, as well as areview of specific accounts.
Inventories
Inventories consist of PPM equipment held for resale to international licensees of the PPMservice. The inventory is accounted for on a first-in, first-out (FIFO) basis, and is included inprepaids and other current assets in the accompanying consolidated balance sheet.
Copyright © 2013 www.secdatabase.com. All Rights Reserved.Please Consider the Environment Before Printing This Document

Property and Equipment
Property and equipment are recorded at cost and depreciated or amortized on a straight-linebasis over the estimated useful lives of the assets, which are as follows:
Computer equipment 3 yearsPurchased and internally
developed software 3 – 5 yearsLeasehold improvements Shorter of useful life or life of leaseMachinery, furniture and
fixtures 3 – 6 years
Repairs and maintenance are charged to expense as incurred. Gains and losses ondispositions are included in the consolidated results of operations at the date of disposal.
Expenditures for significant software purchases and software developed for internal use arecapitalized. For software developed for internal use, external direct costs for materials andservices and certain payroll and related fringe benefit costs are capitalized as well. The costs arecapitalized from the time that the preliminary project stage is completed and managementconsiders it probable that the software will be used to perform the function intended until the timethe software is placed in service for its intended use. Once the software is placed in service, thecapitalized costs are amortized over periods of three to five years. Management performs anassessment quarterly to determine if it is probable that all capitalized software will be used toperform its intended function. If an impairment exists, the software cost is written down toestimated fair value.
Equity and Other Investments
Equity and other investments are accounted for using either the equity method or the costmethod, depending upon the nature of the Company's investment interests. The equity method isused when the Company has an ownership interest of 50% or less and the ability to exercisesignificant influence or has a majority ownership interest but does not have the ability to exerciseeffective control. The cost method is used when the Company has an ownership interest of 20%or less and does not have the ability to exercise significant influence.
Goodwill and Other Intangible Assets
Goodwill represents the excess of costs over fair value of assets of businesses acquired.Goodwill and other intangible assets acquired in a purchase business combination and determinedto have an indefinite useful life are not amortized. Intangible assets with estimable useful livesare amortized over their respective estimated useful lives to their estimated residual values, andare regularly reviewed for impairment.
Goodwill and intangible assets not subject to amortization are tested annually forimpairment or more frequently if events and circumstances indicate that the asset might beimpaired. The Company performs its annual impairment test at the reporting unit level as ofJanuary 1st for each fiscal year. An impairment loss is recognized to the extent that the carryingamount of the asset exceeds its fair value.
Copyright © 2013 www.secdatabase.com. All Rights Reserved.Please Consider the Environment Before Printing This Document
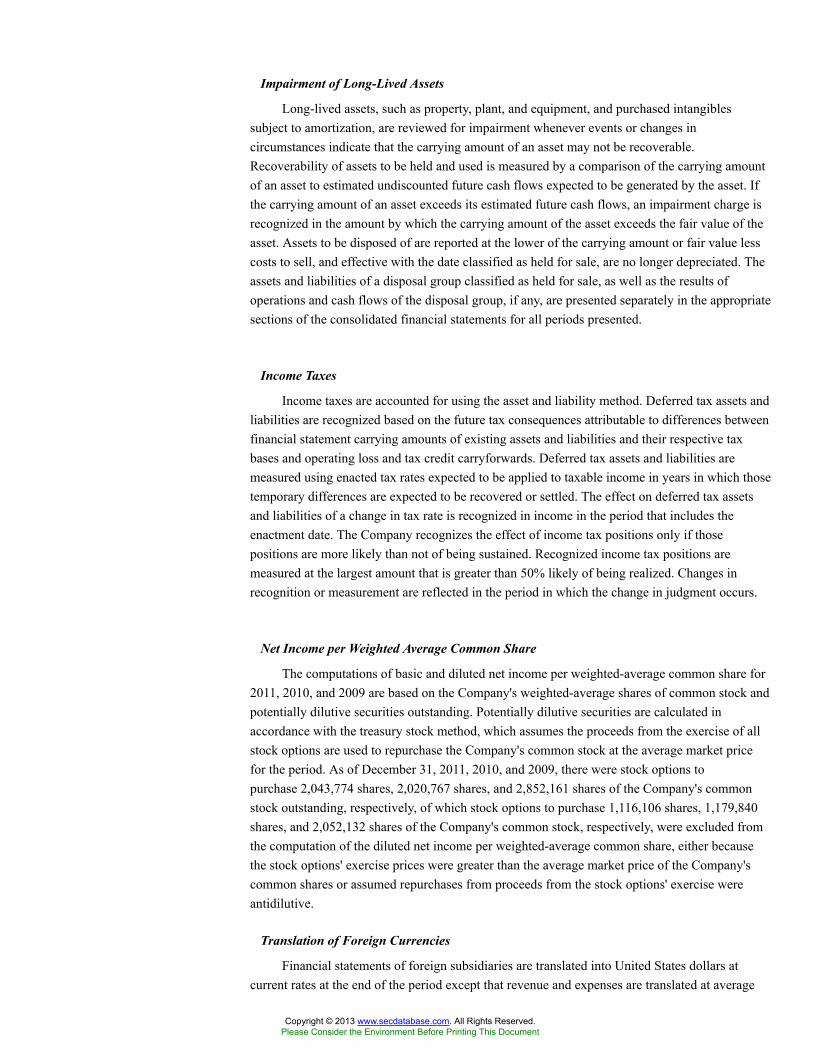
Impairment of Long-Lived Assets
Long-lived assets, such as property, plant, and equipment, and purchased intangiblessubject to amortization, are reviewed for impairment whenever events or changes incircumstances indicate that the carrying amount of an asset may not be recoverable.Recoverability of assets to be held and used is measured by a comparison of the carrying amountof an asset to estimated undiscounted future cash flows expected to be generated by the asset. Ifthe carrying amount of an asset exceeds its estimated future cash flows, an impairment charge isrecognized in the amount by which the carrying amount of the asset exceeds the fair value of theasset. Assets to be disposed of are reported at the lower of the carrying amount or fair value lesscosts to sell, and effective with the date classified as held for sale, are no longer depreciated. Theassets and liabilities of a disposal group classified as held for sale, as well as the results ofoperations and cash flows of the disposal group, if any, are presented separately in the appropriatesections of the consolidated financial statements for all periods presented.
Income Taxes
Income taxes are accounted for using the asset and liability method. Deferred tax assets andliabilities are recognized based on the future tax consequences attributable to differences betweenfinancial statement carrying amounts of existing assets and liabilities and their respective taxbases and operating loss and tax credit carryforwards. Deferred tax assets and liabilities aremeasured using enacted tax rates expected to be applied to taxable income in years in which thosetemporary differences are expected to be recovered or settled. The effect on deferred tax assetsand liabilities of a change in tax rate is recognized in income in the period that includes theenactment date. The Company recognizes the effect of income tax positions only if thosepositions are more likely than not of being sustained. Recognized income tax positions aremeasured at the largest amount that is greater than 50% likely of being realized. Changes inrecognition or measurement are reflected in the period in which the change in judgment occurs.
Net Income per Weighted Average Common Share
The computations of basic and diluted net income per weighted-average common share for2011, 2010, and 2009 are based on the Company's weighted-average shares of common stock andpotentially dilutive securities outstanding. Potentially dilutive securities are calculated inaccordance with the treasury stock method, which assumes the proceeds from the exercise of allstock options are used to repurchase the Company's common stock at the average market pricefor the period. As of December 31, 2011, 2010, and 2009, there were stock options topurchase 2,043,774 shares, 2,020,767 shares, and 2,852,161 shares of the Company's commonstock outstanding, respectively, of which stock options to purchase 1,116,106 shares, 1,179,840shares, and 2,052,132 shares of the Company's common stock, respectively, were excluded fromthe computation of the diluted net income per weighted-average common share, either becausethe stock options' exercise prices were greater than the average market price of the Company'scommon shares or assumed repurchases from proceeds from the stock options' exercise wereantidilutive.
Translation of Foreign Currencies
Financial statements of foreign subsidiaries are translated into United States dollars atcurrent rates at the end of the period except that revenue and expenses are translated at average
Copyright © 2013 www.secdatabase.com. All Rights Reserved.Please Consider the Environment Before Printing This Document
current exchange rates during each reporting period. Net translation exchange gains or losses andthe effect of exchange rate changes on intercompany transactions of a long-term nature arerecorded in accumulated other comprehensive loss in stockholders' equity. Gains and losses fromtranslation of assets and liabilities denominated in other than the functional currency of theoperation are recorded in income as incurred.
Advertising Expense
The Company recognizes advertising expense the first time advertising takes place.Advertising expense for the years ended December 31, 2011, 2010 and 2009, was $1.4 million,$1.0 million, and $2.3 million, respectively.
Accounting Estimates
The preparation of the consolidated financial statements in conformity with accountingprinciples generally accepted in the United States of America requires management to makeestimates and assumptions that affect the reported amounts of assets and liabilities and disclosureof contingent assets and liabilities at the date of the consolidated financial statements and thereported amounts of revenues and expenses during the reporting period. Significant items, if any,subject to such estimates and assumptions may include: valuation allowances for receivables anddeferred income tax assets, loss contingencies, and assets and obligations related to employeebenefits. Actual results could differ from those estimates.
Legal Matters
The Company is involved, from time to time, in litigation and proceedings arising out ofthe ordinary course of business. Legal costs for services rendered in the course of theseproceedings are charged to expense as they are incurred.
Leases
The Company conducts all of its operations in leased facilities and leases certain equipmentwhich have minimum lease obligations under noncancelable operating leases. Certain of theseleases contain rent escalations based on specified percentages. Most of the leases contain renewaloptions and require payments for taxes, insurance and maintenance. Rent expense is charged tooperations as incurred except for escalating rents, which are charged to operations on a straight-line basis over the life of the lease.
New Accounting Pronouncements
Testing Goodwill for Impairment. In September 2011, the Financial AccountingStandards Board (FASB) issued Accounting Standards Update No. 2011-08, Intangibles —Goodwill and Other (Topic 350) — Testing Goodwill for Impairment ("ASU 2011-08"), to allowentities to use a qualitative approach to test goodwill for impairment. ASU 2011-08 permits anentity to first perform a qualitative assessment to determine whether it is more likely than not thatthe fair value of a reporting unit is less than its carrying value. If it is concluded that this is thecase, it is necessary to perform the currently prescribed two-step goodwill impairment test.Otherwise, the two-step goodwill impairment test is not required. ASU 2011-08 is effective for
Copyright © 2013 www.secdatabase.com. All Rights Reserved.Please Consider the Environment Before Printing This Document
the Company for interim and annual periods ended during 2012, with earlier applicationpermitted. The Company does not expect its pending adoption of this guidance to have a materialimpact to the Company's consolidated financial statements.
Amendments to Achieve Common Fair Value Measurement and DisclosureRequirements. In May 2011, the FASB issued Accounting Standards Update No. 2011-04,Amendments to Achieve Common Fair Value Measurement and Disclosure Requirements in U.S.GAAP and International Financial Reporting Standards (Topic 820) — Fair Value Measurement("ASU 2011-04"), to provide a consistent definition of fair value and ensure that the fair valuemeasurement and disclosure requirements are similar between U.S. Generally AcceptedAccounting Principles ("GAAP") and International Financial Reporting Standards. ASU 2011-04changes certain fair value measurement principles and enhances the disclosure requirementsparticularly for Level 3 fair value measurements. ASU 2011-04 is effective for the Company forinterim and annual periods ended during 2012 and will be applied prospectively. The Companydoes not expect its pending adoption of this guidance to have a material impact to the Company'sconsolidated financial statements.
Copyright © 2013 www.secdatabase.com. All Rights Reserved.Please Consider the Environment Before Printing This Document
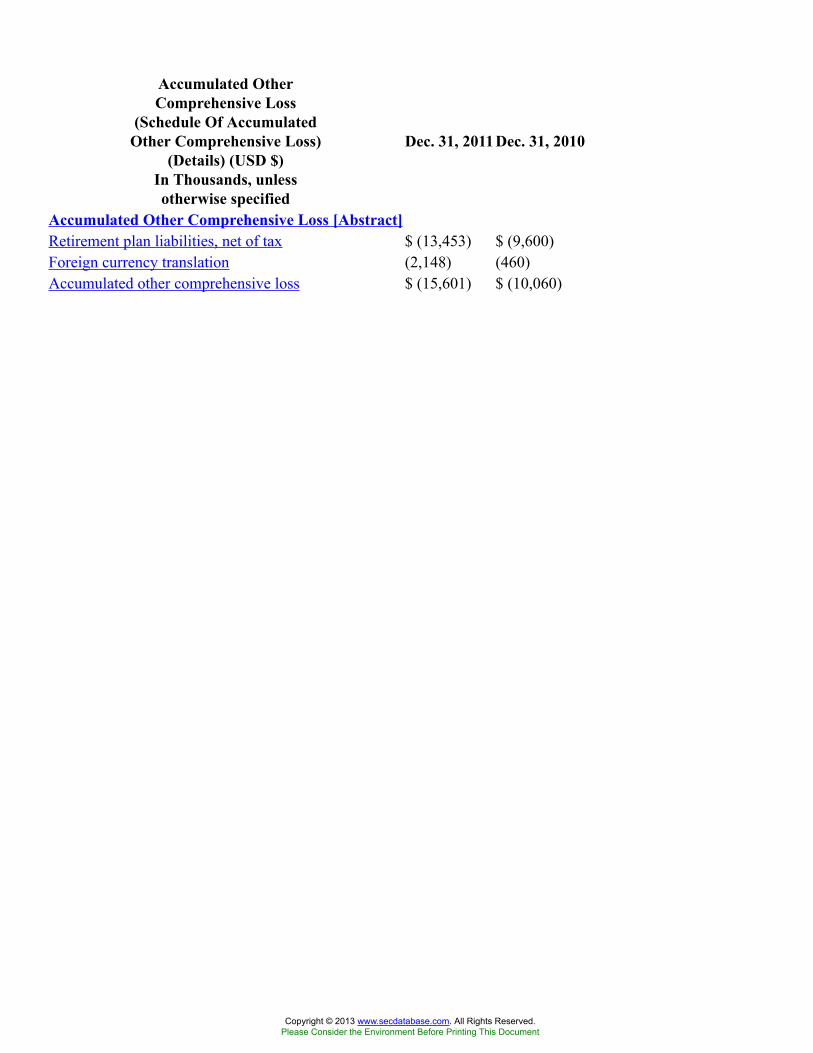
Accumulated OtherComprehensive Loss
(Schedule Of AccumulatedOther Comprehensive Loss)
(Details) (USD $)In Thousands, unlessotherwise specified
Dec. 31, 2011Dec. 31, 2010
Accumulated Other Comprehensive Loss [Abstract]Retirement plan liabilities, net of tax $ (13,453) $ (9,600)Foreign currency translation (2,148) (460)Accumulated other comprehensive loss $ (15,601) $ (10,060)
Copyright © 2013 www.secdatabase.com. All Rights Reserved.Please Consider the Environment Before Printing This Document

12 Months EndedEnterprise-WideInformation (Schedule OfRevenues For Each Group
Of Services Provided ToExternal Customers)
(Details) (USD $)In Thousands, unlessotherwise specified
Dec. 31, 2011Dec. 31, 2010 Dec. 31, 2009
Enterprise Wide Revenue By Type/Geography [Line Items]Service Revenues $ 422,310 $ 395,379 $ 384,952Radio Audience Ratings Services [Member]Enterprise Wide Revenue By Type/Geography [Line Items]Service Revenues 340,479 317,606 307,217Local Market Consumer Information Services [Member]Enterprise Wide Revenue By Type/Geography [Line Items]Service Revenues 35,173 35,187 34,991Software Applications [Member]Enterprise Wide Revenue By Type/Geography [Line Items]Service Revenues 35,676 34,138 33,809All Other Services [Member]Enterprise Wide Revenue By Type/Geography [Line Items]Service Revenues $ 10,982 $ 8,448 $ 8,935
Copyright © 2013 www.secdatabase.com. All Rights Reserved.Please Consider the Environment Before Printing This Document
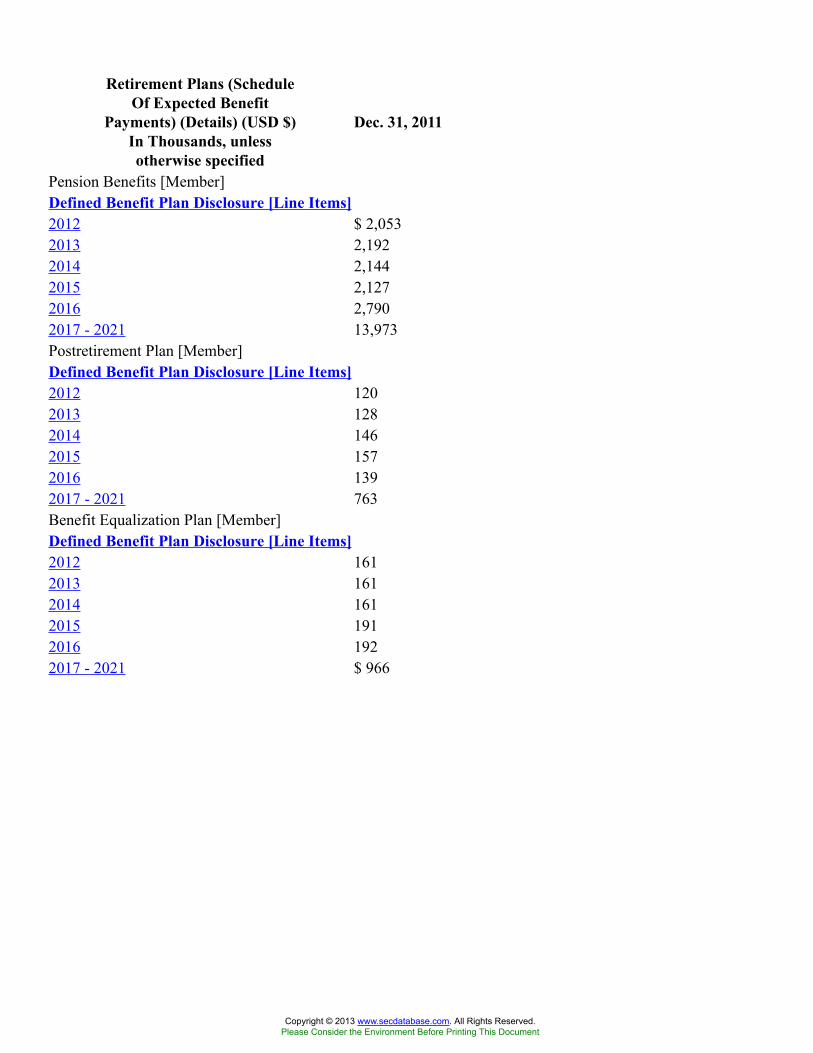
Retirement Plans (ScheduleOf Expected Benefit
Payments) (Details) (USD $)In Thousands, unlessotherwise specified
Dec. 31, 2011
Pension Benefits [Member]Defined Benefit Plan Disclosure [Line Items]2012 $ 2,0532013 2,1922014 2,1442015 2,1272016 2,7902017 - 2021 13,973Postretirement Plan [Member]Defined Benefit Plan Disclosure [Line Items]2012 1202013 1282014 1462015 1572016 1392017 - 2021 763Benefit Equalization Plan [Member]Defined Benefit Plan Disclosure [Line Items]2012 1612013 1612014 1612015 1912016 1922017 - 2021 $ 966
Copyright © 2013 www.secdatabase.com. All Rights Reserved.Please Consider the Environment Before Printing This Document

12 Months EndedSummary Of SignificantAccounting Policies (Policy) Dec. 31, 2011
Summary Of SignificantAccounting Policies[Abstract]Revenue Recognition Revenue Recognition
Syndicated or recurring products and services are licensed on a contractual basis. Revenuesfor such products and services are recognized over the term of the license agreement as productsor services are delivered. Customer billings in advance of delivery are recorded as a deferredrevenue liability. Deferred revenue relates primarily to quantitative radio measurement surveyswhich are delivered to customers in the subsequent quarterly or monthly period. Softwarerevenue is recognized ratably over the life of the agreement. Through the standard softwarelicense agreement, customers are provided enhancements and upgrades, if any, that occur duringtheir license term at no additional cost. Customer agreements with multiple licenses are reviewedfor separate revenue recognition for deliverables specified by the agreements. Sales tax chargedto customers is presented on a net basis within the consolidated income statement and excludedfrom revenues.
Expense RecognitionExpense Recognition
Direct costs associated with the Company's data collection, diary processing andmaintenance of the Company's Portable People Meter™ (PPM™) ratings service are recognizedwhen incurred and are included in cost of revenue. Selling, general, and administrative expensesare recognized when incurred. Research and development expenses are recognized when incurredand consist primarily of expenses associated with the development of new products and customersoftware and other technical expenses including maintenance of operations and reportingsystems.
Cash EquivalentsCash Equivalents
Cash equivalents consist primarily of highly liquid investments with insignificant interestrate risk and original maturities of three months or less.
Trade Accounts Receivable Trade Accounts Receivable
Trade accounts receivable are recorded at invoiced amounts. The allowance for doubtfulaccounts is estimated based on historical trends of past due accounts and write-offs, as well as areview of specific accounts.
InventoriesInventories
Inventories consist of PPM equipment held for resale to international licensees of the PPMservice. The inventory is accounted for on a first-in, first-out (FIFO) basis, and is included inprepaids and other current assets in the accompanying consolidated balance sheet.
Property And EquipmentProperty and Equipment
Property and equipment are recorded at cost and depreciated or amortized on a straight-linebasis over the estimated useful lives of the assets, which are as follows:
Computer equipment 3 years
Copyright © 2013 www.secdatabase.com. All Rights Reserved.Please Consider the Environment Before Printing This Document
Purchased and internallydeveloped software 3 – 5 years
Leasehold improvements Shorter of useful life or life of leaseMachinery, furniture and
fixtures 3 – 6 years
Repairs and maintenance are charged to expense as incurred. Gains and losses ondispositions are included in the consolidated results of operations at the date of disposal.
Expenditures for significant software purchases and software developed for internal use arecapitalized. For software developed for internal use, external direct costs for materials andservices and certain payroll and related fringe benefit costs are capitalized as well. The costs arecapitalized from the time that the preliminary project stage is completed and managementconsiders it probable that the software will be used to perform the function intended until the timethe software is placed in service for its intended use. Once the software is placed in service, thecapitalized costs are amortized over periods of three to five years. Management performs anassessment quarterly to determine if it is probable that all capitalized software will be used toperform its intended function. If an impairment exists, the software cost is written down toestimated fair value.
Equity And Other InvestmentsEquity and Other Investments
Equity and other investments are accounted for using either the equity method or the costmethod, depending upon the nature of the Company's investment interests. The equity method isused when the Company has an ownership interest of 50% or less and the ability to exercisesignificant influence or has a majority ownership interest but does not have the ability to exerciseeffective control. The cost method is used when the Company has an ownership interest of 20%or less and does not have the ability to exercise significant influence.
Goodwill And OtherIntangible Assets Goodwill and Other Intangible Assets
Goodwill represents the excess of costs over fair value of assets of businesses acquired.Goodwill and other intangible assets acquired in a purchase business combination and determinedto have an indefinite useful life are not amortized. Intangible assets with estimable useful livesare amortized over their respective estimated useful lives to their estimated residual values, andare regularly reviewed for impairment.
Goodwill and intangible assets not subject to amortization are tested annually forimpairment or more frequently if events and circumstances indicate that the asset might beimpaired. The Company performs its annual impairment test at the reporting unit level as ofJanuary 1st for each fiscal year. An impairment loss is recognized to the extent that the carryingamount of the asset exceeds its fair value.
Impairment Of Long-LivedAssets Impairment of Long-Lived Assets
Long-lived assets, such as property, plant, and equipment, and purchased intangiblessubject to amortization, are reviewed for impairment whenever events or changes incircumstances indicate that the carrying amount of an asset may not be recoverable.Recoverability of assets to be held and used is measured by a comparison of the carrying amountof an asset to estimated undiscounted future cash flows expected to be generated by the asset. Ifthe carrying amount of an asset exceeds its estimated future cash flows, an impairment charge isrecognized in the amount by which the carrying amount of the asset exceeds the fair value of the
Copyright © 2013 www.secdatabase.com. All Rights Reserved.Please Consider the Environment Before Printing This Document

asset. Assets to be disposed of are reported at the lower of the carrying amount or fair value lesscosts to sell, and effective with the date classified as held for sale, are no longer depreciated. Theassets and liabilities of a disposal group classified as held for sale, as well as the results ofoperations and cash flows of the disposal group, if any, are presented separately in the appropriatesections of the consolidated financial statements for all periods presented.
Income TaxesIncome Taxes
Income taxes are accounted for using the asset and liability method. Deferred tax assets andliabilities are recognized based on the future tax consequences attributable to differences betweenfinancial statement carrying amounts of existing assets and liabilities and their respective taxbases and operating loss and tax credit carryforwards. Deferred tax assets and liabilities aremeasured using enacted tax rates expected to be applied to taxable income in years in which thosetemporary differences are expected to be recovered or settled. The effect on deferred tax assetsand liabilities of a change in tax rate is recognized in income in the period that includes theenactment date. The Company recognizes the effect of income tax positions only if thosepositions are more likely than not of being sustained. Recognized income tax positions aremeasured at the largest amount that is greater than 50% likely of being realized. Changes inrecognition or measurement are reflected in the period in which the change in judgment occurs.
Net Income Per WeightedAverage Common Share Net Income per Weighted Average Common Share
The computations of basic and diluted net income per weighted-average common share for2011, 2010, and 2009 are based on the Company's weighted-average shares of common stock andpotentially dilutive securities outstanding. Potentially dilutive securities are calculated inaccordance with the treasury stock method, which assumes the proceeds from the exercise of allstock options are used to repurchase the Company's common stock at the average market pricefor the period. As of December 31, 2011, 2010, and 2009, there were stock options topurchase 2,043,774 shares, 2,020,767 shares, and 2,852,161 shares of the Company's commonstock outstanding, respectively, of which stock options to purchase 1,116,106 shares, 1,179,840shares, and 2,052,132 shares of the Company's common stock, respectively, were excluded fromthe computation of the diluted net income per weighted-average common share, either becausethe stock options' exercise prices were greater than the average market price of the Company'scommon shares or assumed repurchases from proceeds from the stock options' exercise wereantidilutive.
Translation Of ForeignCurrencies Translation of Foreign Currencies
Financial statements of foreign subsidiaries are translated into United States dollars atcurrent rates at the end of the period except that revenue and expenses are translated at averagecurrent exchange rates during each reporting period. Net translation exchange gains or losses andthe effect of exchange rate changes on intercompany transactions of a long-term nature arerecorded in accumulated other comprehensive loss in stockholders' equity. Gains and losses fromtranslation of assets and liabilities denominated in other than the functional currency of theoperation are recorded in income as incurred.
Advertising ExpenseAdvertising Expense
The Company recognizes advertising expense the first time advertising takes place.Advertising expense for the years ended December 31, 2011, 2010 and 2009, was $1.4 million,$1.0 million, and $2.3 million, respectively.
Copyright © 2013 www.secdatabase.com. All Rights Reserved.Please Consider the Environment Before Printing This Document

Accounting EstimatesAccounting Estimates
The preparation of the consolidated financial statements in conformity with accountingprinciples generally accepted in the United States of America requires management to makeestimates and assumptions that affect the reported amounts of assets and liabilities and disclosureof contingent assets and liabilities at the date of the consolidated financial statements and thereported amounts of revenues and expenses during the reporting period. Significant items, if any,subject to such estimates and assumptions may include: valuation allowances for receivables anddeferred income tax assets, loss contingencies, and assets and obligations related to employeebenefits. Actual results could differ from those estimates.
Legal MattersLegal Matters
The Company is involved, from time to time, in litigation and proceedings arising out ofthe ordinary course of business. Legal costs for services rendered in the course of theseproceedings are charged to expense as they are incurred.
Leases Leases
The Company conducts all of its operations in leased facilities and leases certain equipmentwhich have minimum lease obligations under noncancelable operating leases. Certain of theseleases contain rent escalations based on specified percentages. Most of the leases contain renewaloptions and require payments for taxes, insurance and maintenance. Rent expense is charged tooperations as incurred except for escalating rents, which are charged to operations on a straight-line basis over the life of the lease.
Copyright © 2013 www.secdatabase.com. All Rights Reserved.Please Consider the Environment Before Printing This Document

12 Months EndedShare-Based Compensation(Schedule Of Summary OfOption Activity Under The
SIPs) (Details) (USD $)In Thousands, except Share
data, unless otherwisespecified
Dec. 31, 2011
Share-Based Compensation [Abstract]Outstanding at December 31, 2010, Shares 2,020,767Granted, Shares 154,226Exercised, Shares (115,788)Forfeited or expired, Shares (15,431)Outstanding at December 31, 2011, Shares 2,043,774Vested or expected to vest, Shares 2,009,984Exercisable, Shares 1,549,376Outstanding, Weighted-Average Exercise Price $ 32.17Granted, Weighted-Average Exercise Price $ 39.21Exercised, Weighted-Average Exercise Price $ 20.18Forfeited or expired, Weighted-Average Exercise Price $ 30.95Outstanding, Weighted-Average Exercise Price $ 33.39Vested or expected to vest, Weighted-Average Exercise Price $ 33.49Exercisable, Weighted-Average Exercise Price $ 35.69Outstanding, Weighted-Average Remaining Contractual Term (Years) 5.62Vested or expected to vest, Weighted-Average Remaining Contractual Term (Years) 5.57Exercisable, Weighted-Average Remaining Contractual Term (Years) 4.77Outstanding, Aggregate Intrinsic Value $ 10,537Vested or expected to vest, Aggregate Intrinsic Value 10,240Exercisable, Aggregate Intrinsic Value $ 5,681
Copyright © 2013 www.secdatabase.com. All Rights Reserved.Please Consider the Environment Before Printing This Document

12 Months EndedShare-Based Compensation(Tables) Dec. 31, 2011
Schedule Of Income StatementRecognition Of Share-BasedCompensation
2011 2010 2009
Cost of revenue $592 $418 $451Selling, general and administrative 7,057 5,767 9,438Research and development 371 293 142Total share-based compensation $8,020 $6,478 $10,031
Schedule Of Assumptions For StockOptions Granted
Assumptions for Stock Options Granted 2011 2010 2009
Expected volatility 39.64 - 41.09% 35.56 - 39.89% 31.88 - 35.31%Expected dividends 0.90- 1.19% 1.50- 1.80% 1.91- 2.95%Expected term (in years) 5.66- 5.89 4.50- 6.50 5.75- 6.25Risk-free rate 1.24- 2.76% 1.73- 3.29% 2.13- 2.94%Weighted-average volatility 40.45% 37.76% 33.96%Weighted-average dividends 1.04% 1.75% 2.22%Weighted-average term (in years) 5.86 5.43 5.96Weighted-average risk-free rate 1.97% 2.45% 2.47%Weighted-average grant date fair
value $14.55 $7.33 $5.31Schedule Of Summary Of Option ActivityUnder The SIPs
Options Shares
Weighted-
Average
Exercise
Price
Weighted-
Average
Remaining
Contractual
Term
(Years)
Aggregate
Intrinsic
Value
(In thousands)
Outstanding atDecember 31,2010 2,020,767 $ 32.17
Granted 154,226 39.21Exercised (115,788 ) 20.18Forfeited or expired (15,431 ) 30.95Outstanding at
December 31,2011 2,043,774 $ 33.39 5.62 $ 10,537
Vested or expected tovest atDecember 31,2011 2,009,984 $ 33.49 5.57 $ 10,240
Exercisable atDecember 31,2011 1,549,376 $ 35.69 4.77 $ 5,681
Schedule Of Information Related ToOptions Exercised
2011 2010 2009
(In thousands)
Intrinsic value of stock options exercised $2,269 $3,725 $3Cash received from stock options
exercised $2,336 $6,076 $68
Copyright © 2013 www.secdatabase.com. All Rights Reserved.Please Consider the Environment Before Printing This Document

Schedule Of Employee Stock PurchasePlan Information
2011 2010 2009
Number of ESPP shares issued 42,443 56,279 102,081Amount of proceeds received
from employees $1,288 $1,207 $1,233Share-based compensation
expense $352 $332 $385Nonvested Deferred Stock Units [Member]Schedule Of Nonvested Deferred StockUnits
Nonvested Board DSUs Shares
Weighted-
Average
Grant-Date
Fair Value
Outstanding at December 31, 2010 32,961 $ 28.43Granted 30,397 39.89Vested (17,212) 31.46Nonvested at December 31, 2011 46,146 $ 34.85
Vested at December 31, 2011 65,433 $ 30.15
Expected to vest at December 31,2011 43,262 $ 34.85
Service Award Units [Member]Schedule Of Service Award Units
Service Award Units Shares
Weighted-
Average
Grant-Date
Fair Value
Outstanding at December 31, 2010 169,203 $ 21.07Granted 18,434 42.72Vested (58,819 ) 26.99Cancellations (1,581 ) 22.46Nonvested at December 31, 2011 127,237 $ 21.45
Expected to vest at December 31,2011 119,577 $ 21.45
Performance Award Units [Member]Schedule Of Performance Award Units
Performance Award Units Shares
Weighted-
Average
Grant-Date
Fair Value
Outstanding at December 31, 2010 78,974 $ 26.33Granted 52,503 42.77Vested (19,765 ) 26.33Cancellations (2,191 ) 35.93Nonvested at December 31, 2011 109,521 $ 34.29
Expected to vest at December 31,2011 102,928 $ 34.29
Chief Executive Officer [Member] | DSUService Award [Member]Schedule Of Performance Award Units
Service DSU Units Granted to CEO Shares
Weighted-
Average
Copyright © 2013 www.secdatabase.com. All Rights Reserved.Please Consider the Environment Before Printing This Document

Grant-Date
Fair Value
Outstanding at December 31, 2010 60,144 $ 24.94Granted 900 44.44Vested (15,936) 26.04Total at December 31, 2011 45,108 $ 24.94
Expected to vest at December 31,2011 45,108 $ 24.94
Chief Executive Officer [Member] | DSUPerformance Award [Member]Schedule Of Performance Award Units
Performance DSUs Granted to CEO Shares
Weighted-
Average
Grant-Date
Fair Value
Outstanding at December 31, 2010 23,004 $ 22.17Granted 24,122 44.44Vested (5,751 ) 22.17Total at December 31, 2011 41,375 $ 35.15
Expected to vest at December 31,2011 41,375 $ 35.15
Copyright © 2013 www.secdatabase.com. All Rights Reserved.Please Consider the Environment Before Printing This Document
12 Months EndedRetirement Plans Dec. 31, 2011Retirement Plans [Abstract]Retirement Plans 12. Retirement Plans
Pension Benefits
Certain of the Company's U.S. employees participate in a defined benefit pension plan thatclosed to new participants effective January 1, 1995. Benefits under the plan for most eligibleemployees are calculated using the highest five-year average salary of the employee. Employeesparticipate in this plan by means of salary reduction contributions. Vested benefits are based onan employee's expected date of retirement. Retirement plan funding amounts are based onindependent consulting actuaries' determination of the Employee Retirement Income Security Actof 1974 funding requirements.
For purposes of measuring the Company's benefit obligation as of December 31, 2011, and2010, a discount rate of 4.41% and 5.09%, respectively, was used. These discount rates werechosen using an analysis of the Hewitt Bond Universe yield curve that reflects the plan'sprojected cash flows. The fair value of plan assets increased by $1.6 million as of December 31,2011, as compared to December 31, 2010, as employer contributions and investment gainsexceeded benefits paid during the year. The plan's projected benefit obligation increased by a netamount of $7.6 million, due primarily to the use of a lower discount rate as of December 31,2011. The Company's projected benefit obligations exceeded plan assets by $15.8 million and$9.8 million as of December 31, 2011, and 2010, respectively. Pension cost, excluding anypension settlement charges incurred during the year, was $1.9 million, $1.5 million and $1.5million for 2011, 2010, and 2009, respectively.
The Company's projected benefit obligation was estimated using an expected long-term rateof return on assets of 8.0%. The Company employs a total return investment approach whereby amix of equities and fixed income investments is used to maximize the long-term return of planassets for a prudent level of risk. The intent of this strategy is to minimize plan expenses byoutperforming plan liabilities over the long run. Risk tolerance is established through carefulconsideration of plan liabilities, plan funded status, and corporate financial condition. TheCompany's investment strategy is to diversify assets so that adverse results from one asset orasset class will not have an unduly detrimental effect on the entire portfolio. Diversificationincludes by type, by characteristic, and by number of investments, as well as by investment styleof management organization.
The investment portfolio contains a diversified blend of common collective trust fundinvestments, which include both equity and fixed income type investments. Equity investmentsare diversified across U.S. and non-U.S. stocks, as well as growth and value stocks. Fixed incomeinvestments are diversified across asset-backed and mortgage-backed securities, U.S. treasurysecurities, and corporate bonds. Investment risk is measured and monitored on an ongoing basisthrough annual liability measurements, periodic asset/liability studies and periodic investmentperformance reviews.
The Financial Accounting Standards Board provides a fair value hierarchy that prioritizesthe inputs to valuation techniques used to measure fair value. The hierarchy gives the highestpriority to unadjusted quoted prices in active markets for identical assets or liabilities (level 1
Copyright © 2013 www.secdatabase.com. All Rights Reserved.Please Consider the Environment Before Printing This Document

measurements) and the lowest priority to unobservable inputs (level 3 measurements). The threelevels of the fair value hierarchy are described below:
Level 1 — Inputs to the valuation methodology are unadjusted quoted prices for identicalassets or liabilities in active markets.
Level 2 — Inputs to the valuation methodology include:
� Quoted prices for similar assets or liabilities in active markets;
� Quoted prices for identical or similar assets or liabilities in inactive markets;
� Inputs other than quoted prices that are observable for the asset or liability;
� Inputs that are derived principally from or corroborated by observable market data bycorrelation or other means.
Level 3 — Inputs to the valuation methodology are unobservable and significant to the fairvalue measurement.
The following is a description of the valuation methodologies used for pension plan assetsmeasured at fair value.
Money market fund: The investment in the money market fund is valued at the net assetvalue of shares held at year end.
Collective investment funds: Investments in collective investment funds are valued at thelast reported transaction price per unit.
The fair values of the Company's pension plan assets at December 31, 2011, and 2010, byasset category are as follows (in thousands):
As of December 31, 2011
Total
Fair
Value
Quoted
prices in
active
markets
Level 1
Significant
observable
inputs
Level 2
Significant
unobservable
inputs
Level 3
Asset CategoryCollective investment funds
Fixed income (a) $11,062 $ — $11,062 $ —U.S. equity growth 6,945 — 6,945 —U.S. equity value 6,952 — 6,952 —Foreign equity 2,810 — 2,810 —
Money market fund 702 702 — —Pension assets at December 31, 2011 $28,471 $ 702 $27,769 $ —
(a) As of December 31, 2011, the fixed income fund consisted of a 34% investment in asset andmortgage-backed securities, a 41% investment in U.S. treasury securities, and a 25%investment in corporate bonds.
As of December 31, 2010
Total
Fair
Value
Quoted
prices in
active
Significant
observable
Significant
unobservable
Copyright © 2013 www.secdatabase.com. All Rights Reserved.Please Consider the Environment Before Printing This Document

markets
Level 1
inputs
Level 2
inputs
Level 3
Asset CategoryCollective investment funds
Fixed income (b) $10,626 $ — $10,626 $ —U.S. equity growth 6,607 — 6,607 —U.S. equity value 6,622 — 6,622 —Foreign equity 2,658 — 2,658 —
Money market fund 345 345 — —Pension assets at December 31, 2010 $26,858 $ 345 $26,513 $ —
(b) As of December 31, 2010, the fixed income fund consisted of a 35% investment in asset andmortgage-backed securities, a 41% investment in U.S. treasury securities, and a 24%investment in corporate bonds.
Cash held and intended to pay benefits is considered to be a residual asset in the asset mix,and therefore, compliance with the ranges and targets specified shall be calculated excluding suchassets. Assets of the plan do not include securities issued by the Company. The target allocationfor each asset class is 60% equity securities and 40% debt securities.
The components of net periodic cost and other comprehensive loss (income) for theyears ended December 31, 2011, 2010, and 2009, are as follows (in thousands):
2011 2010 2009
Net periodic costService cost of benefits $774 $731 $790Interest cost 1,819 1,883 1,847Expected return on plan assets (2,051) (2,118) (2,172)Amortization of net actuarial loss 1,370 1,052 992Amortization of prior service cost — — 22Total $1,912 $1,548 $1,479
Other changes in plan assets and projectedbenefit obligation recognized in othercomprehensive loss (income)
Net actuarial loss (gain) arising this year 7,449 281 (2,295)Actuarial loss charged to expense due to
settlement — — (1,521)Net actuarial loss amortized this year (1,370) (1,052) (992 )Prior service cost amortized this year — — (22 )Recognized in other comprehensive loss
(income) 6,079 (771 ) (4,830)
Recognized in net periodic pension cost andother comprehensive loss (income) $7,991 $777 $(3,351)
The Company's estimate for contributions to be paid in 2012 is $2.6 million. Theexpected benefit payments are as follows (in thousands):
2012 $2,0532013 $2,192
Copyright © 2013 www.secdatabase.com. All Rights Reserved.Please Consider the Environment Before Printing This Document
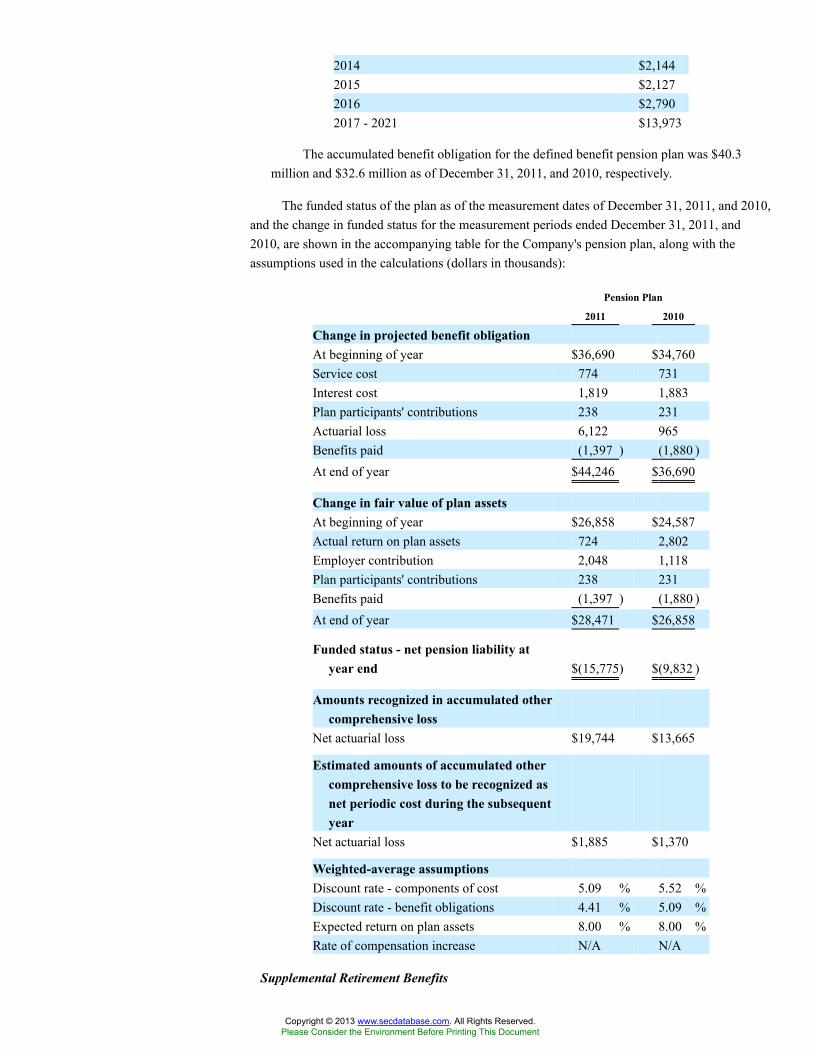
2014 $2,1442015 $2,1272016 $2,7902017 - 2021 $13,973
The accumulated benefit obligation for the defined benefit pension plan was $40.3million and $32.6 million as of December 31, 2011, and 2010, respectively.
The funded status of the plan as of the measurement dates of December 31, 2011, and 2010,and the change in funded status for the measurement periods ended December 31, 2011, and2010, are shown in the accompanying table for the Company's pension plan, along with theassumptions used in the calculations (dollars in thousands):
Pension Plan
2011 2010
Change in projected benefit obligationAt beginning of year $36,690 $34,760Service cost 774 731Interest cost 1,819 1,883Plan participants' contributions 238 231Actuarial loss 6,122 965Benefits paid (1,397 ) (1,880 )At end of year $44,246 $36,690
Change in fair value of plan assetsAt beginning of year $26,858 $24,587Actual return on plan assets 724 2,802Employer contribution 2,048 1,118Plan participants' contributions 238 231Benefits paid (1,397 ) (1,880 )At end of year $28,471 $26,858
Funded status - net pension liability atyear end $(15,775) $(9,832 )
Amounts recognized in accumulated othercomprehensive loss
Net actuarial loss $19,744 $13,665
Estimated amounts of accumulated othercomprehensive loss to be recognized asnet periodic cost during the subsequentyear
Net actuarial loss $1,885 $1,370
Weighted-average assumptionsDiscount rate - components of cost 5.09 % 5.52 %Discount rate - benefit obligations 4.41 % 5.09 %Expected return on plan assets 8.00 % 8.00 %Rate of compensation increase N/A N/A
Supplemental Retirement Benefits
Copyright © 2013 www.secdatabase.com. All Rights Reserved.Please Consider the Environment Before Printing This Document

During the years ended December 31, 2011, 2010, and 2009, the Company sponsored theBenefit Equalization Plan ("BEP"), the purpose of which is to ensure that pension planparticipants will not be deprived of benefits otherwise payable under the pension plan but for theoperation of the provisions of Internal Revenue Code sections 415 and 401. The accumulatedbenefit obligation for the BEP as of December 31, 2011, and 2010, was $3.3 million and $2.9million, respectively.
As of December 31, 2011, and 2010, prepaid pension cost related to the BEP of $0.3million and $0.2 million, respectively, was held in a benefit protection trust and included in othernoncurrent assets in the consolidated balance sheets. The Company's estimate for contributions tobe paid for the BEP in 2012 is $0.2 million. The expected benefit payments for the BEP are asfollows (in thousands):
2012 $1612013 $1612014 $1612015 $1912016 $1922017 - 2021 $966
For the years ended December 31, 2010 and 2009, in addition to the BEP, the Companyalso sponsored a Supplemental Executive Retirement Plan ( "SERP" individually or"Supplemental Plans" when combined with the BEP). The SERP was a supplemental retirementplan for a former chief executive officer, who retired from the Company on December 31, 2009.The Company's $0.7 million SERP obligation was paid during 2010.
The Supplemental Plans are nonqualified, unfunded supplemental retirement plans. Thecomponents of net periodic Supplemental Plan cost and other comprehensive (income) loss forthe years ended December 31, 2011, 2010, and 2009 are as follows (in thousands):
2011 2010 2009
Net periodic costService cost of benefits $20 $16 $93Interest cost 159 192 318Amortization of net actuarial loss 153 148 431Amortization of prior service credit — — (16 )Total $332 $356 $826
Other changes in plan assets and projectedbenefit obligation recognized in othercomprehensive loss (income)
Net actuarial loss (gain) arising this year $464 $493 $(1,104)Net actuarial loss amortized this year (153) (148 ) (431 )Actuarial loss due to settlement — (1,222) (267 )Prior service credit due to curtailment — — 6Prior service credit amortized this year — — 16Recognized in other comprehensive loss
(income) $311 $(877 ) $(1,780)
Copyright © 2013 www.secdatabase.com. All Rights Reserved.Please Consider the Environment Before Printing This Document
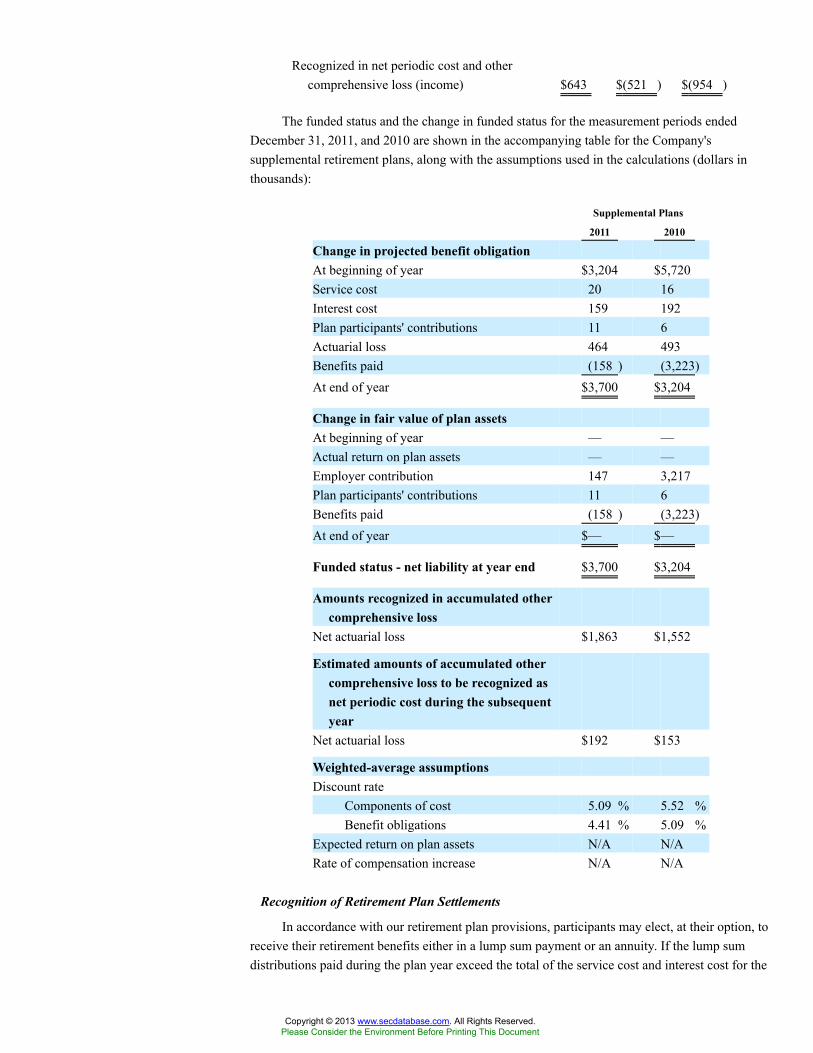
Recognized in net periodic cost and othercomprehensive loss (income) $643 $(521 ) $(954 )
The funded status and the change in funded status for the measurement periods endedDecember 31, 2011, and 2010 are shown in the accompanying table for the Company'ssupplemental retirement plans, along with the assumptions used in the calculations (dollars inthousands):
Supplemental Plans
2011 2010
Change in projected benefit obligationAt beginning of year $3,204 $5,720Service cost 20 16Interest cost 159 192Plan participants' contributions 11 6Actuarial loss 464 493Benefits paid (158 ) (3,223)At end of year $3,700 $3,204
Change in fair value of plan assetsAt beginning of year — —Actual return on plan assets — —Employer contribution 147 3,217Plan participants' contributions 11 6Benefits paid (158 ) (3,223)At end of year $— $—
Funded status - net liability at year end $3,700 $3,204
Amounts recognized in accumulated othercomprehensive loss
Net actuarial loss $1,863 $1,552
Estimated amounts of accumulated othercomprehensive loss to be recognized asnet periodic cost during the subsequentyear
Net actuarial loss $192 $153
Weighted-average assumptionsDiscount rate
Components of cost 5.09 % 5.52 %Benefit obligations 4.41 % 5.09 %
Expected return on plan assets N/A N/ARate of compensation increase N/A N/A
Recognition of Retirement Plan Settlements
In accordance with our retirement plan provisions, participants may elect, at their option, toreceive their retirement benefits either in a lump sum payment or an annuity. If the lump sumdistributions paid during the plan year exceed the total of the service cost and interest cost for the
Copyright © 2013 www.secdatabase.com. All Rights Reserved.Please Consider the Environment Before Printing This Document

plan year, any unrecognized gain or loss in the plan should be recognized for the pro rata portionequal to the percentage reduction of the projected benefit obligation.
No settlement charges were incurred or recognized during 2011. The following table showsthe income statement line items impacted by the recognition of the settlement charges in 2010and 2009 (in thousands):
2010 2009
Cost of revenue $— $—Selling, general, and administrative 1,222 —Research and development — —Restructuring and reorganization — 1,803Total costs and expenses $1,222 $1,803
Postretirement Benefits
The Company provides health care benefits for eligible retired employees who participatein the pension plan and were hired before January 1, 1992. These postretirement benefits areprovided by several health care plans in the United States for both pre-age 65 retirees and certaingrandfathered post-age 65 retirees. Employer contributions to these plans differ for variousgroups of retirees and future retirees. Employees hired before January 1, 1992 and retiring afterthat date may enroll in plans for which a Company subsidy is provided through age 64. As ofDecember 31, 2011, and 2010, the Company's discount rate on its actuarially determined benefitobligations was 3.91% and 4.56%, respectively. The discount rates for 2011 and 2010 werechosen using an analysis of the Hewitt Bond Universe yield curve that reflects the plan'sprojected cash flows.
The Company's postretirement benefit liability was $1.9 million and $1.8 million as ofDecember 31, 2011, and 2010, respectively. The Company's postretirement benefit expense was$0.1 million for the year ended December 31, 2011, and $0.2 million for each of the years endedDecember 31, 2010, and 2009. The postretirement plan is unfunded.
The Company expects to make $0.1 million in contributions in 2012. The expected benefitpayments are as follows (in thousands):
2012 $1202013 $1282014 $1462015 $1572016 $1392017-2021 $763
The components of net periodic postretirement plan cost and other comprehensive loss(income) for the years ended December 31, 2011, 2010, and 2009, are as follows (in thousands):
2011 2010 2009
Net periodic costService cost of benefits $38 $38 $49Interest cost 81 89 92Amortization of net actuarial loss 28 36 43Total $147 $163 $184
Copyright © 2013 www.secdatabase.com. All Rights Reserved.Please Consider the Environment Before Printing This Document

Other changes in plan assets and projected benefitobligation recognized in other comprehensiveloss (income)
Net actuarial loss (gain) arising this year $(35 ) $(79 ) $(41 )Net actuarial loss amortized this year (28 ) (36 ) (43 )Recognized in other comprehensive loss (income) $(63 ) $(115) $(84 )
Recognized in net periodic cost and othercomprehensive loss (income) $84 $48 $100
The accompanying table presents the balances of and changes in the postretirement benefitobligation as of the measurement dates of December 31, 2011, and 2010 (dollars in thousands):
Postretirement Plan
2011 2010
Change in projected benefit obligationAt beginning of year $1,837 $1,783Service cost 38 38Interest cost 81 89Plan participants' contributions 55 59Actuarial gain (35 ) (79 )Benefits paid (69 ) (53 )At end of year $1,907 $1,837
Change in fair value of plan assetsAt beginning of year $— $—Employer contribution 14 (6 )Plan participants' contributions 55 59Benefits paid (69 ) (53 )At end of year $— $—
Funded status - net liability at year end $1,907 $1,837
Amounts recognized in accumulated othercomprehensive loss
Net actuarial loss $348 $411
Estimated amounts of accumulated othercomprehensive loss to be recognized as netperiodic cost during the subsequent year
Net actuarial loss $21 $25
Weighted-average assumptionsDiscount rate
Components of cost 4.56 % 5.17 %Benefit obligations 3.91 % 4.56 %
Expected return on plan assets N/A N/ARate of compensation increase N/A N/A
The assumed health care cost trend rate used in measuring the post retirement benefitobligation was 8.50% for pre-age 65 and post-age 65 in 2011, with pre-age and post-age 65 ratesdeclining to an ultimate rate of 5.00% in 2018. A 1.0% change in this rate would change the
Copyright © 2013 www.secdatabase.com. All Rights Reserved.Please Consider the Environment Before Printing This Document

benefit obligation by up to approximately $0.2 million and the aggregate service and interest costby less than $0.1 million.
401(k) Plan
The Company's employees may participate in a defined contribution plan sponsored by theCompany. For the period ended December 31, 2011, there was no plan limitation on thepercentage of eligible earnings a participant could contribute to the plan, other than thoselimitations set by the Internal Revenue Code. For the period ended December 31, 2010, the plangenerally provided for employee salary deferral contributions of up to 17% of eligible employeecompensation.
Under the terms of the plan, the Company contributes a matching contribution of 50% up toa maximum of 3% of eligible employee compensation related to employees who are pensionparticipants and up to a maximum of 6% of eligible employee compensation related to employeeswho are not pension participants. The Company may also make an additional discretionarymatching contribution of up to 30% up to the maximum eligible employee compensation. TheCompany's costs with respect to its contributions to the defined contribution plan were $2.7million, $2.1 million and $2.0 million in 2011, 2010, and 2009, respectively.
Copyright © 2013 www.secdatabase.com. All Rights Reserved.Please Consider the Environment Before Printing This Document