SECTOR UPDATE March 10, 2014 -...
26
Ambit Capital and / or its affiliates do and seek to do business including investment banking with companies covered in its research reports. As a result, investors should be aware that Ambit Capital may have a conflict of interest that could affect the objectivity of this report. Investors should not consider this report as the only factor in making their investment decision. Bottomed out yet? The consumer staples sector’s revenue growth and EBITDA growth further moderated in 3QFY14 to 13% YoY and 10% YoY, respectively (vs 14% and 17% respectively in 2QFY14). We expect both revenue growth and EBITDA growth to remain sluggish over 4QFY14/1QFY15, owing to: (a) the high competitive intensity and a weak economic environment constraining volume growth; (b) likely gross margin contraction given high base and higher commodity prices; and (c) elevated A&P spends given high competitive intensity. Thus, even though our DCF valuation indicates a limited downside on stocks such as GSK Consumer, HUL and Nestle, we expect the sector to de-rate by another 5-10% from its current average valuation of 28x FY15 earnings. Expect moderation in revenue growth to continue in 4QFY14 Revenue growth and volume growth in 3QFY14 both moderated by 100bps YoY to 13% and 7% respectively, despite the significantly higher promotional spends; the A&P/sales ratio for the sector increased to 13.9%, a 20bps YoY increase. Rural growth, which outpaced urban growth by ~700bps in 2QFY14, decelerated and grew at ~8%, only 200-300bps higher than urban growth during 3QFY14. Given the moderating rural growth amidst a weak macro environment, we expect sector revenue growth to remain sluggish (at 10-12%) over the next 6-9 months. Expect contraction in gross margins given high base of 4QFY13 The sector saw a substantial gross margin expansion from 3QFY13 onwards due to softening input costs. Hence, gross margins contracted 100bps YOY in 3QFY14 given the high base. We expect gross margins to contract further in 4QFY14, owing to: (a) 10-30% inflation in some key raw materials like copra, milk, PFAD and barley; and (b) high base of gross margins in 4QFY13. A&P spends to remain elevated for the sector Historically, the A&P/sales ratio for the sector has increased due to gross margin benefits being invested back into advert spends. However, despite gross margins contracting 100bps YoY for the sector in 3QFY14, A&P spends increased by 20bps YoY over the same period. We expect A&P spends to remain elevated in the coming quarters, due to: (a) high competitive intensity; and (b) companies’ desire to avoid market share losses amidst a widespread weakness in consumer spending. Another ~5-10% de-rating for most stocks; Colgate – our top SELL We reduce our FY15 sector revenue and EBITDA forecast by ~2% and valuations by ~1%. Share prices across the sector have fallen by ~10% over the past nine months; thus, stocks, such as GSK Consumer, Nestle and HUL, just have another 5% downside to our DCF-based valuation. We reiterate SELL on most FMCG firms (excluding Marico), as we expect earnings growth to weaken further in 4QFY14 and 1QFY15 to 10-12% YoY, given the headwinds highlighted above. Colgate is our top SELL recommendation in the sector; it is currently trading at 30.7x FY15 EPS, which is rich, as the FY13-16 EPS CAGR would likely be lower than 11%. Whilst Colgate will be able to maintain its market share over the short to medium term, heightened competitive intensity from Oral-B (P&G) would require high levels of A&P spends, thus adversely impacting Colgate’s EPS growth. Consumer Staples NEGATIVE SECTOR UPDATE March 10, 2014 Consumer Staples Key Recommendations HUL SELL Target Price: 533 Downside: 3% Nestle SELL Target Price: 4,571 Downside: 7% Dabur SELL Target Price: 155 Downside: 9% Godrej Consumer SELL Target Price: 757 Upside: 3% GSK Consumer SELL Target Price: 4,396 Upside: 3% Colgate SELL Target Price: 1,192 Downside: 10% Marico BUY Target Price: 229 Upside : 11% Analyst Details Rakshit Ranjan, CFA +91 22 3043 3201 [email protected] Shariq Merchant +91 22 3043 3246 [email protected]
Transcript of SECTOR UPDATE March 10, 2014 -...
Ambit Capital and / or its affiliates do and seek to do business including investment banking with companies covered in its research reports. As a result, investors should be aware that Ambit Capital may have a conflict of interest that could affect the objectivity of this report. Investors should not consider this report as the only factor in making their investment decision.
Bottomed out yet? The consumer staples sector’s revenue growth and EBITDA growth further moderated in 3QFY14 to 13% YoY and 10% YoY, respectively (vs 14% and 17% respectively in 2QFY14). We expect both revenue growth and EBITDA growth to remain sluggish over 4QFY14/1QFY15, owing to: (a) the high competitive intensity and a weak economic environment constraining volume growth; (b) likely gross margin contraction given high base and higher commodity prices; and (c) elevated A&P spends given high competitive intensity. Thus, even though our DCF valuation indicates a limited downside on stocks such as GSK Consumer, HUL and Nestle, we expect the sector to de-rate by another 5-10% from its current average valuation of 28x FY15 earnings.
Expect moderation in revenue growth to continue in 4QFY14
Revenue growth and volume growth in 3QFY14 both moderated by 100bps YoY to 13% and 7% respectively, despite the significantly higher promotional spends; the A&P/sales ratio for the sector increased to 13.9%, a 20bps YoY increase. Rural growth, which outpaced urban growth by ~700bps in 2QFY14, decelerated and grew at ~8%, only 200-300bps higher than urban growth during 3QFY14. Given the moderating rural growth amidst a weak macro environment, we expect sector revenue growth to remain sluggish (at 10-12%) over the next 6-9 months.
Expect contraction in gross margins given high base of 4QFY13
The sector saw a substantial gross margin expansion from 3QFY13 onwards due to softening input costs. Hence, gross margins contracted 100bps YOY in 3QFY14 given the high base. We expect gross margins to contract further in 4QFY14, owing to: (a) 10-30% inflation in some key raw materials like copra, milk, PFAD and barley; and (b) high base of gross margins in 4QFY13.
A&P spends to remain elevated for the sector
Historically, the A&P/sales ratio for the sector has increased due to gross margin benefits being invested back into advert spends. However, despite gross margins contracting 100bps YoY for the sector in 3QFY14, A&P spends increased by 20bps YoY over the same period. We expect A&P spends to remain elevated in the coming quarters, due to: (a) high competitive intensity; and (b) companies’ desire to avoid market share losses amidst a widespread weakness in consumer spending.
Another ~5-10% de-rating for most stocks; Colgate – our top SELL
We reduce our FY15 sector revenue and EBITDA forecast by ~2% and valuations by ~1%. Share prices across the sector have fallen by ~10% over the past nine months; thus, stocks, such as GSK Consumer, Nestle and HUL, just have another 5% downside to our DCF-based valuation. We reiterate SELL on most FMCG firms (excluding Marico), as we expect earnings growth to weaken further in 4QFY14 and 1QFY15 to 10-12% YoY, given the headwinds highlighted above.
Colgate is our top SELL recommendation in the sector; it is currently trading at 30.7x FY15 EPS, which is rich, as the FY13-16 EPS CAGR would likely be lower than 11%. Whilst Colgate will be able to maintain its market share over the short to medium term, heightened competitive intensity from Oral-B (P&G) would require high levels of A&P spends, thus adversely impacting Colgate’s EPS growth.
Consumer Staples NEGATIVE
SECTOR UPDATE March 10, 2014
Consumer Staples
Key Recommendations
HUL SELL
Target Price: 533 Downside: 3%
Nestle SELL
Target Price: 4,571 Downside: 7%
Dabur SELL
Target Price: 155 Downside: 9%
Godrej Consumer SELL
Target Price: 757 Upside: 3%
GSK Consumer SELL
Target Price: 4,396 Upside: 3%
Colgate SELL
Target Price: 1,192 Downside: 10%
Marico BUY
Target Price: 229 Upside : 11%
Analyst Details Rakshit Ranjan, CFA +91 22 3043 3201 [email protected] Shariq Merchant +91 22 3043 3246 [email protected]
Consumer staples
March 10, 2014 Ambit Capital Pvt. Ltd. Page 2
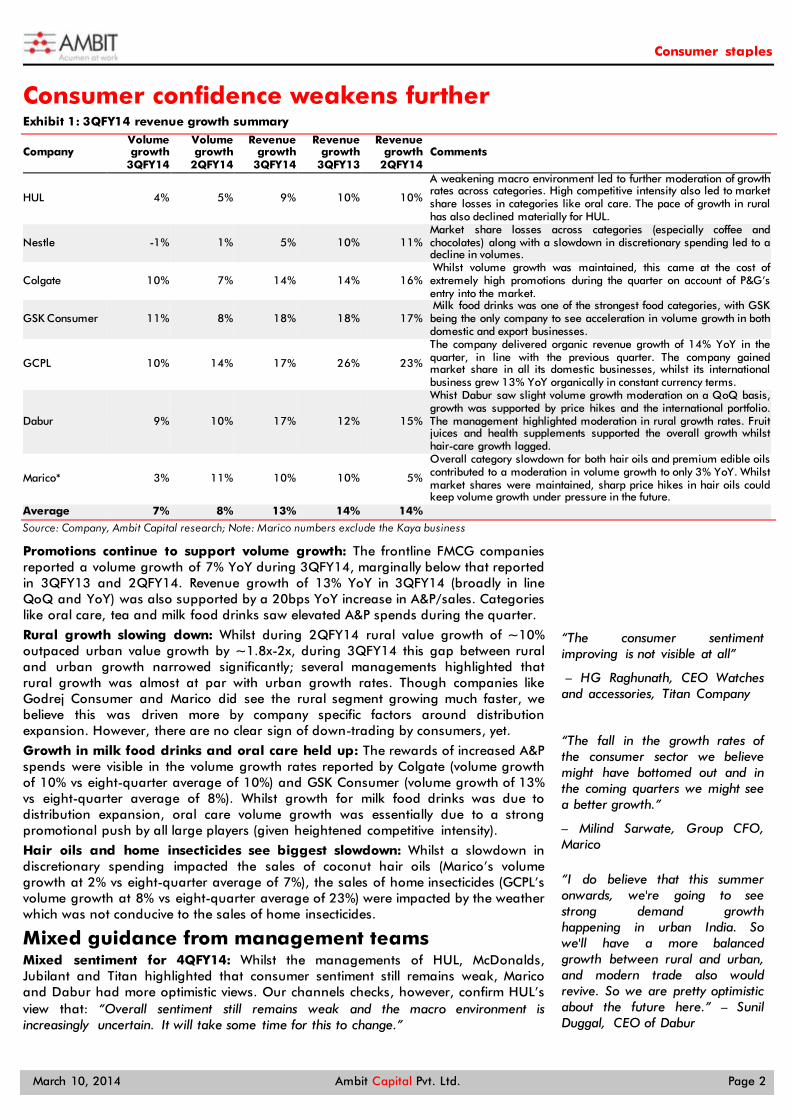
Consumer confidence weakens further Exhibit 1: 3QFY14 revenue growth summary
Company Volume growth
3QFY14
Volume growth
2QFY14
Revenue growth
3QFY14
Revenue growth
3QFY13
Revenue growth
2QFY14 Comments
HUL 4% 5% 9% 10% 10%
A weakening macro environment led to further moderation of growth rates across categories. High competitive intensity also led to market share losses in categories like oral care. The pace of growth in rural has also declined materially for HUL.
Nestle -1% 1% 5% 10% 11% Market share losses across categories (especially coffee and chocolates) along with a slowdown in discretionary spending led to a decline in volumes.
Colgate 10% 7% 14% 14% 16% Whilst volume growth was maintained, this came at the cost of extremely high promotions during the quarter on account of P&G’s entry into the market.
GSK Consumer 11% 8% 18% 18% 17% Milk food drinks was one of the strongest food categories, with GSK being the only company to see acceleration in volume growth in both domestic and export businesses.
GCPL 10% 14% 17% 26% 23%
The company delivered organic revenue growth of 14% YoY in the quarter, in line with the previous quarter. The company gained market share in all its domestic businesses, whilst its international business grew 13% YoY organically in constant currency terms.
Dabur 9% 10% 17% 12% 15%
Whist Dabur saw slight volume growth moderation on a QoQ basis, growth was supported by price hikes and the international portfolio. The management highlighted moderation in rural growth rates. Fruit juices and health supplements supported the overall growth whilst hair-care growth lagged.
Marico* 3% 11% 10% 10% 5%
Overall category slowdown for both hair oils and premium edible oils contributed to a moderation in volume growth to only 3% YoY. Whilst market shares were maintained, sharp price hikes in hair oils could keep volume growth under pressure in the future.
Average 7% 8% 13% 14% 14%
Source: Company, Ambit Capital research; Note: Marico numbers exclude the Kaya business
Promotions continue to support volume growth: The frontline FMCG companies reported a volume growth of 7% YoY during 3QFY14, marginally below that reported in 3QFY13 and 2QFY14. Revenue growth of 13% YoY in 3QFY14 (broadly in line QoQ and YoY) was also supported by a 20bps YoY increase in A&P/sales. Categories like oral care, tea and milk food drinks saw elevated A&P spends during the quarter.
Rural growth slowing down: Whilst during 2QFY14 rural value growth of ~10% outpaced urban value growth by ~1.8x-2x, during 3QFY14 this gap between rural and urban growth narrowed significantly; several managements highlighted that rural growth was almost at par with urban growth rates. Though companies like Godrej Consumer and Marico did see the rural segment growing much faster, we believe this was driven more by company specific factors around distribution expansion. However, there are no clear sign of down-trading by consumers, yet.
Growth in milk food drinks and oral care held up: The rewards of increased A&P spends were visible in the volume growth rates reported by Colgate (volume growth of 10% vs eight-quarter average of 10%) and GSK Consumer (volume growth of 13% vs eight-quarter average of 8%). Whilst growth for milk food drinks was due to distribution expansion, oral care volume growth was essentially due to a strong promotional push by all large players (given heightened competitive intensity).
Hair oils and home insecticides see biggest slowdown: Whilst a slowdown in discretionary spending impacted the sales of coconut hair oils (Marico’s volume growth at 2% vs eight-quarter average of 7%), the sales of home insecticides (GCPL’s volume growth at 8% vs eight-quarter average of 23%) were impacted by the weather which was not conducive to the sales of home insecticides.
Mixed guidance from management teams Mixed sentiment for 4QFY14: Whilst the managements of HUL, McDonalds, Jubilant and Titan highlighted that consumer sentiment still remains weak, Marico and Dabur had more optimistic views. Our channels checks, however, confirm HUL’s view that: “Overall sentiment still remains weak and the macro environment is increasingly uncertain. It will take some time for this to change.”
“The consumer sentiment improving is not visible at all”
– HG Raghunath, CEO Watches and accessories, Titan Company
“The fall in the growth rates of the consumer sector we believe might have bottomed out and in the coming quarters we might see a better growth.”
– Milind Sarwate, Group CFO, Marico
“I do believe that this summer onwards, we're going to see strong demand growth happening in urban India. So we'll have a more balanced growth between rural and urban, and modern trade also would revive. So we are pretty optimistic about the future here.” – Sunil Duggal, CEO of Dabur

Consumer staples
March 10, 2014 Ambit Capital Pvt. Ltd. Page 3
High gross margins now in the base Exhibit 2: 3QFY14 gross margin profile summary
Company Gross margin change (bps, YoY) Gross margin change (bps, QoQ)
HUL 70 (40)
Nestle (180) (160)
Colgate 0 140
GSK Consumer (251) 50
GCPL (220) (40)
Dabur 0 (260)
Marico* (127) (170)
Average (101) (69)
Source: Company, Ambit Capital research; Note: Marico numbers are net of Kaya demerger
High base effect impacts 3QFY14 gross margins: As highlighted in our note, ‘More disappointments ahead’ (click here, dated 27 November 2013, 2HFY14 is likely to see the impact of a high base for gross margins. Of the seven frontline companies only HUL reported an increase in gross margins on a YoY basis during the quarter, whilst the remaining six companies saw flat or declining gross margins (average gross margin decline for the sector was 100bps).
4QFY14 will likely see further gross margin contraction: We expect 4QFY14 gross margins to contract by 80bps, owing to: (1) inflationary trends visible in some key raw materials like palm oil, copra and barley (see the exhibits below); and (2) base effect from high gross margins from 4QFY13 onwards given the softening of commodity prices in 3QFY13 and 4QFY13.
Exhibit 3: Copra prices have risen by ~30% over the past quarter (`100/Kg)
Source: Bloomberg, Ambit Capital research
Exhibit 4: PFAD prices have risen 10% in USD in the past quarter (US$/tonne)
Source: Bloomberg, Ambit Capital research
Exhibit 5: Barley prices have risen by 17% over the past quarter (`/quintal)
Source: Bloomberg, Ambit Capital research
Exhibit 6: Gross margin trends highlight an unfavourable base in 2HFY14 (bps)
Source: Company, Ambit Capital research
3,000
4,000
5,000
6,000
7,000
8,000
Jan/
12
Apr
/12
Jul/
12
Oct
/12
Jan/
13
Apr
/13
Jul/
13
Oct
/13
Jan/
14
30%
500
550
600
650
700
750
Nov
/12
Jan/
13
Mar
/13
Jun/
13
Aug
/13
Nov
/13
Jan/
14
10% QoQ in
1,100
1,200
1,300
1,400
1,500Ja
n/12
Apr
/12
Jul/
12
Oct
/12
Jan/
13
Apr
/13
Jul/
13
Oct
/13
Jan/
14
17%
(400)
(200)
-
200
400
600
Colgate Dabur GCPL GSKConsumer
HUL Marico Nestle
1HFY13 2HFY13 1HFY14 2HFY14E
Consumer staples
March 10, 2014 Ambit Capital Pvt. Ltd. Page 4
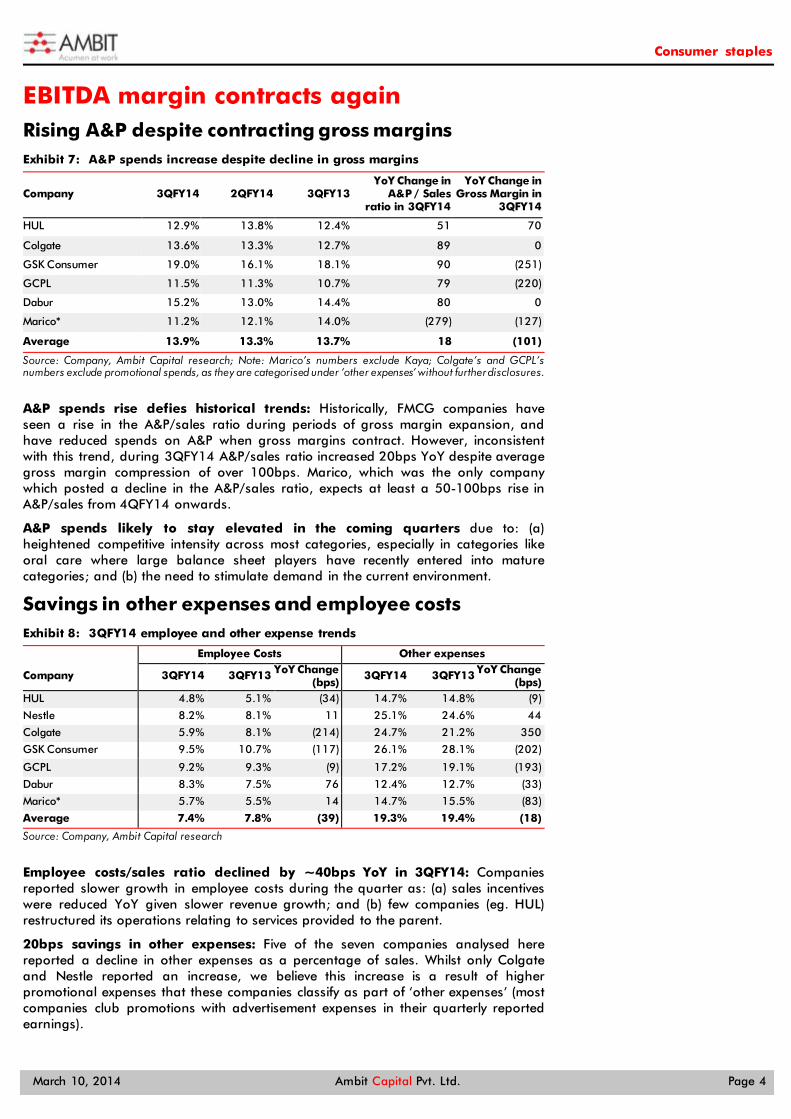
EBITDA margin contracts again Rising A&P despite contracting gross margins Exhibit 7: A&P spends increase despite decline in gross margins
Company 3QFY14 2QFY14 3QFY13 YoY Change in
A&P / Sales ratio in 3QFY14
YoY Change in Gross Margin in
3QFY14
HUL 12.9% 13.8% 12.4% 51 70
Colgate 13.6% 13.3% 12.7% 89 0
GSK Consumer 19.0% 16.1% 18.1% 90 (251)
GCPL 11.5% 11.3% 10.7% 79 (220)
Dabur 15.2% 13.0% 14.4% 80 0
Marico* 11.2% 12.1% 14.0% (279) (127)
Average 13.9% 13.3% 13.7% 18 (101)
Source: Company, Ambit Capital research; Note: Marico’s numbers exclude Kaya; Colgate’s and GCPL’s numbers exclude promotional spends, as they are categorised under ‘other expenses’ without further disclosures.
A&P spends rise defies historical trends: Historically, FMCG companies have seen a rise in the A&P/sales ratio during periods of gross margin expansion, and have reduced spends on A&P when gross margins contract. However, inconsistent with this trend, during 3QFY14 A&P/sales ratio increased 20bps YoY despite average gross margin compression of over 100bps. Marico, which was the only company which posted a decline in the A&P/sales ratio, expects at least a 50-100bps rise in A&P/sales from 4QFY14 onwards.
A&P spends likely to stay elevated in the coming quarters due to: (a) heightened competitive intensity across most categories, especially in categories like oral care where large balance sheet players have recently entered into mature categories; and (b) the need to stimulate demand in the current environment.
Savings in other expenses and employee costs Exhibit 8: 3QFY14 employee and other expense trends
Employee Costs Other expenses
Company 3QFY14 3QFY13 YoY Change (bps)
3QFY14 3QFY13 YoY Change (bps)
HUL 4.8% 5.1% (34) 14.7% 14.8% (9)
Nestle 8.2% 8.1% 11 25.1% 24.6% 44
Colgate 5.9% 8.1% (214) 24.7% 21.2% 350
GSK Consumer 9.5% 10.7% (117) 26.1% 28.1% (202)
GCPL 9.2% 9.3% (9) 17.2% 19.1% (193)
Dabur 8.3% 7.5% 76 12.4% 12.7% (33)
Marico* 5.7% 5.5% 14 14.7% 15.5% (83)
Average 7.4% 7.8% (39) 19.3% 19.4% (18)
Source: Company, Ambit Capital research
Employee costs/sales ratio declined by ~40bps YoY in 3QFY14: Companies reported slower growth in employee costs during the quarter as: (a) sales incentives were reduced YoY given slower revenue growth; and (b) few companies (eg. HUL) restructured its operations relating to services provided to the parent.
20bps savings in other expenses: Five of the seven companies analysed here reported a decline in other expenses as a percentage of sales. Whilst only Colgate and Nestle reported an increase, we believe this increase is a result of higher promotional expenses that these companies classify as part of ‘other expenses’ (most companies club promotions with advertisement expenses in their quarterly reported earnings).

Consumer staples
March 10, 2014 Ambit Capital Pvt. Ltd. Page 5
Valuations – We expect another ~5-10% share price correction after 4QFY14 Exhibit 9: Margin trends in 3QFY14
Company EBITDA Growth
EBITDA Margin change (bps) PBT Growth PAT Growth
HUL 13% 60 11% 9%
Nestle -6% (230) 0% -3%
Colgate 1% (220) 3% 2%
GSK Consumer 16% (22) 17% 14%
GCPL 9% (110) 6% 14%
Dabur 14% (43) 16% 16%
Marico* 27% 221 37% 31%
Average 10% (50) 13% 12%
Source: Company, Ambit Capital research; Note:* Marico’s numbers exclude Kaya
We continue to strongly believe in the long-term growth potential of the Indian consumer sector driven by structural tailwinds around demographics, penetration of media, expanding distribution networks, and evolving consumer behaviour. However, earnings growth for most firms is likely to range between 10% and 12% YoY, at least over the next 6-9 months. This is due to a combination of: (a) weak macro demand environment; (b) rising competitive intensity across categories; (c) heightened A&P spends from firms in order to avoid market share losses; (d) inflationary raw material costs; and (e) company-specific factors such as increase in tax rates, royalty rates etc. Moreover, with some of these headwinds ((b) and (d) cited above) likely to sustain over the medium to longer term, we expect EPS CAGR to moderate by over 400bps during FY13-16 as compared to FY08-13.
Exhibit 10: EPS CAGR in FY13-16 vs EPS CAGR in FY08-13
FY08-13 EPS CAGR FY13-16E EPS CAGR Change (bps)
HUL 13.0% 11.9% (110)
Nestle 21.0% 14.2% (680)
Dabur 18.0% 16.7% (130)
GSK Consumer 22.0% 18.2% (380)
Colgate 17.0% 11.1% (590)
Average (ex-Marico and GCPL) 18.2% 14.4% (378)
GCPL* 21.0% 19.9% (110)
Marico* 17.0% 23.6% 660
Average (incl Marico and GCPL)* 18.4% 16.5% (189)
Source: Companies, Ambit Capital research; Note: * For Marico and GCPL, the EPS for FY14 has benefitted from M&A/demerger

Consumer staples
March 10, 2014 Ambit Capital Pvt. Ltd. Page 6
Exhibit 11: Share price trends over the past nine months
Source: Bloomberg, Ambit Capital research
As highlighted in the chart above, weak earnings growth over the past nine months and poor visibility on demand revival over the next 6-9 months have pulled the sector’s average FY15 P/E multiple lower to 28x from ~29.0x-30.0x in November 2013. We expect earnings growth moderation to continue in 4QFY14 and thus expect P/E multiples to further de-rate by ~5-10% after the 4QFY14 results. We reiterate our SELL on most FMCG firms, with Colgate being our top SELL recommendation. Marico is our only BUY recommendation in the sector, as its valuations at 23.5x FY15 EPS more than adequately factor in headwinds related to its product portfolio.
Our valuation methodologies - absolute and relative Absolute valuations
Since the Indian consumer story is constantly evolving both in terms of the pace of growth (width and depth of consumption) as well as in terms of the competitive intensity, we prefer a DCF-based approach which factors in the implication of this evolution at a firm-specific level. Also, our DCF captures: (a) the varied capital deployment strategies likely to be adopted by these companies through capex and working capital investments; and (b) the relative defensive (or lack thereof) nature of these businesses compared with each other. Our DCF-based valuations suggest a ~5% de-rating of share prices from the current levels.
Exhibit 12: Relative valuations
CMP Mcap Stance Target
Price Upside/
Downside Implied P/E P/E EPS Growth ROCE
(` ) ($mn) FY15E FY15E FY16E FY13-15 FY15E
HUL 549 19,153 SELL 533 -3% 28.1 29.8 26.7 10% 77%
Nestle 4,870 7,541 SELL 4,571 -7% 33.9 33.9 28.4 14% 84%
Dabur 173 4,864 SELL 155 -9% 25.4 28.4 24.8 15% 29%
GCPL 758 4,160 SELL 757 3% 27.9 27.7 23.2 23% 19%
GSK Consumer 4,310 2,920 SELL 4,396 3% 29.6 29.1 24.3 18% 36%
Colgate 1,325 2,906 SELL 1,192 -10% 28.0 30.7 26.2 10% 110%
Marico 206 2,143 BUY 229 11% 25.7 23.5 19.8 24% 27%
ITC 334 42,590 NA NA NA NA 25.8 22.1 17% 50%
Britannia 884 1,707 NA NA NA NA 23.6 19.5 25% 37%
Emami 465 1,703 NA NA NA NA 23.3 19.9 22% 42%
Source: Ambit Capital research
60
70
80
90
100
110
120
130
140
Jun-13 Jul-13 Aug-13 Sep-13 Oct-13 Nov-13 Dec-13 Jan-14 Feb-14 Mar-14
Nestle Dabur Colgate Marico GSK Consumer GCPL HUL Sensex

Consumer staples
March 10, 2014 Ambit Capital Pvt. Ltd. Page 7
Exhibit 13: Competitiveness framework and the relative standing of peers - HUL and Nestle are ahead of the pack
HUL Colgate Dabur Marico Nestle GSK Consumer GCPL
Portfolio positioning (diversification and category growth)
Ability to displace competition
Capital allocation and corporate strategy
Overall rating
Source: Ambit Capital research; Note: *** indicates superior positioning relative to peers; ** indicates intermediate positioning relative to peers; * indicates inferior positioning relative to peers
Relative valuations
On one-year forward P/E multiples, the sector has re-rated by over 60% since FY08. Whilst two-thirds of this re-rating is backed by an improved fundamental performance of the respective stocks, the balance we believe is not justified given the moderation in volume growth related to an increase in competitive intensity and saturating penetration in several large product categories over the past five years.
Also, a comparison with other listed emerging market plays in countries, such as Indonesia, Brazil and China, suggests that the Indian FMCG sector is currently trading at a 40% premium to these international peers despite having generated 300bps lower revenue CAGR and 500bps lower EPS CAGR over FY08-13 (with 100bps lower revenue and 500bps lower EPS over the next 24 months).
Which companies should trade at a discount/premium relative to the sector?
We expect the premium/discount ratings for some firms in the sector as compared to the sector average to be driven by the divergence in positioning against peers on the following value drivers: (a) capital utilisation strategies, given the high cash-generating nature of the sector; and (b) product portfolio positioning, given the competition and category growth prospects. On this basis, we expect firms like Marico, GCPL and Dabur to trade at a discount to the sector average given weaker capital utilisation than their peers. Also, we expect firms like Nestle to trade at a premium relative to the sector average given the superior competitive positioning of its product portfolio (supported especially by baby foods), and an efficient and predictable capital allocation strategy. We expect GSK Consumer, Colgate and HUL to trade broadly in line with the peer group average, with strengths around capital allocation for these firms being offset by weakness around the competitive positioning of their product portfolios.
Cut estimates and valuation for the sector; HUL is the only marginal upgrade As highlighted in the exhibit below, our FY15 forecasts for revenues and EBITDA for the sector have been cut by 1-3%. The impact on valuation has also been similar.
Exhibit 14: Change in FY15 estimates and target price for the stocks under coverage (`)
Old
Valuation New
valuation Change FY15 EPS
(Old) FY15 EPS
(New) Change
Colgate 1,199 1192 -1% 42.5 42.8 1%
Dabur 156 155 -1% 6.3 6.1 -2%
GSK Consumer 4,352 4396 1% 146.7 148.7 1%
Godrej Consumer 789 757 -4% 29.6 28.3 -4%
HUL 523 533 2% 18.3 18.6 2%
Marico 228 229 0% 8.9 8.88 0%
Nestle 4,706 4571 -3% 145.1 138.8 -4%
Source: Ambit Capital research
Consumer staples
March 10, 2014 Ambit Capital Pvt. Ltd. Page 8
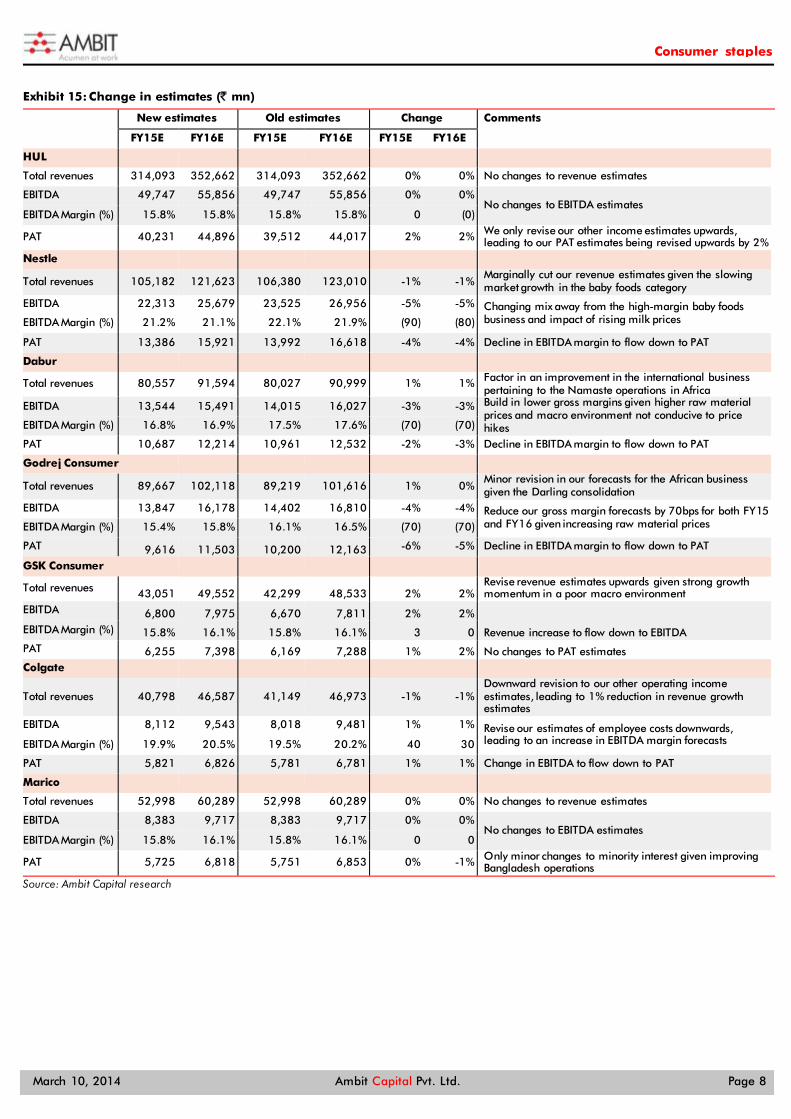
Exhibit 15: Change in estimates (` mn)
New estimates Old estimates Change Comments
FY15E FY16E FY15E FY16E FY15E FY16E HUL Total revenues 314,093 352,662 314,093 352,662 0% 0% No changes to revenue estimates
EBITDA 49,747 55,856 49,747 55,856 0% 0% No changes to EBITDA estimates
EBITDA Margin (%) 15.8% 15.8% 15.8% 15.8% 0 (0)
PAT 40,231 44,896 39,512 44,017 2% 2% We only revise our other income estimates upwards, leading to our PAT estimates being revised upwards by 2%
Nestle
Total revenues 105,182 121,623 106,380 123,010 -1% -1% Marginally cut our revenue estimates given the slowing market growth in the baby foods category
EBITDA 22,313 25,679 23,525 26,956 -5% -5% Changing mix away from the high-margin baby foods business and impact of rising milk prices EBITDA Margin (%) 21.2% 21.1% 22.1% 21.9% (90) (80)
PAT 13,386 15,921 13,992 16,618 -4% -4% Decline in EBITDA margin to flow down to PAT
Dabur Total revenues 80,557 91,594 80,027 90,999 1% 1% Factor in an improvement in the international business
pertaining to the Namaste operations in Africa EBITDA 13,544 15,491 14,015 16,027 -3% -3% Build in lower gross margins given higher raw material
prices and macro environment not conducive to price hikes EBITDA Margin (%) 16.8% 16.9% 17.5% 17.6% (70) (70)
PAT 10,687 12,214 10,961 12,532 -2% -3% Decline in EBITDA margin to flow down to PAT
Godrej Consumer
Total revenues 89,667 102,118 89,219 101,616 1% 0% Minor revision in our forecasts for the African business given the Darling consolidation
EBITDA 13,847 16,178 14,402 16,810 -4% -4% Reduce our gross margin forecasts by 70bps for both FY15 and FY16 given increasing raw material prices EBITDA Margin (%) 15.4% 15.8% 16.1% 16.5% (70) (70)
PAT 9,616 11,503 10,200 12,163 -6% -5% Decline in EBITDA margin to flow down to PAT
GSK Consumer Total revenues 43,051 49,552 42,299 48,533 2% 2%
Revise revenue estimates upwards given strong growth momentum in a poor macro environment
EBITDA 6,800 7,975 6,670 7,811 2% 2%
Revenue increase to flow down to EBITDA EBITDA Margin (%) 15.8% 16.1% 15.8% 16.1% 3 0 PAT 6,255 7,398 6,169 7,288 1% 2% No changes to PAT estimates Colgate
Total revenues 40,798 46,587 41,149 46,973 -1% -1% Downward revision to our other operating income estimates, leading to 1% reduction in revenue growth estimates
EBITDA 8,112 9,543 8,018 9,481 1% 1% Revise our estimates of employee costs downwards, leading to an increase in EBITDA margin forecasts EBITDA Margin (%) 19.9% 20.5% 19.5% 20.2% 40 30
PAT 5,821 6,826 5,781 6,781 1% 1% Change in EBITDA to flow down to PAT
Marico Total revenues 52,998 60,289 52,998 60,289 0% 0% No changes to revenue estimates
EBITDA 8,383 9,717 8,383 9,717 0% 0% No changes to EBITDA estimates
EBITDA Margin (%) 15.8% 16.1% 15.8% 16.1% 0 0
PAT 5,725 6,818 5,751 6,853 0% -1% Only minor changes to minority interest given improving Bangladesh operations
Source: Ambit Capital research
Consumer staples
March 10, 2014 Ambit Capital Pvt. Ltd. Page 9
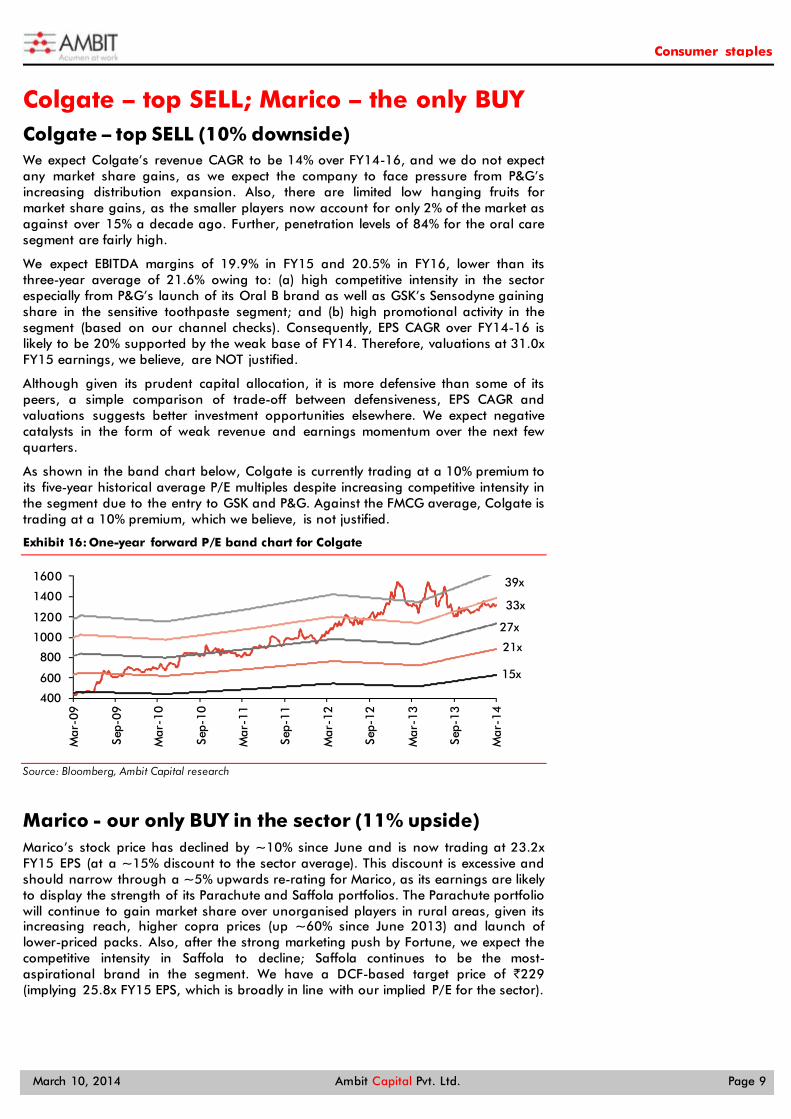
Colgate – top SELL; Marico – the only BUY Colgate – top SELL (10% downside) We expect Colgate’s revenue CAGR to be 14% over FY14-16, and we do not expect any market share gains, as we expect the company to face pressure from P&G’s increasing distribution expansion. Also, there are limited low hanging fruits for market share gains, as the smaller players now account for only 2% of the market as against over 15% a decade ago. Further, penetration levels of 84% for the oral care segment are fairly high.
We expect EBITDA margins of 19.9% in FY15 and 20.5% in FY16, lower than its three-year average of 21.6% owing to: (a) high competitive intensity in the sector especially from P&G’s launch of its Oral B brand as well as GSK’s Sensodyne gaining share in the sensitive toothpaste segment; and (b) high promotional activity in the segment (based on our channel checks). Consequently, EPS CAGR over FY14-16 is likely to be 20% supported by the weak base of FY14. Therefore, valuations at 31.0x FY15 earnings, we believe, are NOT justified.
Although given its prudent capital allocation, it is more defensive than some of its peers, a simple comparison of trade-off between defensiveness, EPS CAGR and valuations suggests better investment opportunities elsewhere. We expect negative catalysts in the form of weak revenue and earnings momentum over the next few quarters.
As shown in the band chart below, Colgate is currently trading at a 10% premium to its five-year historical average P/E multiples despite increasing competitive intensity in the segment due to the entry to GSK and P&G. Against the FMCG average, Colgate is trading at a 10% premium, which we believe, is not justified.
Exhibit 16: One-year forward P/E band chart for Colgate
Source: Bloomberg, Ambit Capital research
Marico - our only BUY in the sector (11% upside) Marico’s stock price has declined by ~10% since June and is now trading at 23.2x FY15 EPS (at a ~15% discount to the sector average). This discount is excessive and should narrow through a ~5% upwards re-rating for Marico, as its earnings are likely to display the strength of its Parachute and Saffola portfolios. The Parachute portfolio will continue to gain market share over unorganised players in rural areas, given its increasing reach, higher copra prices (up ~60% since June 2013) and launch of lower-priced packs. Also, after the strong marketing push by Fortune, we expect the competitive intensity in Saffola to decline; Saffola continues to be the most-aspirational brand in the segment. We have a DCF-based target price of `229 (implying 25.8x FY15 EPS, which is broadly in line with our implied P/E for the sector).
400
600
800
1000
1200
1400
1600
Mar
-09
Sep-
09
Mar
-10
Sep-
10
Mar
-11
Sep-
11
Mar
-12
Sep-
12
Mar
-13
Sep-
13
Mar
-14
15x
39x
33x
27x
21x
Consumer staples
March 10, 2014 Ambit Capital Pvt. Ltd. Page 10
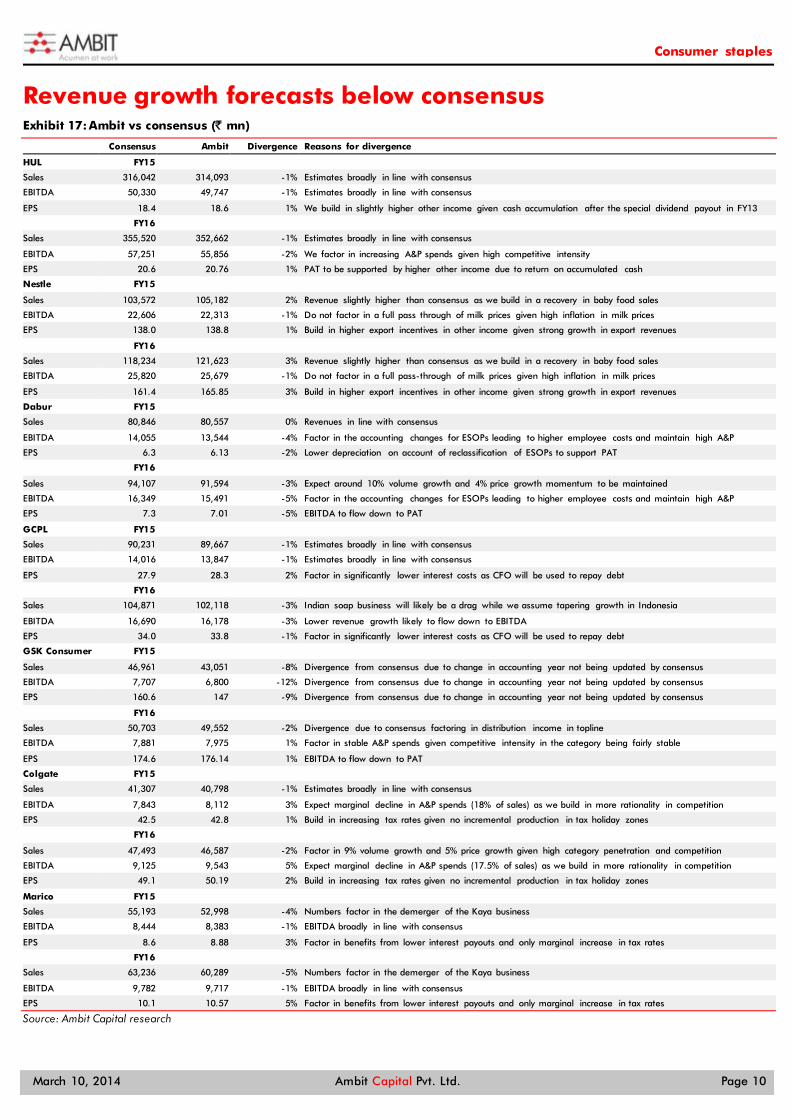
Revenue growth forecasts below consensus Exhibit 17: Ambit vs consensus (` mn)
Consensus Ambit Divergence Reasons for divergence
HUL FY15 Sales 316,042 314,093 -1% Estimates broadly in line with consensus
EBITDA 50,330 49,747 -1% Estimates broadly in line with consensus
EPS 18.4 18.6 1% We build in slightly higher other income given cash accumulation after the special dividend payout in FY13
FY16
Sales 355,520 352,662 -1% Estimates broadly in line with consensus
EBITDA 57,251 55,856 -2% We factor in increasing A&P spends given high competitive intensity
EPS 20.6 20.76 1% PAT to be supported by higher other income due to return on accumulated cash
Nestle FY15
Sales 103,572 105,182 2% Revenue slightly higher than consensus as we build in a recovery in baby food sales
EBITDA 22,606 22,313 -1% Do not factor in a full pass through of milk prices given high inflation in milk prices
EPS 138.0 138.8 1% Build in higher export incentives in other income given strong growth in export revenues
FY16 Sales 118,234 121,623 3% Revenue slightly higher than consensus as we build in a recovery in baby food sales
EBITDA 25,820 25,679 -1% Do not factor in a full pass-through of milk prices given high inflation in milk prices
EPS 161.4 165.85 3% Build in higher export incentives in other income given strong growth in export revenues
Dabur FY15
Sales 80,846 80,557 0% Revenues in line with consensus
EBITDA 14,055 13,544 -4% Factor in the accounting changes for ESOPs leading to higher employee costs and maintain high A&P
EPS 6.3 6.13 -2% Lower depreciation on account of reclassification of ESOPs to support PAT
FY16
Sales 94,107 91,594 -3% Expect around 10% volume growth and 4% price growth momentum to be maintained
EBITDA 16,349 15,491 -5% Factor in the accounting changes for ESOPs leading to higher employee costs and maintain high A&P
EPS 7.3 7.01 -5% EBITDA to flow down to PAT
GCPL FY15 Sales 90,231 89,667 -1% Estimates broadly in line with consensus
EBITDA 14,016 13,847 -1% Estimates broadly in line with consensus
EPS 27.9 28.3 2% Factor in significantly lower interest costs as CFO will be used to repay debt
FY16
Sales 104,871 102,118 -3% Indian soap business will likely be a drag while we assume tapering growth in Indonesia
EBITDA 16,690 16,178 -3% Lower revenue growth likely to flow down to EBITDA
EPS 34.0 33.8 -1% Factor in significantly lower interest costs as CFO will be used to repay debt
GSK Consumer FY15
Sales 46,961 43,051 -8% Divergence from consensus due to change in accounting year not being updated by consensus
EBITDA 7,707 6,800 -12% Divergence from consensus due to change in accounting year not being updated by consensus
EPS 160.6 147 -9% Divergence from consensus due to change in accounting year not being updated by consensus
FY16 Sales 50,703 49,552 -2% Divergence due to consensus factoring in distribution income in topline
EBITDA 7,881 7,975 1% Factor in stable A&P spends given competitive intensity in the category being fairly stable
EPS 174.6 176.14 1% EBITDA to flow down to PAT
Colgate FY15
Sales 41,307 40,798 -1% Estimates broadly in line with consensus
EBITDA 7,843 8,112 3% Expect marginal decline in A&P spends (18% of sales) as we build in more rationality in competition
EPS 42.5 42.8 1% Build in increasing tax rates given no incremental production in tax holiday zones
FY16
Sales 47,493 46,587 -2% Factor in 9% volume growth and 5% price growth given high category penetration and competition
EBITDA 9,125 9,543 5% Expect marginal decline in A&P spends (17.5% of sales) as we build in more rationality in competition
EPS 49.1 50.19 2% Build in increasing tax rates given no incremental production in tax holiday zones
Marico FY15 Sales 55,193 52,998 -4% Numbers factor in the demerger of the Kaya business
EBITDA 8,444 8,383 -1% EBITDA broadly in line with consensus
EPS 8.6 8.88 3% Factor in benefits from lower interest payouts and only marginal increase in tax rates
FY16
Sales 63,236 60,289 -5% Numbers factor in the demerger of the Kaya business
EBITDA 9,782 9,717 -1% EBITDA broadly in line with consensus
EPS 10.1 10.57 5% Factor in benefits from lower interest payouts and only marginal increase in tax rates
Source: Ambit Capital research

Consumer staples
March 10, 2014 Ambit Capital Pvt. Ltd. Page 11
HUL Balance Sheet (` mn)
Year to March FY12 FY13 FY14E FY15E FY16E
Shareholders' equity 2,162 2,163 2,163 2,163 2,163
Reserves & surpluses 32,968 24,578 35,984 47,409 58,337
Total net worth 35,129 26,740 38,147 49,571 60,500
Minority Interest - - - - -
Debt - - - - -
Deferred tax liability (2,142) (2,048) (2,048) (2,048) (2,048)
Total liabilities 32,987 24,692 36,099 47,524 58,452
Gross block 38,117 41,342 43,842 46,342 48,842
Net block 21,475 22,929 22,832 22,760 22,665
CWIP 2,155 2,156 2,156 2,156 2,156
Investments 24,382 23,307 38,307 46,307 56,307
Cash & equivalents 18,300 17,079 17,358 26,211 33,363
Debtors 6,790 8,335 9,218 10,326 11,594
Inventory 25,167 25,270 28,423 31,840 35,749
Loans & advances 8,820 10,326 11,523 12,908 14,493
Other current assets 353 3,676 3,073 3,442 3,865
Total current assets 59,429 64,685 69,594 84,727 99,064
Current liabilities 54,994 62,601 69,136 77,448 86,958
Provisions 19,459 25,784 27,654 30,979 34,783
Total current liabilities 74,453 88,385 96,790 108,427 121,741
Net current assets (15,024) (23,700) (27,196) (23,699) (22,677)
Total assets 32,987 24,692 36,099 47,524 58,452
Source: Company, Ambit Capital research
Income statement (` mn)
Year to March FY12 FY13 FY14E FY15E FY16E
Operating income 221,164 258,102 280,385 314,093 352,662
% growth 12.1% 16.7% 8.6% 12.0% 12.3%
Operating expenditure 188,250 218,065 235,752 264,346 296,807
EBITDA 32,913 40,038 44,633 49,747 55,856
% growth 22.9% 21.6% 11.5% 11.5% 12.3%
Depreciation 2,183 2,360 2,597 2,572 2,594
EBIT 30,731 37,677 42,036 47,175 53,261
Interest expenditure 12 251 400 225 200
Non-operating income 2,783 6,069 6,083 6,811 8,645
Adjusted PBT 33,502 43,495 47,719 53,761 61,707
Tax 7,853 11,770 11,023 14,515 17,895
Adjusted PAT/ Net profit 25,649 31,725 36,696 39,245 43,812
% growth 22.0% 23.7% 15.7% 6.9% 11.6%
Extraordinaries 77 158 - - -
Reported PAT / Net profit 25,572 31,567 36,696 39,245 43,812
Minority Interest - - - - -
Share of associates 993 323 896 986 1,084
Adjusted Consolidated net profit 26,565 31,890 37,592 40,231 44,896
Reported Consolidated net profit 26,565 31,890 37,592 40,231 44,896
Source: Company, Ambit Capital research

Consumer staples
March 10, 2014 Ambit Capital Pvt. Ltd. Page 12
Cash Flow statement (` mn)
Year to March FY12 FY13 FY14E FY15E FY16E
EBIT 33,514 43,746 48,119 53,986 61,907
Depreciation 2,183 2,360 2,597 2,572 2,594
Others (58) (157) (400) (225) (200)
Tax (7,853) (11,770) (11,023) (14,515) (17,895)
(Incr) / decr in net working capital 4,353 7,454 3,776 5,356 6,129
Cash flow from operations 32,139 41,633 43,068 47,174 52,535
Capex (1,233) (3,816) (2,500) (2,500) (2,500)
(Incr) / decr in investments (11,775) 1,076 (15,000) (8,000) (10,000)
Others - - - - -
Cash flow from investments (13,009) (2,741) (17,500) (10,500) (12,500)
Net borrowings - - - - -
Issuance of equity - - - - -
Interest paid (12) (251) (400) (225) (200)
Dividend paid (17,546) (46,557) (27,847) (30,379) (35,442)
Others 444 6,694 2,958 2,783 2,758
Cash flow from financing (17,115) (40,114) (25,289) (27,821) (32,884)
Net change in cash 2,016 (1,222) 279 8,853 7,152
Closing cash balance 18,300 17,079 17,358 26,211 33,363
Free cash flow 30,906 37,817 40,568 44,674 50,035
Source: Company, Ambit Capital research,
Ratio Analysis
Year to March FY12 FY13 FY14E FY15E FY16E
Gross margin (%) 46.9% 47.7% 48.7% 49.0% 49.3%
EBITDA margin (%) 14.9% 15.5% 15.9% 15.8% 15.8%
EBIT margin (%) 15.2% 16.9% 17.2% 17.2% 17.6%
Net profit margin (%) 12.0% 12.4% 13.4% 12.8% 12.7%
Dividend payout ratio (%) 68.4% 146.8% 75.9% 77.4% 80.9%
Net debt: equity (x) (1.2) (1.4) (1.4) (1.4) (1.5)
Working capital turnover (x) (6.6) (6.3) (6.3) (6.3) (6.3)
Gross block turnover (x) 5.8 6.2 6.4 6.8 7.2
RoCE (%) 83.1% 103.1% 114.1% 89.9% 79.9%
RoE (%) 83.1% 102.6% 113.1% 89.5% 79.6%
Source: Company, Ambit Capital research
Valuation Parameters
Year to March FY12 FY13 FY14E FY15E FY16E
EPS (`) 12.3 14.8 17.4 18.6 20.8
Diluted EPS (`) 12.3 14.8 17.4 18.6 20.8
Book value per share (`) 16.2 12.4 17.6 22.9 28.0
Dividend per share (`) 7.0 18.5 11.0 12.0 14.0
P/E (x) 44.5 37.0 31.6 29.8 26.7
P/BV (x) 33.8 44.4 31.1 23.9 19.6
EV/EBITDA (x) 35.5 29.2 26.2 23.3 20.7
Price/Sales (x) 5.4 4.6 4.2 3.8 3.4
Source: Company, Ambit Capital research

Consumer staples
March 10, 2014 Ambit Capital Pvt. Ltd. Page 13
Nestle Balance Sheet (` mn)
Year to March CY11 CY12 CY13E CY14E CY15E Shareholders' equity 964 964 964 964 964
Reserves & surpluses 11,775 17,020 19,649 21,829 23,743
Total net worth 12,739 17,984 20,613 22,793 24,707
Minority Interest - - - - -
Debt 9,709 10,502 8,000 2,000 -
Deferred tax liability 435 1,621 1,621 1,621 1,621
Total liabilities 22,883 30,107 30,234 26,414 26,328
Gross block 25,522 44,276 50,276 52,476 54,676
Net block 15,758 32,043 34,743 33,554 32,470
CWIP 14,186 3,441 1,000 1,000 1,000
Goodwill - - - - -
Investments 1,344 3,649 3,649 3,649 3,649
Cash & equivalents 2,272 2,369 3,060 2,331 5,537
Debtors 1,154 876 997 1,153 1,333
Inventory 7,340 7,456 8,478 9,798 11,329
Loans & advances 1,961 1,796 1,995 2,305 2,666
Other current assets 3 10 - - -
Total current assets 12,730 12,507 14,530 15,587 20,865
Current liabilities 10,096 10,974 11,969 13,832 15,994
Provisions 11,038 10,558 11,719 13,544 15,661
Total current liabilities 21,135 21,532 23,688 27,376 31,655
Net current assets (8,404) (9,025) (9,158) (11,789) (10,790)
Total assets 22,883 30,107 30,234 26,414 26,328
Source: Company, Ambit Capital research
Income statement (` mn)
Year to March CY11 CY12 CY13E CY14E CY15E
Operating income 74,908 83,023 91,012 105,182 121,623
% growth 19.8% 10.8% 9.6% 15.6% 15.6%
Operating expenditure 59,953 65,092 71,928 82,869 95,944
EBITDA 14,955 17,931 19,084 22,313 25,679
% growth 21.5% 19.9% 6.4% 16.9% 15.1%
Depreciation 1,533 2,772 3,300 3,389 3,285
EBIT 13,421 15,159 15,785 18,924 22,395
Interest expenditure 51 266 365 150 30
Non-operating income 509 633 1,222 1,205 1,399
Adjusted PBT 13,879 15,526 16,642 19,979 23,763
Tax 4,264 4,847 5,609 6,593 7,842
Adjusted PAT/ Net profit 9,615 10,679 11,033 13,386 15,921
% growth 17.5% 11.1% 3.3% 21.3% 18.9%
Extraordinaries - - - - -
Reported PAT / Net profit 9,615 10,679 11,033 13,386 15,921
Minority Interest - - - - -
Share of associates - - - - -
Adjusted Consolidated net profit 9,615 10,679 11,033 13,386 15,921
Reported Consolidated net profit 9,615 10,679 11,033 13,386 15,921
Source: Company, Ambit Capital research
Consumer staples
March 10, 2014 Ambit Capital Pvt. Ltd. Page 14
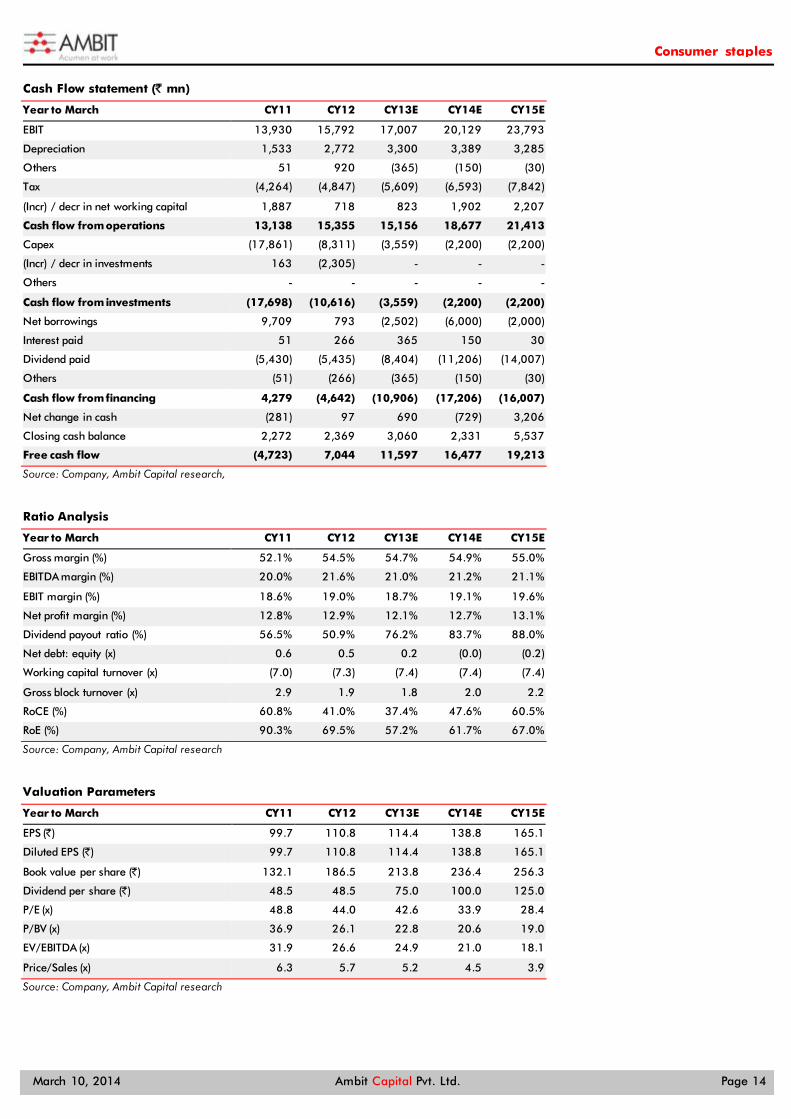
Cash Flow statement (` mn)
Year to March CY11 CY12 CY13E CY14E CY15E
EBIT 13,930 15,792 17,007 20,129 23,793
Depreciation 1,533 2,772 3,300 3,389 3,285
Others 51 920 (365) (150) (30)
Tax (4,264) (4,847) (5,609) (6,593) (7,842)
(Incr) / decr in net working capital 1,887 718 823 1,902 2,207
Cash flow from operations 13,138 15,355 15,156 18,677 21,413
Capex (17,861) (8,311) (3,559) (2,200) (2,200)
(Incr) / decr in investments 163 (2,305) - - -
Others - - - - -
Cash flow from investments (17,698) (10,616) (3,559) (2,200) (2,200)
Net borrowings 9,709 793 (2,502) (6,000) (2,000)
Interest paid 51 266 365 150 30
Dividend paid (5,430) (5,435) (8,404) (11,206) (14,007)
Others (51) (266) (365) (150) (30)
Cash flow from financing 4,279 (4,642) (10,906) (17,206) (16,007)
Net change in cash (281) 97 690 (729) 3,206
Closing cash balance 2,272 2,369 3,060 2,331 5,537
Free cash flow (4,723) 7,044 11,597 16,477 19,213
Source: Company, Ambit Capital research,
Ratio Analysis
Year to March CY11 CY12 CY13E CY14E CY15E
Gross margin (%) 52.1% 54.5% 54.7% 54.9% 55.0%
EBITDA margin (%) 20.0% 21.6% 21.0% 21.2% 21.1%
EBIT margin (%) 18.6% 19.0% 18.7% 19.1% 19.6%
Net profit margin (%) 12.8% 12.9% 12.1% 12.7% 13.1%
Dividend payout ratio (%) 56.5% 50.9% 76.2% 83.7% 88.0%
Net debt: equity (x) 0.6 0.5 0.2 (0.0) (0.2)
Working capital turnover (x) (7.0) (7.3) (7.4) (7.4) (7.4)
Gross block turnover (x) 2.9 1.9 1.8 2.0 2.2
RoCE (%) 60.8% 41.0% 37.4% 47.6% 60.5%
RoE (%) 90.3% 69.5% 57.2% 61.7% 67.0%
Source: Company, Ambit Capital research
Valuation Parameters
Year to March CY11 CY12 CY13E CY14E CY15E
EPS (`) 99.7 110.8 114.4 138.8 165.1
Diluted EPS (`) 99.7 110.8 114.4 138.8 165.1
Book value per share (`) 132.1 186.5 213.8 236.4 256.3
Dividend per share (`) 48.5 48.5 75.0 100.0 125.0
P/E (x) 48.8 44.0 42.6 33.9 28.4
P/BV (x) 36.9 26.1 22.8 20.6 19.0
EV/EBITDA (x) 31.9 26.6 24.9 21.0 18.1
Price/Sales (x) 6.3 5.7 5.2 4.5 3.9
Source: Company, Ambit Capital research
Consumer staples
March 10, 2014 Ambit Capital Pvt. Ltd. Page 15
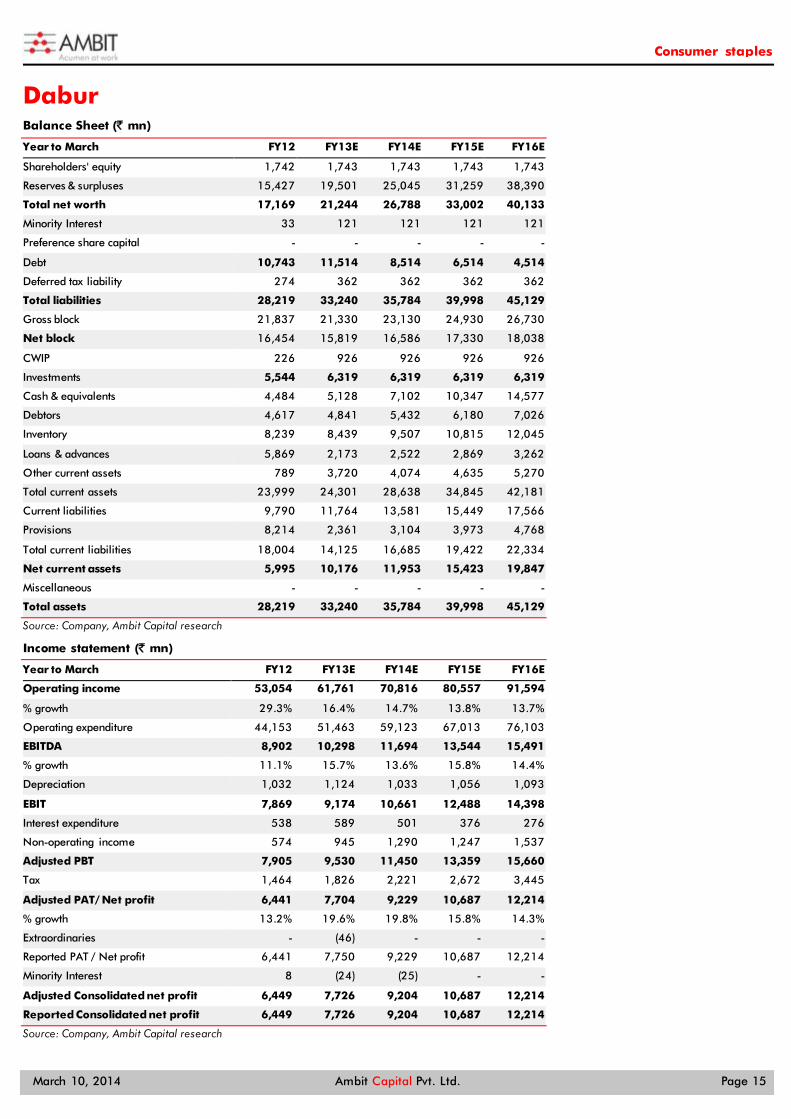
Dabur Balance Sheet (` mn)
Year to March FY12 FY13E FY14E FY15E FY16E
Shareholders' equity 1,742 1,743 1,743 1,743 1,743
Reserves & surpluses 15,427 19,501 25,045 31,259 38,390
Total net worth 17,169 21,244 26,788 33,002 40,133
Minority Interest 33 121 121 121 121
Preference share capital - - - - -
Debt 10,743 11,514 8,514 6,514 4,514
Deferred tax liability 274 362 362 362 362
Total liabilities 28,219 33,240 35,784 39,998 45,129
Gross block 21,837 21,330 23,130 24,930 26,730
Net block 16,454 15,819 16,586 17,330 18,038
CWIP 226 926 926 926 926
Investments 5,544 6,319 6,319 6,319 6,319
Cash & equivalents 4,484 5,128 7,102 10,347 14,577
Debtors 4,617 4,841 5,432 6,180 7,026
Inventory 8,239 8,439 9,507 10,815 12,045
Loans & advances 5,869 2,173 2,522 2,869 3,262
Other current assets 789 3,720 4,074 4,635 5,270
Total current assets 23,999 24,301 28,638 34,845 42,181
Current liabilities 9,790 11,764 13,581 15,449 17,566
Provisions 8,214 2,361 3,104 3,973 4,768
Total current liabilities 18,004 14,125 16,685 19,422 22,334
Net current assets 5,995 10,176 11,953 15,423 19,847
Miscellaneous - - - - -
Total assets 28,219 33,240 35,784 39,998 45,129
Source: Company, Ambit Capital research
Income statement (` mn)
Year to March FY12 FY13E FY14E FY15E FY16E
Operating income 53,054 61,761 70,816 80,557 91,594
% growth 29.3% 16.4% 14.7% 13.8% 13.7%
Operating expenditure 44,153 51,463 59,123 67,013 76,103
EBITDA 8,902 10,298 11,694 13,544 15,491
% growth 11.1% 15.7% 13.6% 15.8% 14.4%
Depreciation 1,032 1,124 1,033 1,056 1,093
EBIT 7,869 9,174 10,661 12,488 14,398
Interest expenditure 538 589 501 376 276
Non-operating income 574 945 1,290 1,247 1,537
Adjusted PBT 7,905 9,530 11,450 13,359 15,660
Tax 1,464 1,826 2,221 2,672 3,445
Adjusted PAT/ Net profit 6,441 7,704 9,229 10,687 12,214
% growth 13.2% 19.6% 19.8% 15.8% 14.3%
Extraordinaries - (46) - - -
Reported PAT / Net profit 6,441 7,750 9,229 10,687 12,214
Minority Interest 8 (24) (25) - -
Adjusted Consolidated net profit 6,449 7,726 9,204 10,687 12,214
Reported Consolidated net profit 6,449 7,726 9,204 10,687 12,214
Source: Company, Ambit Capital research
Consumer staples
March 10, 2014 Ambit Capital Pvt. Ltd. Page 16
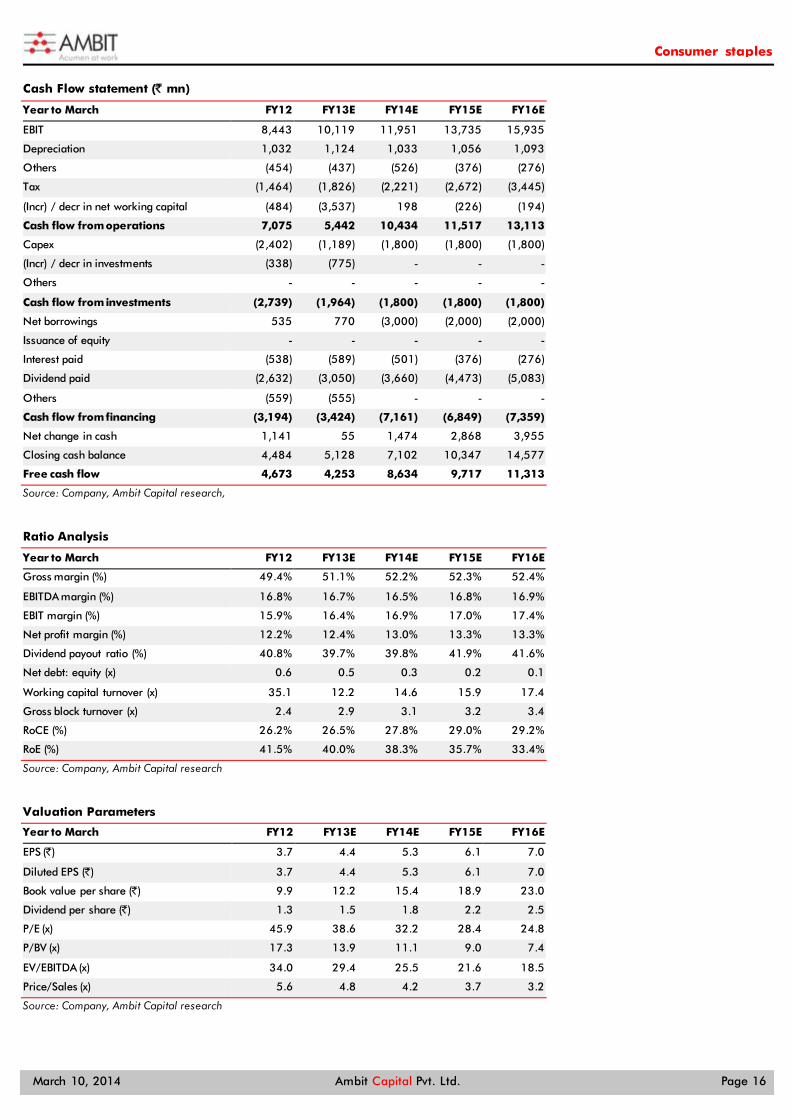
Cash Flow statement (` mn)
Year to March FY12 FY13E FY14E FY15E FY16E
EBIT 8,443 10,119 11,951 13,735 15,935
Depreciation 1,032 1,124 1,033 1,056 1,093
Others (454) (437) (526) (376) (276)
Tax (1,464) (1,826) (2,221) (2,672) (3,445)
(Incr) / decr in net working capital (484) (3,537) 198 (226) (194)
Cash flow from operations 7,075 5,442 10,434 11,517 13,113
Capex (2,402) (1,189) (1,800) (1,800) (1,800)
(Incr) / decr in investments (338) (775) - - -
Others - - - - -
Cash flow from investments (2,739) (1,964) (1,800) (1,800) (1,800)
Net borrowings 535 770 (3,000) (2,000) (2,000)
Issuance of equity - - - - -
Interest paid (538) (589) (501) (376) (276)
Dividend paid (2,632) (3,050) (3,660) (4,473) (5,083)
Others (559) (555) - - -
Cash flow from financing (3,194) (3,424) (7,161) (6,849) (7,359)
Net change in cash 1,141 55 1,474 2,868 3,955
Closing cash balance 4,484 5,128 7,102 10,347 14,577
Free cash flow 4,673 4,253 8,634 9,717 11,313
Source: Company, Ambit Capital research,
Ratio Analysis
Year to March FY12 FY13E FY14E FY15E FY16E
Gross margin (%) 49.4% 51.1% 52.2% 52.3% 52.4%
EBITDA margin (%) 16.8% 16.7% 16.5% 16.8% 16.9%
EBIT margin (%) 15.9% 16.4% 16.9% 17.0% 17.4%
Net profit margin (%) 12.2% 12.4% 13.0% 13.3% 13.3%
Dividend payout ratio (%) 40.8% 39.7% 39.8% 41.9% 41.6%
Net debt: equity (x) 0.6 0.5 0.3 0.2 0.1
Working capital turnover (x) 35.1 12.2 14.6 15.9 17.4
Gross block turnover (x) 2.4 2.9 3.1 3.2 3.4
RoCE (%) 26.2% 26.5% 27.8% 29.0% 29.2%
RoE (%) 41.5% 40.0% 38.3% 35.7% 33.4%
Source: Company, Ambit Capital research
Valuation Parameters
Year to March FY12 FY13E FY14E FY15E FY16E
EPS (`) 3.7 4.4 5.3 6.1 7.0
Diluted EPS (`) 3.7 4.4 5.3 6.1 7.0
Book value per share (`) 9.9 12.2 15.4 18.9 23.0
Dividend per share (`) 1.3 1.5 1.8 2.2 2.5
P/E (x) 45.9 38.6 32.2 28.4 24.8
P/BV (x) 17.3 13.9 11.1 9.0 7.4
EV/EBITDA (x) 34.0 29.4 25.5 21.6 18.5
Price/Sales (x) 5.6 4.8 4.2 3.7 3.2
Source: Company, Ambit Capital research
Consumer staples
March 10, 2014 Ambit Capital Pvt. Ltd. Page 17
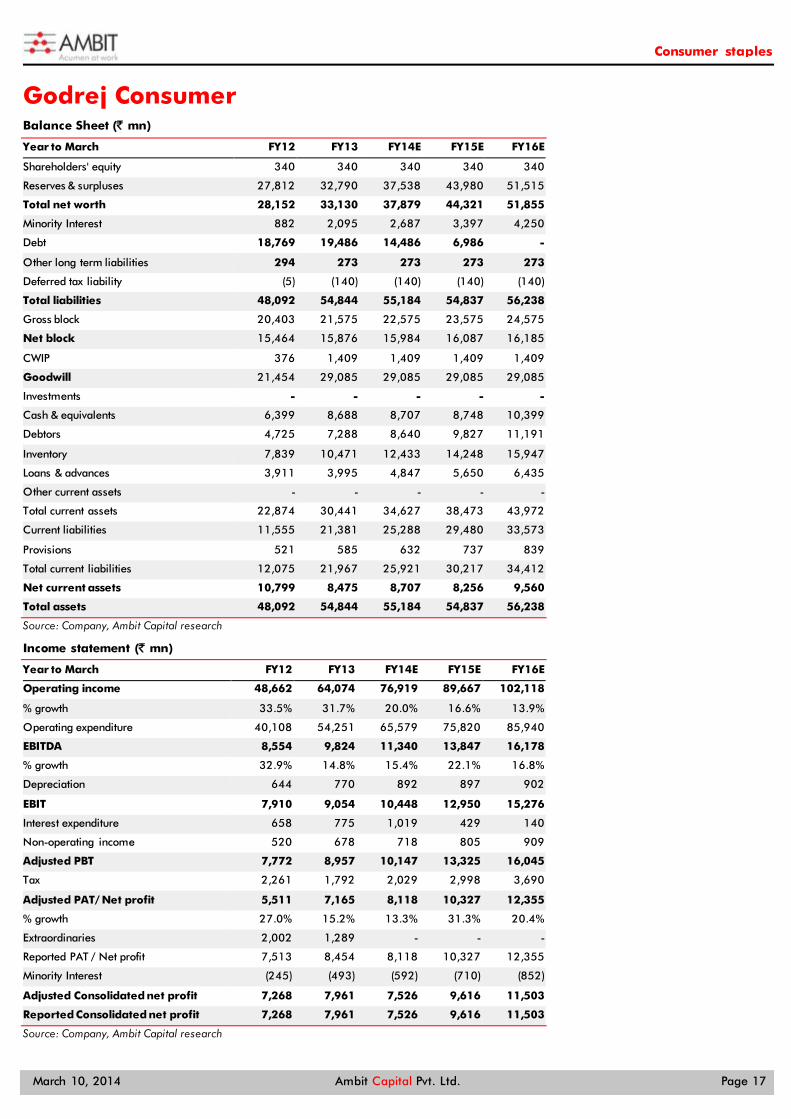
Godrej Consumer Balance Sheet (` mn)
Year to March FY12 FY13 FY14E FY15E FY16E
Shareholders' equity 340 340 340 340 340
Reserves & surpluses 27,812 32,790 37,538 43,980 51,515
Total net worth 28,152 33,130 37,879 44,321 51,855
Minority Interest 882 2,095 2,687 3,397 4,250
Debt 18,769 19,486 14,486 6,986 -
Other long term liabilities 294 273 273 273 273
Deferred tax liability (5) (140) (140) (140) (140)
Total liabilities 48,092 54,844 55,184 54,837 56,238
Gross block 20,403 21,575 22,575 23,575 24,575
Net block 15,464 15,876 15,984 16,087 16,185
CWIP 376 1,409 1,409 1,409 1,409
Goodwill 21,454 29,085 29,085 29,085 29,085
Investments - - - - -
Cash & equivalents 6,399 8,688 8,707 8,748 10,399
Debtors 4,725 7,288 8,640 9,827 11,191
Inventory 7,839 10,471 12,433 14,248 15,947
Loans & advances 3,911 3,995 4,847 5,650 6,435
Other current assets - - - - -
Total current assets 22,874 30,441 34,627 38,473 43,972
Current liabilities 11,555 21,381 25,288 29,480 33,573
Provisions 521 585 632 737 839
Total current liabilities 12,075 21,967 25,921 30,217 34,412
Net current assets 10,799 8,475 8,707 8,256 9,560
Total assets 48,092 54,844 55,184 54,837 56,238
Source: Company, Ambit Capital research
Income statement (` mn)
Year to March FY12 FY13 FY14E FY15E FY16E
Operating income 48,662 64,074 76,919 89,667 102,118
% growth 33.5% 31.7% 20.0% 16.6% 13.9%
Operating expenditure 40,108 54,251 65,579 75,820 85,940
EBITDA 8,554 9,824 11,340 13,847 16,178
% growth 32.9% 14.8% 15.4% 22.1% 16.8%
Depreciation 644 770 892 897 902
EBIT 7,910 9,054 10,448 12,950 15,276
Interest expenditure 658 775 1,019 429 140
Non-operating income 520 678 718 805 909
Adjusted PBT 7,772 8,957 10,147 13,325 16,045
Tax 2,261 1,792 2,029 2,998 3,690
Adjusted PAT/ Net profit 5,511 7,165 8,118 10,327 12,355
% growth 27.0% 15.2% 13.3% 31.3% 20.4%
Extraordinaries 2,002 1,289 - - -
Reported PAT / Net profit 7,513 8,454 8,118 10,327 12,355
Minority Interest (245) (493) (592) (710) (852)
Adjusted Consolidated net profit 7,268 7,961 7,526 9,616 11,503
Reported Consolidated net profit 7,268 7,961 7,526 9,616 11,503
Source: Company, Ambit Capital research

Consumer staples
March 10, 2014 Ambit Capital Pvt. Ltd. Page 18
Cash Flow statement (` mn)
Year to March FY12 FY13 FY14E FY15E FY16E
EBIT 8,430 9,732 11,166 13,754 16,185
Depreciation 644 770 892 897 902
Others 499 282 (427) 281 713
Tax (2,261) (1,792) (2,029) (2,998) (3,690)
(Incr) / decr in net working capital (280) 4,613 (213) 491 348
Cash flow from operations 7,033 13,604 9,389 12,425 14,457
Capex (7,007) (9,845) (1,000) (1,000) (1,000)
(Incr) / decr in investments - - - - -
Others - - - - -
Cash flow from investments (7,007) (9,845) (1,000) (1,000) (1,000)
Net borrowings (1,285) 717 (5,000) (7,500) (6,986)
Interest paid (658) (775) (1,019) (429) (140)
Dividend paid (1,948) (1,984) (2,778) (3,174) (3,968)
Others 7,995 572 427 (281) (713)
Cash flow from financing 4,104 (1,470) (8,369) (11,385) (11,806)
Net change in cash 4,130 2,289 19 41 1,651
Closing cash balance 6,399 8,688 8,707 8,748 10,399
Free cash flow 26 3,759 8,389 11,425 13,457
Source: Company, Ambit Capital research,
Ratio Analysis
Year to March FY12 FY13 FY14E FY15E FY16E
Gross margin (%) 52.4% 53.9% 53.6% 53.8% 54.0%
EBITDA margin (%) 17.6% 15.3% 14.7% 15.4% 15.8%
EBIT margin (%) 17.3% 15.2% 14.5% 15.3% 15.8%
Net profit margin (%) 11.3% 11.2% 10.6% 11.5% 12.1%
Dividend payout ratio (%) 35.3% 27.7% 34.2% 30.7% 32.1%
Net debt: equity (x) 0.4 0.3 0.2 (0.0) (0.2)
Working capital turnover (x) 11.1 (301.0) NA (182.5) (121.7)
Gross block turnover (x) 2.4 3.0 3.4 3.8 4.2
RoCE (%) 14.0% 15.1% 16.2% 19.4% 22.4%
RoE (%) 24.3% 23.4% 22.9% 25.1% 25.7%
Source: Company, Ambit Capital research
Valuation Parameters
Year to March FY12 FY13 FY14E FY15E FY16E
EPS (`) 15.5 19.6 22.1 28.3 33.8
Diluted EPS (`) 15.5 19.6 22.1 28.3 33.8
Book value per share (`) 82.7 97.4 111.3 130.2 152.4
Dividend per share (`) 4.8 5.0 7.0 8.0 10.0
P/E (x) 49.6 39.2 34.7 27.7 23.2
P/BV (x) 9.3 7.9 6.9 5.9 5.0
EV/EBITDA (x) 32.0 27.7 23.6 18.7 15.5
Price/Sales (x) 5.4 4.1 3.4 2.9 2.6
Source: Company, Ambit Capital research
Consumer staples
March 10, 2014 Ambit Capital Pvt. Ltd. Page 19
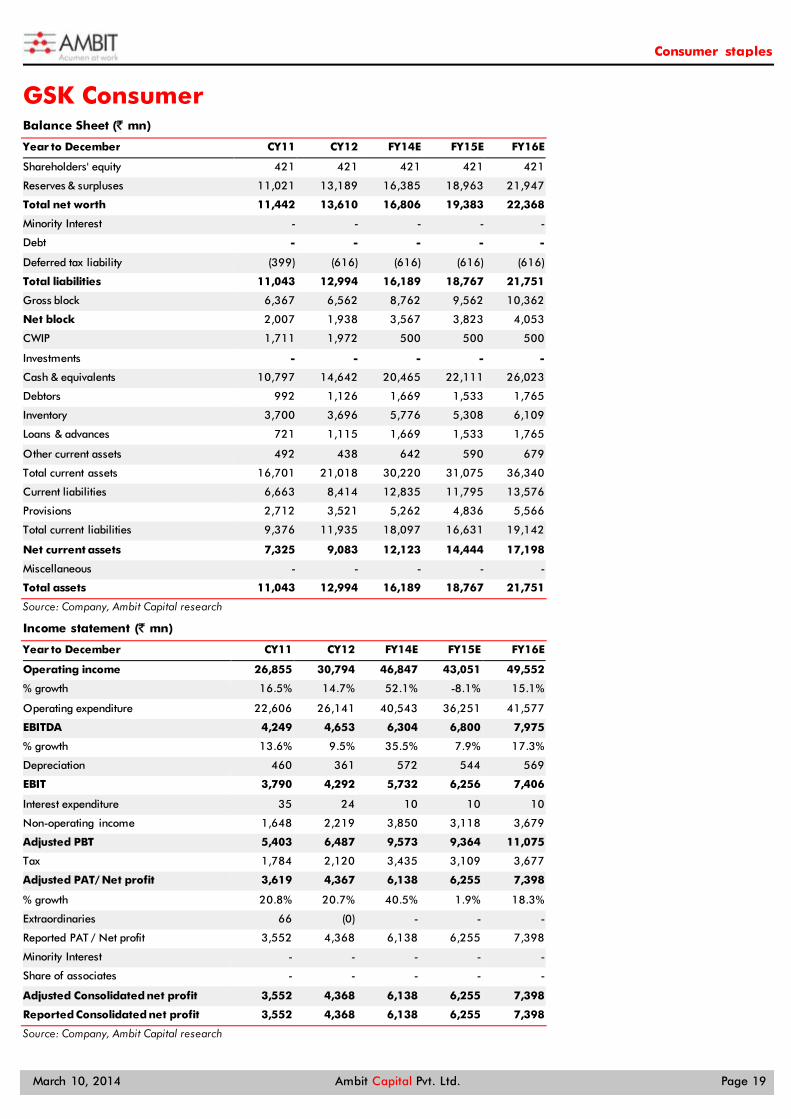
GSK Consumer Balance Sheet (` mn)
Year to December CY11 CY12 FY14E FY15E FY16E
Shareholders' equity 421 421 421 421 421
Reserves & surpluses 11,021 13,189 16,385 18,963 21,947
Total net worth 11,442 13,610 16,806 19,383 22,368
Minority Interest - - - - -
Debt - - - - -
Deferred tax liability (399) (616) (616) (616) (616)
Total liabilities 11,043 12,994 16,189 18,767 21,751
Gross block 6,367 6,562 8,762 9,562 10,362
Net block 2,007 1,938 3,567 3,823 4,053
CWIP 1,711 1,972 500 500 500
Investments - - - - -
Cash & equivalents 10,797 14,642 20,465 22,111 26,023
Debtors 992 1,126 1,669 1,533 1,765
Inventory 3,700 3,696 5,776 5,308 6,109
Loans & advances 721 1,115 1,669 1,533 1,765
Other current assets 492 438 642 590 679
Total current assets 16,701 21,018 30,220 31,075 36,340
Current liabilities 6,663 8,414 12,835 11,795 13,576
Provisions 2,712 3,521 5,262 4,836 5,566
Total current liabilities 9,376 11,935 18,097 16,631 19,142
Net current assets 7,325 9,083 12,123 14,444 17,198
Miscellaneous - - - - -
Total assets 11,043 12,994 16,189 18,767 21,751
Source: Company, Ambit Capital research
Income statement (` mn)
Year to December CY11 CY12 FY14E FY15E FY16E
Operating income 26,855 30,794 46,847 43,051 49,552
% growth 16.5% 14.7% 52.1% -8.1% 15.1%
Operating expenditure 22,606 26,141 40,543 36,251 41,577
EBITDA 4,249 4,653 6,304 6,800 7,975
% growth 13.6% 9.5% 35.5% 7.9% 17.3%
Depreciation 460 361 572 544 569
EBIT 3,790 4,292 5,732 6,256 7,406
Interest expenditure 35 24 10 10 10
Non-operating income 1,648 2,219 3,850 3,118 3,679
Adjusted PBT 5,403 6,487 9,573 9,364 11,075
Tax 1,784 2,120 3,435 3,109 3,677
Adjusted PAT/ Net profit 3,619 4,367 6,138 6,255 7,398
% growth 20.8% 20.7% 40.5% 1.9% 18.3%
Extraordinaries 66 (0) - - -
Reported PAT / Net profit 3,552 4,368 6,138 6,255 7,398
Minority Interest - - - - -
Share of associates - - - - -
Adjusted Consolidated net profit 3,552 4,368 6,138 6,255 7,398
Reported Consolidated net profit 3,552 4,368 6,138 6,255 7,398
Source: Company, Ambit Capital research

Consumer staples
March 10, 2014 Ambit Capital Pvt. Ltd. Page 20
Cash Flow statement (` mn)
Year to December CY11 CY12 FY14E FY15E FY16E
EBIT 5,437 6,511 9,583 9,374 11,084
Depreciation 460 361 572 544 569
Others (166) (242) (10) (10) (10)
Tax (1,784) (2,120) (3,435) (3,109) (3,677)
(Incr) / decr in net working capital (62) 2,088 2,783 (676) 1,158
Cash flow from operations 3,884 6,599 9,493 6,123 9,125
Capex (1,072) (554) (728) (800) (800)
(Incr) / decr in investments 0 - - - -
Others 0 - - - -
Cash flow from investments (1,072) (554) (728) (800) (800)
Net borrowings - - - - -
Issuance of equity - - - - -
Interest paid 35 24 10 10 10
Dividend paid (1,711) (2,199) (2,942) (3,678) (4,413)
Others (101) (24) (10) (10) (10)
Cash flow from financing (1,777) (2,199) (2,942) (3,678) (4,413)
Net change in cash 1,036 3,846 5,823 1,645 3,912
Closing cash balance 10,797 14,642 20,465 22,111 26,023
Free cash flow 2,813 6,045 8,765 5,323 8,325
Source: Company, Ambit Capital research,
Ratio Analysis
Year to December CY11 CY12 FY14E FY15E FY16E
Gross margin (%) 61.9% 62.6% 61.5% 63.1% 63.3%
EBITDA margin (%) 15.8% 15.1% 13.5% 15.8% 16.1%
EBIT margin (%) 20.2% 21.1% 20.5% 21.8% 22.4%
Net profit margin (%) 13.5% 14.2% 13.1% 14.5% 14.9%
Dividend payout ratio (%) 47.3% 50.4% 47.9% 58.8% 59.7%
Net debt: equity (x) (0.9) (1.1) (1.2) (1.1) (1.2)
Working capital turnover (x) (7.7) (5.5) (5.6) (5.6) (5.6)
Gross block turnover (x) 4.2 4.7 5.3 4.5 4.8
RoCE (%) 35.7% 36.5% 42.1% 35.8% 36.5%
RoE (%) 34.4% 34.9% 40.4% 34.6% 35.4%
Source: Company, Ambit Capital research
Valuation Parameters
Year to December CY11 CY12 FY14E FY15E FY16E
EPS (`) 86.0 103.8 145.9 148.7 175.9
Diluted EPS (`) 86.0 103.8 145.9 148.7 175.9
Book value per share (`) 272.1 323.6 399.6 460.9 531.9
Dividend per share (`) 35.0 45.0 60.0 75.0 90.0
P/E (x) 50.4 41.7 29.7 29.1 24.3
P/BV (x) 15.9 13.4 10.8 9.4 8.1
EV/EBITDA (x) 40.4 36.0 25.7 23.6 19.6
Price/Sales (x) 6.8 5.9 3.9 4.2 3.7
Source: Company, Ambit Capital research
Consumer staples
March 10, 2014 Ambit Capital Pvt. Ltd. Page 21
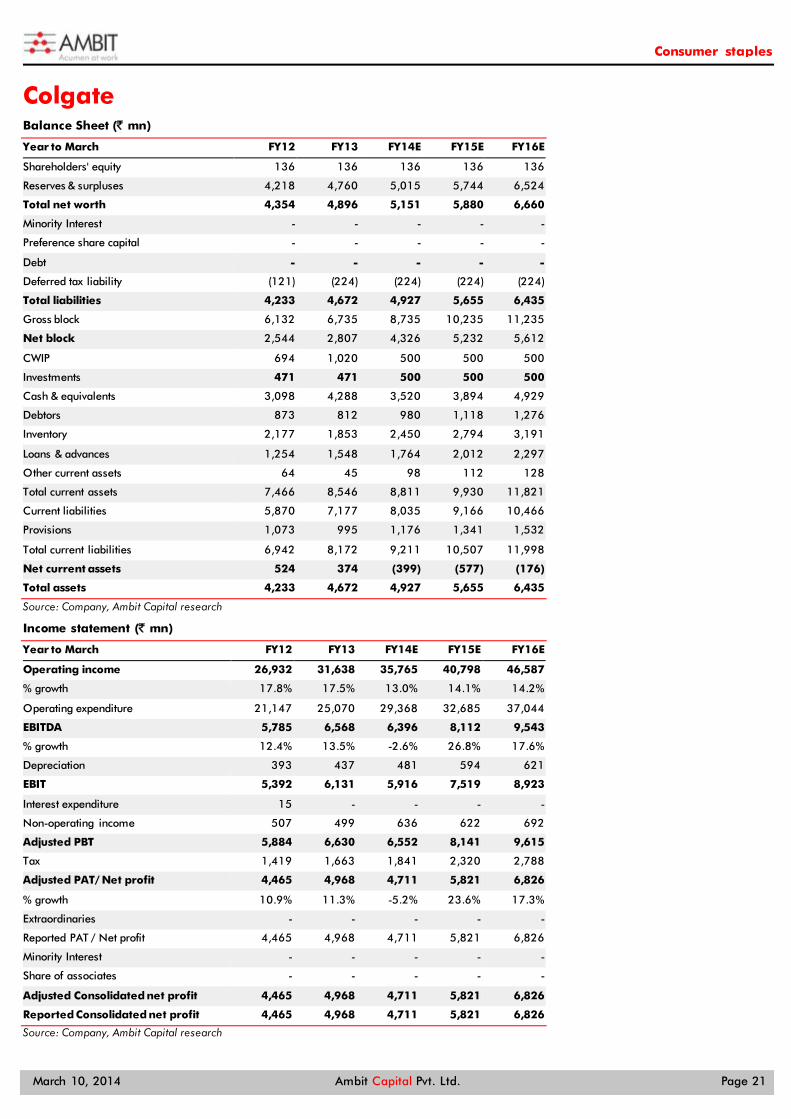
Colgate Balance Sheet (` mn)
Year to March FY12 FY13 FY14E FY15E FY16E
Shareholders' equity 136 136 136 136 136
Reserves & surpluses 4,218 4,760 5,015 5,744 6,524
Total net worth 4,354 4,896 5,151 5,880 6,660
Minority Interest - - - - -
Preference share capital - - - - -
Debt - - - - -
Deferred tax liability (121) (224) (224) (224) (224)
Total liabilities 4,233 4,672 4,927 5,655 6,435
Gross block 6,132 6,735 8,735 10,235 11,235
Net block 2,544 2,807 4,326 5,232 5,612
CWIP 694 1,020 500 500 500
Investments 471 471 500 500 500
Cash & equivalents 3,098 4,288 3,520 3,894 4,929
Debtors 873 812 980 1,118 1,276
Inventory 2,177 1,853 2,450 2,794 3,191
Loans & advances 1,254 1,548 1,764 2,012 2,297
Other current assets 64 45 98 112 128
Total current assets 7,466 8,546 8,811 9,930 11,821
Current liabilities 5,870 7,177 8,035 9,166 10,466
Provisions 1,073 995 1,176 1,341 1,532
Total current liabilities 6,942 8,172 9,211 10,507 11,998
Net current assets 524 374 (399) (577) (176)
Total assets 4,233 4,672 4,927 5,655 6,435
Source: Company, Ambit Capital research
Income statement (` mn)
Year to March FY12 FY13 FY14E FY15E FY16E
Operating income 26,932 31,638 35,765 40,798 46,587
% growth 17.8% 17.5% 13.0% 14.1% 14.2%
Operating expenditure 21,147 25,070 29,368 32,685 37,044
EBITDA 5,785 6,568 6,396 8,112 9,543
% growth 12.4% 13.5% -2.6% 26.8% 17.6%
Depreciation 393 437 481 594 621
EBIT 5,392 6,131 5,916 7,519 8,923
Interest expenditure 15 - - - -
Non-operating income 507 499 636 622 692
Adjusted PBT 5,884 6,630 6,552 8,141 9,615
Tax 1,419 1,663 1,841 2,320 2,788
Adjusted PAT/ Net profit 4,465 4,968 4,711 5,821 6,826
% growth 10.9% 11.3% -5.2% 23.6% 17.3%
Extraordinaries - - - - -
Reported PAT / Net profit 4,465 4,968 4,711 5,821 6,826
Minority Interest - - - - -
Share of associates - - - - -
Adjusted Consolidated net profit 4,465 4,968 4,711 5,821 6,826
Reported Consolidated net profit 4,465 4,968 4,711 5,821 6,826
Source: Company, Ambit Capital research
Consumer staples
March 10, 2014 Ambit Capital Pvt. Ltd. Page 22
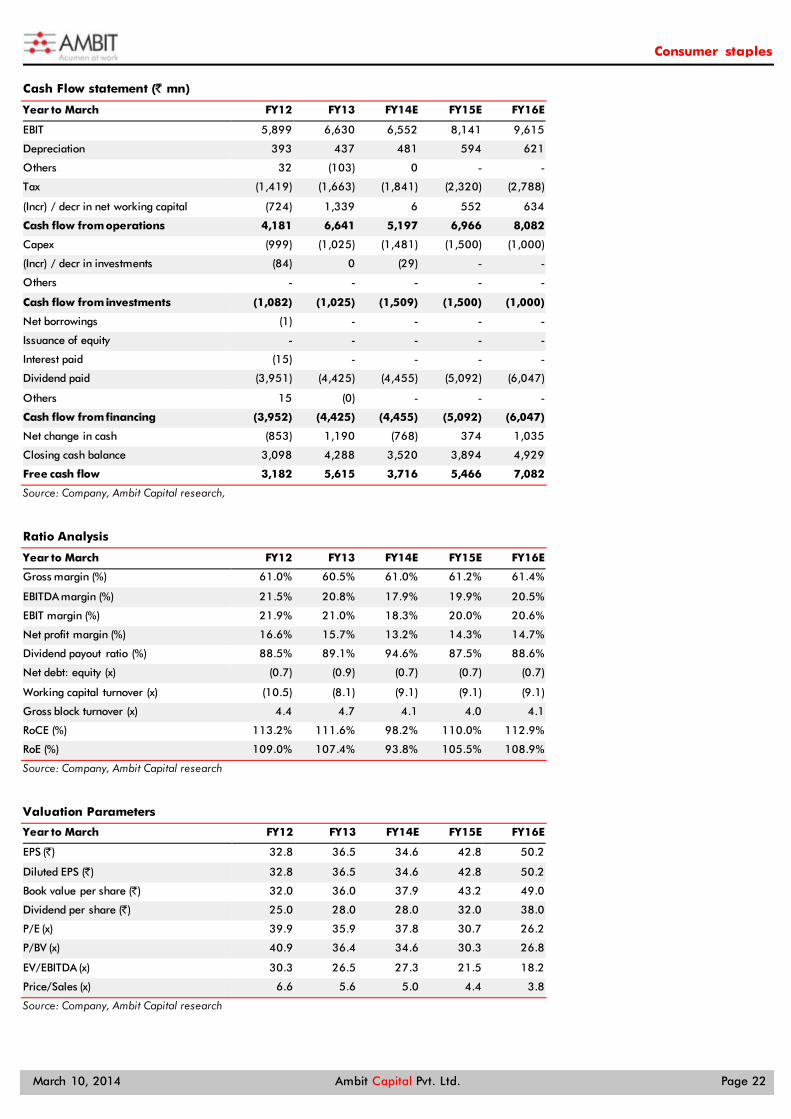
Cash Flow statement (` mn)
Year to March FY12 FY13 FY14E FY15E FY16E
EBIT 5,899 6,630 6,552 8,141 9,615
Depreciation 393 437 481 594 621
Others 32 (103) 0 - -
Tax (1,419) (1,663) (1,841) (2,320) (2,788)
(Incr) / decr in net working capital (724) 1,339 6 552 634
Cash flow from operations 4,181 6,641 5,197 6,966 8,082
Capex (999) (1,025) (1,481) (1,500) (1,000)
(Incr) / decr in investments (84) 0 (29) - -
Others - - - - -
Cash flow from investments (1,082) (1,025) (1,509) (1,500) (1,000)
Net borrowings (1) - - - -
Issuance of equity - - - - -
Interest paid (15) - - - -
Dividend paid (3,951) (4,425) (4,455) (5,092) (6,047)
Others 15 (0) - - -
Cash flow from financing (3,952) (4,425) (4,455) (5,092) (6,047)
Net change in cash (853) 1,190 (768) 374 1,035
Closing cash balance 3,098 4,288 3,520 3,894 4,929
Free cash flow 3,182 5,615 3,716 5,466 7,082
Source: Company, Ambit Capital research,
Ratio Analysis
Year to March FY12 FY13 FY14E FY15E FY16E
Gross margin (%) 61.0% 60.5% 61.0% 61.2% 61.4%
EBITDA margin (%) 21.5% 20.8% 17.9% 19.9% 20.5%
EBIT margin (%) 21.9% 21.0% 18.3% 20.0% 20.6%
Net profit margin (%) 16.6% 15.7% 13.2% 14.3% 14.7%
Dividend payout ratio (%) 88.5% 89.1% 94.6% 87.5% 88.6%
Net debt: equity (x) (0.7) (0.9) (0.7) (0.7) (0.7)
Working capital turnover (x) (10.5) (8.1) (9.1) (9.1) (9.1)
Gross block turnover (x) 4.4 4.7 4.1 4.0 4.1
RoCE (%) 113.2% 111.6% 98.2% 110.0% 112.9%
RoE (%) 109.0% 107.4% 93.8% 105.5% 108.9%
Source: Company, Ambit Capital research
Valuation Parameters
Year to March FY12 FY13 FY14E FY15E FY16E
EPS (`) 32.8 36.5 34.6 42.8 50.2
Diluted EPS (`) 32.8 36.5 34.6 42.8 50.2
Book value per share (`) 32.0 36.0 37.9 43.2 49.0
Dividend per share (`) 25.0 28.0 28.0 32.0 38.0
P/E (x) 39.9 35.9 37.8 30.7 26.2
P/BV (x) 40.9 36.4 34.6 30.3 26.8
EV/EBITDA (x) 30.3 26.5 27.3 21.5 18.2
Price/Sales (x) 6.6 5.6 5.0 4.4 3.8
Source: Company, Ambit Capital research
Consumer staples
March 10, 2014 Ambit Capital Pvt. Ltd. Page 23
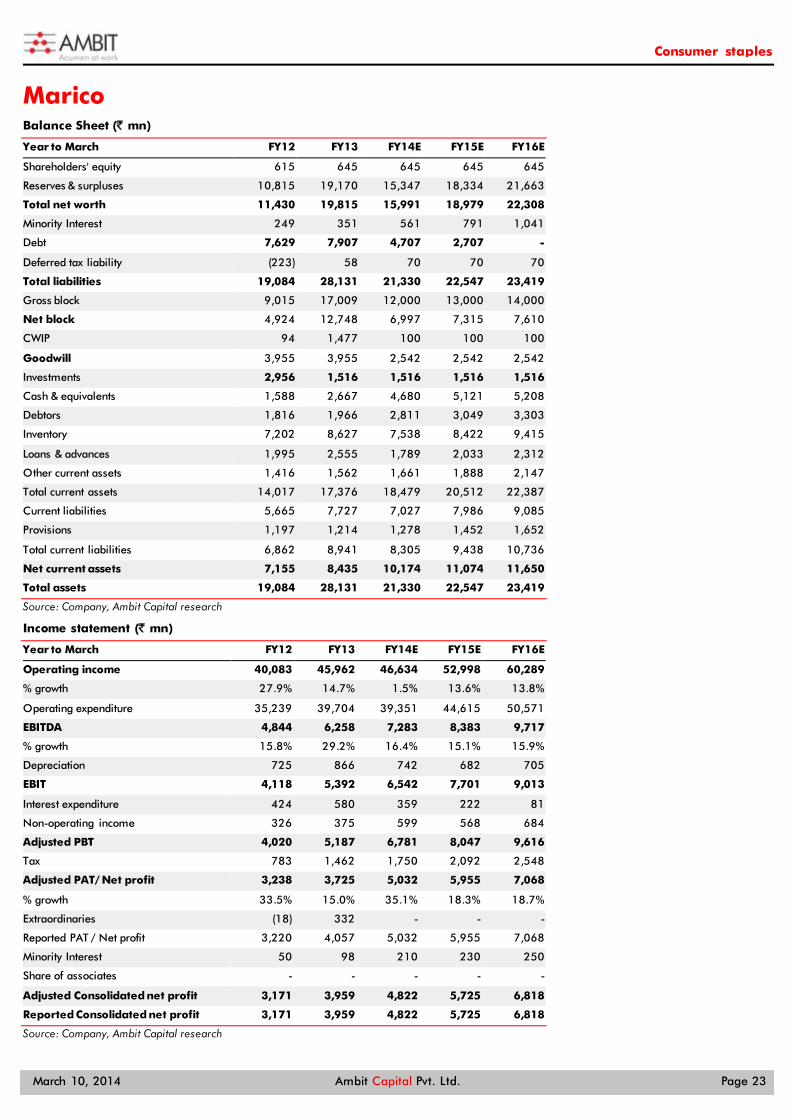
Marico Balance Sheet (` mn)
Year to March FY12 FY13 FY14E FY15E FY16E
Shareholders' equity 615 645 645 645 645
Reserves & surpluses 10,815 19,170 15,347 18,334 21,663
Total net worth 11,430 19,815 15,991 18,979 22,308
Minority Interest 249 351 561 791 1,041
Debt 7,629 7,907 4,707 2,707 -
Deferred tax liability (223) 58 70 70 70
Total liabilities 19,084 28,131 21,330 22,547 23,419
Gross block 9,015 17,009 12,000 13,000 14,000
Net block 4,924 12,748 6,997 7,315 7,610
CWIP 94 1,477 100 100 100
Goodwill 3,955 3,955 2,542 2,542 2,542
Investments 2,956 1,516 1,516 1,516 1,516
Cash & equivalents 1,588 2,667 4,680 5,121 5,208
Debtors 1,816 1,966 2,811 3,049 3,303
Inventory 7,202 8,627 7,538 8,422 9,415
Loans & advances 1,995 2,555 1,789 2,033 2,312
Other current assets 1,416 1,562 1,661 1,888 2,147
Total current assets 14,017 17,376 18,479 20,512 22,387
Current liabilities 5,665 7,727 7,027 7,986 9,085
Provisions 1,197 1,214 1,278 1,452 1,652
Total current liabilities 6,862 8,941 8,305 9,438 10,736
Net current assets 7,155 8,435 10,174 11,074 11,650
Total assets 19,084 28,131 21,330 22,547 23,419
Source: Company, Ambit Capital research
Income statement (` mn)
Year to March FY12 FY13 FY14E FY15E FY16E
Operating income 40,083 45,962 46,634 52,998 60,289
% growth 27.9% 14.7% 1.5% 13.6% 13.8%
Operating expenditure 35,239 39,704 39,351 44,615 50,571
EBITDA 4,844 6,258 7,283 8,383 9,717
% growth 15.8% 29.2% 16.4% 15.1% 15.9%
Depreciation 725 866 742 682 705
EBIT 4,118 5,392 6,542 7,701 9,013
Interest expenditure 424 580 359 222 81
Non-operating income 326 375 599 568 684
Adjusted PBT 4,020 5,187 6,781 8,047 9,616
Tax 783 1,462 1,750 2,092 2,548
Adjusted PAT/ Net profit 3,238 3,725 5,032 5,955 7,068
% growth 33.5% 15.0% 35.1% 18.3% 18.7%
Extraordinaries (18) 332 - - -
Reported PAT / Net profit 3,220 4,057 5,032 5,955 7,068
Minority Interest 50 98 210 230 250
Share of associates - - - - -
Adjusted Consolidated net profit 3,171 3,959 4,822 5,725 6,818
Reported Consolidated net profit 3,171 3,959 4,822 5,725 6,818
Source: Company, Ambit Capital research

Consumer staples
March 10, 2014 Ambit Capital Pvt. Ltd. Page 24
Cash Flow statement (` mn)
Year to March FY12 FY13 FY14E FY15E FY16E
EBIT 4,444 5,767 7,141 8,269 9,697
Depreciation 725 866 742 682 705
Others (368) (295) (347) (222) (81)
Tax (783) (1,462) (1,750) (2,092) (2,548)
(Incr) / decr in net working capital (916) (201) 274 (459) (489)
Cash flow from operations 3,103 4,675 6,060 6,178 7,284
Capex (1,166) (10,072) 6,385 (1,000) (1,000)
(Incr) / decr in investments (2,046) 1,440 1,413 - -
Others - - - - -
Cash flow from investments (3,212) (8,632) 7,799 (1,000) (1,000)
Net borrowings 405 278 (3,200) (2,000) (2,707)
Interest paid (424) (580) (359) (222) (81)
Dividend paid (501) (749) (1,503) (2,255) (3,007)
Others 12 6,088 (6,783) (260) (401)
Cash flow from financing (509) 5,036 (11,845) (4,737) (6,196)
Net change in cash (618) 1,079 2,013 441 88
Closing cash balance 1,588 2,667 4,680 5,121 5,208
Free cash flow 1,937 (5,397) 12,445 5,178 6,284
Source: Company, Ambit Capital research,
Ratio Analysis
Year to March FY12 FY13 FY14E FY15E FY16E
Gross margin (%) 47.6% 51.9% 49.7% 50.0% 50.2%
EBITDA margin (%) 12.1% 13.6% 15.6% 15.8% 16.1%
EBIT margin (%) 11.1% 12.5% 15.3% 15.6% 16.1%
Net profit margin (%) 8.0% 7.9% 10.3% 10.8% 11.3%
Dividend payout ratio (%) 15.8% 18.9% 31.2% 39.4% 44.1%
Net debt: equity (x) 0.5 0.3 0.0 (0.1) (0.2)
Working capital turnover (x) 7.2 8.0 8.5 8.9 9.4
Gross block turnover (x) 4.4 2.7 3.9 4.1 4.3
RoCE (%) 20.0% 17.1% 20.6% 26.8% 29.9%
RoE (%) 31.0% 23.2% 26.9% 32.7% 33.0%
Source: Company, Ambit Capital research
Valuation Parameters
Year to March FY12 FY13 FY14E FY15E FY16E
EPS (`) 5.2 5.6 7.5 8.9 10.6
Diluted EPS (`) 5.2 5.6 7.5 8.9 10.6
Book value per share (`) 18.6 32.2 26.0 30.9 36.3
Dividend per share (`) 0.70 1.00 2.00 3.00 4.00
P/E (x) 39.7 36.6 27.5 23.5 19.8
P/BV (x) 11.1 6.4 7.9 6.7 5.7
EV/EBITDA (x) 27.4 22.1 18.2 15.6 13.1
Price/Sales (x) 3.2 2.9 2.8 2.5 2.2
Source: Company, Ambit Capital research
Consumer staples
March 10, 2014 Ambit Capital Pvt. Ltd. Page 25
Institutional Equities Team
SaurabhMukherjea, CFA CEO, Institutional Equities (022) 30433174 [email protected]
Research
Analysts Industry Sectors Desk-Phone E-mail
Aadesh Mehta Banking & Financial Services (022) 30433239 [email protected]
Achint Bhagat Cement / Infrastructure (022) 30433178 [email protected]
Aditya Khemka Healthcare (022) 30433272 [email protected]
Akshay Wadhwa Banking & Financial Services (022) 30433005 [email protected] Ankur Rudra, CFA Technology / Telecom / Media (022) 30433211 [email protected]
Ashvin Shetty, CFA Automobile (022) 30433285 [email protected]
Bhargav Buddhadev Power / Capital Goods (022) 30433252 [email protected]
Dayanand Mittal, CFA Oil & Gas / Metals & Mining (022) 30433202 [email protected]
Deepesh Agarwal Power / Capital Goods (022) 30433275 [email protected] Gaurav Mehta, CFA Strategy / Derivatives Research (022) 30433255 [email protected]
Karan Khanna Strategy (022) 30433251 [email protected]
Krishnan ASV Banking & Financial Services (022) 30433205 [email protected]
Nitin Bhasin E&C / Infrastructure / Cement (022) 30433241 [email protected]
Nitin Jain Technology (022) 30433291 [email protected]
Pankaj Agarwal, CFA Banking & Financial Services (022) 30433206 [email protected]
Pratik Singhania Real Estate / Retail (022) 30433264 [email protected]
Parita Ashar Metals & Mining / Oil & Gas (022) 30433223 [email protected]
Rakshit Ranjan, CFA Consumer / Real Estate / Retail (022) 30433201 [email protected]
Ravi Singh Banking & Financial Services (022) 30433181 [email protected]
Ritika Mankar Mukherjee, CFA Economy / Strategy (022) 30433175 [email protected]
Ritu Modi Automobile (022) 30433292 [email protected]
Shariq Merchant Consumer (022) 30433246 [email protected]
Tanuj Mukhija, CFA E&C / Infrastructure (022) 30433203 [email protected]
Sales
Name Regions Desk-Phone E-mail
Deepak Sawhney India / Asia (022) 30433295 [email protected]
Dharmen Shah India / Asia (022) 30433289 [email protected]
Dipti Mehta India / USA (022) 30433053 [email protected]
Nityam Shah, CFA USA / Europe (022) 30433259 [email protected]
Parees Purohit, CFA UK / USA (022) 30433169 [email protected]
Praveena Pattabiraman India / Asia (022) 30433268 [email protected]
Sarojini Ramachandran UK +44 (0) 20 7614 8374 [email protected]
Production
Sajid Merchant Production (022) 30433247 [email protected]
Sharoz G Hussain Production (022) 30433183 [email protected]
Joel Pereira Editor (022) 30433284 [email protected]
Nikhil Pillai Database (022) 30433265 [email protected]
E&C = Engineering & Construction

Consumer staples
March 10, 2014 Ambit Capital Pvt. Ltd. Page 26
Explanation of Investment Rating Investment Rating Expected return
(over 12-month period from date of initial rating)
Buy >5%
Sell <5%
Disclaimer
This report or any portion hereof may not be reprinted, sold or redistributed without the written consent of Ambit Capital. AMBIT Capital Research is disseminated and available primarily electronically, and, in some cases, in printed form.
Additional information on recommended securities is available on request.
Disclaimer 1. AMBIT Capital Private Limited (“AMBIT Capital”) and its affiliates are a full service, integrated investment banking, investment advisory and brokerage group. AMBIT Capital is a Stock
Broker, Portfolio Manager and Depository Participant registered with Securities and Exchange Board of India Limited (SEBI) and is regulated by SEBI 2. The recommendations, opinions and views contained in this Research Report reflect the views of the research analyst named on the Research Report and are based upon publicly
available information and rates of taxation at the time of publication, which are subject to change from time to time without any prior notice. 3. AMBIT Capital makes best endeavours to ensure that the research analyst(s) use current, reliable, comprehensive information and obtain such information from sources which the
analyst(s) believes to be reliable. However, such information has not been independently verified by AMBIT Capital and/or the analyst(s) and no representation or warranty, express or implied, is made as to the accuracy or completeness of any information obtained from third parties. The information or opinions are provided as at the date of this Research Report and are subject to change without notice.
4. If you are dissatisfied with the contents of this complimentary Research Report or with the terms of this Disclaimer, your sole and exclusive remedy is to stop using this Research Report and AMBIT Capital shall not be responsible and/ or liable in any manner.
5. If this Research Report is received by any client of AMBIT Capital or its affiliate, the relationship of AMBIT Capital/its affiliate with such client will continue to be governed by the terms and conditions in place between AMBIT Capital/ such affiliate and the client.
6. This Research Report is issued for information only and should not be construed as an investment advice to any recipient to acquire, subscribe, purchase, sell, dispose of, retain any securities. Recipients should consider this Research Report as only a single factor in making any investment decisions. This Research Report is not an offer to sell or the solicitation of an offer to purchase or subscribe for any investment or as an official endorsement of any investment.
7. If 'Buy', 'Sell', or 'Hold' recommendation is made in this Research Report such recommendation or view or opinion expressed on investments in this Research Report is not intended to constitute investment advice and should not be intended or treated as a substitute for necessary review or validation or any professional advice. The views expressed in this Research Report are those of the research analyst which are subject to change and do not represent to be an authority on the subject. AMBIT Capital may or may not subscribe to any and/ or all the views expressed herein.
8. AMBIT Capital makes no guarantee, representation or warranty, express or implied; and accepts no responsibility or liability as to the accuracy or completeness or currentess of the information in this Research Report. AMBIT Capital or its affiliates do not accept any liability whatsoever for any direct or consequential loss howsoever arising, directly or indirectly, from any use of this Research Report.
9. Past performance is not necessarily a guide to evaluate future performance. 10. AMBIT Capital and/or its affiliates (as principal or on behalf of its/their clients) and their respective officers directors and employees may hold positions in any securities mentioned in this
Research Report (or in any related investment) and may from time to time add to or dispose of any such securities (or investment). Such positions in securities may be contrary to or inconsistent with this Research Report.
11. This Research Report should be read and relied upon at the sole discretion and risk of the recipient. 12. The value of any investment made at your discretion based on this Research Report or income therefrom may be affected by changes in economic, financial and/ or political factors and
may go down as well as up and you may not get back the full or the expected amount invested. Some securities and/ or investments involve substantial risk and are not suitable for all investors.
13. This Research Report is being supplied to you solely for your information and may not be reproduced, redistributed or passed on, directly or indirectly, to any other person or published, copied in whole or in part, for any purpose. Neither this Research Report nor any copy of it may be taken or transmitted or distributed, directly or indirectly within India or into any other country including United States (to US Persons), Canada or Japan or to any resident thereof. The distribution of this Research Report in other jurisdictions may be strictly restricted and/ or prohibited by law or contract, and persons into whose possession this Research Report comes should inform themselves about such restriction and/ or prohibition, and observe any such restrictions and/ or prohibition.
14. Neither AMBIT Capital nor its affiliates or their respective directors, employees, agents or representatives, shall be responsible or liable in any manner, directly or indirectly, for views or opinions expressed in this Report or the contents or any errors or discrepancies herein or for any decisions or actions taken in reliance on the Report or inability to use or access our service or this Research Report or for any loss or damages whether direct or indirect, incidental, special or consequential including without limitation loss of revenue or profits that may arise from or in connection with the use of or reliance on this Research Report or inability to use or access our service or this Research Report.
Conflict of Interests 15. In the normal course of AMBIT Capital’s business circumstances may arise that could result in the interests of AMBIT Capital conflicting with the interests of clients or one client’s interests
conflicting with the interest of another client. AMBIT Capital makes best efforts to ensure that conflicts are identified and managed and that clients’ interests are protected. AMBIT Capital has policies and procedures in place to control the flow and use of non-public, price sensitive information and employees’ personal account trading. Where appropriate and reasonably achievable, AMBIT Capital segregates the activities of staff working in areas where conflicts of interest may arise. However, clients/potential clients of AMBIT Capital should be aware of these possible conflicts of interests and should make informed decisions in relation to AMBIT Capital’s services.
16. AMBIT Capital and/or its affiliates may from time to time have investment banking, investment advisory and other business relationships with companies covered in this Research Report and may receive compensation for the same. Research analysts provide important inputs into AMBIT Capital’s investment banking and other business selection processes.
17. AMBIT Capital and/or its affiliates may seek investment banking or other businesses from the companies covered in this Research Report and research analysts involved in preparing this Research Report may participate in the solicitation of such business.
18. In addition to the foregoing, the companies covered in this Research Report may be clients of AMBIT Capital where AMBIT Capital may be required, inter alia, to prepare and publish research reports covering such companies and AMBIT Capital may receive compensation from such companies in relation to such services. However, the views reflected in this Research Report are objective views, independent of AMBIT Capital’s relationship with such company.
19. In addition, AMBIT Capital may also act as a market maker or risk arbitrator or liquidity provider or may have assumed an underwriting commitment in the securities of companies covered in this Research Report (or in related investments) and may also be represented in the supervisory board or on any other committee of those companies.
Additional Disclaimer for U.S. Persons
20. The research report is solely a product of AMBIT Capital 21. AMBIT Capital is the employer of the research analyst(s) who has prepared the research report 22. Any subsequent transactions in securities discussed in the research reports should be effected through J.P.P. Euro-Securities, Inc. (“JPP”). 23. JPP does not accept or receive any compensation of any kind for the dissemination of the AMBIT Capital research reports. 24. The research analyst(s) preparing the research report is resident outside the United States and is/are not associated persons of any U.S. regulated broker-dealer and that therefore the
analyst(s) is/are not subject to supervision by a U.S. broker-dealer, and is/are not required to satisfy the regulatory licensing requirements of FINRA or required to otherwise comply with U.S. rules or regulations regarding, among other things, communications with a subject company, public appearances and trading securities held by a research analyst account.
© Copyright 2014 AMBIT Capital Private Limited. All rights reserved.
Ambit Capital Pvt. Ltd. Ambit House, 3rd Floor 449, Senapati Bapat Marg, Lower Parel, Mumbai 400 013, India. Phone: +91-22-3043 3000 Fax: +91-22-3043 3100