Section 5.3 Trigonometric Graphs
12
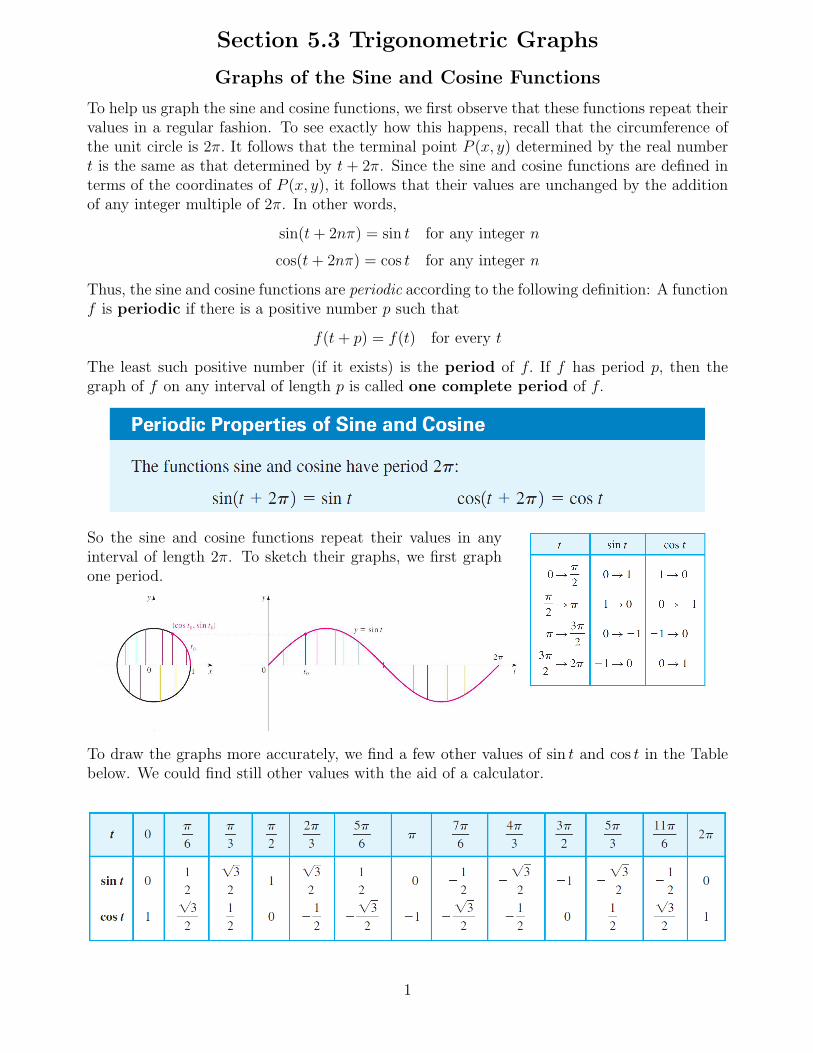
Section 5.3 Trigonometric Graphs Graphs of the Sine and Cosine Functions To help us graph the sine and cosine functions, we first observe that these functions repeat their values in a regular fashion. To see exactly how this happens, recall that the circumference of the unit circle is 2π. It follows that the terminal point P (x, y) determined by the real number t is the same as that determined by t +2π. Since the sine and cosine functions are defined in terms of the coordinates of P (x, y), it follows that their values are unchanged by the addition of any integer multiple of 2π. In other words, sin(t +2nπ) = sin t for any integer n cos(t +2nπ) = cos t for any integer n Thus, the sine and cosine functions are periodic according to the following definition: A function f is periodic if there is a positive number p such that f (t + p)= f (t) for every t The least such positive number (if it exists) is the period of f. If f has period p, then the graph of f on any interval of length p is called one complete period of f. So the sine and cosine functions repeat their values in any interval of length 2π. To sketch their graphs, we first graph one period. To draw the graphs more accurately, we find a few other values of sin t and cos t in the Table below. We could find still other values with the aid of a calculator. 1
Transcript of Section 5.3 Trigonometric Graphs
Section 5.3 Trigonometric Graphs
Graphs of the Sine and Cosine Functions
To help us graph the sine and cosine functions, we first observe that these functions repeat theirvalues in a regular fashion. To see exactly how this happens, recall that the circumference ofthe unit circle is 2π. It follows that the terminal point P (x, y) determined by the real numbert is the same as that determined by t + 2π. Since the sine and cosine functions are defined interms of the coordinates of P (x, y), it follows that their values are unchanged by the additionof any integer multiple of 2π. In other words,
sin(t+ 2nπ) = sin t for any integer n
cos(t+ 2nπ) = cos t for any integer n
Thus, the sine and cosine functions are periodic according to the following definition: A functionf is periodic if there is a positive number p such that
f(t+ p) = f(t) for every t
The least such positive number (if it exists) is the period of f. If f has period p, then thegraph of f on any interval of length p is called one complete period of f.
So the sine and cosine functions repeat their values in anyinterval of length 2π. To sketch their graphs, we first graphone period.
To draw the graphs more accurately, we find a few other values of sin t and cos t in the Tablebelow. We could find still other values with the aid of a calculator.
1
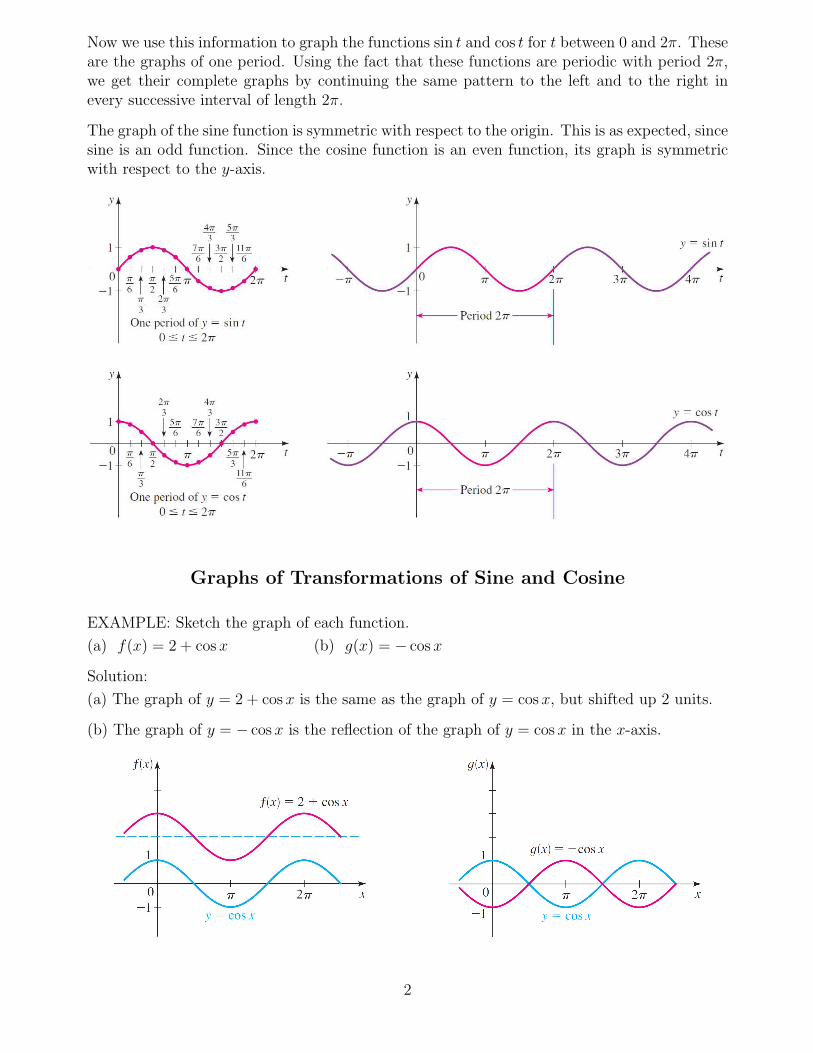
Now we use this information to graph the functions sin t and cos t for t between 0 and 2π. Theseare the graphs of one period. Using the fact that these functions are periodic with period 2π,we get their complete graphs by continuing the same pattern to the left and to the right inevery successive interval of length 2π.
The graph of the sine function is symmetric with respect to the origin. This is as expected, sincesine is an odd function. Since the cosine function is an even function, its graph is symmetricwith respect to the y-axis.
Graphs of Transformations of Sine and Cosine
EXAMPLE: Sketch the graph of each function.
(a) f(x) = 2 + cos x (b) g(x) = − cos x
Solution:
(a) The graph of y = 2 + cos x is the same as the graph of y = cos x, but shifted up 2 units.
(b) The graph of y = − cos x is the reflection of the graph of y = cosx in the x-axis.
2
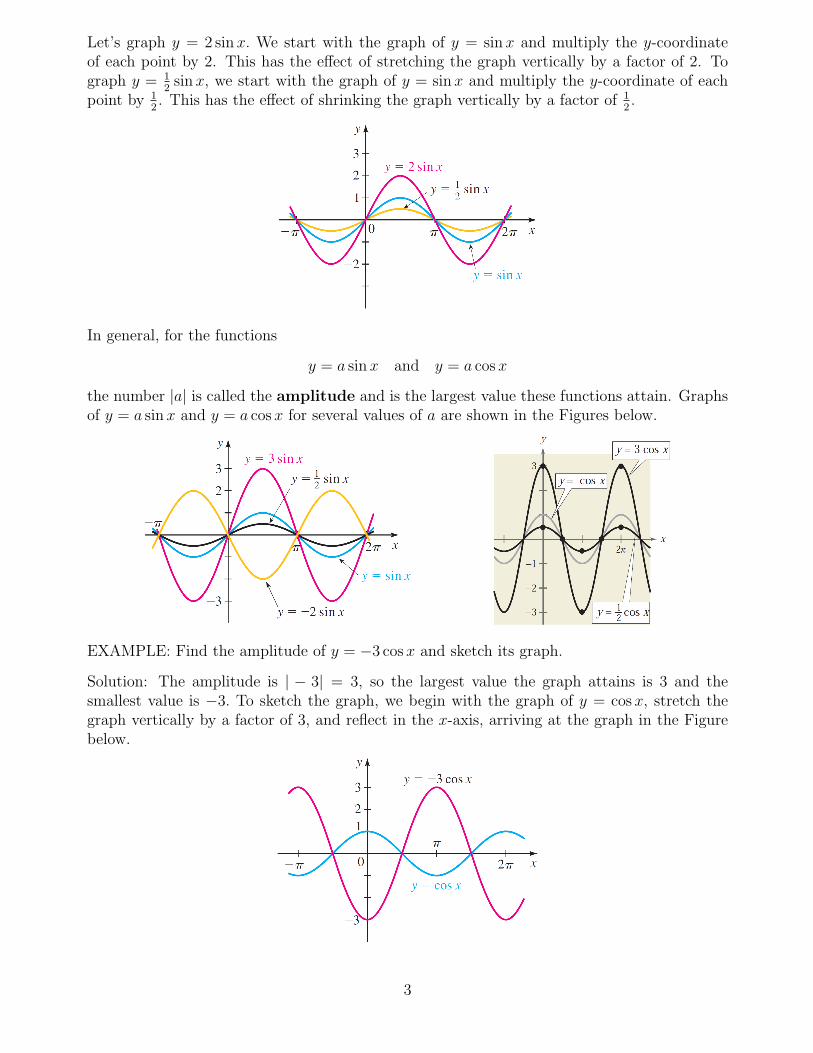
Let’s graph y = 2 sin x. We start with the graph of y = sin x and multiply the y-coordinateof each point by 2. This has the effect of stretching the graph vertically by a factor of 2. Tograph y = 1
2sin x, we start with the graph of y = sin x and multiply the y-coordinate of each
point by 1
2. This has the effect of shrinking the graph vertically by a factor of 1
2.
In general, for the functions
y = a sin x and y = a cos x
the number |a| is called the amplitude and is the largest value these functions attain. Graphsof y = a sin x and y = a cos x for several values of a are shown in the Figures below.
EXAMPLE: Find the amplitude of y = −3 cos x and sketch its graph.
Solution: The amplitude is | − 3| = 3, so the largest value the graph attains is 3 and thesmallest value is −3. To sketch the graph, we begin with the graph of y = cosx, stretch thegraph vertically by a factor of 3, and reflect in the x-axis, arriving at the graph in the Figurebelow.
3
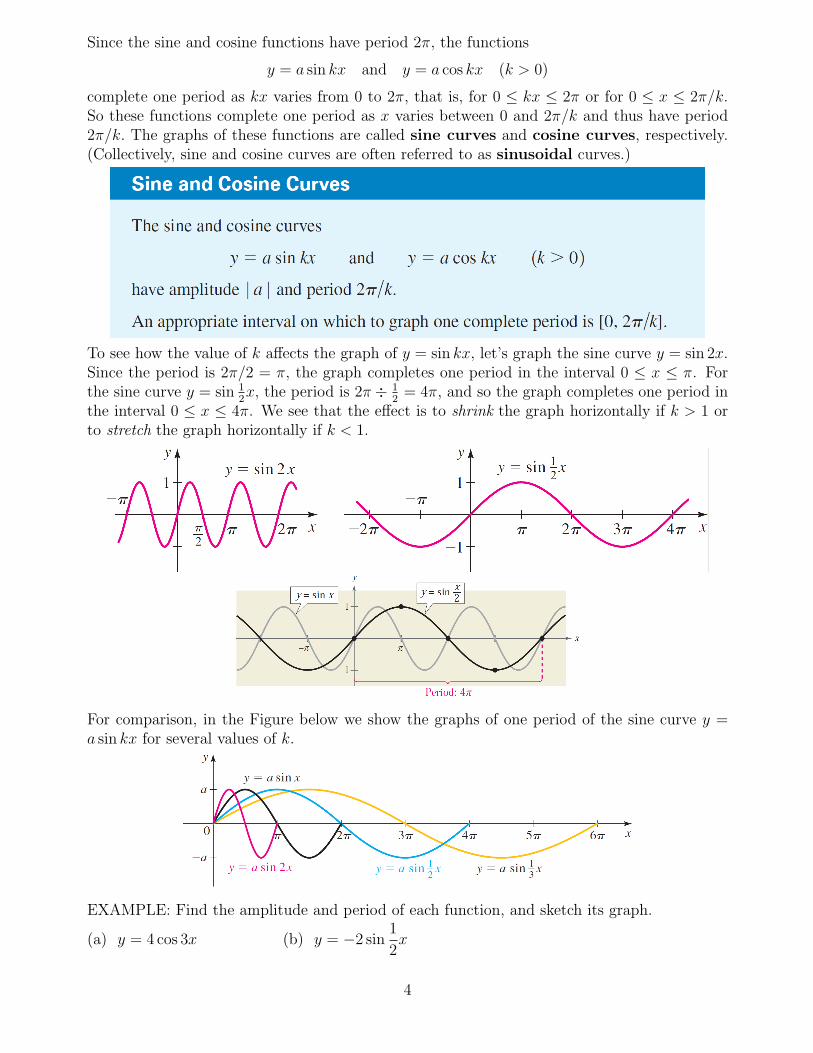
Since the sine and cosine functions have period 2π, the functions
y = a sin kx and y = a cos kx (k > 0)
complete one period as kx varies from 0 to 2π, that is, for 0 ≤ kx ≤ 2π or for 0 ≤ x ≤ 2π/k.So these functions complete one period as x varies between 0 and 2π/k and thus have period2π/k. The graphs of these functions are called sine curves and cosine curves, respectively.(Collectively, sine and cosine curves are often referred to as sinusoidal curves.)
To see how the value of k affects the graph of y = sin kx, let’s graph the sine curve y = sin 2x.Since the period is 2π/2 = π, the graph completes one period in the interval 0 ≤ x ≤ π. Forthe sine curve y = sin 1
2x, the period is 2π ÷ 1
2= 4π, and so the graph completes one period in
the interval 0 ≤ x ≤ 4π. We see that the effect is to shrink the graph horizontally if k > 1 orto stretch the graph horizontally if k < 1.
For comparison, in the Figure below we show the graphs of one period of the sine curve y =a sin kx for several values of k.
EXAMPLE: Find the amplitude and period of each function, and sketch its graph.
(a) y = 4 cos 3x (b) y = −2 sin1
2x
4
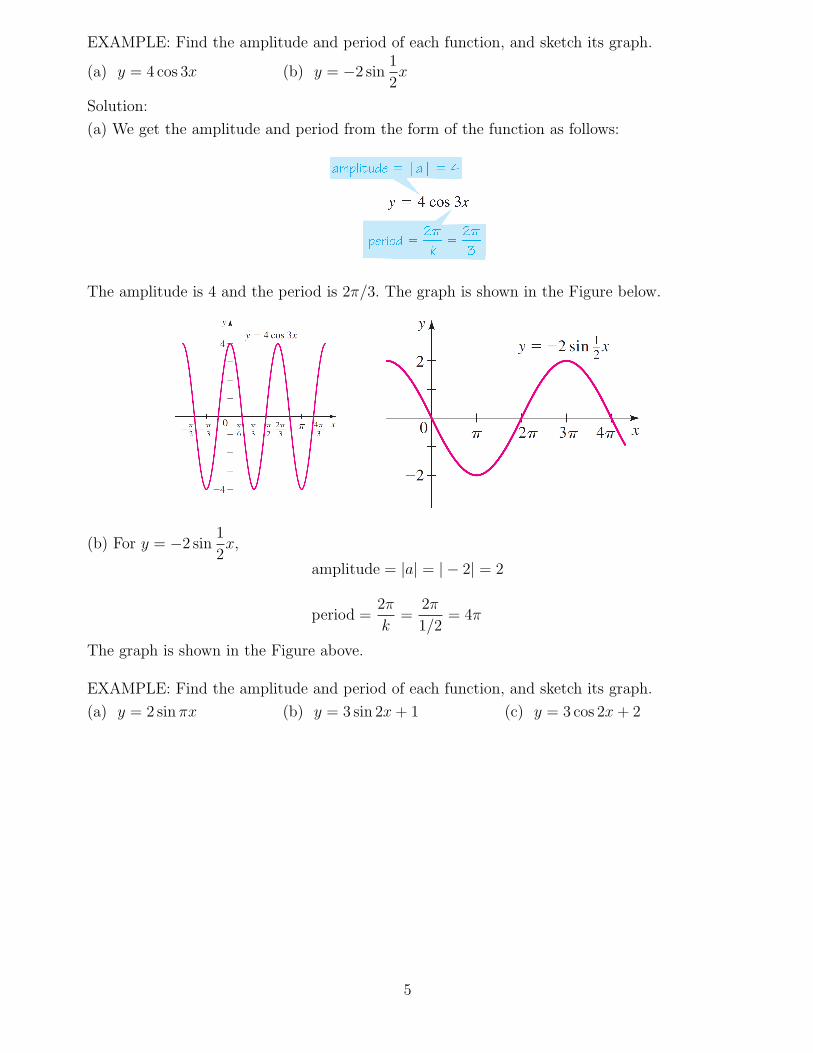
EXAMPLE: Find the amplitude and period of each function, and sketch its graph.
(a) y = 4 cos 3x (b) y = −2 sin1
2x
Solution:
(a) We get the amplitude and period from the form of the function as follows:
The amplitude is 4 and the period is 2π/3. The graph is shown in the Figure below.
(b) For y = −2 sin1
2x,
amplitude = |a| = | − 2| = 2
period =2π
k=
2π
1/2= 4π
The graph is shown in the Figure above.
EXAMPLE: Find the amplitude and period of each function, and sketch its graph.
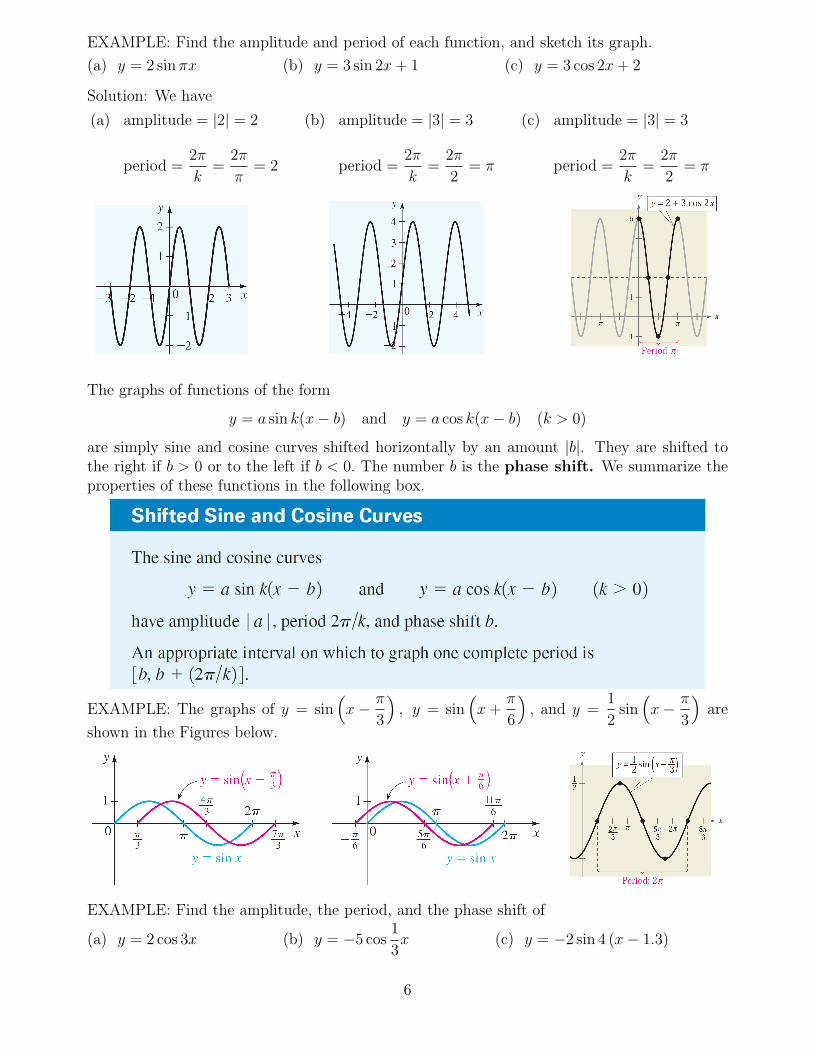
(a) y = 2 sin πx (b) y = 3 sin 2x+ 1 (c) y = 3 cos 2x+ 2
5
EXAMPLE: Find the amplitude and period of each function, and sketch its graph.
(a) y = 2 sin πx (b) y = 3 sin 2x+ 1 (c) y = 3 cos 2x+ 2
Solution: We have
(a) amplitude = |2| = 2
period =2π
k=
2π
π= 2
(b) amplitude = |3| = 3
period =2π
k=
2π
2= π
(c) amplitude = |3| = 3
period =2π
k=
2π
2= π
The graphs of functions of the form
y = a sin k(x− b) and y = a cos k(x− b) (k > 0)
are simply sine and cosine curves shifted horizontally by an amount |b|. They are shifted tothe right if b > 0 or to the left if b < 0. The number b is the phase shift. We summarize theproperties of these functions in the following box.
EXAMPLE: The graphs of y = sin(
x− π
3
)
, y = sin(
x+π
6
)
, and y =1
2sin
(
x− π
3
)
are
shown in the Figures below.
EXAMPLE: Find the amplitude, the period, and the phase shift of
(a) y = 2 cos 3x (b) y = −5 cos1
3x (c) y = −2 sin 4 (x− 1.3)
6
EXAMPLE: Find the amplitude, the period, and the phase shift of
(a) y = 2 cos 3x (b) y = −5 cos1
3x (c) y = −2 sin 4 (x− 1.3)
Solution: We have
(a) amplitude = |2| = 2
period =2π
k=
2π
3phase shift = b = 0
(b) amplitude = | − 5| = 5
period =2π
k=
2π
1/3= 6π
phase shift = b = 0
(c) amplitude = | − 2| = 2
period =2π
k=
2π
4=
π
2phase shift = b = 1.3
(Shift 1.3 to the right)
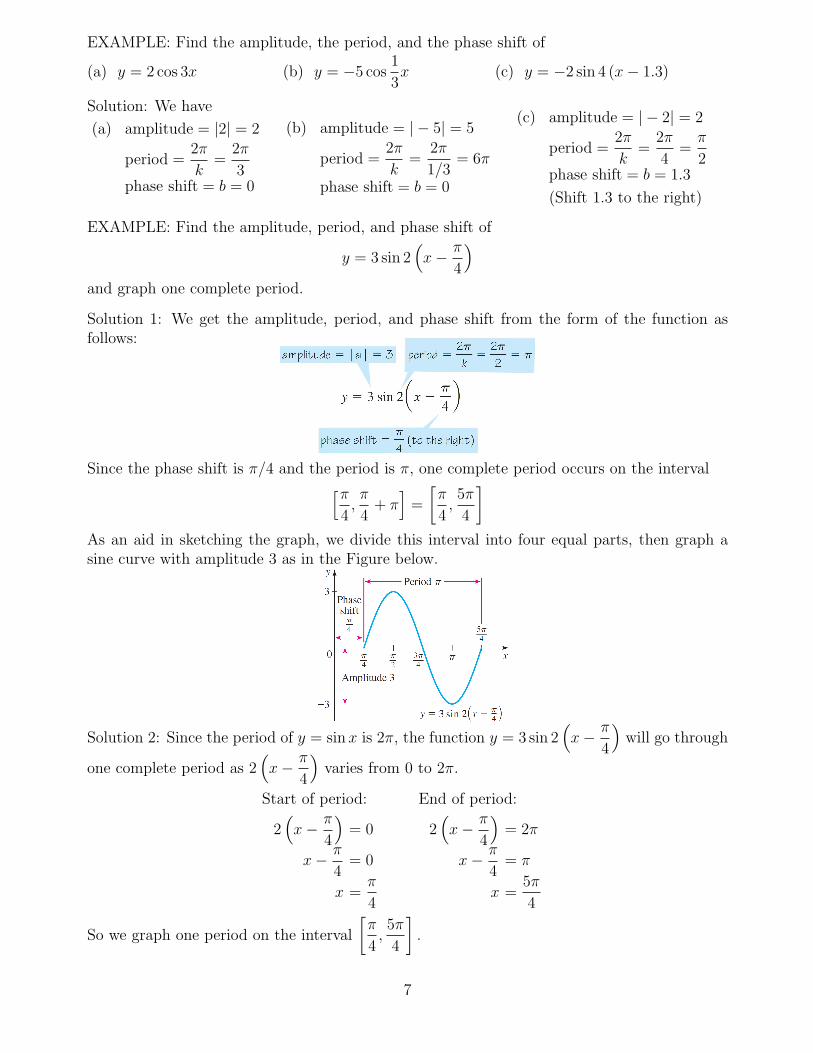
EXAMPLE: Find the amplitude, period, and phase shift of
y = 3 sin 2(
x− π
4
)
and graph one complete period.
Solution 1: We get the amplitude, period, and phase shift from the form of the function asfollows:
Since the phase shift is π/4 and the period is π, one complete period occurs on the interval[π
4,π
4+ π
]
=
[
π
4,5π
4
]
As an aid in sketching the graph, we divide this interval into four equal parts, then graph asine curve with amplitude 3 as in the Figure below.
Solution 2: Since the period of y = sin x is 2π, the function y = 3 sin 2(
x− π
4
)
will go through
one complete period as 2(
x− π
4
)
varies from 0 to 2π.
Start of period: End of period:
2(
x− π
4
)
= 0 2(
x− π
4
)
= 2π
x− π
4= 0 x− π
4= π
x =π
4x =
5π
4
So we graph one period on the interval
[
π
4,5π
4
]
.
7
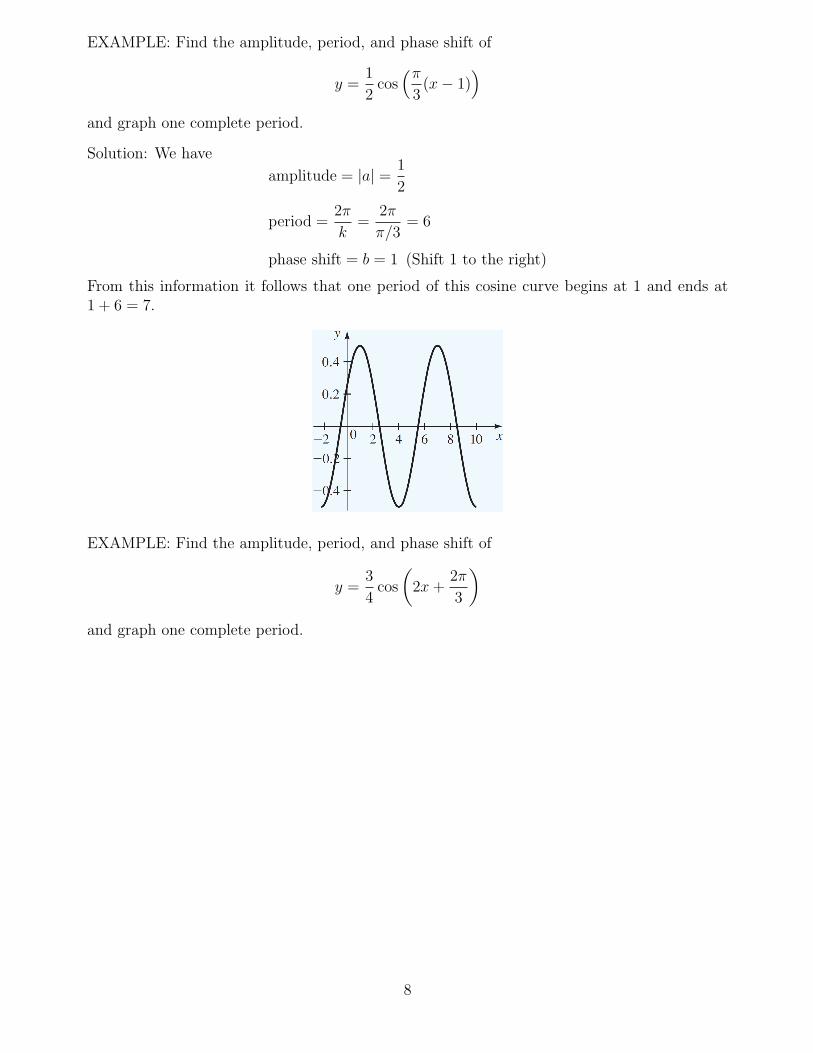
EXAMPLE: Find the amplitude, period, and phase shift of
y =1
2cos
(π
3(x− 1)
)
and graph one complete period.
Solution: We have
amplitude = |a| = 1
2
period =2π
k=
2π
π/3= 6
phase shift = b = 1 (Shift 1 to the right)
From this information it follows that one period of this cosine curve begins at 1 and ends at1 + 6 = 7.
EXAMPLE: Find the amplitude, period, and phase shift of
y =3
4cos
(
2x+2π
3
)
and graph one complete period.
8
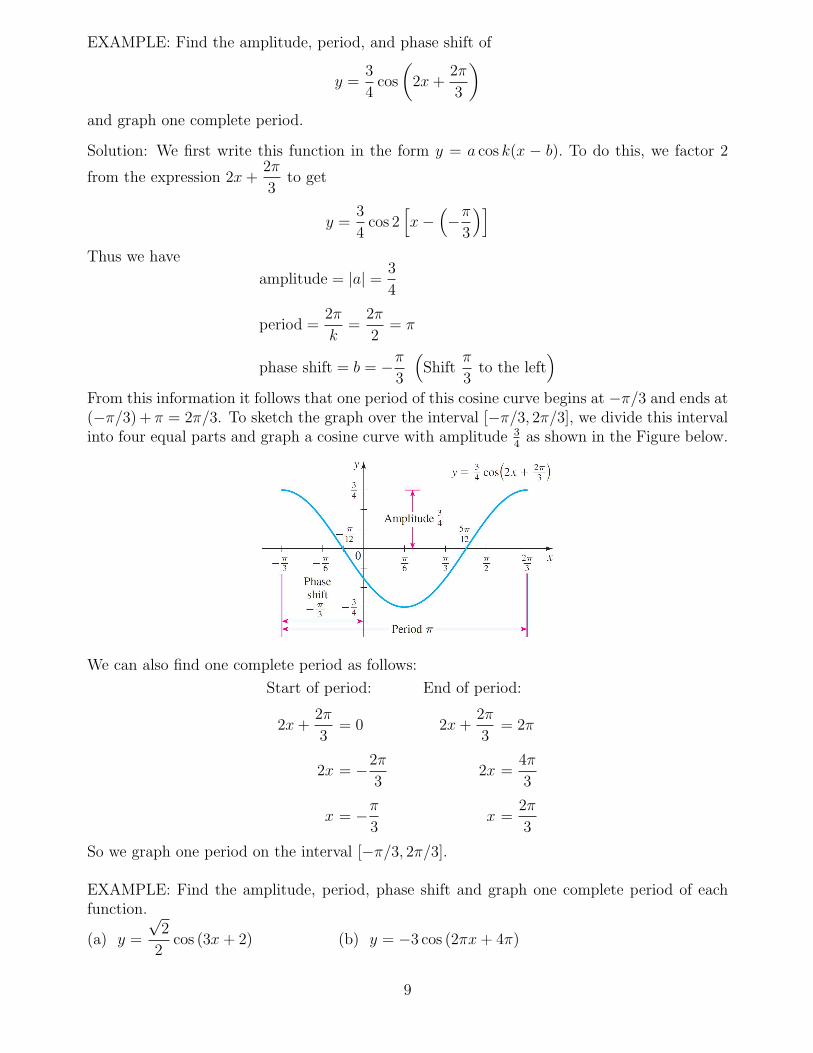
EXAMPLE: Find the amplitude, period, and phase shift of
y =3
4cos
(
2x+2π
3
)
and graph one complete period.
Solution: We first write this function in the form y = a cos k(x − b). To do this, we factor 2
from the expression 2x+2π
3to get
y =3
4cos 2
[
x−(
−π
3
)]
Thus we have
amplitude = |a| = 3
4
period =2π
k=
2π
2= π
phase shift = b = −π
3
(
Shiftπ
3to the left
)
From this information it follows that one period of this cosine curve begins at −π/3 and ends at(−π/3)+ π = 2π/3. To sketch the graph over the interval [−π/3, 2π/3], we divide this intervalinto four equal parts and graph a cosine curve with amplitude 3
4as shown in the Figure below.
We can also find one complete period as follows:
Start of period: End of period:
2x+2π
3= 0 2x+
2π
3= 2π
2x = −2π
32x =
4π
3
x = −π
3x =
2π
3
So we graph one period on the interval [−π/3, 2π/3].
EXAMPLE: Find the amplitude, period, phase shift and graph one complete period of eachfunction.
(a) y =
√2
2cos (3x+ 2) (b) y = −3 cos (2πx+ 4π)
9
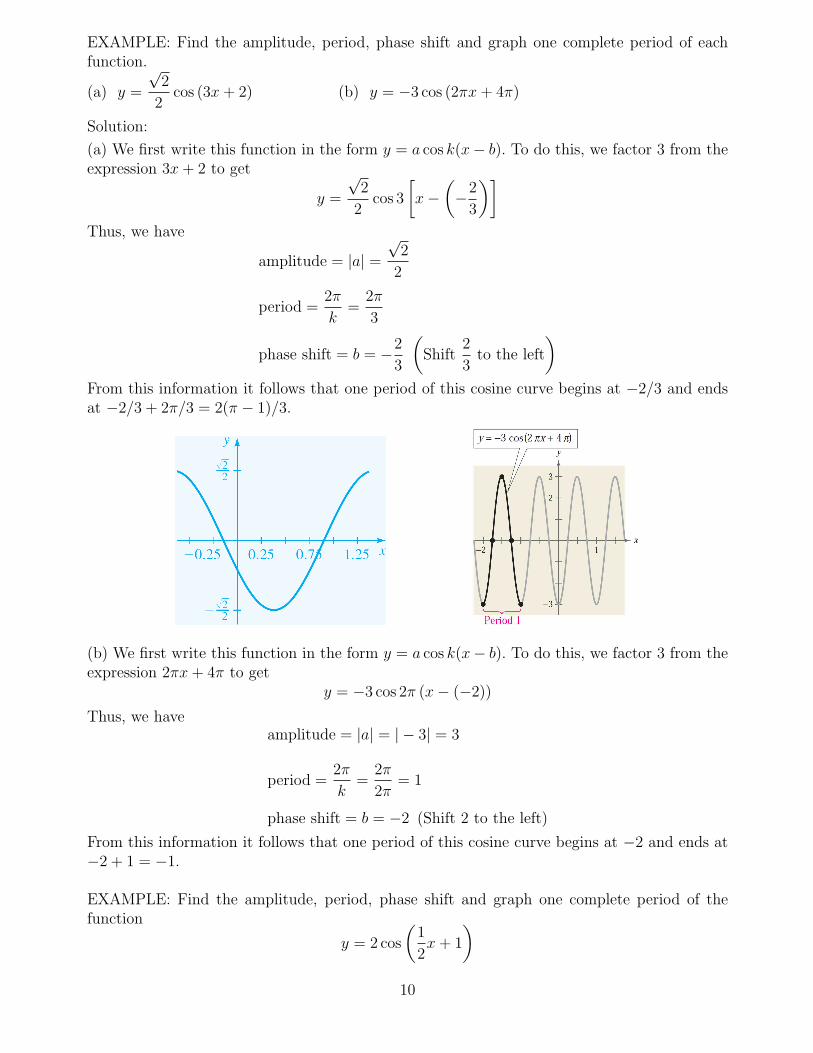
EXAMPLE: Find the amplitude, period, phase shift and graph one complete period of eachfunction.
(a) y =
√2
2cos (3x+ 2) (b) y = −3 cos (2πx+ 4π)
Solution:
(a) We first write this function in the form y = a cos k(x− b). To do this, we factor 3 from theexpression 3x+ 2 to get
y =
√2
2cos 3
[
x−(
−2
3
)]
Thus, we have
amplitude = |a| =√2
2
period =2π
k=
2π
3
phase shift = b = −2
3
(
Shift2
3to the left
)
From this information it follows that one period of this cosine curve begins at −2/3 and endsat −2/3 + 2π/3 = 2(π − 1)/3.
(b) We first write this function in the form y = a cos k(x− b). To do this, we factor 3 from theexpression 2πx+ 4π to get
y = −3 cos 2π (x− (−2))
Thus, we haveamplitude = |a| = | − 3| = 3
period =2π
k=
2π
2π= 1
phase shift = b = −2 (Shift 2 to the left)
From this information it follows that one period of this cosine curve begins at −2 and ends at−2 + 1 = −1.
EXAMPLE: Find the amplitude, period, phase shift and graph one complete period of thefunction
y = 2 cos
(
1
2x+ 1
)
10
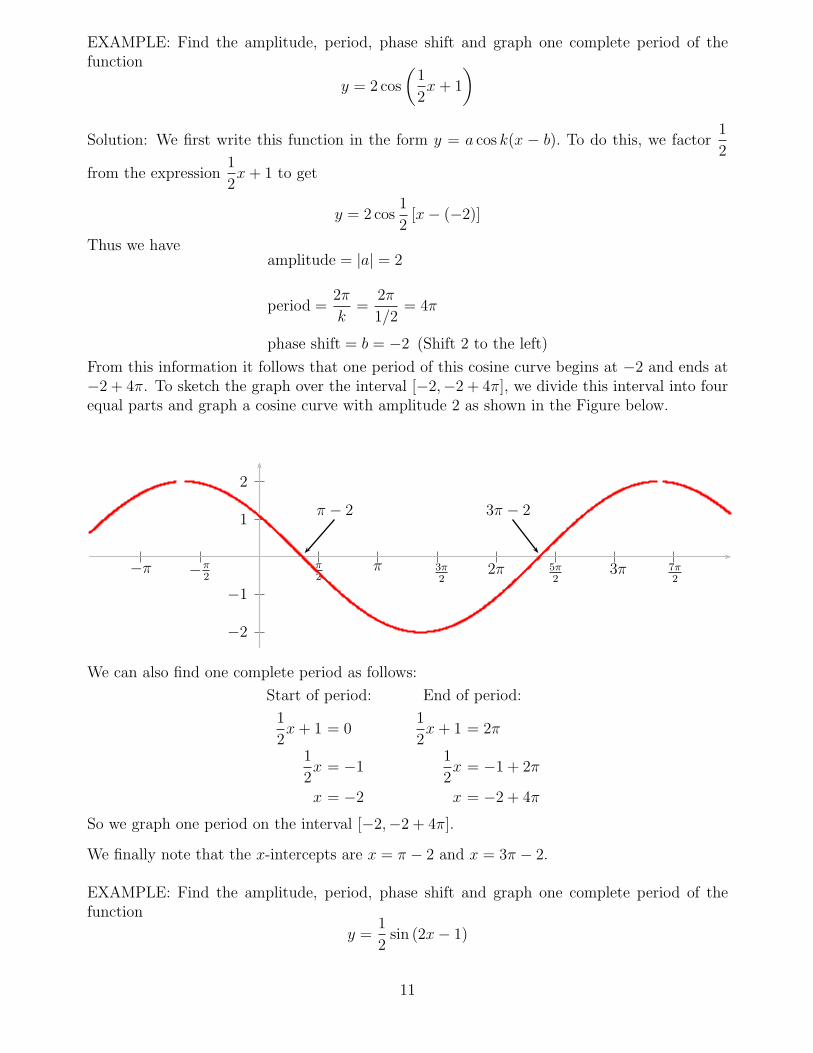
EXAMPLE: Find the amplitude, period, phase shift and graph one complete period of thefunction
y = 2 cos
(
1
2x+ 1
)
Solution: We first write this function in the form y = a cos k(x − b). To do this, we factor1
2
from the expression1
2x+ 1 to get
y = 2 cos1
2[x− (−2)]
Thus we haveamplitude = |a| = 2
period =2π
k=
2π
1/2= 4π
phase shift = b = −2 (Shift 2 to the left)
From this information it follows that one period of this cosine curve begins at −2 and ends at−2 + 4π. To sketch the graph over the interval [−2,−2 + 4π], we divide this interval into fourequal parts and graph a cosine curve with amplitude 2 as shown in the Figure below.
1
2
−1
−2
π
2−π
2
π−π 3π
22π 5π
23π 7π
2
π − 2 3π − 2
We can also find one complete period as follows:
Start of period: End of period:
1
2x+ 1 = 0
1
2x+ 1 = 2π
1
2x = −1
1
2x = −1 + 2π
x = −2 x = −2 + 4π
So we graph one period on the interval [−2,−2 + 4π].
We finally note that the x-intercepts are x = π − 2 and x = 3π − 2.
EXAMPLE: Find the amplitude, period, phase shift and graph one complete period of thefunction
y =1
2sin (2x− 1)
11
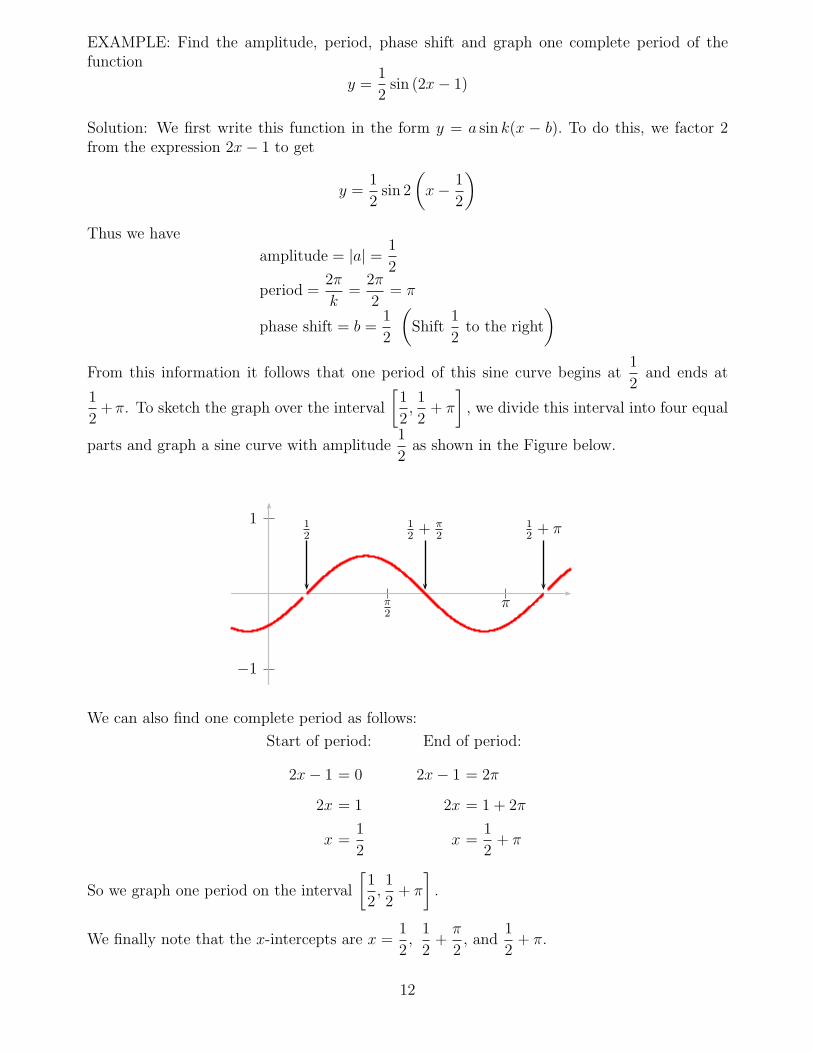
EXAMPLE: Find the amplitude, period, phase shift and graph one complete period of thefunction
y =1
2sin (2x− 1)
Solution: We first write this function in the form y = a sin k(x − b). To do this, we factor 2from the expression 2x− 1 to get
y =1
2sin 2
(
x− 1
2
)
Thus we have
amplitude = |a| = 1
2
period =2π
k=
2π
2= π
phase shift = b =1
2
(
Shift1
2to the right
)
From this information it follows that one period of this sine curve begins at1
2and ends at
1
2+π. To sketch the graph over the interval
[
1
2,1
2+ π
]
, we divide this interval into four equal
parts and graph a sine curve with amplitude1
2as shown in the Figure below.
1
−1
π
2
π
1
2
1
2+ π
2
1
2+ π
We can also find one complete period as follows:
Start of period: End of period:
2x− 1 = 0 2x− 1 = 2π
2x = 1 2x = 1 + 2π
x =1
2x =
1
2+ π
So we graph one period on the interval
[
1
2,1
2+ π
]
.
We finally note that the x-intercepts are x =1
2,1
2+
π
2, and
1
2+ π.
12