Section 5.0 Project Site Characteristics - US EPA · PROJECT SITE CHARACTERISTICS . 5.1 Land Use...
14
Section 5.0 Project Site Characteristics
Transcript of Section 5.0 Project Site Characteristics - US EPA · PROJECT SITE CHARACTERISTICS . 5.1 Land Use...
Section 5.0 Project Site Characteristics

5.0 PROJECT SITE CHARACTERISTICS
5.1 Land Use Analysis
The Project site is in the Town of Braintree, Massachusetts on the western bank of the Weymouth Fore River. The area surrounding the Project site includes a mix of industrial, commercial, urban and suburban residential land uses. Braintree is located in Norfolk County in the northeastern part of the Commonwealth of Massachusetts. The site lies approximately ten miles southeast of the City of Boston.
5.1.1 Urban/Rural Analysis
The USGS topographic quadrangle maps in the vicinity of the Project were initially used to determine whether the land-use pattern in the environs of the proposed plant is urban or rural for modeling purposes. The EPA recommended procedure in The Guideline on Air Quality Models (EPA, 1995a) was followed to determine urban/rural classification using the Auer (1977) land use technique. The land use within the total area circumscribed by a 3 km radius circle around the facility has been classified using the meteorological land use typing scheme shown in Table 5-1. If the land use types I1, I2, C1, R2 and R3 account for 50 percent or more of the area, then urban dispersion coefficients should be used. Otherwise, rural dispersion coefficients should be used in the modeling analysis.
Table 5-1 Identification and Classification of Land Use
Type Use and Structures Vegetation
I1 Heavy Industrial Major chemical, steel and fabrication industries; generally 3-5 story buildings, flat roofs
Grass and tree growth extremely rare; <5% vegetation
I2 Light-Moderate Industrial Rail yards, truck depots, warehouses, industrial parks, minor fabrications; generally 1-3 story buildings, flat roofs
Very limited grass, trees almost absent; <5% vegetation
C1 Commercial Office and apartment buildings, hotels; >10 story heights, flat roofs
Limited grass and trees; < 15% vegetation
R1 Common Residential Single family dwellings with normal easements; generally one story, pitched roof structures; frequent driveways
Abundant grass lawns and light-moderately wooded; >70% vegetation
R2 Compact Residential Single, some multiple, family dwellings with close spacing; generally <2 story, pitched roof structures; garages (via alley), no driveways
Limited lawn sizes and shade trees; < 30% vegetation
BELD Air Plan Approval.doc 5-1 Project Site Characteristics Epsilon Associates, Inc.

Table 5-1 Identification and Classification of Land Use (Continued)
Type Use and Structures Vegetation
R3 Compact Residential Old multi-family dwellings with close (<2m) lateral separation; generally 2 story, flat roof structures; garages (via alley) and ashpits, no driveways
Limited lawn sizes, old established shade trees; < 35% vegetation
R4 Estate Residential Expansive family dwellings on multi-acre tracts
Abundant grass lawns and lightly wooded; > 95% vegetation
A1 Metropolitan Natural Major municipal, state or federal parks, golf courses, cemeteries, campuses, occasional single story structures
Nearly total grass and lightly wooded; > 95% vegetation
A2 Agricultural Rural Local crops (e.g., corn, soybean); > 95% vegetation
A3 Undeveloped Uncultivated; wasteland
Mostly wild grasses and weeds, lightly wooded; > 90% vegetation
A4 Undeveloped Rural Heavily wooded; > 95% vegetation
A5 Water Surfaces Rivers, lakes
The initial land use analysis used the USGS map shading technique. Figure 5-1 shows the 3 kilometer radius around the Project and the grey shading designation on the USGS maps and identifies areas that have a building density that makes individual identification impractical. In the initial land use analysis, these shaded areas on the USGS map were designated as urban. The results of the initial analysis indicate that greater than 50 percent (51%) of the land classified around the facility is rural. The areas outlined in red hatch shading indicate urban classification based on the initial analysis using the USGS map shading technique. A large portion of the area around the proposed Project site is water (classified as “water surfaces”, “A5”), while a significant portion is residential. USGS classification does not discriminate between R1, common residential, and R2 or R3, compact residential. Therefore, to further refine the assessment of the land use classification, the Massachusetts GIS orthophoto quads and land use classification were used. The GIS land use classification is similar to the Auer classification type where the land use is divided into separate use categories. The GIS land use categories are as follows:
Commercial Pasture Forest; Woody Perennial RO; R1; R2; R3 Industrial; Mining; Waste Disposal Salt Wetland; Wetland; Water Open Land Transportation Recreation; Water Recreation Urban Open Water
BELD Air Plan Approval.doc 5-2 Project Site Characteristics Epsilon Associates, Inc.

Legend 3-Kilometer Radius
Populated Areas from USGS Map (3,600 acres)
Project Site
Scale 1:33,000 Figure 5-1 Basemap: 1984 USGS Quadrangles
1 inch = 2,750 feet Land Use Evaluation within 3 km of the Site 1,500 3,000 µ Thomas A. Watson Generating Station
Feet Braintree, Massachusetts \\Gis\system\Projects2\MA\Braintree\Braintree_Electric\Air\AirPlan_Figures\Fig5-1_land_use.mxd
0
5/3/07

Figure 5-2 shows the Massachusetts GIS land use designations for each category by color. By designating the Commercial, Industrial, and Urban Open categories as urban and the remaining categories as rural, similar to the Auer categories, the land use was recalculated. Figure 5-3 shows the resultant land use determination where pink denotes urban and green and blue denotes rural. Based on this designation, it is estimated that 86% of the land use within 3 kilometers of the facility should be classified as rural and the remaining 14% as urban for modeling purposes. Therefore, rural dispersion coefficients will be used in the air quality modeling analysis. This determination is also consistent with the urban rural determination conducted for the nearby Fore River Station located approximately 1,500 feet across the river to the north.
5.2 Topography
The topography at and immediately adjacent to the Project site is relatively flat, while the surrounding area, other than the water bodies is irregular. The base elevation of the stack will be approximately 14 feet (amsl), or 4.3 m.
To the west and south of the Project, the terrain rises irregularly away from the shoreline. West-southwest of the site in the Blue Hills Reservation, terrain elevations reach up to over 600 feet (amsl).
The nearest terrain above stack top (35m amsl) is located to the south-southwest of the site at a distance of approximately 400 meters from the Project site.
A portion of the USGS topographic map, including the site location depicting terrain in the vicinity of the proposed site, is shown in Figure 5-1.
5.3 Meteorological Data for Dispersion Modeling
The regional meteorology in Braintree is best approximated with meteorological data collected by the National Weather Service (NWS) station at Boston Logan Airport which is located approximately 10 miles to the north-northwest of the Project site at an elevation of 15 feet amsl (4.57 m). This NWS station is the closest site for which extensive meteorological data are available which are representative of similar topographic influences that affect the proposed site. Five years (2001-2005) of hourly surface data collected at the Logan Airport station include wind speed and direction, temperature, cloud cover and ceiling height.
A composite wind rose for the five years of meteorological data to be used in the modeling analysis is presented in Figure 5-4. The winds are measured at a height of 22 feet (6.7 m). The winds are predominantly from the southwest through north-westerly directions.
BELD Air Plan Approval.doc 5-4 Project Site Characteristics Epsilon Associates, Inc.

Project Site
Legend
MassGIS Land Use:
3-Kilometer Radius
Note: Land use data provided by MassGIS, last updated in 1999.
Pasture
Forest
Wetland
Mining
Open Land
Partic. Recreation
Water Recreation
Residential (R0)
Residential (R1)
Residential (R2)
Residential (R3)
Salt Wetland
Commercial
Industrial
Urban Open
Transportation
Waste Disposal
Water
Woody Perrenial
Scale 1:33,000 Figure 5-2 Basemap: 2001 MassGIS Orthophotography
1 inch = 2,750 feet MassGIS Land Use Classes 0 1,500 3,000 µ Thomas A. Watson Generating Station
Feet Braintree, Massachusetts \\Gis\system\Projects2\MA\Braintree\Braintree_Electric\Air\AirPlan_Figures\Fig5-2_land_use_MassGIS.mxd 5/3/07

Project Site
Figure 5-3 Basemap: 2001 MassGIS Orthophotography
Legend
Land Classification:
Urban - 967 acres = 14%
Water - 1,206 acres = 17%
Rural - 4,814 acres = 69%
3-Kilometer Radius
86%
Note: Land use data provided by MassGIS, and was last updated in 1999. Rural and urban classes were generalized using MassGIS's 21-category classification.
Scale 1:33,000 Refined MassGIS Land Use Analysis1 inch = 2,750 feet within 3 km of the Site 0 1,500 3,000 µ Thomas A. Watson Generating Station
Feet Braintree, Massachusetts \\Gis\system\Projects2\MA\Braintree\Braintree_Electric\Air\AirPlan_Figures\Fig5-3_land_use_refined.mxd 5/3/07

WIND ROSE PLOT: DISPLAY:
Five Year Composite Windrose (2001 to 2005) Wind Speed Boston, MA
COMMENTS:
Composite Annual Windrose from Boston, MA
Figure 5-4
Direction (blowing from)
NORTH
SOUTH
WEST EAST
3%
6%
9%
12%
15%
WIND SPEED (Knots)
>= 22
17 - 21
11 - 17
7 - 11
4 - 7
1 - 4
Calms: 2.55%
COMPANY NAME:
MODELER:
CALM WINDS:
2.55%
AVG. WIND SPEED: DATE: PROJECT NO.:
9.70 Knots 5/3/2007 1831 BELD
TOTAL COUNT:
42586 hrs.
WRPLOT View - Lakes Environmental Software

The surface data will be input along with five years of concurrent mixing height data from the NWS upper-air observations made in Gray, Maine. The Gray station is located approximately 20 miles NNE of Portland. The Portland surface temperature was used to initialize the soundings for all of the five years. These observation sites were chosen because they are the most representative stations to the Project site that has collected the necessary meteorological data of the required quality for modeling.
The AERMET (version 06431) was used to process the surface and upper air files. The upper air and surface files from the AERMET meteorological processing program will be input into AERMOD. Because of the uncertainty of whether the land use parameters (albedo, Bowen ratio, and roughness length) should be representative of the source site or the site of the meteorological data, both land assumptions were made. Two separate sets of AERMET and AERMOD runs were made for the five year data for each land use classification.
As discussed in Section 5.1, the land use around the BELD facility is considered rural, therefore one set of AERMET runs were made assuming rural or “cultivated land” assumptions. The land use at Boston’s Logan Airport is a combination of water and grasslands (i.e., runways and grass) with some dense buildings located 2-3 km to the northeast and northwest of the anemometer location. The predominant land use affecting the anemometer location is grasslands and some water. Since the grassland and water coefficients are similar, grassland coefficients were chosen for use with Logan data.
Table 5-2 lists the assumptions made in the processing of the data in AERMET, including the Bowen ratio, surface roughness lengths, and albedo.
Table 5-2 AERMET Processing Assumptions
Parameter Values Used
QA Values (Surface and Upper Air) Default
Randomizing Parameter Randomize Wind Directions
Surface Characteristic Frequency Seasonal
Wind Sector Single Wind Sector
Land-Use Cultivated Land
Site Characteristics (Surface Albedo, Bowen Ratio, Surface Roughness)
Derived from AERMET Table 4-1 thru 4-3 using cultivated land use type
Site Characteristics Season Surface Albedo1 Bowen Ratio1 Surface Roughness1
Cultivated Land (Grasslands) Winter 0.6 (0.6) 1.5 (1.5) 0.01 (0.001)
Cultivated Land (Grasslands) Spring 0.14 (0.18) 0.3 (0.4) 0.03 (0.05)
Cultivated Land (Grasslands) Summer 0.2 (0.18) 0.5 (0.8) 0.2 (0.1)
Cultivated Land (Grasslands) Autumn 0.18 (0.20) 0.7 (1.0) 0.05 (0.01)
Measurement Height 6.7 meters 1 Cultivated Land use values, Grassland values are in parenthesis
BELD Air Plan Approval.doc 5-8 Project Site Characteristics Epsilon Associates, Inc.

5.4 Background Air Quality Data
If the modeled concentrations due to emissions from the Project are above the SILs, then ambient background concentrations will be added to the plant impacts to obtain total concentrations, which, in turn, are compared to the NAAQS and MAAQS. To estimate background pollutant levels representative of the area, the most recent Air Quality Data Reports (Commonwealth of Massachusetts) prepared by the Massachusetts DEP, Division of Air Assessment Branch were reviewed. DEP guidance specifies the use of the latest three years of available monitoring data from within 10 km of the project site. Data for 2004 through 2006 were reviewed. For short-term averages (24 hours or less), the highest of the second-highest of the yearly observations will be estimated to be the background concentration, with the exception of PM2.5 24-hour where the 98th percentile concentration was used, consistent with the short-term ambient air quality standards. The short-term ambient air quality standards are not to be exceeded more than once per year. For long-term averages, the highest yearly observation will be used as the background concentration.
Background concentrations were determined from the closest available monitoring stations to the proposed facility in Boston, Lynn, and Milton. A summary of the background air quality concentrations are presented in Table 5-3.
Table 5-3 Observed Ambient Air Quality Concentrations and Selected Background Levels
Averaging Period
Sta. 20041 20051 20061 Background Level
NAAQS
SO2 (µg/m3) 3-Hour BHAR 0.025 0.032 0.019 84 1,300 24-Hour BHAR 0.016 0.019 0.012 50 365 Annual BHAR 0.0038 0.0026 0.0028 10 80
CO (ppm) 1-Hour BHAR 2.8 3.6 3.0 3.6 35 8-Hour BHAR 1.5 2.3 1.7 2.3 9
NO2 (µg/m3) Annual MILT 0.004 0.005 0.005 9.4 100 Ozone (ppm) 1-Hour BLOI 0.098 0.110 0.092 0.110 0.12
8-Hour BLOI 0.081 0.091 0.083 0.091 0.08 PM10 (µg/m3) 24-Hour BHAR 42 39 33 42 150
Annual BHAR 20.1 20.1 18.3 20 50 PM2.5 (µg/m3) 24-Hour LYNN 26 27 25 27 35
Annual LYNN 9.0 9.5 8.5 9.5 15 1. Background monitoring data for 2003, 2004, and 2005 are in ug/m3 except for CO and Ozone which are in ppm.
Monitor locations: BHAR= Boston Harrison Ave, -11 miles to the northwest; MILT = 5.5 miles to the west; BLOI = Boston Long Island – 8 miles to the north, Lynn = Lynn 17 miles to the north, BKEN= Boston Kendall Square, 12 miles to the northwest, BNS = Boston 174 North Street- 12 miles to the north.
5.4.1 Sulfur Dioxide (SO2)
The highest annual average SO2 concentration measured from 2004 to 2006 was 10.0 µg/m3 and was recorded at the Boston Harrison Avenue monitor. This concentration is 13% of the 80 µg/m3 standard. The “highest of the second-highest” 24-hour and three-hour
BELD Air Plan Approval.doc 5-9 Project Site Characteristics Epsilon Associates, Inc.

average SO2 concentrations measured over the same three-year period were 84 µg/m3 and 50 µg/m3, respectively. These concentrations were also recorded at the Boston East First Street monitor. The 24-hour concentration is approximately 14% of the 365 µg/m3
standard, while the three-hour concentration is approximately 6% of the 1,300 µg/m3
standard.
5.4.2 Carbon Monoxide (CO)
The “highest of the second-highest” one-hour average CO concentrations measured from 2004 to 2006 was 3.6 ppm, which is 10% of the 35 ppm standard and was recorded at Boston’s Harrison Avenue monitor. The “highest of the second-highest” eight-hour CO concentrations measured was 2.3 ppm, which is 26% of the 9 ppm standard.
5.4.3 Nitrogen Dioxide (NO2)
The highest annual average NO2 concentration measured from 2004 to 2006 was 9 µg/m3
recorded at Milton’s Blue Hill Observatory monitor. This concentration is 9% of the 100 µg/m3 annual standard.
5.4.4 Ozone (O3)
The EPA revoked the one-hour ozone standard on June 15, 2005, and the eight-hour ozone standard is currently in effect. All of Massachusetts is classified as “moderate” nonattainment for the eight-hour ozone standard. The “highest of the second-highest” eight-hour average ozone concentration measured from 2004 to 2006 was 0.091 ppm. This concentration is 113% of the 0.08 ppm standard and was measured at the Boston Long Island monitor. The “highest of the second-highest” one-hour concentrations measured over the same three-year period was 0.11 ppm. This concentration is 92% of the 0.12 ppm standard and was measured at the same monitor.
5.4.5 Particulates (PM10)
The highest annual average PM10 concentration measured from 2004 to 2006 was 20 µg/m3
and was recorded Boston’s Harrison Avenue monitor. This concentration is 40% of the 50 µg/m3 standard. The “highest of the second-highest” 24-hour concentrations measured over the same three-year period was 42 µg/m3 . This concentration was also recorded at the Harrison Avenue monitor. The 24-hour concentration is approximately 28% of the 150 µg/m3 standard.
5.4.6 Particulates (PM2.5)
In 1998, DEP began monitoring particulate with diameters of 2.5 micrometers or less (PM2.5). The highest annual average PM2.5 concentration measured from 2004 to 2006 was 9.5 µg/m3 at the Lynn monitor. The 98th percentile 24-hour average PM2.5 concentration
BELD Air Plan Approval.doc 5-10 Project Site Characteristics Epsilon Associates, Inc.
was 27 µg/m3 at the Lynn monitor. The annual concentration is 63% of the 15 µg/m3
standard, while the 24-hour concentration is 77% of the new 35 µg/m3 standard.
5.5 Source Data
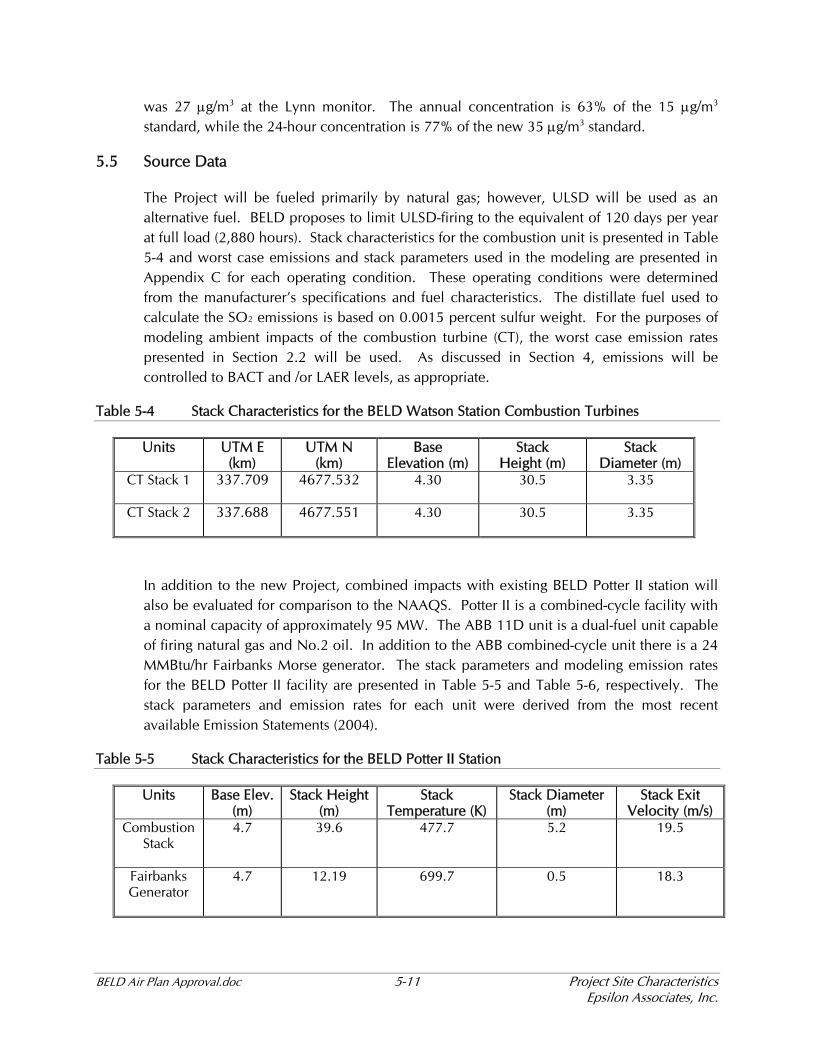
The Project will be fueled primarily by natural gas; however, ULSD will be used as an alternative fuel. BELD proposes to limit ULSD-firing to the equivalent of 120 days per year at full load (2,880 hours). Stack characteristics for the combustion unit is presented in Table 5-4 and worst case emissions and stack parameters used in the modeling are presented in Appendix C for each operating condition. These operating conditions were determined from the manufacturer’s specifications and fuel characteristics. The distillate fuel used to calculate the SO2 emissions is based on 0.0015 percent sulfur weight. For the purposes of modeling ambient impacts of the combustion turbine (CT), the worst case emission rates presented in Section 2.2 will be used. As discussed in Section 4, emissions will be controlled to BACT and /or LAER levels, as appropriate.
Table 5-4 Stack Characteristics for the BELD Watson Station Combustion Turbines
Units UTM E (km)
UTM N (km)
Base Elevation (m)
Stack Height (m)
Stack Diameter (m)
CT Stack 1 337.709 4677.532 4.30 30.5 3.35
CT Stack 2 337.688 4677.551 4.30 30.5 3.35
In addition to the new Project, combined impacts with existing BELD Potter II station will also be evaluated for comparison to the NAAQS. Potter II is a combined-cycle facility with a nominal capacity of approximately 95 MW. The ABB 11D unit is a dual-fuel unit capable of firing natural gas and No.2 oil. In addition to the ABB combined-cycle unit there is a 24 MMBtu/hr Fairbanks Morse generator. The stack parameters and modeling emission rates for the BELD Potter II facility are presented in Table 5-5 and Table 5-6, respectively. The stack parameters and emission rates for each unit were derived from the most recent available Emission Statements (2004).
Table 5-5 Stack Characteristics for the BELD Potter II Station
Units Base Elev. (m)
Stack Height (m)
Stack Temperature (K)
Stack Diameter (m)
Stack Exit Velocity (m/s)
Combustion Stack
4.7 39.6 477.7 5.2 19.5
Fairbanks Generator
4.7 12.19 699.7 0.5 18.3
BELD Air Plan Approval.doc 5-11 Project Site Characteristics Epsilon Associates, Inc.

Table 5-6 Emission Rates for the BELD Potter II Station
SourceShort-Term Emission Rates lb/hr on Gas and Oil (ULSD) NOx CO SO2 PM10/PM2.5
Combustion Stack, natural gas
firing
218.7 142.8 9.12 115.7
Combustion Stack, oil firing1
453.9 146.8 1.51 118.9
Fairbanks Generator, oil
firing
67.06 20.16 0.035 2.38
1 The oil firing emission rate reflects Potter II firing ULSD. 2 The natural gas SO2 emission rates assume a sulfur content of approximately 3 gr/ccf. This assumption is higher than that proposed for the Watson Station (0.8 gr/ccf). The Algonquin system has not reported sulfur contents greater than 0.5 gr/ccf resulting in a conservative estimate of SO2 emissions.
5.6 Good Engineering Practice Stack Height Determination
The GEP stack height evaluation of the facility has been conducted in accordance with the EPA revised Guidelines for Determination of Good Engineering Practice Stack Height (EPA, 1985). The formula, as defined by the EPA guidelines, for the GEP stack height is:
HGEP = Hb + 1.5L
where HGEP = GEP stack height,
Hb = Height of adjacent or nearby structures,
L = Lesser of height or maximum projected
width of adjacent or nearby building,
i.e., the critical dimension, and
Nearby = Within 5L of the stack from downwind (trailing edge) of the building.
There are two stacks proposed for the Project which will exhaust emissions from the combustion turbines; therefore, a GEP analysis was conducted to determine the GEP formula height for each stack to account for potential downwash from nearby structures.
A general arrangement elevation drawing of the major buildings associated with the proposed Project is presented in Appendix G. Facility grade is approximately 14 feet amsl
BELD Air Plan Approval.doc 5-12 Project Site Characteristics Epsilon Associates, Inc.

(4.3 m). Therefore, all heights shown in Appendix G for the Project are with respect to the stack base. The GEP formula was applied to each major structure associated with the Project and the nearby Potter II Station.
Application of the GEP formula to the proposed facility indicates a maximum GEP formula stack height of 61.57 m (202 feet). The 81 foot Potter II turbine building enclosure is found to be the controlling structure.
As the proposed stack height is less than the GEP formula height, building downwash effects will be considered in the air quality modeling. In addition, the EPA AERMOD PRIME downwash algorithm will be used to estimate cavity impacts which may extend beyond the facility fence-line.
BELD Air Plan Approval.doc 5-13 Project Site Characteristics Epsilon Associates, Inc.