Section 5 Law Enforcement, Courts, and Prisons · Courts, and Prisons This section presents data on...
27
Section 5 Law Enforcement, Courts, and Prisons This section presents data on crimes committed, victims of crimes, arrests, and data related to criminal violations, and the criminal justice system. The major sources of these data are the Bureau of Justice Statistics (BJS) and the Federal Bureau of Investigation (FBI). BJS issues several reports, including Sourcebook of Criminal Justice Statistics, Criminal Victimization in the United States, Prisoners in State and Federal Institutions, Children in Custody, National Survey of Courts, Census of State Correctional Facilities and Survey of Prison Inmates, Census of Jails and Survey of Jail Inmates, Parole in the United States, Capital Punishment, and the annual Expenditure and Employment Data for the Criminal Justice System. The Federal Bureau of Investigation’s major annual report is Crime in the United States, which presents data on reported crimes as gathered from State and local law enforcement agencies. Other major sources of these data include: Annual Report of the Director, Federal Court Management Statistics, Federal Offenders, and Sentences Im- posed Chart issued by the Administrative Office of the U.S. Courts; Governmental Finances and Public Employment, issued annually by the Bureau of the Census; and the Statistical Report, issued annually by the Federal Bureau of Prisons. Legal jurisdiction and law enforce- ment.—Law enforcement is, for the most part, a function of State and local officers and agencies. The U.S. Constitu- tion reserves general police powers to the States. By act of Congress, Federal offenses include only offenses against the U.S. Government and against or by its employees while engaged in their offi- cial duties, and offenses which involve the crossing of State lines or an interfer- ence with interstate commerce. Exclud- ing the military, there are 52 separate criminal law jurisdictions in the United States: 1 in each of the 50 States, 1 in the District of Columbia, and the Federal jurisdiction. Each of these has its own criminal law and procedure and its own In Brief Crime rate, as reported by the FBI, fell again from 5,660 per 100,000 population in 1992 to 5,438 in 1993 Among the Nation’s 23,271 murder victims in 1993, there were 2,697 victims under 18 years old. Over 1 million child victims in cases of substantiated abuse and neglect in 1993 law enforcement agencies. While the systems of law enforcement are quite similar among the States, there are often substantial differences in the penalties for like offenses. Law enforcement can be divided into three parts: Investigation of crimes and arrests of persons suspected of commit- ting them; prosecution of those charged with crime; and the punishment or treat- ment of persons convicted of crime. Crime.—There are two major ap- proaches taken in determining the extent of crime. One perspective is provided by the FBI through its Uniform Crime Re- porting Program (UCR). The FBI re- ceives monthly and annual reports from law enforcement agencies throughout the country, currently representing 98 percent of the national population. Each month, city police, sheriffs, and State police file reports on the number of index offenses that become known to them. The FBI Crime Index offenses are as fol- lows: Murder and nonnegligent man- slaughter, is based on police investiga- tions, as opposed to the determination of a medical examiner or judicial body, in- cludes willful felonious homicides, and excludes attempts and assaults to kill, suicides, accidental deaths, justifiable homicides, and deaths caused by negli- gence; forcible rape includes forcible rapes and attempts; robbery includes stealing or taking anything of value by force or violence or threat of force or violence and includes attempted robbery; aggravated assault includes assault with
Transcript of Section 5 Law Enforcement, Courts, and Prisons · Courts, and Prisons This section presents data on...

Section 5
Law Enforcement,Courts, and Prisons
This section presents data on crimescommitted, victims of crimes, arrests,and data related to criminal violations,and the criminal justice system. The major sources of these data are the Bureau of Justice Statistics (BJS) andthe Federal Bureau of Investigation(FBI). BJS issues several reports, including Sourcebook of Criminal JusticeStatistics, Criminal Victimization in theUnited States, Prisoners in State andFederal Institutions, Children in Custody,National Survey of Courts, Census ofState Correctional Facilities and Surveyof Prison Inmates, Census of Jails andSurvey of Jail Inmates, Parole in theUnited States, Capital Punishment, andthe annual Expenditure and EmploymentData for the Criminal Justice System.The Federal Bureau of Investigation’smajor annual report is Crime in theUnited States, which presents data onreported crimes as gathered from Stateand local law enforcement agencies.
Other major sources of these data include: Annual Report of the Director,Federal Court Management Statistics, Federal Offenders, and Sentences Im-posed Chart issued by the AdministrativeOffice of the U.S. Courts; GovernmentalFinances and Public Employment, issuedannually by the Bureau of the Census; andthe Statistical Report, issued annually bythe Federal Bureau of Prisons.
Legal jurisdiction and law enforce-ment. —Law enforcement is, for the most part, a function of State and localofficers and agencies. The U.S. Constitu-tion reserves general police powers tothe States. By act of Congress, Federaloffenses include only offenses againstthe U.S. Government and against or byits employees while engaged in their offi-cial duties, and offenses which involvethe crossing of State lines or an interfer-ence with interstate commerce. Exclud-ing the military, there are 52 separatecriminal law jurisdictions in the UnitedStates: 1 in each of the 50 States, 1 inthe District of Columbia, and the Federaljurisdiction. Each of these has its owncriminal law and procedure and its own
In BriefCrime rate, as reported by the FBI,fell again from 5,660 per 100,000population in 1992 to 5,438 in 1993Among the Nation’s 23,271 murdervictims in 1993, there were 2,697victims under 18 years old.Over 1 million child victims in casesof substantiated abuse and neglectin 1993
law enforcement agencies. While thesystems of law enforcement are quitesimilar among the States, there are oftensubstantial differences in the penaltiesfor like offenses.
Law enforcement can be divided intothree parts: Investigation of crimes andarrests of persons suspected of commit-ting them; prosecution of those chargedwith crime; and the punishment or treat-ment of persons convicted of crime.
Crime. —There are two major ap-proaches taken in determining the extentof crime. One perspective is provided bythe FBI through its Uniform Crime Re-porting Program (UCR). The FBI re-ceives monthly and annual reports fromlaw enforcement agencies throughoutthe country, currently representing 98percent of the national population. Eachmonth, city police, sheriffs, and State police file reports on the number of indexoffenses that become known to them.The FBI Crime Index offenses are as fol-lows: Murder and nonnegligent man-slaughter, is based on police investiga-tions, as opposed to the determination ofa medical examiner or judicial body, in-cludes willful felonious homicides, andexcludes attempts and assaults to kill,suicides, accidental deaths, justifiablehomicides, and deaths caused by negli-gence; forcible rape includes forciblerapes and attempts; robbery includesstealing or taking anything of value byforce or violence or threat of force or violence and includes attempted robbery;aggravated assault includes assault with

196 Law Enforcement, Courts, and Prisons
intent to kill; burglary includes any unlaw-ful entry to commit a felony or a theft andincludes attempted burglary and burglaryfollowed by larceny; larceny includestheft of property or articles of value with-out use of force and violence or fraudand excludes embezzlement, “congames,” forgery, etc.; motor vehicle theftincludes all cases where vehicles aredriven away and abandoned, but ex-cludes vehicles taken for temporary useand returned by the taker. Arson wasadded as the eighth Index offense inApril 1979 following a Congressionalmandate. Arson includes any willful ormalicious burning or attempt to burn withor without intent to defraud, a dwellinghouse, public building, motor vehicle oraircraft, personal property of another, etc.The monthly Uniform Crime Reports alsocontain data on crimes cleared by arrestand on characteristics of persons ar-rested for all criminal offenses. In sum-marizing and publishing crime data, theFBI depends primarily on the adherenceto the established standards of reportingfor statistical accuracy, presenting thedata as information useful to personsconcerned with the problem of crime andcriminal-law enforcement.
National Crime Victimization Survey(NCVS).—A second perspective on crimeis provided by this survey (formerly the Na-tional Crime Survey until August 1991) ofthe Bureau of Justice Statistics. Detailsabout the crimes come directly from thevictims. No attempt is made to validate theinformation against police records or anyother source. The NCVS measures rape,robbery, assault, household and personallarceny, burglary, and motor vehicle theft.The NCVS includes offenses reported tothe police, as well as those not reported.Police reporting rates (percent of victimiza-tions) varied by type of crime. In 1991, forinstance, 59 percent of the rapes were re-ported; 55 percent of the robberies; 47 per-cent of assaults; 28 percent of personallarcenies without contact; 50 percent of thehousehold burglaries; and 74 percent ofmotor vehicle thefts.
Murder and kidnaping are not covered.Commercial burglary and robbery weredropped from the program during 1977.The so-called victimless crimes, such asdrunkenness, drug abuse, and prostitution,also are excluded, as are crimes for which
it is difficult to identify knowledgeable re-spondents or to locate data records.
Crimes of which the victim may not beaware also cannot be measured effec-tively. Buying stolen property may fall intothis category, as may some instances ofembezzlement. Attempted crimes ofmany types probably are under recordedfor this reason. Events in which the vic-tim has shown a willingness to partici-pate in illegal activity also are excluded.
In any encounter involving a personalcrime, more than one criminal act can becommitted against an individual. For ex-ample; a rape may be associated with arobbery; or a household offense, such asa burglary, can escalate into somethingmore serious in the event of a personalconfrontation. In classifying the survey-measured crimes, each criminal incidenthas been counted only once—by themost serious act that took place duringthe incident and ranked in accordancewith the seriousness classification sys-tem used by the Federal Bureau of In-vestigation. The order of seriousness forcrimes against persons is as follows:Rape, robbery, assault, and larceny.Consequently, if a person were bothrobbed and assaulted, the event wouldbe classified as robbery; if the victim suf-fered physical harm, the crime would becategorized as robbery with injury. Per-sonal crimes take precedence overhousehold offenses.
A victimization, basic measure of the oc-currence of a crime, is a specific criminalact as it affects a single victim. The num-ber of victimizations is determined by thenumber of victims of such acts. Victimiza-tion counts serve as key elements incomputing rates of victimization. Forcrimes against persons, the rates arebased on the total number of individualsage 12 and over or on a portion of thatpopulation sharing a particular character-istic or set of traits. As general indicatorsof the danger of having been victimizedduring the reference period, the rates arenot sufficiently refined to represent truemeasures of risk for specific individualsor households.
An incident is a specific criminal act in-volving one or more victims; therefore,the number of incidents of personalcrimes lower than that of victimizations.

197Law Enforcement, Courts, and Prisons
Courts. —Statistics on criminal offensesand the outcome of prosecutions are in-complete for the country as a whole, although data are available for manyStates individually. The only nationalcompilations of such statistics weremade by the Bureau of the Census for1932 to 1945 covering a maximum of 32 States, and by the Bureau of Justice Statistics for 1986, 1988, 1990, and 1992based on a nationally representativesample survey.
The bulk of civil and criminal litigation inthe country is commenced and deter-mined in the various State courts. Onlywhen the U.S. Constitution and acts ofCongress specifically confer jurisdictionupon the Federal courts may civil litiga-tion be heard and decided by them. Generally, the Federal courts have juris-diction over the following types of cases:Suits or proceedings by or against theUnited States; civil actions between pri-vate parties arising under the Constitu-tion, laws, or treaties of the UnitedStates; civil actions between private liti-gants who are citizens of different States;civil cases involving admiralty, maritime,or prize jurisdiction; and all matters inbankruptcy.
There are several types of courts withvarying degrees of legal jurisdiction.These jurisdictions include original, ap-pellate, general, and limited or special. Acourt of original jurisdiction is one havingthe authority initially to try a case andpass judgment on the law and the facts;a court of appellate jurisdiction is onewith the legal authority to review casesand hear appeals; a court of general ju-risdiction is a trial court of unlimited origi-nal jurisdiction in civil and/or criminalcases, also called a “major trial court”; acourt of limited or special jurisdiction is atrial court with legal authority over only aparticular class of cases, such as pro-bate, juvenile, or traffic cases.
The 94 Federal courts of original jurisdic-tion are known as the U.S. district courts.One or more of these courts is estab-lished in every State and one each in theDistrict of Columbia, Puerto Rico, the Vir-gin Islands, the Northern Mariana Is-lands, and Guam. Appeals from the dis-trict courts are taken to intermediate
appellate courts of which there are 13,known as U.S. courts of appeals and theUnited States Court of Appeals for theFederal Circuit. The Supreme Court ofthe United States is the final and highestappellate court in the Federal system ofcourts.
Juvenile offenders. —For statistical pur-poses, the FBI and most States classifyas juvenile offenders persons under theage of 18 years who have committed acrime or crimes.
Delinquency cases are all cases ofyouths referred to a juvenile court forviolation of a law or ordinance or for seri-ously “antisocial” conduct. Several typesof facilities are available for those adjudi-cated delinquent, ranging from the short-term physically unrestricted environmentto the long-term very restrictive atmo-sphere.
Prisoners. —Data on prisoners in Federaland State prisons and reformatories werecollected annually by the Bureau of theCensus until 1950, by the Federal Bureauof Prisons until 1971, transferred then tothe Law Enforcement Assistance Adminis-tration, and, in 1979, to the Bureau of Jus-tice Statistics. Adults convicted of criminalactivity may be given a prison or jail sen-tence. A prison is a confinement facilityhaving custodial authority over adults sen-tenced to confinement of more than oneyear. A jail is a facility, usually operated bya local law enforcement agency, holdingpersons detained pending adjudicationand/or persons committed after adjudica-tion to one year or less. Nearly every Statepublishes annual data either for its wholeprison system or for each separate Stateinstitution.
Statistical reliability. —For discussion ofstatistical collection, estimation, andsampling procedures and measures ofstatistical reliability pertaining to the Na-tional Crime Victimization Survey andUniform Crime Reporting Program, seeAppendix III.
Historical statistics. —Tabular head-notes provide cross-references, whereapplicable, to Historical Statistics of theUnited States, Colonial Times to 1970.See Appendix IV.
1980 1982 1984 1986 1988 1990 1992 1994
Burglary
0
100
200
300
400
500
1980 1982 1984 1986 1988 1990 1992 1994
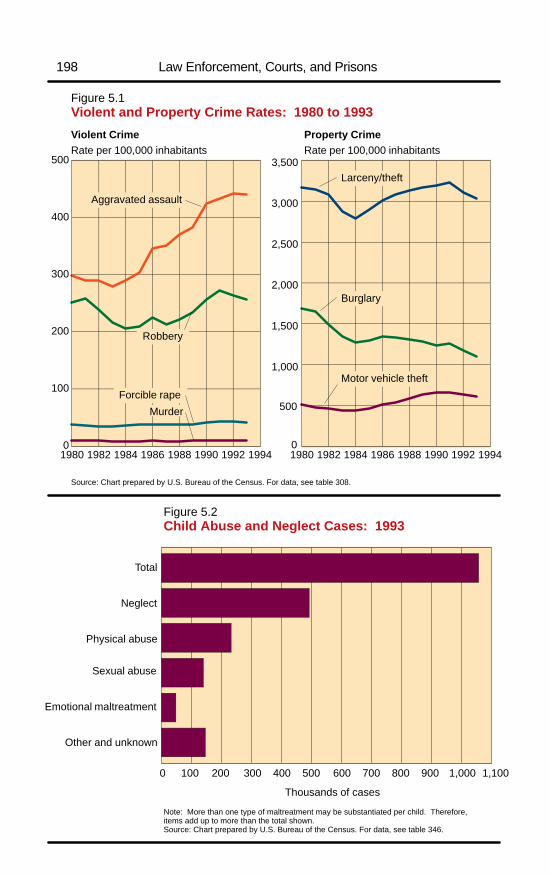
Figure 5.1Violent and Property Crime Rates: 1980 to 1993
Source: Chart prepared by U.S. Bureau of the Census. For data, see table 308.
Property CrimeRate per 100,000 inhabitants
Aggravated assault
Robbery
Larceny/theft
Violent CrimeRate per 100,000 inhabitants
Motor vehicle theft
Forcible rape
Note: More than one type of maltreatment may be substantiated per child. Therefore,items add up to more than the total shown.Source: Chart prepared by U.S. Bureau of the Census. For data, see table 346.
Figure 5.2Child Abuse and Neglect Cases: 1993
198 Law Enforcement, Courts, and Prisons
Murder
Thousands of cases
Neglect
Total
Physical abuse
Sexual abuse
Emotional maltreatment
Other and unknown
0 100 200 300 400 500 600 700 800 900 1,000
0
500
1,000
1,500
2,000
2,500
3,000
3,500
1,100

No. 308. Crimes and Crime Rates, by Type: 1983 to 1993
[Data refer to offenses known to the police. Rates are based on Bureau of the Census estimated resident population as ofJuly 1, 1980 and 1990, enumerated as of April 1. See source for details. Minus sign (-) indicates decrease. For definitions of crimes,see text, section 5. See Historical Statistics, Colonial Times to 1970, series H 952-961 for related data]
ITEM AND YEAR Total
VIOLENT CRIME PROPERTY CRIME
Total Mur-der 1
Forciblerape
Rob-bery
Aggra-vatedassault
Total Bur-glary
Larce-ny—theft
Motorvehicletheft
Number of offenses (1,000):1983 . . . . . . . . . . . . . . . 12,109 1,258 19.3 78.9 507 653 10,851 3,130 6,713 1,0081984 . . . . . . . . . . . . . . . 11,882 1,273 18.7 84.2 485 685 10,609 2,984 6,592 1,0321985 . . . . . . . . . . . . . . . 12,431 1,329 19.0 88.7 498 723 11,103 3,073 6,926 1,1031986 . . . . . . . . . . . . . . . 13,212 1,489 20.6 91.5 543 834 11,723 3,241 7,257 1,2241987 . . . . . . . . . . . . . . . 13,509 1,484 20.1 91.1 518 855 12,025 3,236 7,500 1,2891988 . . . . . . . . . . . . . . . 13,923 1,566 20.7 92.5 543 910 12,357 3,218 7,706 1,4331989 . . . . . . . . . . . . . . . 14,251 1,646 21.5 94.5 578 952 12,605 3,168 7,872 1,5651990 . . . . . . . . . . . . . . . 14,476 1,820 23.4 102.6 639 1,055 12,656 3,074 7,946 1,6361991 . . . . . . . . . . . . . . . 14,873 1,912 24.7 106.6 688 1,093 12,961 3,157 8,142 1,6621992 . . . . . . . . . . . . . . . 14,438 1,932 23.8 109.1 672 1,127 12,506 2,980 7,915 1,6111993 . . . . . . . . . . . . . . . 14,141 1,924 24.5 105.0 660 1,135 12,217 2,835 7,821 1,561
Percent change, number ofoffenses:1983 to 1993 . . . . . . . . . 16.8 52.9 26.9 33.1 30.2 73.8 12.6 -9.4 16.5 54.91991 to 1992 . . . . . . . . . -3.0 1.0 -3.8 2.3 -2.4 3.0 -3.6 -5.9 -2.9 -3.21992 to 1993 . . . . . . . . . -2.1 -0.4 2.9 -3.9 -1.8 0.7 -2.4 -5.1 -1.2 -3.2
Rate per 100,000 population:1983 . . . . . . . . . . . . . . . 5,175 538 8.3 33.7 217 279 4,637 1,338 2,869 4311984 . . . . . . . . . . . . . . . 5,031 539 7.9 35.7 205 290 4,492 1,264 2,791 4371985 . . . . . . . . . . . . . . . 5,207 557 7.9 37.1 209 303 4,651 1,287 2,901 4621986 . . . . . . . . . . . . . . . 5,480 618 8.6 37.9 225 346 4,863 1,345 3,010 5081987 . . . . . . . . . . . . . . . 5,550 610 8.3 37.4 213 351 4,940 1,330 3,081 5291988 . . . . . . . . . . . . . . . 5,664 637 8.4 37.6 221 370 5,027 1,309 3,135 5831989 . . . . . . . . . . . . . . . 5,741 663 8.7 38.1 233 383 5,078 1,276 3,171 6301990 . . . . . . . . . . . . . . . 5,820 732 9.4 41.2 257 424 5,089 1,236 3,195 6581991 . . . . . . . . . . . . . . . 5,898 758 9.8 42.3 273 433 5,140 1,252 3,229 6591992 . . . . . . . . . . . . . . . 5,660 758 9.3 42.8 264 442 4,903 1,168 3,103 6311993 . . . . . . . . . . . . . . . 5,483 746 9.5 40.6 256 440 4,737 1,099 3,032 605
Percent change, rate per100,000 population:1983 to 1993 . . . . . . . . . 6.0 38.7 14.5 20.5 18.0 57.7 2.2 -17.9 5.7 40.41991 to 1992 . . . . . . . . . -4.2 - -5.4 1.2 -3.3 2.0 -4.8 -7.2 -4.1 -4.41992 to 1993 . . . . . . . . . -3.2 -1.6 2.1 -5.4 -3.1 -0.5 -3.5 -6.3 -2.3 -4.3
- Represents or rounds to zero. 1 Includes nonnegligent manslaughter.
Source: U.S. Federal Bureau of Investigation, Crime in the United States, annual.
No. 309. Crimes and Crime Rates, by Type and Area: 1993
[In thousands, except rate. Rate per 100,000 population; see headnote, table 308. Estimated totals based on reports fromcity and rural law enforcement agencies representing 96 percent of the national population. For definitions of crimes, see text,section 5]
TYPE OF CRIMEUNITED STATES METROPOLITAN
AREAS 1 OTHER CITIES RURAL AREAS
Total Rate Total Rate Total Rate Total Rate
Total . . . . . . . . . . . . . . . . . . . . . . . 14,141 5,483 12,390 6,045 1,126 5,303 625 1,971
Violent crime . . . . . . . . . . . . . . . . . . . . . 1,924 746 1,747 852 107 504 71 222Murder and nonnegligentmanslaughter . . . . . . . . . . . . . . . . . . 25 10 22 11 1 5 2 5Forcible rape . . . . . . . . . . . . . . . . . . . 105 41 89 43 8 39 8 25Robbery . . . . . . . . . . . . . . . . . . . . . . 660 256 639 312 15 71 5 16Aggravated assault . . . . . . . . . . . . . . . 1,135 440 997 486 83 389 56 176
Property crime . . . . . . . . . . . . . . . . . . . . 12,217 4,737 10,643 5,193 1,019 4,799 555 1,749Burglary . . . . . . . . . . . . . . . . . . . . . . 2,835 1,099 2,423 1,182 211 993 201 633Larceny—theft . . . . . . . . . . . . . . . . . . 7,821 3,032 6,741 3,289 761 3,582 319 1,006Motor vehicle theft . . . . . . . . . . . . . . . 1,561 605 1,479 721 48 224 35 110
1 For definition, see Appendix II.
Source: U.S. Federal Bureau of Investigation, Crime in the United States, annual.
Crimes by Type 199

No. 310. Crime Rates, by State, 1991 to 1993, and by Type, 1993
[Offenses known to the police per 100,000 population. Based on Bureau of the Census estimated resident populationas of July 1. For definitions of crimes, see text, section 5]
REGION, DIVISION,AND STATE
1991,total
1992,total
1993
Total
Violent crime Property crime
Total Mur-der 1
Forci-blerape
Rob-bery
Aggra-vatedassault
Total Bur-glary
Larce-ny—theft
Motorvehi-cletheft
United States . . . . 5,898 5,660 5,483 746 9.5 40.6 256 440 4,737 1,099 3,032 605
Northeast . . . . . . . . . . . . 5,155 4,837 4,613 713 8.2 28.4 323 354 3,900 878 2,358 664New England . . . . . . . . 4,950 4,614 4,431 538 4.1 31.4 141 361 3,894 925 2,366 602Maine . . . . . . . . . . . 3,768 3,524 3,154 126 1.6 26.6 21 76 3,028 719 2,175 134New Hampshire . . . . . 3,448 3,081 2,905 138 2.0 44.4 27 64 2,767 515 2,058 194Vermont . . . . . . . . . . 3,955 3,410 3,972 114 3.6 39.8 9 62 3,858 874 2,851 133Massachusetts . . . . . 5,322 5,003 4,894 805 3.9 33.4 176 592 4,089 1,002 2,271 816Rhode Island. . . . . . . 5,039 4,578 4,499 402 3.9 28.6 101 268 4,097 1,041 2,410 646Connecticut. . . . . . . . 5,364 5,053 4,560 456 6.3 24.4 197 229 4,194 978 2,621 596
Middle Atlantic . . . . . . 5,227 4,914 4,676 774 9.6 27.3 386 351 3,902 862 2,355 685New York . . . . . . . . . 6,245 5,858 5,551 1,074 13.3 27.5 561 472 4,478 999 2,644 835New Jersey. . . . . . . . 5,431 5,064 4,801 627 5.3 28.1 296 298 4,174 974 2,486 714Pennsylvania. . . . . . . 3,559 3,393 3,271 418 6.8 26.5 179 205 2,854 582 1,832 440
Midwest . . . . . . . . . . . . . 5,257 4,975 4,806 602 7.6 42.3 204 348 4,204 900 2,850 454East North Central . . . . 5,482 5,136 4,953 661 8.3 45.9 235 372 4,292 910 2,883 499Ohio . . . . . . . . . . . . 5,033 4,666 4,485 504 6.0 49.1 193 256 3,981 878 2,668 435Indiana. . . . . . . . . . . 4,818 4,687 4,465 489 7.5 39.1 120 323 3,976 852 2,696 428Illinois 2 . . . . . . . . . . 6,132 5,765 5,618 960 11.4 34.6 381 533 4,658 1,016 3,084 559Michigan . . . . . . . . . 6,138 5,611 5,453 792 9.8 71.1 239 472 4,661 983 3,063 615Wisconsin. . . . . . . . . 4,466 4,319 4,054 264 4.4 25.2 113 121 3,790 663 2,762 365
West North Central . . . 4,722 4,594 4,454 459 5.9 33.8 130 290 3,995 875 2,773 347Minnesota. . . . . . . . . 4,496 4,591 4,386 327 3.4 35.2 113 176 4,059 845 2,872 343Iowa 3 . . . . . . . . . . . 4,134 3,957 3,846 326 2.3 24.4 54 245 3,521 731 2,599 191Missouri . . . . . . . . . . 5,416 5,097 5,095 744 11.3 36.2 242 455 4,351 1,026 2,778 548North Dakota. . . . . . . 2,794 2,903 2,820 82 1.7 23.5 8 49 2,738 373 2,216 149South Dakota . . . . . . 3,079 2,999 2,958 208 3.4 44.5 15 146 2,750 549 2,086 115Nebraska . . . . . . . . . 4,354 4,324 4,117 339 3.9 27.8 55 252 3,778 664 2,913 202Kansas . . . . . . . . . . 5,534 5,320 4,975 496 6.4 40.1 124 326 4,479 1,132 3,024 323
South . . . . . . . . . . . . . . . 6,417 6,155 5,983 802 11.3 45.2 236 510 5,181 1,286 3,339 557South Atlantic . . . . . . . 6,585 6,428 6,334 872 10.8 42.8 276 542 5,462 1,362 3,528 573Delaware . . . . . . . . . 5,869 4,848 4,872 686 5.0 77.0 187 417 4,186 892 2,979 315Maryland . . . . . . . . . 6,209 6,225 6,107 998 12.7 44.0 435 506 5,109 1,133 3,293 683District of Columbia 4 . 10,768 11,407 11,761 2,922 78.5 56.1 1,230 1,558 8,839 1,996 5,449 1,395Virginia. . . . . . . . . . . 4,607 4,299 4,116 372 8.3 32.1 142 190 3,743 668 2,790 286West Virginia. . . . . . . 2,663 2,610 2,533 208 6.9 20.1 43 139 2,324 599 1,564 162North Carolina . . . . . . 5,889 5,802 5,652 679 11.3 34.3 192 441 4,973 1,516 3,169 289South Carolina . . . . . 6,179 5,893 5,903 1,023 10.3 52.3 187 773 4,880 1,309 3,227 344Georgia . . . . . . . . . . 6,493 6,405 6,193 723 11.4 35.4 248 428 5,470 1,307 3,569 594Florida . . . . . . . . . . . 8,547 8,358 8,351 1,206 8.9 53.8 358 786 7,145 1,835 4,414 896
East South Central . . . . 4,687 4,589 4,528 641 10.3 41.0 159 431 3,888 1,068 2,429 390Kentucky . . . . . . . . . 3,358 3,324 3,260 463 6.6 34.3 90 331 2,797 740 1,841 216Tennessee . . . . . . . . 5,367 5,136 5,240 766 10.2 49.9 220 486 4,474 1,183 2,700 591Alabama. . . . . . . . . . 5,366 5,268 4,879 780 11.6 35.1 160 574 4,098 1,089 2,672 338Mississippi . . . . . . . . 4,221 4,282 4,418 434 13.5 42.6 139 238 3,984 1,286 2,364 335
West South Central . . . 7,118 6,589 6,228 779 12.7 51.3 213 502 5,449 1,284 3,542 624Arkansas . . . . . . . . . 5,175 4,762 4,811 593 10.2 42.4 125 416 4,218 1,099 2,796 323Louisiana . . . . . . . . . 6,425 6,546 6,847 1,062 20.3 42.3 284 715 5,785 1,368 3,803 614Oklahoma. . . . . . . . . 5,669 5,432 5,294 635 8.4 49.3 122 455 4,659 1,235 2,944 481Texas. . . . . . . . . . . . 7,819 7,058 6,439 762 11.9 55.0 224 471 5,677 1,297 3,687 692
West . . . . . . . . . . . . . . . 6,478 6,388 6,220 845 9.9 42.9 283 509 5,375 1,222 3,360 794Mountain . . . . . . . . . . . 6,125 6,012 5,929 589 6.4 43.5 130 410 5,340 1,117 3,708 516Montana. . . . . . . . . . 3,648 4,596 4,790 178 3.0 27.9 32 114 4,613 714 3,652 246Idaho . . . . . . . . . . . . 4,196 3,996 3,845 282 2.9 35.3 17 227 3,563 669 2,711 183Wyoming . . . . . . . . . 4,389 4,575 4,163 286 3.4 34.3 17 231 3,877 643 3,079 155Colorado . . . . . . . . . 6,074 5,959 5,527 567 5.8 45.8 117 399 4,960 1,010 3,499 450New Mexico . . . . . . . 6,679 6,434 6,266 930 8.0 52.1 138 731 5,336 1,421 3,510 405Arizona . . . . . . . . . . 7,406 7,029 7,432 715 8.6 37.8 163 506 6,717 1,466 4,387 864Utah . . . . . . . . . . . . 5,608 5,659 5,237 301 3.1 44.6 59 195 4,936 791 3,903 242Nevada . . . . . . . . . . 6,299 6,204 6,180 875 10.4 60.9 340 464 5,305 1,245 3,322 738
Pacific . . . . . . . . . . . . 6,602 6,521 6,324 936 11.2 42.6 338 544 5,388 1,259 3,235 894Washington. . . . . . . . 6,304 6,173 5,952 515 5.2 64.4 137 308 5,438 1,067 3,914 456Oregon . . . . . . . . . . 5,755 5,821 5,766 503 4.6 51.3 130 318 5,263 1,025 3,657 581California . . . . . . . . . 6,773 6,679 6,457 1,078 13.1 37.7 405 622 5,379 1,327 3,029 1,023Alaska . . . . . . . . . . . 5,702 5,570 5,568 761 9.0 83.8 122 546 4,807 817 3,539 451Hawaii . . . . . . . . . . . 5,970 6,112 6,277 261 3.8 33.6 104 120 6,016 1,136 4,429 451
1 Includes nonnegligent manslaughter. 2 Forcible rape figures for 1991 to 1993 were estimated using the national rate offorcible rapes when grouped by like agencies as figures submitted were not in accordance with national Uniform Crime Reportingprogram guidelines. 3 Data for 1991 were not available; therefore, data presented are estimates. 4 Includes offenses reportedby the police at the National Zoo.
Source: U.S. Federal Bureau of Investigation, Crime in the United States, annual.
Law Enforcement, Courts, and Prisons200

No. 311. Crime Rates, by Type—Selected Large Cities: 1993
[Offenses known to the police per 100,000 population. Based on Bureau of the Census estimated resident populationas of July 1. For definitions of crimes, see text, section 5]
CITY RANKED BYPOPULATION SIZE,
1992 1
Crimeindex,total
VIOLENT CRIME PROPERTY CRIME
Total Mur-der
Forci-blerape
Rob-bery
Aggra-vatedassault
Total Bur-glary
Larce-ny—theft
Motorvehicletheft
New York, NY . . . . . . . . 8,171 2,090 26.5 38.4 1,171 854 6,081 1,350 3,200 1,531Los Angeles, CA . . . . . . 8,873 2,374 30.5 50.3 1,090 1,204 6,498 1,425 3,378 1,695Chicago, IL . . . . . . . . . . (2) (2) 30.3 (2) 1,262 1,425 7,437 1,637 4,350 1,450Houston, TX . . . . . . . . . 8,188 1,454 25.9 64.3 625 739 6,734 1,567 3,571 1,596Philadelphia, PA. . . . . . . 6,262 1,255 28.1 50.3 739 437 5,007 969 2,512 1,525San Diego, CA. . . . . . . . 7,343 1,160 11.5 34.1 401 714 6,183 1,257 3,262 1,665Dallas, TX. . . . . . . . . . . 10,627 1,743 30.4 95.9 712 905 8,884 2,012 5,197 1,675Phoenix, AZ . . . . . . . . . 9,282 1,146 15.2 42.7 331 757 8,136 1,984 4,655 1,498Detroit, MI. . . . . . . . . . . (2) (2) 56.8 (2) 1,332 1,274 9,212 2,264 4,198 2,751San Antonio, TX. . . . . . . 9,911 682 22.3 56.1 302 302 9,229 1,813 6,219 1,197San Jose, CA . . . . . . . . 4,539 657 5.1 48.3 147 457 3,882 743 2,643 496Indianapolis, IN . . . . . . . 8,877 1,666 18.0 136.9 543 968 7,211 2,020 3,808 1,384San Francisco, CA . . . . . 9,524 1,815 17.5 49.0 1,148 600 7,709 1,515 4,693 1,501Baltimore, MD . . . . . . . . 12,541 2,994 48.2 91.1 1,689 1,166 9,547 2,442 5,655 1,449Jacksonville, FL . . . . . . . 10,042 1,698 18.6 104.0 536 1,040 8,344 2,250 4,750 1,344Columbus, OH. . . . . . . . 8,706 1,105 16.2 101.7 601 386 7,601 2,018 4,491 1,093Milwaukee, WI . . . . . . . . 8,094 965 25.2 68.0 646 226 7,128 1,324 4,101 1,704Memphis, TN. . . . . . . . . 10,041 1,634 32.0 117.1 867 618 8,407 2,474 3,786 2,147Washington, DC. . . . . . . 11,755 2,922 78.5 56.1 1,230 1,558 8,834 1,995 5,444 1,395Boston, MA . . . . . . . . . . 10,030 1,958 17.7 86.7 737 1,117 8,073 1,441 4,477 2,154El Paso, TX. . . . . . . . . . 8,429 1,102 8.5 50.7 282 761 7,327 1,018 5,309 1,000Seattle, WA. . . . . . . . . . 11,798 1,400 12.6 67.0 503 818 10,398 1,741 7,374 1,284Cleveland, OH . . . . . . . . 7,910 1,643 33.0 164.9 850 596 6,267 1,588 2,668 2,011Nashville-Davidson, TN . . 10,805 1,784 16.9 112.3 527 1,127 9,021 1,781 6,319 921Austin, TX. . . . . . . . . . . 10,252 600 7.4 54.0 310 229 9,652 1,684 7,101 868New Orleans, LA . . . . . . 10,735 2,039 80.3 60.6 1,054 845 8,696 2,275 4,479 1,942Denver, CO. . . . . . . . . . 7,985 1,054 14.8 78.9 374 586 6,931 1,832 3,583 1,516Fort Worth, TX. . . . . . . . 10,748 1,506 28.7 109.4 594 775 9,241 2,267 5,678 1,296Oklahoma City, OK. . . . . 11,222 1,417 17.5 112.6 377 910 9,806 2,186 6,409 1,211Portland, OR . . . . . . . . . 11,380 1,857 12.8 105.3 507 1,232 9,523 1,725 5,939 1,860Long Beach, CA . . . . . . 8,038 1,605 28.4 45.1 839 693 6,433 1,530 3,183 1,720Kansas City, MO . . . . . . 12,669 2,517 35.1 118.3 894 1,470 10,152 2,780 5,423 1,949Virginia Beach, VA . . . . . 4,846 295 5.2 42.8 149 98 4,551 770 3,499 282Charlotte, NC . . . . . . . . 11,767 2,300 28.9 84.2 763 1,424 9,467 2,528 6,236 703Tucson, AZ . . . . . . . . . . 11,480 1,023 10.3 73.6 210 730 10,457 1,727 7,524 1,206Albuquerque, NM . . . . . . 9,582 1,644 12.3 63.6 381 1,187 7,938 2,013 5,046 879Atlanta, GA . . . . . . . . . . 17,354 4,041 50.4 122.1 1,501 2,368 13,313 3,269 7,757 2,288St. Louis, MO . . . . . . . . 16,648 3,875 69.0 82.4 1,608 2,116 12,773 3,204 6,969 2,600Sacramento, CA. . . . . . . 10,210 1,254 22.0 43.2 597 592 8,956 2,089 4,828 2,039Fresno, CA . . . . . . . . . . 10,944 1,450 22.9 56.8 758 613 9,494 2,230 3,821 3,443Tulsa, OK . . . . . . . . . . . 7,758 1,301 14.3 89.6 302 895 6,458 1,902 3,381 1,175Oakland, CA . . . . . . . . . 11,916 2,602 40.8 93.6 1,209 1,258 9,314 2,216 5,037 2,061Honolulu, HI . . . . . . . . . 6,443 286 3.5 32.7 124 126 6,157 1,062 4,586 509Miami, FL . . . . . . . . . . . 18,745 3,893 34.1 54.8 1,901 1,903 14,852 3,296 8,556 3,001Pittsburgh, PA . . . . . . . . 7,765 1,216 21.7 61.3 756 377 6,550 1,251 3,533 1,766Cincinnati, OH . . . . . . . . 8,442 1,536 10.6 123.6 636 765 6,906 1,680 4,663 564Minneapolis, MN . . . . . . (2) (2) 15.8 (2) 867 744 9,268 2,552 5,442 1,274Toledo, OH . . . . . . . . . . 8,588 963 13.6 107.7 481 361 7,625 1,660 4,602 1,363Buffalo, NY . . . . . . . . . . 9,811 1,860 23.4 90.8 892 853 7,951 2,339 3,914 1,699Wichita, KS . . . . . . . . . . 8,845 875 15.3 84.5 423 352 7,970 1,865 5,186 919Mesa, AZ . . . . . . . . . . . 7,925 766 2.0 36.4 135 593 7,158 1,531 4,736 892Colorado Springs, CO . . . 6,441 511 6.2 87.0 128 290 5,930 1,197 4,399 334Las Vegas, NV . . . . . . . 6,741 1,015 12.7 60.6 498 444 5,727 1,364 3,325 1,038Santa Ana, CA. . . . . . . . 6,554 1,096 26.8 26.5 648 395 5,458 1,014 3,084 1,360Tampa, FL . . . . . . . . . . 15,707 3,247 14.9 85.5 1,026 2,120 12,460 3,111 6,416 2,933Arlington, TX . . . . . . . . . 7,181 803 2.5 51.9 252 496 6,378 1,414 4,093 872Anaheim, CA. . . . . . . . . 6,732 704 11.9 25.3 328 339 6,028 1,423 3,302 1,302Louisville, KY. . . . . . . . . 6,335 996 13.5 49.3 509 424 5,339 1,537 2,952 850St. Paul, MN . . . . . . . . . (2) (2) 8.1 (2) 352 548 6,518 1,483 4,177 858Newark, NJ . . . . . . . . . . 14,270 3,787 35.6 95.2 2,183 1,474 10,483 2,549 3,861 4,073Corpus Christi, TX . . . . . 10,092 819 12.5 71.4 187 548 9,273 1,693 6,964 616Birmingham, AL . . . . . . . 11,823 2,485 45.0 110.5 635 1,694 9,338 2,466 5,554 1,319Norfolk, VA . . . . . . . . . . 8,621 1,075 24.1 79.2 554 417 7,546 1,449 5,254 844Anchorage, AK . . . . . . . 6,438 883 9.2 84.6 227 562 5,555 750 4,252 553Aurora, CO . . . . . . . . . . 8,259 1,807 7.7 67.3 300 1,432 6,452 1,180 4,668 604Riverside, CA . . . . . . . . 9,188 1,649 13.7 54.3 534 1,047 7,539 2,064 3,997 1,478St. Petersburg, FL . . . . . 9,644 2,167 8.0 73.7 670 1,415 7,477 2,022 4,913 541Rochester, NY . . . . . . . . 10,846 1,149 27.2 67.6 696 358 9,697 2,694 5,747 1,255Lexington-Fayette, KY. . . 6,653 919 3.4 59.1 237 619 5,734 1,356 4,119 260Jersey City, NJ . . . . . . . 8,146 1,991 8.7 43.4 1,086 853 6,156 1,819 2,749 1,587Baton Rouge, LA . . . . . . 16,195 3,025 32.8 78.5 827 2,086 13,170 3,344 8,050 1,776Akron, OH. . . . . . . . . . . 7,205 946 8.4 90.7 373 474 6,259 1,496 3,855 908Raleigh, NC . . . . . . . . . 6,809 906 12.1 42.0 355 497 5,903 1,315 4,193 394Stockton, CA . . . . . . . . . 11,200 1,578 20.3 70.8 700 786 9,622 2,417 5,540 1,666
1 Crime data are not available for Omaha, NE in 1993. 2 The rates for forcible rape, violent crime, and crime index are notshown because the forcible rape figures were not in accordance with national Uniform Crime Reporting guidelines.
Source: U.S. Federal Bureau of Investigation, Crime in the United States, annual.
Crime Rates by City 201

No. 312. Murder—Circumstances and Weapons Used or Cause of Death:1980 to 1993
[In percents, except as indicated. Based solely on police investigation. For definition of murder, see text, section 5]
CHARACTERISTIC 1980 1990 1992 1993
Murders, total . . . . . . 21,860 20,273 22,716 23,271
Percent distribution . . . 100.0 100.0 100.0 100.0
CIRCUMSTANCES
Felonies, total . . . . . . . 17.7 20.8 21.6 19.1Robbery . . . . . . . . . 10.8 9.2 10.0 9.9Narcotics . . . . . . . . 1.7 6.7 5.7 5.5Sex offenses . . . . . . 1.5 1.1 0.9 0.7Other felonies . . . . . 3.7 3.7 5.0 3.0
Suspected felonies . . . 6.7 0.7 1.2 0.6Argument, total . . . . . . 39.9 34.4 30.3 30.8Property or money . . 2.6 2.5 2.1 1.9Romantic triangle . . . 2.3 2.0 1.5 1.9Other arguments . . . 35.0 29.8 26.7 27.0
CHARACTERISTIC 1980 1990 1992 1993
Other motives. . . . . . . 20.6 19.4 19.2 21.7Unknown . . . . . . . . . . 15.1 24.8 27.6 27.7
TYPE OF WEAPONOR CAUSE OF DEATH
Guns . . . . . . . . . . . . 62.4 64.3 68.2 69.6Handguns. . . . . . . . 45.8 49.8 55.4 56.9
Cutting or stabbing . . . 19.3 17.4 14.5 12.7Blunt objects 1 . . . . . . 5.0 5.4 4.6 4.4Personal weapons 2. . . 5.9 5.5 5.0 5.0Strangulations,asphyxiations . . . . . . 2.3 2.0 1.9 1.9Fire. . . . . . . . . . . . . . 1.3 1.4 0.9 0.9All other 3 . . . . . . . . . 3.8 4.0 5.0 5.5
1 Refers to club, hammer, etc. 2 Hands, fists, feet, etc. 3 Includes poison, drowning, explosives, narcotics, and unknown.Source: U.S. Federal Bureau of Investigation, Crime in the United States, annual.
No. 313. Murder Victims, by Age, Sex, and Race: 1993
AGE TotalSex Race
Male Female Unknown White Black Other Unknown
Total . . . . . . . . . . . . . . . . . . 23,271 17,949 5,278 44 10,709 11,795 563 204Percent distribution . . . . . . . 100.0 77.1 22.7 0.2 46.0 50.7 2.4 0.9
Under 18 yrs. old . . . . . . . . . . . . 2,697 1,933 761 3 1,187 1,411 81 1818 yrs. old and over . . . . . . . . . . 20,250 15,800 4,441 9 9,387 10,266 473 124
Infant (under 1 yr. old). . . . . . . . . 272 150 120 2 135 118 10 91 to 4 yrs. old . . . . . . . . . . . . . . 459 258 200 1 217 225 16 15 to 9 yrs. old . . . . . . . . . . . . . . 173 84 89 - 101 61 10 110 to 14 yrs. old. . . . . . . . . . . . . 387 258 129 - 185 194 8 -15 to 19 yrs. old. . . . . . . . . . . . . 3,084 2,652 432 - 1,125 1,857 81 2120 to 24 yrs. old. . . . . . . . . . . . . 4,355 3,667 684 4 1,597 2,656 78 2425 to 29 yrs. old. . . . . . . . . . . . . 3,466 2,729 736 1 1,451 1,921 74 2030 to 34 yrs. old. . . . . . . . . . . . . 3,083 2,338 745 - 1,444 1,541 86 1235 to 39 yrs. old. . . . . . . . . . . . . 2,318 1,767 550 1 1,143 1,108 56 1140 to 44 yrs. old. . . . . . . . . . . . . 1,620 1,226 394 - 800 753 52 1545 to 49 yrs. old. . . . . . . . . . . . . 1,077 825 252 - 649 389 28 1150 to 54 yrs. old. . . . . . . . . . . . . 717 549 166 2 443 244 21 955 to 59 yrs. old. . . . . . . . . . . . . 465 352 112 1 299 149 13 460 to 64 yrs. old. . . . . . . . . . . . . 393 285 108 - 253 130 9 165 to 69 yrs. old. . . . . . . . . . . . . 319 210 109 - 209 102 7 170 to 74 yrs. old. . . . . . . . . . . . . 292 171 121 - 194 93 4 175 yrs. old and over . . . . . . . . . . 467 212 255 - 329 136 1 1
Age unknown . . . . . . . . . . . . . . 324 216 76 32 135 118 9 62
- Represents zero.Source: U.S. Federal Bureau of Investigation, Crime in the United States, annual.
No. 314. Homicide Victims, by Race and Sex: 1970 to 1992[Rates per 100,000 resident population in specified group. Excludes deaths to nonresidents of United States. Beginning 1980,deaths classified according to the ninth revision of the International Classification of Diseases; for earlier years, classified accordingto revision in use at the time; see text, section 2. See also Historical Statistics, Colonial Times to 1970, series H 971-978]
YEAR
HOMICIDE VICTIMS HOMICIDE RATE 2
Total 1White Black
Total 1White Black
Male Female Male Female Male Female Male Female
1970 . . . . . . . . . . . 16,848 5,865 1,938 7,265 1,569 8.3 6.8 2.1 67.6 13.31980 . . . . . . . . . . . 24,278 10,381 3,177 8,385 1,898 10.7 10.9 3.2 66.6 13.51981 . . . . . . . . . . . 23,646 9,941 3,125 8,312 1,825 10.3 10.4 3.1 64.8 12.71982 . . . . . . . . . . . 22,358 9,260 3,179 7,730 1,743 9.6 9.6 3.1 59.1 12.01983 . . . . . . . . . . . 20,191 8,355 2,880 6,822 1,672 8.6 8.6 2.8 51.4 11.31984 . . . . . . . . . . . 19,796 8,171 2,956 6,563 1,677 8.4 8.3 2.9 48.7 11.21985 . . . . . . . . . . . 19,893 8,122 3,041 6,616 1,666 8.3 8.2 2.9 48.4 11.01986 . . . . . . . . . . . 21,731 8,567 3,123 7,634 1,861 9.0 8.6 3.0 55.0 12.11987 . . . . . . . . . . . 21,103 7,979 3,149 7,518 1,969 8.7 7.9 3.0 53.3 12.61988 . . . . . . . . . . . 22,032 7,994 3,072 8,314 2,089 9.0 7.9 2.9 58.0 13.21989 . . . . . . . . . . . 22,909 8,337 2,971 8,888 2,074 9.2 8.2 2.8 61.1 12.91990 . . . . . . . . . . . 24,932 9,147 3,006 9,981 2,163 10.0 9.0 2.8 69.2 13.51991 . . . . . . . . . . . 26,513 9,581 3,201 10,628 2,330 10.5 9.3 3.0 72.0 14.21992 . . . . . . . . . . . 25,488 9,456 3,012 10,131 2,187 10.0 9.1 2.8 67.5 13.1
1 Includes races not shown separately. 2 Rate based on enumerated population figures as of April 1 for 1970, 1980, and1990; July 1 estimates for other years.
Source: U.S. National Center for Health Statistics, Vital Statistics of the United States, annual, and unpublished data.
Law Enforcement, Courts, and Prisons202

No. 315. Forcible Rape—Number and Rate: 1970 to 1993
[For definition of rape, see text, section 5]
ITEM 1970 1980 1985 1987 1988 1989 1990 1991 1992 1993
NUMBER
Total . . . . . . . . . . . . . . . . . 37,990 82,990 88,670 91,110 92,490 94,500 102,560 106,590 109,060 104,810By force . . . . . . . . . . . . . . . . . . 26,888 63,599 71,060 73,456 75,441 78,411 86,541 91,522 93,825 91,315Attempt . . . . . . . . . . . . . . . . . . . 11,102 19,391 17,610 17,654 17,049 16,089 16,019 15,068 15,235 13,495
RATE
Per 100,000 population . . . . . . . . 18.7 36.8 37.1 37.4 37.6 38.1 41.2 42.3 42.8 40.6Per 100,000 females . . . . . . . . . . 30.4 71.6 72.3 73.0 73.4 74.3 80.5 82.5 83.5 79.4Per 100,000 females 12 yearsold and over . . . . . . . . . . . . . . . 46.3 86.3 86.6 87.5 88.1 89.3 96.6 100.9 100.5 95.6
AVERAGE ANNUALPERCENT CHANGE IN RATE 1
Per 100,000 population . . . . . . . . (NA) 6.1 3.9 -1.3 0.5 1.3 8.1 2.7 1.2 -5.1Per 100,000 females 12 yearsold and over . . . . . . . . . . . . . . . (NA) 6.0 4.3 -1.2 0.7 1.4 8.2 4.5 -0.4 -4.9
NANot available. 1 Represents annual average from prior year shown except for 1980, from 1979; for 1985, from 1984; andfor 1987, from 1986.
No. 316. Robbery and Property Crimes, by Type and Selected Characteristic:1980 to 1993
[For definition of crime, see text, section 5]
ITEMNUMBER OF OFFENSES
(1,000)RATE PER 100,000
INHABITANTS
AVERAGEVALUE LOST
(dol.)
1980 1990 1992 1993 1980 1990 1992 1993 1992 1993
Robbery, total 1 . . . . . . . . . 566 639 672 660 251.1 257.0 263.6 255.8 $840 $815Type of crime:Street or highway . . . . . . . . . . 293 359 374 361 130.1 144.2 146.7 139.9 672 628Commercial house . . . . . . . . . 78 73 80 82 34.6 29.5 31.3 31.9 1,380 1,304Gas station . . . . . . . . . . . . . . 23 18 17 15 10.4 7.1 6.6 6.0 513 515Convenience store . . . . . . . . . 38 39 35 35 17.0 15.6 13.8 13.5 402 449Residence . . . . . . . . . . . . . . . 60 62 68 68 26.8 25.1 26.5 26.3 1,123 1,104Bank . . . . . . . . . . . . . . . . . . 8 9 11 12 3.8 3.8 4.4 4.6 3,325 3,308
Weapon used:Firearm . . . . . . . . . . . . . . . . . 228 234 271 280 101.3 94.1 106.2 108.4 (NA) (NA)Knife or cutting instrument . . . . 73 76 71 66 32.3 30.7 27.8 25.5 (NA) (NA)Other dangerous weapon . . . . . 51 61 64 62 22.8 24.5 25.2 24.2 (NA) (NA)Strongarm . . . . . . . . . . . . . . . 214 268 267 252 94.8 107.7 104.5 97.7 (NA) (NA)
Burglary, total . . . . . . . . . . 3,795 3,074 2,980 2,835 1,684.1 1,235.9 1,168.2 1,099.2 1,278 1,185Forcible entry . . . . . . . . . . . . . . 2,789 2,150 2,049 1,932 1,237.5 864.5 803.3 749.3 (NA) (NA)Unlawful entry . . . . . . . . . . . . . . 711 678 692 676 315.6 272.8 271.2 262.2 (NA) (NA)Attempted forcible entry. . . . . . . . 295 245 239 226 131.0 98.7 93.7 87.7 (NA) (NA)
Residence . . . . . . . . . . . . . . . . 2,525 2,033 1,973 1,884 1,120.6 817.4 773.4 730.5 1,215 1,189Nonresidence . . . . . . . . . . . . . . 1,270 1,041 1,007 951 563.5 418.5 394.8 368.7 1,400 1,179
Occurred during the night . . . . . . 1,508 1,135 1,099 1,032 669.0 456.4 431.0 400.2 (NA) (NA)Occurred during the day . . . . . . . 1,263 1,151 1,123 1,070 560.3 462.8 440.1 414.9 (NA) (NA)
Larceny-theft, total . . . . . . . 7,137 7,946 7,915 7,821 3,167.0 3,194.8 3,103.0 3,032.4 483 504Pocket picking . . . . . . . . . . . . . . 85 81 78 73 37.9 32.4 30.7 28.2 430 411Purse snatching . . . . . . . . . . . . . 107 82 75 68 47.5 32.8 29.3 26.5 292 341Shoplifting. . . . . . . . . . . . . . . . . 773 1,291 1,254 1,201 343.0 519.1 491.5 465.6 106 109From motor vehicles . . . . . . . . . . 1,231 1,744 1,792 1,828 546.4 701.3 702.7 708.6 555 531Motor vehicle accessories . . . . . . 1,366 1,185 1,107 1,091 606.2 476.3 434.0 423.0 297 303Bicycles . . . . . . . . . . . . . . . . . . 715 443 469 478 317.5 178.2 183.7 185.5 231 241From buildings. . . . . . . . . . . . . . 1,187 1,118 1,107 1,029 526.9 449.4 433.9 399.0 802 831From coin-operated machines. . . . 58 63 72 62 25.8 25.4 28.3 23.9 141 208Other . . . . . . . . . . . . . . . . . . . . 1,613 1,940 1,961 1,991 715.7 780.0 768.9 772.0 665 740
Motor vehicles, total 2 . . . . 1,132 1,636 1,611 1,561 502.2 657.8 631.5 605.3 4,713 4,808Automobiles . . . . . . . . . . . . . . . 845 1,304 1,282 1,236 374.8 524.3 502.5 479.2 (NA) (NA)Trucks and buses. . . . . . . . . . . . 149 238 243 240 66.1 95.5 95.1 93.0 (NA) (NA)
NA Not available. 1 Includes other crimes not shown separately. 2 Includes other types of motor vehicles not shownseparately.
Source of tables 315 and 316: U.S. Federal Bureau of Investigation, Population-at-Risk Rates and Selected Crime Indicators,annual.
Rape—Robbery and Property Crimes 203

No. 317. Number and Rate of Victimizations for Crimes Against Persons andHouseholds, by Type: 1973 to 1992
[Data based on National Crime Victimization Survey; see text, section 5, and Appendix III]
YEAR
PERSONAL SECTOR HOUSEHOLD SECTOR
Total
Violent crimesLarce-ny—theft
Total Bur-glary
Lar-ceny
Motorvehi-cletheft
Total Rape Rob-bery
Assault
Total Aggra-vated Simple
NUMBER (1,000)
1973 . . . . . . . . . . 20,322 5,351 156 1,108 4,087 1,655 2,432 14,971 15,340 6,459 7,537 1,3441975 . . . . . . . . . . 21,867 5,573 154 1,147 4,272 1,631 2,641 16,294 17,400 6,744 9,223 1,4331980 . . . . . . . . . . 21,430 6,130 174 1,209 4,747 1,707 3,041 15,300 18,821 6,973 10,468 1,3811981 . . . . . . . . . . 22,445 6,582 178 1,381 5,024 1,796 3,228 15,863 19,009 7,394 10,176 1,4391982 . . . . . . . . . . 22,012 6,459 153 1,334 4,973 1,754 3,219 15,553 17,744 6,663 9,705 1,3771983 . . . . . . . . . . 20,561 5,903 154 1,149 4,600 1,517 3,083 14,657 16,440 6,063 9,114 1,2641984 . . . . . . . . . . 19,743 5,954 180 1,117 4,657 1,673 2,984 13,789 15,733 5,643 8,750 1,3401985 . . . . . . . . . . 19,296 5,823 138 985 4,699 1,605 3,094 13,474 15,568 5,594 8,703 1,2701986 . . . . . . . . . . 18,751 5,515 130 1,009 4,376 1,543 2,833 13,235 15,368 5,557 8,455 1,3561987 . . . . . . . . . . 19,371 5,796 148 1,046 4,602 1,587 3,014 13,575 15,966 5,705 8,788 1,4731988 . . . . . . . . . . 19,966 5,910 127 1,048 4,734 1,741 2,993 14,056 15,830 5,777 8,419 1,6341989 . . . . . . . . . . 19,691 5,861 135 1,092 4,634 1,665 2,969 13,829 16,128 5,352 8,955 1,8201990 . . . . . . . . . . 18,984 6,009 130 1,150 4,729 1,601 3,128 12,975 15,419 5,148 8,304 1,9681991 . . . . . . . . . . 19,472 6,587 174 1,203 5,210 1,634 3,575 12,885 16,025 5,187 8,702 2,1361992 . . . . . . . . . . 18,832 6,621 141 1,226 5,255 1,849 3,406 12,211 14,817 4,757 8,101 1,959
RATE 1
1973 . . . . . . . . . . 123.6 32.6 1.0 6.7 24.9 10.1 14.8 91.1 217.8 91.7 107.0 19.11975 . . . . . . . . . . 128.9 32.8 0.9 6.8 25.2 9.6 15.6 96.0 236.5 91.7 125.4 19.51980 . . . . . . . . . . 116.3 33.3 0.9 6.6 25.8 9.3 16.5 83.0 227.4 84.3 126.5 16.71981 . . . . . . . . . . 120.4 35.3 1.0 7.4 27.0 9.6 17.3 85.1 226.0 87.9 121.0 17.11982 . . . . . . . . . . 116.8 34.3 0.8 7.1 26.4 9.3 17.1 82.5 208.2 78.2 113.9 16.21983 . . . . . . . . . . 107.9 31.0 0.8 6.0 24.1 8.0 16.2 76.9 189.8 70.0 105.2 14.61984 . . . . . . . . . . 102.8 31.0 0.9 5.8 24.3 8.7 15.5 71.8 178.7 64.1 99.4 15.21985 . . . . . . . . . . 99.4 30.0 0.7 5.1 24.2 8.3 15.9 69.4 174.4 62.7 97.5 14.21986 . . . . . . . . . . 95.6 28.1 0.7 5.1 22.3 7.9 14.4 67.5 170.0 61.5 93.5 15.01987 . . . . . . . . . . 98.0 29.3 0.8 5.3 23.3 8.0 15.2 68.7 173.9 62.1 95.7 16.01988 . . . . . . . . . . 100.1 29.6 0.6 5.3 23.7 8.7 15.0 70.5 169.6 61.9 90.2 17.51989 . . . . . . . . . . 97.8 29.1 0.7 5.4 23.0 8.3 14.7 68.7 169.9 56.4 94.4 19.21990 . . . . . . . . . . 93.4 29.6 0.6 5.7 23.3 7.9 15.4 63.8 161.0 53.8 86.7 20.51991 . . . . . . . . . . 95.3 32.2 0.9 5.9 25.5 8.0 17.5 63.1 166.4 53.9 90.4 22.21992 . . . . . . . . . . 91.2 32.1 0.7 5.9 25.5 9.0 16.5 59.2 152.2 48.9 83.2 20.1
1 Rate per 1,000 persons, 12 years old and over, and per 1,000 households.Source: U.S. Bureau of Justice Statistics, Criminal Victimization in the United States, annual.
No. 318. Personal Crimes—Victimization Rate, by Type of Crime and Characteristic: 1992
[Rate per 1,000 persons age 12 years or older. Based on the National Crime Victimization Survey; see text,section 5, and Appendix III]
ITEM Total Rape RobberyAssault
Larceny—theftTotal Aggra-
vated Simple
Total . . . . . . . . . . . . . . . . . 91.2 0.7 5.9 25.5 9.0 16.5 59.2
Male . . . . . . . . . . . . . . . . . . . . 101.4 0.6 8.1 30.1 12.0 18.1 62.6Female. . . . . . . . . . . . . . . . . . . 81.8 0.8 3.9 21.1 6.1 15.0 55.9
12 to 15 yrs. old. . . . . . . . . . . . . 171.0 1.1 9.8 64.8 20.1 44.7 95.316 to 19 yrs. old. . . . . . . . . . . . . 172.7 1.6 15.4 60.9 26.3 34.5 94.820 to 24 yrs. old. . . . . . . . . . . . . 177.0 2.6 11.4 56.0 18.1 38.0 106.925 to 34 yrs. old. . . . . . . . . . . . . 111.1 0.5 7.7 29.4 9.3 20.1 73.435 to 49 yrs. old. . . . . . . . . . . . . 75.1 0.4 3.8 17.1 6.8 10.2 53.950 to 64 yrs. old. . . . . . . . . . . . . 43.3 0.1 2.8 7.1 2.3 4.8 33.365 yrs. old and over . . . . . . . . . . 21.1 0.2 1.5 3.1 1.3 1.8 16.3
White . . . . . . . . . . . . . . . . . . . . 88.7 0.6 4.7 24.6 7.8 16.8 58.8Black . . . . . . . . . . . . . . . . . . . . 110.8 1.3 15.6 33.5 18.3 15.2 60.4Other . . . . . . . . . . . . . . . . . . . . 88.3 - 5.1 18.6 5.3 13.3 64.6
Hispanic . . . . . . . . . . . . . . . . . . 100.1 0.6 10.6 26.9 10.0 16.8 61.9Non-Hispanic. . . . . . . . . . . . . . . 90.3 0.7 5.4 25.3 8.9 16.4 58.9
- Represents or rounds to zero.
Source: U.S. Bureau of Justice Statistics, Criminal Victimization in the United States, annual.
Law Enforcement, Courts, and Prisons204

No. 319. Crime Incidents, by Place and Time of Occurrence and Injury: 1992
INCIDENT CHARACTERISTICS Rape
ROBBERY ASSAULT Per-sonallarcenywith
contactTotal Comple-
tedAt-
tempted Total Aggravat-ed
Simpleassault
Incidents, total . . . . . . . . . . . . . . 131,530 1,113,300 741,590 371,710 4,719,250 1,594,210 3,125,030 478,170
PERCENT DISTRIBUTION
Place of occurrence . . . . . . . . . . . . . . . . 100.0 100.0 100.0 100.0 100.0 100.0 100.0 100.0Inside own home . . . . . . . . . . . . . . . . 116.3 10.1 9.4 11.6 12.4 9.8 13.7 11.4Near own home, on the street nearhome . . . . . . . . . . . . . . . . . . . . . . . 112.4 11.0 10.9 11.3 11.7 14.0 10.5 15.2Friend’s, relative’s, or neighbor’s home . . 114.1 13.1 13.1 13.0 8.3 9.2 7.9 14.3Inside commercial property . . . . . . . . . . 11.5 4.2 13.8 1 5.0 12.2 9.1 13.7 23.2In parking lot or garage . . . . . . . . . . . . 16.5 13.6 12.2 16.3 7.3 8.0 7.0 13.0Inside school, on school property . . . . . . 17.9 3.9 13.6 1 4.4 14.1 8.1 17.1 8.6In park, field, or playground . . . . . . . . . 18.5 6.4 6.6 1 5.8 4.4 5.1 4.1 11.5On street not near own or friend’s home . 125.9 39.7 44.8 29.5 20.6 27.6 17.1 31.9Other . . . . . . . . . . . . . . . . . . . . . . . . 16.9 8.0 5.5 13.0 9.0 9.1 9.0 20.9
Time of occurrence:Daytime (6 a.m. to 6 p.m.) . . . . . . . . . . 40.3 39.5 41.3 35.8 50.2 42.6 54.0 62.9Nighttime. . . . . . . . . . . . . . . . . . . . . . 59.7 58.9 56.7 63.5 49.5 57.4 45.4 35.3
Percent of incidents:Involving the presence of a weapon . . . . 27.6 54.0 55.4 51.2 31.8 94.1 (X) (X)Resulting in victim injury . . . . . . . . . . . (NA) 35.7 41.4 24.7 29.7 35.6 26.6 (X)
NA Not available. X Not applicable. 1 Estimate based on about 10 or fewer sample cases.
Source: U.S. Bureau of Justice Statistics, Criminal Victimization in the United States, annual.
No. 320. Handgun Crime Victimization Rate, by Sex, Race, and Age: 1987-92 Period
[Number of victimizations rates per 1,000 population. Rates do not include murder or nonnegligent manslaughter committedwith handguns. Based on National Crime Victimization Survey; see text, section 5, and Appendix III]
AGE OF VICTIMMALE VICTIMS FEMALE VICTIMS
Total1 White Black Total1 White Black
All ages . . . . . . . . . . . . . . . . . . . . . . . . . 4.9 3.7 14.2 2.1 1.6 5.8
12 to 15 yrs. old . . . . . . . . . . . . . . . . . . . . . . . 5.0 3.1 14.1 2.5 2.1 4.716 to 19 yrs. old . . . . . . . . . . . . . . . . . . . . . . . 14.2 9.5 39.7 5.1 3.6 13.420 to 24 yrs. old . . . . . . . . . . . . . . . . . . . . . . . 11.8 9.2 29.4 4.3 3.5 9.125 to 34 yrs. old . . . . . . . . . . . . . . . . . . . . . . . 5.7 4.9 12.3 3.1 2.1 9.035 to 49 yrs. old . . . . . . . . . . . . . . . . . . . . . . . 3.3 2.7 8.7 1.7 1.4 3.350 to 64 yrs. old . . . . . . . . . . . . . . . . . . . . . . . 1.5 1.2 3.5 0.8 0.7 1.665 yrs. old and older . . . . . . . . . . . . . . . . . . . . 0.8 0.6 3.7 0.3 0.2 2.3
1 Includes persons of other races not shown separately.
Source: U.S. Bureau of Justice Statistics, Guns and Crime, Crime Data Brief, NCJ-147003.
No. 321. Households Touched by Crime, 1990 and 1992, and by Characteristic, 1992
[A household is considered ‘‘touched by crime’’ if during the year it experienced a burglary, auto theft or household theft, or if ahousehold member was raped, robbed, or assaulted, or a victim of personal theft, no matter where the crime occurred. Data basedon the National Crime Victimization Survey; see text, section 5, and Appendix III]
TYPE OF CRIME
1990 1992
Num-ber
(1,000)
Percenttouched
Num-ber
(1,000)
Percent touched
Total 1 White Black Urban Sub-urban Rural
Total 2 . . . . . . . . . . . . . . . . . . 22,652 23.7 22,093 22.6 21.9 27.2 28.1 21.4 16.9
Violent crime . . . . . . . . . . . . . . . . . 4,478 4.7 4,888 5.0 4.8 7.1 6.4 4.6 3.8Rape. . . . . . . . . . . . . . . . . . . . . 104 0.1 149 0.2 0.2 0.1 0.2 0.1 0.1Robbery. . . . . . . . . . . . . . . . . . . 967 1.0 998 1.0 0.9 2.2 1.8 0.7 0.4Assault . . . . . . . . . . . . . . . . . . . 3,591 3.8 3,975 4.1 4.0 5.1 4.7 3.9 3.5
Theft . . . . . . . . . . . . . . . . . . . . . . 15,905 16.7 15,343 15.7 15.5 17.1 19.5 15.0 11.4Burglary . . . . . . . . . . . . . . . . . . . . 4,557 4.8 4,116 4.2 4.0 5.8 5.0 3.8 3.7Motor vehicle theft . . . . . . . . . . . . . 1,825 1.9 1,947 2.0 1.8 3.3 3.2 1.8 0.6
1 Includes other races not shown separately. 2 Types of crime will not add to ‘‘total’’ since each household may report asmany crime categories as experienced.
Source: U.S. Bureau of Justice Statistics, Crime and the Nation’s Households, 1992.
Crime Incidents—Handgun Crimes 205

No. 322. Persons Arrested, by Charge and Race: 1993
[Represents arrests (not charges) reported by 10,509 agencies with a total 1993 population 213,093,000 as estimated by FBI]
OFFENSE CHARGED
TOTAL ARRESTS (1,000) PERCENT DISTRIBUTION
Total White Black
AmericanIndianor
AlaskanNative
Asianor
PacificIslander
Total White Black
AmericanIndianor
AlaskanNative
Asianor
PacificIslander
Total . . . . . . . . . . . . . . . . 11,742 7,855 3,647 126 113 100.0 66.9 31.1 1.1 1.0
Serious crimes 1 . . . . . . . . . . . . 2,419 1,482 884 23 31 100.0 61.3 36.5 0.9 1.3Murder and nonnegligentmanslaughter . . . . . . . . . . . 20 8 12 (Z) (Z) 100.0 40.7 57.6 0.6 1.1Forcible rape . . . . . . . . . . . . 32 18 13 (Z) (Z) 100.0 56.9 41.3 1.0 0.8Robbery. . . . . . . . . . . . . . . . 153 56 95 1 2 100.0 36.5 62.1 0.4 1.0Aggravated assault . . . . . . . . 441 258 176 4 4 100.0 58.4 39.8 0.9 1.0Burglary. . . . . . . . . . . . . . . . 338 227 104 3 4 100.0 67.2 30.9 0.9 1.0Larceny/theft. . . . . . . . . . . . . 1,249 807 412 13 18 100.0 64.6 33.0 1.0 1.4Motor vehicle theft . . . . . . . . . 169 96 68 2 3 100.0 57.1 40.3 0.9 1.7Arson . . . . . . . . . . . . . . . . . 16 12 4 (Z) (Z) 100.0 74.6 23.5 0.9 0.9
All other nonserious crimes:Other assaults . . . . . . . . . . . 963 606 336 12 9 100.0 62.9 34.9 1.2 1.0Forgery and counterfeiting. . . . 89 56 32 1 1 100.0 63.0 35.4 0.6 1.0Fraud . . . . . . . . . . . . . . . . . 335 209 123 2 2 100.0 62.3 36.6 0.5 0.7Embezzlement . . . . . . . . . . . 11 7 3 (Z) (Z) 100.0 67.4 31.0 0.4 1.2Stolen property—buying,receiving, possessing . . . . . . 135 75 57 1 1 100.0 56.1 42.3 0.6 1.1Vandalism . . . . . . . . . . . . . . 261 195 60 3 3 100.0 74.8 22.9 1.1 1.2Weapons; carrying,possessing, etc.. . . . . . . . . . 224 124 96 1 2 100.0 55.4 43.0 0.5 1.1
Prostitution and commer-cialized vice . . . . . . . . . . . . 89 55 32 1 1 100.0 62.0 35.9 0.6 1.5Sex offenses (except forciblerape and prostitution) . . . . . . 88 67 18 1 1 100.0 77.0 20.9 1.0 1.1Drug abuse violations. . . . . . . 968 578 380 4 5 100.0 59.8 39.3 0.4 0.5Gambling . . . . . . . . . . . . . . . 15 7 7 (Z) 1 100.0 48.2 46.9 0.4 4.6Offenses against familyand children . . . . . . . . . . . . 89 58 28 1 2 100.0 65.6 31.2 1.3 2.0Driving under the influence . . . 1,227 1,070 130 16 11 100.0 87.2 10.6 1.3 0.9
Liquor laws. . . . . . . . . . . . . . 417 353 53 10 3 100.0 84.5 12.6 2.3 0.6Drunkenness . . . . . . . . . . . . 604 482 108 13 2 100.0 79.7 17.8 2.1 0.3Disorderly conduct . . . . . . . . . 607 392 204 8 3 100.0 64.6 33.6 1.3 0.5Vagrancy . . . . . . . . . . . . . . . 25 14 10 (Z) (Z) 100.0 56.6 41.2 1.9 0.4All other offenses (excepttraffic) . . . . . . . . . . . . . . . . 2,928 1,833 1,039 28 27 100.0 62.6 35.5 1.0 0.9Suspicion . . . . . . . . . . . . . . . 12 6 6 (Z) (Z) 100.0 46.9 52.0 0.6 0.5Curfew and loiteringlaw violations . . . . . . . . . . . 85 67 15 1 2 100.0 78.8 18.1 1.1 2.0Runaways . . . . . . . . . . . . . . 151 118 26 2 5 100.0 78.1 17.2 1.3 3.4
Z Less than 500. 1 Includes arson.Source: U.S. Federal Bureau of Investigation, Crime in the United States, annual.
No. 323. Juvenile Arrests for Selected Offenses: 1970 to 1993
[Juveniles are persons between the ages 10-17]
OFFENSE 1970 1975 1980 1985 1988 1989 1990 1991 1992 1993
Number of contributing agencies . . 5,073 7,528 8,178 11,263 10,077 10,502 10,765 10,148 11,058 10,277Population covered (1,000) . . . . . . 145,014 156,854 169,439 206,269 192,275 199,098 204,543 189,962 217,754 213,705
NUMBER
Violent crime, total. . . . . . . . . . . . 54,860 76,131 77,220 75,077 71,251 84,551 97,103 95,677 118,358 122,434Murder. . . . . . . . . . . . . . . . . . 1,350 1,373 1,475 1,384 1,827 2,204 2,661 2,626 3,025 3,473Forcible rape. . . . . . . . . . . . . . 3,233 3,457 3,668 5,073 4,278 4,691 4,971 4,766 5,451 5,490Robbery . . . . . . . . . . . . . . . . . 29,363 39,388 38,529 31,833 25,459 30,728 34,944 35,632 42,639 44,598Aggravated assault . . . . . . . . . 20,914 31,913 33,548 36,787 39,687 46,928 54,527 52,653 67,243 68,873
Weapon law violations . . . . . . . . . 17,111 19,341 21,203 27,035 27,473 31,480 33,123 37,575 49,903 54,414
Drug abuse, total . . . . . . . . . . . . 71,517 136,996 86,685 78,660 72,303 86,757 66,300 58,603 73,232 90,618Sale and manufacturing . . . . . . (1) (1) 13,004 14,846 23,174 33,652 24,575 22,929 25,331 27,635Heroin/cocaine. . . . . . . . . . . 10,041 4,902 1,318 2,851 14,914 19,760 17,511 16,915 17,881 18,716Marijuana . . . . . . . . . . . . . . 35,818 95,027 8,876 8,646 4,811 6,781 4,372 3,579 4,853 6,144Synthetic narcotics . . . . . . . . 8,971 3,010 465 414 846 701 346 570 663 455Dangerous nonnarcotic drugs . 16,687 34,057 2,345 2,935 2,603 6,410 2,346 1,865 1,934 2,320
Possession. . . . . . . . . . . . . . . (1) (1) 73,681 63,814 49,129 53,105 41,725 35,674 47,901 62,983Heroin/cocaine. . . . . . . . . . . (1) (1) 2,614 7,809 15,754 19,745 15,194 13,747 16,855 17,726Marijuana . . . . . . . . . . . . . . (1) (1) 64,465 50,582 28,885 27,253 20,940 16,490 25,004 37,915Synthetic narcotics . . . . . . . . (1) (1) 1,524 1,085 1,096 1,115 1,155 885 897 1,008Dangerous nonnarcotic drugs . (1) (1) 5,078 4,338 3,394 4,992 4,436 4,552 5,145 6,334
1 Prior to 1976, drug abuse arrests were collected with no distinctions between the present day classifications of sales/manufacturing and possession.
Source: U.S. Federal Bureau of Investigation, Crime in the United States, annual.
Law Enforcement, Courts, and Prisons206
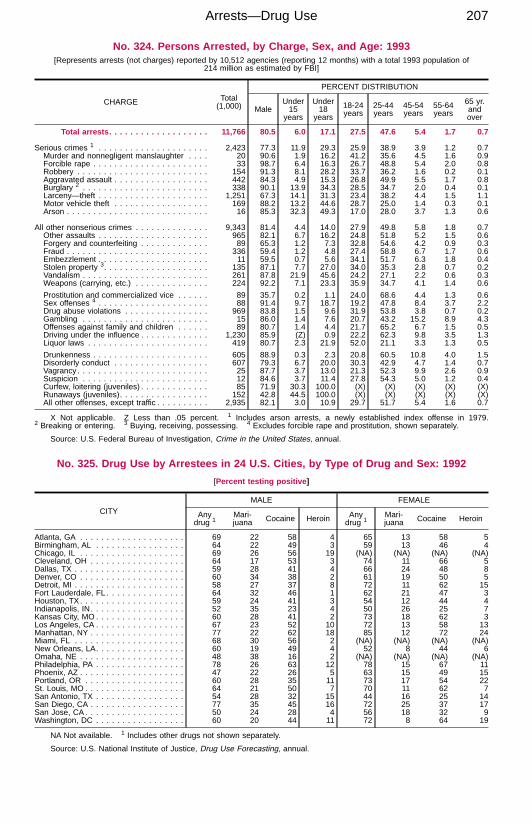
No. 324. Persons Arrested, by Charge, Sex, and Age: 1993[Represents arrests (not charges) reported by 10,512 agencies (reporting 12 months) with a total 1993 population of
214 million as estimated by FBI]
CHARGE Total(1,000)
PERCENT DISTRIBUTION
MaleUnder15
years
Under18
years
18-24years
25-44years
45-54years
55-64years
65 yr.andover
Total arrests . . . . . . . . . . . . . . . . . . . 11,766 80.5 6.0 17.1 27.5 47.6 5.4 1.7 0.7
Serious crimes 1 . . . . . . . . . . . . . . . . . . . . . 2,423 77.3 11.9 29.3 25.9 38.9 3.9 1.2 0.7Murder and nonnegligent manslaughter . . . . 20 90.6 1.9 16.2 41.2 35.6 4.5 1.6 0.9Forcible rape . . . . . . . . . . . . . . . . . . . . . . 33 98.7 6.4 16.3 26.7 48.8 5.4 2.0 0.8Robbery . . . . . . . . . . . . . . . . . . . . . . . . . 154 91.3 8.1 28.2 33.7 36.2 1.6 0.2 0.1Aggravated assault . . . . . . . . . . . . . . . . . . 442 84.3 4.9 15.3 26.8 49.9 5.5 1.7 0.8Burglary 2 . . . . . . . . . . . . . . . . . . . . . . . . 338 90.1 13.9 34.3 28.5 34.7 2.0 0.4 0.1Larceny—theft . . . . . . . . . . . . . . . . . . . . . 1,251 67.3 14.1 31.3 23.4 38.2 4.4 1.5 1.1Motor vehicle theft . . . . . . . . . . . . . . . . . . 169 88.2 13.2 44.6 28.7 25.0 1.4 0.3 0.1Arson . . . . . . . . . . . . . . . . . . . . . . . . . . . 16 85.3 32.3 49.3 17.0 28.0 3.7 1.3 0.6
All other nonserious crimes . . . . . . . . . . . . . . 9,343 81.4 4.4 14.0 27.9 49.8 5.8 1.8 0.7Other assaults . . . . . . . . . . . . . . . . . . . . . 965 82.1 6.7 16.2 24.8 51.8 5.2 1.5 0.6Forgery and counterfeiting . . . . . . . . . . . . . 89 65.3 1.2 7.3 32.8 54.6 4.2 0.9 0.3Fraud . . . . . . . . . . . . . . . . . . . . . . . . . . . 336 59.4 1.2 4.8 27.4 58.8 6.7 1.7 0.6Embezzlement . . . . . . . . . . . . . . . . . . . . . 11 59.5 0.7 5.6 34.1 51.7 6.3 1.8 0.4Stolen property 3. . . . . . . . . . . . . . . . . . . . 135 87.1 7.7 27.0 34.0 35.3 2.8 0.7 0.2Vandalism . . . . . . . . . . . . . . . . . . . . . . . . 261 87.8 21.9 45.6 24.2 27.1 2.2 0.6 0.3Weapons (carrying, etc.) . . . . . . . . . . . . . . 224 92.2 7.1 23.3 35.9 34.7 4.1 1.4 0.6
Prostitution and commercialized vice . . . . . . 89 35.7 0.2 1.1 24.0 68.6 4.4 1.3 0.6Sex offenses 4 . . . . . . . . . . . . . . . . . . . . . 88 91.4 9.7 18.7 19.2 47.8 8.4 3.7 2.2Drug abuse violations . . . . . . . . . . . . . . . . 969 83.8 1.5 9.6 31.9 53.8 3.8 0.7 0.2Gambling . . . . . . . . . . . . . . . . . . . . . . . . 15 86.0 1.4 7.6 20.7 43.2 15.2 8.9 4.3Offenses against family and children . . . . . . 89 80.7 1.4 4.4 21.7 65.2 6.7 1.5 0.5Driving under the influence . . . . . . . . . . . . . 1,230 85.9 (Z) 0.9 22.2 62.3 9.8 3.5 1.3Liquor laws . . . . . . . . . . . . . . . . . . . . . . . 419 80.7 2.3 21.9 52.0 21.1 3.3 1.3 0.5
Drunkenness . . . . . . . . . . . . . . . . . . . . . . 605 88.9 0.3 2.3 20.8 60.5 10.8 4.0 1.5Disorderly conduct . . . . . . . . . . . . . . . . . . 607 79.3 6.7 20.0 30.3 42.9 4.7 1.4 0.7Vagrancy . . . . . . . . . . . . . . . . . . . . . . . . . 25 87.7 3.7 13.0 21.3 52.3 9.9 2.6 0.9Suspicion . . . . . . . . . . . . . . . . . . . . . . . . 12 84.6 3.7 11.4 27.8 54.3 5.0 1.2 0.4Curfew, loitering (juveniles) . . . . . . . . . . . . . 85 71.9 30.3 100.0 (X) (X) (X) (X) (X)Runaways (juveniles). . . . . . . . . . . . . . . . . 152 42.8 44.5 100.0 (X) (X) (X) (X) (X)All other offenses, except traffic . . . . . . . . . . 2,935 82.1 3.0 10.9 29.7 51.7 5.4 1.6 0.7
X Not applicable. Z Less than .05 percent. 1 Includes arson arrests, a newly established index offense in 1979.2 Breaking or entering. 3 Buying, receiving, possessing. 4 Excludes forcible rape and prostitution, shown separately.
Source: U.S. Federal Bureau of Investigation, Crime in the United States, annual.
No. 325. Drug Use by Arrestees in 24 U.S. Cities, by Type of Drug and Sex: 1992
[Percent testing positive ]
CITYMALE FEMALE
Anydrug 1
Mari-juana Cocaine Heroin Any
drug 1Mari-juana Cocaine Heroin
Atlanta, GA . . . . . . . . . . . . . . . . . . . . 69 22 58 4 65 13 58 5Birmingham, AL . . . . . . . . . . . . . . . . . 64 22 49 3 59 13 46 4Chicago, IL . . . . . . . . . . . . . . . . . . . . 69 26 56 19 (NA) (NA) (NA) (NA)Cleveland, OH . . . . . . . . . . . . . . . . . . 64 17 53 3 74 11 66 5Dallas, TX . . . . . . . . . . . . . . . . . . . . . 59 28 41 4 66 24 48 8Denver, CO . . . . . . . . . . . . . . . . . . . . 60 34 38 2 61 19 50 5Detroit, MI . . . . . . . . . . . . . . . . . . . . . 58 27 37 8 72 11 62 15Fort Lauderdale, FL . . . . . . . . . . . . . . . 64 32 46 1 62 21 47 3Houston, TX. . . . . . . . . . . . . . . . . . . . 59 24 41 3 54 12 44 4Indianapolis, IN. . . . . . . . . . . . . . . . . . 52 35 23 4 50 26 25 7Kansas City, MO . . . . . . . . . . . . . . . . . 60 28 41 2 73 18 62 3Los Angeles, CA . . . . . . . . . . . . . . . . . 67 23 52 10 72 13 58 13Manhattan, NY . . . . . . . . . . . . . . . . . . 77 22 62 18 85 12 72 24Miami, FL . . . . . . . . . . . . . . . . . . . . . 68 30 56 2 (NA) (NA) (NA) (NA)New Orleans, LA. . . . . . . . . . . . . . . . . 60 19 49 4 52 8 44 6Omaha, NE . . . . . . . . . . . . . . . . . . . . 48 38 16 2 (NA) (NA) (NA) (NA)Philadelphia, PA . . . . . . . . . . . . . . . . . 78 26 63 12 78 15 67 11Phoenix, AZ . . . . . . . . . . . . . . . . . . . . 47 22 26 5 63 15 49 15Portland, OR . . . . . . . . . . . . . . . . . . . 60 28 35 11 73 17 54 22St. Louis, MO . . . . . . . . . . . . . . . . . . . 64 21 50 7 70 11 62 7San Antonio, TX . . . . . . . . . . . . . . . . . 54 28 32 15 44 16 25 14San Diego, CA . . . . . . . . . . . . . . . . . . 77 35 45 16 72 25 37 17San Jose, CA . . . . . . . . . . . . . . . . . . . 50 24 28 4 56 18 32 9Washington, DC . . . . . . . . . . . . . . . . . 60 20 44 11 72 8 64 19
NA Not available. 1 Includes other drugs not shown separately.
Source: U.S. National Institute of Justice, Drug Use Forecasting, annual.
Arrests—Drug Use 207

No. 326. Drug Arrest Rates for Drug Abuse Violations, 1980 to 1993,and by Region, 1993
[Rate per 100,000 inhabitants. Based on Bureau of the Census estimated resident population as of July 1, except 1980and 1990, enumerated as of April 1. For composition of regions, see table 27]
OFFENSE 1980 1990 1991 1992
1993
TotalRegion
North-east
Mid-west South West
Drug arrest rate, total . . . . . . . . . 256.0 435.3 400.6 418.1 437.2 523.5 244.9 395.9 580.8
Sale and/or manufacture . . . . . . . . . . . 57.9 139.0 133.8 131.6 129.8 213.7 72.1 105.2 143.6Heroin or cocaine 1 . . . . . . . . . . . . . 10.8 93.7 90.1 85.9 84.1 173.0 25.3 71.1 77.3Marijuana. . . . . . . . . . . . . . . . . . . . 28.4 26.4 24.6 27.1 27.1 31.3 20.2 23.6 34.3Synthetic or manufactured drugs . . . . 2.8 2.7 3.1 2.9 2.5 3.4 1.2 2.9 2.1Other dangerous nonnarcotic drugs . . 15.9 16.2 16.0 15.7 16.1 6.0 25.5 7.5 29.9
Possession . . . . . . . . . . . . . . . . . . . . 198.1 296.3 266.8 286.4 307.4 309.8 172.8 290.7 437.2Heroin or cocaine 1 . . . . . . . . . . . . . 22.2 144.4 131.3 136.8 136.1 165.6 49.0 128.2 192.5Marijuana. . . . . . . . . . . . . . . . . . . . 146.2 104.9 89.6 106.5 120.6 127.7 93.2 138.4 109.4Synthetic or manufactured drugs . . . . 6.7 6.6 5.6 5.0 5.2 4.9 2.4 7.0 5.1Other dangerous nonnarcotic drugs . . 23.0 40.4 40.3 38.1 45.6 11.6 28.2 17.1 130.3
1 Includes other derivatives such as morphine, heroin, and codeine.
Source: U.S. Federal Bureau of Investigation, Crime in the United States, annual.
No. 327. Federal Drug Seizures, by Type of Drug: 1990 to 1994
[For fiscal years ending in year shown . Reflects the combined drug seizure effort of the Drug Enforcement Administration, theFederal Bureau of Investigation, the U.S. Customs Services within the jurisdiction of the United States as well as maritime seizuresby the U.S. Coast Guard. Based on reports to the Federal-wide Drug Seizure System, which eliminates duplicate reporting of aseizure involving more than one Federal agency]
DRUG 1990 1991 1992 1993 1994,prel.
AMOUNTS(lbs.)
Heroin . . . . . . . . . . . . . . . . . . . . . . 1,794 3,030 2,551 3,514 2,824Cocaine . . . . . . . . . . . . . . . . . . . . . 235,214 246,324 303,254 244,302 282,086Marijuana . . . . . . . . . . . . . . . . . . . . 483,248 499,070 783,343 772,307 778,715Hashish . . . . . . . . . . . . . . . . . . . . . 17,062 178,211 4,048 26,060 1,616
PERCENT CHANGE
Heroin . . . . . . . . . . . . . . . . . . . . . . (NA) 68.9 -15.8 37.7 -19.6Cocaine . . . . . . . . . . . . . . . . . . . . . (NA) 4.7 23.1 -19.4 15.5Marijuana . . . . . . . . . . . . . . . . . . . . (NA) 3.3 57.0 -1.4 0.8Hashish . . . . . . . . . . . . . . . . . . . . . (NA) 944.5 -97.7 543.8 -93.8
NA Not available.
Source: U.S. Bureau of Justice Statistics, Fact Sheet: Drug Data Summary, July 1994, series NCJ-148213; and unpublisheddata.
No. 328. Drug Removals, Laboratory Seizures, and Persons Indicted, by DEA:1985 to 1993
[Represents domestic drug removals. 1 kg=.454 lbs; du=dosage unit]
ITEM Unit 1985 1988 1989 1990 1991 1992 1993
Domestic drug removals:Heroin. . . . . . . . . . . . . . . . . . kg . . . . . 447 829 629 637 1,124 696 722Cocaine . . . . . . . . . . . . . . . . kg . . . . . 18,129 57,113 82,438 73,635 57,080 78,211 60,666Cannabis (Marijuana). . . . . . . . 1,000 kg . 745 602 336 149 108 202 143Dangerous drugs . . . . . . . . . . mil. du . . 26 114 109 148 532 49 84
Clandestine laboratory seizures . . Number . 338 810 852 549 408 335 286Narcotic Title III intercepts . . . . . . Number . 136 129 192 235 256 291 308
Asset removals:Total seizures. . . . . . . . . . . . . $1,000 . . 246,344 671,290 975,884 1,106,827 956,960 879,058 679,550DEA seizures . . . . . . . . . . . $1,000 . . 171,888 483,355 659,802 886,184 705,003 669,581 553,133Seizures through inter-agency cooperation . . . . . . $1,000 . . 74,456 187,936 316,082 220,643 251,957 209,478 126,416
Arrests . . . . . . . . . . . . . . . . . . . Number . 15,727 23,994 25,718 23,082 23,025 24,386 21,442Convictions . . . . . . . . . . . . . . . . Number . 10,519 13,091 15,917 15,662 15,962 17,476 18,371
Source: Drug Enforcement Administration (DEA), Annual Report.
Law Enforcement, Courts, and Prisons208

No. 329. Authorized Intercepts of Communication—Summary: 1980 to 1993
[Data for jurisdictions with statutes authorizing or approving interception of wire or oral communication]
ITEM 1980 1983 1984 1985 1986 1987 1988 1989 1990 1991 1992 1993
Jurisdictions: 1With wiretap statutes . . . . . . . . 28 31 31 32 32 33 34 37 40 41 41 41Reporting interceptions . . . . . . 22 20 24 22 24 22 23 25 25 23 23 23Intercept applications authorized 564 648 801 784 754 673 738 763 872 856 919 976Intercept installations . . . . . . . . 524 602 773 722 676 634 678 720 812 802 846 938Federal . . . . . . . . . . . . . . . 79 205 277 235 247 233 286 305 321 349 332 444State . . . . . . . . . . . . . . . . . 445 397 496 487 429 401 392 415 491 453 514 494
Intercepted communications,average 2 . . . . . . . . . . . . . . . . 1,058 1,107 1,209 1,320 1,328 1,299 1,251 1,656 1,487 1,584 1,861 1,801Incriminating . . . . . . . . . . . . . 315 229 298 275 253 230 316 337 321 290 347 364
Persons arrested 3 . . . . . . . . . . . 1,871 1,716 2,393 2,469 2,410 2,226 2,486 2,804 2,057 2,364 2,685 2,428Convictions 3 . . . . . . . . . . . . . 259 521 649 660 761 506 543 706 420 605 607 413
Major offense specified:Gambling . . . . . . . . . . . . . . . 199 157 186 206 189 135 126 111 116 98 66 96Drugs . . . . . . . . . . . . . . . . . . 282 360 483 434 348 379 435 471 520 536 634 679Homicide and assault . . . . . . . 13 31 30 25 34 18 14 20 21 21 35 28Other . . . . . . . . . . . . . . . . . . 70 100 102 119 183 141 163 161 204 201 184 173
1 Jurisdictions include Federal Government, States, and District of Columbia. 2 Average per authorized installation.3 Based on information received from intercepts installed in year shown; additional arrests/convictions will occur in subsequentyears but are not shown here.
Source: Administrative Office of the U.S. Courts, Report on Applications for Orders Authorizing or Approving the Interceptionof Wire, Oral or Electronic Communications, (Wiretap Report), annual.
No. 330. Aliens Expelled and Immigration Violations: 1980 to 1993
[For fiscal years ending in year shown. See text, section 9. See also Historical Statistics, Colonial Times to 1970,series C 144, C 149, and C 158-160]
ITEM Unit 1980 1985 1987 1988 1989 1990 1991 1992 1993
Aliens expelled . . . . . . . . 1,000 . . . . 737 1,062 1,113 934 860 1,045 1,091 1,143 1,279Deported . . . . . . . . . . . . . . 1,000 . . . . 17 21 22 23 30 26 28 38 37Required to depart . . . . . . . . 1,000 . . . . 719 1,041 1,091 911 830 1,019 1,063 1,105 1,242
Prosecutions disposed of. Number . . 14,863 17,688 18,894 18,360 18,580 20,079 18,882 14,655 19,650Immigration violations . . . . . . Number . . . 14,498 16,976 18,200 17,590 17,992 19,351 18,297 14,138 18,958Nationality violations . . . . . . . Number . . . 365 712 694 770 588 728 585 517 692
Convictions . . . . . . . . . . . Number . . 12,935 9,833 11,996 12,208 12,561 12,719 11,509 9,865 12,538Immigration violations . . . . . . Number . . . 12,678 9,635 11,786 11,929 12,379 12,515 11,392 9,766 12,252Nationality violations . . . . . . . Number . . . 257 198 210 279 182 204 117 99 286
No. 331. Immigration Border Patrol and Investigation Activities: 1980 to 1993
[In thousands, except where indicated. For fiscal years ending in year shown. See text, section 9]
ITEM Unit 1980 1985 1987 1988 1989 1990 1991 1992 1993
BORDER PATROL
Border patrol agents:Authorized number . . . . . . Number . . . 2,484 3,228 4,812 4,812 4,804 4,852 4,968 4,948 4,143
On duty . . . . . . . . . . . . . . . Number . . . 2,329 3,023 3,180 4,074 3,857 4,360 4,312 4,759 3,991Border patrol obligations . . . . Mil. dol. . . . 82.5 141.9 194.6 205.3 246.4 261.1 295.5 325.8 354.5
Persons apprehended 1. . . . . 1,000 . . . . 766.6 1,272.4 1,168.9 980.5 906.5 1,123.2 1,152.7 1,221.9 1,281.7Deportable aliens located 2 . . 1,000 . . . . 759.4 1,262.4 1,159.0 971.1 893.0 1,103.4 1,132.9 1,199.6 1,263.5Mexican . . . . . . . . . . . . . . . 1,000 . . . . 734.2 1,218.7 1,124.6 929.8 832.2 1,054.8 1,095.1 1,168.9 1,230.1Canadian . . . . . . . . . . . . . . 1,000 . . . . 5.3 5.9 4.8 4.3 5.3 5.7 6.7 6.2 5.2Other . . . . . . . . . . . . . . . . . 1,000 . . . . 19.9 37.8 29.6 37.0 55.5 42.8 31.1 24.4 28.1
Number of seizures . . . . . . . Number . . . 1,920 7,827 7,512 6,643 10,789 17,275 14,261 11,391 10,995Value of seizures . . . . . . . . . Mil. dol. . . . 116.1 122.0 590.6 721.2 1,212.7 843.6 950.2 1,247.9 1,382.9Narcotics . . . . . . . . . . . . . . Mil. dol. . . . 110.3 119.8 582.4 700.5 1,191.5 797.8 910.1 1,216.8 1,337.8
INVESTIGATIONS
Deportable aliens located. . . . 1,000 . . . . 150.9 83.9 31.5 37.0 61.1 64.1 63.6 57.4 60.4Mexican . . . . . . . . . . . . . . . 1,000 . . . . 83.3 48.3 15.0 19.9 33.1 35.8 35.5 36.2 38.8Canadian . . . . . . . . . . . . . . 1,000 . . . . 1.5 1.1 0.4 0.4 0.5 0.4 0.5 0.4 0.4Other . . . . . . . . . . . . . . . . . 1,000 . . . . 66.1 34.5 16.1 16.7 28.5 30.0 29.7 20.8 21.1
1 Covers deportable aliens located and U.S. citizens engaged in smuggling or other immigration violations. 2Beginning1988, includes apprehension by the antismuggling unit.
Source of tables 330 and 331: U.S. Immigration and Naturalization Service, Statistical Yearbook, annual; and unpublisheddata.
Wiretaps—Aliens—Border Patrol 209

No. 332. Criminal Justice System—Public Expenditures and Employment,by Activity and Level of Government: 1990
[Based on a sample survey of local governments. Data for State governments were compiled from State financial recordsand for the Federal Government from the Budget of the United States Government]
TYPE OF GOVERNMENT Total
ACTIVITY
Policeprotec-tion
Judicial Legalservices
Publicdefense
Correc-tions
Otherjustice
TOTAL EXPENDITURES 1
(mil. dol.)
All governments 2 . . . . . . . . . . . . . . . 74,249 31,805 9,307 5,500 1,742 24,961 934Federal Government . . . . . . . . . . . . . . . . . 10,059 4,020 1,553 1,518 406 1,597 964State and local government 2 . . . . . . . . . . . 64,918 27,784 7,754 3,982 1,336 23,504 557State government . . . . . . . . . . . . . . . . . 28,005 5,197 3,478 1,451 604 16,693 582Local government . . . . . . . . . . . . . . . . . 39,667 23,081 4,635 2,686 788 8,244 233
FULL-TIME EQUIVALENT EMPLOYMENT(1,000)
All governments. . . . . . . . . . . . . . . . . 1,722 800 225 118 16 556 7Federal Government . . . . . . . . . . . . . . . . . 136 65 22 24 (Z) 22 (Z)State and local government . . . . . . . . . . . . 1,586 735 203 93 15 534 7State government . . . . . . . . . . . . . . . . . 576 121 70 30 7 345 5Local government . . . . . . . . . . . . . . . . . 1,007 614 133 63 8 188 2
Z Fewer than 500. 1 Covers direct and intergovernmental expenditures. 2 Totals are adjusted to exclude duplication fromintergovernmental expenditures.
Source: U.S. Bureau of Justice Statistics, Justice Expenditure and Employment in the U.S., 1990.
No. 333. State and Local Government Police Protection and Correction—Employment and Expenditures: 1992
[Employment as of October. Expenditures for fiscal years. Local government data are estimates subject to sampling variation;see Appendix III and source]
REGION,DIVISION,AND STATE
FULL-TIME EQUIVALENTEMPLOYMENT
EXPENDI-TURES
Total
Per 10,000population 1
Total 2(mil.dol.)
Percapita1(dol.)
Policeprotec-tion
Correc-tion
U.S.. . . . . 1,248,277 28.0 20.9 79,502 312
Northeast . . . . 280,837 32.1 22.8 18,640 365N.E. . . . . . . 57,377 27.7 15.8 3,809 289ME . . . . . 4,804 23.7 15.1 248 201NH . . . . . 4,407 27.2 12.3 269 241VT. . . . . . 1,939 21.7 12.2 118 207MA . . . . . 26,735 28.5 16.1 1,781 297RI . . . . . . 4,825 30.0 18.2 303 302CT . . . . . 14,667 28.2 16.5 1,091 333
M.A . . . . . . 223,460 33.7 25.3 14,831 391NY . . . . . 126,843 37.5 32.6 9,000 497NJ. . . . . . 49,061 39.5 23.2 2,887 369PA. . . . . . 47,556 24.1 15.6 2,944 245
Midwest . . . . . 258,207 26.4 16.2 15,298 252E.N.C . . . . . 188,347 27.1 17.0 11,615 272OH . . . . . 44,353 25.1 15.2 2,883 262IN . . . . . . 22,628 23.4 16.6 1,026 181IL . . . . . . 60,289 35.0 16.9 3,255 280MI . . . . . . 40,693 22.6 20.6 2,985 316WI. . . . . . 20,384 26.1 14.7 1,467 294
W.N.C . . . . . 69,860 24.6 14.4 3,683 206MN . . . . . 14,899 21.0 12.4 1,078 241IA . . . . . . 8,855 21.7 9.9 452 161MO . . . . . 23,490 28.7 16.6 1,020 197ND . . . . . 2,011 21.1 10.6 98 155SD . . . . . 2,342 21.5 11.6 121 170NE . . . . . 6,486 24.6 15.9 310 194KS . . . . . 11,777 27.4 19.4 604 240
South . . . . . . . 452,482 27.5 23.8 23,753 269S.A. . . . . . . 248,113 29.0 26.0 14,034 311DE . . . . . 3,621 28.2 24.2 259 375MD . . . . . 25,541 29.7 22.2 1,709 348
REGION,DIVISION,AND STATE
FULL-TIME EQUIVALENTEMPLOYMENT
EXPENDI-TURES
Total
Per 10,000population 1
Total 2(mil.dol.)
Percapita1(dol.)
Policeprotec-tion
Correc-tion
DC . . . . . 10,144 86.9 86.5 719 1,229VA. . . . . . 29,383 24.1 21.9 1,698 266WV . . . . . 4,434 16.7 7.8 212 117NC . . . . . 32,761 25.8 22.1 1,609 235SC . . . . . 17,651 25.0 24.0 869 241GA . . . . . 37,476 27.6 27.7 1,806 267FL . . . . . . 87,102 33.6 31.0 5,153 382
E.S.C . . . . . 63,558 23.7 17.2 3,039 196KY . . . . . 14,460 20.4 18.1 722 192TN . . . . . 23,142 25.0 21.1 1,135 226AL. . . . . . 16,448 25.6 14.2 825 199MS . . . . . 9,508 22.9 13.5 356 136
W.S.C . . . . . 140,811 27.3 23.8 6,680 242AR . . . . . 9,179 22.4 15.9 366 153LA. . . . . . 22,053 28.6 22.9 1,096 256OK . . . . . 14,445 27.5 17.6 623 194TX. . . . . . 95,134 27.5 26.3 4,596 260
West . . . . . . . 256,751 26.8 19.7 21,811 396Mountain. . . 69,716 27.5 21.0 4,476 311MT . . . . . 3,270 24.4 15.4 173 210ID . . . . . . 4,390 25.7 15.5 234 220WY . . . . . 2,346 33.7 16.8 148 319CO . . . . . 15,640 27.3 17.8 1,051 303NM . . . . . 8,279 28.7 23.6 463 293AZ. . . . . . 21,303 29.2 26.4 1,404 366UT . . . . . 6,548 20.6 15.5 396 219NV . . . . . 7,940 32.7 26.7 607 454
Pacific . . . . 187,035 26.6 19.3 17,335 425WA . . . . . 20,388 21.9 17.7 1,679 327OR . . . . . 11,994 22.3 18.1 851 286CA . . . . . 146,321 27.7 19.7 14,032 454AK . . . . . 2,870 27.2 21.7 366 623HI . . . . . . 5,462 29.7 17.5 407 352
1 Based on resident population as of July 1. 2 Covers police protection, corrections, judicial, and legal functions.
Source: U.S. Bureau of the Census, Public Employment, series GE, No. 1, annual, and Government Finances,series GF, No. 5, annual.
Law Enforcement, Courts, and Prisons210
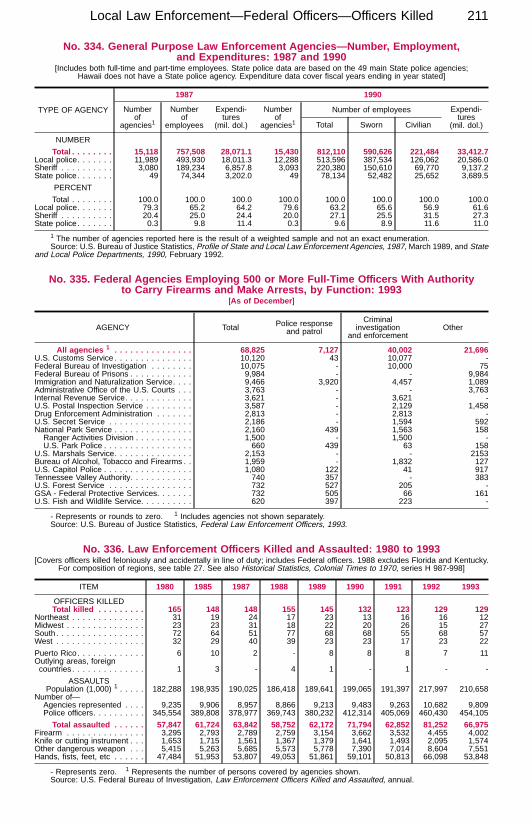
No. 334. General Purpose Law Enforcement Agencies—Number, Employment,and Expenditures: 1987 and 1990
[Includes both full-time and part-time employees. State police data are based on the 49 main State police agencies;Hawaii does not have a State police agency. Expenditure data cover fiscal years ending in year stated]
TYPE OF AGENCY
1987 1990
Numberof
agencies1
Numberof
employees
Expendi-tures
(mil. dol.)
Numberof
agencies1
Number of employees Expendi-tures
(mil. dol.)Total Sworn Civilian
NUMBER
Total . . . . . . . . 15,118 757,508 28,071.1 15,430 812,110 590,626 221,484 33,412.7Local police. . . . . . . 11,989 493,930 18,011.3 12,288 513,596 387,534 126,062 20,586.0Sheriff . . . . . . . . . . 3,080 189,234 6,857.8 3,093 220,380 150,610 69,770 9,137.2State police. . . . . . . 49 74,344 3,202.0 49 78,134 52,482 25,652 3,689.5
PERCENT
Total . . . . . . . . 100.0 100.0 100.0 100.0 100.0 100.0 100.0 100.0Local police. . . . . . . 79.3 65.2 64.2 79.6 63.2 65.6 56.9 61.6Sheriff . . . . . . . . . . 20.4 25.0 24.4 20.0 27.1 25.5 31.5 27.3State police. . . . . . . 0.3 9.8 11.4 0.3 9.6 8.9 11.6 11.0
1 The number of agencies reported here is the result of a weighted sample and not an exact enumeration.Source: U.S. Bureau of Justice Statistics, Profile of State and Local Law Enforcement Agencies, 1987, March 1989, and State
and Local Police Departments, 1990, February 1992.
No. 335. Federal Agencies Employing 500 or More Full-Time Officers With Authorityto Carry Firearms and Make Arrests, by Function: 1993
[As of December ]
AGENCY Total Police responseand patrol
Criminalinvestigation
and enforcementOther
All agencies 1 . . . . . . . . . . . . . . . 68,825 7,127 40,002 21,696U.S. Customs Service . . . . . . . . . . . . . . . 10,120 43 10,077 -Federal Bureau of Investigation . . . . . . . . 10,075 - 10,000 75Federal Bureau of Prisons . . . . . . . . . . . . 9,984 - - 9,984Immigration and Naturalization Service. . . . 9,466 3,920 4,457 1,089Administrative Office of the U.S. Courts . . . 3,763 - - 3,763Internal Revenue Service. . . . . . . . . . . . . 3,621 - 3,621 -U.S. Postal Inspection Service . . . . . . . . . 3,587 - 2,129 1,458Drug Enforcement Administration . . . . . . . 2,813 - 2,813 -U.S. Secret Service . . . . . . . . . . . . . . . . 2,186 - 1,594 592National Park Service . . . . . . . . . . . . . . . 2,160 439 1,563 158Ranger Activities Division . . . . . . . . . . . 1,500 - 1,500 -U.S. Park Police . . . . . . . . . . . . . . . . . 660 439 63 158
U.S. Marshals Service. . . . . . . . . . . . . . . 2,153 - - 2153Bureau of Alcohol, Tobacco and Firearms . . 1,959 - 1,832 127U.S. Capitol Police . . . . . . . . . . . . . . . . . 1,080 122 41 917Tennessee Valley Authority. . . . . . . . . . . . 740 357 - 383U.S. Forest Service . . . . . . . . . . . . . . . . 732 527 205 -GSA - Federal Protective Services. . . . . . . 732 505 66 161U.S. Fish and Wildlife Service. . . . . . . . . . 620 397 223 -
- Represents or rounds to zero. 1 Includes agencies not shown separately.Source: U.S. Bureau of Justice Statistics, Federal Law Enforcement Officers, 1993.
No. 336. Law Enforcement Officers Killed and Assaulted: 1980 to 1993[Covers officers killed feloniously and accidentally in line of duty; includes Federal officers. 1988 excludes Florida and Kentucky.
For composition of regions, see table 27. See also Historical Statistics, Colonial Times to 1970, series H 987-998]
ITEM 1980 1985 1987 1988 1989 1990 1991 1992 1993
OFFICERS KILLEDTotal killed . . . . . . . . . 165 148 148 155 145 132 123 129 129
Northeast . . . . . . . . . . . . . . 31 19 24 17 23 13 16 16 12Midwest . . . . . . . . . . . . . . . 23 23 31 18 22 20 26 15 27South. . . . . . . . . . . . . . . . . 72 64 51 77 68 68 55 68 57West . . . . . . . . . . . . . . . . . 32 29 40 39 23 23 17 23 22
Puerto Rico. . . . . . . . . . . . . 6 10 2 - 8 8 8 7 11Outlying areas, foreigncountries. . . . . . . . . . . . . . 1 3 - 4 1 - 1 - -
ASSAULTSPopulation (1,000) 1 . . . . . 182,288 198,935 190,025 186,418 189,641 199,065 191,397 217,997 210,658
Number of—Agencies represented . . . . 9,235 9,906 8,957 8,866 9,213 9,483 9,263 10,682 9,809Police officers. . . . . . . . . . 345,554 389,808 378,977 369,743 380,232 412,314 405,069 460,430 454,105
Total assaulted . . . . . . 57,847 61,724 63,842 58,752 62,172 71,794 62,852 81,252 66,975Firearm . . . . . . . . . . . . . . . 3,295 2,793 2,789 2,759 3,154 3,662 3,532 4,455 4,002Knife or cutting instrument . . . 1,653 1,715 1,561 1,367 1,379 1,641 1,493 2,095 1,574Other dangerous weapon . . . 5,415 5,263 5,685 5,573 5,778 7,390 7,014 8,604 7,551Hands, fists, feet, etc . . . . . . 47,484 51,953 53,807 49,053 51,861 59,101 50,813 66,098 53,848
- Represents zero. 1 Represents the number of persons covered by agencies shown.Source: U.S. Federal Bureau of Investigation, Law Enforcement Officers Killed and Assaulted, annual.
Local Law Enforcement—Federal Officers—Officers Killed 211
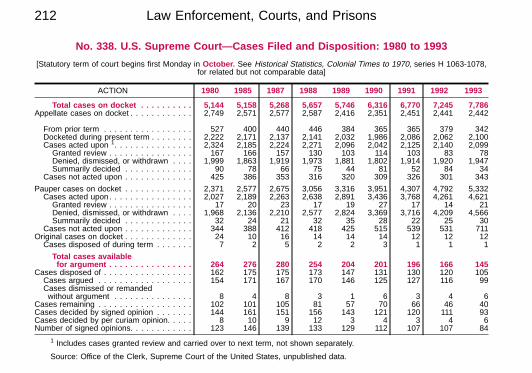
No. 338. U.S. Supreme Court—Cases Filed and Disposition: 1980 to 1993
[Statutory term of court begins first Monday in October. See Historical Statistics, Colonial Times to 1970, series H 1063-1078,for related but not comparable data]
ACTION 1980 1985 1987 1988 1989 1990 1991 1992 1993
Total cases on docket . . . . . . . . . . 5,144 5,158 5,268 5,657 5,746 6,316 6,770 7,245 7,786Appellate cases on docket . . . . . . . . . . . . 2,749 2,571 2,577 2,587 2,416 2,351 2,451 2,441 2,442
From prior term . . . . . . . . . . . . . . . . . 527 400 440 446 384 365 365 379 342Docketed during present term . . . . . . . . 2,222 2,171 2,137 2,141 2,032 1,986 2,086 2,062 2,100Cases acted upon 1. . . . . . . . . . . . . . . 2,324 2,185 2,224 2,271 2,096 2,042 2,125 2,140 2,099Granted review . . . . . . . . . . . . . . . . 167 166 157 130 103 114 103 83 78Denied, dismissed, or withdrawn . . . . 1,999 1,863 1,919 1,973 1,881 1,802 1,914 1,920 1,947Summarily decided . . . . . . . . . . . . . 90 78 66 75 44 81 52 84 34
Cases not acted upon . . . . . . . . . . . . . 425 386 353 316 320 309 326 301 343
Pauper cases on docket . . . . . . . . . . . . . 2,371 2,577 2,675 3,056 3,316 3,951 4,307 4,792 5,332Cases acted upon. . . . . . . . . . . . . . . . 2,027 2,189 2,263 2,638 2,891 3,436 3,768 4,261 4,621Granted review . . . . . . . . . . . . . . . . 17 20 23 17 19 27 17 14 21Denied, dismissed, or withdrawn . . . . 1,968 2,136 2,210 2,577 2,824 3,369 3,716 4,209 4,566Summarily decided . . . . . . . . . . . . . 32 24 21 32 35 28 22 25 30
Cases not acted upon . . . . . . . . . . . . . 344 388 412 418 425 515 539 531 711Original cases on docket . . . . . . . . . . . . . 24 10 16 14 14 14 12 12 12Cases disposed of during term . . . . . . . 7 2 5 2 2 3 1 1 1
Total cases availablefor argument . . . . . . . . . . . . . . . . 264 276 280 254 204 201 196 166 145
Cases disposed of . . . . . . . . . . . . . . . . . 162 175 175 173 147 131 130 120 105Cases argued . . . . . . . . . . . . . . . . . . 154 171 167 170 146 125 127 116 99Cases dismissed or remandedwithout argument . . . . . . . . . . . . . . . 8 4 8 3 1 6 3 4 6
Cases remaining . . . . . . . . . . . . . . . . . . 102 101 105 81 57 70 66 46 40Cases decided by signed opinion . . . . . . . 144 161 151 156 143 121 120 111 93Cases decided by per curiam opinion. . . . . 8 10 9 12 3 4 3 4 6Number of signed opinions. . . . . . . . . . . . 123 146 139 133 129 112 107 107 84
1 Includes cases granted review and carried over to next term, not shown separately.
Source: Office of the Clerk, Supreme Court of the United States, unpublished data.
Law Enforcement, Courts, and Prisons212

No. 339. U.S. Courts of Appeals—Cases Commenced and Disposition: 1980 to 1994[For years ending June 30. See also Historical Statistics, Colonial Times to 1970, series H 1079-1096]
ITEM 1980 1985 1988 1989 1990 1991 1992 1993 1994
Cases commenced 1 . . 23,200 33,360 37,524 39,734 40,898 42,033 46,032 49,770 48,815Criminal . . . . . . . . . 4,405 4,989 6,012 8,020 9,493 9,949 10,956 11,885 11,052U.S. civil . . . . . . . . 4,654 6,744 6,210 6,349 6,626 6,663 7,113 7,758 7,518Private civil. . . . . . . 10,200 16,827 20,464 20,626 20,490 20,798 22,862 24,030 24,781Administrative appeals 2,950 3,179 3,043 2,965 2,578 2,764 3,052 3,824 3,560
Cases terminated 1 . . . 20,887 31,387 35,888 37,372 38,520 41,414 42,933 47,466 48,546Criminal . . . . . . . . . 3,993 4,892 5,284 6,297 7,509 9,198 9,830 11,043 11,519U.S. civil . . . . . . . . 4,346 6,363 6,386 6,127 6,379 6,579 6,797 7,462 7,637Private civil. . . . . . . 8,942 15,743 19,798 20,313 20,369 20,698 21,628 23,437 23,943Administrative appeals 2,643 2,760 2,625 2,914 2,582 3,148 2,801 3,464 3,480
Cases disposed of 2 . . 10,607 16,369 19,178 19,322 21,006 22,707 23,162 25,567 26,475Affirmed or granted . 8,017 12,286 14,953 15,240 16,629 17,988 18,463 20,604 21,371Reversed or denied . 1,845 2,770 2,664 2,617 2,565 2,503 2,681 2,514 2,636Other . . . . . . . . . . 745 1,313 1,561 1,465 1,812 2,216 2,018 2,449 2,468
Median months 3 . . . . 8.9 10.3 10.1 10.3 10.1 10.2 10.5 10.4 10.5
1 Includes original proceedings and bankruptcy appeals not shown separately. 2 Terminated on the merits after hearing orsubmission. 3 Prior to 1985, the figure is from filing of complete record to final disposition; beginning 1985, figure is from filingnotice of appeal to final disposition. For definition of median, see Guide to Tabular Presentation.
No. 340. U.S. District Courts—Civil and Criminal Cases: 1980 to 1994[In thousands, except percent. For years ending June 30. See also Historical Statistics, Colonial Times to 1970,
series H 1097-1111]
ITEM 1980 1985 1988 1989 1990 1991 1992 1993 1994
Civil cases: Commenced . . . . . . . 168.8 273.7 239.6 233.5 217.9 207.7 226.9 228.6 236.0Cases terminated 1 . . . . . . . . . 155.0 268.6 238.1 234.6 213.4 211.7 239.6 225.2 229.3No court action . . . . . . . . . . 68.7 129.4 79.6 64.3 51.6 44.6 51.4 44.0 40.5Court action, total . . . . . . . . 86.2 139.2 158.6 170.4 161.8 166.5 187.6 181.2 188.8Before pretrial . . . . . . . . . 53.8 95.5 114.7 129.7 127.0 136.9 153.4 152.3 160.0Pretrial . . . . . . . . . . . . . . 22.4 31.1 32.2 29.5 25.5 21.1 26.2 21.1 21.0Trials . . . . . . . . . . . . . . . 10.1 12.6 11.6 11.2 9.2 8.4 8.0 7.9 7.9Percent reaching trial. . . 6.5 4.7 4.9 4.8 4.3 4.0 3.4 3.5 3.4
Criminal cases: Commenced 2 . . . 28.0 38.5 43.5 44.9 46.5 45.1 47.5 45.7 44.9Defendants disposed of 3 . . . . . 36.6 47.4 52.8 54.6 56.5 56.7 58.4 59.5 61.2Not convicted . . . . . . . . . . . 8.0 8.8 9.9 10.1 9.8 10.0 10.0 9.2 10.0Convicted. . . . . . . . . . . . . . 28.6 38.5 42.9 44.5 46.7 46.8 48.4 50.4 51.1Imprisonment . . . . . . . . . 13.2 18.7 22.5 24.9 27.8 29.2 31.1 34.2 34.5Probation . . . . . . . . . . . . 11.1 14.4 16.1 15.0 14.2 13.8 13.1 12.6 12.8Fine and other . . . . . . . . . 4.4 5.4 4.4 4.7 4.7 3.8 4.3 3.7 3.9
1 Excludes land condemnation cases. 2 Excludes transfers. 3 Includes Guam, Virgin Islands, and Northern MarianaIslands; 1980 includes Canal Zone.
No. 341. U.S. District Courts—Civil Cases Commenced and Pending: 1991 to 1994[For years ending June 30 ]
TYPE OF CASECASES COMMENCED CASES PENDING
1991 1992 1993 1994 1991 1992 1993 1994
Cases total . . . . . . . . . . 207,690 226,895 228,562 235,996 244,570 237,040 215,574 218,396
Contract actions 1. . . . . . . . . . . . 42,396 51,246 38,240 31,988 42,497 41,588 40,525 34,036Recovery of overpayments 2 . . . 7,932 17,475 7,255 2,591 4,686 4,663 5,995 2,585
Real property actions . . . . . . . . . 9,795 10,143 8,436 7,468 8,743 7,657 7,743 6,810Tort actions . . . . . . . . . . . . . . . . 37,287 36,469 40,939 48,067 77,998 69,734 45,148 46,785Personal injury . . . . . . . . . . . . 34,007 33,147 37,409 44,734 74,141 65,792 41,324 43,105Personal injury productliability 1 . . . . . . . . . . . . . . 12,399 10,769 16,545 23,977 47,288 39,264 15,208 14,721Asbestos . . . . . . . . . . . . 7,142 4,673 4,900 7,111 38,849 31,218 7,154 7,053
Other personal injury . . . . . . 21,608 22,378 20,864 20,757 26,853 26,528 26,116 24,635Personal property damage . . . . 3,280 3,322 3,530 3,333 3,857 3,942 3,824 3,680
Actions under statutes 1 . . . . . . . 118,085 128,921 140,811 148,344 114,853 117,538 121,964 130,504Civil rights 1 . . . . . . . . . . . . . . 19,337 23,419 26,483 31,521 23,791 24,009 26,477 29,179Employment . . . . . . . . . . . . 8,144 10,275 12,221 15,256 11,490 11,156 12,530 14,386
Bankruptcy suits . . . . . . . . . . . 5,013 5,243 6,192 5,675 3,941 4,083 4,203 4,922Commerce (ICC rates, etc.) . . . 1,556 2,475 1,475 1,228 1,441 1,189 1,238 1,149Environmental matters . . . . . . . 1,075 1,252 1,077 1,059 1,538 1,719 1,943 1,949Prisoner petitions . . . . . . . . . . 42,476 46,452 52,454 56,283 35,793 37,259 39,512 42,956Forfeiture and penalty . . . . . . . 5,581 5,492 4,832 3,548 4,886 4,967 4,850 4,323Labor laws. . . . . . . . . . . . . . . 14,684 15,800 16,174 15,800 12,112 12,778 13,026 12,859Protected property rights 3 . . . . 5,231 5,670 6,202 7,051 5,448 5,296 5,281 5,559Securities commodities andexchanges . . . . . . . . . . . . . . 2,245 1,998 1,875 1,742 4,636 4,555 3,983 3,642Social Security laws . . . . . . . . 7,695 8,415 11,602 11,142 8,068 8,154 8,304 11,473Tax suits . . . . . . . . . . . . . . . . 2,639 2,305 2,267 2,275 2,850 2,713 2,255 2,087Freedom of information . . . . . . 363 439 425 566 451 465 498 478
1 Includes other types not shown separately. 2 Includes enforcement of judgments in student loan cases, and overpaymentsof veterans benefits. 3 Includes copyright, patent, and trademark rights.
Source of tables 339-341: Administrative Office of the U.S. Courts, Annual Report of the Director.
U.S. Courts 213

No. 342. U.S. District Courts—Offenders Convicted and Sentenced to Prison,and Length of Sentence: 1992
MOST SERIOUSOFFENSE OFCONVICTION
Offendersconvicted
Convictedoffenderssentencedto prison
Lengthof sen-tence(mo.)
Total 1 . . . . . . . . . 51,936 33,622 62.2
Violent offenses . . . . . . 2,919 2,618 88.5Property offenses . . . . . 14,217 6,557 19.9Fraudulent offenses 2 . 10,253 5,039 19.4Embezzlement. . . . 1,743 718 15.2Fraud 3 . . . . . . . . 7,215 3,669 20.3Forgery . . . . . . . . 726 336 18.2
Other offenses 2 . . . . 3,964 1,518 21.8Larceny . . . . . . . . 3,086 901 17.0
MOST SERIOUSOFFENSE OFCONVICTION
Offendersconvicted
Convictedoffenderssentencedto prison
Lengthof sen-tence(mo.)
Drug offenses 2 . . . . . . 18,698 16,401 82.2Possession . . . . . . . 1,120 414 21.8Trafficking andmanufacturing . . . . . 17,578 15,987 83.8
Public-order offenses. . . 16,101 8,045 47.6Regulatory offenses . . 2,179 856 35.5Other offenses . . . . . 13,922 7,189 49.1Weapons . . . . . . . 3,985 3,426 76.9Immigration. . . . . . 2,364 1,741 15.1Tax law violations 4. 1,062 436 19.0
1 Total may include offenders for whom offense category could not be determined. 2 Includes offenses not shownseparately. 3 Excludes tax fraud. 4 Includes tax fraud.
Source: U.S. Bureau of Justice Statistics, Federal Criminal Case Processing, annual.
No. 343. U.S. District Courts—Defendants Charged With Violations of Drug AbusePrevention and Control Act: 1990 to 1994
[For years ending June 30 ]
ITEMMARIJUANA DRUGS
CONTROLLEDSUBSTANCES
(prescribed drugs)
1990 1992 1993 1994 1990 1992 1993 1994 1990 1992 1993 1994
Defendants disposed of . 5,139 5,438 5,615 5,884 12,649 12,776 12,713 11,461 1,483 2,011 3,215 3,952
Not convicted . . . . . . . . . . . . 1,011 946 870 810 1,850 1,807 1,675 1,613 222 272 422 537Dismissed 1. . . . . . . . . . . . 915 850 780 740 1,506 1,474 1,415 1,381 189 233 339 453
Convicted. . . . . . . . . . . . . . . 4,128 4,492 4,745 5,074 10,799 10,969 11,038 9,848 1,261 1,739 2,793 3,415By guilty plea and nolocontendere. . . . . . . . . . 3,624 4,056 4,310 4,764 8,423 8,806 9,278 8,439 1,020 1,512 2,430 2,981
Imprisonment, total 2. . . . . 3,004 3,585 3,906 4,091 9,804 10,050 10,230 9,289 1,030 1,397 2,412 2,974Regular sentence . . . . . . 2,931 3,538 3,886 4,040 9,551 9,936 10,005 8,920 980 1,355 2,356 2,883Avg. sentence (mo.) . . . 48.9 51.4 45.7 46.8 86.2 98.1 96.8 96.2 79.3 105.0 93.3 88.0
Other sentences toprison2 . . . . . . . . . . . . 73 47 20 51 253 114 225 369 50 42 56 91
Probation, total . . . . . . . . . 1,054 838 754 913 874 831 724 644 207 285 345 424Avg. sentence (mo.) . . . 25.1 32.7 31.1 30.4 40.0 42.4 41.0 40.4 32.3 48.5 36.0 35.5
Fine only. . . . . . . . . . . . . . 39 69 84 70 17 88 85 35 8 57 36 17Other 3 . . . . . . . . . . . . . . . 31 1 4 - 104 3 2 6 16 - 5 4
- Represents zero. 1 Includes defendants committed under 28 USC 2902, Narcotic Addict Rehabilitation Act of 1966.2 Split or mixed sentences of prison and probation in the same case as well as indeterminate and Youth Corrections Act sentencesare included under total imprisonment and other sentences to prison. 3 Includes deportation, suspended sentences,imprisonment for four days or less or for time already served, remitted and suspended fines and life sentences.
Source: Administrative Office of the U.S. Courts, Annual Report of the Director.
No. 344. Federal Prosecutions of Public Corruption: 1980 to 1992[As of Dec. 31. Prosecution of persons who have corrupted public office in violation of Federal Criminal Statutes]
PROSECUTION STATUS 1980 1982 1983 1984 1985 1986 1987 1988 1989 1990 1991 1992
Total: 1 Indicted . . . . . . . . . . . 727 813 1,076 931 1,157 1,208 1,276 1,274 1,348 1,176 1,452 1,189Convicted . . . . . . . . . . . . . 602 671 972 934 997 1,026 1,081 1,067 1,149 1,084 1,194 1,081Awaiting trial. . . . . . . . . . . . 213 186 222 269 256 246 368 288 375 300 346 380
Federal officials: Indicted . . . . 123 158 2460 408 563 596 651 629 695 615 803 624Convicted . . . . . . . . . . . . . 131 147 2424 429 470 523 545 529 610 583 665 532Awaiting trial. . . . . . . . . . . . 16 38 58 77 90 83 118 86 126 103 149 139
State officials: Indicted . . . . . . 72 49 81 58 79 88 102 66 71 96 115 84Convicted . . . . . . . . . . . . . 51 43 65 52 66 71 76 69 54 79 77 92Awaiting trial. . . . . . . . . . . . 28 18 26 21 20 24 26 14 18 28 42 24
Local officials: Indicted. . . . . . 247 257 270 203 248 232 246 276 269 257 242 232Convicted . . . . . . . . . . . . . 168 232 226 196 221 207 204 229 201 225 180 211Awaiting trial. . . . . . . . . . . . 82 58 61 74 49 55 89 79 122 98 88 91 277
1 Includes individuals who are neither public officials nor employees but who were involved with public officials or employeesin violating the law, not shown separately. 2 Increases in the number indicted and convicted between 1982 and 1983 resultedfrom a greater focus on federal corruption nationwide and more consistent reporting of cases involving lower-level employees.
Source: U.S. Department of Justice, Federal Prosecutions of Corrupt Public Officials, 1970-1980 and Report to Congress onthe Activities and Operations of the Public Integrity Section, annual.
Law Enforcement, Courts, and Prisons214

No. 345. Delinquency Cases Disposed by Juvenile Courts, by Reason for Referral:1982 to 1992
[In thousands. A delinquency offense is an act committed by a juvenile for which an adult could be prosecuted in a criminal court.Disposition of a case involves taking a definite action such as transferring the case to criminal court, dismissing the case, placingthe youth on probation, placing the youth in a facility for delinquents, or such actions as fines, restitution, and community service]
REASON FOR REFERRAL 1982 1984 1985 1986 1987 1988 1989 1990 1991 1992
All delinquency offense . . . . 1,073 1,034 1,112 1,150 1,145 1,170 1,212 1,300 1,374 1,471Case rate 1 . . . . . . . . . . . . 39.1 38.7 42.2 43.9 45.7 45.7 47.8 51.0 52.7 55.1
Violent offenses . . . . . . . . . . . . . 57 61 67 73 67 71 78 95 105 119Criminal homicide . . . . . . . . . . 2 1 1 2 1 2 2 3 3 3Forcible rape. . . . . . . . . . . . . . 3 3 4 5 4 4 4 4 5 5Robbery . . . . . . . . . . . . . . . . . 26 22 26 26 22 22 23 28 30 33Aggravated assault . . . . . . . . . 27 35 36 40 39 43 49 60 67 78
Property offenses . . . . . . . . . . . . 475 442 489 496 498 501 525 546 590 599Burglary . . . . . . . . . . . . . . . . . 158 129 139 140 131 129 131 142 151 156Larceny . . . . . . . . . . . . . . . . . 278 276 307 308 314 311 319 327 360 362Motor vehicle theft . . . . . . . . . . 34 31 36 42 47 55 68 71 72 73Arson . . . . . . . . . . . . . . . . . . 5 6 7 6 6 7 7 7 8 8
Delinquency offenses. . . . . . . . . . 541 530 555 583 590 599 610 658 679 753Simple assault. . . . . . . . . . . . . 86 73 92 95 100 104 111 125 134 153Vandalism . . . . . . . . . . . . . . . 64 69 84 84 83 81 83 97 109 122Drug law violations. . . . . . . . . . 62 65 76 73 73 82 78 71 63 72Obstruction of justice . . . . . . . . 47 63 68 76 79 79 82 86 81 87Other 2 . . . . . . . . . . . . . . . . . 282 260 235 255 256 253 257 279 293 320
1 Number of cases disposed per 1,000 youth (ages 10 to 17) at risk. 2 Includes such offenses as stolen property offenses,trespassing, weapons offenses, other sex offenses, liquor law violations, disorderly conduct, and miscellaneous offenses.
Source: National Center for Juvenile Justice, Pittsburgh, PA, Juvenile Court Statistics, annual.
No. 346. Child Abuse and Neglect Cases Substantiated and Indicated—Victim Characteristics: 1990 to 1993
[Based on reports alleging child abuse and neglect that were referred for investigation by the respective child protective servicesagency in each State. The reporting period may be either calendar or fiscal year. The majority of States provided duplicated counts.Also, varying number of States reported the various characteristics presented below. A substantiated case represents a type ofinvestigation disposition that determines that there is sufficient evidence under State law to conclude that maltreatment occurredor that the child is at risk of maltreatment. An indicated case represents a type of disposition that concludes that there was a reasonto suspect maltreatment had occurred]
ITEM1990 1991 1992 1993
Number Percent Number Percent Number Percent Number Percent
TYPES OF SUBSTANTIATEDMALTREATMENT
Victims, total 1 . . . . . . . . . . . . . . . 801,143 (X) 819,922 (X) 1,044,480 (X) 1,057,255 (X)Neglect . . . . . . . . . . . . . . . . . . . . . . . 358,846 44.8 366,462 44.7 474,871 51.7 492,211 48.8Physical abuse . . . . . . . . . . . . . . . . . . 205,057 25.6 206,235 25.2 212,300 23.1 232,061 23.0Sexual abuse . . . . . . . . . . . . . . . . . . . 127,853 16.0 129,425 15.8 130,248 14.2 139,326 13.8Emotional maltreatment . . . . . . . . . . . . 47,673 6.0 46,334 5.7 48,898 5.3 47,659 4.7Other and unknown . . . . . . . . . . . . . . . 61,714 7.7 71,466 8.7 178,163 19.4 145,998 14.5
SEX OF VICTIM
Victims, total . . . . . . . . . . . . . . . . 775,596 100.0 816,223 100.0 956,076 100.0 915,579 100.0Male . . . . . . . . . . . . . . . . . . . . . . . . . 360,531 46.5 376,617 46.1 430,280 45.0 413,210 45.0Female . . . . . . . . . . . . . . . . . . . . . . . 409,286 52.8 434,729 53.3 488,267 51.1 470,541 51.1Unknown . . . . . . . . . . . . . . . . . . . . . . 5,779 0.7 4,877 0.6 37,529 3.9 31,828 3.9
AGE OF VICTIM
Victims, total . . . . . . . . . . . . . . . . 788,338 100.0 813,057 100.0 953,487 100.0 915,909 100.01 year and younger . . . . . . . . . . . . . . . 107,217 13.6 112,227 13.8 122,631 12.9 121,689 13.32 to 5 years old. . . . . . . . . . . . . . . . . . 194,485 24.7 208,183 25.6 244,184 25.6 236,925 25.96 to 9 years old. . . . . . . . . . . . . . . . . . 177,396 22.5 189,124 23.3 216,414 22.7 209,227 22.810 to 13 years old . . . . . . . . . . . . . . . . 151,971 19.3 162,049 19.9 183,297 19.2 177,537 19.414 to 17 years old . . . . . . . . . . . . . . . . 117,312 14.9 122,603 15.1 138,667 14.5 133,852 14.618 and over . . . . . . . . . . . . . . . . . . . . 7,184 0.9 6,327 0.8 7,377 0.8 6,799 0.7Unknown . . . . . . . . . . . . . . . . . . . . . . 32,773 4.2 12,544 1.5 40,917 4.3 29,880 3.3
RACE/ETHNIC GROUPOF VICTIM 2
Victims, total . . . . . . . . . . . . . . . . 775,409 100.0 818,527 99.9 956,248 100.0 916,185 100.0White . . . . . . . . . . . . . . . . . . . . . . . . 424,470 54.7 454,059 55.5 509,111 53.2 497,913 54.3Black . . . . . . . . . . . . . . . . . . . . . . . . 197,400 25.5 218,044 26.6 242,357 25.3 229,596 25.1Asian and Pacific Islander. . . . . . . . . . . 6,408 0.8 6,585 0.8 7,139 0.7 7,775 0.8American Indian, Eskimo, and Aleut . . . . 10,283 1.3 10,873 1.3 12,782 1.3 13,657 1.5Other races . . . . . . . . . . . . . . . . . . . . 11,749 1.5 12,982 1.6 15,094 1.6 13,659 1.5Hispanic origin . . . . . . . . . . . . . . . . . . 73,132 9.4 77,985 9.5 89,426 9.4 85,026 9.3Unknown . . . . . . . . . . . . . . . . . . . . . . 51,967 6.7 37,999 4.6 80,339 8.4 68,559 7.5
X Not applicable. 1 More than one type of maltreatment may be substantiated per child. 2 Some States were unable toreport on the number of Hispanic victims, thus it is probable that nationwide the percentage of Hispanic victims is higher.
Source: U.S. Department of Health and Human Services, National Center on Child Abuse and Neglect, National Child Abuseand Neglect Data System, Working Paper 2, 1991 Summary Data Component, May 1993; Child Maltreatment - 1992, May 1994;and Child Maltreatment - 1993, April 1995.
Juvenile Courts—Child Abuse and Neglect 215

No. 347. Child Abuse and Neglect Cases Reported and Investigated, by State:1992 and 1993
[Based on reports alleging child abuse and neglect that were referred for investigation by the respective child protective servicesagency in each State. The reporting period may be either calendar or fiscal year. The majority of States were unable to provideunduplicated counts. Only nine jurisdictions (Alaska, Hawaii, Michigan, Montana, Ohio, Oregon, South Carolina, Vermont, and Wash-ington) provided unduplicated counts of children subject of report. Excludes the Armed Forces]
STATE
1992 1993
Populationunder 18years old
Reports Investi-gation
disposition,number ofchildrensubstan-tiated 2
Populationunder 18years old
Reports Investi-gation
disposition,number ofchildrensubstan-tiated 2
Numberof
reports 1
Number ofchildrensubjectof areport
Numberof
reports 1
Number ofchildrensubjectof areport
United State s . . . 66,166,000 1,898,098 2,876,184 991,549 67,135,000 1,936,242 2,825,594 1,007,953Alabama . . . . . . . . . . 1,076,000 28,311 43,246 23,265 1,077,000 26,758 40,388 19,130Alaska. . . . . . . . . . . . 185,000 39,079 9,079 8,335 189,000 39,920 9,920 6,917Arizona . . . . . . . . . . . 1,047,000 29,339 51,216 30,556 1,070,000 29,747 51,068 30,729Arkansas . . . . . . . . . . 629,000 17,250 36,089 7,538 635,000 17,489 25,624 10,336California . . . . . . . . . . 8,423,000 326,120 463,090 73,675 8,594,000 342,537 455,526 161,612Colorado . . . . . . . . . . 909,000 34,409 56,305 9,237 938,000 33,287 33,287 7,892Connecticut . . . . . . . . 771,000 14,369 22,080 15,957 775,000 17,871 27,710 23,069Delaware . . . . . . . . . . 172,000 4,586 8,292 2,157 175,000 5,386 9,635 2,271District of Columbia . . . 117,000 5,596 12,093 3,718 115,000 5,669 12,773 3,327Florida. . . . . . . . . . . . 3,106,000 116,403 180,285 88,563 3,169,000 105,468 161,686 81,982Georgia . . . . . . . . . . . 1,800,000 51,225 65,908 46,192 1,841,000 52,519 85,118 55,516Hawaii. . . . . . . . . . . . 293,000 35,310 5,310 2,277 299,000 35,412 5,412 2,297
Idaho . . . . . . . . . . . . 324,000 12,230 24,020 6,395 333,000 12,494 24,759 6,892Illinois . . . . . . . . . . . . 3,029,000 74,220 131,592 43,433 3,068,000 72,101 126,960 43,519Indiana . . . . . . . . . . . 1,461,000 39,233 58,970 30,283 1,469,000 40,263 59,481 29,136Iowa . . . . . . . . . . . . . 735,000 19,432 28,094 7,834 734,000 20,866 30,776 8,834Kansas . . . . . . . . . . . 678,000 322,079 22,079 11,585 684,000 324,797 24,797 12,327Kentucky . . . . . . . . . . 964,000 35,997 56,438 24,437 971,000 36,901 57,706 25,282Louisiana. . . . . . . . . . 1,238,000 26,087 47,893 16,050 1,243,000 27,218 46,170 15,253Maine . . . . . . . . . . . . 306,000 4,826 10,177 4,927 307,000 4,286 9,567 4,955Maryland . . . . . . . . . . 1,226,000 30,062 49,191 (NA) 1,241,000 29,412 29,412 (NA)Massachusetts . . . . . . 1,384,000 32,286 52,581 24,601 1,393,000 31,833 51,941 24,186Michigan . . . . . . . . . . 2,509,000 51,601 117,316 25,931 2,506,000 53,302 126,601 19,522Minnesota . . . . . . . . . 1,206,000 17,988 27,462 11,217 1,228,000 17,427 26,778 10,535Mississippi . . . . . . . . . 748,000 17,528 32,076 10,712 758,000 17,606 27,568 8,812
Missouri. . . . . . . . . . . 1,350,000 49,286 79,493 24,339 1,363,000 52,268 85,323 20,472Montana . . . . . . . . . . 226,000 9,691 14,760 5,328 232,000 9,005 13,713 4,827Nebraska. . . . . . . . . . 439,000 7,961 17,029 5,262 439,000 8,439 17,481 5,726Nevada . . . . . . . . . . . 338,000 13,914 22,768 7,699 352,000 12,568 12,568 7,085New Hampshire . . . . . 280,000 6,755 11,053 917 283,000 6,225 7,234 928New Jersey . . . . . . . . 1,863,000 350,443 50,443 17,499 1,896,000 365,102 65,102 10,510New Mexico . . . . . . . . 469,000 326,969 26,969 6,716 481,000 324,984 24,984 6,880New York. . . . . . . . . . 4,422,000 137,779 228,457 92,238 4,468,000 139,468 230,916 59,311North Carolina . . . . . . 1,662,000 55,411 88,472 29,546 1,704,000 58,376 92,739 29,809North Dakota . . . . . . . 172,000 4,515 7,565 3,669 172,000 4,884 8,252 4,010Ohio . . . . . . . . . . . . . 2,820,000 95,376 148,101 61,327 2,859,000 93,144 147,106 51,850Oklahoma . . . . . . . . . 858,000 324,092 24,092 8,063 869,000 326,349 26,349 8,359
Oregon . . . . . . . . . . . 766,000 25,622 41,916 8,705 782,000 25,227 25,227 (NA)Pennsylvania . . . . . . . 2,844,000 325,891 25,891 8,419 2,872,000 324,909 24,909 7,814Rhode Island . . . . . . . 233,000 8,395 12,886 4,931 235,000 8,278 13,065 3,130South Carolina . . . . . . 945,000 19,712 33,854 11,348 952,000 21,227 40,147 11,263South Dakota . . . . . . . 204,000 310,486 10,486 2,903 208,000 310,284 10,284 2,368Tennessee . . . . . . . . . 1,246,000 331,231 31,231 11,469 1,269,000 332,739 32,739 12,136Texas . . . . . . . . . . . . 5,072,000 110,937 174,255 62,342 5,183,000 110,973 177,328 58,304Utah . . . . . . . . . . . . . 654,000 15,910 27,047 10,875 665,000 16,168 27,485 10,976Vermont . . . . . . . . . . 144,000 2,750 2,778 1,498 144,000 2,732 3,190 1,305Virginia . . . . . . . . . . . 1,562,000 35,880 55,680 14,472 1,588,000 36,257 55,937 14,066Washington . . . . . . . . 1,355,000 39,704 55,836 41,879 1,393,000 40,075 55,689 41,602West Virginia . . . . . . . 438,000 12,932 21,161 (NA) 434,000 12,932 12,932 (NA)Wisconsin . . . . . . . . . 1,330,000 347,622 47,622 19,213 1,342,000 349,152 49,152 19,189Wyoming . . . . . . . . . . 138,000 3,268 5,457 2,017 138,000 3,908 5,080 1,702
NA Not available. 1 Except as noted, reports are on incident/family based basis or based on number of reported incidentsregardless of the number of children involved in the incidents. 2 Type of investigation disposition that determines that there issufficient evidence under State law to conclude that maltreatment occurred or that the child is at risk of maltreatment.3 Child-based report that enumerates each child who is a subject of a report.
Source: U.S. Department of Health and Human Services, National Center on Child Abuse and Neglect, Child Maltreatment -1992, May 1994; and Child Maltreatment -1993, April 1995.
Law Enforcement, Courts, and Prisons216

No. 348. Jail Inmates, by Race and Detention Status: 1978 to 1994[Excludes Federal and State prisons or other correctional institutions; institutions exclusively for juveniles; State-operated jails inAlaska, Connecticut, Delaware, Hawaii, Rhode Island, and Vermont; and other facilities which retain persons for less than 48 hours.As of June 30. For 1978 and 1988, data based on National Jail Census; for other years, based on sample survey and subject tosampling variability]
CHARACTERISTIC 1978 1985 1988 1989 1990 1991 1992 1993 1994
Total inmates 1 . . . . . . . . . . . . 158,394 256,615 343,569 395,553 405,320 426,479 444,584 459,804 490,442Percent of rated capacity . . . . . 65 94 101 108 104 101 99 97 97
Male . . . . . . . . . . . . . . . . . . . . . . . 148,839 235,909 313,158 356,050 368,002 386,865 403,768 415,700 441,219Female. . . . . . . . . . . . . . . . . . . . . . 9,555 19,077 30,411 37,253 37,318 39,614 40,816 44,100 49,223White 2. . . . . . . . . . . . . . . . . . . . . . 89,418 151,403 166,302 201,732 186,989 190,333 191,362 239,500 255,800Black 2 . . . . . . . . . . . . . . . . . . . . . . 65,104 102,646 141,979 185,910 174,335 187,618 195,156 214,100 227,000Other races 2. . . . . . . . . . . . . . . . . . 3,872 2,566 3,932 7,911 5,321 5,391 5,831 6,200 7,600Hispanic 3 . . . . . . . . . . . . . . . . . . . . 16,349 35,926 51,455 55,377 57,449 60,129 62,961 69,200 75,500Non-Hispanic. . . . . . . . . . . . . . . . . . 142,045 220,689 292,114 340,176 347,871 366,350 381,623 390,600 414,942Adult 4 . . . . . . . . . . . . . . . . . . . . . . 156,783 254,986 341,893 393,303 403,019 424,129 441,781 455,500 (NA)Awaiting arraignment or trial . . . . . . 77,453 127,059 175,669 204,291 207,358 217,671 223,840 228,900 (NA)Convicted . . . . . . . . . . . . . . . . . . 75,438 123,409 166,224 189,012 195,661 206,458 217,940 226,600 (NA)
Juvenile 5 . . . . . . . . . . . . . . . . . . . . 1,611 1,629 1,676 2,250 2,301 2,350 2,804 4,300 (NA)
NA Not available. 1 For 1985, 1989-1994, includes juveniles not shown separately by sex, and for 1988 and 1990-1994includes 31,356, 38,675, 43,138, 52,235, 66,249, and 93,058 persons, respectively, of unknown race not shown separately.2 For 1993 and 1994, data are estimated and rounded to nearest 100. 3 Hispanic persons may be of any race. Data for 1993and 1994 are estimated and rounded to nearest 100. 4 Includes inmates not classified by conviction status. 5 Juveniles arepersons whose age makes them initially subject to juvenile court authority although they are sometimes tried as adults in criminalcourt. In 1993, includes juveniles who were tried as adults. In 1994, includes all persons under age 18.
Source: U.S. Bureau of Justice Statistics, Profile of Jail Inmates, 1978 and 1989; Jail Inmates, annual; and 1988 Census ofLocal Jails.
No. 349. Federal and State Prisoners: 1970 to 1993[Based on Bureau of the Census estimated resident population, as of July 1. Prior to 1970, excludes State institutions in Alaska.Beginning 1980, includes all persons under jurisdiction of Federal and State authorities rather than those in the custody of suchauthorities. Represents inmates sentenced to maximum term of more than a year. See also Historical Statistics, Colonial Timesto 1970, series H 1135-1140]
YEAR
PRESENT AT END OF YEAR RECEIVED FROM COURTS
All institutions Federal State All institutions Federal State
Number Rate 1 Number Rate 1 Number Rate 1 Number Rate 1 Number Rate 1 Number Rate 1
1970 . . . 196,429 96.7 20,038 9.8 176,391 86.8 79,351 39.1 12,047 5.9 67,304 33.11975 . . . 240,593 113.3 24,131 11.4 216,462 102.0 129,573 61.0 16,770 7.9 112,803 53.11980 . . . 315,974 139.2 20,611 9.1 295,363 130.1 142,122 62.7 10,907 4.8 131,215 57.91985 . . . 480,568 216.5 32,695 13.6 447,873 187.6 198,499 82.7 15,368 6.4 183,131 76.31986 . . . 522,084 230.4 36,531 15.0 485,553 201.4 219,382 91.0 16,067 7.0 203,315 84.01987 . . . 560,812 229.0 39,523 16.0 521,289 214.2 241,887 99.0 16,260 7.0 225,627 92.01988 . . . 603,732 244.0 42,738 17.0 560,994 227.0 261,242 106.0 15,932 6.4 245,310 99.31989 . . . 680,907 274.3 47,168 19.0 633,739 255.3 316,215 127.4 18,388 7.4 297,827 120.01990 . . . 739,980 295.0 50,403 20.1 689,577 274.9 (NA) (NA) (NA) (NA) 323,069 128.81991 . . . 789,610 309.6 56,696 22.2 732,914 287.3 (NA) (NA) (NA) (NA) 317,237 124.41992 . . . 846,277 331.8 65,706 25.8 780,571 306.0 (NA) (NA) (NA) (NA) 334,301 130.31993 . . . 910,080 352.9 74,399 28.8 835,681 324.0 341,722 132.5 23,653 9.2 318,069 123.3
NA Not available. 1 Rate per 100,000 estimated population.Source: U.S. Bureau of Justice Statistics, Prisoners in State and Federal Institutions on December 31, annual, and
Correctional Populations in the United States, annual.
No. 350. State Prison Inmates—Selected Characteristics: 1986 and 1991[Based on a sample survey of about 13,986 inmates in 1991 and 13,711 inmates in 1986; subject to sampling variability]
CHARACTERISTICNUMBER
PERCENTOF PRISONINMATES
1986 1991 1986 1991
Total 1 . . . . . . . . . . 450,416 711,643 100.0 100.0
Under 18 years old. . . . . 2,057 4,552 0.5 0.618 to 24 years old . . . . . 120,384 151,328 26.7 21.325 to 34 years old . . . . . 205,817 325,429 45.7 45.735 to 44 years old . . . . . 87,502 161,651 19.4 22.745 to 54 years old . . . . . 23,524 46,475 5.2 6.555 to 64 years old . . . . . 8,267 16,997 1.8 2.465 years old and over . . . 2,808 5,210 0.6 0.7
Male . . . . . . . . . . . . . . 430,604 672,847 95.6 94.5Female. . . . . . . . . . . . . 19,812 38,796 4.4 5.5White . . . . . . . . . . . . . . 223,648 349,628 49.7 49.1Black . . . . . . . . . . . . . . 211,021 336,920 46.9 47.3Other races. . . . . . . . . . 15,412 25,094 3.4 3.5
CHARACTERISTICNUMBER
PERCENTOF PRISONINMATES
1986 1991 1986 1991
Never married . . . . . . . . 241,707 389,302 53.7 55.3Married. . . . . . . . . . . . . 91,492 127,389 20.3 18.1Widowed . . . . . . . . . . . 8,343 13,036 1.9 1.9Divorced. . . . . . . . . . . . 81,264 129,913 18.1 18.5Separated. . . . . . . . . . . 26,985 44,095 6.0 6.3Years of school:Less than 12 years . . . 276,309 2290,722 61.6 241.212 years or more . . . . 172,386 415,451 38.4 58.8
Pre-arrest employmentstatus:Employed . . . . . . . . . 309,364 476,068 69.0 67.3Not employed. . . . . . . 139,097 230,876 31.0 32.7Looking for work . . . 80,750 115,590 18.0 16.4Not looking for work . 58,347 115,286 13.0 16.3
1 For 1986, includes data not reported for all characteristics except sex. For 1991, includes data not reported for marital status,re-arrest, employment status, and years of school. 2 In 1991, the survey question was revised; therefore, the response may notbe entirely comparable with 1986 and before.
Source: U.S. Bureau of Justice Statistics, Profile of State Prison Inmates, 1986; and Survey of State Prison Inmates, 1991.
Jail Inmates—Prisoners 217

No. 351. State Prison Inmates, by Criminal History and Selected Characteristicsof the Inmate: 1991
[Violent/nonviolent refers to the current or past criminal offense for which the inmate is or was incarcerated; see table 308 fortypes of violent crimes. Data based on a sample survey of 13,986 inmates; subject to sampling variability]
CHARACTERISTIC
CRIMINAL HISTORY OF PRISON INMATES
Total
First-timers Recidivists 1
Total Non-violent Violent Total Non-
violentPriorviolent
Currentviolentonly
Currentandpriorviolent
Prison inmates, total . . . . . . . . 697,853 134,131 45,559 88,572 563,722 223,117 88,689 131,289 120,626Percent of total. . . . . . . . . . . 100.0 19.2 6.5 12.7 80.8 32.0 12.7 18.8 17.3
Percent distribution . . . . . . . . . . . . . 100.0 100.0 100.0 100.0 100.0 100.0 100.0 100.0 100.0Male . . . . . . . . . . . . . . . . . . . . . 94.5 92.0 89.7 93.2 95.1 92.1 96.5 96.9 97.8Female . . . . . . . . . . . . . . . . . . . 5.5 8.0 10.3 6.8 4.9 7.9 3.5 3.1 2.2
White . . . . . . . . . . . . . . . . . . . . 49.0 52.6 50.9 53.4 48.2 52.9 40.1 50.4 42.9Black. . . . . . . . . . . . . . . . . . . . . 47.5 43.6 45.7 42.6 48.4 43.7 56.5 45.6 54.0Other races . . . . . . . . . . . . . . . . 3.5 3.8 3.4 4.0 3.5 3.4 3.4 4.0 3.1
Median age (years) . . . . . . . . . . . . . 30 31 30 31 30 29 30 30 32Median age at first arrest (years) . . . . 18 24 25 23 17 18 16 17 16
1 An individual who has been previously sentenced to probation or incarceration as a juvenile or adult.
Source: U.S. Bureau of Justice Statistics, Survey of State Prison Inmates, 1991.
No. 352. Prisoners Under Jurisdiction of State and Federal Correctional Authorities—Summary, by State: 1980 to 1993
[For years ending December 31 ]
SEX,REGION,DIVISION,
ANDSTATE
1980 1990 1992
1993
Total
Percentchange,1992-1993
U.S.. . 329,821 773,919 882,500 946,946 7.3Male. . . . . 316,401 729,840 832,093 891,885 7.2Female . . . 13,420 44,079 50,407 55,061 9.2Federal . . . 24,363 65,526 80,259 89,587 11.6State . . . . 305,458 708,393 802,241 857,359 6.9
Northeast . 45,796 123,464 138,144 145,425 5.3N.E. . . . 9,926 25,151 28,781 30,975 7.6ME . . 814 1,523 1,519 1,469 -3.3NH . . 326 1,342 1,777 1,775 -0.1VT 1 . 480 1,049 1,254 1,223 -2.5MA 2 . 3,185 8,345 10,053 10,034 -0.2RI 1 . . 813 2,392 2,775 2,783 0.3CT 1 . 4,308 10,500 11,403 13,691 20.1
M.A . . . 35,870 98,313 109,363 114,450 4.7NY . . 21,815 54,895 61,736 64,569 4.6NJ. . . 5,884 21,128 22,653 23,831 5.2PA. . . 8,171 22,290 24,974 26,050 4.3
Midwest . . 66,211 145,894 166,308 173,277 4.2E.N.C . . 51,175 113,806 131,267 137,705 4.9OH . . 13,489 31,822 38,378 40,641 5.9IN . . . 6,683 12,736 13,945 14,470 3.8IL 2 . . 11,899 27,516 31,640 34,495 9.0MI 2 . . 15,124 34,267 39,113 39,318 0.5WI. . . 3,980 7,465 8,191 8,781 7.2
W.N.C . . 15,036 32,088 35,041 35,572 1.5MN . . 2,001 3,176 3,822 4,200 9.9IA 2 . . 2,481 3,967 4,518 4,898 8.4MO 2 . 5,726 14,943 16,195 16,178 -0.1ND . . 253 483 477 498 4.4SD . . 635 1,341 1,487 1,553 4.4NE . . 1,446 2,403 2,514 2,518 0.2KS . . 2,494 5,775 6,028 5,727 -5.0
South . . . . 146,358 284,651 323,600 350,825 8.4S.A. . . . 78,815 152,952 170,476 181,401 6.4
SEX,REGION,DIVISION,
ANDSTATE
1980 1990 1992
1993
Total
Percentchange,1992-1993
DE 1 . 1,474 3,471 4,062 4,210 3.6MD . . 7,731 17,848 19,977 20,264 1.4DC 1 . 3,145 9,947 10,875 10,845 -0.3VA. . . 8,920 17,593 21,199 22,850 7.8WV 3 . 1,257 1,565 1,674 1,805 7.8NC . . 15,513 18,411 20,454 21,892 7.0SC . . 7,862 17,319 18,643 18,704 0.3GA 2 . 12,178 22,411 25,290 27,783 9.9FL 2 . . 20,735 44,387 48,302 53,048 9.8
E.S.C . . 21,055 43,451 48,571 51,795 6.6KY . . 3,588 9,023 10,364 10,440 0.7TN . . 7,022 10,388 11,849 12,824 8.2AL. . . 6,543 15,665 17,453 18,624 6.7MS . . 3,902 8,375 8,905 9,907 11.3
W.S.C . . 46,488 88,248 104,553 117,629 12.5AR . . 2,911 7,322 8,285 8,625 4.1LA. . . 8,889 18,599 20,980 22,468 7.1OK . . 4,796 12,285 14,821 16,409 10.7TX 2 3. 29,892 50,042 60,467 70,127 16.0
West . . . . 47,093 154,384 174,189 187,832 7.8Mt . . . . 13,141 37,433 42,360 45,073 6.4MT . . 739 1,425 1,548 1,541 -0.5ID . . . 817 1,961 2,256 2,606 15.5WY . . 534 1,110 1,063 1,129 6.2CO . . 2,629 7,671 8,997 9,462 5.2NM . . 1,279 3,187 3,271 3,498 6.9AZ 2 . 4,372 14,261 16,477 17,811 8.1UT . . 932 2,496 2,699 2,888 7.0NV . . 1,839 5,322 6,049 6,138 1.5
Pac . . . 33,952 116,951 131,829 142,759 8.3WA . . 4,399 7,995 9,959 10,419 4.6OR . . 3,177 6,492 6,583 6,557 -0.4CA 2 . 24,569 97,309 109,496 119,951 9.5AK 1 2. 822 2,622 2,865 2,703 -5.7HI 1 . . 985 2,533 2,926 3,129 6.9
1 Includes both jail and prison inmates (State has combined jail and prison system). 2 Numbers are custodial, notjurisdictional counts. 3 Jurisdiction counts exclude prisoners held in jail because of crowding.
Source: U.S. Bureau of Justice Statistics, Prisoners in 1993, and earlier reports.
Law Enforcement, Courts, and Prisons218

No. 353. Adults on Probation, in Jail or Prison, or on Parole: 1980 to 1992
[As of December 31, except jail counts as of June 30 ]
ITEM Total 1 Probation Jail Prison Parole
1980 . . . . . . . . . . . . . . . . . . . . . . . 1,840,400 1,118,097 2182,288 319,598 220,4381981 . . . . . . . . . . . . . . . . . . . . . . . 2,006,600 1,225,934 2195,085 360,029 225,5391982 . . . . . . . . . . . . . . . . . . . . . . . 2,192,600 1,357,264 207,853 402,914 224,6041983 . . . . . . . . . . . . . . . . . . . . . . . 2,475,100 1,582,947 221,815 423,898 246,4401984 . . . . . . . . . . . . . . . . . . . . . . . 2,689,200 1,740,948 233,018 448,264 266,992
1985 . . . . . . . . . . . . . . . . . . . . . . . 3,011,400 1,968,712 254,986 487,593 300,2031986 . . . . . . . . . . . . . . . . . . . . . . . 3,239,400 2,114,621 272,735 526,436 325,6381987 . . . . . . . . . . . . . . . . . . . . . . . 3,459,600 2,247,158 294,092 562,814 355,5051988 . . . . . . . . . . . . . . . . . . . . . . . 3,714,100 2,356,483 341,893 607,766 407,9771989 . . . . . . . . . . . . . . . . . . . . . . . 4,055,600 2,522,125 393,303 683,367 456,803
1990 . . . . . . . . . . . . . . . . . . . . . . . 4,348,100 2,670,234 403,019 743,382 531,4071991 . . . . . . . . . . . . . . . . . . . . . . . 4,536,200 2,729,322 424,129 792,535 590,198
1992 . . . . . . . . . . . . . . . . . . . . . . . 4,763,200 2,811,611 441,781 851,205 658,601Sex:Male . . . . . . . . . . . . . . . . . . . . 4,050,900 2,257,900 401,100 804,200 587,700Female . . . . . . . . . . . . . . . . . . 712,300 553,700 40,700 47,100 70,800
Race:White . . . . . . . . . . . . . . . . . . . 2,682,200 1,689,500 233,000 411,800 347,800Black. . . . . . . . . . . . . . . . . . . . 1,781,700 857,100 195,200 427,700 301,600
1 Totals may not add due to individuals having multiple correctional statuses. 2 Estimated.
Source: U.S. Bureau of Justice Statistics, Correctional Populations in the United States, 1992.
No. 354. Prisoners Under Sentence of Death: 1980 to 1993[As of December 31. Excludes prisoners under sentence of death who remained within local correction
systems pending exhaustion of appellate process or who had not been committed to prison]
CHARACTERISTIC 1980 1990 1991 1992 1993
Total 1 . . . . . . . . . 688 2,346 2,466 2,575 2,716
White . . . . . . . . . . . . . 418 1,368 1,450 1,508 1,566Black and other . . . . . . 270 978 1,016 1,067 1,150
Under 20 years . . . . . . 11 8 14 12 1320 to 24 years . . . . . . . 173 168 179 188 21125 to 34 years . . . . . . . 334 1,110 1,087 1,078 1,06635 to 54 years . . . . . . . 186 1,006 1,129 1,212 1,33055 years and over. . . . . 10 64 73 85 96
Years of schoolcompleted:7 years or less . . . . . 68 178 173 181 1858 years . . . . . . . . . . 74 186 181 180 1839 to 11 years . . . . . . 204 775 810 836 88512 years . . . . . . . . . 162 729 783 831 887More than 12 years . . 43 209 222 232 244
CHARACTERISTIC 1980 1990 1991 1992 1993
Unknown . . . . . . . . . 163 279 313 315 332Marital status:Never married. . . . . . 268 998 1,071 1,132 1,222Married . . . . . . . . . . 229 632 663 663 671Divorced 2 . . . . . . . . 217 726 746 780 823
Time elapsed sincesentencing:Less than 12 months . 185 231 252 265 26212 to 47 months . . . . 389 753 718 720 71648 to 71 months . . . . 102 438 441 444 42272 months and over . . 38 934 1,071 1,146 1,316
Legal status at arrest:Not under sentence . . 384 1,345 1,415 1,476 1,562Parole or probation 3 . 115 578 615 702 754Prison or escaped . . . 45 128 102 101 102Unknown . . . . . . . . . 170 305 321 296 298
1 For 1980 to 1991, revisions to the total number of prisoners were not carried to the characteristics except for race.2 Includes persons married but separated, widows, widowers, and unknown. 3 Includes prisoners on mandatory conditionalrelease, work release, leave, AWOL, or bail. Covers 24 prisoners in 1989, 28 in 1990, and 29 in 1991 and 1992.
Source: U.S. Bureau of Justice Statistics, Capital Punishment, annual.
Adults on Probation, in Prison, on Parole—Death Sentence 219

No. 355. Movement of Prisoners Under Sentence of Death: 1980 to 1993[Prisoners reported under sentence of death by civil authorities. The term ‘‘under sentence of death’’ begins when
the court pronounces the first sentence of death for a capital offense]
STATUS 1980 1984 1985 1986 1987 1988 1989 1990 1991 1992 1993
Under sentence of death, Jan. 1 . . 595 1,209 1,420 1,575 1,800 1,967 2,117 2,243 2,346 2,465 2,580Received death sentence 1 2 . . . . 203 296 281 297 299 296 251 244 266 265 282White . . . . . . . . . . . . . . . . . . 125 173 165 164 190 196 133 147 163 147 146Black . . . . . . . . . . . . . . . . . . 77 119 114 123 106 91 114 94 101 114 130
Dispositions other than executions 2 101 69 108 73 90 128 102 108 116 124 108Executions . . . . . . . . . . . . . . . . - 21 18 18 25 11 16 23 14 31 38Under sentence of death, Dec. 31 1 688 1,420 1,575 1,800 1,967 2,117 2,243 2,346 2,466 2,575 2,716White . . . . . . . . . . . . . . . . . . 425 809 896 1,006 1,128 1,238 1,308 1,368 1,450 1,508 1,566Black . . . . . . . . . . . . . . . . . . 268 595 664 750 813 853 898 940 1,016 1,029 1,109
- Represents zero. 1 Includes races other than White or Black. 2 Revisions to total number of prisoners under deathsentence not carried to this category.
Source: U.S. Bureau of Justice Statistics, Capital Punishment, annual.
No. 356. Prisoners Executed Under Civil Authority: 1930 to 1993[Excludes executions by military authorities. The Army (including the Air Force) carried out 160 (148 between 1942 and 1950;3 each in 1954, 1955, and 1957; and 1 each in 1958, 1959, and 1961). Of the total, 106 were executed for murder (including 21involving rape), 53 for rape, and 1 for desertion. The Navy carried out no executions during the period. See also Historical Statistics,Colonial Times to 1970, series H 1155-1167]
YEAR OR PERIOD Total 1 White BlackEXECUTED FOR
MURDER EXECUTED FOR RAPE EXECUTED, OTHEROFFENSES 2
Total 1 White Black Total 1 White Black Total 1 White Black
All years . . . . . 4,089 1,864 2,154 3,564 1,777 1,718 455 48 405 70 39 31
1930 to 1939. . . . . . 1,667 827 816 1,514 803 687 125 10 115 28 14 141940 to 1949. . . . . . 1,284 490 781 1,064 458 595 200 19 179 20 13 71950 to 1959. . . . . . 717 336 376 601 316 280 102 13 89 14 7 71960 to 1967. . . . . . 191 98 93 155 87 68 28 6 22 8 5 31968 to 1976. . . . . . - - - - - - - - - - - -1977 to 1981. . . . . . 4 4 - 4 4 - - - - - - -1982 . . . . . . . . . . . 2 1 1 2 1 1 - - - - - -1983 . . . . . . . . . . . 5 4 1 5 4 1 - - - - - -1984 . . . . . . . . . . . 21 13 8 21 13 8 - - - - - -1985 . . . . . . . . . . . 18 11 7 18 11 7 - - - - - -1986 . . . . . . . . . . . 18 11 7 18 11 7 - - - - - -1987 . . . . . . . . . . . 25 13 12 25 13 12 - - - - - -1988 . . . . . . . . . . . 11 6 5 11 6 5 - - - - - -1989 . . . . . . . . . . . 16 8 8 16 8 8 - - - - - -1990 . . . . . . . . . . . 23 16 7 23 16 7 - - - - - -1991 . . . . . . . . . . . 14 7 7 14 7 7 - - - - - -1992 . . . . . . . . . . . 31 19 11 31 19 11 - - - - - -1993 . . . . . . . . . . . 38 23 14 38 23 14 - - - - - -
- Represents zero. 1 Includes races other than White or Black. 2 Includes 25 armed robbery, 20 kidnapping, 11 burglary,8 espionage (6 in 1942 and 2 in 1953), and 6 aggravated assault.
Source: Through 1978, U.S. Law Enforcement Assistance Administration; thereafter, U.S. Bureau of Justice Statistics,Correctional Populations in the United States, annual.
No. 357. Prisoners Under Sentence of Death and Executed Under Civil Authority,by States: 1977 to 1993
[No executions took place in Delaware, Maine, Massachusetts, Michigan, Minnesota, Montana, New Hampshire, North Dakota,Rhode Island, South Dakota, and Wisconsin from 1977 to 1993. Maine, Minnesota, and Wisconsin never authorized the deathpenalty during the period. New Hampshire and Rhode Island authorized it for most of the 4 decades but did not apply it. Michiganabolished the penalty and North Dakota allowed the punishment statute to lapse in 1975. Alaska and Hawaii could enter these dataafter receiving statehood in 1959, but neither has authorized the death penalty]
STATE1977to
19891990 1991 1992 1993
U.S. . 120 23 14 31 38AL . . . 7 1 - 2 -AZ . . . - - - 1 2AR . . . - 2 - 2 -CA . . . - - - 1 1CO . . . - - - - -CT . . . - - - - -DC . . . - - - - -FL. . . . 21 4 2 2 3GA . . . 14 - 1 - 2ID . . . . - - - - -IL . . . . - 1 - - -IN . . . . 2 - - - -
STATE1977to
19891990 1991 1992 1993
IA . . . . - - - - -KS . . . - - - - -KY . . . - - - - -LA . . . 18 1 1 - 1MD . . . - - - - -MS . . . 4 - - - -MO . . . 1 4 1 1 4NE . . . - - - - -NV . . . 4 1 - - -NJ. . . . - - - - -NM . . . - - - - -NY . . . - - - - -NC . . . 3 - 1 1 -
STATE1977to
19891990 1991 1992 1993
OH . . . - - - - -OK . . . - 1 - 2 -OR . . . - - - - -PA . . . - - - - -SC . . . 2 1 1 - -TN . . . - - - - -TX . . . 33 4 5 12 17UT . . . 3 - - 1 -VT . . . - - - - -VA . . . - 3 2 4 5WA . . . - - - - 1WV . . . - - - - -WY . . . - - - 1 -
- Represents zero.Source: Through 1978, U.S. Law Enforcement Assistance Administration; thereafter, U.S. Bureau of Justice Statistics, Capital
Punishment, annual.
Law Enforcement, Courts, and Prisons220

No. 358. Fire Losses—Total and Per Capita: 1970 to 1993[Includes allowance for uninsured and unreported losses but excludes losses to government property and forests.
Represents incurred losses ]
YEAR Total(mil. dol.)
Percapita 1
1970 . . . . . . . 2,328 11.411971 . . . . . . . 2,316 11.201972 . . . . . . . 2,304 11.011973 . . . . . . . 2,639 12.491974 . . . . . . . 3,190 14.951975 . . . . . . . 3,190 14.811976 . . . . . . . 3,558 16.351977 . . . . . . . 3,764 17.13
YEAR Total(mil. dol.)
Percapita 1
1978 . . . . . . . 4,008 18.051979 . . . . . . . 4,851 21.601980 . . . . . . . 5,579 24.561981 . . . . . . . 5,625 24.531982 . . . . . . . 5,894 25.611983 . . . . . . . 6,320 27.201984 . . . . . . . 7,602 32.351985 . . . . . . . 7,753 32.70
YEAR Total(mil. dol.)
Percapita 1
1986 . . . . . . . 8,488 35.211987 . . . . . . . 8,504 34.961988 . . . . . . . 9,626 39.111989 . . . . . . . 9,514 38.331990 . . . . . . . 9,495 38.261991 . . . . . . . 11,302 44.831992 . . . . . . . 13,588 48.241993 . . . . . . . 9,990 38.73
1 Based on Bureau of the Census estimated resident population as of July 1.
Source: Insurance Information Institute, New York, NY, Insurance Facts, annual.
No. 359. Fires—Number and Loss, by Type and Property Use: 1990 to 1993[Based on annual sample survey of fire departments. No adjustments were made for unreported fires and losses.
Property loss includes direct property loss only]
TYPE AND PROPERTY USENUMBER (1,000) PROPERTY LOSS (mil. dol.)
1990 1991 1992 1993 1990 1991 1992 1993
Fires, total . . . . . . . . . . 2,019 2,041 1,965 1,953 7,818 9,467 8,295 8,546
Structure . . . . . . . . . . . . . . 624 640 638 621 6,713 8,320 6,957 7,406Outside of structure 1 . . . . . . 52 54 50 52 90 55 318 63Brush and rubbish . . . . . . . . 787 806 743 732 - - - -Vehicle . . . . . . . . . . . . . . . . 436 428 405 421 967 1,049 965 1,030Other . . . . . . . . . . . . . . . . . 120 113 129 127 48 43 55 47
Structure by property use:Public assembly . . . . . . . . 17 16 17 16 317 362 361 298Educational . . . . . . . . . . . 9 9 10 9 136 58 68 64Institutional . . . . . . . . . . . 11 12 12 10 33 28 35 30Stores and offices . . . . . . . 31 33 33 29 603 2931 31,105 741Residential. . . . . . . . . . . . 467 478 472 470 4,253 45,552 3,880 4,8431-2 family units 5 . . . . . . 359 363 358 358 3,534 3,354 3,178 4,111Apartments. . . . . . . . . . 95 102 101 100 623 609 597 653Hotels and motels . . . . . 6 6 6 6 66 52 56 34Other residential . . . . . . 7 7 7 6 30 37 49 45
Storage 6. . . . . . . . . . . . . 40 44 42 39 534 594 734 651Industry, utility, defense 6 . . 22 19 19 19 623 605 597 623Special structures . . . . . . . 27 29 33 29 214 190 177 156
- Represents zero. 1 Includes outside storage, crops, timber, etc. 2 Includes one large store and office fire totaling $325million. 3 Includes estimated loss of $567 million involving 862 structures from the April 1992 civil disturbance in Los Angeles,CA. 4 Includes the Oakland, CA fire which resulted in $1.5 billion in residential property damage. 5 Includes mobile homes.6 Data underreported as some incidents were handled by private fire brigades or fixed suppression systems which do not report.
Source: National Fire Protection Association, Quincy, MA, ‘‘NFPA Reports on U.S. Fire Loss — 1993,’’ NFPA Journal,September 1994, and prior issues (copyright 1994).
No. 360. Fires and Property Loss for Incendiary and Suspicious Fires and Civilian FireDeaths and Injuries, by Selected Property Type: 1990 to 1993
[Based on sample survey of fire departments]
ITEM 1990 1991 1992 1993
NUMBER(1,000)
Structure fires, total. . . 624 640 638 621Structure fires of incendiaryor suspicious origin . . . . . 97 98 94 85
Fires of incendiary origin . 58 62 58 54Fires of suspicious origin . 39 36 36 31
PROPERTY LOSS 1
(mil. dol.)Structure fires, total. . . 6,713 8,320 6,957 7,406
Structure fires of incendiaryor suspicious origin . . . . . 1,394 1,531 1,999 2,351
Fires of incendiary origin . 875 1,072 31,493 41,901Fires of suspicious origin . 519 459 506 450
ITEM 1990 1991 1992 1993
CIVILIAN FIRE DEATHSDeaths, total 2 . . . . . . 5,195 4,465 4,730 4,635
Residential property . . . . . . 4,115 3,575 3,765 3,825
One- and two-familydwellings . . . . . . . . . . 3,370 2,905 3,160 3,035Apartments . . . . . . . . . . 680 595 545 685
Vehicles . . . . . . . . . . . . . 695 605 730 595
CIVILIAN FIRE INJURIESInjuries, total 2 . . . . . . 28,600 29,375 28,700 30,475
Residential property . . . . . . 20,650 21,850 21,600 22,600One- and two-familydwellings. . . . . . . . . . 15,250 15,600 15,275 15,700
Apartments . . . . . . . . . . 4,975 5,675 5,825 6,300Vehicles . . . . . . . . . . . . . 3,350 3,050 3,000 2,675
1 Direct property loss only. 2 Includes other not shown separately. 3 Includes estimated loss of $567 million from the April1992 civil disturbance in Los Angeles, CA. 4 Includes fire losses that occurred during the wildfires in California and the WorldTrade Center bombing in New York City, which resulted in combined estimated losses of $1.039 billion.
Source: National Fire Protection Association, Quincy, MA, September 1994, and prior issues (copyright 1994).
Fires and Property Losses 221