Section 4.1: The Risk Management Function -
44
This text was adapted by The Saylor Foundation under a Creative Commons Attribution-NonCommercial-ShareAlike 3.0 License without attribution as requested by the work’s original creator or licensee.
Transcript of Section 4.1: The Risk Management Function -

This text was adapted by The Saylor Foundation under a Creative
Commons Attribution-NonCommercial-ShareAlike 3.0 License without
attribution as requested by the work’s original creator or licensee.

Chapter 4 Evolving Risk Management: Fundamental Tools
In the prior chapters, we discussed risks from many aspects. With this chapter we begin the discussion of
risk management and its methods that are so vital to businesses and to individuals. Today’s
unprecedented global financial crisis following the man-made and natural megacatastrophes underscore
the urgency for studying risk management and its tools. Information technology, globalization, and
innovation in financial technologies have all led to a term called “enterprise risk management” (ERM). As
you learned from the definition of risk in Chapter 1 "The Nature of Risk: Losses and
Opportunities" (see Figure 1.2 "Uncertainty as a Precondition to Risk"), ERM includes managing pure
opportunity and speculative risks. In this chapter, we discuss how firms use ERM to further their goals.
This chapter and Chapter 5 "The Evolution of Risk Management: Enterprise Risk Management" that
follows evolve into a more thorough discussion of ERM. While employing new innovations, we should
emphasize that the first step to understanding risk management is to learn the basics of the fundamental
risk management processes. In a broad sense, they include the processes of identifying, assessing,
measuring, and evaluating alternative ways to mitigate risks.
The steps that we follow to identify all of the entity’s risks involve measuring the frequency and severity of
losses, as we discussed inChapter 1 "The Nature of Risk: Losses and Opportunities" and computed
in Chapter 2 "Risk Measurement and Metrics". The measurements are essential to create the risk map
that profile all the risks identified as important to a business. The risk map is a visual tool used to consider
alternatives of the risk management tool set. A risk map forms a grid of frequency and severity
intersection points of each identified and measured risk. In this and the next chapter we undertake the
task of finding risk management solutions to the risks identified in the risk map. Following is the anthrax
story, which occurred right after September 11. It was an unusual risk of high severity and low frequency.
The alternative tools for financial solutions to each particular risk are shown in the risk management
matrix, which provides fundamental possible solutions to risks with high and low severity and frequency.
These possible solutions relate to external and internal conditions and are not absolutes. In times of low
insurance prices, the likelihood of using risk transfer is greater than in times of high rates. The risk
management process also includes cost-benefit analysis.
The anthrax story was an unusual risk of high severity and low frequency. It illustrates a case of risk
management of a scary risk and the dilemma of how best to counteract the risks.
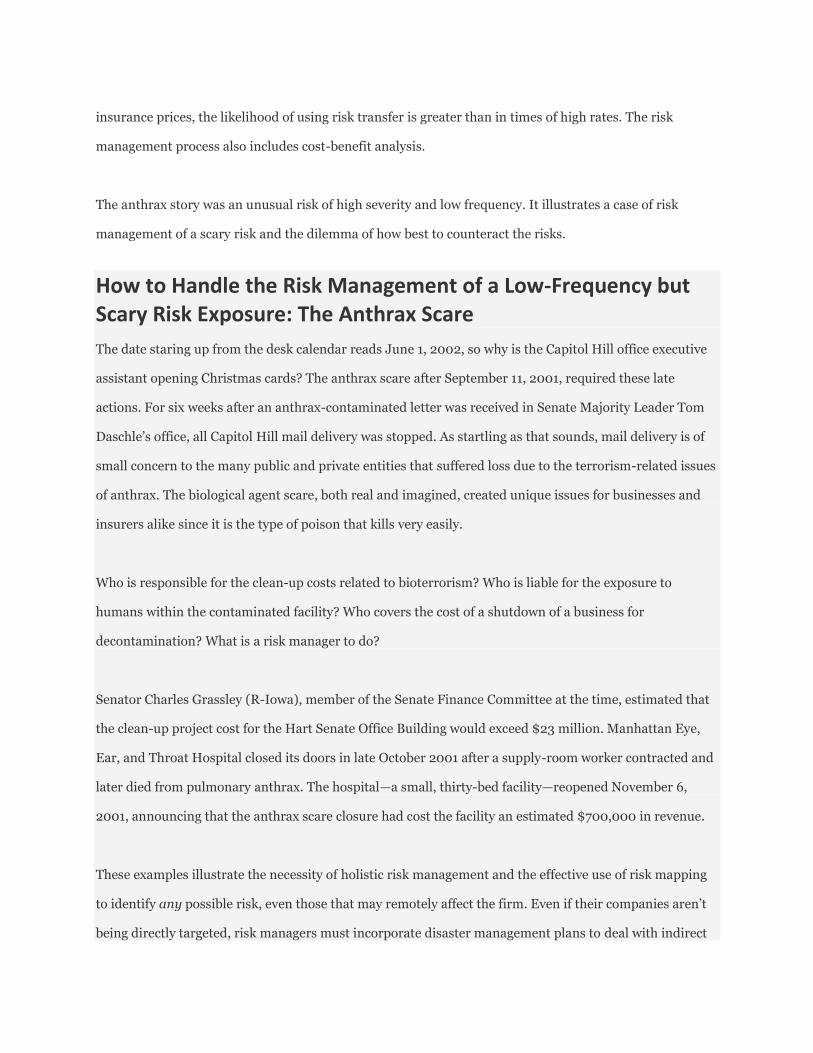
How to Handle the Risk Management of a Low-Frequency but Scary Risk Exposure: The Anthrax Scare
The date staring up from the desk calendar reads June 1, 2002, so why is the Capitol Hill office executive
assistant opening Christmas cards? The anthrax scare after September 11, 2001, required these late
actions. For six weeks after an anthrax-contaminated letter was received in Senate Majority Leader Tom
Daschle’s office, all Capitol Hill mail delivery was stopped. As startling as that sounds, mail delivery is of
small concern to the many public and private entities that suffered loss due to the terrorism-related issues
of anthrax. The biological agent scare, both real and imagined, created unique issues for businesses and
insurers alike since it is the type of poison that kills very easily.
Who is responsible for the clean-up costs related to bioterrorism? Who is liable for the exposure to
humans within the contaminated facility? Who covers the cost of a shutdown of a business for
decontamination? What is a risk manager to do?
Senator Charles Grassley (R-Iowa), member of the Senate Finance Committee at the time, estimated that
the clean-up project cost for the Hart Senate Office Building would exceed $23 million. Manhattan Eye,
Ear, and Throat Hospital closed its doors in late October 2001 after a supply-room worker contracted and
later died from pulmonary anthrax. The hospital—a small, thirty-bed facility—reopened November 6,
2001, announcing that the anthrax scare closure had cost the facility an estimated $700,000 in revenue.
These examples illustrate the necessity of holistic risk management and the effective use of risk mapping
to identify any possible risk, even those that may remotely affect the firm. Even if their companies aren’t
being directly targeted, risk managers must incorporate disaster management plans to deal with indirect

atrocities that slow or abort the firms’ operations. For example, an import/export business must protect
against extended halts in overseas commercial air traffic. A mail-order-catalog retailer must protect
against long-term mail delays. Evacuation of a workplace for employees due to mold infestation or
biochemical exposure must now be added to disaster recovery plans that are part of loss-control
programs. Risk managers take responsibility for such programs.
After a temporary closure, reopened facilities still give cause for concern. Staffers at the Hart Senate Office
Building got the green light to return to work on January 22, 2002, after the anthrax remediation process
was completed. Immediately, staffers began reporting illnesses. By March, 255 of the building’s employees
had complained of symptoms that included headaches, rashes, and eye or throat irritation, possibly from
the chemicals used to kill the anthrax. Was the decision to reopen the facility too hasty?
Sources: “U.S. Lawmakers Complain About Old Mail After Anthrax Scare.” Dow Jones Newswires, 8 May
2002; David Pilla, “Anthrax Scare Raises New Liability Issues for Insurers,” A.M. Best Newswire, October
16, 2001; Sheila R. Cherry, “Health Questions Linger at Hart,” Insight on the News, April 15, 2002, p.16;
Cinda Becker, “N.Y. Hospital Reopens; Anthrax Scare Costs Facility $700,000,” Modern Healthcare, 12
November 2001, p. 8; Sheila R. Cherry, “Health Questions Linger at Hart,” Insight on the News, April 15,
2002, p. 16(2).
Today’s risk managers explore all risks together and consider correlations between risks and their
management. Some risks interact positively with other risks, and the occurrence of one can trigger the
other—flood can cause fires or an earthquake that destroys a supplier can interrupt business in another
side of the country. As we discussed in Chapter 1 "The Nature of Risk: Losses and Opportunities",
economic systemic risks can impact many facets of the corporations, as is the current state of the world
during the financial crisis of 2008.
In our technological and information age, every person involved in finding solutions to lower the adverse
impact of risks uses risk management information systems (RMIS), which are data bases that provide

information with which to compute the frequency and severity, explore difficult-to-identify risks, and
provide forecasts and cost-benefits analyses.
This chapter therefore includes the following:
1. Links
2. The risk management function
3. Projected frequency and severity, cost-benefit analysis, and capital budgeting
4. Risk management alternatives: the risk management matrix
5. Comparing to current risk-handling methods
Links
Now that we understand the notion and measurement of risks fromChapter 1 "The Nature of Risk: Losses
and Opportunities" and Chapter 2 "Risk Measurement and Metrics", and the attitudes toward risk
inChapter 3 "Risk Attitudes: Expected Utility Theory and Demand for Hedging", we are ready to begin
learning about the actual process of risk management. Within the goals of the firm discussed in Chapter 1
"The Nature of Risk: Losses and Opportunities", we now delve into how risk managers conduct their jobs
and what they need to know about the marketplace to succeed in reducing and eliminating risks. Holistic
risk management is connected to our complete package of risks shown in Figure 4.1 "Links between the
Holistic Risk Picture and the Risk Management Alternative Solutions". To complete the puzzle, we have to
1. identify all the risks,
2. assess the risks,
3. find risk management solutions to each risk, and
4. evaluate the results.
Risk management decisions depend on the nature of the identified risks, the forecasted frequency and
severity of losses, cost-benefit analysis, and using the risk management matrix in context of external

market conditions. As you will see later in this chapter, risk managers may decide to transfer the risk to
insurance companies. In such cases, final decisions can’t be separated from the market conditions at the
time of purchase. Therefore, we must understand the nature of underwriting cycles, which are the
business cycles of the insurance industry when insurance processes increase and fall (explained inChapter
6 "The Insurance Solution and Institutions"). When insurance prices are high, risk management decisions
differ from those made during times of low insurance prices. Since insurance prices are cyclical, different
decisions are called for at different times for the same assessed risks.
Risk managers also need to understand the nature of insurance well enough to be aware of which risks are
uninsurable. Overall, in this Links section, shown in Figure 4.1 "Links between the Holistic Risk Picture
and the Risk Management Alternative Solutions", we can complete our puzzle only when we have
mitigated all risks in a smart risk management process.
Figure 4.1 Links between the Holistic Risk Picture and the Risk Management
Alternative Solutions
4.1 The Risk Management Function
LEARNING OBJECTIVE
In this section you will learn about the big picture of all risk management steps.
Traditionally, a firm’s risk management function ensured that the pure risks of losses were managed
appropriately. The risk manager was charged with the responsibility for specific risks only. Most activities
involved providing adequate insurance and implementing loss-control techniques so that the firm’s
employees and property remained safe. Thus, risk managers sought to reduce the firm’s costs of pure risks
and to initiate safety and disaster management.
Typically, the traditional risk management position has reported to the corporate treasurer. Handling
risks by self-insuring (retaining risks within the firm) and paying claims in-house requires additional
personnel within the risk management function. In a small company or sole proprietorship, the owner
usually performs the risk management function, establishing policy and making decisions. In fact, each of
us manage our own risks, whether we have studied risk management or not. Every time we lock our house
or car, check the wiring system for problems, or pay an insurance premium, we are performing the same
functions as a risk manager. Risk managers use agents or brokers to make smart insurance and risk
management decisions (agents and brokers are discussed in Chapter 7 "Insurance Operations").
The traditional risk manager’s role has evolved, and corporations have begun to embrace enterprise risk
management in which all risks are part of the process: pure, opportunity, and speculative risks. With this
evolution, firms created the new post of chief risk officer (CRO). The role of CROs expanded the
traditional role by integrating the firm’s silos, or separate risks, into a holistic framework. Risks cannot be
segregated—they interact and affect one another.
In addition to insurance and loss control, risk managers or CROs use specialized tools to keep cash flow
in-house, which we will discuss inChapter 6 "The Insurance Solution and Institutions" and Chapter 7
"Insurance Operations". Captives are separate insurance entities under the corporate structure—mostly
for the exclusive use of the firm itself. CROs oversee the increasing reliance on capital market instruments
to hedge risk. They also address the entire risk map—a visual tool used to consider alternatives of the
risk management tool set—in the realm of nonpure risks. For example, a cereal manufacturer, dependent
upon a steady supply of grain used in production, may decide to enter into fixed-price long-term
contractual arrangements with its suppliers to avoid the risk of price fluctuations. The CRO or the
financial risk managers take responsibility for these trades. They also create the risk management
guideline for the firm that usually includes the following:
Writing a mission statement for risk management in the organization
Communicating with every section of the business to promote safe behavior
Identifying risk management policy and processes
Pinpointing all risk exposures (what “keeps employees awake at night”)
Assessing risk management and financing alternatives as well as external conditions in the
insurance markets
Allocating costs
Negotiating insurance terms
Adjusting claims adjustment in self-insuring firms
Keeping accurate records
Writing risk management manuals set up the process of identification, monitoring, assessment,
evaluation, and adjustments.
In larger organizations, the risk manager or CRO has differing authority depending upon the policy that
top management has adopted. Policy statements generally outline the dimensions of such authority. Risk
managers may be authorized to make decisions in routine matters but restricted to making only
recommendations in others. For example, the risk manager may recommend that the costs of employee

injuries be retained rather than insured, but a final decision of such magnitude would be made by top
management.
The Risk Management Process
A typical risk management function includes the steps listed above: identifying risks, assessing them,
forecasting future frequency and severity of losses, mitigating risks, finding risk mitigation solutions,
creating plans, conducting cost-benefits analyses, and implementing programs for loss control and
insurance. For each property risk exposure, for example, the risk manager would adopt the following or
similar processes:
Finding all properties that are exposed to losses (such as real property like land, buildings, and
other structures; tangible property like furniture and computers; and intangible personal
property like trademarks)
Evaluating the potential causes of loss that can affect the firms’ property, including natural
disasters (such as windstorms, floods, and earthquakes); accidental causes (such as fires,
explosions, and the collapse of roofs under snow); and many other causes noted inChapter 1 "The
Nature of Risk: Losses and Opportunities";
Evaluating property value by different methods, such as book value, market value, reproduction
cost, and replacement cost
Evaluating the firm’s legal interest in each of the properties—whether each property is owned or
leased
Identifying the actual loss exposure in each property using loss histories (frequency and severity),
accounting records, personal inspections, flow charts, and questionnaires
Computing the frequency and severity of losses for each of the property risk exposures based on
loss data
Forecasting future losses for each property risk exposure
Creating a specific risk map for all property risk exposures based on forecasted frequency and
severity
Developing risk management alternative tools (such as loss-control techniques) based upon cost-
benefit analysis or insurance
Comparing the existing solutions to potential solutions (traditional and nontraditional)—uses of
risk maps
Communicating the solutions with the whole organization by creating reporting techniques,
feedback, and a path for ongoing execution of the whole process
The process is very similar to any other business process.
KEY TAKEAWAYS
The modern firm ensures that the risk management function is embedded
throughout the whole organization.
The risk management process follows logical sequence just as any business process
will.
The main steps in the risk management process are identifying risks, measuring
risks, creating a map, finding alternative solutions to managing the risk, and
evaluating programs once they are put into place.
DISCUSSION QUESTIONS
1. What are the steps in the pure risk management process?
2. Imagine that the step of evaluation of the risks did not account for related risks.
What would be the result for the risk manager?
3. In the allocation of costs, does the CRO need to understand the holistic risk map of
the whole company? Explain your answer with an example.
4.2 Beginning Steps: Communication and Identification
LEARNING OBJECTIVE
In this section you will learn how to identify risks and create a risk map to
communicate the importance of each risk on a severity and frequency grid.
Risk management policy statements are the primary tools to communicate risk management
objectives. Forward-thinking firms have made a place for risk management policy statements for many
years as leaders discuss the risk management process. Other tools used to relay objectives may include
company mission statements, risk management manuals (which provide specific guidelines for detailed
risk management problems, such as how to deal with the death or disability of a key executive), and even
describe the risk manager’s job description. Effective risk management objectives coincide with those of
the organization generally, and both must be communicated consistently. Advertisements, employee
training programs, and other public activities also can communicate an organization’s philosophies and
objectives.
Identifying Risks
The process of identifying all of a firm’s risks and their values is a very detailed process. It is of extreme
importance to ensure that the business is not ignoring anything that can destroy it. To illustrate how the
process takes shape, imagine a business such as Thompson’s department store that has a fleet of delivery
trucks, a restaurant, a coffee shop, a restaurant, and a babysitting service for parents who are shopping.
The risk manager who talks to each employee in the store usually would ask for a list of all the perils and
hazards (discussed inChapter 1 "The Nature of Risk: Losses and Opportunities") that can expose the
operation to losses.
A simple analysis of this department store risk exposure nicely illustrates risk identification, which is a
critical element of risk management. For the coffee shop and restaurant, the risks include food poisoning,
kitchen fire, and injuries to customers who slip. Spilled coffee can damage store merchandise. For the

babysitting service, the store may be liable for any injury to infants as they are fed or play or possibly
suffer injuries from other kids. In addition to worry about employees’ possible injuries while at work or
damage to merchandise from mistreatment, the store risk manager would usually worry about the
condition of the floors as a potential hazard, especially when wet. Most risk managers work with the
architectural schematics of the building and learn about evacuation routes in case of fires. The location of
the building is also critical to identification of risks. If the department store is in a flood-prone area, the
risks are different than if the store were located in the mountains. The process involves every company
stakeholder. Understanding the supply chain of movement of merchandise is part of the plan as well. If
suppliers have losses, risk managers need to know about the risk associated with such delays. This
example is a short illustration of the enormous task of risk identification.
Today’s CRO also reviews the financial statement of the firm to ensure the financial viability within the
financial risks, the asset risks and product risks the firm undertakes. We elaborate more on this aspect
with examples in Chapter 5 "The Evolution of Risk Management: Enterprise Risk Management".
Risk Profiling
Discovering all risks, their assessments and their relationships to one another becomes critical to learning
and understanding an organization’s tolerance for risk. This step comes after a separate and thorough
review of each risk. Holistic risk mapping is the outcome of risk profiling, a process that evaluates all
the risks of the organizations and measures the frequency and severity of each risk. Different kinds of
organizations pose very different types of risk exposures, and risk evaluations can differ vastly among
industries. Boeing, for example, has a tremendous wrongful death exposure resulting from plane crashes.
Intellectual property piracy and property rights issues could have a big impact upon the operations of an
organization like Microsoft.
Risk Mapping: Creating the Model
The results of risk profiling can be graphically displayed and developed into a model. One such model
is risk mapping. [1]
Risk mapping involves charting entire spectrums of risk, not individual risk “silos”
from each separate business unit. Risk mapping becomes useful both in identifying risks and in choosing

approaches to mitigate them. Such a map presents a cumulative picture of all the risks in one risk
management solution chart. Different facets of risk could include
workers’ compensation claims,
earthquake or tornado exposure,
credit risk,
mold,
terrorism,
theft,
environmental effects,
intellectual property piracy, and
a host of other concerns.
A risk map puts the risks a company faces into a visual medium to see how risks are clustered and to
understand the relationships among risks. The risks are displayed on a severity and frequency grid after
each risk is assessed. Risk maps can be useful tools for explaining and communicating various risks to
management and employees. One map might be created to chart what risks are most significant to a
particular company. This chart would be used to prioritize risk across the enterprise. Another map might
show the risk reduction after risk management action is adopted, as we will show later in this chapter. [2]
Figure 4.2 "Notable Notions Risk Map" presents an example of a holistic risk map for an organization
examining the dynamics of frequency and severity as they relate to each risk. By assigning the probability
of occurrence against the estimate of future magnitude of possible loss, risk managers can form
foundations upon which a corporation can focus on risk areas in need of actions. The possible actions—
including risk avoidance, loss control, and insurance (loss transfer)—provide alternative solutions during
the discussion of the risk management matrix in this chapter.

Note that risk maps include plotting intersection points between measures of frequency (on an x-axis) and
severity (on a y-axis) and visually plotting intersection points. Each point represents the relationship
between the frequency of the exposure and the severity of the exposure for each risk measured.
Risk Identification and Estimates of Frequency and Severity
Strategies for risk mapping will vary from organization to organization. Company objectives arise out of
the firm’s risk appetite and culture. These objectives help determine the organization’s risk tolerance level
(see Chapter 3 "Risk Attitudes: Expected Utility Theory and Demand for Hedging"). As in the separate
risk management process for each risk exposure, the first step in mapping risk is to identify the firm’s loss
exposures and estimate and forecast the frequency and severity of each potential risk. Figure 4.2 "Notable
Notions Risk Map" displays (for illustration purposes only) quantified trended estimates of loss frequency
and severity that risk managers use as inputs into the risk map for a hypothetical small import/export
business, Notable Notions. The risk map graph is divided into the four quadrants of the classical risk
management matrix (which we discuss in detail later in this chapter). As we will see, such matrices
provide a critical part of the way to provide risk management solutions to each risk.
Figure 4.2 Notable Notions Risk Map

Plotting the Risk Map
Several sample risks are plotted in Notable Notions’ holistic risk map.[3]
This model can be used to help
establish a risk-tolerance boundary and determine priority for risks facing the organization. Graphically,
risk across the enterprise comes from four basic risk categories:
1. natural and man-made risks (grouped together under the hazard risks),
2. financial risks,
3. business risks, and
4. operational risks.
Natural and man-made risks include unforeseen events that arise outside of the normal operating
environment. The risk map denotes that the probability of a natural and man-made frequency is very low,
but the potential severity is very high—for example, a tornado, valued at approximately $160 million. This
risk is similar to earthquake, mold exposure, and even terrorism, all of which also fall into the low-
frequency/high-severity quadrant. For example, in the aftermath of Hurricane Katrina, the New Orleans
floods, and September 11, 2001, most corporations have reprioritized possible losses related to huge man-
made and natural catastrophes. For example, more than 1,200 World Bank employees were sent home
and barred from corporate headquarters for several days following an anthrax scare in the
mailroom. [4]
This possibility exposes firms to large potential losses associated with an unexpected
interruption to normal business operations. See the box in the introduction to this chapter Note 4.1 "How
to Handle the Risk Management of a Low-Frequency but Scary Risk Exposure: The Anthrax Scare".
Financial risks arise from changing market conditions involving
prices,
volatility,
liquidity,
credit risk,
foreign exchange risk, and
general market recession (as in the third and fourth quarter of 2008).

The credit crisis that arose in the third and fourth quarters of 2008 affected most businesses as economies
around the world slowed down and consumers retrench and lower their spending. Thus, risk factors that
may provide opportunities as well as potential loss as interest rates, foreign exchange rates are embedded
in the risk map. We can display the opportunities—along with possible losses (as we show inChapter 5
"The Evolution of Risk Management: Enterprise Risk Management" in Figure 5.1 "The Links to ERM with
Opportunities and Risks").
In our example, we can say that because of its global customer base, Notable Notions has a tremendous
amount of exposure to exchange rate risk, which may provide opportunities as well as risks. In such cases,
there is no frequency of loss and the opportunity risk is not part of the risk map shown in Figure 4.2
"Notable Notions Risk Map". If Notable Notions was a highly leveraged company (meaning that the firm
has taken many loans to finance its operations), the company would be at risk of inability to operate and
pay salaries if credit lines dried out. However, if it is a conservative company with cash reserves for its
operations, Notable Notions’ risk map denotes the high number (frequency) of transactions in addition to
the high dollar exposure (severity) associated with adverse foreign exchange rate movement. The credit
risk for loans did not even make the map, since there is no frequency of loss in the data base for the
company. Methods used to control the risks and lower the frequency and severity of financial risks are
discussed in Chapter 5 "The Evolution of Risk Management: Enterprise Risk Management".
One example of business risks is reputation risk, which is plotted in the high-frequency/high-severity
quadrant. Only recently have we identified reputation risk in map models. Not only do manufacturers
such as Coca-Cola rely on their high brand-name identification, so do smaller companies (like Notable
Notions) whose customers rely on stellar business practices. One hiccup in the distribution chain causing
nondelivery or inconsistent quality in an order can damage a company’s reputation and lead to canceled
contracts. The downside of reputation damage is potentially significant and has a long recovery period.
Companies and their risk managers currently rate loss of good reputation as one of the greatest corporate
threats to the success or failure of their organization. [5]
A case in point is the impact on Martha Stewart’s
reputation after she was linked to an insider trading scandal involving the biotech firm ImClone. [6]
The

day after the story was reported in the Wall Street Journal, the stock price of Martha Stewart Living
Omnimedia declined almost 20 percent, costing Stewart herself nearly $200 million.
Operational risks are those that relate to the ongoing day-to-day business activities of the organization.
Here we reflect IT system failure exposure (which we will discuss in detail later in this chapter). On the
figure above, this risk appears in the lower-left quadrant, low severity/low frequency. Hard data shows
low down time related to IT system failure. (It is likely that this risk was originally more severe and has
been reduced by backup systems and disaster recovery plans.) In the case of a nontechnology firm such as
Notable Notions, electronic risk exposure and intellectual property risk are also plotted in the low-
frequency/low-severity quadrant.
A pure risk (like workers’ compensation) falls in the lower-right quadrant for Notable Notions. The
organization experiences a high-frequency but low-severity outcome for workers’ compensation claims.
Good internal record-keeping helps to track the experience data for Notable Notions and allows for an
appropriate mitigation strategy.
The location of each of the remaining data points on Figure 4.2 "Notable Notions Risk Map" reflects an
additional risk exposure for Notable Notions.
Once a company or CRO has reviewed all these risks together, Notable Notions can create a cohesive and
consistent holistic risk management strategy. Risk managers can also review a variety of effects that may
not be apparent when exposures are isolated. Small problems in one department may cause big ones in
another, and small risks that have high frequency in each department can become exponentially more
severe in the aggregate. We will explore property and liability risks more in Chapter 9 "Fundamental
Doctrines Affecting Insurance Contracts" and Chapter 10 "Structure and Analysis of Insurance Contracts".

KEY TAKEAWAYS
Communication is key in the risk management processes and there are various
mediums in use such as policy statement and manuals.
The identification process includes profiling and risk mapping.
DISCUSSION QUESTIONS
1. Design a brief risk management policy statement for a small child-care company.
Remember to include the most important objectives.
2. For the same child-care company, create a risk identification list and plot the risks on
a risk map.
3. Identify the nature of each risk on the risk map in terms of hazard risk, financial risk,
business risk, and operational risks.
4. For the child-care company, do you see any speculative or opportunity risks?
Explain.
[1] Etti G. Baranoff, “Mapping the Evolution of Risk Management,”Contingencies (July/August
2004): 22–27.
[2] Lee Ann Gjertsen, “‘Risk Mapping’ Helps RM’s Chart Solutions,” National Underwriter,
Property & Casualty/Risk & Benefits Management Edition, June 7, 1999.
[3] The exercise is abridged for demonstrative purposes. An actual holistic risk mapping model
would include many more risk intersection points plotted along the frequency/severity X and Y
axes.
[4] Associated Press Newswire, May 22, 2002.
[5] “Risk Whistle: Reputation Risk,” Swiss Re publication,http://www.swissre.com.

[6] Geeta Anand, Jerry Arkon, and Chris Adams, “ImClone’s Ex-CEO Arrested, Charged with
Insider Trading,” Wall Street Journal, June 13, 2002, 1.

4.3 Projected Frequency and Severity and Cost-Benefit Analysis—Capital Budgeting
LEARNING OBJECTIVES
In this section we focus on an example of how to compute the frequency and
severity of losses (learned in Chapter 2 "Risk Measurement and Metrics").
We also forecast these measures and conduct a cost-benefit analysis for loss control.
Dana, the risk manager at Energy Fitness Centers, identified the risks of workers’ injury on the job and
collected the statistics of claims and losses since 2003. Dana computed the frequency and severity using
her own data in order to use the data in her risk map for one risk only. When we focus on one risk only, we
work with the risk management matrix. This matrix provides alternative financial action to undertake
for each frequency/severity combination (described later in this chapter). Dana’s computations of the
frequency and severity appear in Table 4.1 "Workers’ Compensation Loss History of Energy Fitness
Centers—Frequency and Severity". Forecasting, on the other hand, appears in Table 4.2 "Workers’
Compensation Frequency and Severity of Energy Fitness Centers—Actual and Trended" and Figure 4.3
"Workers’ Compensation Frequency and Severity of Energy Fitness Centers—Actual and Trended".
Forecasting involves projecting the frequency and severity of losses into the future based on current
data and statistical assumptions.

Table 4.1 Workers’ Compensation Loss History of Energy Fitness Centers—Frequency
and Severity
Year Number of WC Claims WC Losses Average Loss per Claim
2003 2,300 $3,124,560 $1,359
2004 1,900 $1,950,000 $1,026
2005 2,100 $2,525,000 $1,202
2006 1,900 $2,345,623 $1,235
2007 2,200 $2,560,200 $1,164
2008 1,700 $1,907,604 $1,122
Total 12,100 $14,412,987
Frequency for the whole period
Severity for the whole period
Mean 2,017 $2,402,165 $1,191
(See Chapter 2 "Risk Measurement and Metrics" for the computation)
Table 4.2 Workers’ Compensation Frequency and Severity of Energy Fitness Centers—
Actual and Trended
WC
Frequency
Linear Trend
Frequency
WC Average
Claim
Linear Trend
Severity
2003 2,300 2,181 $1,359 $1,225
2004 1,900 2,115 $1,026 $1,226
2005 2,100 2,050 $1,202 $1,227
2006 1,900 1,984 $1,235 $1,228
2007 2,200 1,918 $1,422 $1,229
2008 1,700 1,852 $1,122 $1,230
2009 Estimated 1,786.67 Estimated $1,231.53

Figure 4.3 Workers’ Compensation Frequency and Severity of Energy Fitness
Centers—Actual and Trended
Dana installed various loss-control tools during the period under study. The result of the risk reduction
investments appear to be paying off. Her analysis of the results indicated that the annual frequency trend
has decreased (see the negative slope for the frequency in Figure 4.2 "Notable Notions Risk Map"). The
company’s success in decreasing loss severity doesn’t appear in such dramatic terms. Nevertheless, Dana
feels encouraged that her efforts helped level off the severity. The slope of the annual severity (losses per
claim) trend line is 1.09 per year—and hence almost level as shown in the illustration in Figure 4.2
"Notable Notions Risk Map". (See the Section 4.6 "Appendix: Forecasting" to this chapter for explanation
of the computation of the forecasting analysis.)
Capital Budgeting: Cost-Benefit Analysis for Loss-Control Efforts
With the ammunition of reducing the frequency of losses, Dana is planning to continue her loss-control
efforts. Her next step is to convince management to invest in a new innovation in security belts for the
employees. These belts have proven records of reducing the severity of WC claim in other facilities. In this
example, we show her cost-benefit analysis—analysis that examines the cost of the belts and compares the
expense to the expected reduction in losses or savings in premiums for insurance. If the benefit of cost

reduction exceeds the expense for the belt, Dana will be able to prove her point. In terms of the actual
analysis, she has to bring the future reduction in losses to today’s value of the dollar by looking at the
present value of the reduction in premiums. If the present value of premium savings is greater than the
cost of the belts, we will have a positive net present value (NPV) and management will have a clear
incentive to approve this loss-control expense.
With the help of her broker, Dana plans to show her managers that, by lowering the frequency and
severity of losses, the workers’ compensation rates for insurance can be lowered by as much as 20–25
percent. This 20–25 percent is actually a true savings or benefit for the cost-benefit analysis. Dana
undertook to conduct cash flow analysis for purchasing the new innovative safety belts project. A cash
flow analysis looks at the amount of cash that will be saved and brings it into today’s present value. Table
4.3 "Net Present Value (NPV) of Workers’ Compensation Premiums Savings for Energy Fitness Centers
When Purchasing Innovative Safety Belts for $50,000" provides the decrease in premium anticipated
when the belts are used as a loss-control technique.
The cash outlay required to purchase the innovative belts is $50,000 today. The savings in premiums for
the next few years are expected to be $20,000 in the first year, $25,000 in the second year, and $30,000
in the third year. Dana would like to show her managers this premium savings over a three-year time
horizon. Table 4.3 "Net Present Value (NPV) of Workers’ Compensation Premiums Savings for Energy
Fitness Centers When Purchasing Innovative Safety Belts for $50,000" shows the cash flow analysis that
Dana used, using a 6 percent rate of return. For 6 percent, the NPV would be ($66,310 – 50,000) =
$16,310. You are invited to calculate the NPV at different interest rates. Would the NPV be greater for 10
percent? (The student will find that it is lower, since the future value of a lower amount today grows faster
at 10 percent than at 6 percent.)

Table 4.3 Net Present Value (NPV) of Workers’ Compensation Premiums Savings for
Energy Fitness Centers When Purchasing Innovative Safety Belts for $50,000
Savings on
Premiums
Present Value of $1 (at 6
percent)
Present Value of Premium
savings End of
Year End of Year
1 $20,000 0.943 $18,860
2 $25,000 0.890 $22,250
3 $30,000 0.840 $25,200
Total present value of all premium savings $66,310
Net present value = $66,310 − $50,000 = $16,310 > 0
Use a financial calculator
Risk Management Information System
Risk managers rely upon data and analysis techniques to assess and evaluate and thus to make informed
decisions. One of the risk managers’ primary tasks—as you see from the activities of Dana at Energy
Fitness Centers—is to develop the appropriate data systems to allow them to quantify the organization’s
loss history, including
types of losses,
amounts,
circumstances surrounding them,
dates, and
other relevant facts.
We call such computerized quantifications a risk management information system, or RMIS. An
RMIS provides risk managers with the ability to slice and dice the data in any way that may help risk
managers assess and evaluate the risks their companies face. The history helps to establish probability
distributions and trends analysis. When risk managers use good data and analysis to make risk reduction
decisions, they must always include consideration of financial concepts (such as the time value of money)
as shown above.

The key to good decision making lies in the risk managers’ ability to analyze large amounts of data
collected. A firm’s data warehousing (a system of housing large sets of data for strategic analysis and
operations) of risk data allows decision makers to evaluate multiple dimensions of risks as well as overall
risk. Reporting techniques can be virtually unlimited in perspectives. For example, risk managers can sort
data by location, by region, by division, and so forth. Because risk solutions are only as good as their
underlying assumptions, RMIS allows for modeling data to assist in the risk exposure measurement
process. Self-administered retained coverages have experienced explosive growth across all industries.
The boom has meant that systems now include customized Web-based reporting capabilities. The
technological advances that go along with RMIS allows all decision makers to maximize a firm’s
risk/reward tradeoff through data analysis.
KEY TAKEAWAY
The student learned how to trend the frequency and severity measures for use in the
risk map. When this data is available, the risk manager is able to conduct cost-benefit
analysis comparing the benefit of adopting a loss-control measure.
DISCUSSION QUESTIONS
1. Following is the loss data for slip-and-fall shoppers’ medical claims of the grocery
store chain Derelex for the years 2004–2008.
a. Calculate the severity and frequency of the losses.
b. Forecast the severity and frequency for next year using the appendix to
this chapter.
c. If a new mat can help lower the severity of slips and falls by 50 percent in
the third year from now, what will be the projected severity in 3 years if
the mats are used?
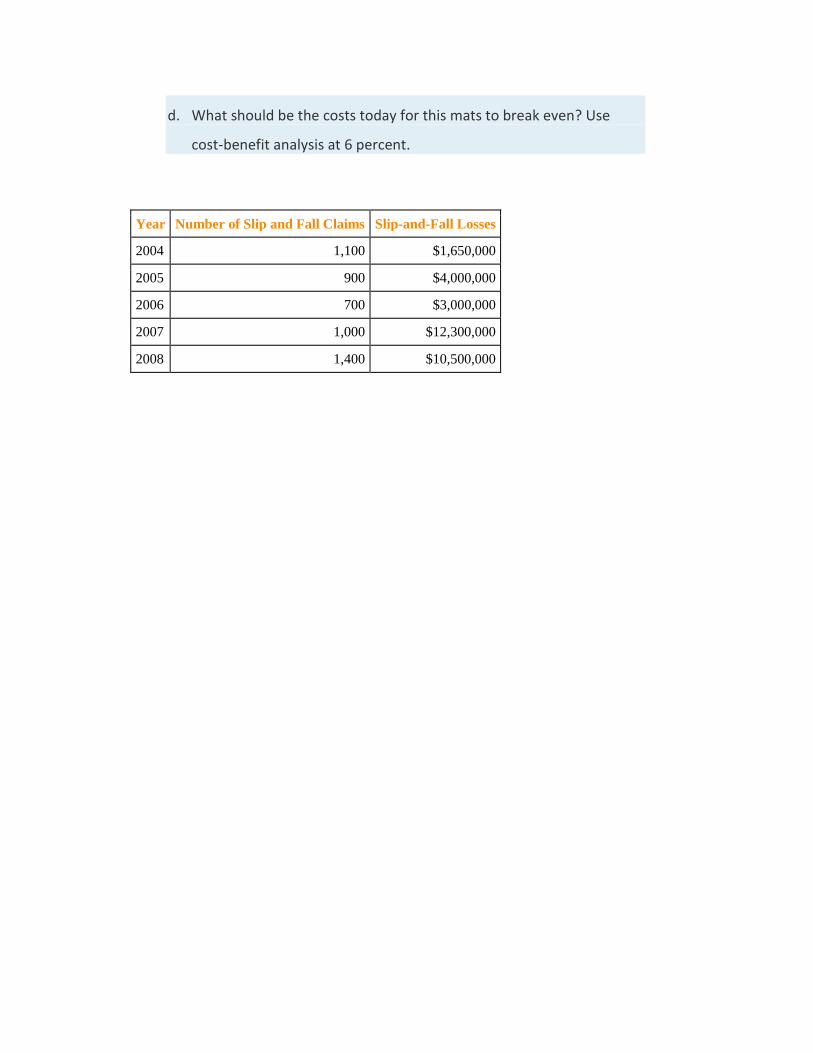
d. What should be the costs today for this mats to break even? Use
cost-benefit analysis at 6 percent.
Year Number of Slip and Fall Claims Slip-and-Fall Losses
2004 1,100 $1,650,000
2005 900 $4,000,000
2006 700 $3,000,000
2007 1,000 $12,300,000
2008 1,400 $10,500,000

4.4 Risk Management Alternatives: The Risk Management Matrix
LEARNING OBJECTIVES
In this section you will learn about the alternatives available for managing risks based
on the frequency and severity of the risks.
We also address the risk manager’s alternatives—transferring the risk, avoiding it,
and managing it internally with loss controls.
Once they are evaluated and forecasted, loss frequency and loss severity are used as the vertical and horizontal lines
in the risk management matrix for one specific risk exposure. Note that such a matrix differs from the risk map
described below (which includes all important risks a firm is exposed to). The risk management matrix includes on
one axis, categories of relative frequency (high and low) and on the other, categories of relative severity (high and
low). The simplest of these matrices is one with just four cells, as shown in the pure risk solutions in Table 4.4 "The
Traditional Risk Management Matrix (for One Risk)". While this matrix takes into account only two variables, in
reality, other variables—the financial condition of the firm, the size of the firm, and external market conditions, to
name a few—are very important in the decision. [1]
Table 4.4 The Traditional Risk Management Matrix (for One Risk)
Pure Risk Solutions
Low Frequency of
Losses High Frequency of Losses
Low Severity of Losses Retention—self-insurance
Retention with loss control—risk
reduction
High Severity of
Losses Transfer—insurance Avoidance

The Risk Management Decision—Return to the Example
Dana, the risk manager of Energy Fitness Centers, also uses a risk management matrix to decide whether
or not to recommend any additional loss-control devices. Using the data in Table 4.3 "Net Present Value
(NPV) of Workers’ Compensation Premiums Savings for Energy Fitness Centers When Purchasing
Innovative Safety Belts for $50,000" and Figure 4.3 "Workers’ Compensation Frequency and Severity of
Energy Fitness Centers—Actual and Trended", Dana compared the forecasted frequency and severity of
the worker’s compensation results to the data of her peer group that she obtained from the Risk and
Insurance Management Society (RIMS) and her broker. In comparison, her loss frequency is higher than
the median for similarly sized fitness centers. Yet, to her surprise, EFC’s risk severity is lower than the
median. Based on the risk management matrix she should suggest to management that they retain some
risks and use loss control as she already had been doing. Her cost-benefit analysis from above helps
reinforce her decision. Therefore, with both cost-benefits analysis and the method of managing the risk
suggested by the matrix, she has enough ammunition to convince management to agree to buy the
additional belts as a method to reduce the losses.
To understand the risk management matrix alternatives, we now concentrate on each of the cells in the
matrix.
Risk Transfer—Insurance
The lower-left corner of the risk management matrix represents situations involving low frequency and
high severity. Here we find transfer of risk—that is, displacement of risk to a third, unrelated party—to
an insurance company. We discuss insurance—both its nature and its operations—at length in Chapter 6
"The Insurance Solution and Institutions" and Chapter 7 "Insurance Operations". In essence, risk
transference involves paying someone else to bear some or all of the risk of certain financial losses that
cannot be avoided, assumed, or reduced to acceptable levels. Some risks may be transferred through the
formation of a corporation with limited liability for its stockholders. Others may be transferred by
contractual arrangements, including insurance.
Corporations—A Firm
The owner or owners of a firm face serious potential losses. They are responsible to pay debts and other
financial obligations when such liabilities exceed the firm’s assets. If the firm is organized as a sole
proprietorship, the proprietor faces this risk. His or her personal assets are not separable from those of
the firm because the firm is not a separate legal entity. The proprietor has unlimited liability for the firm’s
obligations. General partners in a partnership occupy a similar situation, each partner being liable
without limit for the debts of the firm.
Because a corporation is a separate legal entity, investors who wish to limit possible losses connected with
a particular venture may create a corporation and transfer such risks to it. This does not prevent losses
from occurring, but the burden is transferred to the corporation. The owners suffer indirectly, of course,
but their loss is limited to their investment in the corporation. A huge liability claim for damages may take
all the assets of the corporation, but the stockholders’ personal assets beyond their stock in this particular
corporation are not exposed to loss. Such a method of risk transfer sometimes is used to
compartmentalize the risks of a large venture by incorporating separate firms to handle various segments
of the total operation. In this way, a large firm may transfer parts of its risks to separate smaller
subsidiaries, thus placing limits on possible losses to the parent company owners. Courts, however, may
not approve of this method of transferring the liability associated with dangerous business activities. For
example, a large firm may be held legally liable for damages caused by a small subsidiary formed to
manufacture a substance that proves dangerous to employees and/or the environment.
Contractual Arrangements
Some risks are transferred by a guarantee included in the contract of sale. A noteworthy example is the
warranty provided a car buyer. When automobiles were first manufactured, the purchaser bore the
burden of all defects that developed during use. Somewhat later, automobile manufacturers agreed to
replace defective parts at no cost, but the buyer was required to pay for any labor involved. Currently,
manufacturers typically not only replace defective parts but also pay for labor, within certain constraints.
The owner has, in effect, transferred a large part of the risk of purchasing a new automobile back to the

manufacturer. The buyer, of course, is still subject to the inconvenience of having repairs made, but he or
she does not have to pay for them.
Other types of contractual arrangements that transfer risk include leases and rental agreements, hold-
harmless clauses [2]
and surety bonds. [3]
Perhaps the most important arrangement for the transfer of risk
important to our study is insurance.
Insurance is a common form of planned risk transfer as a financing technique for individuals and most
organizations. The insurance industry has grown tremendously in industrialized countries, developing
sophisticated products, employing millions of people, and investing billions of dollars. Because of its core
importance in risk management, insurance is the centerpiece in most risk management activities.
Risk Assumption
The upper-left corner of the matrix in Table 4.4 "The Traditional Risk Management Matrix (for One
Risk)", representing both low frequency and low severity, shows retention of risk. When an organization
uses a highly formalized method of retention of a risk, it is said the organization has self-insured the risk.
The company bears the risk and is willing to withstand the financial losses from claims, if any. It is
important to note that the extent to which risk retention is feasible depends upon the accuracy of loss
predictions and the arrangements made for loss payment. Retention is especially attractive to large
organizations. Many large corporations use captives, which are a form of self-insurance. When a business
creates a subsidiary to handle the risk exposures, the business creates a captive. As noted above, broadly
defined, a captive insurance company is one that provides risk management protection to its parent
company and other affiliated organizations. The captive is controlled by its parent company. We will
provide a more detailed explanation of captives in Chapter 6 "The Insurance Solution and Institutions". If
the parent can use funds more productively (that is, can earn a higher after-tax return on investment), the
formation of a captive may be wise. The risk manager must assess the importance of the insurer’s claims
adjusting and other services (including underwriting) when evaluating whether to create or rent a captive.

Risk managers of smaller businesses can become part of a risk retention group. [4]
A risk retention
group provides risk management and retention to a few players in the same industry who are too small to
act on their own. In this way, risk retention groups are similar to group self-insurance. We discuss them
further in Chapter 6 "The Insurance Solution and Institutions".
Risk Reduction
Moving over to the upper-right corner of the risk management matrix in Table 4.4 "The Traditional Risk
Management Matrix (for One Risk)", the quadrant characterized by high frequency and low severity, we
find retention with loss control. If frequency is significant, risk managers may find efforts to prevent
losses useful. If losses are of low value, they may be easily paid out of the organization’s or individual’s
own funds. Risk retention usually finances highly frequent, predictable losses more cost effectively. An
example might be losses due to wear and tear on equipment. Such losses are predictable and of a
manageable, low-annual value. We described loss control in the case of the fitness center above.
Loss prevention efforts seek to reduce the probability of a loss occurring. Managers
use loss reduction efforts to lessen loss severity. If you want to ski in spite of the hazards involved, you
may take instruction to improve your skills and reduce the likelihood of you falling down a hill or crashing
into a tree. At the same time, you may engage in a physical fitness program to toughen your body to
withstand spills without serious injury. Using both loss prevention and reduction techniques, you attempt
to lower both the probability and severity of loss.
Loss prevention’s goal seeks to reduce losses to the minimum compatible with a reasonable level of
human activity and expense. At any given time, economic constraints place limits on what may be done,
although what is considered too costly at one time may be readily accepted at a later date. Thus, during
one era, little effort may have been made to prevent injury to employees, because employees were
regarded as expendable. The general notion today, however, is that such injuries are prevented because
they have become too expensive. Change was made to adapt to the prevailing ideals concerning the value
of human life and the social responsibility of business.

Risk Avoidance
In the lower-right corner of the matrix in Table 4.4 "The Traditional Risk Management Matrix (for One
Risk)", at the intersection of high frequency and high severity, we find avoidance. Managers seek to avoid
any situation falling in this category if possible. An example might be a firm that is considering
construction of a building on the east coast of Florida in Key West. Flooding and hurricane risk would be
high, with significant damage possibilities.
Of course, we cannot always avoid risks. When Texas school districts were faced with high severity and
frequency of losses in workers’ compensation, schools could not close their doors to avoid the problem.
Instead, the school districts opted to self-insure, that is, retain the risk up to a certain loss limit. [5]
Not all avoidance necessarily results in “no loss.” While seeking to avoid one loss potential, many efforts
may create another. Some people choose to travel by car instead of plane because of their fear of flying.
While they have successfully avoided the possibility of being a passenger in an airplane accident, they
have increased their probability of being in an automobile accident. Per mile traveled, automobile deaths
are far more frequent than aircraft fatalities. By choosing cars over planes, these people actually raise
their probability of injury.
KEY TAKEAWAYS
One of the most important tools in risk management is a road map using projected
frequency and severity of losses of one risk only.
Within a framework of similar companies, the risk manager can tell when it is most
appropriate to use risk transfer, risk reduction, retain or transfer the risk.
DISCUSSION QUESTIONS
1. Using the basic risk management matrix, explain the following:
a. When would you buy insurance?
b. When would you avoid the risk?
c. When would you retain the risk?

d. When would you use loss control?
Give examples for the following risk exposures:
a. High-frequency and high-severity loss exposures
b. Low-frequency and high-severity loss exposures
c. Low-frequency and low-severity loss exposures
d. High-frequency and low-severity loss exposure
[1] Etti G. Baranoff, “Determinants in Risk-Financing Choices: The Case of Workers’
Compensation for Public School Districts,” Journal of Risk and Insurance, June 2000.
[2] “A Hold Harmless Agreement is usually used where the Promisor’s actions could lead to a
claim or liability to the Promisee. For example, the buyer of land wants to inspect the property
prior to close of escrow, and needs to conduct tests and studies on the property. In this case,
the buyer would promise to indemnify the current property owner from any claims resulting
from the buyer’s inspection (i.e., injury to a third party because the buyer is drilling a hole; to
pay for a mechanic’s lien because the buyer hired a termite inspector, etc.). Another example is
where a property owner allows a caterer to use its property to cater an event. In this example,
the Catering Company (the “Promisor”) agrees to indemnify the property owner for any claims
arising from the Catering Company’s use of the property.” From Legaldocs, a division of U.S.A.
Law Publications, Inc.,http://www.legaldocs.com/docs/holdha_1.mv.
[3] A surety bond is a three-party instrument between a surety, the contractor, and the project
owner. The agreement binds the contractor to comply with the terms and conditions of a
contract. If the contractor is unable to successfully perform the contract, the surety assumes
the contractor’s responsibilities and ensures that the project is completed.
[4] President Reagan signed into law the Liability Risk Retention Act in October 1986 (an
amendment to the Product Liability Risk Retention Act of 1981). The act permits formation of
retention groups (a special form of captive) with fewer restrictions than existed before. The

retention groups are similar to association captives. The act permits formation of such groups in
the U.S. under more favorable conditions than have existed generally for association captives.
The act may be particularly helpful to small businesses that could not feasibly self-insure on
their own but can do so within a designated group. How extensive will be the use of risk
retention groups is yet to be seen. As of the writing of this text there are efforts to amend the
act.
[5] Etti G. Baranoff, “Determinants in Risk-Financing Choices: The Case of Workers’
Compensation for Public School Districts,” Journal of Risk and Insurance, June 2000.

4.5 Comparisons to Current Risk-Handling Methods
LEARNING OBJECTIVES
In this section we return to the risk map and compare the risk map created for the
identification purpose to that created for the risk management tools already used by
the business.
If the solution the firm uses does not fit within the solutions suggested by the risk
management matrix, the business has to reevaluate its methods of managing the
risks.
At this point, the risk manager of Notable Notions can see the potential impact of its risks and its best risk
management strategies. The next step in the risk mapping technique is to create separate graphs that
show how the firm is currently handling each risk. Each of the risks inFigure 4.4 "Notable Notions
Current Risk Handling" is now graphed according to whether the risk is uninsured, retained, partially
insured or hedged (a financial technique to lower the risk by using the financial instrument discussed
in Chapter 6 "The Insurance Solution and Institutions"), or insured. Figure 4.4 "Notable Notions Current
Risk Handling" is the new risk map reflecting the current risk management handling.
Figure 4.4 Notable Notions Current Risk Handling

When the two maps, the one in Figure 4.2 "Notable Notions Risk Map"and the one in Figure 4.4 "Notable
Notions Current Risk Handling", are overlaid, it can be clearly seen that some of the risk strategies
suggested in Table 4.4 "The Traditional Risk Management Matrix (for One Risk)" differ from current risk
handling as shown in Figure 4.4 "Notable Notions Current Risk Handling". For example, a broker
convinced the risk manager to purchase an expensive policy for e-risk. The risk map shows that for
Notable Notions, e-risk is low severity and low frequency and thus should remain uninsured. By
overlaying the two risk maps, the risk manager can see where current risk handling may not be
appropriate.
The Effect of Risk Handling Methods
We can create another map to show how a particular risk management strategy of the maximum severity
that will remain after insurance. This occurs when insurance companies give only low limits of coverage.
For example, if the potential severity of Notable Notions’ earthquake risk is $140 million, but coverage is
offered only up to $100 million, the risk falls to a level of $40 million.
Using holistic risk mapping methodology presents a clear, easy-to-read presentation of a firm’s overall
risk spectrum or the level of risks that are still left after all risk mitigation strategies were put in place. It
allows a firm to discern between those exposures that after all mitigation efforts are still
1. unbearable,
2. difficult to bear, and
3. relatively unimportant.
In summary, risk mapping has five main objectives:
1. To aid in the identification of risks and their interrelations
2. To provide a mechanism to see clearly what risk management strategy would be the best to
undertake

3. To compare and evaluate the firm’s current risk handling and to aid in selecting appropriate
strategies
4. To show the leftover risks after all risk mitigation strategies are put in place
5. To easily communicate risk management strategy to both management and employees
Ongoing Monitoring
The process of risk management is continuous, requiring constant monitoring of the program to be
certain that (1) the decisions implemented were correct and have been implemented appropriately and
that (2) the underlying problems have not changed so much as to require revised plans for managing
them. When either of these conditions exists, the process returns to the step of identifying the risks and
risk management tools and the cycle repeats. In this way, risk management can be considered a systems
process, one in never-ending motion.
KEY TAKEAWAYS
In this section we return to the risk map and compare the risk map created for the
identification purpose to that created for the risk management tools already used by
the business. This is part of the decision making using the highly regarded risk
management matrix tool.
If the projected frequency and severity indicate different risk management solutions,
the overlay of the maps can immediately clarify any discrepancies. Corrective actions
can be taken and the ongoing monitoring continues.
DISCUSSION QUESTIONS
1. Use the designed risk map for the small child-care company you created above.
Create a risk management matrix for the same risks indentified in the risk map of
question 1.
2. Overlay the two risk maps to see if the current risk management tools fit in with
what is required under the risk management matrix.
3. Propose corrective measures, if any.

4. What would be the suggestions for ongoing risk management for the child-care
company?

4.6 Appendix: Forecasting
Forecasting of Frequency and Severity
When insurers or risk managers use frequency and severity to project the future, they use trending
techniques that apply to the loss distributions known to them. [1]
Regressions are the most commonly used
tools to predict future losses and claims based on the past. In this textbook, we introduce linear regression
using the data featured inChapter 2 "Risk Measurement and Metrics". The scientific notations for the
regressions are discussed later in this appendix.
Table 4.5 Linear Regression Trend of Claims and Losses of A
Year
Actual Fire
Claims
Linear Trend For
Claims
Actual Fire
Losses
Linear Trend For
Losses
1 11 8.80 $16,500 $10,900.00
2 9 9.50 $40,000 $36,900.00
3 7 10.20 $30,000 $62,900.00
4 10 10.90 $123,000 $88,900.00
5 14 11.60 $105,000 $114,900.00
Figure 4.5 Linear Regression Trend of Claims of A

Figure 4.6 Linear Regression Trend of Losses of A
Using Linear Regression
Linear regression attempts to explain the relationship among observed values by applying a straight line
fit to the data. The linear regression model postulates that
Y= b+mX+e
,where the “residual” e is a random variable with mean of zero. The coefficients a and b are determined by
the condition that the sum of the square residuals is as small as possible. For our purposes, we do not
discuss the error term. We use the frequency and severity data of A for 5 years. Here, we provide the
scientific notation that is behind Figure 4.5 "Linear Regression Trend of Claims of A" and Figure 4.6
"Linear Regression Trend of Losses of A".
In order to determine the intercept of the line on the y-axis and the slope, we use m (slope) and b (y-
intercept) in the equation.
Given a set of data with n data points, the slope (m) and the y-intercept (b) are determined using:
m = nΣ(xy)−ΣxΣy / nΣ(x2)−(Σx)2
b = Σy−mΣx / n
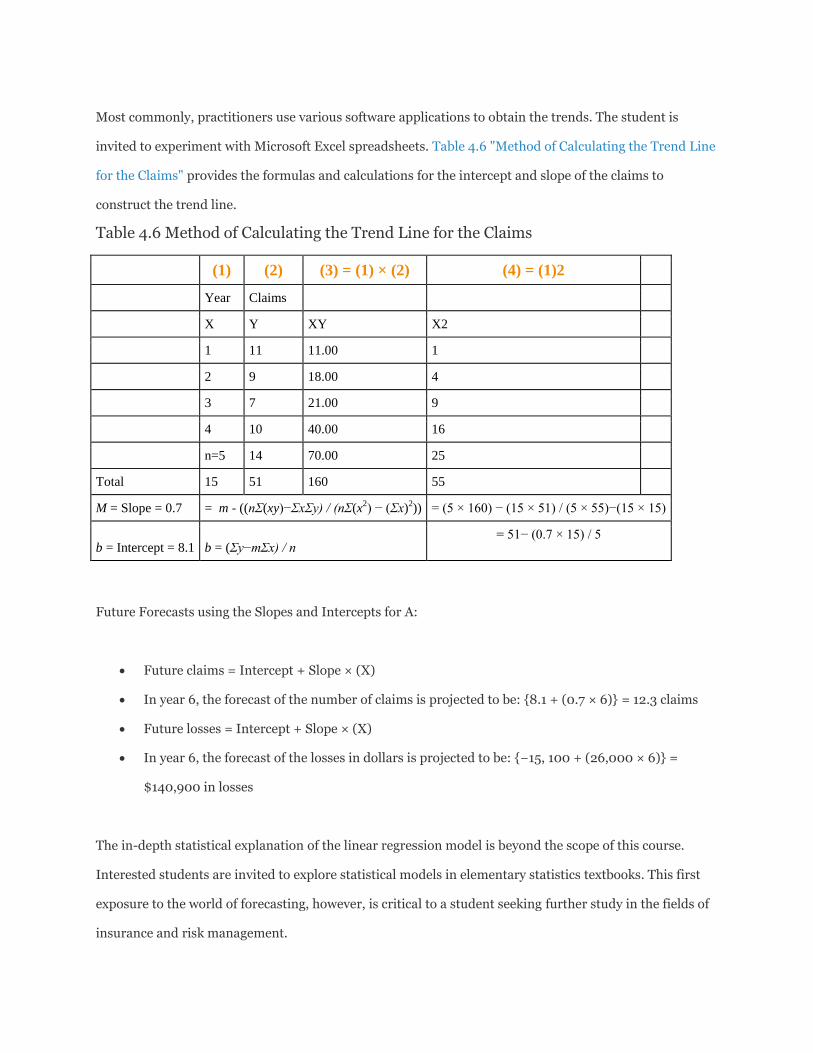
Most commonly, practitioners use various software applications to obtain the trends. The student is
invited to experiment with Microsoft Excel spreadsheets. Table 4.6 "Method of Calculating the Trend Line
for the Claims" provides the formulas and calculations for the intercept and slope of the claims to
construct the trend line.
Table 4.6 Method of Calculating the Trend Line for the Claims
(1) (2) (3) = (1) × (2) (4) = (1)2
Year Claims
X Y XY X2
1 11 11.00 1
2 9 18.00 4
3 7 21.00 9
4 10 40.00 16
n=5 14 70.00 25
Total 15 51 160 55
M = Slope = 0.7 = m - ((nΣ(xy)−ΣxΣy) / (nΣ(x
2) − (Σx)
2)) = (5 × 160) − (15 × 51) / (5 × 55)−(15 × 15)
b = Intercept = 8.1 b = (Σy−mΣx) / n = 51− (0.7 × 15) / 5
Future Forecasts using the Slopes and Intercepts for A:
Future claims = Intercept + Slope × (X)
In year 6, the forecast of the number of claims is projected to be: {8.1 + (0.7 × 6)} = 12.3 claims
Future losses = Intercept + Slope × (X)
In year 6, the forecast of the losses in dollars is projected to be: {−15, 100 + (26,000 × 6)} =
$140,900 in losses
The in-depth statistical explanation of the linear regression model is beyond the scope of this course.
Interested students are invited to explore statistical models in elementary statistics textbooks. This first
exposure to the world of forecasting, however, is critical to a student seeking further study in the fields of
insurance and risk management.

[1] Forecasting is part of the Associate Risk Manager designation under the Risk Assessment course
using the book: Baranoff Etti, Scott Harrington, and Greg Niehaus, Risk Assessment (Malvern, PA:
American Institute for Chartered Property Casualty Underwriters/Insurance Institute of America, 2005).

4.7 Review and Practice 1. What are the adverse consequences of risk? Give examples of each.
2. What is a common process of risk management for property exposure of a firm?
3. How was the traditional process of risk management expanded?
4. The liability of those who own a corporation is limited to their investment, while proprietors and
general partners have unlimited liability for the obligations of their business. Explain what relevance
this has for risk management.
5. What are the three objectives of risk mapping? Explain one way a chief risk officer would use a risk
map model.
6. Define the terms loss prevention and loss reduction. Provide examples of each.
7. What are the types of risks that are included in an enterprise risk analysis?
8. What has helped to expand risk management into enterprise risk management?
9. Following is the loss data for slip-and-fall shoppers’ medical claims of the fashion designer LOLA for
the years 2004–2008.
a. Calculate the severity and frequency of the losses.
b. Forecast the severity and frequency for next year using the appendix to this chapter.
c. What would be the risk management solution if Lola’s results are above the median of
severity and frequency for the industry of the geographical location?
Year Number of Slip-and-Fall Claims Slip-and-Fall Losses
2004 700 $2,650,000
2005 1,000 $6,000,000
2006 700 $7,000,000
2007 900 $12,300,000
2008 1,400 $10,500,000
Brooks Trucking, which provides trucking services over a twelve-state area from its home base in
Cincinnati, has never had a risk management program. Shawana Lee, Brooks Trucking’s financial
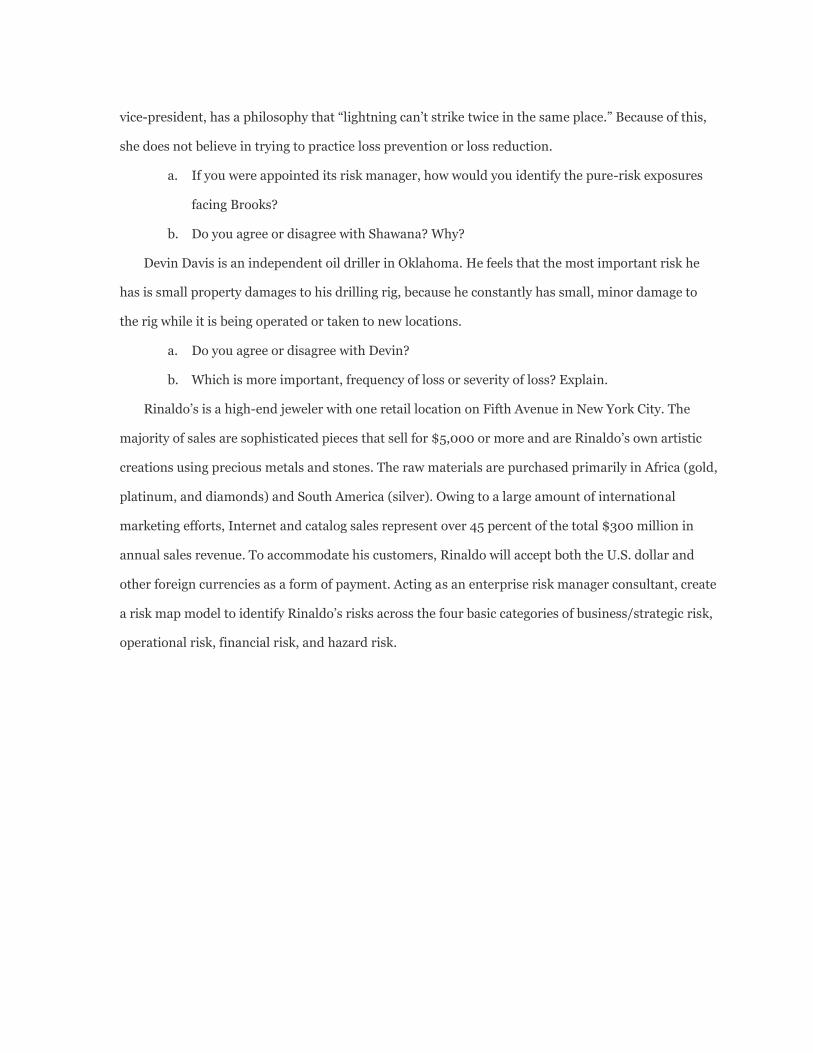
vice-president, has a philosophy that “lightning can’t strike twice in the same place.” Because of this,
she does not believe in trying to practice loss prevention or loss reduction.
a. If you were appointed its risk manager, how would you identify the pure-risk exposures
facing Brooks?
b. Do you agree or disagree with Shawana? Why?
Devin Davis is an independent oil driller in Oklahoma. He feels that the most important risk he
has is small property damages to his drilling rig, because he constantly has small, minor damage to
the rig while it is being operated or taken to new locations.
a. Do you agree or disagree with Devin?
b. Which is more important, frequency of loss or severity of loss? Explain.
Rinaldo’s is a high-end jeweler with one retail location on Fifth Avenue in New York City. The
majority of sales are sophisticated pieces that sell for $5,000 or more and are Rinaldo’s own artistic
creations using precious metals and stones. The raw materials are purchased primarily in Africa (gold,
platinum, and diamonds) and South America (silver). Owing to a large amount of international
marketing efforts, Internet and catalog sales represent over 45 percent of the total $300 million in
annual sales revenue. To accommodate his customers, Rinaldo will accept both the U.S. dollar and
other foreign currencies as a form of payment. Acting as an enterprise risk manager consultant, create
a risk map model to identify Rinaldo’s risks across the four basic categories of business/strategic risk,
operational risk, financial risk, and hazard risk.