SECTION 2 CONTAINER-GROWN PLANT PRODUCTION - SNA · SECTION 2 CONTAINER-GROWN PLANT PRODUCTION ......
87
"SNA RESEARCH CONFERENCE - VOL. 36-1991" 56 SECTION 2 CONTAINER-GROWN PLANT PRODUCTION Dr. Bonnie Appleton Section Chairman and Moderator
Transcript of SECTION 2 CONTAINER-GROWN PLANT PRODUCTION - SNA · SECTION 2 CONTAINER-GROWN PLANT PRODUCTION ......
"SNA RESEARCH CONFERENCE - VOL. 36-1991"
56
SECTION 2CONTAINER-GROWNPLANT PRODUCTION
Dr. Bonnie AppletonSection Chairman and Moderator

"SNA RESEARCH CONFERENCE - VOL. 36-1991"
57
Growing Landscape Plants in Yard Waste Compost
Dennis B. McConnell and Aziz Shlralipour Florida
Nature of Work: Over 5 Ibs of municipal solid waste (MSW) is generated per person per day in the United States (1). Since MSW can no longer be disposed of in open burning dumps, over 70% of our MSW is buried in 5,500 active landfills (4,5). Most of these landfills are approaching capacity and new landfill sites are limited. Yard waste (grass clippings, leaves, branches and other plant debris) ac-count for 20-40% of MSW in Florida (8). If composted yard waste could be used individually or in combination with standard potting mixes as a container plant growth substrate an important beneficial use for these materials would be identified. Most potting mixes used for container production contain 70% or more organic matter. Peat and pine bark comprise most of the organic matter used. The sup-ply of peat is limited, prices are escalating and alternative uses for pine bark have increased the price and reduced the supply. Previous research has shown that 40% or more of the total potting mix can be supplied from other than the traditional sources of peat and pine bark (6). The objective of this research was to investigate the growth response of landscape plants in potting mixes formulated with com-posted yard waste (CYW).
Experiment 1. Two month old Quercus shumardii Buckl. seedlings were potted in trade one gallon containers using one of nine mixes [a) Metro 300 (100%) b) Metro 300:CYW (7:1); c) Metro 300:CYW (3:1); d) Metro 300:CYW (1:1); e) CYW (100%); f) peat:pine bark:sand (P/PB/S) (1:1:1); g) P/PB/S:CYW (7:1); h) P/PB/S:CYW (3:1); i) P/PB/S:CYW (1:1). Potting mix components were blended on a volume basis. Metro 300 (W.R. Grace & Co., Cambridge, MA) is a commercial potting mix formulated with sphagnum peat, vermiculite, composted pine bark, sand and perlite. The CYW used was obtained from an unturned static pile which was 180 days old (Wood Resource Recovery, Inc., Gainesville, FL). There were six replications per treatment with one plant per container as the experimental unit. The pH of all mixes was adjusted to 6.0-6.5 prior to potting. After potting plants were transferred to an open structure with 70% light transmission (30% shade) and 1 tsp of Osmocote 18-6-12 (N, P2O5, K2O) was applied per container. After a one month establishment period all plants were cut back to a uniform height of 10 cm. Height, width (average of two measurements) and number of branches were determined at experiment initiation and every 6 weeks for 6 months. The growth index at experiment termination was calculated by adding the height and average width and dividing the total by two.
Experiment 2. Two month old Acer rubrum L. seedlings were potted in standard one gallon containers using one of eight mixes [a) Metro 300 (100%); b) Metro 300:coarse (C) CYW (1:1); c) CCYW (100%); d) Metro 300: fine (F) CYW (1:1); e) FCYW (100%); f) P/PB/S (2:2:1); g) P/PB/S/CCYW (1:1:1: 2); h) P/PB/S/FCYW

(1:1:1: 2). There were eight replicates per treatment. The coarse and fine CYW (Recycled Wood Products, Tampa, FL) were produced by composting ground yard waste in aerated windrows (turned every 3 weeks) for 90 days and screening it into two categories: fine (.375 in or smaller) and coarse (.375-.625 in). After potting plants were transferred to an open structure with 50% light transmission (50% shade) and grown for 270 days. Fertilization, data collection and calculations were as described in Experiment 1.
Results and Discussion: Quercus shumardii grew poorly in 100% CYW compared to plants grown in other potting mixes (Table 1). Research has shown that phy-totoxins are detected in CWv from unturned static piles for several months (7,9). Statistically, there was little difference in plant growth in other potting mixes. All plants were grown from acorns, and seedling variability may have contributed to data overlap with subsequent lack of statistical differences between plant growth in different potting mixes. The data does reveal Q. shumardii grown in P/PB/S (100%); P/PB/S:CYW (7:1) and Metro 300:CYW (3:1) had the highest growth index values. Most commercial producers of Q. shumardii use a P/PB/S potting mix.
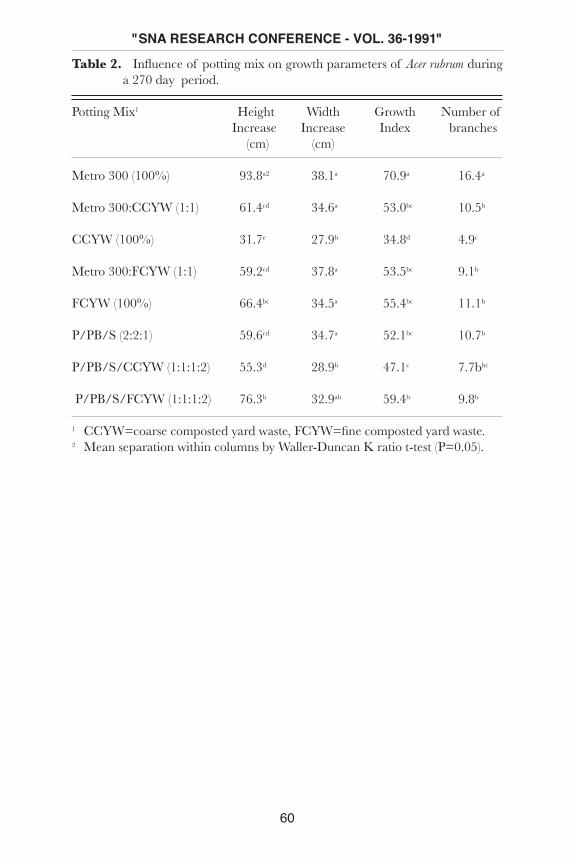
Acer rubrum had the greatest height increase and highest growth index when grown in Metro 300 (Table 2). Previous research had shown Metro 300 was an excellent growth substrate for some woody plants (2). Plants grown in P/PB/S/FCYW (1:1:1:2), FCYW (100%) and Metro 300/CCYW (1:1) had growth parameters (height increase, growth index, etc.) equal to or greater than plants grown in a representative nursery mix [P/PB/S (2:2:1)]. The least height increase and lowest growth index occurred when plants were grown in 100% CCYW.
Significance to Industrv. The results of this study and others (3) indicate CYW can be used as a potting mix component. If produced from turned windrows and screened to remove particles larger than .375 in CYW may be suitable as a sole ingredient in potting mixes. In this study, plant growth in FCYW was equal to or greater than plant growth in a representative nursery mix [P/PB/S (2:2:1)]. The results also show that FCYW or CCYW can be used to replace part of the peat and pine bark used in P/PB/S nursery mixes. CYW from a static pile 180 days old did not appear to be suitable as the sole ingredient of a potting mix.
Literature Cited
1. Glen, J. and D. Riggle. 1989. Where does the waste go? BioCycle April:34-39.
2. McConnell, D. B. 1987. Container size and potting medium affect growth rate of weeping fig and loquat. Proc. Fla. State Hort. Soc. 100:337-339.
3. McConnell, D. B. and W. H. Smith. 1990. Use of yard waste compost in pot-ting mixes. HortScience 25(9):1101.
"SNA RESEARCH CONFERENCE - VOL. 36-1991"
58

"SNA RESEARCH CONFERENCE - VOL. 36-1991"
59
4. Nebel, B. J. 1990. The solid waste crisis. In Environmental Science: The way the world works. pp. 427-440. Prentice Hall, Englewood Cliffs, N.J.
5. Rathje, W. L. 1991. Once and future landfills. National Geographic 179(5):117-134.
6. Sanderson, K. C. 1980. Use of sewage-refuse compost in the production of ornamental plants. HortScience 15:173-178.
7. Shiralipour, A. and D. B. McConnell. 1 991. Influence of yard trash compost-ing on weed tree seed germination. Proc. Environmentally Sound Agr. Vol. 2:549-556.
8. Smith, W. H., D. B. McConnell, and R. Norstedt. 1989. Yard trash: Recycling for horticultural applications. Florida Nurseryman 36(11):46-49.
9. Zucconi, F., A. Para, and M. Forte. 1981. Evaluating toxicity of immature compost. BioCycle. March-April:54-57.
Table 1. Influence of potting mix on selected growth parameters of Quercus shumardii during a 180 day period.
Height Width Increase Increase Growth Number of Potting Mix1 (cm) (cm) Index branches
Metro 300 (100%) 54.2abc2 17.6ab 35.9ab 4.2a
Metro 300:CYW (7:1) 48.5abc 22.8a 35.6ab 5.0a
Metro 300:CYW (3:1) 56.5ab 20.8ab 38.6a 3.8a
Metro 300:CYW (1:1) 42.0bc 16.6ab 29.3b 2.1a
CYW (100%) 18.8d 10.5b 14.6c 2.8a
P/PB/S (100%) 51.8abc 24.3a 38.0a 3.0a
P/PB/S:CYW (7:1) 58.3a 17.5ab 37.9a 4.5a
P/PB/S:CYW (3:1) 39.2c 16.7ab 27.9b 2.0a
P/PB/S:CYW (1:1) 45.3abc 18.0ab 31.6ab 3.3a
1 CYW=Composted yard waste.2 Mean separation within columns by Waller-Duncan K ratio t test (P=0.05).
"SNA RESEARCH CONFERENCE - VOL. 36-1991"
60
Table 2. Influence of potting mix on growth parameters of Acer rubrum during a 270 day period.
Potting Mix1 Height Width Growth Number of Increase Increase Index branches (cm) (cm)
Metro 300 (100%) 93.8a2 38.1a 70.9a 16.4a
Metro 300:CCYW (1:1) 61.4cd 34.6a 53.0bc 10.5b
CCYW (100%) 31.7e 27.9b 34.8d 4.9c
Metro 300:FCYW (1:1) 59.2cd 37.8a 53.5bc 9.1b
FCYW (100%) 66.4bc 34.5a 55.4bc 11.1b
P/PB/S (2:2:1) 59.6cd 34.7a 52.1bc 10.7b
P/PB/S/CCYW (1:1:1:2) 55.3d 28.9b 47.1c 7.7bbc
P/PB/S/FCYW (1:1:1:2) 76.3b 32.9ab 59.4b 9.8b
1 CCYW=coarse composted yard waste, FCYW=fine composted yard waste. 2 Mean separation within columns by Waller-Duncan K ratio t-test (P=0.05).
"SNA RESEARCH CONFERENCE - VOL. 36-1991"
61
Use of Horticultural Rockwool, Poultry Litter Compost and Pine Bark as Container Media
T.E. Bilderback and W.C. FontenoNorth Carolina
Nature of Work: Solid waste management and water quality are two of the biggest issues facing the ornamental industry and this nation. Environmental concern is placing considerable emphasis on agricultural crop production to maximize nutrient and water efficiency, reduce nutrient runoff impacts on water quality, and utilize recycled stabilized wastes. Although several alternative cul-tural practices may reduce water and nutrient run-off from nurseries, engineering container media to hold more water and nutrients seems to be one of the more practical approaches. Media composed of pine bark (PB), horticultural rockwool (RW) and poultry litter compost (C) were evaluated in this study to determine the usefulness of composts on water and nutrient retention and rockwool to maintain air space in blended media. Cotoneaster dammeri ‘Skogholm’ and Rhododendron sp. ‘Sunglow’ rooted liners were grown in 1 of 5 container sestrates in 3qt. (2.8 liter) containers. Drip irrigation was applied twice daily with approximately 400 ml per irrigation or daily, or every other day with approximately 800 ml of water. There were no significant interactions between container medium and irrigation, therefore container media data reported are averaged for irrigation frequency. Pine bark was amended with dolomitic limestone and Scotts Step minor element supplement at 5.0 and 1.5 lbs/cu.yd. respectively, before blending with other components or potting. Scotts ProKote (20-3-10) was incorporated into all media at the rate of 10 lbs./ cu.yd. Containers were placed in a randomized complete block design with 6 replications. The effect of component combinations in each medium on container air and water relationships, nutrient retention, and plant response was analyzed. Nutrient retention was be determined by VTEM extraction 2, 5, and 9 weeks after initiation of the study. Samples were analyzed for NO3-N, NH4-N, P, K, Ca, and Mg, electrical conductance (EC) and pH (data not presented). Plant response was evaluated by shoot dry weight of both species and root dry weight of cotoneaster at the conclusion of the study.
Results and Discussion: Addition of rockwool to pine bark decreased bulk density and container capacity, and increased total porosity, and air space (Table 1) . Addition of 33% (by volume) of poultry litter compost to pine bark had no or little effect on total porosity and container capacity, but increased bulk density and unavailable water. When both components were added at 15% each (by volume) only an increase in unavailable water was detected when compared to the pine bark control. Addition of both components at 25% each (by volume) appeared to increase bulk density and decrease unavailable water held in the medium compared to pine bark. A 30% addition of rockwool to pine bark initially decreased pH, did not effect electrical conductivity (EC) but increased container nitrogen levels. A 33% addition of compost to pine bark increased pH and EC after 5 weeks and NO3-N, P, K, Ca, and Mg levels were increased while NH4-N was decreased. Effects of chemical

"SNA RESEARCH CONFERENCE - VOL. 36-1991"
62
properties with addition of both components to pine bark were variable however, both rates tended to increased NO3-N, P,K, Ca and Mg nutrient levels during the study. Greatest top dry weight for azalea was achieved in the pine bark medium, least in the single additions of rockwool or compost and top dry weights in three component media were intermediate (Table 2). Cotoneaster had greatest top dry weight in pine bark and the three component media and least top dry weight in the pine bark:compost and pine bark:rockwool two component treatments. Cotoneaster root dry weight was not different among the media tested.
Significance to Industry: Organic container media have low anion and cation exchange capacities. Data in this study indicated that poultry litter compost when blended with pine bark maintained higher nutrient levels during the growing season than pine bark alone, while rockwool increased air space when compost was used. Use of both components produced growth equal to the pine bark control medium and suggests that these materials can be beneficial in commercial nursery potting mixes. Further studies need to be conducted to determine optimal component ratios and water and nutrient management practices.
Table 1: Physical properties of Rockwool, Composted Poultry Litter and Pine Bark Subtrates.z
Medium Bulk Total Container Air UnavailableDescription Density Porosityy Capacityx Spacew Waterv
Pine Bark 0.23 84.0 68.6 15.42 24.85
PB:RW (70:30) 0.20 87.1 66.1 21.01 24.62
PB:Compost (67.33) 0.26 84.4 67.5 16.90 29.30
PB:RW:C (70:15:15) 0.24 84.7 69.8 14.88 28.92
PB:RW:C (50:25:25) 0.26 85.4 68.7 16.73 22.39
z Analyses nperformed using standard aluminum soil sampling cylinders (7.6 cm ID, 7.6 cm h)
y Percent volume at 0 kPa.x Predicted as percent volume at drainage.w Calculated as the difference between total porosity and container capacity.v Percent volume at 1.5 MPa.

"SNA RESEARCH CONFERENCE - VOL. 36-1991"
63
Table 2: Top dry weight of Cotoneaster dammero ‘Skogholm’ and Rhododendron sp. ‘Sunglow’ as affected by container subtrates.
Container Top Dry Weightz
Medium Cotoneaster Azalea (g)
PB 72.6ab 18.9a
PB:RW 71.1b 9.7c(70:30)
PB:C 57.9b 10.0c(67.33)
PB:RW:C 88.0a 15.6b(70:15:15)
PB:RW:C 72.5ab 14.9b(50:25:25)
z Mean seperation within a column followed by the same letter or letters are not significantly different using the Waller-Duncan k-ratio t-test at k-ration = 100. Each value represents the mean 18 plants.
Predicting Air Space and Water Retention of Pine Bark-Sand Potting Media from Analyses of Medium Compo-
nents
M. A. Nash and F. A. Pokorny Georgia
Nature of Work: Standardization of container production practices such as ir-rigation and fertilization is a goal of container nursery operators. Before this goal can be reached, a feasible method of standardizing physical and chemical properties of potting media must be found. This is difficult because of the wide variety of potting media components available and considerable batch-to-batch variation of potting media components. Standardization of potting media can be done by preparing various media samples and testing each one in the laboratory, but this is time consuming and costly.
Another method of standardizing potting media is application of computer modeling techniques. This entails formulation of mathematical equations which estimate physical and chemical properties of potting media from analyses of the potting
"SNA RESEARCH CONFERENCE - VOL. 36-1991"
64
medium components. The equations must be independent of the type and batch of potting medium component before they are useful for predictive work. Math-ematical equations which can be used to estimate several physical and chemical properties have been devised and tested (2,3,4,7).
Objectives of this study are to devise and test mathematical equations which accu-rately estimate air/water relations of pine bark-sand potting media from laboratory analyses of the medium components.
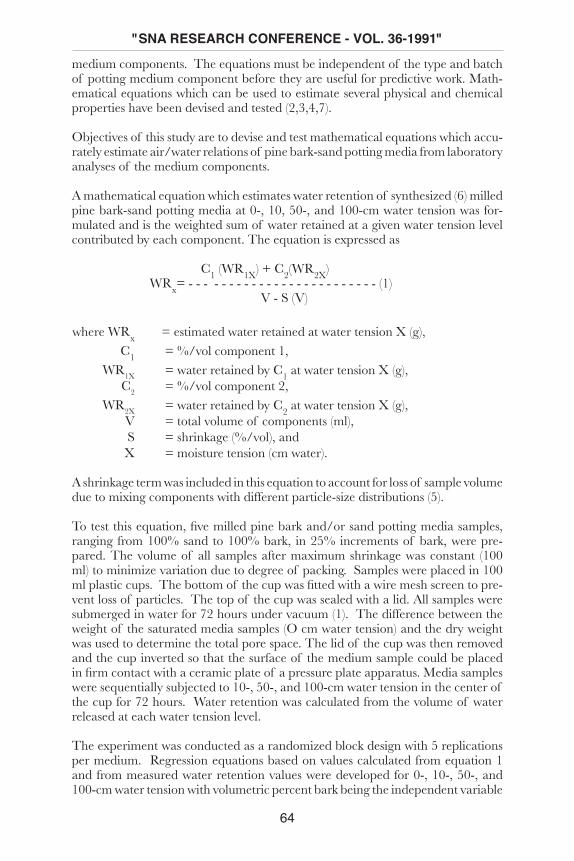
A mathematical equation which estimates water retention of synthesized (6) milled pine bark-sand potting media at 0-, 10, 50-, and 100-cm water tension was for-mulated and is the weighted sum of water retained at a given water tension level contributed by each component. The equation is expressed as
C1 (WR1X) + C2(WR2X) WRx= - - - - - - - - - - - - - - - - - - - - - - - - - (1) V - S (V)
where WRx = estimated water retained at water tension X (g), C1 = %/vol component 1, WR1X = water retained by C1 at water tension X (g), C2 = %/vol component 2, WR2X = water retained by C2 at water tension X (g), V = total volume of components (ml), S = shrinkage (%/vol), and X = moisture tension (cm water).
A shrinkage term was included in this equation to account for loss of sample volume due to mixing components with different particle-size distributions (5).
To test this equation, five milled pine bark and/or sand potting media samples, ranging from 100% sand to 100% bark, in 25% increments of bark, were pre-pared. The volume of all samples after maximum shrinkage was constant (100 ml) to minimize variation due to degree of packing. Samples were placed in 100 ml plastic cups. The bottom of the cup was fitted with a wire mesh screen to pre-vent loss of particles. The top of the cup was sealed with a lid. All samples were submerged in water for 72 hours under vacuum (1). The difference between the weight of the saturated media samples (O cm water tension) and the dry weight was used to determine the total pore space. The lid of the cup was then removed and the cup inverted so that the surface of the medium sample could be placed in firm contact with a ceramic plate of a pressure plate apparatus. Media samples were sequentially subjected to 10-, 50-, and 100-cm water tension in the center of the cup for 72 hours. Water retention was calculated from the volume of water released at each water tension level.
The experiment was conducted as a randomized block design with 5 replications per medium. Regression equations based on values calculated from equation 1 and from measured water retention values were developed for 0-, 10-, 50-, and 100-cm water tension with volumetric percent bark being the independent variable
"SNA RESEARCH CONFERENCE - VOL. 36-1991"
65
and water retention being the dependent variable. Equality of the two regression equations for each tension level were statistically compared. Results and Discussion: Water retention calculated from equation 1 and mea-sured water retention increased linearly with increasing volumetric percent bark at all 4 water tension levels (0-, 10, 50, 100-cm water tension). Regression equations describing measured and estimated water retention were not statistically different regardless of the moisture tension level. This indicates that equation 1 accurately predicts water retention of pine bark-sand potting media at these moisture levels.
Air space, defined as the %/vol. of air in a sample at 10-cm water tension, can be estimated by subtracting the water retention estimated at 10-cm tension from the water retention estimated at 0-cm water tension. Easily available water, defined as the %/vol. of water retained between 10 and 50-cm water tension, can be es-timated by subtracting water retention estimated from equation 1 at 50-cm water tension from water retention estimated at 10-cm water tension. Similarly, water buffer capacity, defined as the %/vol water retained between 50 and 100-cm wa-ter tension, can be estimated from the water retention values estimated at 50 and 100-cm water tension.
Significance to Industry: The mathematical equation presented here will lead to a more systematic approach to irrigation management based on rate of water uptake by the plant, environmental conditions, and the water retention properties of the potting medium.
Literature Cited
1. Airhart, D. L., N. J. Natarella, and F. A. Pokorny. 1978. The structure of pro-cessed pine bark. J. Amer. Soc. Hort. Sci. 103:404-408.
2. Gibson, P. G. 1984. Prediction of selected physical properties of bark/sand container media from physical analysis of media components. M.S. Thesis, University of Georgia, Athens, Georgia.
3. Nash, M. A. and F. A. Pokorny. 1990. Prediction of CEC of two-component media from laboratory analysis of components. Commun. Soil Sci. and Plant Anal. 21(9 & 10):705-715.
4. Nash, M. A. and F. A. Pokorny. 1988. Predicting pH in pine bark-sand potting media from analysis of components. Proc. SNA Res. Conf. 33:85-87.
5. Nash, M. A. and F. A. Pokorny. 1987. Shrinkage of container media. Proc. SNA Res. Conf. 32:18-20.
6. Pokorny, F. A. and B. K. Henny. 1984. Construction of a milled pine bark and sand potting medium from component particles II. Medium synthesis. J. Amer. Soc. Hort. Sci. 109:774-776.
7. Pokorny, F. A., P. Gibson, and M. G. Dunavent. 1986. Prediction of bulk density of a pine bark and/or sand potting media from laboratory analysis of individual components. J. Amer. Soc. Hort. Sci. 111:8-11.

"SNA RESEARCH CONFERENCE - VOL. 36-1991"
66
Slow Release Fertilizer Evaluations on Containerized Shore Juniper
James T. Midcap, Howell R. Roborts and Mark C. JohnsonGeorgia
Nature of Work: Slow release fertilizers are an integral part of fertilization programs of many container nurseries. Plant growth and the nutrient release characteristics are dependent upon the product used, fertilizer rates and plant species (1,2,3).
The objective of this study was to compare slow release fertilizer products at three rates on the growth of shore juniper. Uniform second year gallons of Juniperus conferta ‘Blue Pacific’ were growing in a 9:1 pine bark:sand medium. The medium was amended in the fall of 1989 with 10 pounds of dolomitic limestone per cubic yard and micro-elements. Fertilizer treatments of Prokote 20-3-10, Sierra 17-6-10, Sierrablen 17-7-10 and High-N 24-4-7 were applied March 12, 1990. The Sierra and Prokote materials are eight to nine month product while the other products are twelve to fourteen month. Materials were applied at high, medium and low rates derived from manufacturers recommendations and given in Table 1. Plants were produced at McCorkle’s Nursery in Dearing, Georgia under conditions of normal production practices.
Table l.
Fertilizer Product Rates in grams Low Medium High
Prokote 20-3-10 13 18 22Sierra 17-6-10 10 15 20.5Sierrablen 17-7-10 12 18 24High-N 24-4-7 9 12 16
Plant growth was evaluated by determining top dry weight in July and November of 1990. Each treatment was visually ranked at the end of the season. Leaf tissue analysis for major and minor nutrients were determined in July and November. Nursery medium samples for all treatments were analyzed for soluble salts and all macro-elements every two weeks throughout the growing season.
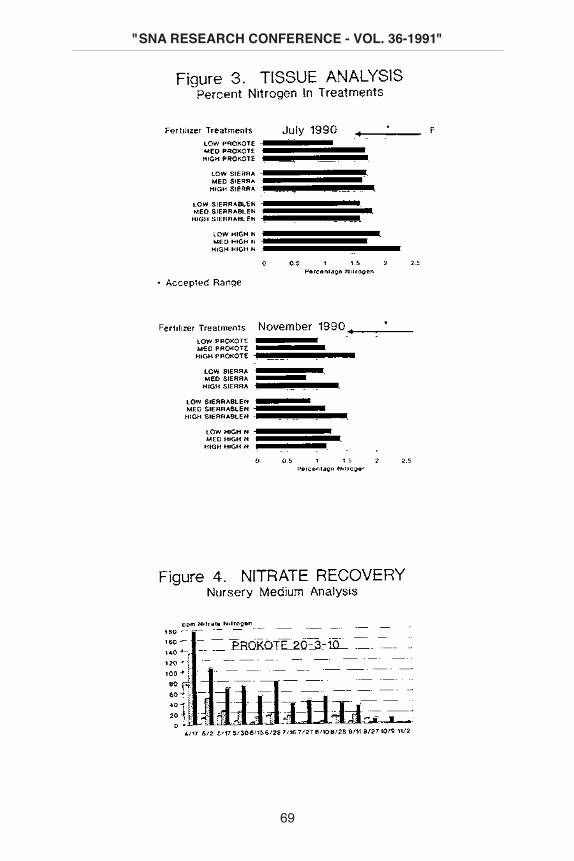
Results and Discussion: Plant growth based on dry weight showed no differ-ences in July for the fertilizer treatments (Figure 1). By November Sierra 17-6-10 at the medium rate produced the most growth but was not significantly different than Prokote 20-3-10 low rate, Sierrablen 17-7-10 at the medium and high rate (Figure 1). Visual ratings at the end of the growing season were highest for Sierra 17-6-10 at the medium rate but not significantly different than Sierra 17-6-10 high rate, Prokote 23-20-10 low and medium rate, Sierrablen 17-7-10 low, medium and high rates or High-N 24-4-7 medium and high rate (Figure 2).

"SNA RESEARCH CONFERENCE - VOL. 36-1991"
67
Tissue analysis of nitrogen showed a dramatic decrease from July to November for all treatments except Prokote 20-3-10 at the high rate. Nitrogen levels by the end of the season were well below those recommended and suggest a need for refertilization (Figure 3).
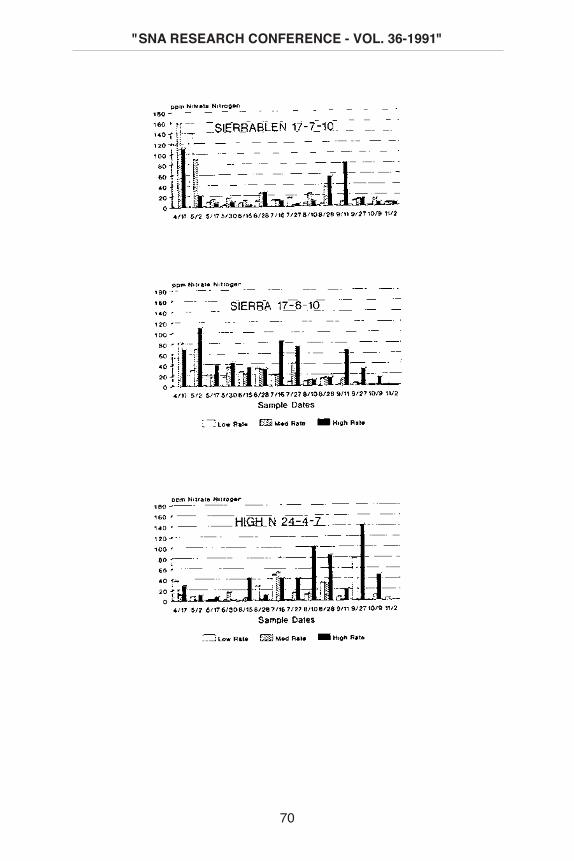
Nitrates recovered from the treatments illustrated various patterns of release throughout the growing season. Higher nitrates were recovered from Prokote 20-3-10 at the high rate than in the medium and low rates. Nitrate recovery at the medium rate was also significantly higher than the low rate. Early season nitrates were higher than late in the season. Higher nitrates were recovered from Sierra 17-6-10 at the high rate than the medium and low rates. There were no differences between the medium and low rate. Early season nitrates were higher than later in the season except for the July samples (Figure 4).
No nitrates differences existed for the three application rates of Sierrablen 17-7-10. Early season release was greater than the rest of the season which showed no difference. High-N 24-4-7 had greater nitrates at the high rate than the medium and low. The medium and low rates were not different. Nitrate levels early in the season were low, with few differences during the rest of the season (Figure 4).
In summary there were differences in the amount of growth and dry weight produced by these products. Most products had early high nitrate levels with a significant decrease as the season progressed. Nutrient levels from tissue samples taken late in the season were much lower than those taken mid season suggesting deficient levels.
Significance to the Industry: Evaluation of slow release fertilizers indicates that mid to late season fertilization may be important in promoting maximum growth. Additional research will be necessary to determine if additional fertilization will prove economically feasible.
Literature Cited
1. Eakes, D. J., W. J. Foster, C. H. Gilliam and J. W. Olive. 1990. Effects of Method of Application and Rate of Three Slow Release Fertilizers. Proc. SNA Res. Conf. 35:55-56.
2. Phillips, E. Lewis and T. E. Bilderback. 1990. Comparison of Container Leachate Levels and Plant Response to Slow Release Fertilizers. Proc. SNA Res. Conf. 35:80-83.
3. Yeager, T. H., D. L. Ingram and C. A. Larsen. 1989. Nitrate Nitrogen and Potassium Release From Surface Applied and Growth Medium Incorporated Osmocote and Escote. Proc. SNA Res. Conf. 34:54-56.

"SNA RESEARCH CONFERENCE - VOL. 36-1991"
68
"SNA RESEARCH CONFERENCE - VOL. 36-1991"
69
F
"SNA RESEARCH CONFERENCE - VOL. 36-1991"
70

"SNA RESEARCH CONFERENCE - VOL. 36-1991"
71
Azalea Production With 12 To 14 MonthSlow Release Fertilizers
D. Joseph Eakes and John W. OliveAlabama
Nature of Work: Utilization of slow release fertilizers has become an integral part in the production of container grown plant material because of the long-term release of nutrients they provide. One group of slow release fertilizer products are the resin coated materials. Release rates for these fertilizers are controlled by the coating thickness, medium moisture content, and most importantly, medium temperature. Manufacturers generally document release rates for their slow release fertilizer products at temperatures ranging from 68 to 77°F. However, Ingram in 1981 noted that container temperatures often exceed 95°F for over 5 hours/day in standard black pots during the summer which would hasten nutrient release (1). The objective of this study was to compare 12 to 14 month slow release fertilizers at 4 rates on medium solution electrical conductivity and growth of 3 azalea species.
Uniform liners of Rhododendron obtusum ‘Coral Bells’ (Kurume), R. indicum ‘Formosa’ (Southern Indian), and R. eriocarpum ‘Pink Gumpo’ (Satsuki) were potted May 2, 1990 in a 3:1 (v:v) pine bark:peat moss medium in trade gallon con-tain-ers. Fertilizer treatments were Osmocote 17-7-12, Sierra 16-6-10, High-N 24-4-7, Sierrablen 17-7-10, and Nutricote 16-10-10 (Type 360) preplant incorporated at 1.5, 2.0, 2.5, and 3.0 lb N/yd3. All media were amended with 6 lb of dolomitic limestone, 2 lb of gypsum, and 1.5 lb of Micromax/yd3 with the exception of the Sierra 16-6-10 medium where no Micromax was added. There were 6 replications of 2 plants each arranged in a randomized complete block design.
Medium leachates were collected 30, 60, 90, 120, 150, 180, 240, 300, and 360 days after treatment (DAT) using the pour through technique to determine medium solution electrical conductivity (EC) (2). On January 4, 1991, one plant/replication/treatment was harvested to determine shoot dry weight (1990 growing season). The remaining plants were harvested to determine shoot dry weights on May 6, 1991 (1991 spring flush of growth).
Results and Discussion: Shoot dry weight increased as N rate increased for the 3 azalea species in 1990 and 1991 regardless of fertilizer product applied. Greatest shoot dry weights for ‘Coral Bells’ azalea were produced by the Osmo-cote and Sierrablen treatments during the 1990 growing season (Table 1). Following the 1991 spring flush of growth, Nutricote plants had the greatest shoot dry weights compared to the other fertilizer treatments, while shoot dry weights for Sierra plants were the least.
‘Formosa’ azalea shoot growth was greatest for Sierra plants in 1990 regardless of rate of application. Osmocote, High-N, and Sierrablen plants were similar in size to Sierra plants while Nutricote plants had the smallest shoot dry weights

72
"SNA RESEARCH CONFERENCE - VOL. 36-1991"
when compared to the other fertilizer treatments. Following the 1991 spring flush of growth, there were no differences in shoot dry weights due to fertilizer product for ‘Formosa’ azalea.
Greatest shoot dry weights for ‘Pink Gumpo’ azalea in 1990 occurred for Osmocote and High-N treated plants regard-less of fertilizer rate. As with ‘Formosa’ azaleas following the 1991 spring flush of growth, fertilizer product had no influence on shoot dry weight for ‘Pink Gumpo’ azalea.
Thirty DAT, Nutricote had the greatest medium solution EC level with a mean EC of 0.60 dS/m. The lowest EC levels were observed for Osmocote and Sierrablen with EC levels of 0.24 and 0.21 dS/m, respectively. From 30 to 60 DAT medium solution EC increased for all fertilizer treatments with the exception of Nutricote. Medium solution EC was greatest for the High-N and Sierra products 60 DAT while Nutricote had the lowest EC; a sharp decrease from 30 DAT. Medium solution EC levels increased from 60 to 90 DAT for the Osmocote and Sierra products, while Nutricote, High-N, and Sierrablen all had decreases in EC. Medium solution EC declined for all fertilizer products from 90 through 360 DAT.
As fertilizer rate increased medium solution EC increased on each observation day through the study. Following observations 90 DAT, EC declined for all fertilizer rates. By 150 DAT, mean medium solution EC across all treatments and rates was 0.14 dS/m and continued to decline to 360 DAT.
Significance to Industry: Greatest shoot dry weights for the 3 azalea species occurred with N application rates of 3 lb N/yd3 regardless of fertilizer product applied. ‘Coral Bells’ azalea was the only azalea species to be influenced by fertil-izer product 360 DAT. Greatest shoot dry weights occurred for the Nutricote and Osmocote treated plants. Medium solution EC levels began to drop sharply 90 DAT regardless of fertilizer product or rate of application.
Literature Cited
1. Ingram, D.L. 1981. Characterization of temperature fluctuations and woody plant growth in white poly bags and conventional black containers. HortScience 16:762-763.
2. Wright, R.D. 1987. The Virginia Tech liquid fertilizer system for container-grown nursery plants. College of Agriculture and Life Sciences Information Series 86-5.

"SNA RESEARCH CONFERENCE - VOL. 36-1991"
73
Table 1. Shoot dry weights for 3 azalea species in response to 12 to 14 month slow release fertilizers and rate of application.
Shoot dry weight (g)Treatment 1990 1991 ‘Coral ‘Formosa’ ‘Pink ‘Coral ‘Formosa’ ‘Pink Bells’ Gumpo’ Bells’ Gumpo’
Fertilizer Osmocote 17-7-12 42.6a 70.5ab 36.7ab 48.lab 80.5a 58.2a Sierra 16-6-10 34.6b 72.8a 33.3bc 41.4c 80.8a 52.9a High-N 24-4-7 35.2b 68.lab 36.9a 45.8abc 77.6a 54.9a Sierrablen 17-7-10 38.3ab 68.7ab 34.7abc 44.2bc 78.9a 49.8a Nutricote 16-10-10 36.2b 64.9b 31.5c 50.7a 77.2a 53.3a
Rate (lb N/yd3) 1.5 30.5 54.3 29.9 38.1 60.2 42.5 2.0 36.8 62.3 32.3 43.7 76.3 50.7 2.5 37.4 75.3 37.9 49.5 88.2 58.3 3.0 44.9 84.1 38.3 52.9 91.4 63.8
Significance Fertilizer ** NS ** * NS NS Rate ** ** ** ** ** ** Fertilizer x Rate ** NS NS NS NS NS
One plant/replication harvested on January 4, 1991 and May 6, 1991.Means followed by the same letter are not significantly different by LSD, 5% level. Nonsignificant (NS) or significant at the 5% (*) or 1% (**) level.
74
"SNA RESEARCH CONFERENCE - VOL. 36-1991"
Timing of Osmocote Reapplication on Growth of 'Hel-leri' Holly
Robert D. Wright and Alex X. NiemieraVirginia
Nature of Work: Many container-grown plants are fertilized with controlled release fertilizers (CRF). A disadvantage of CRF is that the duration of nutrient release conducive to optimum growth may be less than claimed by the manufacturer (2, 3). Less than optimum medium levels can result as CRF nutrient release is affected by temperature (1) and irrigation rate (unpublished data). Growers com-monly reapply CRF during the same growing season when media nutrient levels are relatively low to avoid potential growth loss. Yet there are no established threshold medium nutrient values which signal the reapplication of CRF. Media nutrient solution concentrations from containers fertilized with CRF are difficult to interpret due to the lack of data on nutrient sufficiency levels. Thus, a need exists to establish criteria that signal a need for the reapplication of CRF. The objec-tives of this study were 1) to determine when to reapply a CRF, Osmocote (Grace Sierra, Milpitas, Calif.), during the growing season to prevent growth reduction, and 2) to associate the proper timing for reapplication with minimum tissue and medium solution N levels.
llex crenata ‘Helleri’ rooted cuttings were potted in March 1989 with a pine bark/peat/sand (9:1:1 v/v/v) medium in 3 liter (1 gal.) plastic containers. Osmocote 18N-2.6P-7.6K was surface applied at 16 g (0.6 oz.) per container. Beginning in June and every month through September, 8 9 (0.3 oz.) per container of Osmocote was reapplied once to a new group of plants (Table 1). Beginning in April and every month thereafter until October, five plants were harvested and separated into roots and shoots for dry weight and nitrogen (N) analysis. Plants were greenhouse grown until June 1 when they were moved to an outdoor nursery.
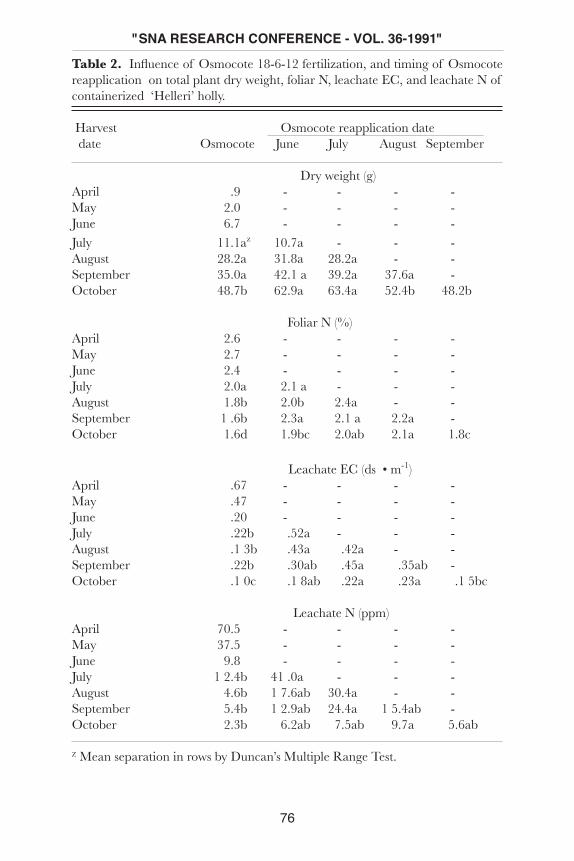
Plants that had received a reapplication of Osmocote in June or July were larger in October than those that received no supplemental fertilizer (Table 2). If reap-plication occurred in August or September, no influence on growth was realized. Plants that were not supplemented had lower percent tissue and medium solution N. These data demonstrate that tissue nutrient analysis as well as the medium nutrient levels extracted with the pour-through procedure can be used to determine when reapplication of a slow-release fertilizer is necessary to promote optimal growth.
Significance to Industry: This work demonstrates that CRF-fertilized plants may require CRF reapplication to maximize growth potential. Medium solution N and electrical conductivity measurements and leaf N concentration may be used to signal the time of reapplication.

"SNA RESEARCH CONFERENCE - VOL. 36-1991"
75
Literature Cited
1. Maynard, D. N. and O. A. Lorenz. 1979. Controlled-release fertilizers for horticultural crops. Hortic. Rev. 1:79-140.
2. Meadows, W. A. and D. L. Fuller. 1983. Nitrogen and potassium release patterns of five formulations of Osmocote fertilizers and two micronutrient mixes for container grown woody ornamentals. S. Nurserym. Assoc. Res. J. 9:28-34.
3. Meadows, W. A., J. H. Collins, and D. L. Fuller. 1983. A comparison of nitro-gen release patterns of five sulfur coated fertilizers in pine bark-sand medium under field conditions for container grown woody ornamentals. S. Nurserym. Assoc. Res. J. 9:22-27.
Table 1. Schedule of Osmocote application and reapplication.
Initial Osmocote reapplication datez
Harvest date application Jun Jul Aug Sep Oct only
April x
May -
June -
July - x
August - - x
September - - - x
October - - - - x
November - - - - - x
z x signifies the initial Osmocote application or reapplication date.
76
"SNA RESEARCH CONFERENCE - VOL. 36-1991"
Table 2. Influence of Osmocote 18-6-12 fertilization, and timing of Osmocote reapplication on total plant dry weight, foliar N, leachate EC, and leachate N of containerized ‘Helleri’ holly.
Harvest Osmocote reapplication date date Osmocote June July August September
Dry weight (g)April .9 - - - -May 2.0 - - - -June 6.7 - - - -July 11.1az 10.7a - - -August 28.2a 31.8a 28.2a - -September 35.0a 42.1 a 39.2a 37.6a -October 48.7b 62.9a 63.4a 52.4b 48.2b
Foliar N (%)April 2.6 - - - -May 2.7 - - - -June 2.4 - - - -July 2.0a 2.1 a - - -August 1.8b 2.0b 2.4a - -September 1 .6b 2.3a 2.1 a 2.2a -October 1.6d 1.9bc 2.0ab 2.1a 1.8c
Leachate EC (ds • m-1)April .67 - - - -May .47 - - - -June .20 - - - -July .22b .52a - - -August .1 3b .43a .42a - -September .22b .30ab .45a .35ab -October .1 0c .1 8ab .22a .23a .1 5bc
Leachate N (ppm)April 70.5 - - - -May 37.5 - - - -June 9.8 - - - -July 1 2.4b 41 .0a - - -August 4.6b 1 7.6ab 30.4a - -September 5.4b 1 2.9ab 24.4a 1 5.4ab -October 2.3b 6.2ab 7.5ab 9.7a 5.6ab
Z Mean separation in rows by Duncan’s Multiple Range Test.
"SNA RESEARCH CONFERENCE - VOL. 36-1991"
77
Efficiency of Nutrient Uptake from Slow-Release Fertil-ization
Dan MilbockerVirginia
Nature of Work: Slow-release fertilizers are heavily used for fertilizing container grown nursery stock yet little information is available on the efficiency of nutri-ent absorption from slow-release fertilizers. The objective of this research was to determine which factors, fertilizer application rate, formulation, plant species or irrigation rate, were significant in determining nutrient absorption efficiency. Plants were grown in 7:1 pine bark and sphagnum peat (v:v) amended at the rates of 1 1/2 lb of Micromax and 5 lb ground limestone per cubic yard. Three species were planted: a fast growing tree, Columbia Planetree, Platanus x acerifolia ‘Columbia’; a conifer, Cryptomeria japonica ‘Elegans’; and an azalea, Rhododendron mucrona-tum ‘Delaware Valley White’. Planetrees were 24 inch and Cryptomeria, 10 inch rooted cuttings. Azaleas were rooted in 2 1/2 inch pots. Fertilizers were applied and mixed in the surface inch of medium at 8, 12 and 16 grams of Osmocote per gallon (1 1/3, 2 and 2 2/3 tsp). Four fertilizers were applied, 18-6-12 Osmocote, 24-4-7 (High N), 18-7-13 (Northern Mix) and 18-8-12 (Southern Mix). Irrigation intervals were tested on azaleas daily, on even days and twice per week. Other plants were irrigated daily. All plants were grown in one gallon (No. 400) containers except Columbia Planetrees which were planted in No. 1000 containers. Each plant was paired with an equally fertilized unplanted container and irrigated with drip tubes. Containers were leached 20% and all leachates were collected and measured for soluble salts. Nutrient absorption was measured as the difference in soluble salts leached from the planted and unplanted containers. Soluble salt content was measured as electrical conductivity. Container pairs were replicated three times and data were analyzed statistically.
Results and Discussion: All plants were healthy and bright green except plants of the longest irrigation frequency which wilted but otherwise indicated good grow-ing conditions. The four fertilizer formulations released similarly and according to the equation Y (% fertilizer released) = 5.34X - 6.1, where x is the time since application in weeks (correlation coefficient = 0.99). The negative coefficient (-6.1) measures the initial delay in nutrient release.
Nutrients were released at the same rate per gram of fertilizer regardless of amount applied per container. Accordingly, the 16 gram applications released at twice the rate of 8 gram applications. The amount of nutrients released to plants was highly rate dependent.
Nutrient absorption was highly dependent on irrigation frequency. Less than daily irrigation reduced nutrient absorption from 50% to 25%. Fertilizer formulations also differed in absorption. Southern Mix and High N were absorbed at lower rates than 18-6-12. Southern Mix released excessively when plants were small and incapable

78
"SNA RESEARCH CONFERENCE - VOL. 36-1991"
of absorbing large amounts of nutrients. High N may have been absorbed as urea which is not measured as a soluble salt by electrical conductivity. Approximately 50% of released nutrients were absorbed regardless of application rate. Planetree absorbed 48%, Cryptomeria, 59% and azalea, 49%.
Significance to industry: According to this research, efficient nutrient ab-sorption depends primarily upon adequate moisture supplied as daily irrigation. The plant species, fertilizer formula and application rate were less important. Since total nutrient absorption was dependent on application rate, high application rates were useful for accumulating nutrients for use during later periods of growth. These results have shown that the nutrient absorption efficiency of slow-release fertilizers under typical nursery conditions is approximately 50%. Under exceptional condi-tions, 100% absorption has been obtained and shows that greater improvement in nutrient absorption efficiency is possible.
Effects of Slow-Release Fertilizers on Nitrate Nitrogen Runoff
Geri Cashion and Tom YeagerFlorida
Nature of Work: Slow-release fertilizers are commonly used in container plant production because of their long-term nutrient release. Adequate nutrient levels must be maintained during crop production while groundwater quality is protected. This research was conducted to examine the levels and duration of nitrate nitrogen in runoff from slow-release fertilizers under nursery production conditions.
Three liners of Vibumum odoratissimum were potted June 21, 1990 with a 2 pine bark: 1 Canadian peat: 1 builders’ sand (v:v:v) medium in each 5 gallon container. The potting medium was amended with dolomitic limestone at 7 Ibs/cubic yard and micronutrients were incorporated separately for each fertilizer treatment. On August 30, 1990, the following complete fertilizers were surface-applied to each container; 1) Escote (a trademarked fertilizer of Vigoro Industries, Inc., Fairview Heights, Illinois), 2) Osmocote (a trademarked fertilizer of Grace-Sierra Chemical Co., Milpitas, California), 3) Prokote (a trademarked fertilizer of O.M. Scott and Sons, Marysville, Ohio), or 4) Nutricote (a trademarked fertilizer of Plantco, Inc., Ontario, Canada). Nutricote granules were pushed just below the media surface. Control containers received no fertilizer. Complete fertilizers and micronutrient amendment rates as per manufacturers recommendations are given in Table 1.
Seven replicate containers per treatment were placed on platforms at Amerson Nursery, Palmetto, Florida. Platforms were constructed of 4 x 8 feet sheets of exterior grade plywood and were lined with double sheets of black polyethylene
"SNA RESEARCH CONFERENCE - VOL. 36-1991"
79
and set upon concrete blocks. The platforms were slanted toward one corner so that runoff could be collected via an opening in the 1 by 2 inch platform rim in a 5 x 5 x 24 inch plastic trough. Plants were watered as needed with Nelson Whiz-head overhead sprinklers (0.4 inch per application). Irrigation water contained 0.2 ppm nitrate nitrogen. Runoff was sampled every two weeks for the initial 4.5 months after fertilizer application and monthly thereafter until March 1 3, 1 991. An aliquot of runoff from each platform was analyzed for nitrate-nitrogen using standard analyses (1). An initial and final average growth index was determined by summing the height and greatest width for each of the three liners per container and dividing by 6 (Table 2).
Results and Discussion: Growth indices indicate that at manufacturers’ suggested rates, the resulting plant growth among the four fertilizer treatments was comparable. Nitrate nitrogen levels in runoff 2 weeks after application was highest for Prokote (33 ppm), followed by Escote (24 ppm), Osmocote (11 ppm) and Nutricote (3 ppm). A second surge of nitrate nitrogen release for the Escote treatment occurred approximately 60 days after application, with 33 ppm nitrate nitrogen measured in runoff. Nitrate nitrogen runoff levels for the Nutricote treatment remained below 5 ppm throughout the study, except for the January 16, 1991 sample, where all treatments exhibited an increase in nitrate nitrogen levels in runoff. Nitrate nitrogen levels on January 16 were 13 ppm for Prokote, 8 ppm for Osmocote, 39 ppm for Escote and 19 ppm for Nutricote. This sample date followed an exceptionally heavy rainfall of 2.5 inches. Nitrate nitrogen levels in runoff were less than 1 ppm for all fertilizer treatments on February 1 3, 1 991, 5.5 months after fertilizer application.
Significance to Industry: These data indicate that runoff may contain nitrate nitrogen levels higher than the 10 ppm federal drinking water standard, even though slow-release fertilizers are used. Runoff nitrate nitrogen levels vary with sampling time and consequently repetitive sampling over a period of time should be used when monitoring runoff. Nitrate nitrogen runoff levels were consistently below 1 ppm for all the fertilizers used in this study, 5.5 months after application. Nursery operators may observe different release rates under altered temperature and moisture conditions.
Literature Cited
1. Hanlon, E., G. Kidder and B. McNeal. 1990. Soil, container media, and water testing; interpretations and IFAS standardized fertilization recommendations. University of Florida Extension Cir. 817.
Florida Agricultural Experiment Stations Journal Series No. N-00424The authors appreciate companies supplying fertilizers. Trade names and compa-nies are mentioned with the understanding that no discrimination is intended nor endorsement implied.

80
"SNA RESEARCH CONFERENCE - VOL. 36-1991"
Table 1. Treatments applled to Viburnum odoratissimum grown in 2 pine bark:1 Ca-nadian peat:1 builders sand (v:v:v) medium in 5 gallon containers.
Complete Fertilizerz Fertilizer Nitrgoen Micronutrient Micronutrients (g/container) (g/container) amendment (g/container)
Prokote Plus 20-3-10, 270 Day 106 21.2 Step 33.6
Osmocote 18-6-12, 270 Day 110 19.8 Micromax 25.2
Escote 19-6-12, 300 Day 150 28.5 Perk 33.6
Nutricote Total 18-6-8, 270 Day 82.5 14.9 Nutritrace 50.4
zComplete fertilizers were surface-applied and growth medium was amended with the respective micronutrient product.
Table 2. Growth Indicesz for Viburnum odoratissimum at the time of fertilization
(August 30, 1990) or 7 months later.
Fertilizer Months after fertlllzer application
0 7
Prokote Plus 20-3-10, 270 Day 24 44
Osmocote 18-6-12, 270 Day 25 46
Escote 19-6-12, 300 Day 22 42
Nutricote Total 18-6-8, 270 Day 25 44
Control 24 24
z Average growth index [(height + width)/6] for each of 3 plants per container (n=21)
"SNA RESEARCH CONFERENCE - VOL. 36-1991"
81
Nitrogen Levels in Irrigation Effluent From Container Nurseries
Donna C. Fare, Charles H. Gilliam, Gary J. Keever,John Olive, and James C. Stephenson
Alabama
Nature of Work: Past container nursery production practices have focused on heavy nitrogen (N) fertilizer application for rapid growth of plant material with little regard to leaching of N through the container media (2,4). Nitrogen is required in large quantities by the plant, but is often the most difficult nutrient to manage in a container production system (3). Currently, nitrate-nitrogen (N03-N) effluent from container media is an environmental concern because of possible contamination of surface and groundwaters. This study was developed to monitor NO3-N levels from irrigation effluent at container nurseries in Alabama.
Seven wholesale container nurseries were monitored during 1989 and 1990 for NO3-N levels in irrigation effluent. Samples were collected during the growing season every 4 weeks in 1989, and every 6 weeks in 1990. Six selected areas were sampled at each nursery: well, holding/irrigation pond (5 nurseries only), container bed effluent, irrigation water, container leachate, and effluent leaving the property. Irrigation ran for 60 minutes, the typical watering duration at most of the nurseries, in a designated growing area at each sampling. Container leachate was collected from twelve plants in the growing area at each sampling date. Plants were placed in plastic containers with water tight styrofoam lids. These containers suspended the plant container to allow leachate to drain and prevented the irrigation water from diluting the container leachate. About midway into the irrigation cycle, ir-rigation water from the irrigation riser was collected. Holding pond water was collected below the surface and on the pond bottom using a grab sample technique (5). Irrigation effluent leaving the property was sampled at the property line. After the 60 minute irrigation application, container bed runoff and container leachate were collected. All samples were collected in Nalgene polyethylene bottles and packed in iced coolers for transporting to the lab. All samples were stored at 40˚ F (4˚ C). Nitrate levels were determined by a continuous flow reduction of nitrate to ammonia with the granular zinc technique (1).
Results and Discussion: NO3-N levels in all wells sampled were below 10 ppm (10 ppm NO3-N is the drinking water standard) regardless of the time of the year sampled. Wells sampled were between 80 and 150 feet deep (24 and 46 m) deep.
All holding/irrigation ponds sampled contained less than 10 ppm NO3-N, regardless of whether fresh well water was routinely pumped into the pond or whether dilu-tion was from rainfall only. Four of the nurseries sampled channeled effluent from the container beds into a holding/irrigation pond, diluted the pond water with fresh well water and reused the water for normal irrigation. One nursery used the pond only for retention of the container bed runoff. NO3-N levels in the holding/
82
"SNA RESEARCH CONFERENCE - VOL. 36-1991"
irrigation ponds were similar to levels in the non-irrigation pond. Another nurs-ery collected container bed effluent in a holding pond and had the capability of irrigating directly from the pond if the need arose, but routinely irrigated directly from a well. Sample results indicate similar N03-N levels from the pond surface and the pond bottom.
Effluent water leaving the nursery (at the property line) generally contained levels less than 10 ppm N03-N. Two exceptions were shortly after a granular fertilizer application or when fertilizer was injected into the irrigation system. Two of the nurseries routinely used liquid fertilization (weekly) as a supplemental component of the fertility program.
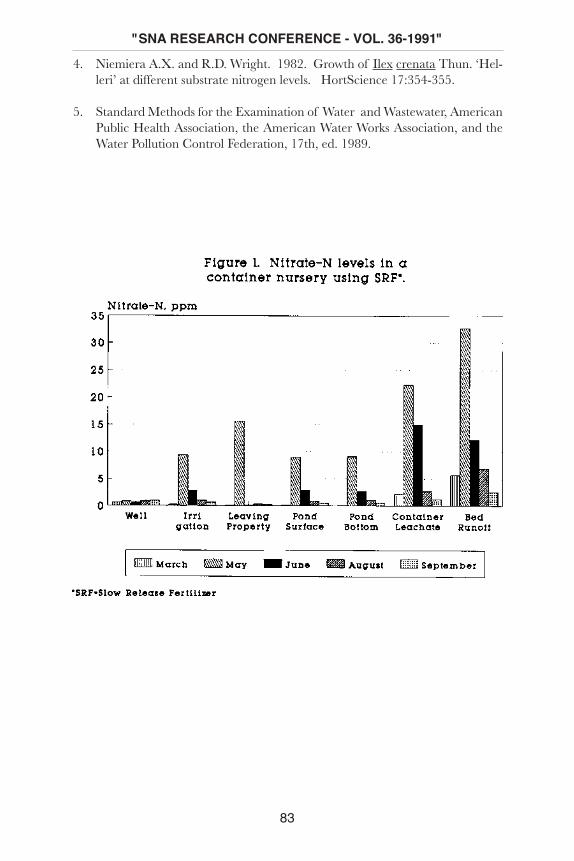
Levels of N03-N in the effluent from the plant containers and the bed runoff were dependent on the fertilizer type and method of application. Use of slow release fertilizers generally resulted in highest N03-N effluent levels soon after application. Levels of N03-N in the container and bed runoff effluent from liquid fertilization were equal to the rate applied or greater depending if slow release (incorporated or topdressed) fertilizer had also been used. Figure 1 shows N03-N levels in the areas sampled of one nursery using a slow release fertilizer.
These selected sites sampled in commercial nurseries in Alabama indicate that N03-N levels in the wells, holding/irrigation ponds, and effluent leaving the property generally meet drinking water standards ( 10 ppm) . The highest N03-N levels were found in container bed effluent when liquid fertilization was used.
Significance to the Industry: With increasing emphasis on water quality, com-mercial nurseries are being targeted as a potential source ground and surface water contamination from excessive use of N fertilizer. Most nurseries sampled used slow release fertilizer which controlled the level of NO3-N released at any one time. As a result NO3-N levels were generally below 10 ppm (standard of drinking water). Injecting liquid fertilizer increased the levels of NO3-N in the container and bed effluents. Grower awareness of ‘best management’ strategies include the use of slow release fertilizers to reduce the NO3-N levels within a commercial container nursery and holding ponds to prevent effluent from leaving the nursery.
Literature Cited
1. Carlson, Robert, M. 1986. Continuous flow reduction of nitrate to ammonia with granular zinc. Analytical Chemistry 58:1590-1591.
2. Gilliam, C.H. and R.D. Wright. 1977. Effects of nitrogen and growth regula-tiors on growth of Japanese holly. J. Amer.Soc. 102:46-48.
3. Green, James L. 1989. Practices to minimize contamination of groundwater and runoff water in greenhouse and nursery production of container-grown plants. Ornamentals Northwest Newsletter 13(3):9.
"SNA RESEARCH CONFERENCE - VOL. 36-1991"
83
4. Niemiera A.X. and R.D. Wright. 1982. Growth of Ilex crenata Thun. ‘Hel-leri’ at different substrate nitrogen levels. HortScience 17:354-355.
5. Standard Methods for the Examination of Water and Wastewater, American Public Health Association, the American Water Works Association, and the Water Pollution Control Federation, 17th, ed. 1989.

84
"SNA RESEARCH CONFERENCE - VOL. 36-1991"
Nitrogen Leaching from Osmocote as Influenced by Irrigation Amount
Alex X. NiemieraVirginia
Nature of Work: Container-grown plants are irrigated with little or no regard to the leaching influence on nutrient loss from media. This is evidenced by the wide range of water application rates used in nurseries (1). The amount of water that leaves a container, leaching fraction (LF), is critical since this fraction is responsible for nutrient loss from media and nutrient runoff. LF is defined as the amount of solution leached divided by the amount applied. Ku and Hershey (2), using liquid fertilization at a range of LF values, found that LF affected leachate and medium electrical conductivity. LF should be an important issue to growers since water use and nutrient runoff regulations are becoming progressively more stringent. Hence, knowledge of how LF influences media nutrient retention and nutrient runoff is necessary to develop conservation strategies. Thus, the purpose of this experiment is to determine how leaching fraction affects medium N concentration and N leached using a controlled release fertilizer.
Pine bark (50 g - 1.8 oz.) filled PVC tubes fertilized with 0.5 g (0.018 oz.) 14-14-14 Osmocote were drip irrigated every three days with an amount of water equal to the amount lost from evaporation (E), E + 0.1E, or E + 0.2E. Gravimetric water content of bark at irrigations was approximately 80%. Leachate from tubes was collected. Medium solution N content (pour-through method) was measured on days 15, 36, and 59. Tubes were stored in a growth chamber at 21 C.
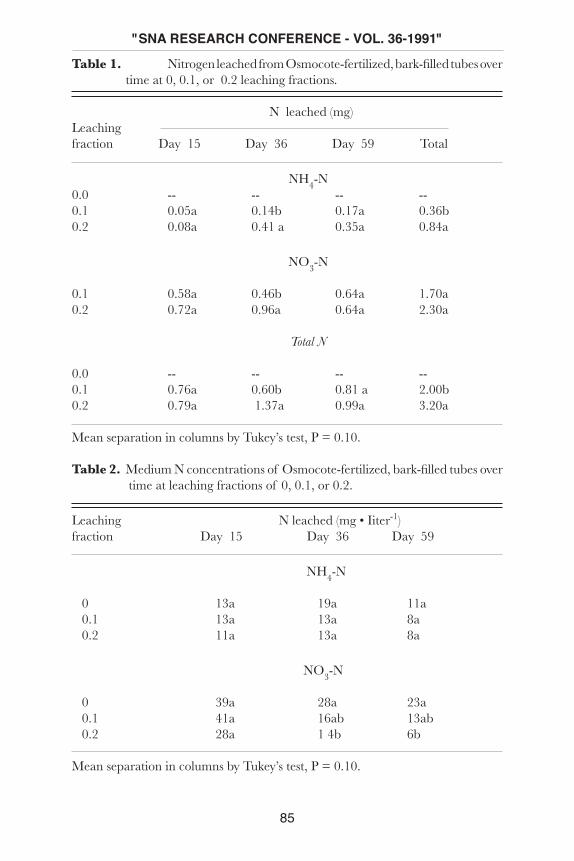
Results and Discussion: Forty-five percent more N was leached at the E + 0.2E than E + 0.1E (Table 1). In most cases, very little leachate or no leachate was collected from the E treatment. Medium NH4-N concentrations were not different for the irrigation treatments; however, NO3-N concentrations were higher in the E treatment than at E + 0.2 on days 36 and 59 (Table 2).
Significance to Industry: This work demonstrates that irrigating CRF-fer-tilized plants at rates that result in leaching reduces medium N concentration and increases N runoff. More work is needed to determine minimum leaching fractions for CRF-fertilized plants.
Literature Cited1. Fare, D.C., C.H. Gilliam, and G. J. Keever. 1990. Irrigation monitoring at
container nurseries. Proc. SNA Res. Conf. 35:57-58.
2. Ku, C. S. M. and D. R. Hershey. 1989. Growth of ‘V-14 Glory’ Poinsettia (Euphorbia Pulcherrima) with leaching fractions of 0, 0.1, and 0.4. ASHS 1989 Annu. Mtg. Tulsa, Okla., Prog. & Abstr. p. 75.
"SNA RESEARCH CONFERENCE - VOL. 36-1991"
85
Table 1. Nitrogen leached from Osmocote-fertilized, bark-filled tubes over time at 0, 0.1, or 0.2 leaching fractions.
N leached (mg)Leachingfraction Day 15 Day 36 Day 59 Total
NH4-N0.0 -- -- -- --0.1 0.05a 0.14b 0.17a 0.36b0.2 0.08a 0.41 a 0.35a 0.84a
NO3-N
0.1 0.58a 0.46b 0.64a 1.70a0.2 0.72a 0.96a 0.64a 2.30a
Total N
0.0 -- -- -- --0.1 0.76a 0.60b 0.81 a 2.00b0.2 0.79a 1.37a 0.99a 3.20a
Mean separation in columns by Tukey’s test, P = 0.10.
Table 2. Medium N concentrations of Osmocote-fertilized, bark-filled tubes over time at leaching fractions of 0, 0.1, or 0.2.
Leaching N leached (mg • Iiter-1)fraction Day 15 Day 36 Day 59
NH4-N
0 13a 19a 11a 0.1 13a 13a 8a 0.2 11a 13a 8a
NO3-N
0 39a 28a 23a 0.1 41a 16ab 13ab 0.2 28a 1 4b 6b
Mean separation in columns by Tukey’s test, P = 0.10.

86
"SNA RESEARCH CONFERENCE - VOL. 36-1991"
Nutrient Run-off from Overhead Irrigated Containers
Dan MilbockerVirginia
Nature of Work: Fertilization of container grown nursery stock, particularly at high rates, results in nutrient loss. The purpose of this research was to measure run-off and its nutrient content. Two circular areas were divided into quadrants so that run-off could be collected from each quadrant. A sprinkler was positioned at the center and supplied by its own tank and pump. One quadrant measured the total amount of irrigation and the other three quadrants were covered by plants in containers of different sizes, fertilization rates or spacings. Soluble fertilizer rates, when applied, were applied to the entire area in a sequence. Each trial was replicated at 3 different times for statistical analysis.
Results and Discussion: Until the container became saturated, the amount of run-off was proportional to the area uncovered by containers. For container-to-container configurations in a square pattern, the area uncovered by containers is 21.5% regardless of container size. When containers of a size are mismatched in a hexagonal pattern, the uncovered area is reduced to 15.5%. Run-off water from unspaced containers (21.5% uncovered) was measured to exceed 21.5% of the water applied by only 12%. This excess may be due to some channeling of water through the growing medium within the container. After saturation, leaching approached the rate of application. Run-off was measured to be 82 to 84% of the application rate. Even when leaching had begun, some of the water continued to be held, possibly by incompletely saturated areas within the container.
Spacing of containers greatly increased run-off because larger percentages of the area were uncovered by containers. The percentage of uncovered area can be determined from Fig. 1.
Increases in container sizes increased the depth of the growing medium which required more irrigation before saturation and leaching began. The same satu-rated and semi-saturated zones exist in the bottom 4 inches of either small or large containers and most of the water is retained in these zones. The growing medium above these saturated zones temporarily held large amounts of water but over the following two hours, drained to field capacity, a more or less stable moisture level of approximately 25% which is very suitable for plant growth. Large containers have larger zones of this type than smaller containers and require more irrigation before leaching begins. Very large containers with depths greater than 12 inches have an additional zone. When filled with growing media adequately porous for use in containers, any growing medium above approximately 12 inches retains less water than field capacity and serves, mostly, to delay leaching. Delayed drainage encourages longer irrigation which can easily cancel any reduction in run-off from greater depths of container media.
Losses of nutrients from slow-release fertilizers were always a small fraction of the amount applied. Sixty days after application of 8 to 16 grams (1 1/3 to 2 2/3 tsp) of 18-6-12 Osmocote, run-off after saturation of the container was less than 0.1

"SNA RESEARCH CONFERENCE - VOL. 36-1991"
87
millimho (less than 70 ppm). For soluble fertilization in the range of 50 to 250 ppm nitrogen, the soluble salt content of runoff water was 19% higher than the fertilizer laden irrigation water. Evaporation and possibly transpiration had a concentrating effect on the soluble salts in the run-off water.
Significance to Industry: Irrigation run-off is dynamic. It is reduced by short irrigation intervals, large containers, close spacing, evaporation and transpiration. Nutrients in run-off are increased by heavy application rates, especially of soluble fertilizers. This report supports the practice of using slow-release fertilizers for reducing nutrient run-off. Figure 1 is provided so that nurserymen can calculate the expected run-off from using different container sizes at different spacings.
Fig. 1. The percent uncovered area around containers ranging from 6 to 48 inches in diameter when spaced 0 to 14 inches apart.
88
"SNA RESEARCH CONFERENCE - VOL. 36-1991"
Overhead Irrigation: How Much Water Reaches the Medium Surface?
Richard Beeson and Gary KnoxFlorida
Nature of Work: Overhead irrigation is the most practical and the most com-monly used irrigation system for container production of woody ornamentals. The irrigation application efficiency (amount of water retained in the container available to the plant/total water applied) of overhead irrigation is, at best, near 80% and drops rapidly with increased spacing between pots (1). Weatherspoon and Harrell (2) reported that irrigation application efficiencies of impact sprinklers averaged 26% over the course of a year, and were reduced to 13% using a spin-ner-type sprinkler.
Our objective was to determine the factors that result in these low application ef-ficiencies for overhead irrigation. The results are discussed on the basis of sprin-kler type as a function of container spacing, pot size, and canopy characteristics. Rhododendron x ‘Duc du Rohan’, R. x ‘George L. Taber’, and Pittosporum tobira ‘Laura Lee’ were selected for the experiment due to varying canopy densities and leaf curvature, and availability in 1-, 2-, and 3-gal containers. Ten marketable size plants of each species x container size were used to determine the % water cap-tured (amount of water reaching the media surface as a percent of the maximum potential water captured) for plants arranged pot-to-pot or spaced 3 inches apart. The media surface of each plant was sealed with a sheet of polyethylene split to go around the stem. The polyethylene was sealed against the stem with grafting strips and against the outside of the container using a large rubber band. The split was sealed against water loss with a strip of silver duct tape. To further reduce the possibility of water loss, a 0.5 x 2 x 4 in natural sponge was placed in each container and notched to fit around the stem.
The experiment was performed in a commercial nursery using impact sprinklers (Model 3023-1-3/4" M, #8 nozzle, 0.125 in. orifice, Senninger Irrigation, Orlando, FL) and wobbler sprinklers (Wobbler®, #8 nozzle, 0.125 in. orifice, Senninger Ir-rigation, Orlando, FL). Irrigation lines were 25 ft apart with risers extending 4 ft above the ground in a staggered pattern. Three sampling cups were placed around each species x size plot to measure irrigation precipitation.
Ten plants of each species x size category were randomly arranged in the interior of each of 9 areas chosen for their uniform water distribution. Containers were placed at right-angles to each other either pot-to-pot or spaced 3 in apart. Plants were irrigated for about 1 hr at 25 psi and allowed to drip dry for 15 min. The sponges and excess water collected on the polyethylene were removed and placed in zip-lock bags. This process was repeated for each combination of sprinkler type and plant spacing.

"SNA RESEARCH CONFERENCE - VOL. 36-1991"
89
Plant parameters measured were surface area within the canopy perimeter, leaf area within the cylinder bounded by the container rim, and total leaf area of the canopy. From these parameters, 3 measures of canopy density were also computed: PLAI - container leaf area/surface area of the container; TLAI -total leaf area/top canopy surface area; and Compress LAI - total leaf area/surface area of the con-tainer). The volume of water for each plant was calculated as: (weight of the bag + sponge after irrigation + excess water) - (weight of the bag + oven-dry sponge). The % water captured (% captured) for each plant was calculated as: (volume of water captured per 15.5 in2 of container medium surface area)/(average water captured in the sampling cups per 15.5 in2 maximum surface area) for each sprin-kler x container spacing irrigation.
Results and Discussion: When containers were pot-to-pot, the use of wobbler sprinklers resulted in greater % captured than impact sprinklers (51 vs. 44%). How-ever, there were no differences between sprinkler types when containers were spaced (56% captured). Differences between the two sprinkler types may have resulted from differences in droplet size, trajectory angles, and droplet velocity. Averaged over sprinkler types, pot-to-pot spacing resulted in significantly less % captured (48) than separated spacing (56). Pot-to-pot spacing increased canopy density, thereby increasing the ability of the canopies to hold or deflect droplets.
The interaction between species and container size was also significant (Table 1). Percent captured ranged from 70% for ‘Laura Lee’ in 1-gal containers to 30% for ‘Laura Lee’ in 3-gal containers. In general, the 1- and 2-gal containers had higher % captured than the 3-gal containers due to proportionally larger canopies in the 3-gal containers. Leaf curvature (concave vs convex) was different between the two Rhododendron cultivars but was not a significant factor in the % captured.
Percentage water captured was analyzed by linear regression as a function of container leaf area, total leaf area, container surface area, top canopy surface area, PLAI, TLAI and Compress LAI. The most satisfactory models predicting % captured were obtained when the data were separated by spacing. For pots 3 in apart, % captured was inversely related to the leaf area contained within the cylinder bounded by the container rim. Percent captured was inversely related to total plant leaf area at a pot-to-pot spacing.
The previous calculations do not take into account the irrigation lost by falling between containers. As the containers are spaced farther apart, the percentage of bed surface covered by the containers diminishes rapidly ( 1 ). Thus, to deter-mine the actual irrigation application efficiency at a given spacing, the % captured above must be multiplied by the percentage of bed surface area covered by the containers. For example, the actual irrigation application efficiency for ‘George L. Taber’ azaleas grown in 2-gal containers at a 3 in spacing, was only 28% [(0.629 % captured * 0.441 bed area covered) * 100]. The same spacing for the 3-gal ‘Laura Lee’ calculates to only a 15% irrigation application efficiency.
"SNA RESEARCH CONFERENCE - VOL. 36-1991"
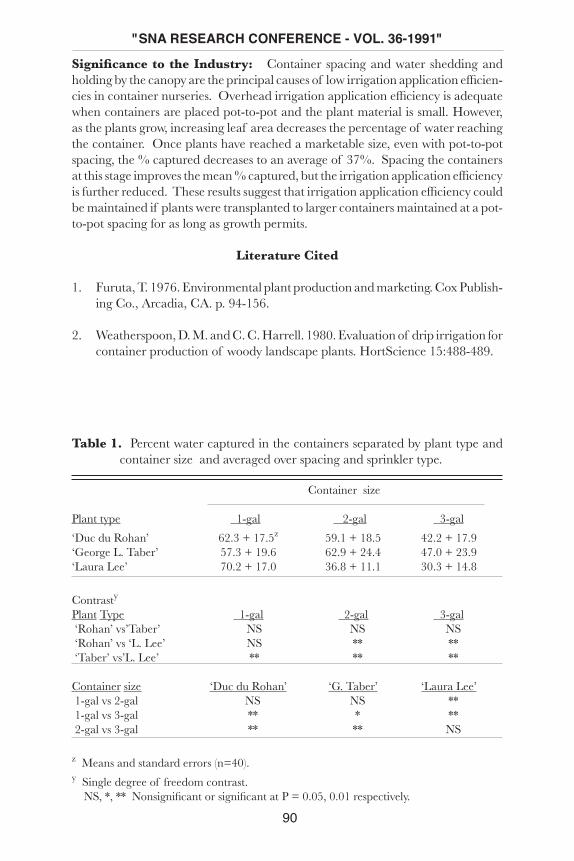
Significance to the Industry: Container spacing and water shedding and holding by the canopy are the principal causes of low irrigation application efficien-cies in container nurseries. Overhead irrigation application efficiency is adequate when containers are placed pot-to-pot and the plant material is small. However, as the plants grow, increasing leaf area decreases the percentage of water reaching the container. Once plants have reached a marketable size, even with pot-to-pot spacing, the % captured decreases to an average of 37%. Spacing the containers at this stage improves the mean % captured, but the irrigation application efficiency is further reduced. These results suggest that irrigation application efficiency could be maintained if plants were transplanted to larger containers maintained at a pot-to-pot spacing for as long as growth permits.
Literature Cited
1. Furuta, T. 1976. Environmental plant production and marketing. Cox Publish-ing Co., Arcadia, CA. p. 94-156.
2. Weatherspoon, D. M. and C. C. Harrell. 1980. Evaluation of drip irrigation for container production of woody landscape plants. HortScience 15:488-489.
Table 1. Percent water captured in the containers separated by plant type and container size and averaged over spacing and sprinkler type.
Container size
Plant type 1-gal 2-gal 3-gal
‘Duc du Rohan’ 62.3 + 17.5z 59.1 + 18.5 42.2 + 17.9‘George L. Taber’ 57.3 + 19.6 62.9 + 24.4 47.0 + 23.9‘Laura Lee’ 70.2 + 17.0 36.8 + 11.1 30.3 + 14.8
Contrasty
Plant Type 1-gal 2-gal 3-gal ‘Rohan’ vs’Taber’ NS NS NS ‘Rohan’ vs ‘L. Lee’ NS ** ** ‘Taber’ vs’L. Lee’ ** ** **
Container size ‘Duc du Rohan’ ‘G. Taber’ ‘Laura Lee’ 1-gal vs 2-gal NS NS ** 1-gal vs 3-gal ** * ** 2-gal vs 3-gal ** ** NS
z Means and standard errors (n=40).y Single degree of freedom contrast. NS, *, ** Nonsignificant or significant at P = 0.05, 0.01 respectively.
90

"SNA RESEARCH CONFERENCE - VOL. 36-1991"
91
Overhead Irrigation of Containers at Dawn Restricts Plant Growth Compared to Maintaining Field Capacity
Richard C. Beeson, Jr. Florida
Nature of Work: Container-grown landscape ornamentals are usually irrigated with overhead sprinklers. Yet, overhead irrigation is very inefficient, especially for larger plants (Weatherspoon and Harrell, 1980; Beeson & Knox, 1991). Daylight irrigation is most convenient, but also when evaporation is the highest. In Florida, drought conditions and increased demand on water reserves has led to a ban on overhead irrigation from 1000 to 1600 hr. Anticipating more severe restrictions, it was questioned how overhead irrigation limited to night and early morning hours would effect plant growth and diurnal water stress compared to optimum water availablity.
Fifty plants each of Elaeagnus pungens, Ligustrum laponicum, and Rhododendron spp. ‘Fashion’ (azalea) grown in pine bark-peat-sand mixtures in 3-gal containers were obtained during their last production season in June 1990. Plants were divided between: 1) daily dawn overhead irrigation by impact sprinkler or 2) drip irrigation from 6-inch Dramm rings. Overhead irrigation supplied about 11 ounces of water per container per day (= 0.25 inches per day, average nursery rate) while drip irrigation supplied about 45 ounces/time; 3 or 4 times a day, starting near dawn. Drip irrigation was supplied in excess to maintain the container media near field capacity.
Diurnal water stress (water potential, Ψt) was measured weekly on 4 different plants of each species per treatment, from mid-June until late November 1990 with a pressure chamber. Measurements started around 0800 hr and occurred at 2 hr intervals until 1630 hr each day. Daily accumulated water stress (Sy) was calculated as the area over the diurnal Ψt curves extrapolated to -1.5 bars at sunset. Relationships of stomatal conductance to Ψt were determined during the drying of 4 well-watered plants of each species to wilting . Stomatal conductance was measured for each plant with a steady-state porometer with Ψt determined thereafter on the twig containing the measured leaf.
In December 1990, shoot height was measured for each plant. Growth indexes were calculated from perpendicular measurements of canopy width, where: Growth Index = [(width 1 x width 2) x (height/2)] / 106 cm3. Canopy dry weights were measured for 5 plants from each species and treatment.
Results and Discussion: For all species, maintaining the media at field capacity (drip irrigation) resulted in increased height compared to those irrigated overhead; ranging from 7% (azaleas) to 15% (ligustrum). Growth indexes of drip irrigated azaleas (65%) and elaeagnus (30%) were also significantly (a = 0.05)
92
"SNA RESEARCH CONFERENCE - VOL. 36-1991"
larger than overhead irrigated plants. Total canopy dry weight was greater for drip irrigated ligustrum and elaeagnus.
Significant differences in Sy between treatments depended on the week of measurement. Generally, plants receiving drip irrigation had lower Sy than those watered overhead. Differences in Sy for azaleas were significant from mid-August through mid-October, but not thereafter. Marked declines in Sy for azaleas and ligustrum accompanied shorter day lengths and lower daytime temperature in early October (week 18). Significant differences in Sy for ligustrum occurred only during weeks 1 through 5, though through mid-September (week 15) drip-irrigated plants accumulated less stress. Drip irrigated elaeagnus almost always were less stressed than overhead irrigated plants. These differences continued into the late fall (mid-November). Sy for elaeagnus decreased little over the experiment, showing little dependence on seasonal temperature or day length.
Most of the differences in Sy between treatments occurred in mid- to late afternoon. Few differences in Ψt occurred between treatments through mid-day. However by 1400 hr, more water stress was usually measured for overhead irrigated plants. Differences became more pronounced by 1600 hr. Despite declines in Ψt of overhead irrigated plants during the afternoon, seldom did Ψt decline to the threshold for stomatal closure.
Small reductions in Sy were associated with significant increases in the growth parameters measured. Slower growth of overhead irrigated plants was not associated with stomata closure, thus does not appear to be due to reduced photosynthesis. For azaleas, an 11% reduction in the mean Sy resulted in a 65% increase in the growth index. Drip irrigation of elaeagnus reduced the mean Sr by 18%, resulting in an increase in the growth index (30%) and total dry weight (21%). Reductions of 10% in the mean Sy of ligustrum resulted in a 33% increase plant dry weight.
Significance to the Industry: If overhead irrigation is limited to nighttime or near dawn, long-term growth will be significantly slower compared to plants irrigated frequently during the day, due to differences in afternoon water stress. Similar growth increases were found with Euonymus laponica (Newman and Follett, 1988) and ‘Hershey’s Red’ azaleas (Keever and Cobb, 1985) irrigated twice, compared to once daily. Where plants are irrigated by drip systems, frequencies of twice or more per day should produce greater growth than once per day.

"SNA RESEARCH CONFERENCE - VOL. 36-1991"
93
Effects of Container Size and Sub-irrigation on Growth of Two Tree Species
Ken Tilt, Ronald Shumack and John OliveAlabama
Nature of Work: Overhead irrigation of a container nursery requires about 20 to 40 thousand gallons of water per acre each day. Seventy to eighty percent of this water falls between or passes through the containers and runs off the nursery.
There is strong movement and concern for conserving natural resources, especially in the area of water quality. Chemical runoff from pesticides and fertilizers and possible contamination of ground water reserves is of special concern to all agriculture.
Some nurseries have already implemented conservation measures to address these concerns. One method has been to channel runoff to holding ponds where it is filtered and recycled. Another production technique is to use drip irrigation where each container has its’ own water source. This prevents the tremendous loss of water falling between the pots. However, this method is only economically feasible in larger containers. There is still runoff in this system.
This research was designed to evaluate the effects on growth of Quercus virqiniana and Quercus shumardii as a result of catching the leachate or water passing through the container and holding it in reserve in a 1.5 inch saucer. Another feature of the project was to determine whether a constant water level maintained
Literature Cited
1. Beeson, Jr., R. C. and G. W. Knox. 1991. Factors affecting the efficiency of overhead irrigation in container production. HortScience. (In press).
2. Keever, G. J. and G. S. Cobb. 1985. Irrigation scheduling effects on container media and canopy temperatures and growth of ‘Hershey’s Red’ Azalea. HortScience. 20:921-923.
3. Newman, S. E. and M. W. Follett. 1988. Irrigation frequency and shading influences on water relations and growth of container-grown Euonymus japonica ‘Aureo-marginata’. J. Environ. Hort. 6:96-100.
4. Weatherspoon, D. M. and C. C. Harrell. 1980. Evaluation of drip irrigation for container production of woody landscape plants. HortScience. 15:488-489.

94
"SNA RESEARCH CONFERENCE - VOL. 36-1991"
in the saucer beneath the containers would be detrimental to or enhance growth over allowing the saucer to dry out between irrigations. The experiment also utilized 15 gallon and 30 gallon containers to determine the size of containers needed to facilitate optimum growth of the two trees. (Table 1)
Ten trees of each species were selected for each container size and each of the three irrigation treatments. The trees were planted January 18, 1988. All plants received the same cultural care throughout the experiment, except for the irrigation treatments. The height and caliper of each tree was measured on October 10, 1989.
Results and Discussion: Live oaks exhibited increased caliper and height by both versions of catching and holding leachate from the containers compared to growth measurements of the control drip irrigation treatment, (Table 2). There were no differences in growth detected for Shumard oak resulting from the irrigation treatments.
There was a clear growth benefit for growing the trees in thirty gallon containers over fifteen gallon containers for the 2 year production period in this experiment. There was a 0.8 and 1.6 feet increase in height using the larger container for live oak and Shumard oak, respectively, (Table 3).
As a result of this project a more extensive research program has been installed at Mobile Ornamental Experiment Station looking at and refining other subirrigation techniques and incorporating new container designs.
Significance to the Nursery Industry: This study represents some positive implications for further research in the continuing efforts toward increasing or maintaining production efficiency while increasing the committment toward conservation and preservation of our natural resourses.
Table 1. Treatments
SPECIES IRRIGATION CONTAINER SIZE
Quercus shumardii Subirriqation-wetl 15 qallon
Quercus virqiniana Subirriqation-dry2 30 qallon
Traditional drip
1 1.5 inch saucer was maintained filled with water at all times2 1.5 inch saucer was filled with water as it dried out

"SNA RESEARCH CONFERENCE - VOL. 36-1991"
95
Table 2. Effects of Subirrigation on Growth of Two Tree Species
Live Oak Shumard Oak
Irrigation Height Caliper Height Caliper Treatments (ft) (in) (ft) (in)
Control 5.la3 1.4a 5.5a l.0a
1Dry 7.2b 1.9b 6.la l.0a
2Wet 6.7b 1.9b 5.4a l.0a
1 1.5 inch saucer was filled with water after it dried out2 1.5 inch saucer was maintained filled with water at all times3 Means within rows separted by Duncan’s Multiple Range Test at P=0.05. Means with same letter are not significantly different
Table 3. Effects of Container Size on Growth of Two Tree Species
LIVE Oak SHUMARD Oak
Container Height Caliper Height CaliperTreatments (Ft) (In) (Ft) (In)
15 Gallon 5.8a1 1.5a 5.0a 1.1a
30 Gallon 6.6b 1.9b 6.6b 1.0a
1 Means within rows separted by Duncan’s Multiple Range Test at P=0.05. Means with same letter are not significantly different
96
"SNA RESEARCH CONFERENCE - VOL. 36-1991"
Water Relations of Selected Container GrownLandscape Plants Under Drought Conditions
Fred T. Davies, Jr., Jayne M. Zajicek and Sharon A. DurayTexas
Nature of Work: The nursery industry produces hundreds of containerized spe-cies that are diverse in their irrigation requirements. Few guidelines are available in determining irrigation schedules, and subsequently irrigation is often based upon empirical observation. Information on consumptive water use of container-grown woody ornamental species is also limited (1). To date, little research has been con-ducted on water usage and water relations of low-maintenance, drought resistant landscape plants (2). A question to be answered is how does drought resistance of native plants compare with nonnative species? The objective of this research was to determine water relations and consumptive water usage of selected native and nonnative landscape species under drought stress conditions.
Materials and Methods: Eight species of woody ornamental plants (Salvia gregii. Anisacanthus wrightii, Elaeagnus punaens, Ligustrum japonicum, Magnolia gran-diflora, Hedera helix, Leucophyllum frutescens ‘Green Cloud’ and Euonymous kiautschovica ‘Manhattan’) were planted in 3.8 liter containers containing 4 com-posted pine bark:1 sand (v:v) amended with 3.7 kg/m3 (6.3 #/yd3) 18N-6P-12K, 3 kg/m3 (5.1 #/yd3) gypsum and dolomitic limestone and 74.2 g/m3 (2 oz/yd3) fritted trace elements. Plants were established for at least 12 weeks prior to the start of the experiment. The study was conducted indoors under high intensity florescent lights with a maximum photosynthetically active radiation of 700 µmol m-2s-1 at plant height with minimum/maximum temperatures of 21C (70F)/29C(84F) and 25-68% relative humidity. The study was conducted using 1 species per experi-mental drought cycle and was initiated with Salvia gregii on August 9, 1988 and terminated on January 10, 1989 with Elaeagnus pungens.
Prior to the initiation of a drought cycle, plants were fully hydrated and containers were covered with polyethylene bags which were secured around the plant crown to prevent moisture loss from the medium surface. Leaf water potential (Ψ leaf) was measured with a Scholander-type pressure chamber at 0800 hr each morning. Measurements were taken on 5 plants/species with 2 subsamples/plant (n=10). Leaf diffusive resistance (DR) was determined with a LiCor 1600 steady state porometer using 5 plants/species with 2 subsamples/plant (n=10). The total water transpired per plant was determined through gravimetric means with 10 plants/species, which were weighed daily at 0800 hr. From this data and leaf areas measured at harvest, water flux on a whole plant transpirational basis (E) was determined.
A drought cycle for a given species was terminated and plants harvested when predawn Ψ leaf did not recover from the previous afternoon measurements (which was 3-11 days after experiment initiation, depending on species). Upon completion
"SNA RESEARCH CONFERENCE - VOL. 36-1991"
97
of the study, plants used for gravemetric measurements (n=10) were harvested and leaf area, leaf number, shoot and root dry weight, leaf area ratio (LAR) and root:shoot ratios were determined.
Results and Discussions: Total Water Transpired (TWT) - On the first day of the drought cycle, Salvia and Leucophyllum had the greatest loss of water per plant, while English ivy and Magnolia had the lowest TWT. By day-3, Salvia had become desiccated and had the lowest TWT. By day-5, Salvia, Anisacanthus and Leucophyllum were terminated due to desiccation; for the duration of the cycle, English ivy maintained the highest TWT. By day-9, TWT could only be recorded for English ivy and Magnolia since the other species had been terminated due to desiccation. At the termination of the drought cycle, greatest overall TWT occurred with Magnolia and Ligustrum, and lowest overall TWT with Anisacanthus.
Whole Plant Transpiration (E) - On day-1, Salvia and Anisacanthus had the highest E (which represents the flux of water loss per leaf evaporative surface over time), while Magnolia had the lowest E. By day-3, Salvia and Leucophyllum had the lowest E due to desiccation, while Anisacanthus and English ivy had the highest E; for the remainder of the cycle, English ivy maintained the highest E and by day-9, it was the only remaining species along with Magnolia. At the termination of the drought cycle greatest overall E occurred with Anisacanthus and Salvia (but they desiccated quickly and had to be terminated after day-3), while Magnolia had the lowest overall E.
Leaf Diffusive Resistance (DR) - Leaf DR was initially greatest with Magnolia (which corresponded with low E and high Ψ leaf and lowest in Salvia and Elaeagnus. By day-3, DR was greatest in the desiccated Leucophyllum and Anisacanthus. By day-7, Euonymous, Magnolia and English ivy had the highest DR, while Ligustrum had the lowest DR; by day-9, Ligustrum had been terminated due to desiccation.
Leaf Water Potential (Ψ leaf) - On day-1, Magnolia had the highest (least negative) leaf. By day-3, Magnolia, English ivy and Elaeagnus had the highest × leaf, while Salvia (× leaf = -2.2 MPa), Leucophyllum and Anisacanthus had low Ψ leaf. Mag-nolia and English ivy continued to have the highest Ψ leaf throughout the cycle, while by day-5, Anisacanthus and Elaeagnus had low Ψ leaf. By day-7, Salvia, Anisacanthus and Leucophyllum (all native landscape plants of the southwest U.S. and northern Mexico) had been terminated due to desiccation, while Elaeagnus and Ligustrum had the lowest leaf of the remaining species.
Plant Growth and Development - Magnolia had the greatest leaf area, leaf weight, root & shoot weight and root/shoot ratio, while English ivy had the lowest growth parameters. Yet these two species were among the most drought resistant. Salvia, Leucophyllum and Anisacanthus had large to intermediate leaf evaporative surfaces and intermediate to small root systems; these three native species were among the most drought susceptible plants. There was no consistent pattern of root/shoot ratio and LAR influencing water relations of the species tested.

98
"SNA RESEARCH CONFERENCE - VOL. 36-1991"
Significance to Industry: Native landscape species are not necessarily more drought resistant than imported “exotic” species. Salvia, Leucophyllum and Anisacan-thus are native to the southwestern U.S., yet they rapidly became drought stressed in a containerized system. Salvia and Anisacanthus had the initial highest whole plant transpiration (E) indicating little stomatal control to reduce water loss.
English ivy and Magnolia were the two most drought resistant species. Magnolia had the greatest leaf evaporative surface, root and shoot dry weight, while English ivy had the lowest of these growth parameters. Apparently the relationship of biomass and drought resistance were not always consistent among the species tested. What is apparent is that despite the greater evaporative surface and biomass of Magnolia, it controlled loss of water by greater leaf diffusive resistance and sub-sequent initially low E levels. The strategy of English ivy was a low evaporative surface and biomass to avoid desiccation. Both these species have waxy leaves that can also reduce desiccation loss.
Literature Cited
1. Davies, F.T. Jr., J.M. Zajicek and S.A. Duray. 1990. Water relations and con-sumptive water usage of selected container grown landscape plants. Procd. South. Nurseryman Assoc. Res. Conf. 35:130-132.
2. Henderson, J.C. and F.T. Davies, Jr. 1990. Drought acclimation and the mor-phology of mycorrhhizal Rosa hybrida L. cv. ‘Ferdy’ is independent of leaf elemental content. New Phytol. 115:503-510.
"SNA RESEARCH CONFERENCE - VOL. 36-1991"
99
Development of a Growth Curve Model for Root Regen-eration
of Chemically Root Pruned Viburnum
Phillip C. Flanagan and W.T. WitteTennessee
Nature of Work: The use of copper compounds for chemical root pruning of container grown plants has had varying degrees of success. While excess copper is toxic to plants it is important to remember that tolerance to copper and other heavy metals varies within and among species (3). The lack of mechanical stability of plug grown pine seedlings led Burdett (1,2) to chemical root pruning research on container grown Pinus contorta Dougl. (lodgepole pine). Inside surfaces of styroblock containers were painted with a copper carbonate and latex paint mixture. Treated container walls effectively inhibited elongation of lateral roots and eliminated the tendency for roots to grow downward and circle. When treated seedlings were planted in the field, root regeneration occurred rapidly and root system conformation was comparable to seedlings of naturally established trees.
Researchers must be aware of root growth and physiology factors in woody or-namental plants including but not limited to: root distribution, root pruning, root regeneration, and various types of container production systems. This research project was set up to evaluate the effects of cupric hydroxide (CH) used in conjunc-tion with latex paint (LP) as a carrier for the copper as a chemical root pruning agent and its subsequent effects on root regeneration of Viburnum tomentosum plicatum ‘Mariesii’. A randomized complete block design was used with 6 treat-ments and 5 replications.
On March 29, 1990, 120 dormant rooted cuttings were selected for uniformity. Roots and shoots were pruned to 3 inches and plants placed in cold storage at 4° C (37° F). On March 30, 1990, technical grade CH was mixed with LP to yield CH concentrations of 0, 47, 90, 185 and 260 g/l LP. Each treatment was painted onto interior walls of 3 gallon black plastic containers and allowed to air dry. A control treatment with 0 paint and 0 CH was included. Dormant rooted cuttings were planted on March 31, 1990 in a ground pine bark medium amended with 3Ihlb dolomitic limestone, 21b treble superphosphate, 21b 10-10-10 granular fertilizer, 2.25 lb gypsum and 1.5 lb Micromax per cubic yard. Plants were placed under 30% shade for 10 days prior to moving them into full sun. Osmocote 18-6-12 was top dressed at the rate of 12g per container 2 weeks after planting. Plants were liquid fertilized at 14 to 21 day intervals with Peter’s 20-20-20 at the rate of 200ppm N. Watering was supplied by drip irrigation.
On September 18, 1990, plants were placed in growth trays constructed of plexi-glass to monitor root regeneration over a 32 day period. Aluminum foil was used to cover the sides of growth trays to prevent light from reaching roots. Ten roots
100
"SNA RESEARCH CONFERENCE - VOL. 36-1991"
from each plant (300 total) were selected and their initial root tip position marked on the plexiglass. At 2 day intervals, aluminum foil was removed and root growth recorded (in millimeters).
Results and Discussion: After 32 days, plants grown in the 90 g/l CH treat-ment reached the same level of root growth as control plants. Based on individual root measurements a statistical growth curve was modeled for root regeneration of each CH treatment (Figure 1) utilizing 3 parameters: 1) slope (B,) representing linear growth rate, 2) change from linear growth to an exponential growth pattern (X,) and 3) an asymptotic curve (A).
Initial growth of roots in all treatments was linear. Roots from control plants, al-ready in a linear growth pattern, grew faster, initially, and the slope was significantly greater than any other treatment (Table 1). CH at 260 g/l significantly reduced initial root growth compared with all other treatments. Treatment effects were evident when root growth changed from a linear growth pattern to an exponential (Xl) growth pattern (Table 1). Control and 90 g/l CH began exponential growth at the same time. LP had an inhibitory effect on regeneration of roots in contact with container walls treated with paint. Asymptote (A), is a line approached by a curve, where Y approaches zero and X increases without limit (4). In this case Y is the length of the root when root growth has leveled off and X is number of days. No significant differences occurred between the 90 g/l CH treatment and contro1 plants (Table 1). All other treatments had significantly shorter root lengths.
Significance to Industry: The development of a growth curve model provides researchers with a clear picture of the root regeneration process of chemically root pruned viburnum, and a basis for comparison with other woody ornamental plants which may be studied for the effects of chemical root pruning on root re-generation.
Literature Cited
1. Burdett, A.N. 1978. Control of root morphogenesis for improved mechanical stability of container grown lodgepole pine. Can. J. For. Res. 8(4):483-486.
2. Burdett, A. N. 1981. Box-pruning the roots of container-grown tree seedlings. Proceedings of the Canadian Containerized Tree Seedling Symposium. p.203-206.
3. Cataldo, D. A. and R. E. Wildung. 1978. Soil and plant factors influencing the accumulation of heavy metals by plants. Environ. Health Perspectives 27:149-159.
4. Little, Thomas M. and F. Jackson Hills. 1977. Agricultural experimentation: design and analysis. John Wiley and Sons, New York, New York.
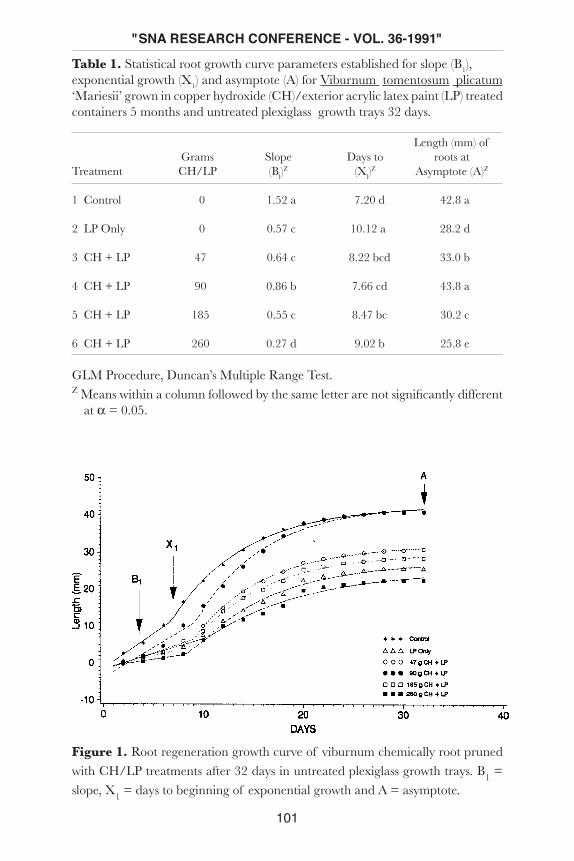
"SNA RESEARCH CONFERENCE - VOL. 36-1991"
101
Table 1. Statistical root growth curve parameters established for slope (B1), exponential growth (X1) and asymptote (A) for Viburnum tomentosum plicatum ‘Mariesii’ grown in copper hydroxide (CH)/exterior acrylic latex paint (LP) treated containers 5 months and untreated plexiglass growth trays 32 days.
Length (mm) of Grams Slope Days to roots atTreatment CH/LP (Bl)
Z (Xl)Z Asymptote (A)Z
1 Control 0 1.52 a 7.20 d 42.8 a
2 LP Only 0 0.57 c 10.12 a 28.2 d
3 CH + LP 47 0.64 c 8.22 bcd 33.0 b
4 CH + LP 90 0.86 b 7.66 cd 43.8 a
5 CH + LP 185 0.55 c 8.47 bc 30.2 c
6 CH + LP 260 0.27 d 9.02 b 25.8 e
GLM Procedure, Duncan’s Multiple Range Test.Z Means within a column followed by the same letter are not significantly different
at α = 0.05.
Figure 1. Root regeneration growth curve of viburnum chemically root pruned with CH/LP treatments after 32 days in untreated plexiglass growth trays. B1 = slope, X1 = days to beginning of exponential growth and A = asymptote.

102
"SNA RESEARCH CONFERENCE - VOL. 36-1991"
Container Dimensions Affect ContainerMedia Temperature Patterns
Chris A. Martin and Dewayne L. IngramArizona and Kentucky
Nature of Work: Growth of containerized plants is slowed by supraoptimal container medium temperatures (1, 2, 3, 6). Root tissues are often killed when root-zone temperatures exceed 42C (108˚F) (6). Daily maximum temperatures > 50C (122°F) have been recorded in container media adjacent to eastern, southern, and western container walls, and temperatures > 40C (104°F) have been recorded for 6 to 10 hours daily during the summer months at the center of the container me-dium profile (7). Ingram et al. (1) suggested that nursery operators prevent growth medium temperatures from exceeding 40C (104°F) so as to attenuate root injury and maintain satisfactory plant growth.
In general, container medium temperature patterns mimic a sinusoidal wave pat-tern. Computer modeling of container medium thermal energy flows indicated that solar radiation and wind-driven convection were the primary pathways for the influx and efflux of heat energy through a container medium system (4). Martin and Ingram (5) showed that irrigation water could be used to lower container media temperatures; however, the volumes of water needed for media cooling were judged to be excessive in light of current trends toward resource conservation and control of irrigation runoff from container production areas. Accordingly, the most sensible means of lowering supraoptimal container media temperatures is to reduce the influx of radiation energy into the container wall. This can be accomplished by changing container color, spacing containers close together, or increasing overhead shade (1, 2, 3). However, other ways to lower supraoptimal root-zone temperatures in container media might involve increasing container volume or changing container shape. This paper summarizes research where computer simulation was used to investigate the consequences of increased container volume or changed container shape on root-zone temperature patterns in three container media. Computer simulation is a robust research tool for this type of study because of the ability to manipulate container dimensions, and the inherent difficulty of obtaining contain-ers of different shapes and volumes from plastics manufacturers.
A computer model was constructed previously to simulate temperature patterns in cylindrically-shaped containers filled with growth medium as a function of chang-ing environrnental inputs (4). The computer model can predict container medium temperatures within 1 SE (4). With this model, the effect of container volume on medium temperature patterns was studied by modeling volume as a continuous parameter [7 to 70 liters (2 to 19 gal.)] for three growth media [pine bark, 4 pine bark: 1 sand (by vol.), and 3 pine bark: 2 sand (by vol.)], where container height, top diameter, and bottom diameter were increased equally at a one: one: one ratio. The effect of container shape on medium temperature patterns was examined by

modeling the container wall tilt angle as a continuous parameter for a 4 pine bark: 1 sand (by vol.) medium for containers with heights ranging from 22 to 55 cm (9 to 22 in). For each height, the container wall was tilted outward from perpendicular to a horizontal surface (tilt angle equals zero) to 45° by maintaining container height and bottom diameter constant at a one: one ratio while the top diameter was increased. All simulation data were generated for Phoenix, AZ (33.5°N 112°W) or Lexington, KY (38.0°N 84.4°W), Julian day 201 aul. 20). The weather was assumed to be clear at both locations. The volumetric water content for all simulation runs was initialized at 40%. Relative humidity was held constant at 15% or 65% for Phoenix, AZ, or Lexington, KY, respectively.
Results and Discussion: For Phoenix, AZ, and Lexington, KY, predicted medium temperature patterns adjacent to container walls did not change, regard-less of changes in container volume or medium sand content. However, at the center location, the predicted maximum daily medium temperature was lowered and occurred later in the day as volume was increased. For Phoenix, AZ, the maximurn temperature was lowered by 14.3C (25.7°F), 8.8C (16.9°F), and 7.4C (13.4°F) for the pine bark, 4 pine bark: 1 sand (by volume), and 3 pine bark: 2 sand (by volume), respectively, as the container volume was increased from 7 to 70 liters (2 to 19 gal.). Also, predicted medium temperature gradients from the container wall to the center location in the container profile, after the walls were exposed to solar radiation, were negatively curvilinear. The highest medium temperatures were predicted at the 2.5 cm (1 in) medium section adjacent to the container wall. Thus, plants transplanted into large containers would be more buffered from the highest medium temperatures by the larger rooting volume than for those plants transplanted into small containers.
Predicted temperature patterns in container medium adjacent to the container wall were lowered as the wall tilt angle was increased. For Phoenix, AZ, the maximum temperatures at the east and west exposures were lowered by 13. lC (23.6°F) and 10.6C (19.0°F), respectively, as the tilt angle was increased from 0 to 45°. How-ever, when the tilt angle equaled 45°, the maximum temperatures at both east and west exposures were still > 40C (104°F) [53.2C (127.8°F) and 42.9C (109.2°F), respectively]. For Lexington, KY, the maximum temperatures at the east and west exposures were lowered by 12.9C (23.2°F) and 11. lC (19.9°F), respectively, as the tilt angle was increased from 0 to 45° and a tilt angle of 36.4° was sufficient to lower the daily maximum temperature at the east exposure to 40C (104°F). Predicted temperature patterns at the center location of the container profile were lowered in response to the interaction of increased container height and wall tilt angle. For both locations, as container height was decreased, the tilt angle necessary to lower the daily maximum temperature at the center location to < 40C (104°F) was increased; however, the required increase was greater for Phoenix, AZ, than for Lexington, KY, because of higher ambient air temperatures. For Phoenix, AZ, container height had to be ≥ 23.5 cm (9.3 in) before the wall tilt angle (≥ 45°) would cause the maximum center location temperature to be ≤ 40C (104°F). However,
"SNA RESEARCH CONFERENCE - VOL. 36-1991"
103
104
"SNA RESEARCH CONFERENCE - VOL. 36-1991"
if the container height was increased to 35 cm (14 in), then the tilt angle necessary to maintain the maximum center location temperature below 40C (104°F) was only 13.7°. For Lexington, KY, if the container height was 22 cm (9 in) and the container wall was perpendicular to the ground (tilt angle equals zero), then the daily maximum temperature at the center location was 41.3C (106.3°F). If however, the tilt angle was 6.5°, then the daily maximum temperature at the center loca-tion was 39.8C (103.6°F) and if the tilt angle was increased to 34°, then the daily maximum temperature at the center location was only 35.5C (95.9°F). This data suggest that the practice of tilting container walls to lower root-zone temperatures might be more practical for large containers in Phoenix, AZ, and small containers in Lexington, KY.
Significance to the Industry: Supraoptimal root-zone temperatures in con-tainer media reduce plant growth and increase the duration of time before trees and shrubs reach marketable size. Via the use of computer models, we have shown how increased container volume, changed medium composition, and changed container shape might ameliorate supraoptimal container medium temperatures. Based on simulation data, we suggest that nursery operators minimize container medium sand content and shift plants to larger container volumes earlier in the production cycle than usual, or start plants in the container volume which they will be marketed. When container walls are exposed to solar radiation, supraoptimal temperatures in media not adjacent to container walls might be further alleviated by having con-tainer walls tilted outward to lessen exposure of the walls to direct solar radiation. In Lexington, KY, nursery operators might use small containers with tilted walls, whereas, in Phoenix, AZ, nursery operators might use large containers with tilted walls, because of higher average ambient air temperatures.
Literature Cited
1. Ingram, D.L., C.A. Martin, and J.M. Ruter. 1989. Heat-stress of container-grown plants. Int. Plant Prop. Soc. Proc. 39:348-353.
2. Keever, G.S. and G.S. Cobb. 1984. Container and production bed mulch effects on media temperatures and growth of ‘Hershey's Red' azalea. HortScience 19:439-441.
3. Laiche, A.J. 1985. Effect of time of spacing on the growth of container-grown llex comuta ‘Dwarf Burford,’ Lindl. and Paxt., and Pittosporum tobira. J. Environ. Hort. 3:22-24.
4. Martin, C.A. 1990. Modeling Temperature Patterns in a Container Media and Acclimatization of Three Tree Species to Supraoptimal Root-zone Tem-peratures. Ph.D. Diss., Univ. of Florida, Gainesville, Florida.

"SNA RESEARCH CONFERENCE - VOL. 36-1991"
105
5. Martin, C.A. and D.L. Ingram. 1991. Evaluation of thermal properties in container media and effect of irrigation on temperature dynamics in container media. J. Environ. Hort. 9(1):24-28.
6. Martin, C.A. and D.L. Ingram. 1989. Supraoptimal root-zone temperature alters growth and photosynthesis of holly and elm. J. Arboriculture 15:272-276.
7. Martin, C.A. and D.L. Ingram. 1988. Temperature dynamics in black poly containers. Southern Nurseryman Res. Conf. 33:71-74.
Comparison of Light Intensity and TempaturesUnder White and Black Shade Cloth
E. Lewis Phillips, T.E. Bilderback, Richard E. Bir and Doug TornNorth Carolina
Nature of Work: Many researchers as well as nurserymen have expressed inter-est in the production of mountain laurel, Kalmia latifolia L. in containers. With the availability of high quality tissue culture propagated liners, many producers are attempting to grow mountain laurel under many different cultural conditions with mixed results (1,2,3).
Research by Hummel and Johnson (3) showed that mountain laurel could be suc-cessfully grown in different media. Bir and Bilderback (1) conducted a survey of cultural practices of nurseries growing mountain laurel in thirteen states. These cultural practices included plant handling, pruning, pest management, fertilization, cultivar performance and winter protection.
In another study, Bir and Bilderback (2) analyzed the affect that media physical properties had on the growth of mountain laurel. They concluded that media management by nurserymen can be considered the greatest variable in producing consistently excellent plants with the best mountain laurel being produced in rela-tively lightweight mixes with greater total porosity, air space and available water.
The intent of this study was to compare light intensity and temperatures under black and white shade cloth and determine if these variables affected plant growth. Uni-form liners of Kalmia latifolia ‘Nipmunk’ were potted into trade 3 gallon containers on May 31, 1990. The growing media consisted of pine bark and peat moss (85:15 by volume), a minor element supplement (STEP, 0. M. Scotts) at 0.88 lbs./cu. yd., 7.0 lbs./cu. yd. dolomitic limestone, and Scotts 20-3-10 fertilizer incorporated at 10.6 lbs./cu. yd. Containers were placed on gravel beds under shade treatments. The shade treatments consisted of black 20% shade cloth and white 55% shade
"SNA RESEARCH CONFERENCE - VOL. 36-1991"
106
cloth. Irrigation applied at approximately one half inch when needed as determined by the grower was provided by overhead irrigation. Light levels were measured by using a General Electric Type 214 Light Meter and levels were recorded at 4 different times during the growing season. Temperature data from under the 2 shade treatments were recorded by a 21 X Campbell Scientific Micrologger with thermocouple wire sensors. Ambient air temperature and container temperatures were recorded for both treatments. Plant growth response to the shade treatments were determined by growth index measurement at the initiation of the study and at the termination of the study to develop a growth index response difference utilizing newly potted liners. The growth index is a measurement of the width + the height divided by 2.
Results and Discussion: All cultural practices were the same under both shade treatments.
Light Intensity - Light measurements were recorded on 31 May 90, 17 July 90, 17 Oct. 90, 20 Nov. 90. A 20% reduction of light intensity was recorded under the black shade cloth in May and July as compared to a 52% reduction under the white shade on the same dates. In October, a 39% reduction of light intensity was recorded under black shade and a 64% reduction in light was recorded under the white shade. Light intensity was reduced by 34% and 57% in November under the black and white shade treatments respectively.
Temperature - Both ambient air and pot temperatures were recorded with a 21 X Campbell Scientific Micrologger with thermocouple wire sensors. Air temperatures under both shade treatments were obtained by placing a thermocouple sensor in a small wooden box containing holes allowing exposure to ambient air. Pot tempera-tures were determined by placing thermocouple sensors in pots, approximately 2.5 inches deep and .75 inches from the side of the pot, under both black and white shade. Data collected indicates no significant difference in ambient air temperatures under the different shade treatments. Pot temperatures were significantly different with the cooler pot temperatures recorded in the pots placed under white shade.
Plant Growth Index - Plant growth measurements recorded at the initiation of the study and at the termination of the study indicates no significant difference in plant growth response due to the light intensity and temperatures recorded under the black and white shade cloth treatments.
Significance to Industry: In this study, differences in light intensity and pot temperatures recorded under 20% black shade cloth and 55% white shade cloth did not play a major role in influencing plant growth. From this study we would be in agreement with Bir and Bilderback in concluding that proper media man-agement plays a greater role in determining plant growth when compared to light intensities and temperatures recorded under 20% black shade cloth and 55% white shade cloth.
"SNA RESEARCH CONFERENCE - VOL. 36-1991"
107
Literature Cited:
1. Bir, R. E. and T. E. Bilderback. 1989. Growing Better Mountain Laurel in Containers. Proc. Int. Pl. Prop. Soc. 39:442-447.
2. Bir, R. E. and T. E. Bilderback. 1990. The Affect of Container Media Physical Properties on the Quality of Nursery Grown Mountain Laurel. Proc. SNA. Res. Conf 35:71-73.
3. Hummel, R. L., L. R. Johnson and 0. M. Lindstrom. 1990. Root and Shoot Growth Response of Three Containerized Kalmia latifolia L. Cultivars at Two Locations to Growing Medium and Nitrogen form. J. Environ. Hort. 8:10-14.
Influence of Shade on Leaf Physiology and Growth ofRhododendron x ‘Pink Ruffles’1
Jeffrey G. Norcini, Gary W. Knox, and Peter C. AndersenFlorida
Nature of Work: Azaleas, grown in nurseries under intensive fertilization and irrigation regimes, are usually provided with 31% to 55% shade in Florida (4). However, in some Southeastern U.S. nurseries, azaleas are grown under full sun. The objectives of this study were to assess leaf physiology and plant growth characterisitics of Rhododendron x ‘Pink Ruffles’ when grown under 0%, 31%, 53%, and 71% shade.
In April 1987, liners were potted in 1-gal containers in a medium consisting of pine bark:Canadian sphagnum peat: sand (2:1:1, by vol.) and amended as previously described (1); initial medium pH was 4.6. Plants were placed under 31% shade until the experiment was started.
An 80 x 56 x 6.5-ft open-sided structure was constructed with the longitudinal axis oriented in a north-south direction. The structure was divided into four rows (blocks) in a north-south direction. Each block consisted of four individual 20 x 14-ft shade structures - 0, 31%, 53%, and 71% shade. On June 17, 1987, four plants were placed about 3 ft above the ground on benches (8.9 x 2.6 ft) centered directly below each of the four replicates of each of four shade treatments.
Plants were top-dressed with 0.35 oz Nutricote 16-10-10 Type 180 at the start of the experiment, and then every 3 months with 0.5 oz osmocote 18-6-12. Plants were repotted into 3-gal containers in April 1988. About 1 qt (1987) or 2 qt (1988) of water was applied to each container daily at both 0800 and 1400 HR via drip irrigation.
"SNA RESEARCH CONFERENCE - VOL. 36-1991"
108
Net photosynthetic rate (A) and stomatal conductance to water vapor (gs) were measured using an Analytical Development Corporation Model LCA-2 infrared gas analyzer as previously described (1). Stomatal conductance to water vapor, an indicator of stomatal pore opening, was measured because it can strongly influence A. On Aug. 26, 1987, chlorophyll concentration was measured in leaves from one plant in each replicate (5). Plant growth index was determined as GI = (height + width)/2 on all plants during June and Dec. 1987, and Nov. 1988. On Dec. 20, 1987, one plant in each replicate was harvested for determination of total leaf area and total dry weight. These variables were measured again on Dec. 21 to 27, 1988 using two plants per replicate.
Results and Discussion: Rhododendron x ‘Pink Ruffles’ grown under full sun were dwarfed and chlorotic, and had markedly reduced total dry weight and leaf area compared to shade-grown plants (Table 1). Appearance of plants in 31% or 53% shade was normal and considered marketable. Plants grown under shade exhibited no differences in total dry weight or leaf area, but under 71% shade plants were not compact enough to be marketable.
Plants grown under shade had similar levels of A, gs, and chlorophyll (Table 1). Under full sun, A, gs, and chlorophyll were often reduced compared to shade-grown plants. These lowered levels indicated that plants in full sun may have experienced photoinhibition (2, 3).
Successful production of containerized azaleas under full sun in some Southeastern nurseries might be related to the potting medium temperature. In this experiment, medium temperature was more than 7°F higher under full sun than under shade. However, under nursery conditions, the azalea canopy would partially or fully shade most containers thereby reducing medium temperature.
Significance to Industry: Growth and appearance of Rhododendron x ‘Pink Ruffles’ was normal under 31% or 53% shade. Plants grown under 71% shade were not marketable because of their leggy growth habit, although these plants were similar to the other shade-grown plants in all other respects. Full sun caused these azaleas to become dwarfed and chlorotic, and were therefore unmarketable.
1 This is Florida Agricultural Experiment Station Journal Series No. N-00425.
Literature Cited
1. Andersen, P.C., J.G. Norcini, and G.W. Knox. 1991. Influence of irradiance on leaf physiology and plant growth of Rhododendron x ‘Pink Ruffles’. J. Amer. Soc. Hort. Sci. (in press).
2. Anderson, J.M. and C.B. Osmond. 1987. Shade-sun responses: compromises between acclimation and photoinibition, p. 1-38. In: D.J. Kyle, C.B. Osmond, and C.J. Arntzen (eds.). Photoinhibition - Topics in Photosynthesis, Vol. 9. Elsevier Science Publishers, Amsterdam, The Netherlands.
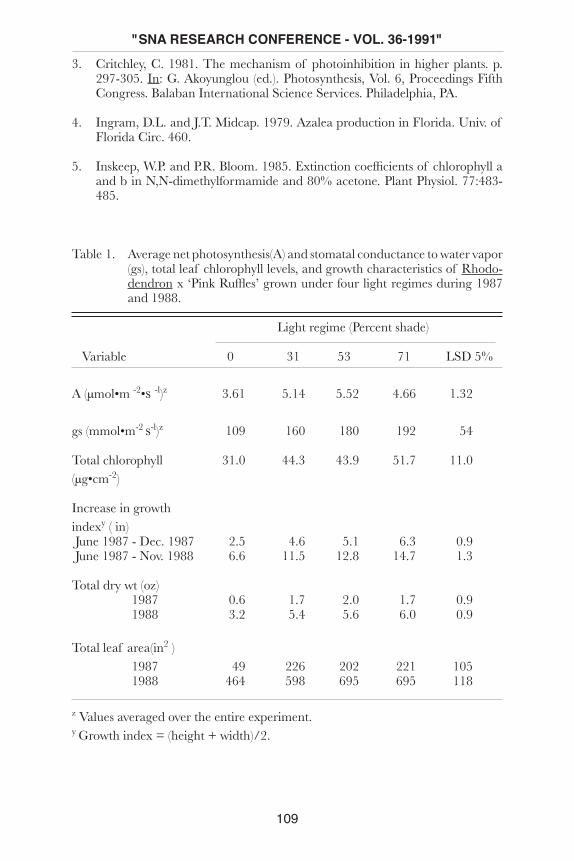
"SNA RESEARCH CONFERENCE - VOL. 36-1991"
109
3. Critchley, C. 1981. The mechanism of photoinhibition in higher plants. p. 297-305. In: G. Akoyunglou (ed.). Photosynthesis, Vol. 6, Proceedings Fifth Congress. Balaban International Science Services. Philadelphia, PA.
4. Ingram, D.L. and J.T. Midcap. 1979. Azalea production in Florida. Univ. of Florida Circ. 460.
5. Inskeep, W.P. and P.R. Bloom. 1985. Extinction coefficients of chlorophyll a and b in N,N-dimethylformamide and 80% acetone. Plant Physiol. 77:483-485.
Table 1. Average net photosynthesis(A) and stomatal conductance to water vapor (gs), total leaf chlorophyll levels, and growth characteristics of Rhodo-dendron x ‘Pink Ruffles’ grown under four light regimes during 1987 and 1988.
Light regime (Percent shade) Variable 0 31 53 71 LSD 5%
A (µmol•m -2•s -l)z 3.61 5.14 5.52 4.66 1.32
gs (mmol•m-2 s-l)z 109 160 180 192 54
Total chlorophyll 31.0 44.3 43.9 51.7 11.0(µg•cm-2)
Increase in growth indexy ( in) June 1987 - Dec. 1987 2.5 4.6 5.1 6.3 0.9 June 1987 - Nov. 1988 6.6 11.5 12.8 14.7 1.3
Total dry wt (oz) 1987 0.6 1.7 2.0 1.7 0.9 1988 3.2 5.4 5.6 6.0 0.9
Total leaf area(in2 ) 1987 49 226 202 221 105 1988 464 598 695 695 118
z Values averaged over the entire experiment.y Growth index = (height + width)/2.
"SNA RESEARCH CONFERENCE - VOL. 36-1991"
110
Effects of Selected Pruning Treatments on the Growth ofContainer-Grown Ternstroemia qymnanthera
Adolph J. Laiche, Jr.Mississippi
Nature of Work: Container-grown woody landscape plants usually require prun-ing to remove undesired growth and to stimulate branching. Judicious pruning improves plant appearance and increases marketability.
The objective of this study was to evaluate the effects of initial pruning, before and after spring bud break, and subsequent pruning during the growing season, on the growth of Ternstroemia gymnanthera.
Uniform Ternstroemia gymnanthera plants in 3 gal (11.4 L) containers with an average height of 37 in (94 cm) were obtained from a wholesale nursery and planted in 12 gal (45 L) containers on February 19, 1988. A growth medium of 3 pine bark:l sand (v/v) was amended with 3 lb/yd3 (1.78 kg/m3) of dolomitic limestone, 1 lb/yd3 (.59 kg/m3) of 0-20-0 (0N-8.6P-0K), 1.5 lb/yd3 (.89 kg/m3) of Micromax and 12 lb/yd3 (7.12 kg/m3) of slow release 17-7-12 (17N-3.0P-l0.0K) fertilizer.
Treatments consisted of two initial prunings, three subsequent prunings and an unpruned check, Table 1. Treatments were arranged in a randomized complete block design and replicated six times with one container plant as an experimental unit. Initial pruning, before or after spring bud break, was performed on Febru-ary 26, 1988 and April 28, 1988, respectively. Initial pruning reduced plant size to 14 in (36 cm) and consisted of cutting stems of the previous season’s growth. Subsequent pruning treatments were no pruning, light pruning and severe prun-ing, and consisted of cutting stems of the current season’s growth. Light pruning removed only the terminal bud and stem with 1 or 2 young leaves. Severe pruning removed all of the current season’s growth except approximately 1/4 in (.64 cm) of the basal end of each stem. Subsequent light and severe prunings were performed when new growth was 3 to 5 in (8 to 13 cm) in length on April 28, 1988 to plants initially pruned before spring bud break, and on June 23, 1988 to plants initially pruned after spring bud break.
The study was terminated January 3, 1989 and the following data were taken for statistical analysis. Growth index was determined by averaging plant height and plant width. Plant height was taken from the rim of the container and plant width was an average of 2 measurements that were taken perpendicular to each other. The number of bud breaks per shoot per plant was an average obtained from 3 shoots randomly selected in the beginning of the study. Plant quality ratings were based on a scale of 10 = excellent to 0 = poor. Shoots were severed 14 inches above the growth medium to obtain the fresh weight of growth above the initial pruning height. The plants were also severed at the growth medium surface to obtain total shoot fresh weight.

"SNA RESEARCH CONFERENCE - VOL. 36-1991"
111
Results and Discussion: Pruning before spring bud break with no subsequent pruning or only light subsequent pruning, improved plant quality with no decrease in plant size and shoot fresh weight, as compared to unpruned check plants, Table 1. An increase in shoot fresh weight above 14 inches occurred with plants pruned before spring bud break and then lightly pruned compared to unpruned check plants. An increase in plant size as indicated by growth index measurements and total shoot fresh weight, however, was not obtained by this treatment, Table 1.
The growth index, shoot fresh weight and quality of plants pruned before spring bud break and then severely pruned and plants pruned after spring bud break and then not pruned or lightly pruned were similar. The growth index, shoot fresh weight and quality of these plants were less compared to plants pruned before spring bud break with no or only light subsequent pruning. Pruning after spring bud break with subsequent severe pruning resulted in the smallest plants as indicated by growth index and total fresh weight, Table 1.
Growth and quality of plants receiving light subsequent pruning were not differ-ent from those not subsequently pruned whether the plants were pruned before or after spring bud break. Severe subsequent pruning resulted in decreased plant size, total fresh weight and quality of plants regardless of initial pruning time. The number of bud breaks per shoot was not significantly affected by any of the pruning treatments in this study.
All pruning treatments were expected to cause a decrease in total plant growth since pruning is considered a dwarfing process (1). Although initial pruning treatments resulted in the removal of a substantial amount of foliage, (plant height was reduced from an average height of 37 inches to 14 inches) pruning before spring bud break with light or no subsequent pruning did not result in a decrease in plant size and total shoot fresh weight after one growing season with Ternstroemia gymnanthera in 12 gallon containers.
Significance to Industry: Plant quality was substantially improved by pruning before spring bud break with both light and no subsequent pruning. The additional expense of subsequent light pruning during the growing season to plants initially pruned before spring bud break did not result in a greater increase in plant quality and may not be necessary. Pruning in the spring after bud break and severe sub-sequent pruning during the growing season to plants initially pruned either before or after spring bud break were detrimental to the size and quality of Ternstroemia gymnanthera.
Pruning practices with container-grown plants vary with objective and cultivar. This study with Ternstroemia gymnanthera demonstrates the need to plan prun-ing practices of container-grown plants thoroughly. For example, the timing and degree of pruning should be considered to maximize desired quality and avoid or minimize the possible loss in growth associated with pruning.
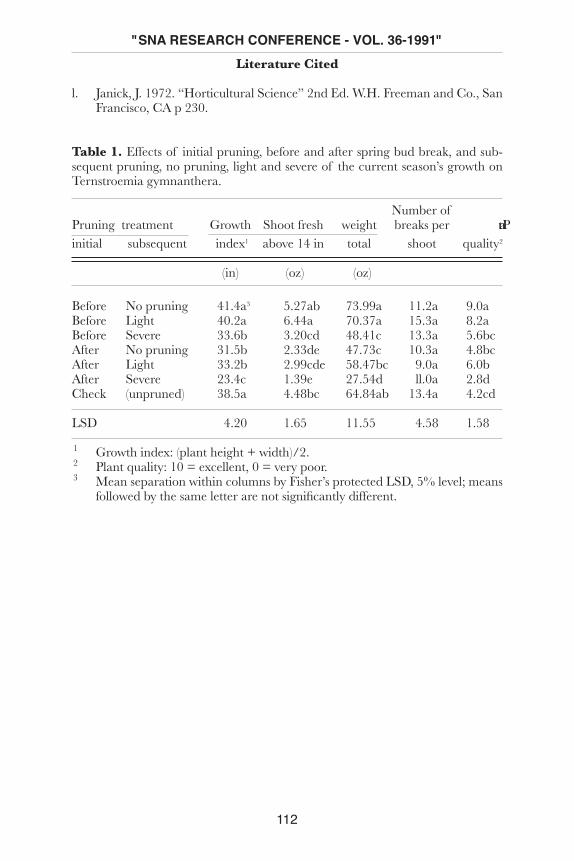
"SNA RESEARCH CONFERENCE - VOL. 36-1991"
112
Literature Cited
l. Janick, J. 1972. “Horticultural Science” 2nd Ed. W.H. Freeman and Co., San Francisco, CA p 230.
Table 1. Effects of initial pruning, before and after spring bud break, and sub-sequent pruning, no pruning, light and severe of the current season’s growth on Ternstroemia gymnanthera.
Number ofPruning treatment Growth Shoot fresh weight breaks per Plant initial subsequent index1 above 14 in total shoot quality2
(in) (oz) (oz)
Before No pruning 41.4a3 5.27ab 73.99a 11.2a 9.0aBefore Light 40.2a 6.44a 70.37a 15.3a 8.2aBefore Severe 33.6b 3.20cd 48.41c 13.3a 5.6bcAfter No pruning 31.5b 2.33de 47.73c 10.3a 4.8bcAfter Light 33.2b 2.99cde 58.47bc 9.0a 6.0bAfter Severe 23.4c 1.39e 27.54d ll.0a 2.8dCheck (unpruned) 38.5a 4.48bc 64.84ab 13.4a 4.2cd
LSD 4.20 1.65 11.55 4.58 1.58
1 Growth index: (plant height + width)/2. 2 Plant quality: 10 = excellent, 0 = very poor. 3 Mean separation within columns by Fisher’s protected LSD, 5% level; means
followed by the same letter are not significantly different.

"SNA RESEARCH CONFERENCE - VOL. 36-1991"
113
Commercial Nursery Production of Crataegus Opaca in Louisana
E. W. Bush, C. E. Johnson and J. T. Payne Louisiana
Nature of Work: Commercial production of Crataegus opaca Hook & Arn. (Mayhaw) has significantly expanded in Louisiana over the past 3 years. Newly established backyard and commercial orchards have created a demand for mayhaw trees that has exceeded the supply. Mayhaw is an attractive small tree that can be planted in a home landscape, providing dark green foliage and early profuse blossoms. Several Louisiana nurserymen are currently producing mayhaw trees in field rows, plastic liners and nursery containers. The objective of this study was to ascertain cultural practices used to produce mayhaw in Louisiana.
Discussion: Seed propagation is the most common form of starting mayhaw plants. Fresh seed planted in flats filled with a peat lite mixture sprout within 14 days of planting. Dormant seed require cold stratification for germination (2). Schopmeyer (3) reported that Crataegus spp. have embryo dormancy that requires stratification in a moist medium before germination will occur. Fermentation is used by several growers to clean seed. Following fermentation for several days, the extracted seed can be planted immediately or stored for later use (1). Seed are then planted in liner trays, nursery containers or fields. Nurseryman Leonard Bosch drills mayhaw seed directly into fumigated field beds. Bareroot trees are produced the following spring. Seedling mayhaw trees are commonly used as grafting rootstock.
Little research has been reported about rooting mayhaw cuttings. Propagation experiments at the Calhoun Research Station in 1989 using hardwood cuttings from a selected mayhaw clone yielded little success. Callus formation occurred after 12 weeks under mist, however less than 10% rooting occurred by the following spring. Softwood cuttings taken in mid-spring from new growth had greater than 80% rooting success after 8 weeks under mist. Hormone treatments consisted of 4 inch tip cuttings dipped in 0, .3%, and .8% IBA rooting powder. There were no observable differences among hormone treatments.
Cleft graft is the most commonly used grafting procedure for commercial mayhaw production in Louisiana. Scion wood is taken in December and refrigerated in sealed plastic bags. Grafting typically occurs between February and March in north Louisiana. “Greenwood” grafting offers nurserymen a second opportunity to graft using the same rootstock from unsuccessful spring grafts. “Greenwood” grafting is a cleft graft accomplished in mid-summer. Current season’s growth in July is used for the scion wood. This grafting technique was performed successfully at the Calhoun Research Station in July 1990 with an 85% success rate.
"SNA RESEARCH CONFERENCE - VOL. 36-1991"
114
Several mayhaw specimens have been selected from the wild throughout Louisiana. ‘Super Spur’ is one of the most widely recognized mayhaw cultivars in Louisiana. Nurseryman, Sherwood Akin, selected ‘Super Spur’ from the wild for heavy fruit production. Several other mayhaw selections are currently in production (Table 1).
Pine bark is the most common medium used for producing container-grown mayhaw. Container size selection varies from 3 to 10 gallons. Fertilizer amend-ments used by nurserymen consist of micronutrients, dolomitic lime (8-12 lbs/cu yd) and slow release fertilizers (2 lbs N/cu yd). Magnesium deficiency can occur when lime is not incorporated, resulting in leaf chlorosis and growth reduction of mayhaw plants. The majority of nurserymen adjust planting media to pH 6.5 using dolomitic lime.
Little information is available on pests of mayhaw. The major disease affecting cultured mayhaw plants is Quince rust (Gymnosporanqium clavipes Cke. & Pk.). Selection of resistant cultivars is needed. Leafminers, mealybugs, and scale insects may also be a nuisance.
Conclusions: The demand for mayhaw trees currently exceeds nursery production. A 2-3 year period is needed to produce a marketable plant. Cultivar selection will depend on local demand. Media amendments (lime, micronutrients, and fertilizer) are essential to produce a healthy mayhaw tree. Further research concerning the production of mayhaw is being conducted at the Calhoun Research Station.
Significance to the Industry: Mayhaw production in Louisiana has increased significantly in recent years. Little research has been published on nursery produc-tion of Crataegus opaca. Mayhaw can be propagated using seed, stem cuttings, root cuttings, and grafting. Nursery containers filled with pine bark media amended with dolomitic lime(10 lbs/cu yd), Micromax(1.5 lbs/cu yd), and Osmocote 18-6-12(2 lbs N/cu yd) produced good quality plants.
Literature Cited
1. Baker, M.L. 1991. Increasing Seed Germination Percentage of Crataegus Opaca (Mayhaw) By Fermintation. HortSci 26(5):496.
2. Hartmen, H.T. and D.E Kester. 1983. Plant propagation principles and practices. Prentice-Hall, Inc., Englewood Clifs, N.J.
3. Schopmeyer, C.S. 1974. Seeds of woody plants in the United States. Agri-culture Handbook 450. U. S. Government Printing Office, Washington, DC.
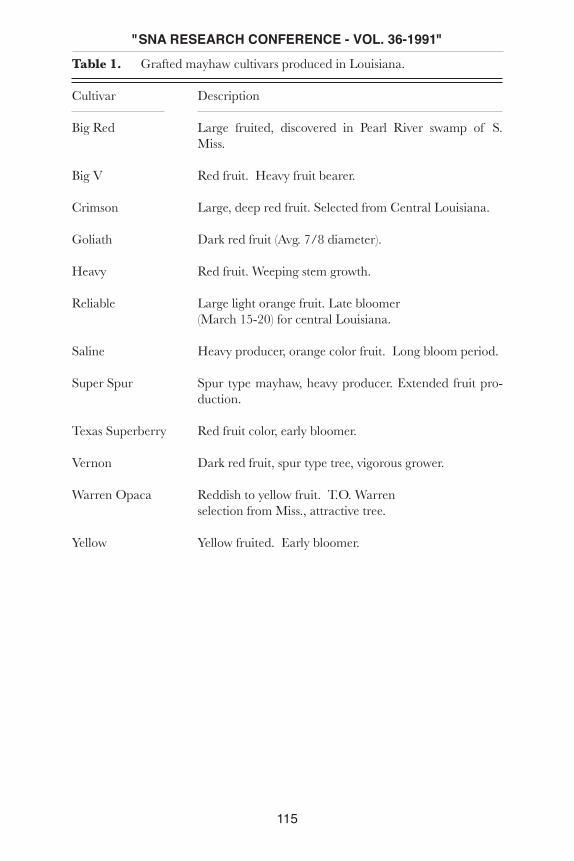
"SNA RESEARCH CONFERENCE - VOL. 36-1991"
115
Table 1. Grafted mayhaw cultivars produced in Louisiana.
Cultivar Description
Big Red Large fruited, discovered in Pearl River swamp of S. Miss.
Big V Red fruit. Heavy fruit bearer.
Crimson Large, deep red fruit. Selected from Central Louisiana.
Goliath Dark red fruit (Avg. 7/8 diameter).
Heavy Red fruit. Weeping stem growth.
Reliable Large light orange fruit. Late bloomer (March 15-20) for central Louisiana.
Saline Heavy producer, orange color fruit. Long bloom period.
Super Spur Spur type mayhaw, heavy producer. Extended fruit pro-duction.
Texas Superberry Red fruit color, early bloomer.
Vernon Dark red fruit, spur type tree, vigorous grower.
Warren Opaca Reddish to yellow fruit. T.O. Warren selection from Miss., attractive tree.
Yellow Yellow fruited. Early bloomer.

"SNA RESEARCH CONFERENCE - VOL. 36-1991"
116
Media and Water Quality Influence Growth ofContainer-Grown Azaleas
D.L. Fuller, E.W. Bush and D.A. Wall Louisiana
Nature of Work: Bicarbonate (H2C03) and Sodium (Na) in irrigation water in-crease medium pH and Na levels significantly (1,4). Milbocker (3) showed that azalea cultivar salt tolerance varies among species and cultivars Medium selection has also been shown to significantly affect the growth of container-grown azaleas (2).
The objective of this project was to determine the ability of various medium components to reduce the negative effects of irrigation with water high in sodium bicarbonate on azalea growth.
Four inch azalea liners were planted into 1 gallon containers filled with one of nine different media in November 1988 (Table 1). Media amendments were Si-erraBlen 17-7-10 + Fe(12 lbs/cu. yd), Micromax (1.51bs/cu. yd) and dolomitic lime(61bs/cu.yd). Azalea cultivars included ‘Formosa’, ‘George Tabor’, ‘G.G. Gerbing’, ‘Red Ruffles’ and ‘Southern Charm’. Containers were arranged in a randomized complete block design with 5 blocks. Irrigation water (pH 8.4, Na 225ppm) was supplied daily (600ml) to the medium surface through spray stakes. Subjective ratings (l=poor - 5=excellent) were taken at 8 months. Media and plant tissue samples were taken at the conclusion of the experiment. Plant tissue samples were analyzed by the LSU Feed and Fertilizer Laboratory. Medium samples were analyzed by the LSU Soil Testing lab.
Results and Discussion: Increasing the proportion of sand in bark and peat media resulted in lower plant quality ratings after an eight month period(Table 1). Media pH levels increased while extractable levels of Na, Ca, and Mg decreased with increasing proportions of sand in the media(Table 1).
Leaf tissue analysis revealed that bark and bark:peat without sand had the lowest Na levels and the highest Ca and Mg levels(Table 2). Although soil test results indicated a higher Na base saturation relative to Ca and Mg for media without sand this was not reflected in tissue analyses. A possible explanation for the lack of correlation between the soil test and tissue results may be the effect of media pH on the plant availability of Na, Ca, and Mg. The soil extraction test is done with 1 N Ammonium acetate buffered at a pH of 7.0 and would mask any effect media pH may have on nutrient availability.
Bark and bark:peat treatments without sand were able to buffer excessive increases in media pH from constant irrigation with low quality water high in bicarbonate and sodium. This buffering capacity resulted in significantly lower tissue levels of Na, and in the production of azalea plants that were commercially acceptable.
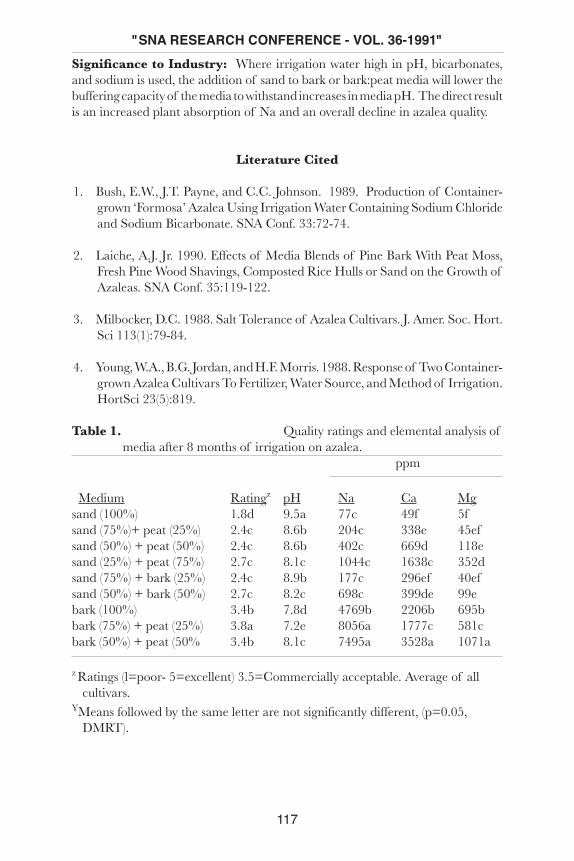
"SNA RESEARCH CONFERENCE - VOL. 36-1991"
117
Significance to Industry: Where irrigation water high in pH, bicarbonates, and sodium is used, the addition of sand to bark or bark:peat media will lower the buffering capacity of the media to withstand increases in media pH. The direct result is an increased plant absorption of Na and an overall decline in azalea quality.
Literature Cited
1. Bush, E.W., J.T. Payne, and C.C. Johnson. 1989. Production of Container-grown ‘Formosa’ Azalea Using Irrigation Water Containing Sodium Chloride and Sodium Bicarbonate. SNA Conf. 33:72-74.
2. Laiche, A.J. Jr. 1990. Effects of Media Blends of Pine Bark With Peat Moss, Fresh Pine Wood Shavings, Composted Rice Hulls or Sand on the Growth of Azaleas. SNA Conf. 35:119-122.
3. Milbocker, D.C. 1988. Salt Tolerance of Azalea Cultivars. J. Amer. Soc. Hort. Sci 113(1):79-84.
4. Young, W.A., B.G. Jordan, and H.F. Morris. 1988. Response of Two Container-grown Azalea Cultivars To Fertilizer, Water Source, and Method of Irrigation. HortSci 23(5):819.
Table 1. Quality ratings and elemental analysis of media after 8 months of irrigation on azalea.
ppm
Medium Ratingz pH Na Ca Mgsand (100%) 1.8d 9.5a 77c 49f 5fsand (75%)+ peat (25%) 2.4c 8.6b 204c 338e 45efsand (50%) + peat (50%) 2.4c 8.6b 402c 669d 118esand (25%) + peat (75%) 2.7c 8.1c 1044c 1638c 352dsand (75%) + bark (25%) 2.4c 8.9b 177c 296ef 40efsand (50%) + bark (50%) 2.7c 8.2c 698c 399de 99ebark (100%) 3.4b 7.8d 4769b 2206b 695bbark (75%) + peat (25%) 3.8a 7.2e 8056a 1777c 581cbark (50%) + peat (50% 3.4b 8.1c 7495a 3528a 1071a
z Ratings (l=poor- 5=excellent) 3.5=Commercially acceptable. Average of all cultivars.
YMeans followed by the same letter are not significantly different, (p=0.05, DMRT).
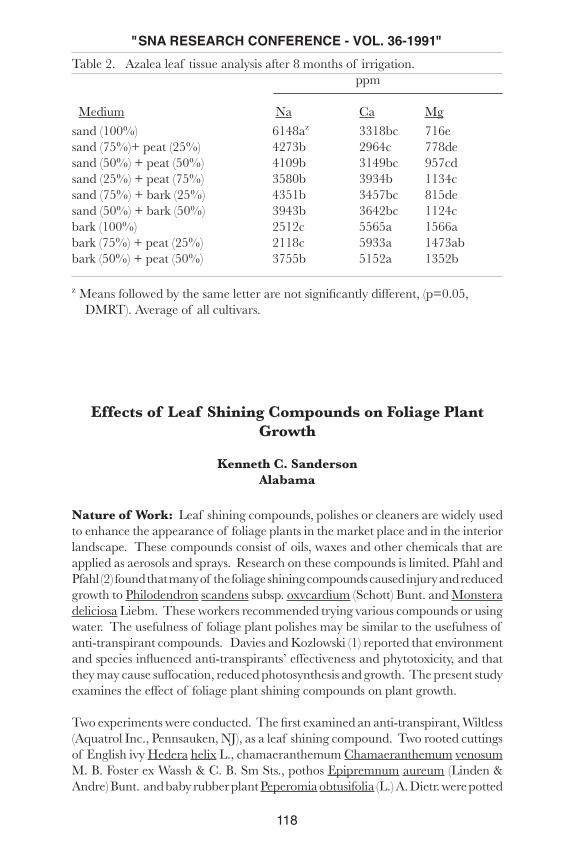
"SNA RESEARCH CONFERENCE - VOL. 36-1991"
118
Table 2. Azalea leaf tissue analysis after 8 months of irrigation. ppm
Medium Na Ca Mgsand (100%) 6148az 3318bc 716esand (75%)+ peat (25%) 4273b 2964c 778desand (50%) + peat (50%) 4109b 3149bc 957cdsand (25%) + peat (75%) 3580b 3934b 1134csand (75%) + bark (25%) 4351b 3457bc 815desand (50%) + bark (50%) 3943b 3642bc 1124cbark (100%) 2512c 5565a 1566abark (75%) + peat (25%) 2118c 5933a 1473abbark (50%) + peat (50%) 3755b 5152a 1352b
z Means followed by the same letter are not significantly different, (p=0.05, DMRT). Average of all cultivars.
Effects of Leaf Shining Compounds on Foliage Plant Growth
Kenneth C. SandersonAlabama
Nature of Work: Leaf shining compounds, polishes or cleaners are widely used to enhance the appearance of foliage plants in the market place and in the interior landscape. These compounds consist of oils, waxes and other chemicals that are applied as aerosols and sprays. Research on these compounds is limited. Pfahl and Pfahl (2) found that many of the foliage shining compounds caused injury and reduced growth to Philodendron scandens subsp. oxvcardium (Schott) Bunt. and Monstera deliciosa Liebm. These workers recommended trying various compounds or using water. The usefulness of foliage plant polishes may be similar to the usefulness of anti-transpirant compounds. Davies and Kozlowski (1) reported that environment and species influenced anti-transpirants’ effectiveness and phytotoxicity, and that they may cause suffocation, reduced photosynthesis and growth. The present study examines the effect of foliage plant shining compounds on plant growth.
Two experiments were conducted. The first examined an anti-transpirant, Wiltless (Aquatrol Inc., Pennsauken, NJ), as a leaf shining compound. Two rooted cuttings of English ivy Hedera helix L., chamaeranthemum Chamaeranthemum venosum M. B. Foster ex Wassh & C. B. Sm Sts., pothos Epipremnum aureum (Linden & Andre) Bunt. and baby rubber plant Peperomia obtusifolia (L.) A. Dietr. were potted
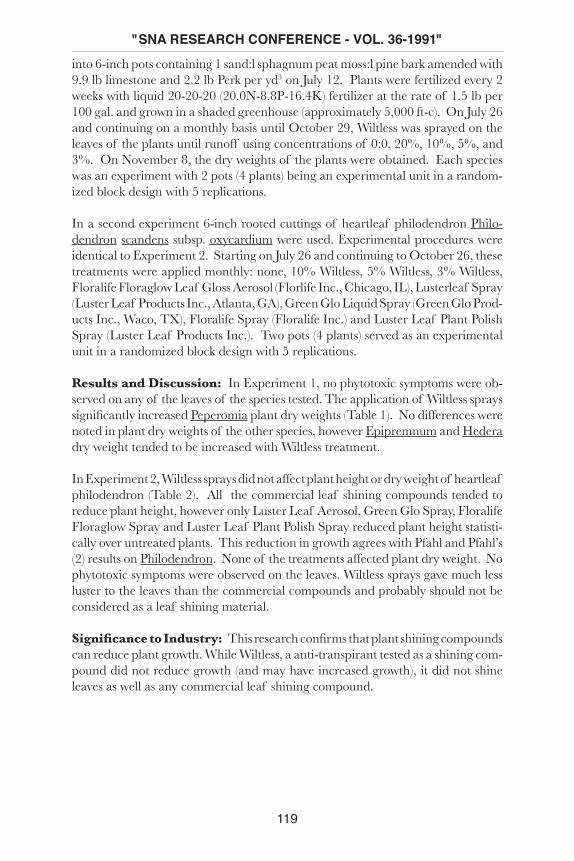
"SNA RESEARCH CONFERENCE - VOL. 36-1991"
119
into 6-inch pots containing 1 sand:l sphagnum peat moss:l pine bark amended with 9.9 lb limestone and 2.2 lb Perk per yd3 on July 12. Plants were fertilized every 2 weeks with liquid 20-20-20 (20.0N-8.8P-16.4K) fertilizer at the rate of 1.5 lb per 100 gal. and grown in a shaded greenhouse (approximately 5,000 ft-c). On July 26 and continuing on a monthly basis until October 29, Wiltless was sprayed on the leaves of the plants until runoff using concentrations of 0:0, 20%, 10%, 5%, and 3%. On November 8, the dry weights of the plants were obtained. Each species was an experiment with 2 pots (4 plants) being an experimental unit in a random-ized block design with 5 replications.
In a second experiment 6-inch rooted cuttings of heartleaf philodendron Philo-dendron scandens subsp. oxycardium were used. Experimental procedures were identical to Experiment 2. Starting on July 26 and continuing to October 26, these treatments were applied monthly: none, 10% Wiltless, 5% Wiltless, 3% Wiltless, Floralife Floraglow Leaf Gloss Aerosol (Florlife Inc., Chicago, IL), Lusterleaf Spray (Luster Leaf Products Inc., Atlanta, GA), Green Glo Liquid Spray (Green Glo Prod-ucts Inc., Waco, TX), Floralife Spray (Floralife Inc.) and Luster Leaf Plant Polish Spray (Luster Leaf Products Inc.). Two pots (4 plants) served as an experimental unit in a randomized block design with 5 replications.
Results and Discussion: In Experiment 1, no phytotoxic symptoms were ob-served on any of the leaves of the species tested. The application of Wiltless sprays significantly increased Peperomia plant dry weights (Table 1). No differences were noted in plant dry weights of the other species, however Epipremnum and Hedera dry weight tended to be increased with Wiltless treatment.
In Experiment 2, Wiltless sprays did not affect plant height or dry weight of heartleaf philodendron (Table 2). All the commercial leaf shining compounds tended to reduce plant height, however only Luster Leaf Aerosol, Green Glo Spray, Floralife Floraglow Spray and Luster Leaf Plant Polish Spray reduced plant height statisti-cally over untreated plants. This reduction in growth agrees with Pfahl and Pfahl’s (2) results on Philodendron. None of the treatments affected plant dry weight. No phytotoxic symptoms were observed on the leaves. Wiltless sprays gave much less luster to the leaves than the commercial compounds and probably should not be considered as a leaf shining material.
Significance to Industry: This research confirms that plant shining compounds can reduce plant growth. While Wiltless, a anti-transpirant tested as a shining com-pound did not reduce growth (and may have increased growth), it did not shine leaves as well as any commercial leaf shining compound.
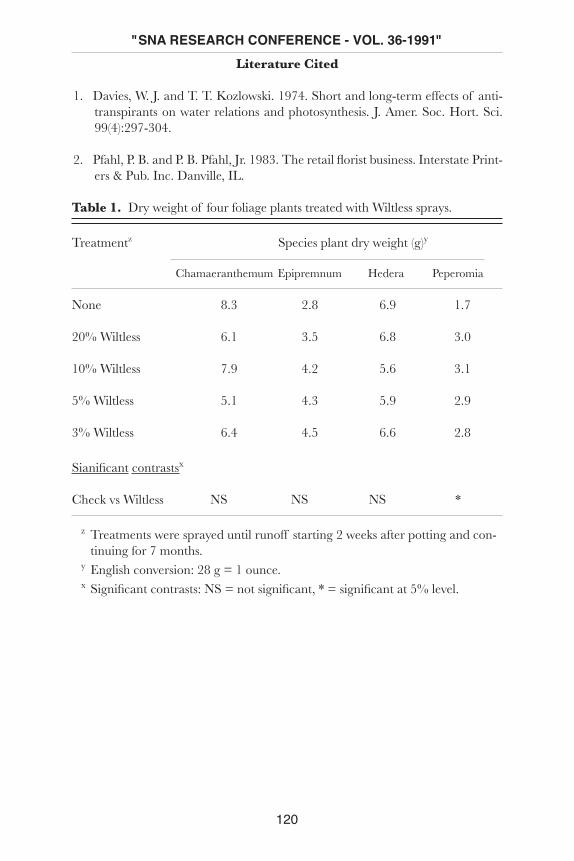
"SNA RESEARCH CONFERENCE - VOL. 36-1991"
120
Literature Cited
1. Davies, W. J. and T. T. Kozlowski. 1974. Short and long-term effects of anti-transpirants on water relations and photosynthesis. J. Amer. Soc. Hort. Sci. 99(4):297-304.
2. Pfahl, P. B. and P. B. Pfahl, Jr. 1983. The retail florist business. Interstate Print-ers & Pub. Inc. Danville, IL.
Table 1. Dry weight of four foliage plants treated with Wiltless sprays.
Treatmentz Species plant dry weight (g)y
Chamaeranthemum Epipremnum Hedera Peperomia
None 8.3 2.8 6.9 1.7
20% Wiltless 6.1 3.5 6.8 3.0
10% Wiltless 7.9 4.2 5.6 3.1
5% Wiltless 5.1 4.3 5.9 2.9
3% Wiltless 6.4 4.5 6.6 2.8
Sianificant contrastsx
Check vs Wiltless NS NS NS *
z Treatments were sprayed until runoff starting 2 weeks after potting and con-tinuing for 7 months.
y English conversion: 28 g = 1 ounce. x Significant contrasts: NS = not significant, * = significant at 5% level.
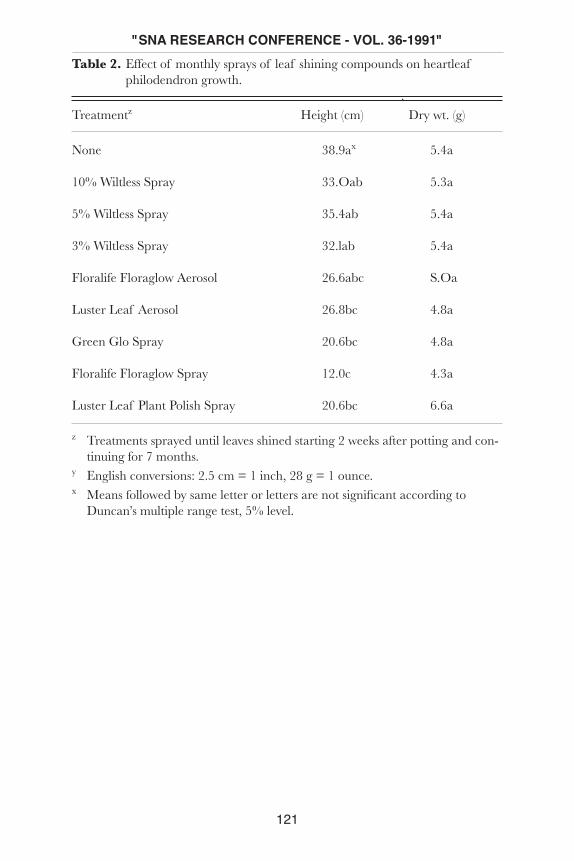
"SNA RESEARCH CONFERENCE - VOL. 36-1991"
121
Table 2. Effect of monthly sprays of leaf shining compounds on heartleaf philodendron growth.
.Treatmentz Height (cm) Dry wt. (g)
None 38.9ax 5.4a
10% Wiltless Spray 33.Oab 5.3a
5% Wiltless Spray 35.4ab 5.4a
3% Wiltless Spray 32.lab 5.4a
Floralife Floraglow Aerosol 26.6abc S.Oa
Luster Leaf Aerosol 26.8bc 4.8a
Green Glo Spray 20.6bc 4.8a
Floralife Floraglow Spray 12.0c 4.3a
Luster Leaf Plant Polish Spray 20.6bc 6.6a
z Treatments sprayed until leaves shined starting 2 weeks after potting and con-tinuing for 7 months.
y English conversions: 2.5 cm = 1 inch, 28 g = 1 ounce.
x Means followed by same letter or letters are not significant according to Duncan’s multiple range test, 5% level.
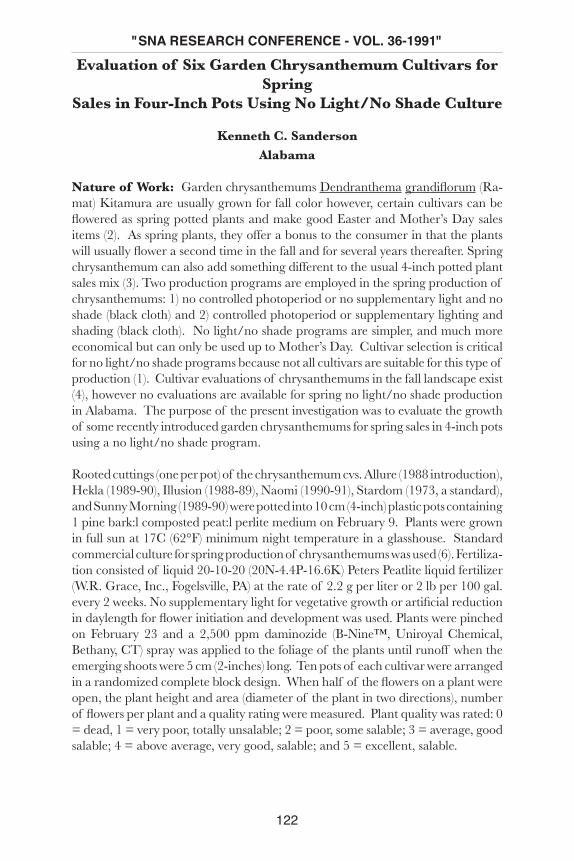
"SNA RESEARCH CONFERENCE - VOL. 36-1991"
122
Evaluation of Six Garden Chrysanthemum Cultivars for Spring
Sales in Four-Inch Pots Using No Light/No Shade Culture
Kenneth C. SandersonAlabama
Nature of Work: Garden chrysanthemums Dendranthema grandiflorum (Ra-mat) Kitamura are usually grown for fall color however, certain cultivars can be flowered as spring potted plants and make good Easter and Mother’s Day sales items (2). As spring plants, they offer a bonus to the consumer in that the plants will usually flower a second time in the fall and for several years thereafter. Spring chrysanthemum can also add something different to the usual 4-inch potted plant sales mix (3). Two production programs are employed in the spring production of chrysanthemums: 1) no controlled photoperiod or no supplementary light and no shade (black cloth) and 2) controlled photoperiod or supplementary lighting and shading (black cloth). No light/no shade programs are simpler, and much more economical but can only be used up to Mother’s Day. Cultivar selection is critical for no light/no shade programs because not all cultivars are suitable for this type of production (1). Cultivar evaluations of chrysanthemums in the fall landscape exist (4), however no evaluations are available for spring no light/no shade production in Alabama. The purpose of the present investigation was to evaluate the growth of some recently introduced garden chrysanthemums for spring sales in 4-inch pots using a no light/no shade program.
Rooted cuttings (one per pot) of the chrysanthemum cvs. Allure (1988 introduction), Hekla (1989-90), Illusion (1988-89), Naomi (1990-91), Stardom (1973, a standard), and Sunny Morning (1989-90) were potted into 10 cm (4-inch) plastic pots containing 1 pine bark:l composted peat:l perlite medium on February 9. Plants were grown in full sun at 17C (62°F) minimum night temperature in a glasshouse. Standard commercial culture for spring production of chrysanthemums was used (6). Fertiliza-tion consisted of liquid 20-10-20 (20N-4.4P-16.6K) Peters Peatlite liquid fertilizer (W.R. Grace, Inc., Fogelsville, PA) at the rate of 2.2 g per liter or 2 lb per 100 gal. every 2 weeks. No supplementary light for vegetative growth or artificial reduction in daylength for flower initiation and development was used. Plants were pinched on February 23 and a 2,500 ppm daminozide (B-Nine™, Uniroyal Chemical, Bethany, CT) spray was applied to the foliage of the plants until runoff when the emerging shoots were 5 cm (2-inches) long. Ten pots of each cultivar were arranged in a randomized complete block design. When half of the flowers on a plant were open, the plant height and area (diameter of the plant in two directions), number of flowers per plant and a quality rating were measured. Plant quality was rated: 0 = dead, 1 = very poor, totally unsalable; 2 = poor, some salable; 3 = average, good salable; 4 = above average, very good, salable; and 5 = excellent, salable.

"SNA RESEARCH CONFERENCE - VOL. 36-1991"
123
Results and Discussion: Most of the cultivars flowered around April 17. The six cultivars did not differ in plant area (data not shown). With the exception of ‘Hekla’, most of the cultivars were within a cm (1/2-inch) of the one and half the height of container criterion for acceptable plant height (5). ‘Hekla’ plants were taller than the other plants. ‘Hekla’ plants produced more flowers than the other cultivars. ‘Hekla’, ‘Illusion’, and ‘Naomi’ were rated superior in quality to ‘Stardom’ plants (a cultivar that has been highly rated for 18 years by the author). Allure ‘ plants were comparable in height and flower number to ‘Stardom’ plants but were rated lower ( 3.5 vs 4.O ). ‘ Sunny Morning ‘ plants were rated poor.
Significance to Industry: This research reveals that the recently introduced cvs. ‘Hekla’, ‘Illusion’ and ‘Naomi’ are superior cultivars for no light/no shade production as 4-inch potted plants in the spring, ‘Stardom’ and ‘Allure’ plants are also acceptable, however ‘Sunny Morning’ plants were rated poor.
Literature Cited
1. Ball, V. (ed. ). 1985. The Ball Red Book. 14th ed. Reston Publishing Co. Reston, VA. 720 p.
2. Crater, G. D. 1980. Pot mums. p. 285 Chapter 10. In: R. A. Larson (ed.). Introduction to floriculture. Academic Press. New York, NY.
3. McAvoy, R. J. 1991. Back to basics: 4" pot production. Conn. Greenhouse Newsletter. April. p. 7-12.
4. Martin, W. C., Jr. and H. P. Orr. 1972. Evaluation of garden chrysanthemums for Alabama. Auburn Univ. Agric. Exp. Sta. Circ . 2 02 .
5 . Sachs , R. M., A. M. Kofranek, and W. P. Hackett . 1976 . Evaluating new plant species. Florist Rev. 159 (4116) :35-36, 8 0-84 .
6. Yoder, G. R. (ed.). 1990. Yoder products for 1989-90. Yoder Brothers. Bar-berton, OH. 79 p.
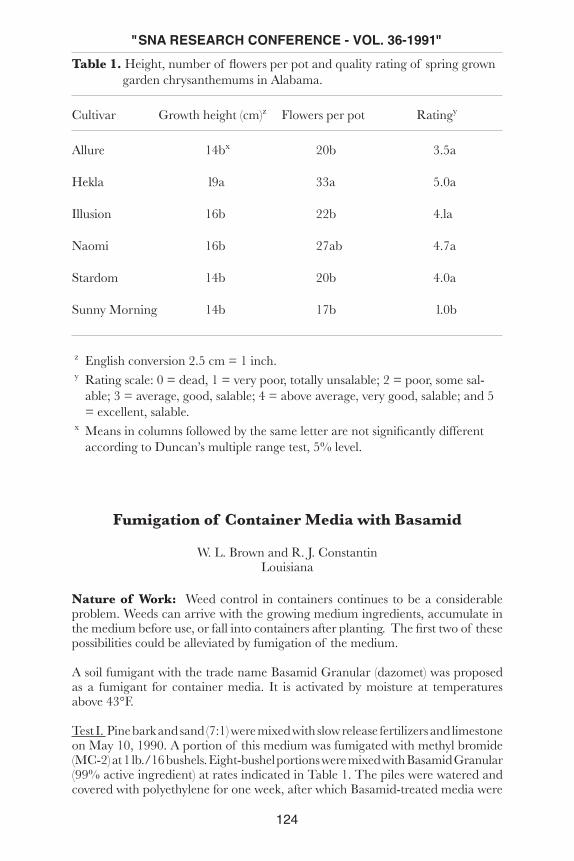
"SNA RESEARCH CONFERENCE - VOL. 36-1991"
124
Table 1. Height, number of flowers per pot and quality rating of spring grown garden chrysanthemums in Alabama.
Cultivar Growth height (cm)z Flowers per pot Ratingy
Allure 14bx 20b 3.5a
Hekla l9a 33a 5.0a
Illusion 16b 22b 4.la
Naomi 16b 27ab 4.7a
Stardom 14b 20b 4.0a
Sunny Morning 14b 17b l.0b
z English conversion 2.5 cm = 1 inch. y Rating scale: 0 = dead, 1 = very poor, totally unsalable; 2 = poor, some sal-
able; 3 = average, good, salable; 4 = above average, very good, salable; and 5 = excellent, salable.
x Means in columns followed by the same letter are not significantly different according to Duncan’s multiple range test, 5% level.
Fumigation of Container Media with Basamid
W. L. Brown and R. J. ConstantinLouisiana
Nature of Work: Weed control in containers continues to be a considerable problem. Weeds can arrive with the growing medium ingredients, accumulate in the medium before use, or fall into containers after planting. The first two of these possibilities could be alleviated by fumigation of the medium.
A soil fumigant with the trade name Basamid Granular (dazomet) was proposed as a fumigant for container media. It is activated by moisture at temperatures above 43°F.
Test I. Pine bark and sand (7:1) were mixed with slow release fertilizers and limestone on May 10, 1990. A portion of this medium was fumigated with methyl bromide (MC-2) at 1 lb./16 bushels. Eight-bushel portions were mixed with Basamid Granular (99% active ingredient) at rates indicated in Table 1. The piles were watered and covered with polyethylene for one week, after which Basamid-treated media were

"SNA RESEARCH CONFERENCE - VOL. 36-1991"
125
turned with a shovel and left uncovered without water added. Temperature of the media during the week of fumigation ranged from 80 to 85°F.
Liners of boxwood, ‘Fashion’ azalea, ‘Blue Point’ juniper, and ‘Elizabeth’ raphiolepis were transplanted to 3-quart containers containing the prescribed media May 21-22. The Ronstar treatment consisted of a surface application one day after planting.
Test II. In response to the apparent need for more thorough removal of the fumigant from the medium before planting, a second test was initiated. A growth medium identical to that used in Test I was mixed on July 6, 1990. Basamid Granular was mixed with portions of this mix at 0.5 lb./cu. yd. These portions were covered with polyethylene within one-half hour of mixing. Moisture content of the bark at the time of mixing was determined to be 49.3% by weight. Treatments were:
1) No Basamid added. Used one week after mixing.2) Basamid treated (0.5 lb./cu. yd.). Covered with polyethylene one week.
Used for potting after another week without further handling.3) Treated and covered as for Treatment 2. Remixed for five minutes
in a rotary mixer on day of uncovering. Used same day.4) Treated, covered, and remixed as for Treatment 3. Used after three
days.5) Treated, covered, and remixed as for Treatment 3. Used after one
week.A) No water added during initial mixing.B) Water added during initial mixing (0.5 gal./bushel).
A Treatment 6A was added for raphiolepis only. This consisted of treating, cover-ing, and remixing as for Treatment 3 and using two weeks after remixing.
Results and Discussion: Test I. Weed counts made five and nine weeks after potting are summarized in Table 1. The only treatment that reduced the total number of weeds present five weeks after potting was the application of Ron-star. Basamid failed to reduce the number of grass seedlings and appears to have stimulated the growth of broadleaf weeds. Only sedges were reduced by Basamid treatments. Failure of fumigation treatments to reduce number of weeds was even more apparent nine weeks after potting.
As shown in Table 2, the medium and high rates of Basamid reduced quality ratings of azalea, juniper, and raphiolepis below those of all other treatments. Size ratings, which are not shown, followed the same pattern. Methyl bromide fumigation resulted in higher ratings of boxwood than the checks. of the 20 plants per treatment, one raphiolepis plant with the low rate of Basamid, nine with the medium rate, and eight with the high rate were dead by September.
Test II. Response to treatments is summarized in Table 3. Use of bark and sand medium after incorporation of Basamid, covering with plastic for one week, and ventilation for another week was satisfactory for azalea. Little or no difference resulted from additional water at the time of fumigant incorporation. Likewise, remixing at the time the plastic cover was removed made little or no difference. Ventilation for less than a week was not satisfactory.

"SNA RESEARCH CONFERENCE - VOL. 36-1991"
126
Ventilation for a week was not generally satisfactory for raphiolepis. However, when water was added at time of incorporation and remixing was not performed, only 20% mortality and a satisfactory rating of the surviving plants resulted. This was the only case in which addition of water made a large difference. The reason why these plants had low mortality and those given the same ventilation time plus remixing had a high mortality rate is not known.
Significance to Industry: Under the conditions of this experiment, Basamid did not accomplish the primary goal of weed control and was detrimental to some of the ornamentals used unless an extensive period of ventilation was provided. Methyl bromide fumigation also failed to reduce weed counts under these conditions.
Table 1. Number of weeds present in the 80 containers of each treatment, five and nine weeks after planting.
Number of weeds removed 6/26/90 7/23 Broad-Treatment Rate leaf Grass Sedge Total Total
Check 40 16 39 95 26Ronstar 2G 150 lbs./A 3 2 5 10 11MC-2 1.37 lbs./yd.3 90 7 2 99 37Basamid 0.25 lb./yd.3 81 10 3 94 50Basamid 0.50 lb./yd.3 62 13 0 75 46Basamid 0.75 lb./yd.3 93 14 1 107 51
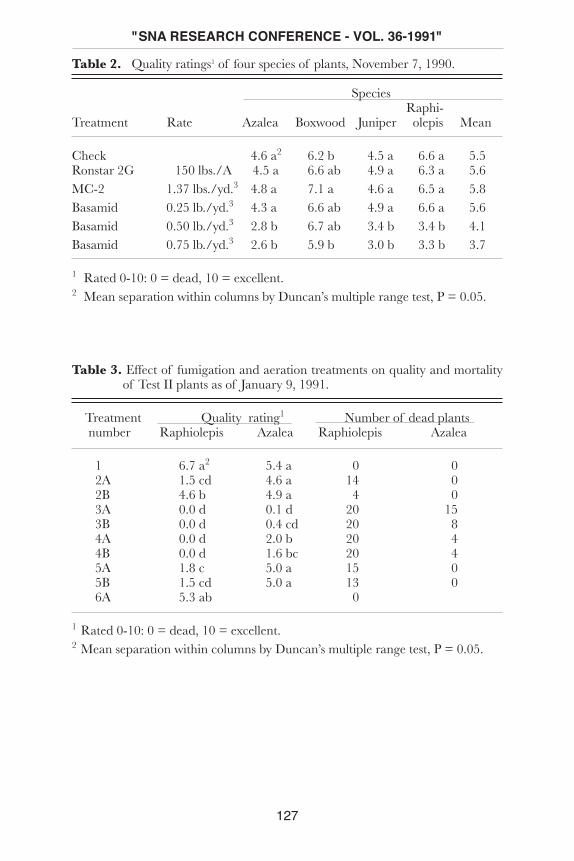
"SNA RESEARCH CONFERENCE - VOL. 36-1991"
127
Table 2. Quality ratings1 of four species of plants, November 7, 1990.
Species Raphi-Treatment Rate Azalea Boxwood Juniper olepis Mean
Check 4.6 a2 6.2 b 4.5 a 6.6 a 5.5Ronstar 2G 150 lbs./A 4.5 a 6.6 ab 4.9 a 6.3 a 5.6MC-2 1.37 lbs./yd.3 4.8 a 7.1 a 4.6 a 6.5 a 5.8Basamid 0.25 lb./yd.3 4.3 a 6.6 ab 4.9 a 6.6 a 5.6Basamid 0.50 lb./yd.3 2.8 b 6.7 ab 3.4 b 3.4 b 4.1Basamid 0.75 lb./yd.3 2.6 b 5.9 b 3.0 b 3.3 b 3.7
1 Rated 0-10: 0 = dead, 10 = excellent. 2 Mean separation within columns by Duncan’s multiple range test, P = 0.05.
Table 3. Effect of fumigation and aeration treatments on quality and mortality of Test II plants as of January 9, 1991.
Treatment Quality rating1 Number of dead plants number Raphiolepis Azalea Raphiolepis Azalea
1 6.7 a2 5.4 a 0 0 2A 1.5 cd 4.6 a 14 0 2B 4.6 b 4.9 a 4 0 3A 0.0 d 0.1 d 20 15 3B 0.0 d 0.4 cd 20 8 4A 0.0 d 2.0 b 20 4 4B 0.0 d 1.6 bc 20 4 5A 1.8 c 5.0 a 15 0 5B 1.5 cd 5.0 a 13 0 6A 5.3 ab 0
1 Rated 0-10: 0 = dead, 10 = excellent. 2 Mean separation within columns by Duncan’s multiple range test, P = 0.05.
"SNA RESEARCH CONFERENCE - VOL. 36-1991"
128
Growth Response of Pieris floribunda asInfluenced by Temperature and Photoperiod
Mark C. Starrett, Frank A. Blazich, and Stuart L. WarrenNorth Carolina
Nature of Work: A preliminary experiment was conducted at the Southeastern Plant Environment Laboratory (Phytotron) to study the effects of photoperiod and selected day/night temperatures on growth of Pieris floribunda (Pursh ex Sims) Benth. and Hook. (mountain andromeda). Uniform, 6-month-old seedlings were placed in controlled - environment A-chambers, (16 seedlings/chamber) maintained at 9 hr day/15 hr night temperatures of 22°/18°C (72°/64°F), 26°/22°C (79°/72°F) and 30°/26°C (86°/79°F) under both long and short day conditions (1). Long days were obtained by interruption of the 15 hr dark period from 11 p.m. - 2 a.m. with light from incandescent lamps. Plants were watered once daily and fertilized twice weekly with the standard Phytotron nutrient solution (1). After 10 weeks, the experiment was terminated and leaf area and top dry weight determined.
Results and Discussion: For each temperature, leaf area and top dry weight of plants under long day conditions was significantly greater than that of short days. Plants under short day conditions often produced an inflorescence indicating that flowering is regulated by photoperiod.
Significance to Industry: Data suggest that commercial production of P. flo-ribunda under long days may enhance leaf and shoot growth.
Literature Cited
1. Downs, R.J. and J.F. Thomas. 1991. Phytotron Procedural Manual for Controlled Environment Research at the Southeastern Plant Environment Laboratory. N.C. Agr. Res. Serv. Tech. Bul. 244. (Revised)
"SNA RESEARCH CONFERENCE - VOL. 36-1991"
129
Production of Container-Grown Firebush (Hamelia patens Jacq.)as Influenced by Growing Medium and Slow-Release Fertilizer
Tim D. Davis, Steven W. George, and Billy W. HippTexas
Nature Of Work: Firebush is a shrub native to southern Florida, the West Indies, and portions of Central and South America (3). The plant produces brilliant or-ange-red tubular flowers throughout the growing season and has attractive autumn coloration. Although the plant is highly heat-tolerant, it does not tolerate heavy freezes and, as a result, can only be used as a shrub or root-hardy perennial in the southernmost portions of the U.S. In more northern climates, firebush appears to have considerable potential as a heat-tolerant bedding plant (2).
Development and utilization of firebush as a landscape plant is hindered by lack of knowledge regarding cultural requirements for mass production. Although some information regarding firebush propagation is available (1), there is no published information on the response of firebush to growing medium and fertilizer. The objective of the research described herein was to evaluate the influence of several growing media and slow-release fertilizer rates on the growth and flowering of container-grown firebush.
Two separate greenhouse experiments were conducted. In the first experiment, rooted firebush cuttings were placed in 4-inch square pots containing: 1) Terra-Lite Metro Mix 200® (W.R. Grace, Cambridge, Mass.); 2) Redi-Earth Peat-Lite Mix® (W.R. Grace, Cambridge, Mass.); 3) peat-perlite mix (1:1 by volume); 4) pine bark-sand mix (1:1 by volume); or 5) pine bark-sand (1:1 by volume) plus dolomitic limestone at 1 g per pot. In the second experiment, rooted cuttings were placed in 4-inch pots containing Metro Mix 200 and Osmocotet® 14-14-14 (Sierra Chemi-cal Co., Milpitas, Calif.) applied to the medium surface at 0.5, 1.0, 1.5, 2.0, 3.0, or 4.0 g per pot. In an addidonal treatment, plants were given no Osmocote but were watered weekly with 100 ml (about 3.4 oz.) of a solution containing 2 1/4 tablespoons of Peter’s® Soluble 20-10-20 Fertilizer (W.R. Grace, Fogelsville, Penn.) per gallon of water. This treatment provided a total of 1.42 g N over the duration of the experiment.
Both experiments were conducted using a randomized block design. There were 5 and 10 plants per treatment in the first and second experiments, respectively.
Results and Discussion: In the first experiment, shoot dry weight was highest in Metro Mix 200 and Redi-Earth (Table 1). Plants grown in the other three media had shoot dry weights that were less than 50% of those of plants grown in Metro Mix 200 or Redi-Earth. Although the growing media had a pronounced influence on shoot dry weights, plant height was about 11-12 inches in all media except for peat-perlite where height was only about 9 inches. Thus, plants grown in Metro Mix and Redi-Earth, although not taller, were much fuller and more robust than

"SNA RESEARCH CONFERENCE - VOL. 36-1991"
130
plants grown in the other media. This further suggests, as in many other species, that height is not a good indicator of firebush response to growing medium.
All of the plants growing in Metro Mix or Redi-Earth were flowering by the end of the first experiment (Table 1). In the other media, there were some plants which had still not flowered by the end of the experiment. In addition, there were more flower clusters per plant in Metro Mix and Redi-Earth compared to the other me-dia. Taken together, the growth and flowering data indicate that Metro Mix and Redi-Earth were superior growing media for firebush. It is unclear why the other media did not produce strong, robust plants.
In the second experiment, shoot dry weight increased as the Osmocote treatrnent level increased up to 3.0 g per pot (Table 2). No further increase in dry weight occurred when the Osmocote rate was increased from 3.0 to 4.0 g per pot. The Peter’s soluble fertilizer treatment resulted in shoot dry weights that were compa-rable to the higher Osmocote treatment levels. Plant height was largely unaffected by the treatments, except at the 0.5 and 1.0 g Osmocote treatments where height was reduced.
The percentage of plants that flowered and the number of flower clusters per plant were greatest at 2.0 g Osmocote per pot or higher and with the Peter’s soluble fertilizer treatment (Table 2). In addition, overall visual ratings were highest in these treatments. These data suggest that 2.0-3.0 g Osmocote per pot is needed to produce good quality firebush plants in 4-inch pots with Metro Mix. Osmocote rates at 3.0-4.0 g per pot will not likely provide any additional benefits. Weekly feeding with Peter’s soluble fertilizer produced good quality plants but is more laborious and may result in nitrate runoff.
Significance to the Industry: Firebush is a potentially valuable landscape plant for the southern U.S. but little information is available on the cultural requirements of this species. The present investigation indicates that both Metro Mix and Redi-Earth are good growing media for greenhouse production of firebush in 4-inch pots. Other media tested thus far have not been satisfactory. Osmocote 14-14-14 applied to the growing medium surface at 2.0-3.0 g per pot yielded good quality plants. Lower Osmocote rates resulted in reduced growth and flowering whereas rates higher than 3.0 g per pot provided no additional benefits.
Literature Cited
1. Davis, T.D., S.W. George, A. Upadhyaya, and J. Parsons. 1990. Propagation of firebush (Hamelia patens Jacq.) by stem cuttings. J. Environ. Hort. 9: (in press).
2. Salee, K. 1990. Texas firebush takes the heat. Nursery Manager 6(5): 64, 66-69.

"SNA RESEARCH CONFERENCE - VOL. 36-1991"
131
3. Standley, P.C. 1926. Contributions from the United States National Herbarium, Volume 23: Trees and Shrubs of Mexico. U.S. Govt. Printing Office, Wash-ington, D.C.
Table 1. Dry weight, height, and flowering of firebush plants grown in various media. Plus/minus values indicate standard error of the mean.
Media
Parameter Metro Redi-Earth Peat-Perlite Pine PineBark- Mix 200 Bark-Sand Sand+lirne
Dry wt. shoots (g) 8.7 + 0.7 8.3 + 0.6 3.1 + 0.3 3.6 + 0.3 4.0 + 0.7
Plant height (in.) 11.6 + 0.8 12.2 + 0.7 8.7 + 1.1 11.3 + 0.8 11.7 + 1.3
% of plants flowering 100 100 60 40 80
no. flowerclusters/plant 6.4 + 0.5 4.8 + 0.8 2.0 + 0.7 1.4 + 0.2 1.8 + 0.9
Table 2. Dry weight, height, flowering and visual rating of plants grown in Metro Mix with varying levels of Osmocote 14-14-14 or with Peter’s soluble fertilizer. Plus/minus values indicate standard error of the mean.
Osmocote treatment (g/pot) Peter’sParameter 0.5 1.0 1.5 2.0 3.0 4.0 soluble fertilizer
Dry wt. 2.8 + 0.2 5.2 + 0.3 6.5 + 0.3 6.6 + 0.3 7.9 + 0.5 6.9 + 0.4 6.8 + 0.6shoots (g)
Plant 7.2 + 0.5 9.1 + 0.4 10.4 + 0.7 10.7 + 0.7 11.2 + 0.6 10.5 + 0.6 10.8 + 0.5ht. (in.)
% of plants 20 50 60 80 70 70 70flowering
no. flowerclusters/ 0.4 + 0.3 1.2 + 0.6 1.1 + 0.4 2.9 + 0.8 2.3 + 0.7 3.6 + 1.2 2.8 + 0.9plant
Overall visual 3.3 + 0.4 4.7 + 0.3 5.9 + 0.4 6.6 + 0.4 7.4 + 0.3 7.5 + 0.4 7.2 + 0.4rating (0-10)**0 = poor quality, 10 = excellent quality.

"SNA RESEARCH CONFERENCE - VOL. 36-1991"
132
Influence of Root-Zone Temperature and Elevated CO2 Concentrations on CO2 Assimulation Rates of
‘Rotundifolia’ Holly
John M. Ruter and Dewayne L. IngramGeorgia and Kentucky
Nature of Work: Supraoptimal root-zone temperatures, which occur in con-tainer-grown plants in the southeastern United States, are known to influence vari-ous physiological and biochemical processes of Ilex crenata ‘Rotundifolia’ (2,7,8). Elevated CO2 concentrations are known to partially alleviate the effects of high temperature stress in higher plants (3). Much research has been conducted in re-cent years to evaluate the effects of elevated CO2 concentrations and the potential effects of global warming on plant productivity and yield (3,6). This research was conducted to determine if short-term exposure of ‘Rotundifolia’ holly to elevated C02 concentrations influenced C02 assimilation rates during exposure to supraop-timal root-zone temperatures.
Plants were grown in a 10 by 12 ft. walk-in growth room with irradiance supplied by twelve 1000-W phosphor-coated, metal arc HID lamps (GTE Sylvania Corp., Manchester, NH). Photosynthetic photon flux was 850+50 µmol•s-1 •m-2 at canopy height measured with a quantum radiometer (LI-COR Inc., Lincoln, NE). The photoperiod was 13 hr daily (0800 to 2100 HR) with the dark period being inter-rupted (2200 to 0100 HR) for 3 hr with incandescent light. Air temperatures and relative humidity, respectively, were maintained at 28±1C and 40% during the light period and 21±1°C and 90% during the dark period.
Root-zone temperature treatments of 30 (85), 34 (93), 38 (100) and 42C (108F) were maintained within ±l°C for 6 hr daily for 21 days using an electronically controlled root-heating system (5). Plants were arranged in a randomized complete block design with 4 root-zone temperatures and 4 replicate plants.
CO2 assimilation rates were measured in the laboratory using a portable photosyn-thesis system (LI-6200, LI-COR Inc., Lincoln, NE) in closed mode, thus allowing the plant canopy to decrease the CO2 concentration (1). Due to the small size of ‘Rotundifolia’ holly leaves, canopy CO2 assimilation rate measurements were made using a specially designed 7.1 liter plexiglass chamber, which when mounted to the LI-COR sensing unit, allowed for the enclosure of the entire shoot canopy while the root system was excluded. A high pressure sodium vapor lamp (Lumalux 400W, GTE Sylvania, Inc., Manchester, NH) was used to provide a photosynthetic photon flux of 1100±25 µmol•s-1•m-2 at canopy height. Measurements began at 700 µL C02 •1iter -1 with final measurements being made at 350 µL CO2 •1iter -1. CO2 assimilation measurements were replicated 3 times in CO2 draw-down increments of 5µL C02 • liter -1. Total measurement time per plant was approximately 45 minutes. Air temperature within the chamber was maintained at 29±1°C (84°F) during the course of the experiment.

"SNA RESEARCH CONFERENCE - VOL. 36-1991"
133
Results and Discussion: CO2 assimilation rates at all root-zone temperatures showed significant linear and quadratic responses to increasing CO2 concentrations (Table 1). Below 550µL CO2 liter-1 , CO2 assimilation rates at root-zone tempera-tures of 30C (85F) were not different from 34°C (93°F). At or above 550 µL CO2 liter-1 , CO2 assimilation rates at 34°C (93°F) were greater than the other root zone temperature treatments. No differences in CO2 assimilation rates were detected between the 30 (85), 38 (100) and 42C (108F) root-zone temperature treatments at any CO2 concentration.
CO2 assimilation rates can respond to elevated CO2 concentrations in a matter of seconds (6). ‘Rotundifolia’ holly responded to changes in CO2 concentration; however, root-zone temperature had little effect on CO2 assimilation rates. Since root-zone temperatures above 38°C (lOO°F) are commonly seen in container-grown holly (4), an increase in atmospheric CO2 concentrations may not alleviate stress induced by supraoptimal root-zone temperatures.
Significance to Industry: Increasing CO2 concentrations in the environment decrease negative physiological effects associated with high air temperatures. The results of our study indicate that short-term exposure of ‘Rotundifolia’ holly to elevated CO2 concentrations was not beneficial when plants were exposed to root-zone temperatures above 34°C (93°F).
Literature Cited
1. Davis, J.E., T.K. Arkebauer, J.M. Norman and J.R. Brandle. 1987. Rapid field measurement of the assimilation rate versus internal CO2 concentration rela-tionship in green ash (Fraxinus pennsylvanica Marsh.): the influence of light intensity. Tree Physiol. 3:387-392.
2. Foster, W.J., D.L. Ingram and T.A. Nell. 1991. Photosynthesis and root respi-ration in Ilex crenata ‘Rotundifolia’ at supraoptimal root-zone temperatures. HortScience 26:535-537.
3. Idso, S.B. 1989. Carbon dioxide and global change:earth in transition. IBR Press, Tempe, AZ.
4. Ingram, D.L., C. Martin and B. Castro. 1988. Container spacing treatments influence temperature fluctuations and holly growth. Proc. Fla. State Hort. Soc. 101:328-331.
5. Ingram, D.L., B.H. Basford, W.J. Foster and C. Ramcharan. 1990. Electronically controlled root heating tubes. HortScience 25:693-694.
6. Mooney, H.A., B.G. Drake, R.J. Luxmoore, W.C. Oechel and L.F. Pitelka. 1991. Predicting ecosystem responses to elevated CO2 concentrations. BioScience 41:96-104.

"SNA RESEARCH CONFERENCE - VOL. 36-1991"
134
7. Ruter, J.M. and D.L. Ingram. 1990. Carbon-labelled photosynthate partitioning in Ilex crenata ‘Rotundifolia’ at supraoptimal root-zone temperatures. J. Amer. Soc. Hort. Sci. 115:1008-1113.
8. Ruter, J.M. and D.L. Ingram. 1991. The effect of supraoptimal temperatures on root respiratory characteristics of ‘Rotundifolia’ holly. J. Amer. Soc. Hort. Sci. 116:560-564.
Table 1. Influence of root-zone temperatures on CO2 assimilation rates of ‘Ro-tundifolia’ holly at different CO2 concentrations.
[CO2] Root-zone temperature(µL CO2 • liter-1 ) 30C 34C 38C 42C
(85F) (93F) (l00F) (108F) CO2 assimilation rate (µmol C02 • s
-1 • m-2)
350 14.6 15.0 13.2 13.2
400 16.1 17.0 15.1 14.8
450 17.8 20.2 16.8 16.9
500 19.1 21.8 18.2 18.2
550 19.9 23.3 19.4 19.1
600 20.5 24.2 20.3 20.0
650 21.0 25.2 21.0 20.9
700 21.6 25.4 21.4 21.4
SignificanceLinear **z ** ** **
Quadratic ** ** ** **
R2 0.99 0.99 0.99 0.99
z Significant at PR>F=0.0l.

"SNA RESEARCH CONFERENCE - VOL. 36-1991"
135
Response of ‘Delaware Valley White’ Azalea to Preplant Nitrogen Amendments
Tom Yeager, Fred May, Claudia Larsen and Matt JenksFlorida
Nature of Work: Amending soilless container media with slow-release nitrogen fertilizer is a common nursery practice. Preplant amendments are an economical means of providing nitrogen and other essential elements for plant growth. Soil-less organic substrates are also amended with nitrogen to compensate for nitrogen drain or draft that may occur when fresh pine bark is used as a component of the substrate. Cobb and Keever (1) determined that growth of Euonymus japonica ‘Microphylla’ and llex crenata ‘Compacta’ in fresh pine bark was more than in aged pine bark when both barks received 0 to 300 ppm nitrogen weekly and a preplant amendment of Osmocote 17-7-12 at 10 lb/cubic yard. Whitcomb and Appleton (4) reported similar findings with birch, pyracantha and nandina grown in fresh or aged pine bark amended with Osmocote 17-7-12 with or without supplemental nitrogen from urea. Matkin (3) utilized fresh white fir bark and Douglas fir saw-dust amended with IBDU or urea-formaldehyde at 1 to 4 Ib/cubic yard and had the most Manhattan ryegrass growth at the 4 Ib rate of urea-formaldehyde. The purpose of our study was do determine if preplant isobutylidene diurea (IBDU) or urea-formaldehyde amendments resulted in additional growth if fresh pine bark was used as a component of the substrate and plants were grown with a solution fertilization program.
Two hundred fifty-two multiple branched liners of ‘Delaware Valley White’ azaleas were potted May 23, 1990 with a growth medium composed by volume of 66% fresh pine bark, 21% coarse sand and 13% Canadian peat in trade one-gallon containers. Pine bark had a 290:1 carbon to nitrogen ratio. Micronutrients were provided in Pip ll (Graco Fertilizer Company, Cairo, GA 31728) at 5.3 lb/ cubic yard, iron sulfate (31%) at 1.12 lb/ cubic yard, copper sulfate at 0.001 lb/ cubic yard, potassium sulfate at 0.5 lb/ cubic yard, single superphosphate at 2.6 lb/ cu-bic yard and dolomitic limestone at 4.6 lb/ cubic yard. Plants were arranged in a randomized complete block design with 21 treatments in 6 blocks and 2 replicate plants per block. Treatments are listed in Table 1 and included preplant amend-ments of either extra coarse (2.5 - 3.5 mm), fine (0.5 -1 mm) or coarse (1.4 - 2.7 mm) isobutylidene diurea (EC-IBDU, F-IBDU, or C-IBDU, respectively, Estech Branded Fertilizers, Winter Haven, FL, 33882) or urea-formaldehyde (UF, Blue Chip, Nor-am Chemical Company, Wilmington, DE 19803). A control treatment did not receive urea-formaldehyde or IBDU. Plants were grown under 30% shade at May Nursery Co., Havana, Florida. Irrigation ( 0.5 inch/application) was supplied as needed by overhead irrigation and 100 ppm nitrogen from a 10-0-6 solution fertilizer was applied in the irrigation water 3 times per week during the growing season. Each plant received 1 teaspoon (12.3 9) of granular Graco Perma-green 13-6-6 nursery fertilizer (Graco Fertilizer Company) in December 1990.

"SNA RESEARCH CONFERENCE - VOL. 36-1991"
136
Leachates were collected (5) from 2 replicate plants for each treatment of one block on July 12 and November 19,1990, and March 5,1991. Leachate pH, soluble salts, and nitrate and ammonium nitrogen were determined by standard analyses (2). On April 8, 1991, an average of 5 plants per treatment was rated based on overall quality by 28 people associated with the nursery industry and the height and 2 widths perpendicular to each other were determined. A ranking of the treatments was tabulated based on averages of the ratings and a growth index was calculated from adding height and average width.
Results and Discussion: Plants grown with a urea-formaldehyde amendment at 8 lb/cubic yard were ranked the highest (Table 1) and had the third highest growth index (95.2). Plants grown in the medium amended with 19.6 lb/cubic yard of EC-IBDU had the highest growth index (97.6), but were ranked 16th. Thirteen treatments had growth indices that were numerically higher than the control and 8 treatments were rated better than or equal to the control. Four of the 8 treatments were urea-formaldehyde amendments of 2, 8, 12 and 16 lb/cubic yard. EC-IBDU at 9.8 and 14.7 lb/cubic yard and F-IBDU at 2.5 and 4.9 lb/cubic were also ranked higher than the control, but the growth index for the EC-IBDU amendment at 9.8 Ib/cubic yard and the 2.5 lb/cubic yard rate of F-IBDU was less than the control. The 4.9 lb/cubic yard treatment of F-IBDU was ranked 7th. These findings gener-ally concur with Cobb and Keever (1) who reported more plant growth in a fresh pine bark medium supplemented with nitrogen than in a fresh pine bark medium without supplemental nitrogen.
Six plants from the 19.6 lb/cubic yard treatment of F-IBDU were dead at the time of first leachate collection, July 12, 1990. This was presumed to be due to a rapid release of nitrogen due to the fine particle size, but was not substantiated by the 0.5 mmhos/cm or dS/m soluble salts reading for this treatment at the time of leachate collection. Leachate soluble salts ranged from 0.7 mmhos in July for the 16 lb/cubic yard rate of urea-formaldehyde to less than 0.1 mmhos for all the treatments in March. Leachate ammonium nitrogen was less than 1 ppm for all treatments in July and March, and the highest ammonium nitrogen level in November was 8 ppm for the 16 lb/cubic yard urea-formaldehyde treatment. Leachate nitrate nitrogen levels ranged from 38 ppm for the 16 Ib/cubic yard urea-formaldehyde amendment in July to less than 3 ppm for all treatments in March. Leachate pH ranged from 6.0 to 7.2 during the experiment.
Significance to Industry: These data indicate that urea-formaldehyde or IBDU can be used as preplant amendments when utilizing fresh pine bark and a solution fertilization program. Plants grown with a urea-formaldehyde amendment of 8 Ib/cubic yard were rated the highest and those grown with 4.9 Ib/cubic yard of the fine IBDU and 14.7 Ib/cubic yard extra coarse IBDU had higher ratings and growth indices than plants without a nitrogen amendment. Plants grown without a preplant nitrogen amendment were ranked 8th and those grown with 4.9 lb/cu yard of fine IBDU were ranked 7th out of 21 treatments.

"SNA RESEARCH CONFERENCE - VOL. 36-1991"
137
Literature Cited
1. Cobb, G.S. and G.J. Keever. 1984. Effects of supplemental N on plant growth in fresh and aged pine bark. HortScience 19(1):127-129.
2. Hanlon, E., G. Kidder and B. McNeal. 1990. Soil, container media, and water testing; interpretations and IFAS standardized fertilization recommendations. University of Florida Extension Cir. 817.
3. Matkin, O.A. 1979. Efficiency of two slow release nitrogen sources with two raw wood residuals. The Plant Propagator 25(1) 14.
4. Whitcomb, C.E. and B.L. Appleton. 1985. Effect of pine bark age, starter nitrogen, and activated charcoal on growth of plants in containers. J. Environ. Hort. 3(2):69-71.
5. Yeager, T. H., R. D. Wright and S. J. Donohue. 1983. Comparison of pour-through and saturated pine bark extract N, P, K and pH levels. J. Amer. Soc. Hort. Sci. 108(1):112-114.
Florida Agricultural Experiment Stations Journal Series No. N-00419 The authors appreciate companies supplying fertilizers. Trade names and companies are men-tioned with the understanding that no discrimination is intended nor endorsement implied.

"SNA RESEARCH CONFERENCE - VOL. 36-1991"
138
Table 1. ‘Delaware Valley White’ azaleas were grown for 10 months in a 66% fresh pine bark, 21% coarse sand and 13% Canadian peat (by volume) container medium amended with extra coarse IBDU (EC-IBDU), fine IBDU (F-IBDU), coarse IBDU (C-IBDU), urea-formaldehyde (UF) or no amendment (CONTROL).
Fertilizer lb/ cubic yard Ranking Growth (1 =best)
index
EC-IBDU 2.5 19 80.3F-IBDU 2.5 4 86.8C-IBDU 2.5 12 86.1UF 2.0 0.8 Ib of N 5 89.3
EC-IBDU 4.9 18 88.8F-IBDU 4.9 7 97.1C-IBDU 4.9 15 93.1UF 4.0 1.5 lbs of N 10 88.4
EC-IBDU 9.8 3 86.0F-IBDU 9.8 20 90.6C-IBDU 9.8 17 93.1UF 8.0 3.0 1bs of N 1 95.2
EC-IBDU 14.7 2 92.7F-IBDU 14.7 1 0 75.6C-IBDU 14.7 14 86.1UF 12.0 4.5 lbs of N 8 92.4
EC-IBDU 19.6 16 97.6F-IBDU 19.6 21 73.3C-IBDU 19.6 13 87.9UF 16.0 6.0 lbs: N 6 907
CONTROL 0.0 8 86.7
"SNA RESEARCH CONFERENCE - VOL. 36-1991"
139
Influence of High Temperature and Exposure Timeon Nitrification in a Pine Bark Medium
Ronald F. Walden and Robert D. WrightVIRGINIA
Nature of Work: Woody plant growth and nutrient composition can be signifi-cantly influenced by the ionic form of nitrogen in the root environment (2,5,7). When predominantly ammoniacal N sources are used to fertilize container-grown plants, the NH4-NO3 ratio in the medium solution is largely determined by the rate of nitrification, that is, the biological conversion of NH4-N to NO3-N. Nitrification is influenced by several factors, including medium temperature (1). In a pine bark medium, a constant temperature of 68° or 86°F promoted rapid nitrification, while continuous exposure to 104°F significantly inhibited nitrification (6).
In southern nurseries, the growth and quality of container-grown plants can be limited by the supraoptimal medium temperatures which result from heat gain due to solar radiation on the sidewalls of dark colored containers. Medium temperatures can exceed 104°F for up to 6 hours, while portions of the container may exceed 122°F for as much as 2 hours (3,4). Temperatures of this magnitude may inhibit nitrification, thereby raising the level of NH4-N in the medium solution of plants fertilized with ammoniacal N sources. Heat-induced ammonia toxicity has been proposed as one of the factors contributing to summer heat stress of container-grown plants (8). The purpose of this research was to determine the effect of high temperature and exposure time on nitrification in a pine bark medium.
Twenty-four 1 quart polyethylene containers, filled with limestone amended pine bark (pH 5.9), were placed in each of 5 temperature controlled chambers maintained at 82°, 93°, 104°, 115°, and 126°F. A population of nitrifiers had been established in the pine bark prior to the initiation of temperature treatments during a 90 day preincubation procedure (6). The containers in each chamber were gradually heated to their respective chamber temperatures over a period of about 4 hours. Five containers were then removed from each chamber at intervals of 1, 2, 4, and 6 hours after reaching the chamber temperature. Container medium temperatures were monitored with a datalogger by means of copper-constantan thermocouples placed in the center of the medium in five containers per chamber.
Following removal from a chamber, the containers were held in a room with a day/night temperature of 82°/70°F. The containers equilibrated to room temperature over approximately 5 hours. This sequence was repeated every 24 hours using the same 5 containers for each temperature by exposure time treatment combination. This gradual heating and cooling of the container medium to and from a peak temperature each day approximates patterns of heating and cooling observed in nursery containers during the summer months (3,4). The 4 containers remaining in each chamber received a 24 hour daily exposure to the chamber temperature.

"SNA RESEARCH CONFERENCE - VOL. 36-1991"
140
Prior to their initial placement in the chambers, containers were irrigated with 200 ml of a nutrient solution containing 200 ppm N as (NH4)2SO4, 10 ppm P as H3PO4, and 25 ppm K as KCl. After 2 hours drainage, an initial weight was recorded for each container. All containers were brought back to this initial weight by the addi-tion of distilled water at the beginning of each 24 hour period. This was intended to keep medium moisture levels above that which might inhibit nitrification.
Every 5 days, the medium solution of each container was extracted by the VTEM pour through procedure (9), 2 hours after bringing containers back to their initial weight. Containers were then fertilized with 200 ml of the nutrient solution, drained for 1 hour, and returned to the temperature controlled chambers. This procedure was followed for 20 days, resulting in 4 extraction dates over the course of the ex-periment. Extracts were analyzed for NH4
+ and NO3- by ion selective electrode.
Results and Discussion: The pattern of interaction between temperature and daily exposure duration on the level of NH4-N in medium extracts was quite similar for all extraction dates. Representative data from day 15 is presented in Figure 1. Treatment temperature of at least 104°F with a daily exposure duration greater than 6 hours was necessary to inhibit nitrification, thereby increasing NH4-N con-centration in the medium solution. Similar increase in NH4-N was found for a 2 hour/day exposure to 115°F, with further increases at longer exposure times. The maximum level of NH4-N concentration in medium extracts was found after a 1 hour/day exposure to 126°F. Decreases in the levels of medium solution NO3-N generally correspond with the increases in NH4-N ( Figure 2 ), consistent with an inhibition of nitrification.
Significance to Industry: These results indicate that the patterns of container medium temperature often observed in southern nurseries in mid-summer are capable of inhibiting nitrification, thereby increasing the ratio of NH4-N to NO3-N in the medium solution of plants fertilized with predominantly ammoniacal N. Nurserymen should adopt cultural practices which prevent container media temperatures from exceeding 104°F when producing plants which might be sensi-tive to elevated levels of NH4-N. Alternatively, growers should use fertilizers that contain no more than 50 % NH4-N during mid-summer.
"SNA RESEARCH CONFERENCE - VOL. 36-1991"
141
Literature Cited
1. Alexander, M. 1977. Introduction to soil microbiology, 2nd ed. Wiley, New York.
2. Chrustic, G.A. and R. D. Wright. 1983. Influence of liming on holly, azalea, and juniper growth in pine bark. J. Amer. Soc. Hort. Sci. 108:791-795.
3. Ingram, D.L. 1981. Characterization of temperature fluctuations and woody plant growth in white poly bags and conventional black containers. HortScience 16:762-763.
4. Martin, C.A. and D.L. Ingram. 1988. Temperature dynamics in black poly containers. SNA Res. Conf. Proc. 33:71-74.
5. Niemiera, A.X. and R.D. Wright. 1986. Influence of nitrification on the me-dium solution and growth of azalea, holly, and juniper in a pine bark medium. J. Amer. Soc Hort. Sci. 111:708-712.
6. Niemiera, A.X. and R.D. Wright. Influence of temperature on nitrification in a pine bark medium. 1987. HortScience 22:615-616
7. Walden, R.F. and G. Epelman. 1988. Influence of liming rate on growth of Japanese boxwood in pine bark media. SNA Res. Conf. Proc. 33:52-57.
8. Walden, R.F., R.D. Wright, and A.X. Niemiera. 1989. Heat induced ammonia toxicity of container-grown nursery crops. SNA Res. Conf. Proc. 34:80-83. 9.
9. Wright, R.D. 1987. The Virginia Tech liquid fertilizer system for container grown plants. Virginia Tech College of Life Sciences Information Series 86-5:1-20.
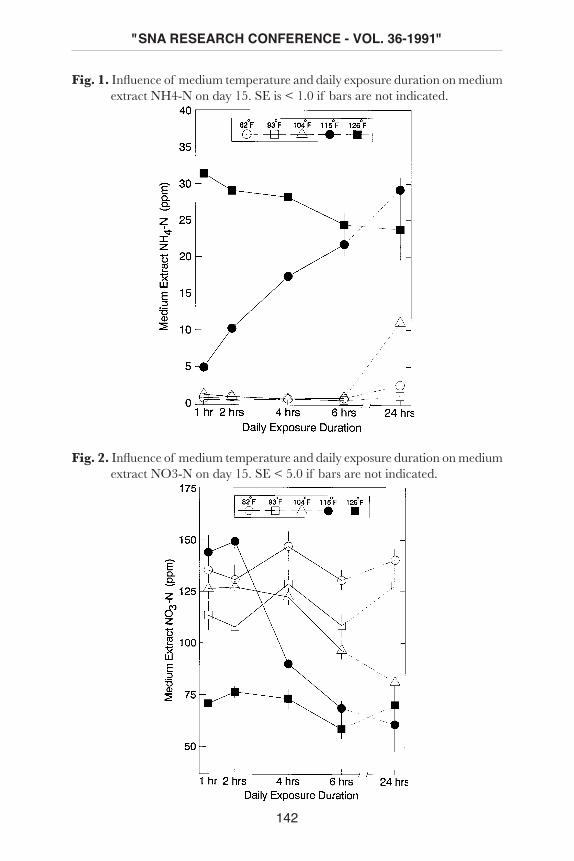
"SNA RESEARCH CONFERENCE - VOL. 36-1991"
142
Fig. 1. Influence of medium temperature and daily exposure duration on medium extract NH4-N on day 15. SE is < 1.0 if bars are not indicated.
Fig. 2. Influence of medium temperature and daily exposure duration on medium extract NO3-N on day 15. SE < 5.0 if bars are not indicated.