Secretagogin expression delineates functionally ... et al 2016 eLife.pdfDOI: 10.7554/eLife.16088.001...
36
*For correspondence: peter. [email protected] (PJM); [email protected] (AS) † These authors contributed equally to this work Competing interests: The authors declare that no competing interests exist. Funding: See page 31 Received: 16 March 2016 Accepted: 25 August 2016 Published: 26 September 2016 Reviewing editor: Rui M Costa, Fundac ¸a ˜ o Champalimaud, Portugal Copyright Garas et al. This article is distributed under the terms of the Creative Commons Attribution License, which permits unrestricted use and redistribution provided that the original author and source are credited. Secretagogin expression delineates functionally-specialized populations of striatal parvalbumin-containing interneurons Farid N Garas 1 , Rahul S Shah 1 , Eszter Kormann 1 , Natalie M Doig 1 , Federica Vinciati 1 , Kouichi C Nakamura 1 , Matthijs C Dorst 2 , Yoland Smith 3,4 , Peter J Magill 1 * † , Andrew Sharott 1 * † 1 Medical Research Council Brain Network Dynamics Unit, Department of Pharmacology, University of Oxford, Oxford, United Kingdom; 2 Department of Neuroscience, Karolinska Institutet, Stockholm, Sweden; 3 Yerkes National Primate Research Center, Department of Neurology, Emory University, Atlanta, United States; 4 Udall Center of Excellence for Parkinson’s Disease Research, Emory University, Atlanta, United States Abstract Corticostriatal afferents can engage parvalbumin-expressing (PV+) interneurons to rapidly curtail the activity of striatal projection neurons (SPNs), thus shaping striatal output. Schemes of basal ganglia circuit dynamics generally consider striatal PV+ interneurons to be homogenous, despite considerable heterogeneity in both form and function. We demonstrate that the selective co-expression of another calcium-binding protein, secretagogin (Scgn), separates PV+ interneurons in rat and primate striatum into two topographically-, physiologically- and structurally- distinct cell populations. In rats, these two interneuron populations differed in their firing rates, patterns and relationships with cortical oscillations in vivo. Moreover, the axons of identified PV+/ Scgn+ interneurons preferentially targeted the somata of SPNs of the so-called ‘direct pathway’, whereas PV+/Scgn- interneurons preferentially targeted ‘indirect pathway’ SPNs. These two populations of interneurons could therefore provide a substrate through which either of the striatal output pathways can be rapidly and selectively inhibited to subsequently mediate the expression of behavioral routines. DOI: 10.7554/eLife.16088.001 Introduction Interactions within and between populations of interneurons and spiny projection neurons (SPN) of striatum are critical for the expression of many basal ganglia-dependent behaviors. One major type of GABAergic striatal interneuron expresses parvalbumin (PV). Striatal PV+ interneurons can form axo-somatic synapses with SPNs (Koos and Tepper, 1999; Kubota and Kawaguchi, 2000), allowing them to powerfully inhibit SPNs of both the so-called ‘direct pathway’ and ‘indirect pathway’ (Gittis et al., 2010; Planert et al., 2010). These interneurons exhibit short-latency responses to powerful excitatory inputs from afferents originating in distinct cortical areas (Ramanathan et al., 2002; Sharott et al., 2012), providing a mechanism for rapidly stopping or delaying SPN spiking (Mallet et al., 2005) and, in turn, modulating striatal outputs. Consistent with this, physiologically- classified (putative) PV+ interneurons in striatum, often called ‘fast-spiking interneurons’ (FSIs), appear to have a specific role in ‘selecting’ motor programs, firing most intensely at the choice exe- cution/decision making point of a given task (Friedman et al., 2015; Gage et al., 2010). The Garas et al. eLife 2016;5:e16088. DOI: 10.7554/eLife.16088 1 of 36 RESEARCH ARTICLE
Transcript of Secretagogin expression delineates functionally ... et al 2016 eLife.pdfDOI: 10.7554/eLife.16088.001...

*For correspondence: peter.
[email protected] (PJM);
(AS)
†These authors contributed
equally to this work
Competing interests: The
authors declare that no
competing interests exist.
Funding: See page 31
Received: 16 March 2016
Accepted: 25 August 2016
Published: 26 September 2016
Reviewing editor: Rui M Costa,
Fundacao Champalimaud,
Portugal
Copyright Garas et al. This
article is distributed under the
terms of the Creative Commons
Attribution License, which
permits unrestricted use and
redistribution provided that the
original author and source are
credited.
Secretagogin expression delineatesfunctionally-specialized populations ofstriatal parvalbumin-containinginterneuronsFarid N Garas1, Rahul S Shah1, Eszter Kormann1, Natalie M Doig1,Federica Vinciati1, Kouichi C Nakamura1, Matthijs C Dorst2, Yoland Smith3,4,Peter J Magill1*†, Andrew Sharott1*†
1Medical Research Council Brain Network Dynamics Unit, Department ofPharmacology, University of Oxford, Oxford, United Kingdom; 2Department ofNeuroscience, Karolinska Institutet, Stockholm, Sweden; 3Yerkes National PrimateResearch Center, Department of Neurology, Emory University, Atlanta, UnitedStates; 4Udall Center of Excellence for Parkinson’s Disease Research, EmoryUniversity, Atlanta, United States
Abstract Corticostriatal afferents can engage parvalbumin-expressing (PV+) interneurons to
rapidly curtail the activity of striatal projection neurons (SPNs), thus shaping striatal output.
Schemes of basal ganglia circuit dynamics generally consider striatal PV+ interneurons to be
homogenous, despite considerable heterogeneity in both form and function. We demonstrate that
the selective co-expression of another calcium-binding protein, secretagogin (Scgn), separates PV+
interneurons in rat and primate striatum into two topographically-, physiologically- and structurally-
distinct cell populations. In rats, these two interneuron populations differed in their firing rates,
patterns and relationships with cortical oscillations in vivo. Moreover, the axons of identified PV+/
Scgn+ interneurons preferentially targeted the somata of SPNs of the so-called ‘direct pathway’,
whereas PV+/Scgn- interneurons preferentially targeted ‘indirect pathway’ SPNs. These two
populations of interneurons could therefore provide a substrate through which either of the striatal
output pathways can be rapidly and selectively inhibited to subsequently mediate the expression of
behavioral routines.
DOI: 10.7554/eLife.16088.001
IntroductionInteractions within and between populations of interneurons and spiny projection neurons (SPN) of
striatum are critical for the expression of many basal ganglia-dependent behaviors. One major type
of GABAergic striatal interneuron expresses parvalbumin (PV). Striatal PV+ interneurons can form
axo-somatic synapses with SPNs (Koos and Tepper, 1999; Kubota and Kawaguchi, 2000), allowing
them to powerfully inhibit SPNs of both the so-called ‘direct pathway’ and ‘indirect pathway’
(Gittis et al., 2010; Planert et al., 2010). These interneurons exhibit short-latency responses to
powerful excitatory inputs from afferents originating in distinct cortical areas (Ramanathan et al.,
2002; Sharott et al., 2012), providing a mechanism for rapidly stopping or delaying SPN spiking
(Mallet et al., 2005) and, in turn, modulating striatal outputs. Consistent with this, physiologically-
classified (putative) PV+ interneurons in striatum, often called ‘fast-spiking interneurons’ (FSIs),
appear to have a specific role in ‘selecting’ motor programs, firing most intensely at the choice exe-
cution/decision making point of a given task (Friedman et al., 2015; Gage et al., 2010). The
Garas et al. eLife 2016;5:e16088. DOI: 10.7554/eLife.16088 1 of 36
RESEARCH ARTICLE

functional importance of striatal PV+ interneurons is further illustrated by the severe movement defi-
cits that result from their loss or selective disruption (Burguiere et al., 2013; Gittis et al., 2011).
In cortical circuits, PV+ GABAergic interneurons comprise multiple cell types with distinct struc-
tural, neurochemical and physiological features (Klausberger and Somogyi, 2008). In contrast, stria-
tal PV+ interneurons are usually treated as a single functionally-homogenous population that is
enriched within dorsolateral striatum (Gerfen et al., 1985; Kita et al., 1990). There is some evi-
dence, however, of anatomical, physiological and molecular heterogeneity within this population,
suggesting that distinct subpopulations of PV+ interneuron could exist within the striatum. Striatal
PV+ interneurons in rats can be broadly divided into two subtypes based on the sizes of their axonal
and dendritic fields (Kawaguchi, 1993), and the ratio of synapses formed with SPN somata and den-
drites varies considerably between individual PV+ cells (Kubota and Kawaguchi, 2000). Physiologi-
cally, identified PV+ interneurons in rats display highly variable firing rates and patterns in vivo
(Sharott et al., 2012). It is therefore reasonable to speculate that such variance or diversity could
arise from the blinded sampling of functionally-distinct subpopulations of PV+ interneurons. More-
over, studies in mouse striatum indicate that almost half of all PV+ interneurons express serotonin
receptor subunit 3A, again highlighting possible functional disparity (Munoz-Manchado et al.,
2016).
In cortical circuits, combinations of molecular markers have been crucial for defining neuronal
diversity. In certain specialized cases, the combinatorial expression of calcium-binding proteins,
together with other markers such as transcription factors and neuropeptides, has been used to dis-
ambiguate interneuron types that had been previously defined by structural features (Viney et al.,
2013). Combinations of similar molecules could thus be used to systematically demarcate different
populations of PV+ interneurons in striatum. Secretagogin (Scgn), an EF-hand calcium-binding pro-
tein (Rogstam et al., 2007; Alpar et al., 2012), is a particularly promising candidate marker of stria-
tal interneuron heterogeneity, as it is expressed by some (sparsely distributed) non-cholinergic
striatal neurons (Mulder et al., 2009). Using a combination of immunohistochemistry, stereological
cell counting and in vivo recordings of identified interneurons, we demonstrate that Sgcn is co-
expressed in a segregated and specialized population of striatal PV+ interneurons in rats and pri-
mates, but not in mice. Our findings suggest that distinct subpopulations of PV+ interneurons could
enable corticostriatal afferents to orchestrate SPN activity in a topographically- and output pathway-
selective manner.
Results
Selective expression of secretagogin divides the PV+ interneuronpopulation in rat striatum but not in mouse striatumIn the adult mouse, the calcium-binding protein secretagogin (Scgn) is expressed by some GABAer-
gic, but not cholinergic, striatal neurons (Mulder et al., 2009). To test whether these neurons also
express PV, we examined the expression of Scgn and PV across the mouse dorsal striatum using
unbiased stereological methods. All striatal Scgn+ cells co-expressed the ‘pan-neuronal’ marker
NeuN, but not the SPN-specific marker Ctip2 (Arlotta et al., 2008) (Figure 1A,B), indicating that
Scgn is exclusively expressed by interneurons. However, interneurons that co-expressed PV and
Scgn were rare. Indeed, the vast majority of Scgn+ interneurons did not co-express PV and vice
versa (Figure 1C–F, Figure 1—source data 1). Thus, the previously identified population of
GABAergic Scgn+ neurons in mice (Mulder et al., 2009) are interneurons, but not PV-expressing
interneurons.
Secretagogin is expressed in many brain areas, and expression patterns may vary across species
(Alpar et al., 2012). We next tested whether the patterns of Scgn expression in mice also held true
for rats. As in mice, Scgn-expressing cells in rat dorsal striatum were interneurons (Figure 1G,H).
However, in comparison to mice, Scgn+ interneurons in rat dorsal striatum could more readily be
observed, with or without co-expression of PV (Figure 1I,J, Figure 1—source data 1). Across all
striatal sections, about one half of Scgn+ interneurons also expressed PV (Figure 1K, Figure 1—
source data 1), and about one quarter of PV+ interneurons also expressed Scgn (Figure 1L, Fig-
ure 1—source data 1). These findings suggest that, in rats, Scgn is a candidate marker for a subtype
of PV-expressing interneuron. Moreover, Scgn+ interneurons were relatively common overall, with a
Garas et al. eLife 2016;5:e16088. DOI: 10.7554/eLife.16088 2 of 36
Research article Neuroscience

Figure 1. A large subpopulation of PV+ interneurons co-express Scgn in the dorsal striatum of rats, but not in
mice. (A–F), Co-expression of PV and Scgn in the dorsal striatum of the mouse. (A, B) Immunofluorescence signals
for Scgn (arrows), the pan-neuronal marker NeuN (A) and SPN-specific marker, Ctip2 (B). Scgn+ cells express
NeuN, but not Ctip2, indicating they are interneurons. (C, D), Immunofluorescence signals for PV and Scgn. The
vast majority of Scgn+ neurons did not co-express PV (C, white arrow) although a few did (D). (E, F) Densities and
Figure 1 continued on next page
Garas et al. eLife 2016;5:e16088. DOI: 10.7554/eLife.16088 3 of 36
Research article Neuroscience

density that was about two thirds of that of PV+ interneurons, indicating that Scgn is itself a novel
marker of a major class of striatal interneuron in the rat. We found this divergence in Scgn immuno-
reactivity between rodent species using two antibodies raised against different epitopes of Scgn
that have 100% and 95% sequence homologies for rat and mouse, suggesting that the relative pau-
city of Scgn+ interneurons in mice was not a result of differences in antibody specificity (Table 1).
Striatal afferents (and efferents) are topographically organized (Mailly et al., 2013;
McGeorge and Faull, 1989). Thus, if a given cell population has a biased spatial distribution across
striatum, it will likely receive privileged inputs from a specific subset of all striatal afferents. With this
in mind, we next tested whether the two molecularly-distinct populations of PV+ interneuron, i.e.
those that co-expressed Scgn (PV+/Scgn+) and those that did not (PV+/Scgn-), were preferentially
localized to discrete striatal regions in the rat. The density of PV+/Scgn- interneurons remained rela-
tively constant along the rostro-caudal axis of dorsal striatum, at least until the most caudal aspects
where density decreased by around 75% (Figure 2Ai,B, Figure 2—source data 2). However, PV+/
Scgn+ interneurons displayed a strikingly different pattern of localization, being more sparsely
Figure 1 continued
numbers of interneurons expressing combinations of PV and/or Scgn. PV and Scgn were seldom expressed by the
same interneurons in the mouse dorsal striatum. (G–L) As in A–F, but all data are from the dorsal striatum of rat.
(G, H) Scgn+ cells express NeuN, but not Ctip2, indicating they are interneurons. (I, J) In contrast to mouse, Scgn+
interneurons that co-expressed PV were common (I, white arrow), as were those that did not (J, white arrow,). (K, L)
Densities and numbers of interneurons expressing combinations of PV and/or Scgn in the rat. About one half of
Scgn+ interneurons co-expressed PV (K). About one quarter of PV+ interneurons co-expressed Scgn (L). (Scale
bars A–D and G–J, 20 mm)
DOI: 10.7554/eLife.16088.002
The following source data is available for figure 1:
Source data 1. Source data for Figures 1E,F,K,L.
DOI: 10.7554/eLife.16088.003
Table 1. Primary antibodies used in this study.
Molecular MarkerHostOrganism
Dilutionused Source and catalog number
Research Resource Identifier(RRID)
Choline acetyltransferase Goat 1:500 MilliporeAB144P
RRID:AB_2079751
Ctip2 Rat 1:500 AbcamAB18465
RRID:AB_2064130
Dopamine and cAMP-regulated phosphoprotein-32(DARPP-32)
Goat 1:100 Santa Cruz BiotechnologySC-8483
RRID:AB_639002
Gephyrin Mouse 1:500 Synaptic Systems147021
RRID:AB_2232546
Neuron-specific nuclear antigen (NeuN) Mouse 1:200 MilliporeMAB377
RRID:AB_2298772
Nitric Oxide Synthase Mouse 1:500 SigmaN2280
RRID:AB_260754
Neuropeptide Y Rabbit 1:5000 ImmunoStar22940
RRID:AB_2307354
Parvalbumin Guinea Pig 1:1000 Synaptic Systems195004
RRID:AB_2156476
Preproenkephalin Rabbit 1:5000 LifeSpan BiosciencesLS-C23084
RRID:AB_902714
Secretagogin Goat 1:1000 R&D SystemsAF4878
RRID:AB_2269934
Secretagogin Rabbit 1:500 AbcamAB111871
RRID:AB_10864618
DOI: 10.7554/eLife.16088.004
Garas et al. eLife 2016;5:e16088. DOI: 10.7554/eLife.16088 4 of 36
Research article Neuroscience
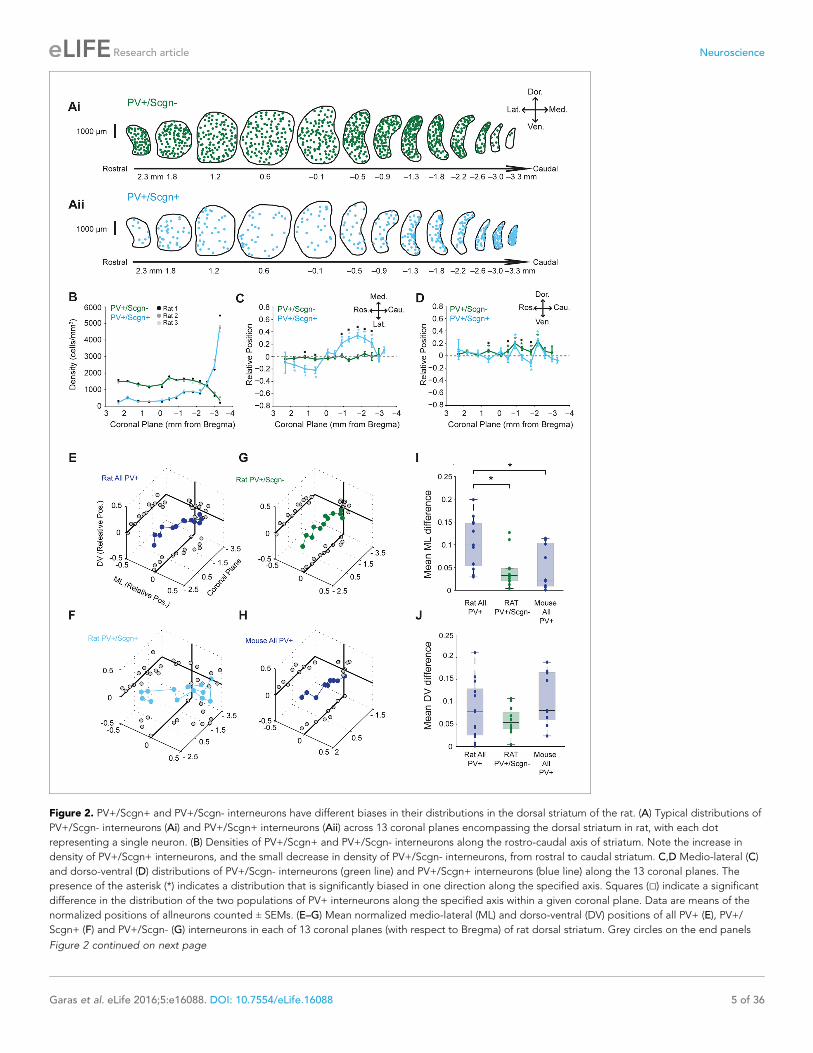
Figure 2. PV+/Scgn+ and PV+/Scgn- interneurons have different biases in their distributions in the dorsal striatum of the rat. (A) Typical distributions of
PV+/Scgn- interneurons (Ai) and PV+/Scgn+ interneurons (Aii) across 13 coronal planes encompassing the dorsal striatum in rat, with each dot
representing a single neuron. (B) Densities of PV+/Scgn+ and PV+/Scgn- interneurons along the rostro-caudal axis of striatum. Note the increase in
density of PV+/Scgn+ interneurons, and the small decrease in density of PV+/Scgn- interneurons, from rostral to caudal striatum. C,D Medio-lateral (C)
and dorso-ventral (D) distributions of PV+/Scgn- interneurons (green line) and PV+/Scgn+ interneurons (blue line) along the 13 coronal planes. The
presence of the asterisk (*) indicates a distribution that is significantly biased in one direction along the specified axis. Squares (□) indicate a significant
difference in the distribution of the two populations of PV+ interneurons along the specified axis within a given coronal plane. Data are means of the
normalized positions of allneurons counted ± SEMs. (E–G) Mean normalized medio-lateral (ML) and dorso-ventral (DV) positions of all PV+ (E), PV+/
Scgn+ (F) and PV+/Scgn- (G) interneurons in each of 13 coronal planes (with respect to Bregma) of rat dorsal striatum. Grey circles on the end panels
Figure 2 continued on next page
Garas et al. eLife 2016;5:e16088. DOI: 10.7554/eLife.16088 5 of 36
Research article Neuroscience
distributed across most striatal levels, except in the most caudal aspects where their density was
around three times higher than that of PV+/Scgn- interneurons in any other plane (Figure 2Aii,B,
Figure 2—source data 1). The two populations of interneurons were also differentially distributed
along the medio-lateral axis of the striatum; PV+/Scgn- neurons were evenly distributed, whereas PV
+/Scgn+ interneurons tended to distribute more laterally in the rostral striatum but more medially in
caudal striatum (Figure 2C, Supplementary file 1, Figure 2—source data 1). This particular pattern
of bias in the distribution of PV+/Scgn+ interneurons is highly unusual in that it has not been
described for any other striatal cell population. Along the dorso-ventral axis, PV+/Scgn- interneurons
were more likely than PV+/Scgn+ interneurons to display a slight dorsal bias in their localization
(Figure 2D, Supplementary file 1, Figure 2—source data 1). Taken together, these data show that
the selective expression of Scgn distinguishes two populations of PV+ interneurons that display sig-
nificantly different spatial distributions in the dorsal striatum of the rat.
Given that PV+/Scgn+ and PV+/Scgn- interneurons are not equally abundant (Figure 1F,L), we
next estimated whether their different spatial distributions biased the distribution of all PV+ inter-
neurons as a whole. When all rat PV+ interneurons were grouped together for analysis, and all coro-
nal planes were considered, there was no consistent bias in their relative positions along the dorso-
ventral axis (Figure 2E, Figure 2—source data 1). However, the relative medio-lateral positions of
all PV+ interneurons varied along the rostral-caudal axis; they tended to be laterally positioned in
those coronal planes rostral of Bregma, but medially positioned in planes caudal to Bregma
(Figure 2E). The distribution biases of all PV+ interneurons were thus similar to those of PV+/Scgn+
interneurons (Figure 2F, Figure 2—source data 1), suggesting the presence of PV+/Scgn+ inter-
neurons biases the entire PV+ interneuron population. In line with this, there was no consistent or
strong bias in the relative positions of PV+/Scgn- interneurons (Figure 2G, Figure 2—source data
1). Taken together, these data suggest that, in rat dorsal striatum, the biased medio-lateral distribu-
tions of PV+ interneurons can be largely explained by the selective expression of Scgn. To further
explore this notion, we analyzed the spatial distributions of all PV+ interneurons in the mouse dorsal
striatum (Figure 2H), which contains a tiny number of PV+/Scgn+ interneurons (Figure 1F). There
was no consistent or strong bias in the relative positions of all PV+ interneurons in mice (Figure 2H)
and, as such, their distribution pattern closely resembled that of PV+/Scgn- interneurons in rats
(Figure 2G), but not that of all PV+ interneurons in rats (Figure 2E). These observations were sup-
ported by quantitative comparisons of the differences in medio-lateral positions across coronal
planes of all mouse PV+ interneurons, all rat PV+/Scgn- interneurons and all rat PV+ interneurons;
the differences in the latter were significantly larger (Figure 2I). The relatively uniform distribution of
PV+ interneurons in mouse striatum thus tallies with their relative lack of Scgn expression. These
data serve to reinforce that Scgn is a useful and highly-relevant marker for dividing PV+ interneuron
populations.
In summary, rat PV+/Scgn+ interneurons have a highly unusual spatial distribution, transitioning
from predominantly lateral to medial positions as the rostro-caudal axis of dorsal striatum is tra-
versed; their biased positioning accounts for much of the non-uniform distribution of all PV+ inter-
neurons in rats. However, in contrast to a previous report (Luk and Sadikot, 2001), we found no
quantitative evidence of a consistent ‘dorsolateral’ bias in the distribution of all PV+ interneurons in
the striatum of rats. This discrepancy presumably arises from differences in the cell-counting meth-
odologies and analyses used, including the extent to which different regions of dorsal striatum were
sampled; we calculated the relative position of each neuron counted in 13 coronal planes, rather
Figure 2 continued
show the distribution of the mean values in each dimension. Note that clear biases in ML positions of all PV+ interneurons are similar to those of PV+/
Scgn+ interneurons, whereas PV+/Scgn- interneurons are not clearly biased. (H) Mean normalized medio-lateral and dorso-ventral co-ordinates of all PV
+ interneurons in each of 9 coronal planes of mouse dorsal striatum. Note that their positions are not clearly biased. (I, J) The difference in mean
medio-lateral positions (I), but not dorso-ventral positions (J), between coronal planes of all rat PV+ interneurons is significantly higher than that of rat
PV+/Scgn- interneurons and all PV+ interneurons in the mouse (Kruskal-Wallis ANOVA on ranks with post-hoc Dunn tests).
DOI: 10.7554/eLife.16088.005
The following source data is available for figure 2:
Source data 1. Source data for Figures 2 B–H.
DOI: 10.7554/eLife.16088.006
Garas et al. eLife 2016;5:e16088. DOI: 10.7554/eLife.16088 6 of 36
Research article Neuroscience
than calculating cell densities according to arbitrary ‘quadrants’ in 1 coronal plane (Luk and Sadikot,
2001).
Selective secretagogin expression divides the PV+ interneuronpopulation in the primate caudate and putamenOur data in rats and mice show that the co-expression of Scgn by striatal PV+ interneurons is not
highly conserved across rodent species. Because Scgn+ neurons have also been reported in the pri-
mate striatum (Mulder et al., 2009), we further explored the possibility of phylogenetic conservation
by analyzing the co-expression of PV and Scgn in interneurons of the monkey (rhesus macaque) stria-
tum. Secretagogin was expressed by some neurons in both the caudate nucleus and putamen of
monkeys; it was frequently co-expressed with PV (Figure 3A–C, Figure 3—source data 1). Com-
pared to the rat, co-expression of PV and Scgn was more common in primates; about three quarters
of PV+ interneurons in caudate nucleus and putamen also expressed Scgn (Figure 3C, Figure 3—
source data 1). Thus, Scgn is itself a novel marker of a major class of striatal interneuron in both
monkeys and rats. Along the rostro-caudal axis of monkey striatum, but most notably in the caudate
nucleus, there was a marked increase in the density of PV+/Scgn+ interneurons in caudal planes
(Figure 3D, Supplementary file 2, Figure 3—source data 1), mirroring the biased rostro-caudal dis-
tribution of PV+/Scgn+ interneurons in the rat striatum (Figure 2B). The density of PV+/Scgn- inter-
neurons remained relatively constant across the rostro-caudal extent of monkey striatum, which is
again in line with our observations in rats (Figure 3D, Supplementary file 2, Figure 3—source data
1.). Interestingly, the distribution of PV+/Scgn- interneurons, but not PV+/Scgn+ neurons, was lat-
erally biased throughout rostro-caudal aspect putamen, but not caudate (Figure 3E,
Supplementary file 2, Figure 3—source data 1). When taken together, the data from monkey and
rat not only show that a substantial proportion of striatal PV+ interneurons co-express Scgn, a popu-
lation enriched in caudal striatum, but also that these novel constituents of the striatal microcircuit
are phylogenetically conserved to some extent.
Spontaneous in vivo activity of identified PV+/Scgn- and PV+/Scgn+interneurons during cortical SWA and activation statesAs previously described, PV+ interneurons display the most diverse in vivo firing rates/patterns of
the major striatal interneuron types in the rat (Sharott et al., 2012). We next investigated whether
the selective expression of Scgn could account for any of the variability in the activity of striatal PV+
interneurons. We thus extracellularly recorded the action potentials fired by individual interneurons
in the dorsal striatum of anesthetized rats, and then juxtacellularly labeled the same interneurons
with neurobiotin for posthoc verification of their neurochemical identities and locations (Figure 4).
We focused our analyses on the firing of identified PV+ interneurons during two distinct brain states,
slow-wave activity (SWA) and ‘cortical activation’ (Sharott et al., 2012), as defined by simultaneous
recordings of the electrocorticogram (ECoG).
Striatal PV+ interneurons have short duration (<1 ms) action potentials (Mallet et al., 2005;
Sharott et al., 2012), a characteristic often used to putatively identify them (as FSIs) in awake,
behaving animals (Adler et al., 2013; Berke, 2004). In agreement with this, our recordings con-
firmed that the action potential waveforms of all PV+ interneurons, irrespective of Scgn immunoreac-
tivity, were brief (1.09 ± 0.06 ms, n = 24; Figure 5A.). Further analysis showed that the duration of
the first deflection (D1) of the action potentials (see Figure 5A) of PV+/Scgn+ interneurons (n = 10
cells; 0.31 ± 0.014 ms) was significantly shorter than those of PV+/Scgn- interneurons (n = 14 cells;
0.39 ± 0.02 ms) (Mann Whitney, p=0.006). Although the firing rates of PV+ interneurons as a whole
could vary substantially (range: 0.01 – 22.52 spikes/s; see Figure 4) during SWA, the average firing
rates of PV+/Scgn+ and PV+/Scgn- interneurons were similar in this brain state (Figure 5B, Fig-
ure 5—source data 1). However, during cortical activation, the firing rate of PV+/Scgn+interneurons
(median = 13.8 spikes/s) was significantly higher than that of the PV+/Scgn- interneurons (median =
3.74 spikes/s, Mann-Whitney U test, p=0.03; Figure 5B, Figure 5—source data 1).
Striatal PV+ interneurons display considerable heterogeneity in their firing patterns, more so than
other striatal interneuron types (Sharott et al., 2012). In order to quantify this observation, we calcu-
lated correlations between the interspike interval (ISI) distributions of pairs of interneurons of the
same type (Figure 5C–H). We analyzed firing pattern homogeneity of all PV+ interneurons
Garas et al. eLife 2016;5:e16088. DOI: 10.7554/eLife.16088 7 of 36
Research article Neuroscience

Figure 3. PV+/Scgn+ and PV+/Scgn- interneurons have different biases in their distributions in the caudate and
putamen of macaque monkey. (Ai, Aii) Confocal micrographs of the macaque striatum showing PV-expressing
interneurons that co-expressed (Ai) and did not co-express (Aii) Scgn (arrow). (B) Typical distributions of PV+/Scgn-
interneurons (left) and PV+/Scgn+ interneurons (right) across 7 coronal planes of macaque caudate and putamen,
with each dot representing a single neuron. (C) Mean densities of all PV+ interneurons across the entirety of the
Figure 3 continued on next page
Garas et al. eLife 2016;5:e16088. DOI: 10.7554/eLife.16088 8 of 36
Research article Neuroscience
(irrespective of Scgn expression) as compared to that of cholinergic (ChAT+) interneurons, which fire
with a relatively narrow range of ISIs (Sharott et al., 2012). In line with our previous observations,
correlations between the ISI histograms of ChAT+ interneurons often result in r-values close to 1
(Figure 5C,E). In contrast, while correlations between PV+ interneurons could also yield strong cor-
relations, many ISI histograms differed, thereby producing lower r-values (Figure 5D,F). Across all
recorded neurons, the ISI histograms of ChAT+ interneurons were significantly more positively corre-
lated than those of PV+ interneurons during both SWA and cortical activation (Mann Whitney, SWA;
p=0.001 � 10�37; Act: p<0.025 � 10�36), confirming that PV+ interneurons have more heteroge-
neous firing patterns than ChAT+ interneurons.
If PV+ interneurons encompass multiple neuron types, and Scgn is a marker of a single subpopu-
lation of PV+ interneurons, pairs of PV+/Scgn+ interneurons should display more homogeneity in
their firing patterns than the population as a whole. To test this hypothesis, we computed correla-
tions between the ISI histograms of pairs of PV+/Scgn+ interneurons and pairs of PV+/Scgn- inter-
neurons. During both SWA and cortical activation (Figure 5G,H, Figure 5—source data 1), the
r-values for pairs of PV+/Scgn+ interneurons were significantly higher than those of PV+/Scgn- pairs
(p<0.05 for both Kruskal–Wallis ANOVAs and post hoc Dunn’s tests), but not significantly different
from pairs of ChAT+ interneurons. These results suggest that, across brain states, the homogeneity
of firing patterns within the subpopulation of PV+/Scgn+ interneurons was akin to that of cholinergic
interneurons and greater than within the subpopulation of PV+/Scgn- interneurons.
Firing of PV+/Scgn- and PV+/Scgn+ interneurons is preferentiallyphase-locked to different cortical network oscillationsIdentified striatal PV+ interneurons, as well as FSIs, show a strong tendency to phase lock their firing
to cortical oscillations (Berke, 2004, 2009; Sharott et al., 2012). Thus, we next examined whether
PV+/Scgn- and PV+/Scgn+ interneurons fired differently with respect to the phase of cortical popu-
lation oscillations (as recorded in ipsilateral, frontal ECoG) across frequencies from 0.4–80 Hz in
SWA and cortical activation (Figure 6). As suggested by the raw data (Figure 4), both PV+/Scgn-
and PV+/Scgn+ interneurons tended to fire around the peaks of cortical slow oscillations (0.4–
1.6 Hz) during SWA (Figure 6A,B). Although the firing of all PV+ interneurons was significantly
locked to cortical slow oscillations to some extent (Figure 6C, Figure 6—source data 1), the locking
across the population was stronger in the PV+/Scgn- neurons (Figure 6A,B). In line with these
results, the vector length of firing of PV+/Scgn- interneurons was around twice that of PV+/Scgn+
interneurons (Figure 6D; Mann Whitney, p=0.04). Similarly, the firing of PV+/Scgn- interneurons was
more strongly locked to cortical spindle oscillations (7–12 Hz), which was reflected in both a greater
number of significantly locked neurons (Figure 6C, Figure 6—source data 1) and greater vector
length (Figure 6D, Mann Whitney, p=0.008). In contrast, the firing of PV+/Scgn+ interneurons was
more tightly locked to cortical gamma (30–80 Hz) oscillations (Figure 6A,B), and a greater propor-
tion of PV+/Scgn+ interneurons were significantly locked to gamma oscillations (Figure 6C). The
phase-locked firing of PV+/Scgn- and PV+/Scgn+ interneurons was generally more similar across all
Figure 3 continued
caudate nucleus (Ci) and the putamen (Cii), including those populations that co-express Scgn (blue) and do not
express Scgn (green). In the macaque caudate-putamen, PV+/Scgn+ neurons represent nearly three quarters of all
PV-expressing neurons. Dots and squares indicate the values for individual animals. (D) Densities of PV+/Scgn+
interneurons (blue) and PV+/Scgn- interneurons (green) along the rostro-caudal axis of the caudate (Di) and the
putamen (Dii). Note that the PV+/Scgn+ population in the macaque increases in density towards the caudal
planes of the caudate and the putamen. (E) Medio-lateral distribution of PV+/Scgn+ and PV+/Scgn- interneurons
along 7 coronal planes of the caudate nucleus (Ei) and the putamen (Eii). The presence of the asterisk (*) indicates
a distribution that is significantly biased in one direction along the specified axis. Squares (□) indicate a significant
difference in the distribution of the two PV+ interneuron populations along the specified axis within a given
coronal plane. Data are means of the position of all neurons counted ± SEMs.
DOI: 10.7554/eLife.16088.007
The following source data is available for figure 3:
Source data 1. Source data for Figures 3B–E.
DOI: 10.7554/eLife.16088.008
Garas et al. eLife 2016;5:e16088. DOI: 10.7554/eLife.16088 9 of 36
Research article Neuroscience
cortical oscillation frequencies during the activated brain state (Figure 6E,F,H, Figure 6—source
data 1). However, around three times as many PV+/Scgn+ interneurons were locked at gamma fre-
quencies between 30 and 60 Hz as compared to PV+/Scgn- interneurons (Figure 6G, Figure 6—
source data 1). These results indicate that the temporal organization of the firing of PV+/Scgn- and
PV+/Scgn+ interneurons with respect to ongoing cortical oscillations is distinct and brain state-
dependent, thus demonstrating further physiological divergence between these cell populations.
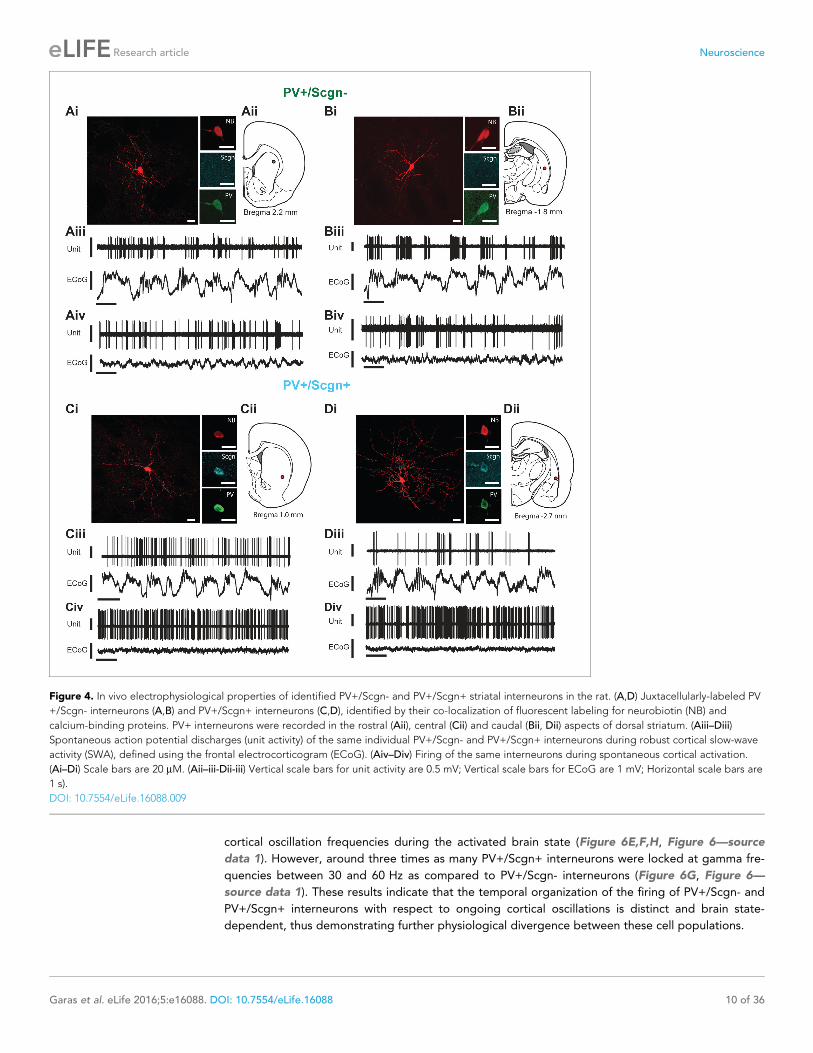
Figure 4. In vivo electrophysiological properties of identified PV+/Scgn- and PV+/Scgn+ striatal interneurons in the rat. (A,D) Juxtacellularly-labeled PV
+/Scgn- interneurons (A,B) and PV+/Scgn+ interneurons (C,D), identified by their co-localization of fluorescent labeling for neurobiotin (NB) and
calcium-binding proteins. PV+ interneurons were recorded in the rostral (Aii), central (Cii) and caudal (Bii, Dii) aspects of dorsal striatum. (Aiii–Diii)
Spontaneous action potential discharges (unit activity) of the same individual PV+/Scgn- and PV+/Scgn+ interneurons during robust cortical slow-wave
activity (SWA), defined using the frontal electrocorticogram (ECoG). (Aiv–Div) Firing of the same interneurons during spontaneous cortical activation.
(Ai–Di) Scale bars are 20 mM. (Aii–iii-Dii-iii) Vertical scale bars for unit activity are 0.5 mV; Vertical scale bars for ECoG are 1 mV; Horizontal scale bars are
1 s).
DOI: 10.7554/eLife.16088.009
Garas et al. eLife 2016;5:e16088. DOI: 10.7554/eLife.16088 10 of 36
Research article Neuroscience

Figure 5. Identified PV+/Scgn- and PV+/Scgn+ interneurons in the dorsal striatum of rats have distinct
electrophysiological properties. (A) The mean action potential waveforms of PV+/Scgn-(green) and PV+/Scgn
+(blue) interneurons. Both groups had short waveforms (around 1 ms). Waveforms were split in to D1 (baseline to
its peak) and D2 (return to the baseline from peak). The D1 segment of PV+/Scgn+interneurons was significantly
Figure 5 continued on next page
Garas et al. eLife 2016;5:e16088. DOI: 10.7554/eLife.16088 11 of 36
Research article Neuroscience

PV+/Scgn- and PV+/Scgn+ interneurons differ in their somatictargeting of striatal projection neurons of the direct and indirectpathwaysThe axon terminals of dorsal striatal PV+ interneurons/FSIs often form multiple “basket-like” apposi-
tions with SPN cell bodies (Koos and Tepper, 1999; Kubota and Kawaguchi, 2000), allowing them
to powerfully inhibit SPNs, a mechanism which is thought central to their role in the striatal microcir-
cuit (Tepper and Bolam, 2004). Fully delineating the role of any neuron type requires an under-
standing of not only its neurochemical/molecular properties and the temporal organization of its
activity, but also of the cellular targets that it innervates. With the latter in mind, some of the
recorded and neurobiotin-labeled PV+/Scgn+ and PV+/Scgn- interneurons (n = 4 and 4, respec-
tively) were used to gain insight into whether these two cell populations target the same types of
SPN to the same extent. We thus compared the prevalence of appositions of the terminal-like axonal
varicosities (’boutons’) of neurobiotin-labeled PV+/Scgn+ or PV+/Scgn- interneurons with the cell
bodies of SPNs (selectively labeled with DARPP-32). In agreement with previous descriptions (Kawa-
guchi, 1993 Sharott et al., 2012), PV+ interneurons exhibited dense local axonal arborizations (see
Figure 4) that often formed varicosities in close proximity to (i.e. were apposed to) the somata of
SPNs (Figure 7). Whether or not these appositions indicated the presence of functional axo-somatic
synapses between PV+ interneurons and SPNs was investigated by simultaneously detecting the
presence of gephyrin, which is highly enriched in the post-synaptic membranes of GABAergic synap-
ses (Sigal et al., 2015). Quantification of the overlap between gephyrin puncta and axonal varicosi-
ties revealed that appositions between neurobiotin-labeled axonal boutons and SPNs were often the
sites of putative GABAergic synapses (Figure 7). Indeed, 69.2 ± 2.4% of appositions (n = 104) made
by the axons of PV+/Scgn+ interneurons (n = 3) with SPN somata were associated with discrete
puncta of gephyrin immunoreactvity, while 75.5 ± 6.6% of appositions (n = 94) made by the axons of
PV+/Scgn- neurons (n = 2) were associated with discrete gephyrin+ puncta. These data suggest
that, at the site of an apposition of a PV+ interneuron axonal bouton with a SPN soma, there is a
high probability of a GABAergic synapse being formed.
Previous work has shown that the proportion of somatic (as compared to dendritic) synapses
formed by the axons of individual PV+ interneurons ranges from 7 to 58% (Kubota and Kawaguchi,
2000). Next we examined whether any of this variability could be explained by systematic differen-
ces in innervation of SPN somata by the two populations of PV+ interneuron. Neurobiotin-labeled
boutons of PV+/Scgn- interneurons (neurons = 4, boutons = 347) were almost twice as likely as those
of PV+/Scgn+ interneurons (neurons = 3, boutons = 709) to appose the somata of SPNs (Figure 8C;
Figure 5 continued
shorter than that of PV+/Scgn- interneurons. (B) The median firing rates of the two populations of PV+ interneuron
were similar during SWA, but PV+/Scgn+ interneurons had a significantly higher firing rate than PV+/Scgn-
interneurons during cortical activation. (C–F) The similarity of firing patterns between pairs of PV+/Scgn-, PV+/
Scgn+ and cholinergic (ChAT+) interneurons was assessed by calculating the correlation coefficient (Spearman)
between interspike interval (ISI) histograms. (Ci–ii) ISI histograms from the spike trains for two cholinergic
interneurons recorded separately during cortical activation. (Ciii) Scatter plot of the % count in each ISI bin for the
two ChAT+ interneurons plotted against each other. Because of the similar (unimodal) ISI distributions, the
Spearman Rho correlation coefficient (r) for the pair of ChAT+ interneurons is relatively high. (Di–ii) As in C, but
the analysis is now performed on two separately recorded PV+ interneurons. (Diii) Because of the more variable ISI
distributions, the correlation coefficient (r) is relatively low. (E) Histogram of the correlation coefficients of 276
cholinergic interneuron pairs from recordings during cortical activation. The majority of correlations are high,
indicating similar ISI histograms across the population. (F) Histogram of the correlation coefficients of 325 PV+
interneuron pairs from recordings during cortical activation. Correlations strengths are relatively spread; indicating
ISI histograms are less similar than those of the cholinergic population. (G, H) Comparison of Spearman
correlation coefficients of all PV+/Scgn-, PV+/Scgn+ and ChAT+ interneuron pairs recorded in SWA (G) and
cortical activation (H). In both brain states, the correlation coefficients between pairs of PV+/Scgn+ ISI histograms
was significantly higher than that of PV+/Scgn- pairs, but not significantly different to ChAT+ interneuron pairs.
DOI: 10.7554/eLife.16088.010
The following source data is available for figure 5:
Source data 1. Source data for Figure 5A,B,G,H.
DOI: 10.7554/eLife.16088.011
Garas et al. eLife 2016;5:e16088. DOI: 10.7554/eLife.16088 12 of 36
Research article Neuroscience

Figure 6. The firing of PV+/Scgn- and PV+/Scgn+ striatal interneurons is distinctly phase locked to cortical
oscillations in the rat. (A,B) Mean phase histograms of the firing of striatal PV+/Scgn- (A) and PV+/Scgn+ (B)
interneurons with respect to cortical oscillations of 0.4–80 Hz during SWA. Note the stronger locking of the firing
of PV+/Scgn- interneurons to slow (0.4–1.6 Hz) and spindle (7–12 Hz) frequencies, and the stronger locking of PV+/
Scgn+ interneurons to gamma oscillations (30–80 Hz) (C) Histogram showing the proportions of PV+/Scgn- (green)
and PV+/Scgn+ (blue) interneurons that exhibited significantly phase-locked firing (as measured by the Raleigh
test, with p<0.05) in each frequency range of cortical oscillation during SWA. (D) Mean vector lengths calculated
across all PV+/Scgn- (green) and PV+/Scgn+ (blue) neurons recorded during SWA (PV+/Scgn+ n = 9; PV+/Scgn- n
Figure 6 continued on next page
Garas et al. eLife 2016;5:e16088. DOI: 10.7554/eLife.16088 13 of 36
Research article Neuroscience

Fisher Exact Test, p<0.001. Figure 8—source data 1). A complementary analysis showed that SPN
somata that were apposed to at least one axonal bouton of a PV+ interneuron received a signifi-
cantly greater number of appositions from the axons of PV+/Scgn- interneurons (n = 46 SPN somata)
as compared to appositions from the axons of PV+/Scgn+ interneurons (n = 44 SPN somata;
Figure 8D, Mann Whitney, p=0.009. Figure 8—source data 1). Taken together, these data not only
show that the axons of both PV+/Scgn- interneurons and PV+/Scgn+ interneurons innervate SPN
cell bodies, but also that the former interneuron population is more likely to do so and with more
appositions per targeted SPN.
Figure 6 continued
= 8) from 0 to 80 Hz. Shaded areas show SEMs across neurons. (E,F) Mean phase histograms of striatal PV+/Scgn-
(E) and PV+/Scgn+ (F) interneurons for cortical oscillations of 0.4–80 Hz during cortical activation. (G) Histogram
showing the proportions of PV+/Scgn- (green) and PV+/Scgn+ (blue) neurons that were significantly locked in
each frequency range of cortical oscillation during cortical activation. (H) Mean vector lengths calculated across all
PV+/Scgn- (green) and PV+/Scgn+ (blue) neurons recorded during cortical activation (PV+/Scgn+ n = 11; PV+/
Scgn- n = 7). Shaded areas show SEMs across neurons. (A, B, E, F, frequencies between 0–5 Hz are separated to
allow for a wider color scale)
DOI: 10.7554/eLife.16088.012
The following source data is available for figure 6:
Source data 1. Source data for Figures 6C,D,G,H.
DOI: 10.7554/eLife.16088.013
Figure 7. Appositions formed by the axons of PV+ interneurons with the somata of SPNs are associated with the
post-synaptic marker gephyrin. (A) Confocal micrograph stack of an SPN cell body, labeled with DARPP-32
(purple), that is apposed by the boutons of a neurobiotin (NB)-labeled axon of a PV+/Scgn+ interneuron (blue).
The section has also been labeled with an antibody against the post-synaptic structural protein gephyrin (yellow).
Scale bar = 5 mm. (B–F), Single-plane confocal micrographs showing the xy axis and the corresponding orthogonal
views; xz (top) and yz (right) of the 5 appositions labeled in A. Axes crossing points are marked by colored lines.
The top right corner panel shows a magnification of the apposition in the xy axis. Note that, for each apposition,
there is a punctate gephyrin signal located between the axonal bouton and the soma, indicating the presence of a
putative GABAergic synapse.
DOI: 10.7554/eLife.16088.014
Garas et al. eLife 2016;5:e16088. DOI: 10.7554/eLife.16088 14 of 36
Research article Neuroscience

Fundamental to the conceptual organization of basal ganglia function is the separation of SPNs
into two information streams, the so-called direct and indirect pathways, which have broadly antago-
nistic roles in the expression of behavior (Gerfen and Surmeier, 2011). Thus, we next examined
whether there was any bias in the proportion of appositions formed between the PV+ interneuron
axons and the somata of SPNs of the direct pathway (dSPNs) and indirect pathway (iSPNs). Somatic
co-expression of DARPP-32 and preproenkephalin (PPE) was used to identify iSPNs, whereas those
SPNs that did not express PPE were considered to be dSPNs (Ellender et al., 2011; Lee et al.,
1997). The axons of individual PV+/Scgn- interneurons could readily be observed to form multiple
Figure 8. PV+/Scgn- and PV+/Scgn+ striatal interneurons selectively target the somata of SPNs in the direct or indirect pathway. (Ai) Confocal
fluorescent micrograph stack of a neurobiotin (NB)-labeled axon of a PV+/Scgn- interneuron (green) targeting a SPN revealed with DARRP-32 (purple).
The interneuron axon forms 4 appositions (numbered white arrows) with the SPN soma. (Aii) The SPN expresses preproenkephalin (PPE, white),
indicating it is in the indirect pathway (iSPN). (Aiii, Aiv) Single-plane confocal micrographs verifying that each of the 4 boutons is closely apposed to the
SPN soma. (Bi) Confocal fluorescent micrograph stack of the NB-labeled axon of a PV+/Scgn+ interneuron (blue) traversing close to two SPNs. The
axon forms 3 appositions (white arrows) with the SPN soma on the left, and appears to form a single apposition (red arrow) with the SPN on right.
(Bii) The right SPN expresses PPE (iSPN), while the left SPN does not, indicating it is in the direct pathway (dSPN). (Biii, Biv), Single-plane confocal
micrographs verifying that boutons 1–3 are apposed to the soma of the dSPN, while bouton 4 is not directly apposed to the iSPN. (C) Quantitative
analyses of the NB-labeled axonal boutons of PV+/Scgn- and PV+/Scgn+ interneurons revealed that the axons of PV+/Scgn- interneurons were more
likely to be opposed to the somata of SPNs. (D) Histogram of the frequency of different numbers of appositions formed with an individual SPN soma
for both types of interneuron. (E) The axons of PV+/Scgn- interneurons were more likely than the axons of PV+/Scgn+ interneurons to target the
somata of PPE+ SPNs of the indirect pathway.(A,B, scale bars are 20 mm.)
DOI: 10.7554/eLife.16088.015
The following source data is available for figure 8:
Source data 1. Source data for Figure 8C,D,E.
DOI: 10.7554/eLife.16088.016
Garas et al. eLife 2016;5:e16088. DOI: 10.7554/eLife.16088 15 of 36
Research article Neuroscience
basket-like appositions around PPE+ iSPNs (Figure 8A), whereas the axons of PV+/Scgn+ interneur-
rons appeared to more often target PPE- dSPNs (Figure 8B). Quantitative analysis confirmed that
these two populations of PV+ interneurons significantly differed in their preferential targeting of the
somata of iSPNs and dSPNs (Fisher Exact Test, p<0.0001). More specifically, the axonal boutons of
PV+/Scgn- interneurons (n = 119 boutons from 4 interneurons) were more commonly apposed to
iSPN somata than to dSPN somata (Figure 8A,E, Figure 8—source data 1). In contrast, the axons
of PV+/Scgn+ interneurons (n = 238 boutons from 4 interneurons) preferentially targeted dSPN
somata (Figure 8B,E, Figure 8—source data 1). In tissue sections containing the neurobiotin-
labeled axons of PV+ interneurons, approximately half of all SPNs located within 30 mm (i.e. approxi-
mately 2 SPN cell body diameters) of an axonal bouton were iSPNs. This meant that the mean ratio
of dSPNs to iSPNs in each section containing labeled interneuron axon was close to 1.0 (ratios of
1.04 ± 0.07 and 1.00 ± 0.12 for sections containing axons of PV+/Scgn+ or PV+/Scgn- interneurons,
respectively). This indicates that the preferential targeting of dSPNs and iSPNs by the axons of PV+/
Scgn+ and PV+/Scgn- interneurons, respectively, was not the result of a preferential distribution or
enrichment of dSPNs or iSPNs in these specific tissue sections. Taken together, these results show
that not only do PV+/Scgn- interneurons and PV+/Scgn+ interneurons target SPN somata to differ-
ent extents, but also that these two types of interneuron preferentially innervate the somata of dis-
tinct populations of SPNs. By virtue of these biased connections, PV+/Scgn- interneurons might be
better positioned than PV+/Scgn+ interneurons to selectively shape the activity of SPNs of the indi-
rect pathway, whereas PV+/Scgn+ neurons might be better positioned to selectively influence SPNs
of the direct pathway.
PV+/Scgn- and PV+/Scgn+ interneurons differ in their temporalrelationships with striatal projection neurons of the direct and indirectpathwaysStriatal PV+ interneurons are often considered to provide ’feedforward’ inhibition to SPNs
(Silberberg and Bolam, 2015). Indeed, PV+ interneurons can rapidly integrate synchronized cortical
inputs and thence curtail or delay SPN firing (Gittis et al., 2010; Koos and Tepper, 1999;
Mallet et al., 2005; Ramanathan et al., 2002; Sharott et al., 2012; Planert et al., 2010). Our analy-
sis of neurobiotin-labeled PV+/Scgn- and PV+/Scgn+ interneurons suggests these two cell types
selectively innervate iSPNs and dSPNs, respectively. When our observations are placed within a
framework of feedforward inhibition in vivo, one might predict that, first, the firing of PV+/Scgn-
interneurons is more likely to precede the firing of iSPNs than dSPNs, and secondly, that the firing
of PV+/Scgn+ interneurons is more likely to precede the firing of dSPNs than iSPNs.
To test these predictions, we compared the spike timing of identified SPNs (n = 48) and PV+
interneurons (n = 26) recorded in anesthetized rats during SWA (Figure 9). A subset of recorded
and neurobiotin-labelled SPNs (n = 36 of 48) were tested for their expression of PPE, which led to
the identification of 18 dSPNs (Figure 9Ai) and 18 iSPNs (Figure 9Bi). A subset of PV+ interneurons
(n = 15 of 26) were tested for their co-expression of Scgn, which led to the identification of 8 PV+/
Scgn- and 7 PV+/Scgn+ interneurons. As a common reference point for the temporal analysis of all
striatal neuron firing, we used the peak of the slow oscillation (~1 Hz) present in the inverted striatal
local field potential (iLFP) that was simultaneously recorded with the single-unit activity (Figure 9Aii,
Bii). The slow oscillation in the iLFP is of particular relevance because it is a proxy signal for the corti-
cally-driven synchronized ’up states’ of many SPNs in the vicinity of the electrode (Goto and O’Don-
nell, 2001; Stern et al., 1998). For each striatal neuron, we calculated histograms of the spike times
and iLFP amplitudes across the iLFP peak in 100 time bins, irrespective of the length of the individual
cycle (Figure 9A–C); this normalization procedure ensured that the variable durations of the slow
oscillation components (Nakamura et al., 2014) and thus, variable ‘peak lengths’, did not confound
the analysis.
When all recorded SPNs were grouped together for analysis, their maximal firing probability
occurred before the center of the iLFP peak, and their firing probability ‘profile’ extensively over-
lapped with that of all PV+ interneurons when analyzed together (Figure 9Ci, Figure 9—source
data 1). These observations agree with previous reports (Mallet et al., 2005), and are further sup-
ported by the fact that the median firing times of the SPN and PV+ interneurons were not different
(Mann Whitney, p=0.55. Figure 9D, Figure 9—source data 1). However, when the subsets of identi-
fied dSPNs and iSPNs were separately analyzed, their firing probability profiles only partly
Garas et al. eLife 2016;5:e16088. DOI: 10.7554/eLife.16088 16 of 36
Research article Neuroscience
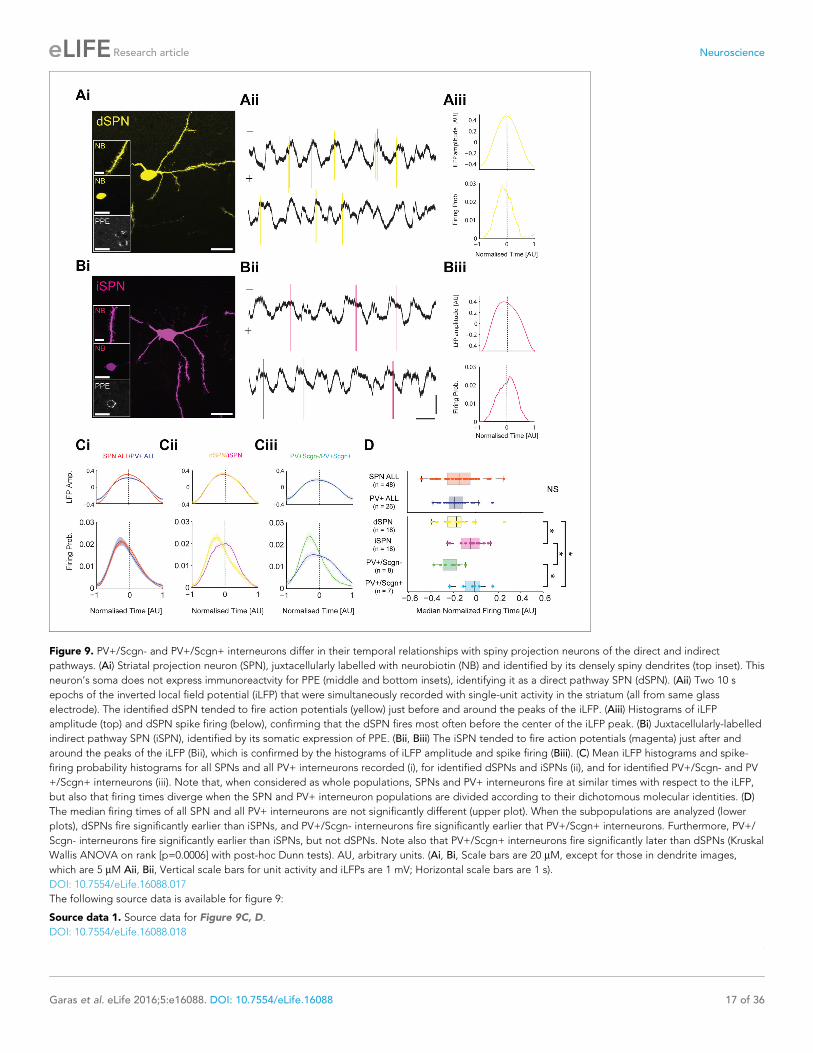
Figure 9. PV+/Scgn- and PV+/Scgn+ interneurons differ in their temporal relationships with spiny projection neurons of the direct and indirect
pathways. (Ai) Striatal projection neuron (SPN), juxtacellularly labelled with neurobiotin (NB) and identified by its densely spiny dendrites (top inset). This
neuron’s soma does not express immunoreactvity for PPE (middle and bottom insets), identifying it as a direct pathway SPN (dSPN). (Aii) Two 10 s
epochs of the inverted local field potential (iLFP) that were simultaneously recorded with single-unit activity in the striatum (all from same glass
electrode). The identified dSPN tended to fire action potentials (yellow) just before and around the peaks of the iLFP. (Aiii) Histograms of iLFP
amplitude (top) and dSPN spike firing (below), confirming that the dSPN fires most often before the center of the iLFP peak. (Bi) Juxtacellularly-labelled
indirect pathway SPN (iSPN), identified by its somatic expression of PPE. (Bii, Biii) The iSPN tended to fire action potentials (magenta) just after and
around the peaks of the iLFP (Bii), which is confirmed by the histograms of iLFP amplitude and spike firing (Biii). (C) Mean iLFP histograms and spike-
firing probability histograms for all SPNs and all PV+ interneurons recorded (i), for identified dSPNs and iSPNs (ii), and for identified PV+/Scgn- and PV
+/Scgn+ interneurons (iii). Note that, when considered as whole populations, SPNs and PV+ interneurons fire at similar times with respect to the iLFP,
but also that firing times diverge when the SPN and PV+ interneuron populations are divided according to their dichotomous molecular identities. (D)
The median firing times of all SPN and all PV+ interneurons are not significantly different (upper plot). When the subpopulations are analyzed (lower
plots), dSPNs fire significantly earlier than iSPNs, and PV+/Scgn- interneurons fire significantly earlier that PV+/Scgn+ interneurons. Furthermore, PV+/
Scgn- interneurons fire significantly earlier than iSPNs, but not dSPNs. Note also that PV+/Scgn+ interneurons fire significantly later than dSPNs (Kruskal
Wallis ANOVA on rank [p=0.0006] with post-hoc Dunn tests). AU, arbitrary units. (Ai, Bi, Scale bars are 20 mM, except for those in dendrite images,
which are 5 mM Aii, Bii, Vertical scale bars for unit activity and iLFPs are 1 mV; Horizontal scale bars are 1 s).
DOI: 10.7554/eLife.16088.017
The following source data is available for figure 9:
Source data 1. Source data for Figure 9C, D.
DOI: 10.7554/eLife.16088.018
Garas et al. eLife 2016;5:e16088. DOI: 10.7554/eLife.16088 17 of 36
Research article Neuroscience
overlapped; dSPNs tended to fire before the center of the iLFP peak whereas iSPNs fired on or
slightly after the center (Figure 9Cii). Accordingly the median firing time of dSPNs significantly pre-
ceded that of the iSPNs (Figure 9D, Figure 9—source data 1). To give further context to this spike
timing difference, we separately analyzed the firing of the identified PV+/Scgn- and PV+/Scgn+
interneurons. The firing probability profiles of the two types of PV+ interneuron diverged substan-
tially; the profile of PV+/Scgn- interneurons was sharp with a maximum well before the center of the
iLFP peak, whereas the profile of PV+/Scgn+ interneurons was broad and maximal around the center
(Figure 9Ciii). Analysis of median firing times confirmed that PV+/Scgn- interneurons fired signifi-
cantly earlier than PV+/Scgn+ interneurons (Figure 9D, Figure 9—source data 1), thus highlighting
further disparities in the in vivo firing properties of these two types of PV+ interneuron. When the fir-
ing times of PV+/Scgn- interneurons, PV+/Scgn+ interneurons, dSPNs and iSPNs were compared
(Figure 9D, Figure 9—source data 1), it was evident that PV+/Scgn- interneurons fired significantly
earlier than iSPNs but not dSPNs, whereas PV+/Scgn+ interneurons did not fire before iSPNs or
dSPNs (their firing was significantly delayed as compared to dSPNs). There were no significant differ-
ences in the peak times, lengths or amplitudes of the iLFP peaks between the different neuron
groups (Kruskal-Wallis ANOVA with post-hoc Dunn tests), suggesting that the differences in firing
times of the distinct neuron types were not due to systematic biases in the LFPs recorded with each
population.
These electrophysiological data verify the first prediction above with respect to possible sub-
strates for feedforward inhibition, that is, the firing of PV+/Scgn- interneurons is indeed more likely
to precede the firing of iSPNs than dSPNs. This result is consistent with our anatomical data showing
that, in the context of targeting SPN somata, PV+/Scgn- interneurons exhibit a considerable bias
towards innervating iSPNs. The firing of PV+/Scgn+ interneuron firing with respect to dSPN firing
did not validate the second prediction; the spike timings of this type of interneuron are not consis-
tent with a powerful feedforward inhibitory connection to either type of SPN. Again, this result reso-
nates with our anatomical data showing that, although PV+/Scgn+ interneuron preferentially target
dSPNs, these interneurons form fewer putative somatic synapses and fewer appositions on a given
SPN soma. Taken together, these observations suggest that the diverse properties of PV+/Scgn-
and PV+/Scgn+ interneurons position them to fulfil different roles in the striatal circuit.
Hierarchical clustering of striatal interneurons usingelectrophysiological parameters is highly correlated with theirmolecular identitiesThe analyses above show that PV+/Scgn- and PV+/Scgn+ interneurons differ in several of their
electrophysiological properties, suggesting they are discrete cell types. These analyses were neces-
sarily based on comparisons of two sets of PV+ interneurons that were first divided according to
their selective expression of Scgn. This raises the issue of whether PV+ interneurons can be segre-
gated into two or more discrete groups on the basis of their electrophysiological properties alone. If
they can be segregated, this raises the further issue of whether the discrete interneuron groups dif-
fer with respect to their expression of Scgn. To address these issues, we performed unsupervised
hierarchical cluster analyses of the electrophysiological parameters of PV+ interneurons (omitting
information on whether or not they expressed Scgn) together with those of cholinergic interneurons
and GABAergic interneurons that co-express nitric oxide synthase (NOS) and neuropeptide Y (NPY).
We included ChAT+ interneurons and NOS+/NPY+ interneurons because they are widely accepted
to be discrete cell types (Tepper and Bolam, 2004) and, as such, can be used as comparators; if PV
+/Scgn- and PV+/Scgn+ interneurons can be distinguished to the same degree as ChAT+ and NOS
+/NPY+ interneurons can be distinguished (from each other and/or from the subpopulations of PV+
interneurons), then this would support the notion that PV+/Scgn- and PV+/Scgn+ interneurons are
discrete cell types. Another key advantage of including ChAT+ and NOS+/NPY+ interneurons is that
they facilitated the unbiased selection of the electrophysiological parameters to analyze; parameters
were thus selected according to their utility for segregating one or more of the populations of
ChAT+ interneurons, PV+ interneurons (as a whole) and NOS+/NPY+ interneurons, rather than their
ability to distinguish PV+/Scgn- from PV+/Scgn+ interneurons per se.
Eighty three percent of the cholinergic interneurons and all of the NOS+/NPY+ interneurons used
here have been reported in previous papers (Sharott et al., 2012; Doig et al., 2014). Because the
firing rates and patterns of striatal interneurons varies considerably between SWA and cortical
Garas et al. eLife 2016;5:e16088. DOI: 10.7554/eLife.16088 18 of 36
Research article Neuroscience

activation (Sharott et al., 2012), we performed separate cluster analyses for parameters recorded in
each brain state. For activity during SWA, we analyzed a total of 65 interneurons; 36 ChAT+, 12
NOS+/NPY+ and 17 PV+ interneurons. Three measures of interneuron firing regularity/pattern (Log
ISI 10, CV ISI and CV2 ratio; see Materials and methods) and 4 measures of interneuron locking to
population oscillations in the ECoG (LFP peak, SWA Vec., Spin. Vec and Gam. Vec; see Materials
and methods) were used for clustering (Figure 10Ai, Figure 10—source data 1). When these 7
parameters were analyzed across all interneuron populations, 5 significant clusters emerged
(Figure 10B). After assignment of molecular identities, it was evident that two of these clusters were
predominantly composed of cholinergic interneurons (Figure 10B). The three remaining clusters
were composed of a clear majority of PV+/Scgn-, PV+/Scgn+ or NOS+/NPY+ interneurons. The PV
+/Scgn- and PV+/Scgn+ interneurons were therefore segregated to a similar degree as the ChAT+
and NOS+/NPY+ interneurons. When the ChAT+ interneurons were removed and the analysis
repeated, the GABAergic interneurons segregated into 3 significant clusters with a slightly improved
clustering of the NOS+/NPY+ interneurons and a similar separation of the two PV+ populations to
the larger analysis (Figure 10C). With the removal of NOS+/NPY+ interneurons, the segregation of
PV+/Scgn- and PV+/Scgn- interneurons was largely maintained (Figure 10D). When only the 4 meas-
ures of interneuron locking were used in the analysis, PV+ interneurons were segregated into two
significant clusters with >85% correlation with Scgn expression (Figure 10D). This could reflect the
relatively large influence of cortical oscillations on the firing patterns of striatal GABAergic interneur-
ons in this brain state (Sharott et al, 2012).
For activity during cortical activation, we analyzed a total of 48 interneurons; 24 ChAT+, 6 NOS+/
NPY+ and 18 PV+ interneurons. Six measures of interneuron firing regularity/pattern (Log ISI 10, Log
ISI 50, Log ISI 85, mean firing rate, CV2 ratio and CV2 mean; see Materials and methods) were used
for clustering (Figure 10Aii, Figure 10—source data 1). When these 6 parameters were analyzed
across all interneuron populations, 4 significant clusters emerged (Figure 10F). After assignment of
molecular identities, it was evident that these clusters were predominantly composed of cholinergic
interneurons, NOS+/NPY+ interneurons, PV+/Scgn- interneurons or PV+/Scgn+ interneurons
(Figure 10F), thus establishing the value of the parameters used. When the ChAT+ interneurons
were removed and the analysis repeated, the NOS+/NPY+, PV+/Scgn- and PV+/Scgn+ interneurons
remained significantly segregated to similar degrees (Figure 10G). These data show that, during
cortical activation, PV+/Scgn+ and PV+/Scgn- interneurons are as distinct from each other as either
subpopulation is from ChAT+ or NOS+/NPY+ interneurons. When the analysis was repeated after
removal of NOS+/NPY+ interneurons, 3 significant clusters emerged, one of which was composed
entirely of PV+/Scgn+ interneurons (Figure 10H). Interestingly, the remaining PV+ interneurons,
which were mostly Scgn-, were divided into two clusters. This concurs with our ISI histogram correla-
tion analysis (Figure 5) that indicated that the firing patterns of PV+/Scgn- interneurons are more
variable than those of PV+/Scgn+ interneurons.
In summary, these unsupervised cluster analyses show not only that PV+ interneurons can be seg-
regated into two discrete groups on the basis of their electrophysiological properties alone (in two
brain states), but also that these discrete interneuron groups differ with respect to their Scgn expres-
sion. Taken together, these data further support the notion that rat PV+ interneurons are comprised
of two main subpopulations, and that selective expression of Scgn is a robust and useful metric for
distinguishing between them.
DiscussionStriatal PV-expressing interneurons have generally been regarded as a single population or cell type.
Here we demonstrate that, in rats and primates, co-expression (or lack thereof) of a second calcium-
binding protein, secretagogin, divides PV+ interneurons into two functionally-specialized subpopula-
tions by virtue of their different structural, topographical and physiological properties.
Neurons of the same cell type deliver identical neuroactive substances to a matching range of
postsynaptic targets in the same temporal patterns (Somogyi, 2010). These properties can be
defined using molecular, structural and physiological features (Petilla Interneuron Nomenclature
et al., 2008). Exemplars of the utility of such a multi-level definition of GABAergic cell type include
the discrimination of myriad types of hippocampal interneuron (Klausberger and Somogyi, 2008)
and the cellular dichotomy recently revealed in the external globus pallidus (Abdi et al., 2015;
Garas et al. eLife 2016;5:e16088. DOI: 10.7554/eLife.16088 19 of 36
Research article Neuroscience

Figure 10. Unsupervised hierarchical clustering of electrophysiological parameters segregate PV+/Scgn+ interneurons from established striatal
interneuron types. (A) Scatter plots showing the values of 6 electrophysiological parameters used in the cluster analysis of juxtacellularly-labelled
ChAT+ (red), GABAergic NOS+/NPY+ (black circles) and PV+ (dark blue) interneurons recorded during SWA (Ai) and cortical activation (Aii). See
Materials and ethods for definitions of each parameter. Each variable separates two or more of the interneuron groups. (B) Dendrogram derived from
7D-cluster analysis using Ward’s method with a squared Euclidian distance measure to classify 65 striatal interneurons recorded during SWA using the
parameters in Ai and one other (ECoG gamma vector length). The x-axis represents individual cells (ChAT+ in red, NOS+/NPY+ in black, PV+/Scgn- in
green, PV+/Scgn+ in light blue), the y-axis represents average linkage distance between neurons, where longer distance represents greater
dissimilarity. The dotted redline represents the threshold for separating clusters, which are highlighted by grey boxes, together with the p-value for this
threshold. Five clusters are formed, two made up mostly of ChAT+ interneurons and the other three of different types of GABAergic interneurons. (C,
D) The same analysis run only on the GABAergic interneurons (C) and only on PV+ interneurons (D). (C) The three significant clusters correspond to the
three different molecular marker combinations with >70% accuracy. (D) Upper, in the 7D space, the two significant clusters for PV+ interneurons are
roughly segregated according to Scgn expression. Lower, 4D-cluster analysis using only parameters related to population locking. The two significant
clusters are almost completely predicted by Scgn expression. (E) Dendrogram of 6D cluster analysis of 48 interneurons recorded during cortical
activation using the parameters in Aii. 4 clusters are significantly segregated, each with a clear majority of cells with a single molecular identity. (F)
Analysis of only GABAergic interneurons leads to 3 significant clusters highly correlated with the 3 interneuron types. (G) Analysis of only PV+
interneurons led to 3 significant clusters, 2 of which were predominantly comprised of PV+/Scgn- interneurons. The third cluster, which had the widest
segregation, was comprised only of PV+/Scgn+ interneurons.
DOI: 10.7554/eLife.16088.019
Figure 10 continued on next page
Garas et al. eLife 2016;5:e16088. DOI: 10.7554/eLife.16088 20 of 36
Research article Neuroscience
Mallet et al., 2012). In both of these cases, a specific combination of molecular markers can be
used as the primary or sufficient indicators of the unique set of structural and physiological proper-
ties. Combinations of markers have also proved useful for parsing some types of GABAergic inter-
neuron in the rodent striatum. For example, interneurons expressing NPY can be separated
according to whether or not they also express NOS and/or somatostatin; those expressing NPY, but
not NOS, have a completely distinctive anatomical and physiological phenotype (Ibanez-
Sandoval et al., 2011) and specific role in the microcircuit (English et al., 2012) as compared to
NPY+/NOS+ interneurons. In contrast, striatal PV+ interneurons have generally been treated as a
homogenous population. The findings presented here describing the molecular profiles, distribution,
structure and firing of striatal PV+ interneurons converge to suggest that striatal PV+ interneurons in
rats and monkeys comprise at least two discrete cell types. The unsupervised cluster analysis of PV+
interneuron firing during cortical activation suggested this heterogeneity may extend further.
We compared PV and Scgn expression across three species in which the amino acid sequence of
Scgn is highly conserved (Gartner et al., 2007; Pruitt et al., 2014; Zierhut et al., 2005). While PV+/
Scgn+ interneurons constituted around 30% and 75% of all PV+ interneurons in rats and primates
respectively, Scgn was only expressed by a small minority of PV+ interneurons (<1%) in mice.
Because Scgn-expressing neurons could be observed in other brain regions of mice, the scarcity of
PV+/Scgn+ interneurons in mouse striatum was thus unlikely to be due to a technical/detection
issue. The paucity of Scgn co-expression in mouse PV+ interneurons suggests the molecular diversity
we elucidate here does not tally with that defined by the selective, but more widespread, expression
of serotonin receptor subunit 3A (Munoz-Manchado et al., 2016). However, it would be important
to test in the future whether Scgn expression in rat and primate striatum correlates with expression
of this receptor subunit. It is possible that mouse striatum still contains a sub-population of PV+
interneurons that have the same anatomical and physiological properties as the PV+/Scgn+ inter-
neurons in rats. Even if this scenario were true, however, the fact that such mouse interneurons lack
Scgn suggests they would handle calcium differently compared to rat/primate interneurons that co-
express Scgn. Moreover, given the increasing use of genetically-altered mice for identifying and
manipulating specific neuronal populations based on their selective gene expression, the finding
that a combination of molecular markers is so prominent in the rat and primate but absent in the
mouse striatum is noteworthy. Indeed, further study of the functional properties of PV+/Scgn- and
PV+/Scgn+ interneurons using, for example, cell-type-specific optical or pharmacogenetic methods,
would likely require a double-transgenic rat, the generation of which would present a considerable
technical challenge. However, this does not alter the likelihood that, although many elements of
striatal circuits are likely conserved across mice, rats and primates, a focus on mice as a model
organism could potentially miss important substrates of interneuron diversity that are conserved
along different phylogenetic paths.
The corticostriatal projection is topographically organized and (depending on the precise cortical
areas of origin) partly overlapping, with different striatal territories receiving specific combinations of
cortical afferents that impart diverse functionality. As the predominant excitatory (glutamatergic)
input to striatal PV+ interneurons is from cerebral cortex (Lapper et al., 1992; Ramanathan et al.,
2002), the origin of these inputs is likely to be particularly important in defining their function. In rat,
PV+/Scgn+ interneurons were distributed across the entire striatum, but their density dramatically
increased in caudal aspects (such that they outnumbered PV+/Scgn- interneurons by >10 to 1).
These caudal striatal territories receive converging inputs from, in particular, most areas of prefrontal
(Hoover and Vertes, 2011; Mailly et al., 2013), entorhinal (McGeorge and Faull, 1989), prelimbic
(Mailly et al., 2013), visual (Faull et al., 1986) and auditory cortical areas (McGeorge and Faull,
1989; Xiong et al., 2015). In contrast, PV+/Scgn- interneurons were evenly distributed throughout
striatum, with the exception of caudal territories where they were sparse. Thus, corticostriatal neu-
rons in areas of rat cortex that heavily innervate caudal striatum could gain privileged access to PV+/
Figure 10 continued
The following source data is available for figure 10:
Source data 1. Source data for Figure 10.
DOI: 10.7554/eLife.16088.020
Garas et al. eLife 2016;5:e16088. DOI: 10.7554/eLife.16088 21 of 36
Research article Neuroscience

Scgn+ interneurons. On the other hand, in rostral and central territories of striatum, which receive
denser and more widespread inputs from somatosensory and motor cortical areas, PV+/Scgn- inter-
neurons outnumbered PV+/Scgn+ interneurons by at least 3:1. Thus, corticostriatal neurons in
‘somato-motor’ areas of rat cortex are particularly well positioned to engage PV+/Scgn-
interneurons.
Primate corticostriatal projections differ in several ways to those of rats and mice. The somatosen-
sory/motor cortical areas in primates comprise a far smaller fraction of the entire cortical mantle
than in rodents, particularly in relation to prefrontal, association and visual cortical areas (Brod-
mann, 1909; Buckner and Krienen, 2013). In line with this change in relative cortical volume, combi-
nations of afferents from prefrontal, association and visual cortices of primates innervate large areas
of the caudate and putamen across most of their rostro-caudal axes (Calzavara et al., 2007;
Haber and Knutson, 2010; Yeterian and Pandya, 1998), whereas corticostriatal neurons in motor
and somatosensory cortical areas primarily target the lateral putamen (Flaherty and Graybiel, 1991;
Inase et al., 1996; Parent and Parent, 2006; Takada et al., 1998). These differences in the sources
and sizes of corticostriatal innervation are partly correlated with the relative densities and distribu-
tions of the two populations of striatal PV+ interneurons in the primate. Unlike in the rat, PV+/Scgn+
interneurons in primates were three times as dense as PV+/Scgn- interneurons across the entire ros-
tro-caudal extent of striatum. In further contrast to the rat, PV+/Scgn- interneurons were clustered in
lateral aspects of the putamen. Thus, the relative switch in prevalence of the two PV+ interneuron
populations in the two species is roughly in line with the relative difference in prevalence of somato-
sensory/motor corticostriatal projections versus prefrontal, associative, visual and auditory cortico-
striatal projections. There was another notable similarity between rat and macaque, namely that the
density of PV+/Scgn+ interneurons increased in caudal territories. Both rat caudal striatum
(Faull et al., 1986) and primate caudal caudate receive dense inputs from visual cortical areas
(Gattass et al., 2014), which could possibly explain this shared relationship.
In hippocampus, PV is expressed by at least four distinct types of GABAergic interneuron (axo-
axonic, basket, bistratified and O-LM cells) that selectively innervate different compartments of tar-
get cells (Klausberger and Somogyi, 2008). Approximately 50% of PV-immunoreactive terminals in
the striatum form symmetric synapses with putative SPN somata (Bennett and Bolam, 1994;
Kita et al., 1990). While some of these terminals could originate from neurons in external globus
pallidus (Bevan et al., 1998; Mallet et al., 2012), a much larger proportion are likely to originate
from PV+ interneurons (Koos and Tepper, 1999; Kubota and Kawaguchi, 2000). Thus, PV+ inter-
neurons in striatum have generally been thought to play a similar circuit role to basket cells in cortex.
We found that, as compared to outputs of PV+/Scgn+ interneurons, the PV+/Scgn- interneurons
formed almost twice as many putative somatic synapses and formed more appositions on a given
SPN soma. From our experiments, we can only speculate on the identities of other targets inner-
vated by PV+/Scgn+ and PV+/Scgn- interneurons. While it seems likely that these interneurons form
some synapses with SPN dendrites, we cannot rule out that the somata and/or dendrites of inter-
neurons are also targeted. Whatever their targets, our results suggest that different subpopulations
of striatal PV+ interneuron could also underlie the considerable variability in the cellular compart-
ments targeted by individual PV+ interneuron axons (Kubota and Kawaguchi, 2000).
The targeting of SPN somata is an important factor in the ability of PV+ interneurons to power-
fully inhibit SPNs (Gittis et al., 2010; Planert et al., 2010). Bursts of spikes in PV+ interneurons can
considerably delay or even prevent SPN spiking, and inhibition mediated by PV+ interneurons is con-
siderably stronger than that mediated by other GABAergic interneurons (Gittis et al., 2010;
Koos and Tepper, 1999; Planert et al., 2010). We demonstrate that the axon of a single PV+ inter-
neuron most commonly forms 2–4 putative synapses with a single SPN soma. Thus, in addition to
several PV+ interneurons forming basket-like contacts with an SPN soma, our results indicate that an
axon from an individual PV+ interneuron can form sufficient synaptic contacts to powerfully inhibit a
single SPN.
In vitro electrophysiological recordings in mice have suggested that PV+ interneurons provide
either approximately equal inhibition to dSPNs and iSPNs, or have a slightly greater influence on
dSPNs (Gittis et al., 2010; Planert et al., 2010). Our findings suggest that the innervation of SPNs
by PV+ interneurons in the rat and primate is considerably more complex. In the context of targeting
SPN somata, we found that PV+/Scgn- and PV+/Scgn+ interneurons had a considerable bias
towards innervating iSPNs and dSPNs, respectively. The terminals of corticostriatal neurons show
Garas et al. eLife 2016;5:e16088. DOI: 10.7554/eLife.16088 22 of 36
Research article Neuroscience

little selectivity for the two SPN populations (Doig et al., 2010; Guo et al., 2015; Kress et al.,
2013; Wall et al., 2013). The biased innervation of SPNs by two different types of PV+ interneuron
may, therefore, provide a novel mechanism through which corticostriatal neurons can selectively
influence one or the other output pathway. The utility of this mechanism would be further enhanced
by the high sensitivity of PV+ interneurons to cortical input (Gittis et al., 2010; Mallet et al., 2005)
and/or by any differences in the temporal organisation of PV+/Scgn- and PV/Scgn+ interneuron
activities. We observed that the firing of these two types of PV+ interneuron was temporally distinct
with respect to the slow oscillations present in the striatum during SWA; PV+/Scgn- interneurons
fired earlier than PV+/Scgn+ interneurons. Selective innervation of iSPNs by PV+/Scgn- interneurons
might thus explain why the firing of iSPNs was delayed compared to that of dSPNs. In contrast, the
relative timing of PV+/Scgn+ interneuron firing and dSPN firing would not be consistent with a pow-
erful feedforward inhibitory circuit. In the future, in vitro recordings of synaptically-connected pairs
of PV+ interneurons and SPNs should provide further insights into the predicted functional impact of
the selective targeting of the somata of dSPNs and iSPNs.
Innervation of the somatic compartments of pyramidal neurons by some types of cortical PV+
interneurons is a key factor contributing to the role of these interneurons in the generation of net-
work oscillations (Freund and Katona, 2007; Klausberger and Somogyi, 2008). The strong tempo-
ral relationships between the firing of PV+ interneurons or FSIs to cortical oscillations is also well
described in striatum (Berke, 2004, 2009; Sharott et al., 2012, 2009). Thus, it was notable that PV
+/Scgn- and PV+/Scgn+ interneurons displayed differences in the incidence, strengths and timings
of their phase-locked firing to different cortical rhythms. This could be the result of these two inter-
neuron populations receiving different cortical inputs with different oscillatory signatures. Alterna-
tively, variance in the intrinsic properties of these interneurons could result in a different output in
response to the same oscillatory inputs. Whatever the underlying mechanism, our results highlight
that the physiological differences of PV+/Scgn- and PV+/Scgn+ interneurons extend to their dispa-
rate engagement in behaviorally-relevant network oscillations in the corticostriatal circuit. In addi-
tion, the firing pattern within the PV+/Scgn+ interneurons was as similar to each other as to that of
cholinergic interneurons, which have relatively homogenous firing patterns (Sharott et al., 2012). In
contrast, PV+/Scgn- interneurons displayed considerable variability in their firing patterns, which
could indicate that they represent more than one subtype of interneuron.
Overall, our findings suggest that PV+/Scgn- interneurons and PV+/Scgn+ interneurons play dif-
ferent roles in the feedforward inhibition of striatal outputs, which are in turn likely to underpin spe-
cialized contributions to the control of behavior. A recent study in mice demonstrated feedforward
inhibition of SPNs in striosomes, but not matrix compartment, of rostro-medial striatum by afferents
from prelimbic cortex (Friedman et al., 2015). Optogenetic manipulation of this corticostriatal/inhib-
itory-interneuron pathway specifically altered performance in cost/benefit decision making, illustrat-
ing that inhibitory interneurons can enable cortical afferents from a single area to selectively mediate
a subset of striatal outputs (Friedman et al., 2015). We propose that PV+/Scgn+ interneurons may
instantiate a similar mechanism, whereby associative, visual and auditory cortical inputs can selec-
tively inhibit dSPNs. Consistent with this idea, the caudal striatum of rats has been shown to mediate
the association of auditory stimuli with rewarding actions (Xiong et al., 2015). The proliferation of
PV+/Scgn+ interneurons in the macaque striatum could reflect the increase in such decision-making
capabilities required by the corticostriatal system of primates.
Materials and methods
Indirect immunofluorescence of rat and mouse tissueThe experimental procedures described below were carried out using 36 adult (3–4 months old,
280–350 g) male Sprague Dawley rats (Charles River) and 7 adult (3–4 months old) C57Bl/6J male
mice (Charles River) in accordance with the Animals (Scientific Procedures) Act, 1986 (UK). After
being deeply anaesthetized using isoflurane (4% v/v in oxygen), each rat was given a lethal dose of
pentobarbitone (1.3g/kg; i.p.) and transcardially perfused with approximately 50 ml of 0.05 M phos-
phate-buffered saline, pH7.4 (PBS), followed by 300 ml of fixative (4% w/v paraformaldehyde with
0.1% w/v glutaraldehyde in 0.1 M phosphate buffer, pH7.4 (PB)). This was followed by a third perfu-
sion of approximately 200 ml of fixative (4% w/v paraformaldehyde in PB). Mice were deeply
Garas et al. eLife 2016;5:e16088. DOI: 10.7554/eLife.16088 23 of 36
Research article Neuroscience

anesthetized with pentobarbitone and perfused transcardially using 20 ml of PBS, followed by 20 ml
of fixative (4% w/v paraformaldehyde in 0.1 M PB). For both species, once the brain was removed,
the tissue was post-fixed in this solution for 24 hr at 4˚C. Using a vibrating-blade microtome (Leica
VT1000S), 50 mm-thick coronal sections containing the striatum as identified using either a rat or
mouse brain atlas (Franklin and Paxinos, 2008; Paxinos and Watson, 2007) were cut and collected
in a one in four series for immunofluorescence processing.
Sections were washed with PBS (four 10 min washes) and pre-incubated for 2 hr in a solution con-
sisting of 10% v/v normal donkey serum (NDS) and 0.3% v/v Triton X-100 in PBS. After further wash-
ing using PBS, sections were incubated overnight at room temperature in a solution of 0.3 %v/v
Triton X-100 in PBS containing primary antibodies. Refer to Table 1 for details, source, and dilutions
of antibodies used. After incubation in primary antibodies, sections were washed in PBS and incu-
bated overnight at room temperature in Triton-PBS which contained a mixture of secondary antibod-
ies (all raised in donkey) which were conjugated to the following fluorophores: DyLight 649 (1:500;
Jackson ImmunoResearch Laboratories); Cy3 (1:1000; Jackson ImmunoResearch Laboratories); Alex-
aFluor-488 (1:500; Invitrogen); or AMCA (1:250 dilution; Jackson ImmunoResearch Laboratories). To
ensure minimal cross-reactivity, these antibodies were cross adsorbed by the manufacturers. After
further washing in PBS, sections were mounted on glass slides using fluorescence mounting medium
(Vectashield; Vector Laboratories), followed by the addition of a coverslip.
Sampling and cell-counting strategies in rat and mouse tissueUsing a series of partly overlapping, complementary immunofluorescence protocols, striatal neurons
were tested for their combinatorial expression of some of the molecular markers in Table 1. A ver-
sion of design-based stereology, the ‘modified optical fractionator’ (Dodson et al., 2015;
Abdi et al., 2015), was used to generate unbiased cell counts, determine the relative expression of
molecular markers, and map distributions of striatal interneurons. In all procedures performed, the
accuracy of these estimates was ensured by performing counts throughout the entirety of the stria-
tum within a given rostro-caudal plane. This allowed for an accurate description of their distribution
within the striatum. The analysis of dorsal striatal expression of specific molecular markers was per-
formed using 13 coronal striatal planes in the rat (Paxinos and Watson, 2007). For protocols per-
formed using mouse striatum, 9 coronal planes were used (Franklin and Paxinos, 2008). As our aim
was to investigate the distribution of interneurons across specific coronal planes in a quantitatively
and statistically robust manner, chosen sections from all animals were matched with one another
such that sections representing the same distance from Bregma (±50 mm) were chosen. This ensured
that the results from all animals studied could be averaged to produce more accurate results regard-
ing the number of counted neurons within a given coronal plane.
Once the chosen striatal coronal planes were identified and the immunofluorescence protocol
carried out, the dorsal striatum was delineated using a Zeiss Imager M2 epifluorescence microscope
(Carl Zeiss, AxioImager.M2) equipped with a 20X (Numerical Aperture = 0.8) objective and StereoIn-
vestigator v9.0 software (MBF Biosciences). In order to image each fluorescence channel, the follow-
ing sets of filter cubes were used: AMCA (excitation 299–392 nm, beamsplitter 395 nm, emission
420–470 nm); AlexaFluor-488 (excitation 450–490 nm, beamsplitter 495 nm, emission 500–550 nm);
Cy3 (excitation 532–558 nm, beamsplitter 570 nm, emission 570–640 nm); and DyLight 649 (excita-
tion 625–655 nm, beamsplitter 660 nm, emission 665–715 nm). Imaging was subsequently per-
formed by capturing a series of completely tessellated, z-stacked images (each 1 mm thick) at depths
from 2 to 12 mm from the upper surface of each section at the level of the striatum (thereby defining
a 10 mm-thick optical disector). As counts were performed across the entirety of the dorsal striatum
within a given rostro-caudal plane, the grid size and counting frame were set to the same size of 420
x 320 mm. In order to calculate the coefficient of error associated with each count (CE – also referred
to as the Gundersen coefficient), the point counting method option of the StereoInvestigator 9.0
software (MBF Biosciences) was applied. In all trials, the mean CE was 0.03.
To minimize confounds arising from surface irregularities, neuropil within a 2 mm ‘guard zone’ at
the upper surface was not imaged. A neuron was counted if the top of its nucleus came into focus
within the disector. If the nucleus was already in focus at the top of the 10 mm-thick optical disector
the neuron was excluded (Dodson et al., 2015). As strongly fluorescent cytoplasmic/nuclear markers
can obscure nuclear boundaries, delineation of these boundaries was achieved when necessary by
incubating the tissue for 10 min in a solution (1:100,000) of the DNA dye 4’,6-diamidino-2-
Garas et al. eLife 2016;5:e16088. DOI: 10.7554/eLife.16088 24 of 36
Research article Neuroscience

phenylindole (DAPI). For a given molecular marker, X, positive immunoreactivity (confirmed expres-
sion) is denoted as X+ while undetectable immunoreactivity (no expression) was denoted as X–. In
all fluorescence analyses a neuron was classified as not expressing the tested marker only when posi-
tive immunoreactivity could be observed in other cells on the same optical section as the neuron in
question. Each immunofluorescence protocol was repeated in a minimum of three adult rats/mice.
Calculations of section area, volume and estimates of total cell numberOnce the number of neurons expressing a marker or markers had been counted and recorded for a
given coronal plane, the volume of the striatum in which these neurons had been counted (i.e. the
optical disector) was first calculated. The cross-sectional area of a given delineated region was calcu-
lated using StereoInvestigator 9.0 software (MBF Biosciences). Since each set of counts was per-
formed within the confines of an optical disector of a depth of 10 mm, the cross sectional area could
be multiplied by this depth in order to obtain the volume of striatum in which the counts were per-
formed for a given section. Because each count represents the total number of immunoreactive neu-
rons (i.e. it is not an estimate) within this volume, dividing this number by the calculated volume
yields the absolute density of immunoreactive neurons in that specific volume.
In order to calculate an estimate of the total number of neurons in the striatum, the following
equation (Oorschot, 1996) was used:
N¼Nv� VðrefÞ
where N is the estimate for the total number of neurons in the structure, Nv is the numerical or vol-
ume density and V(ref) is the volume of that structure.
The volume of the dorsal striatum in rats and mice was calculated using the Cavalieri direct vol-
ume estimate (Gundersen and Jensen, 1987) with the following equation (Oorschot, 1996;
West, 1999):
VðrefÞ ¼ aðpÞ�tðX
PÞ
where P is the number of points counted within a delineated contour, a(p) is the area represented
by each point and t is the fixed distance between each section. When calculated in this manner
across the striatum of 9 rats, the mean volume of the dorsal striatum was determined to be 23.2 ±
2.1 mm3. This value is similar to previous estimations for the volume of the dorsal striatum in the rat
(Oorschot, 1996; Rymar et al., 2004). In a similar manner, the mean volume of the dorsal striatum
of 3 mice was calculated to be 9.40 ± 0.29 mm3. Once the value of V(ref) for the dorsal striatum in
each animal is determined, multiplying that volume by the absolute neuronal density yields an esti-
mate for the total number of neurons for that animal. Because most neuronal counts were performed
across 3 animals (a sample that is typical of stereological studies), in depth statistics were deemed
inappropriate, and so the value calculated from each animal is plotted along with the mean.
Topographical and statistical analysis of interneuron distributionIn order to gain a quantitative understanding of any spatial biases in cell distributions, data obtained
using StereoInvestigator regarding the position of individual interneurons and the volume of striatum
imaged in a given coronal section were imported into MATLAB software (Mathworks, version:
R2014b) for analyses with well-established Matlab toolboxes (see below). Due to the striatum’s irreg-
ular shape across its 3 dimensions, horizontal and vertical lines were first ’drawn’ from the position
of each interneuron within a given coronal plane to the contours of striatum. Each interneuron was
then assigned a value of between -1 and 1 according to its relative distance from the lateral and
medial borders of striatum at that same coronal plane and to its distance from dorsal and ventral
borders. A value of 0 indicated that an interneuron was positioned equidistantly from both striatal
borders (e.g. the medial and lateral borders of striatum for the medio-lateral axis). Notably, all dis-
tance values were calculated according to the first points along the striatal contours that were con-
tacted by the horizontal and vertical lines drawn from each interneurons position. In this manner, the
definition of ’medial’ and ’lateral’ striatum was shifted depending on the position of the interneuron
in the dorso-ventral plane; due to the irregular shape of the striatum. Likewise, the definition of ’dor-
sal’ and ’ventral’ striatum was also shifted depending on an interneuron’s position in the medio-lat-
eral plane.
Garas et al. eLife 2016;5:e16088. DOI: 10.7554/eLife.16088 25 of 36
Research article Neuroscience
As each counted interneuron in a section is given a value for each axis analyzed, and these values
were subsequently pooled together, the sample size was large enough for the use of the Wilcoxon
signed-rank test in order to determine if the mean relative value of a neural population in a given
coronal plane differed significantly from 0, a value indicating an unbiased distribution along a given
axis. In order to compare the mean positional values of two different interneuron populations along
the medio-lateral or dorso-ventral axis within a given coronal plane, the Mann-Whitney U test was
performed. When a section contained �5 neurons of a given type, positional analysis was not per-
formed in either plane as variance became too great to give meaningful averages. Multiple compari-
sons were corrected using the false discovery rate (FDR) method in order to avoid false positives
(Noble, 2009). The minimum significance level for all statistical tests was taken to be p�0.05. To
compare the variance in the distribution of neurons in the medio-lateral and dorso-ventral planes
across the rostrocaudal axis, the difference in the mean normalised ML and DV values for a single
coronal section and all other coronal sections was averaged. The absolute value of this measure
could then be used to compare the variances of ML and DV positions of different interneuron types
across different species using a Kruskal Wallis ANOVA. This measure was thus sensitive to changes
in the mean position across the different coronal sections, but would yield low values if there was a
consistent bias across all sections.
Preparation of monkey tissue for indirect immunofluorescenceMonkey tissue used for stereological cell counting was obtained from two female adult rhesus mon-
keys (Macaca mulatta, 4.5–8.5kg) from the Yerkes National Primate Research Center colony. All pro-
cedures performed were in accordance with guidelines from the National Institute of Health and
were approved by Emory’s Animal Care and Use Committee. The highly experienced Yerkes veteri-
nary staff took care of the animals. The Yerkes National Primate Research Center is an NIH-funded
institution that is fully accredited by AAALAC, and regularly inspected by USDA. All activities at the
Center are in compliance with federal guidelines. All experimental protocols concerning primates
are performed in strict accordance with the NIH Guide for the Care and Use of Laboratory Animals
and the PHS Policy on the Humane Care and Use of Laboratory Animals, and are reviewed and
approved by the Emory IACUC before the proposed studies begin. Both monkeys were anaesthe-
tized using an intravenous injection of pentobarbital (100 mg/kg). This was followed by a transcardial
perfusion with cold oxygenated Ringer’s solution, and 2 liters of a fixative solution containing 4%
paraformaldehyde and 0.1% glutaraldehyde in phosphate buffer (0.1 M, pH 7.4). Each brain was
then cut into 10 mm-thick blocks in the frontal plane, which were subsequently cut into 50 mm-thick
sections using a vibrating-blade microtome. Sections containing the caudate/putamen were col-
lected for use in immunofluorescence and cell counting procedures.
Indirect immunofluorescence and stereological cell counting in MonkeyTissueSeven coronal sections which extended from the ‘head’ to the beginning of the ‘tail’ of the caudate
nucleus were selected from each brain for the purposes of indirect immunofluorescence and stereo-
logical cell counting. The seven sections from each monkey were matched such that the overall posi-
tion of each section relative to Bregma from one monkey was similar to the sections chosen for the
second monkey. The incubation procedure and immunofluorescence protocols (see Table 1 for
details) used to prepare the tissue are identical to those described for the rat and mouse. The delin-
eation of the caudate and the putamen was defined using the Rhesus monkey brain atlas
(Paxinos et al., 2000) and was done on a section by section basis. Once delineated, the acquisition,
counting and positional analysis of immunolabeled neurons was carried out and represented in pre-
cisely the same manner as was done for the rodent (see above).
In vivo electrophysiological recording and juxtacellular labeling ofsingle neuronsJuxtacellular recording and labeling of neurons was performed in 137 anesthetized male Sprague-
Dawley rats (280-350 g) according to previous protocols (Sharott et al., 2012) and in accordance
with the Animals (Scientific Procedures) Act 1986 (UK). The induction of anesthesia was achieved
using 4% v/v isoflurane in O2, and maintained with urethane (1.3 g/kg, i.p; ethyl carbamate; Sigma),
Garas et al. eLife 2016;5:e16088. DOI: 10.7554/eLife.16088 26 of 36
Research article Neuroscience

and supplemental doses of ketamine (30 mg/kg, i.p.; Ketaset) and xylazine (3 mg/kg, i.p.; Rompun;
Bayer). Wound margins were infiltrated with local anesthetic (0.5% w/v bupivacaine; Astra). A stereo-
taxic frame (Kopf) was used to fix the animal in place, and a homeothermic heating device (Harvard
Apparatus) was used to maintain the animal’s temperature at 37 ± 0.5˚C. Recording of the electro-
corticogram (ECoG) was performed directly above the frontal (somatic sensory-motor) cortex
(4.0 mm rostral and 2.0 mm lateral of Bregma) (Paxinos and Watson, 2007)., with the reference
being placed above the ipsilateral cerebellum (Sharott et al., 2012). Prior to acquisition, recordings
of the ECoG subsequently underwent bandpass filtration (0.3–1500 Hz, �3dB limits) and amplifica-
tion (2000X; DPA-2FS filter/amplifier; npi electronic). Using a computer-controlled stepper motor
(IVM-1000; Scientifica), glass electrodes (10–30 MW in situ with a tip diameter of approximately
1.5 mm) filled with a 0.5 M solution of NaCl containing neurobiotin (1.5% w/v; Vector Laboratories)
were lowered into the dorsal striatum under stereotaxic guidance. The depth of the electrode was
constantly monitored and recorded at a resolution of 0.1 mm. Action potentials of striatal neurons
(i.e. single-unit activity) were subsequently recorded after being amplified (Axoprobe-1A amplifier;
Molecular Devices), AC-coupled, bandpass filtered at 300–5000 Hz (DPA-2FS filter/amplifier) and
then amplified one more time by a factor of one hundred. Both the ECoG and single-unit activity
were recorded at a sampling rate of 16.6 kHz using a Power1401 Analog-Digital converter and a PC
running Spike2 acquisition and analysis software (Version 7.2; Cambridge Electronic Design).
Using the ECoG, the anaesthetized animal’s brain state was defined and categorized as slow-
wave activity (SWA) or cortical activation (Magill et al., 2000). Where possible, single unit activity
was recorded during both of these states. Cortical SWA is characterized by the appearance of slow
oscillations (approximately 1 Hz), which appear as alternating surface-positive ’active components’,
and surface negative ’inactive components’ (Mallet et al., 2008) in the ECoG. Both spindle (7–
12 Hz) and gamma (27–45 Hz) oscillations also appear in this brain state, which is analogous to that
observed during drowsiness and non-rapid eye movement sleep (Steriade, 2000). In contrast, corti-
cal slow and spindle oscillations are not present in the activated brain state, which is most similar to
the brain activity recorded during the alert, behaving state.
Once a neuron was recorded, it was juxtacellularly labeled with the neurobiotin solution present
in the glass electrode (Sharott et al., 2012). Labeling was achieved by sending continuous positive
pulse currents (2–10 nA, 200 ms, 50% duty cycle) through the electrode until the recorded single-
unit activity was ’entrained’ by the injection of current. In most cases, this entrained state was main-
tained for 3 min or more in order to ensure adequate labeling. At the end of each experiment, ani-
mals were given a lethal dose of ketamine (150 mg/kg) followed by a transcardial perfusion using
50 ml of 0.05 M PBS, pH 7.4, followed by 300 ml of 0.1% w/v glutaraldehyde and 4% w/v parafor-
maldehyde (PFA) in 0.1 M PB, pH 7.4, and then by 200 ml of 4% w/v PFA in PB. Once retrieved,
brains were left for a period of 12 hr in a fixative solution of 4% w/v PFA in PB. Each neuron was
recorded and labelled in a different animal.
Tissue processing for identification of recorded and labeled neuronsUsing a vibrating microtome, 50 mm-thick parasagittal or coronal sections were serially collected and
subsequently washed in PBS for 10 min. Sections were then incubated for a minimum of 4 hr in a
solution of Triton PBS (PBS containing 0.3% v/v Triton X-100 [Sigma]) and Cy3-conjugated streptavi-
din (1:1000; Life Technologies). Sections containing neurobiotin-labelled cell bodies were isolated
and subjected to further molecular characterization by indirect immunofluorescence. Neurons with
dendritic spines were defined as spiny projections neurons (SPNs). Neurons that were suspected to
be SPNs, but that did not have well labelled dendrites were tested for Ctip2 expression
(Arlotta et al., 2008). Some confirmed SPNs were additionally tested for the expression of PPE (see
below). Neurons that did not express the SPN marker Ctip2 and/or that possessed aspiny dendrites
were tested for their expression of the major striatal interneuron markers, including parvalbumin
(PV), choline acetyltransferase (ChAT), nitric oxide synthase (NOS) and neuropeptide Y (NPY). The
initial molecular marker tested was guided by the labeled cell’s somatodendritic structure, and once
a positive expression for one of these markers was established, no other classical marker was tested
since these molecules are rarely co-expressed, except for NOS and NPY (Kawaguchi et al., 1995).
The expression of these markers was tested using the same indirect immunofluorescence protocol
used for stereological cell counting.
Garas et al. eLife 2016;5:e16088. DOI: 10.7554/eLife.16088 27 of 36
Research article Neuroscience

After being washed one final time in PBS, sections were mounted on glass slides using Vecta-
shield (Vector Laboratories) followed by the addition of a coverslip. Single-plane confocal images
were acquired using a 1 mm optical disector and the 20X (Numerical Aperture = 0.8) or 40X (Numeri-
cal Aperture = 1.4) objective lens of a laser scanning confocal microscope (Zeiss LSM 710). For each
section, absence of bleed through or cross talk between channels was investigated and was ensured
by taking sequential and separate images. Importantly, neurons were declared ’negative’ for a given
marker if other neurons along the same focal plane were shown to express the marker under investi-
gation. For neurons that were extensively filled with neurobiotin, multiple-plane images were taken
in order to form a stack to highlight the somatodendritic structure. Linear brightness and contrast
adjustments were made using Photoshop software (Creative Suite 3; Adobe Systems).
Data selection and analysis of the firing of identified striatalinterneuronsPeriods of sustained, artifact free spontaneous SWA or spontaneous cortical activation were defined
from the ECoG using previously described parameters (Sharott et al., 2012). The corresponding
unit signal was digitally isolated using spike sorting procedures including principal component analy-
sis (PCA) and template matching using Spike 2 software. Epochs with a minimum length of 60 s
(range: 60–487 s) were converted into a binary digital signal that was imported into MATLAB for fur-
ther analysis. The firing rate (spikes/s) of each recorded neuron was calculated as the number of
spikes recorded within a selected data epoch. In order to perform comparisons of firing activity, non-
parametric Kruskal–Wallis ANOVA on ranks, followed by Dunn’s test for post hoc definition of signifi-
cant pairwise differences were performed. The Mann-Whitney U or Wilcoxon signed rank test of
significant pairwise differences were also used where appropriate. For all tests performed, the signif-
icance level was p<0.05.
Analysis of waveform lengthIn order to compare the waveforms of each identified PV+ interneuron, recorded spikes were
divided into two segments, with the D1 segment representing the time taken for the waveform to
go from baseline to its peak and the D2 segment representing the time taken for the waveform to
return to the baseline from its peak. Recordings of identified striatal PV+/Scgn+ and PV+/Scgn–
interneurons were used to calculate the mean length of the D1 and the D2 waveform segment for
both interneuron types, as well as to calculate the length of the entire waveform. One identified PV
+/Scgn+ interneuron was excluded from this analysis as its D2 segment could not be properly and
consistently estimated. The lengths of the D1 and D2 segments as well as the total waveform lengths
were compared using the Mann-Whitney U test. The minimum significance level for these statistical
tests was taken to be p�0.05
Analysis of firing patternTo determine the similarity of firing patterns between neurons, we calculated the Spearman-rho cor-
relation coefficient between the ISI histograms of pairs of neurons. Thus neurons with very similar ISI
histograms would have a correlation coefficient near 1, those that were unrelated near zero, and
negatively correlated near -1. The correlation coefficients of specific pairs of neurons expressing par-
ticular combinations of molecular markers (i.e. PV+/Scgn+ or PV+/Scgn-) could then be compared
statistically. This technique has previously been used to examine the similarity post-stimulation histo-
grams of striatal neurons (Adler et al., 2013).
Phase analysisTo investigate how the activity of individual striatal neurons varied in time with respect to ongoing
cortical network activity, we analyzed the instantaneous phase relationships between striatal spike
times and ongoing cortical oscillations. Electrocorticogram signals containing robust SWA or cortical
activation were first filtered, using a neutral-phase bandpass filter (1–3 order Butterworth filter,) in
107 overlapping frequency bands with exponentially increasing center frequencies of 1-80 Hz and
increasing widths of the plus/minus 1.5x the center frequency. The instantaneous phase and power
of the ECoG in these frequency bands were separately calculated from the analytic signal obtained
via the Hilbert transform (Lachaux et al., 1999). In this formalism, peaks in the ECoG oscillations
Garas et al. eLife 2016;5:e16088. DOI: 10.7554/eLife.16088 28 of 36
Research article Neuroscience
correspond to a phase of 0˚ and troughs to a phase of 180˚. Circular phase plots and circular statisti-
cal measures were calculated using the instantaneous phase values for each spike in relation to each
frequency band. Descriptive and inferential circular statistics were then calculated using the CircStat
toolbox (Berens, 2009) for MATLAB. We included only those neurons that fired �40 spikes during
the analyzed epoch. Phase histograms were constructed using 20 phase bins and used to construct
pseudocolor plots of probability of firing as a function of phase for each frequency band. These neu-
rons were then tested for significant phase-locked firing in each frequency band (defined as having
p<0.05 in Rayleigh’s Uniformity Test). The null hypothesis for Rayleigh’s test was that the spike data
were distributed in a uniform manner. The power of the ECoG in the SWA band was compared in
data epochs used for analyses of phase-locked striatal neuron firing to test whether they were signifi-
cantly different between groups. For frequencies below 5 Hz, Rayleigh tests were only carried out
after any phase non-uniformities of the slow oscillations were corrected with the empirical cumulative
distribution function (Nakamura et al., 2014; Siapas et al., 2005).
iLFP peak histogram analysisTo investigate the timing of the activity of different striatal neuron populations in relation to local
synchronized events, we calculated histograms of action potential firing times in relation to the slow
oscillation (~1 Hz) present in the LFP recorded in striatum (using the same glass electrode that was
used to simultaneously record single-unit activity). The polarity of the LFP was inverted (iLFP) so that
peaks in the slow oscillation would correspond to the synchronized peaks in the membrane potential
of many SPNs, often referred to as ’up states’ (Goto and O’Donnell, 2001; Wilson et al., 1990).
iLFP signals containing robust SWA were first filtered, using a neutral-phase bandpass filter (2nd
order Butterworth filter) between 0.4 and 1.6 Hz. The instantaneous phase of the LFP slow oscillation
the analytic signal obtained via the Hilbert transform. iLFP peaks were then defined as the period
between each trough (i.e. –p to p). Each iLFP peak was then divided in to 100 time bins, irrespective
of the total length of the peak in time, and a histogram of action potential firing was calculated for
over these time bins (nominally assigned values from �1 to 1). Using this ’normalized time’
approach, the time of action potential firing was not dependent on the duration of the iLFP peak,
which can vary considerably between cycles. iLFP peaks that were shorter or longer than the period
corresponding to the boundaries of the filter (i.e. 0.625 s and 2.5 s) were discarded. The median fir-
ing time of all spikes on the normalized time scale was used to compare the relationship of each
neuronal population to the iLFP peak using a Kruskal-Wallis ANOVA on ranks with post-hoc Dunn
tests.
Hierarchical cluster analysisUnsupervised clustering was performed to define the degree to which interneuron types could be
segregated by their electrophysiological activity and the correlation between this functional segrega-
tion and their molecular identity. Clustering was performed using squared Euclidean distance in mul-
tidimensional space with Ward’s linkage method (Sosulina et al., 2010). The number of clusters was
established using a resampling variant of Thorndike’s method, whereby the largest difference
between successive within-cluster distances was used to determine the cutoff point. Clustering was
performed on 10000 surrogate data sets created by randomly shuffling the value for each electro-
physiological parameter and the differences between within cluster distances calculated for each sur-
rogate. This null distribution, therefore, gave the within-cluster differences that would occur if the
electrophysiological parameters were distributed randomly and was used to calculate p-values for
the real data (i.e. the probability that the difference between successive within-cluster distances
occurred by chance). The threshold for cluster separation was taken as the midpoint between the
two within-cluster distances whose difference produced the lowest p-value < 0.05. Importantly for
this study, using this criteria allowed for there to be a result where there were no significant clusters
(i.e no p-value below 0.05).
Separate analyses were performed for SWA and cortical activation as interneuron rate, pattern
and locking to cortical oscillations vary considerably between these brain states (Sharott et al,
2012). For SWA the following parameters were included in the analysis: the log of the
10th percentile of interspike interval (Log. ISI 10), the ratio of the proportion CV2 values lower than
0.2 and higher than 1.85 (CV2 ratio), the median firing time of spikes in relation normalized iLFP
Garas et al. eLife 2016;5:e16088. DOI: 10.7554/eLife.16088 29 of 36
Research article Neuroscience
peak (iLFP peak), the vector length of the phases of all action potentials in relation to the ECoG slow
(0.4–1.6 Hz), spindle (7–12 Hz) and gamma (30-48 Hz) oscillations (ECoG SWA vec, ECoG spin. vec,
ECoG gam vec., respectively). For cortical activation, Log. ISI 10 and CV2 ratio were also used in
addition to the log of the 50th percentile of interspike interval (Log. ISI 50), the log of the
85th percentile of interspike interval (Log. ISI 85), the mean of the CV2 (CV2 mean) and the mean fir-
ing rate (Rate). These parameters were chosen based on their ability to separate previously estab-
lished categories of striatal interneuron with well-defined molecular, structural, and
electrophysiological features, (cholinergic/choline acetyltransferase-expressing (ChAT+) interneur-
ons, GABAergic nitric oxide synthase /neuropeptide Y-expressing (NOS+/NPY+) interneurons and
PV+ interneurons, irrespective of Scgn-expression), and were based on previous analyses of the fir-
ing of these of these cell types in vivo (Sharott et al, 2012). This approach allowed us to evaluate
the clustering of PV+/Scgn+ against well-established interneuron types using parameters that were
generally effective for classifying interneurons, rather than being selected to discriminate specific
populations.
Identification and quantification of axonal boutons of juxacellularly-labeled interneuronsAfter in vivo recordings and effective juxtacellular labeling of select interneurons, all sections con-
taining intense Cy3 signal for neurobiotin were isolated. The section(s) containing the cell body were
separated from those containing neurobiotin-filled dendrites or axons. These cell body containing
sections were then subject to tests for PV and Scgn immunohistochemistry in order to determine
whether the labeled cell expressed one, both or neither of these proteins. If a cell was determined
to be PV+/Scgn+ or PV+/Scgn-, all sections containing the neurobiotin filled axons of the corre-
sponding cell were incubated with the following primary antibodies (see Table 1 for details): goat
anti-DARPP-32, rabbit anti-preproenkephalin (PPE) and mouse anti-gephyrin using the same 2-step
incubation method described above for stereological cell counting. As simultaneous detection of
these 3 markers (in addition to the detection of the neurobiotin signal) was not possible due to tech-
nical limitations, some axon containing sections were incubated with antibodies against DARPP-32
and gephyrin while others were incubated with antibodies against DARPP-32 and PPE. The presence
of a DARPP-32 signal was used to mark the somata of spiny projection neurons. Gephyrin, a post-
synaptic protein involved in the anchoring of inhibitory receptors to the neuron’s cytoskeleton
(Charrier et al., 2006) was used as a marker of putative GABAergic synapses. For protocols involv-
ing DARPP-32 and gephyrin detection of gephyrin expression at the point of contact between a neu-
robiotin-filled axon bouton and the edge of the DARPP-32 signal was used as indirect evidence of
the existence of synapses between axonal boutons and SPN somata. For protocols involving
DARPP-32 and PPE, the expression of PPE was used to determine whether a DARPP-32 expressing
SPN was of the direct pathway (PPE-) or indirect pathway (PPE+).
After one final wash in PBS, each section was mounted on a glass slide in Vectashield and multiple
single-plane confocal images (or stacks) were acquired using a 1 mm optical disector and a 63X
objective lens (Numerical Aperture = 1.4) of a laser scanning microscope (Zeiss LSM 710). Appropri-
ate sets of laser beams and emission windows were used for Alexa Fluor 488 and DyLight 488 (exci-
tation 488 nm, emission 492–544 nm), Cy3 (excitation 543 nm, emission 552–639 nm), and Cy5 and
DyLight649 (excitation 633 nm, emission 639–757 nm).
Analysis and quantification of appositions made by the axons ofidentified interneuronsCaptured images of axon containing sections were analyzed using Zeiss imaging software (Carl Zeiss
Microscopy, GmbH). Sections incubated with antibodies against DARPP-32 and gephyrin were ana-
lyzed in order to establish how often the swelling of an axonal bouton apposed to a DARPP-32
expressing SPN soma was co-localized with a positive gephyrin signal, signifying that these apposi-
tions likely indicated the presence of putative synapses. Other sections containing neurobiotin-filled
axons were incubated with antibodies against DARPP-32 and PPE. In such sections, putative synap-
ses made between the axons of labelled interneurons and SPNs could not be identified using
gephyrin, and appositions were instead defined when an axonal bouton (a swelling of the axon) was
in close proximity (~0.1 mm) to the cell body of a DARPP-32+ SPN. These appositions could be
Garas et al. eLife 2016;5:e16088. DOI: 10.7554/eLife.16088 30 of 36
Research article Neuroscience
viewed in 3 planes using the software to ensure that the swelling of the axon defined as a bouton
was consistent in 3 dimensions and was not the result of overexposure of the neurobiotin signal.
Appositions were established after verification that there were no detectable pixels between the cell
body signal and the neurobiotin signal of the axonal bouton. For each section, the number of bou-
tons on the neurobiotin-filled axon of an identified striatal interneuron was counted.
These counts included those boutons that apposed the cell bodies of SPNs as well as those that
did not. In cases where a bouton contacted an SPN cell body, the expression of PPE (or lack thereof)
was used to determine whether that SPN was of the direct pathway (PPE– SPN) or the indirect path-
way (PPE+ SPN). The number of appositions with PPE– and PPE+ somata was counted along with
the total number of PPE+ and PPE– SPNs that were positioned within a 30 mm radius from any neu-
robiotin filled axons.
In total, the neurobiotin-filled axons of 4 PV+/Scgn- and 4 PV+/Scgn+ interneurons were assessed
in this manner, which allowed for the counting of 100 s of boutons. This encompassed all juxtacellu-
larly-labelled neurons with well-labelled axon on 3 or more sections and any section from these neu-
rons with �10 axonal swellings was included in 1 or more protocols. For each neuron, boutons were
classified as either apposed to SPN cell bodies or not apposed. Those boutons that were apposed
were further classified as apposed to PPE+ or PPE- cell bodies. The counts for each neuron were
averaged with those of other neurons belonging to the same group (i.e. PV+/Scgn- or PV+/Scgn+).
Statistical comparisons comparing whether one group significantly differed from another were per-
formed using the Fisher exact test. The minimum significance level for these statistical tests was
taken to be p�0.05.
AcknowledgementsThis work was supported by the Medical Research Council UK (MRC; awards MC_UU_12020/5 and
MC_UU_12024/2 to PJM, and award MC_UU_12024/1 to AS), a Marie Curie European Re-integra-
tion Grant (SNAP-PD) awarded by the European Union, and the Wellcome Trust (Investigator Award
101821 to PJM). FNG and EK were supported by the MRC and University of Oxford Clarendon Fund
Scholarships. FV was supported by an MRC studentship. RS was in receipt of a Wellcome Trust Clini-
cal Fellowship (WT_RS_109030/Z/15/Z). We thank T Harkany and R Faram for early insights on secre-
tagogin, and G Hazell, B Micklem, L Norman, K Whitworth, J Janson, L Conyers and C Johnson for
technical support. We also thank G. Silberberg and K. Meletis for their expert insights.
Additional information
Funding
Funder Grant reference number Author
University Of Oxford Clarendon Fund Scholarship Farid N GarasEszter Kormann
Medical Research Council Farid N GarasEszter Kormann
Wellcome Trust 109030/Z/15/Z Rahul S Shah
Medical Research Council 1531859 Eszter Kormann
Medical Research Council Studentship Federica Vinciati
Human Frontier Science Pro-gram
LT000396/2009-L Kouichi C Nakamura
Medical Research Council MC_UU_12020/5 Peter J Magill
Medical Research Council MC_UU_12024/2 Peter J Magill
Wellcome Trust 101821 Peter J Magill
European Research Council SNAP-PD Peter J MagillAndrew Sharott
Medical Research Council MC_UU_12024/1 Andrew Sharott
Garas et al. eLife 2016;5:e16088. DOI: 10.7554/eLife.16088 31 of 36
Research article Neuroscience

National Institutes of Health NIH base grant to theYerkes National PrimateResearch Center P51OD011132
Yoland Smith
The funders had no role in study design, data collection and interpretation, or the decision tosubmit the work for publication.
Author contributions
FNG, AS, Conception and design, Acquisition of data, Analysis and interpretation of data, Drafting
or revising the article; RSS, EK, NMD, YS, Acquisition of data, Drafting or revising the article; FV,
KCN, Conception and design, Acquisition of data; MCD, Conception and design, Contributed
unpublished essential data or reagents; PJM, Conception and design, Analysis and interpretation of
data, Drafting or revising the article
Author ORCIDs
Rahul S Shah, http://orcid.org/0000-0002-8616-8693
Natalie M Doig, http://orcid.org/0000-0001-6821-0264
Kouichi C Nakamura, http://orcid.org/0000-0001-7053-0507
Matthijs C Dorst, http://orcid.org/0000-0002-1162-1481
Peter J Magill, http://orcid.org/0000-0001-7141-7071
Andrew Sharott, http://orcid.org/0000-0002-1594-3349
Ethics
Animal experimentation: All rodent experiments in this study were performed in strict accordance
with the Animals (Scientific Procedures) Act, 1986 (UK) under Home Office project licences 30/3159
and 30/2629. All non-human primate experiments in this study were performed in strict accordance
with guidelines from the National Institute of Health and were approved by Emory’s Animal Care
and Use Committee. All procedures for the primate work were performed in accordance with guide-
lines from the National Institute of Health and were approved by Emory’s Animal Care and Use
Committee. The highly experienced Yerkes veterinary staff took care of the animals. The Yerkes
National Primate Research Center is an NIH-funded institution that is fully accredited by AAALAC,
and regularly inspected by USDA. All activities at the Center are in compliance with federal guide-
lines. All experimental protocols concerning primates are performed in strict accordance with the
NIH Guide for the Care and Use of Laboratory Animals and the PHS Policy on the Humane Care and
Use of Laboratory Animals, and are reviewed and approved by the Emory IACUC before the pro-
posed studies begin.
Additional filesSupplementary files. Supplementary file 1. Distribution of PV+/Scgn– and PV+/Scgn+ interneurons in the rat striatum.
DOI: 10.7554/eLife.16088.021
. Supplementary file 2. Distribution of PV+/Scgn– and PV+/Scgn+ interneurons in the macaque cau-
date and putamen.
DOI: 10.7554/eLife.16088.022
ReferencesAbdi A, Mallet N, Mohamed FY, Sharott A, Dodson PD, Nakamura KC, Suri S, Avery SV, Larvin JT, Garas FN,Garas SN, Vinciati F, Morin S, Bezard E, Baufreton J, Magill PJ. 2015. Prototypic and arkypallidal neurons in thedopamine-intact external globus pallidus. Journal of Neuroscience 35:6667–6688. doi: 10.1523/JNEUROSCI.4662-14.2015
Adler A, Katabi S, Finkes I, Prut Y, Bergman H. 2013. Different correlation patterns of cholinergic and GABAergicinterneurons with striatal projection neurons. Frontiers in Systems Neuroscience 7:47. doi: 10.3389/fnsys.2013.00047
Garas et al. eLife 2016;5:e16088. DOI: 10.7554/eLife.16088 32 of 36
Research article Neuroscience
Alpar A, Attems J, Mulder J, Hokfelt T, Harkany T. 2012. The renaissance of Ca2+-binding proteins in thenervous system: secretagogin takes center stage. Cellular Signalling 24:378–387. doi: 10.1016/j.cellsig.2011.09.028
Arlotta P, Molyneaux BJ, Jabaudon D, Yoshida Y, Macklis JD. 2008. Ctip2 controls the differentiation of mediumspiny neurons and the establishment of the cellular architecture of the striatum. Journal of Neuroscience 28:622–632. doi: 10.1523/JNEUROSCI.2986-07.2008
Bennett BD, Bolam JP. 1994. Synaptic input and output of parvalbumin-immunoreactive neurons in theneostriatum of the rat. Neuroscience 62:707–719. doi: 10.1016/0306-4522(94)90471-5
Berens P. 2009. CircStat: A matlab toolbox for circular statistics. Journal of Statistical Software 31:1–21 . doi: 10.18637/jss.v031.i10
Berke JD. 2009. Fast oscillations in cortical-striatal networks switch frequency following rewarding events andstimulant drugs. European Journal of Neuroscience 30:848–859. doi: 10.1111/j.1460-9568.2009.06843.x
Berke JD. 2011. Functional properties of striatal fast-spiking interneurons. Frontiers in Systems Neuroscience 5:45. doi: 10.3389/fnsys.2011.00045
Bevan MD, Booth PA, Eaton SA, Bolam JP. 1998. Selective innervation of neostriatal interneurons by a subclassof neuron in the globus pallidus of the rat. Journal of Neuroscience 18:9438–9452.
Brodmann K. 1909. Localisation in the Cerebral Cortex. Leipzig: Johann Ambrosius Barth.Buckner RL, Krienen FM. 2013. The evolution of distributed association networks in the human brain. Trends inCognitive Sciences 17:648–665. doi: 10.1016/j.tics.2013.09.017
Burguiere E, Monteiro P, Feng G, Graybiel AM. 2013. Optogenetic stimulation of lateral orbitofronto-striatalpathway suppresses compulsive behaviors. Science 340:1243–1246. doi: 10.1126/science.1232380
Calzavara R, Mailly P, Haber SN. 2007. Relationship between the corticostriatal terminals from areas 9 and 46,and those from area 8A, dorsal and rostral premotor cortex and area 24c: an anatomical substrate for cognitionto action. European Journal of Neuroscience 26:2005–2024. doi: 10.1111/j.1460-9568.2007.05825.x
Charrier C, Ehrensperger MV, Dahan M, Levi S, Triller A. 2006. Cytoskeleton regulation of glycine receptornumber at synapses and diffusion in the plasma membrane. Journal of Neuroscience 26:8502–8511. doi: 10.1523/JNEUROSCI.1758-06.2006
Dodson PD, Larvin JT, Duffell JM, Garas FN, Doig NM, Kessaris N, Duguid IC, Bogacz R, Butt SJ, Magill PJ.2015. Distinct developmental origins manifest in the specialized encoding of movement by adult neurons of theexternal globus pallidus. Neuron 86:501–513. doi: 10.1016/j.neuron.2015.03.007
Doig NM, Magill PJ, Apicella P, Bolam JP, Sharott A. 2014. Cortical and thalamic excitation mediate themultiphasic responses of striatal cholinergic interneurons to motivationally salient stimuli. Journal ofNeuroscience 34:3101–3117. doi: 10.1523/JNEUROSCI.4627-13.2014
Doig NM, Moss J, Bolam JP. 2010. Cortical and thalamic innervation of direct and indirect pathway medium-sized spiny neurons in mouse striatum. Journal of Neuroscience 30:14610–14618. doi: 10.1523/JNEUROSCI.1623-10.2010
Ellender TJ, Huerta-Ocampo I, Deisseroth K, Capogna M, Bolam JP. 2011. Differential modulation of excitatoryand inhibitory striatal synaptic transmission by histamine. Journal of Neuroscience 31:15340–15351. doi: 10.1523/JNEUROSCI.3144-11.2011
English DF, Ibanez-Sandoval O, Stark E, Tecuapetla F, Buzsaki G, Deisseroth K, Tepper JM, Koos T. 2012.GABAergic circuits mediate the reinforcement-related signals of striatal cholinergic interneurons. NatureNeuroscience 15:123–130. doi: 10.1038/nn.2984
Faull RL, Nauta WJ, Domesick VB. 1986. The visual cortico-striato-nigral pathway in the rat. Neuroscience 19:1119–1132. doi: 10.1016/0306-4522(86)90128-4
Flaherty AW, Graybiel AM. 1991. Corticostriatal transformations in the primate somatosensory system.Projections from physiologically mapped body-part representations. Journal of Neurophysiology 66:1249–1263.
Franklin KBJ, Paxinos G. 2008. The Mouse Brain in Stereotaxic Coordinates. Academic Press.Freund TF, Katona I. 2007. Perisomatic inhibition. Neuron 56:33–42. doi: 10.1016/j.neuron.2007.09.012Friedman A, Homma D, Gibb LG, Amemori K, Rubin SJ, Hood AS, Riad MH, Graybiel AM. 2015. A corticostriatalpath targeting striosomes controls decision-making under conflict. Cell 161:1320–1333. doi: 10.1016/j.cell.2015.04.049
Gage GJ, Stoetzner CR, Wiltschko AB, Berke JD. 2010. Selective activation of striatal fast-spiking interneuronsduring choice execution. Neuron 67:466–479. doi: 10.1016/j.neuron.2010.06.034
Gartner W, Vila G, Daneva T, Nabokikh A, Koc-Saral F, Ilhan A, Majdic O, Luger A, Wagner L. 2007. Newfunctional aspects of the neuroendocrine marker secretagogin based on the characterization of its rat homolog.AJP: Endocrinology and Metabolism 293:E347–354. doi: 10.1152/ajpendo.00055.2007
Gattass R, Galkin TW, Desimone R, Ungerleider LG. 2014. Subcortical connections of area V4 in the macaque.Journal of Comparative Neurology 522:1941–1965. doi: 10.1002/cne.23513
Gerfen CR, Baimbridge KG, Miller JJ. 1985. The neostriatal mosaic: compartmental distribution of calcium-binding protein and parvalbumin in the basal ganglia of the rat and monkey. PNAS 82:8780–8784. doi: 10.1073/pnas.82.24.8780
Gerfen CR, Surmeier DJ. 2011. Modulation of striatal projection systems by dopamine. Annual Review ofNeuroscience 34:441–466. doi: 10.1146/annurev-neuro-061010-113641
Gittis AH, Leventhal DK, Fensterheim BA, Pettibone JR, Berke JD, Kreitzer AC. 2011. Selective inhibition ofstriatal fast-spiking interneurons causes dyskinesias. Journal of Neuroscience 31:15727–15731. doi: 10.1523/JNEUROSCI.3875-11.2011
Garas et al. eLife 2016;5:e16088. DOI: 10.7554/eLife.16088 33 of 36
Research article Neuroscience
Gittis AH, Nelson AB, Thwin MT, Palop JJ, Kreitzer AC. 2010. Distinct roles of GABAergic interneurons in theregulation of striatal output pathways. Journal of Neuroscience 30:2223–2234. doi: 10.1523/JNEUROSCI.4870-09.2010
Goto Y, O’Donnell P. 2001. Network synchrony in the nucleus accumbens in vivo. Journal of Neuroscience 21:4498–4504.
Gundersen HJ, Jensen EB. 1987. The efficiency of systematic sampling in stereology and its prediction. Journalof Microscopy 147:229–263. doi: 10.1111/j.1365-2818.1987.tb02837.x
Guo Q, Wang D, He X, Feng Q, Lin R, Xu F, Fu L, Luo M. 2015. Whole-brain mapping of inputs to projectionneurons and cholinergic interneurons in the dorsal striatum. PLoS One 10:e0123381. doi: 10.1371/journal.pone.0123381
Haber SN, Knutson B. 2010. The reward circuit: linking primate anatomy and human imaging.Neuropsychopharmacology 35:4–26. doi: 10.1038/npp.2009.129
Hoover WB, Vertes RP. 2011. Projections of the medial orbital and ventral orbital cortex in the rat. The Journalof Comparative Neurology 519:3766–3801. doi: 10.1002/cne.22733
Ibanez-Sandoval O, Tecuapetla F, Unal B, Shah F, Koos T, Tepper JM. 2011. A novel functionally distinct subtypeof striatal neuropeptide Y interneuron. Journal of Neuroscience 31:16757–16769. doi: 10.1523/JNEUROSCI.2628-11.2011
Inase M, Sakai ST, Tanji J. 1996. Overlapping corticostriatal projections from the supplementary motor area andthe primary motor cortex in the macaque monkey: an anterograde double labeling study. The Journal ofComparative Neurology 373:283–296. doi: 10.1002/(SICI)1096-9861(19960916)373:2<283::AID-CNE10>3.0.CO;2-M
Kawaguchi Y. 1993. Physiological, morphological, and histochemical characterization of three classes ofinterneurons in rat neostriatum. Journal of Neuroscience 13:4908–4923.
Kita H, Kosaka T, Heizmann CW. 1990. Parvalbumin-immunoreactive neurons in the rat neostriatum: a light andelectron microscopic study. Brain Research 536:1–15. doi: 10.1016/0006-8993(90)90002-S
Klausberger T, Somogyi P. 2008. Neuronal diversity and temporal dynamics: the unity of hippocampal circuitoperations. Science 321:53–57. doi: 10.1126/science.1149381
Koos T, Tepper JM. 1999. Inhibitory control of neostriatal projection neurons by GABAergic interneurons. NatureNeuroscience 2:467–472. doi: 10.1038/8138
Kress GJ, Yamawaki N, Wokosin DL, Wickersham IR, Shepherd GM, Surmeier DJ. 2013. Convergent corticalinnervation of striatal projection neurons. Nature Neuroscience 16:665–667. doi: 10.1038/nn.3397
Kubota Y, Kawaguchi Y. 2000. Dependence of GABAergic synaptic areas on the interneuron type and targetsize. Journal of Neuroscience 20:375–386.
Lachaux JP, Rodriguez E, Martinerie J, Varela FJ. 1999. Measuring phase synchrony in brain signals. Human BrainMapping 8:194–208. doi: 10.1002/(SICI)1097-0193(1999)8:4<194::AID-HBM4>3.0.CO;2-C
Lapper SR, Smith Y, Sadikot AF, Parent A, Bolam JP. 1992. Cortical input to parvalbumin-immunoreactiveneurones in the putamen of the squirrel monkey. Brain Research 580:215–224. doi: 10.1016/0006-8993(92)90947-8
Lee T, Kaneko T, Taki K, Mizuno N. 1997. Preprodynorphin-, preproenkephalin-, and preprotachykinin-expressingneurons in the rat neostriatum: an analysis by immunocytochemistry and retrograde tracing. The Journal ofComparative Neurology 386:229–244. doi: 10.1002/(SICI)1096-9861(19970922)386:2<229::AID-CNE5>3.0.CO;2-3
Luk KC, Sadikot AF. 2001. GABA promotes survival but not proliferation of parvalbumin-immunoreactiveinterneurons in rodent neostriatum: an in vivo study with stereology. Neuroscience 104:93–103. doi: 10.1016/S0306-4522(01)00038-0
Magill PJ, Bolam JP, Bevan MD. 2000. Relationship of activity in the subthalamic nucleus-globus pallidus networkto cortical electroencephalogram. Journal of Neuroscience 20:820–833.
Mailly P, Aliane V, Groenewegen HJ, Haber SN, Deniau JM. 2013. The rat prefrontostriatal system analyzed in3D: evidence for multiple interacting functional units. Journal of Neuroscience 33:5718–5727. doi: 10.1523/JNEUROSCI.5248-12.2013
Mallet N, Le Moine C, Charpier S, Gonon F. 2005. Feedforward inhibition of projection neurons by fast-spikingGABA interneurons in the rat striatum in vivo. Journal of Neuroscience 25:3857–3869. doi: 10.1523/JNEUROSCI.5027-04.2005
Mallet N, Micklem BR, Henny P, Brown MT, Williams C, Bolam JP, Nakamura KC, Magill PJ. 2012. Dichotomousorganization of the external globus pallidus. Neuron 74:1075–1086. doi: 10.1016/j.neuron.2012.04.027
Mallet N, Pogosyan A, Marton LF, Bolam JP, Brown P, Magill PJ. 2008. Parkinsonian beta oscillations in theexternal globus pallidus and their relationship with subthalamic nucleus activity. Journal of Neuroscience 28:14245–14258. doi: 10.1523/JNEUROSCI.4199-08.2008
McGeorge AJ, Faull RL. 1989. The organization of the projection from the cerebral cortex to the striatum in therat. Neuroscience 29:503–537. doi: 10.1016/0306-4522(89)90128-0
Mulder J, Zilberter M, Spence L, Tortoriello G, Uhlen M, Yanagawa Y, Aujard F, Hokfelt T, Harkany T. 2009.Secretagogin is a Ca2+-binding protein specifying subpopulations of telencephalic neurons. PNAS 106:22492–22497. doi: 10.1073/pnas.0912484106
Munoz-Manchado AB, Foldi C, Szydlowski S, Sjulson L, Farries M, Wilson C, Silberberg G, Hjerling-Leffler J.2016. Novel Striatal GABAergic Interneuron Populations Labeled in the 5HT3a(EGFP) Mouse. Cerebral Cortex26:96–105. doi: 10.1093/cercor/bhu179
Garas et al. eLife 2016;5:e16088. DOI: 10.7554/eLife.16088 34 of 36
Research article Neuroscience

Nakamura KC, Sharott A, Magill PJ. 2014. Temporal coupling with cortex distinguishes spontaneous neuronalactivities in identified basal ganglia-recipient and cerebellar-recipient zones of the motor thalamus. CerebralCortex 24:81–97. doi: 10.1093/cercor/bhs287
Noble WS. 2009. How does multiple testing correction work? Nature Biotechnology 27:1135–1137. doi: 10.1038/nbt1209-1135
Oorschot DE. 1996. Total number of neurons in the neostriatal, pallidal, subthalamic, and substantia nigral nucleiof the rat basal ganglia: a stereological study using the cavalieri and optical disector methods. The Journal ofComparative Neurology 366:580–599. doi: 10.1002/(SICI)1096-9861(19960318)366:4<580::AID-CNE3>3.0.CO;2-0
Parent M, Parent A. 2006. Single-axon tracing study of corticostriatal projections arising from primary motorcortex in primates. The Journal of Comparative Neurology 496:202–213. doi: 10.1002/cne.20925
Paxinos G, Huang X, Toga A. 2000. The Rhesus Monkey Brain in Stereotaxic Coordinates. San Diego: AcademicPress.
Paxinos G, Watson C. 2007. The Rat Brain in Stereotaxic Coordinates: Hard Cover Edition. Elsevier Science.Petilla Interneuron Nomenclature Group, Ascoli GA, Alonso-Nanclares L, Anderson SA, Barrionuevo G,Benavides-Piccione R, Burkhalter A, Buzsaki G, Cauli B, Defelipe J, Fairen A, Feldmeyer D, Fishell G, Fregnac Y,Freund TF, Gardner D, Gardner EP, Goldberg JH, Helmstaedter M, Hestrin S, Karube F, et al. 2008. Petillaterminology: nomenclature of features of GABAergic interneurons of the cerebral cortex. Nature Reviews.Neuroscience 9:557–568. doi: 10.1038/nrn2402
Planert H, Szydlowski SN, Hjorth JJ, Grillner S, Silberberg G. 2010. Dynamics of synaptic transmission betweenfast-spiking interneurons and striatal projection neurons of the direct and indirect pathways. Journal ofNeuroscience 30:3499–3507. doi: 10.1523/JNEUROSCI.5139-09.2010
Pruitt KD, Brown GR, Hiatt SM, Thibaud-Nissen F, Astashyn A, Ermolaeva O, Farrell CM, Hart J, Landrum MJ,McGarvey KM, Murphy MR, O’Leary NA, Pujar S, Rajput B, Rangwala SH, Riddick LD, Shkeda A, Sun H, TamezP, Tully RE, et al. 2014. RefSeq: an update on mammalian reference sequences. Nucleic Acids Research 42:D756–763. doi: 10.1093/nar/gkt1114
Ramanathan S, Hanley JJ, Deniau JM, Bolam JP. 2002. Synaptic convergence of motor and somatosensorycortical afferents onto GABAergic interneurons in the rat striatum. Journal of Neuroscience 22:8158–8169.
Rogstam A, Linse S, Lindqvist A, James P, Wagner L, Berggard T. 2007. Binding of calcium ions and SNAP-25 tothe hexa EF-hand protein secretagogin. Biochemical Journal 401:353–363. doi: 10.1042/BJ20060918
Rymar VV, Sasseville R, Luk KC, Sadikot AF. 2004. Neurogenesis and stereological morphometry of calretinin-immunoreactive GABAergic interneurons of the neostriatum. The Journal of Comparative Neurology 469:325–339. doi: 10.1002/cne.11008
Sharott A, Doig NM, Mallet N, Magill PJ. 2012. Relationships between the firing of identified striatalinterneurons and spontaneous and driven cortical activities in vivo. Journal of Neuroscience 32:13221–13236.doi: 10.1523/JNEUROSCI.2440-12.2012
Sharott A, Moll CK, Engler G, Denker M, Grun S, Engel AK, Grun S. 2009. Different subtypes of striatal neuronsare selectively modulated by cortical oscillations. Journal of Neuroscience 29:4571–4585. doi: 10.1523/JNEUROSCI.5097-08.2009
Siapas AG, Lubenov EV, Wilson MA. 2005. Prefrontal phase locking to hippocampal theta oscillations. Neuron46:141–151. doi: 10.1016/j.neuron.2005.02.028
Sigal YM, Speer CM, Babcock HP, Zhuang X. 2015. Mapping Synaptic Input Fields of Neurons with Super-Resolution Imaging. Cell 163:493–505. doi: 10.1016/j.cell.2015.08.033
Silberberg G, Bolam JP. 2015. Local and afferent synaptic pathways in the striatal microcircuitry. Current Opinionin Neurobiology 33:182–187. doi: 10.1016/j.conb.2015.05.002
Somogyi P. 2010. Hippocampus: intrinsic organization. In: Shepherd, S. G G. M (Ed). Handbook of BrainMicrocircuits. Oxford, Uk: Oxford University Press. doi: 10.1093/med/9780195389883.003.0015
Sosulina L, Graebenitz S, Pape HC. 2010. GABAergic interneurons in the mouse lateral amygdala: a classificationstudy. Journal of Neurophysiology 104:617–626. doi: 10.1152/jn.00207.2010
Steriade M. 2000. Corticothalamic resonance, states of vigilance and mentation. Neuroscience 101:243–276. doi:10.1016/S0306-4522(00)00353-5
Stern EA, Jaeger D, Wilson CJ. 1998. Membrane potential synchrony of simultaneously recorded striatal spinyneurons in vivo. Nature 394:475–478. doi: 10.1038/28848
TakadaM, Tokuno H, Nambu A, Inase M. 1998. Corticostriatal projections from the somatic motor areas of thefrontal cortex in the macaque monkey: segregation versus overlap of input zones from the primary motor cortex,the supplementary motor area, and the premotor cortex. Experimental Brain Research 120:114–128. doi: 10.1007/s002210050384
Tepper JM, Bolam JP. 2004. Functional diversity and specificity of neostriatal interneurons. Current Opinion inNeurobiology 14:685–692. doi: 10.1016/j.conb.2004.10.003
Viney TJ, Lasztoczi B, Katona L, Crump MG, Tukker JJ, Klausberger T, Somogyi P. 2013. Network state-dependent inhibition of identified hippocampal CA3 axo-axonic cells in vivo. Nature Neuroscience 16:1802–1811. doi: 10.1038/nn.3550
Wall NR, De La Parra M, Callaway EM, Kreitzer AC. 2013. Differential innervation of direct- and indirect-pathwaystriatal projection neurons. Neuron 79:347–360. doi: 10.1016/j.neuron.2013.05.014
West MJ. 1999. Stereological methods for estimating the total number of neurons and synapses: issues ofprecision and bias. Trends in Neurosciences 22:51–61. doi: 10.1016/S0166-2236(98)01362-9
Garas et al. eLife 2016;5:e16088. DOI: 10.7554/eLife.16088 35 of 36
Research article Neuroscience
Wilson CJ, Chang HT, Kitai ST. 1990. Firing patterns and synaptic potentials of identified giant aspinyinterneurons in the rat neostriatum. Journal of Neuroscience 10:508–519.
Xiong Q, Znamenskiy P, Zador AM. 2015. Selective corticostriatal plasticity during acquisition of an auditorydiscrimination task. Nature 521:348–351. doi: 10.1038/nature14225
Yeterian EH, Pandya DN. 1998. Corticostriatal connections of the superior temporal region in rhesus monkeys.The Journal of Comparative Neurology 399:384–402. doi: 10.1002/(SICI)1096-9861(19980928)399:3<384::AID-CNE7>3.0.CO;2-X
Zierhut B, Daneva T, Gartner W, Brunnmaier B, Mineva I, Berggard T, Wagner L. 2005. Setagin andsecretagogin-R22: Posttranscriptional modification products of the secretagogin gene. Biochemical andBiophysical Research Communications 329:1193–1199. doi: 10.1016/j.bbrc.2005.02.093
Garas et al. eLife 2016;5:e16088. DOI: 10.7554/eLife.16088 36 of 36
Research article Neuroscience