SecondIG Patel lecture New Delhi 26 October 2007 · SecondIG Patel lecture New Delhi 26 October...
34
1 The Economics of Climate Change Nicholas Stern Second IG Patel lecture New Delhi 26 October 2007
Transcript of SecondIG Patel lecture New Delhi 26 October 2007 · SecondIG Patel lecture New Delhi 26 October...

1
The Economics of Climate ChangeNicholas Stern
Second IG Patel lectureNew Delhi
26 October 2007

2
The economics of climate change
• Impacts, Risks, Costs: Global• Possible Impacts on India• Planning for Adaptation• Mitigation Policy • Global Deal

3
Impacts, Risks, Costs: Global

4
Why science implies this externality is different
• Global
• Long-term; irreversibilities
• Uncertainty
• Scale

5
Key messages
• The costs of strong and urgent action to avoid serious impacts from climate change are substantially less than the the damages thereby avoided
• Even with strong action to reduce greenhouse gas emissions adaptation must be a crucial part of development strategy
• Policy requires urgent and international action, pricing for damages from greenhouse gases, supporting technology development and combating deforestation

6
Projected impacts of climate change
1°C 2°C 5°C4°C3°C
Sea level rise threatens major cities
Falling crop yields in many areas, particularly developing regions
FoodFood
WaterWater
EcosystemsEcosystems
Risk of Abrupt and Risk of Abrupt and Major Irreversible Major Irreversible ChangesChanges
Global temperature change (relative to pre-industri al)0°C
Falling yields in many developed regions
Rising number of species face extinction
Increasing risk of dangerous feedbacks and abrupt, large-scale shifts in the climate system
Significant decreases in water availability in many areas, including Mediterranean and Southern Africa
Small mountain glaciers disappear – water supplies threatened in several areas
Extensive Damage to Coral Reefs
Extreme Extreme Weather Weather EventsEvents
Rising intensity of storms, forest fires, droughts, flooding and heat waves
Possible rising yields in some high latitude regions
7
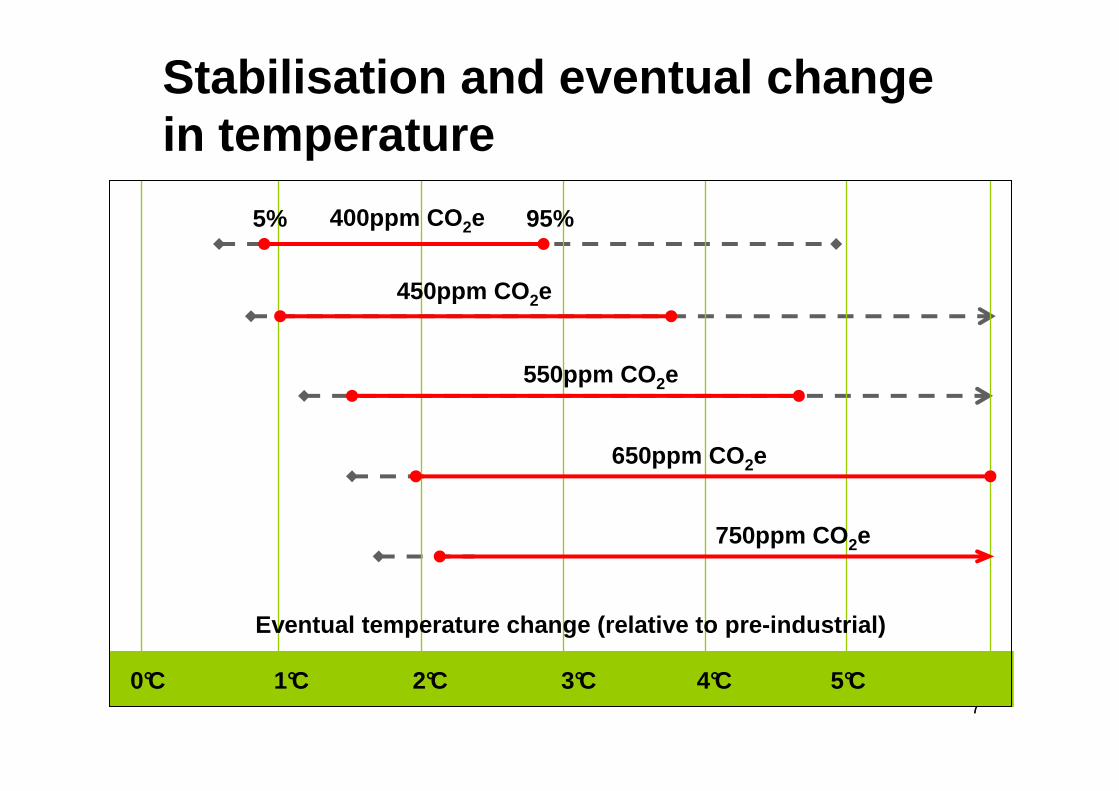
Stabilisation and eventual change in temperature
1°C 2°C 5°C4°C3°C
400ppm CO 2e
450ppm CO 2e
550ppm CO 2e
650ppm CO 2e
750ppm CO 2e
5% 95%
Eventual temperature change (relative to pre-indust rial)
0°C

8
Aggregate estimates of impactsSensitivity of total cost of climate change to dama ge function exponent and consumption elasticity of social marginal utility in baseline-climate scen ario (mean BGE loss, 5-95% confidence interval).
• Models should not be taken too literally• Assumptions on discounting, risk aversion and equity affect the
results• Review central case was top left hand corner: high weight on future,
conservative on risks. Plausible case for centring the argument further down the diagonal. Note: intra generational distribution, changing relative price of environmental goods, irreversibilities, all omitted and introduction would increase damage estimates
Damage function exponent
Consumption elasticity of social marginal utility (η)
1 1.5 2
2 10.4 (2.2-22.8) 6.0 (1.7-14.1) 3.3 (0.9-7.8)
2.5 16.5 (3.2-37.8) 10.0 (2.3-24.5) 5.2 (1.1-13.2)
3 33.3 (4.5-73.0) 29.3 (3.0-57.2) 29.1 (1.7-35.1)

9
Delaying mitigation is dangerous and costly
Stabilising below 450ppm CO2e would require emissions to peak by 2010 with 6-10% p.a. decline thereafter
If emissions peak in 2020, we can stabilise below 550ppm CO2e if we achieve annual declines of 1 – 2.5% afterwards. A 10 year delay almost doubles the annual rate of decline required
0
10
20
30
40
50
60
70
80
90
100
2000 2010 2020 2030 2040 2050 2060 2070 2080 2090 2100
Glo
bal E
mis
sion
s (G
tCO
2e)
450ppm CO2e
500ppm CO2e (falling to450ppm CO2e in 2150)
550ppm CO2e
Business as Usual
50GtCO2e
70GtCO2e
65GtCO2e
10
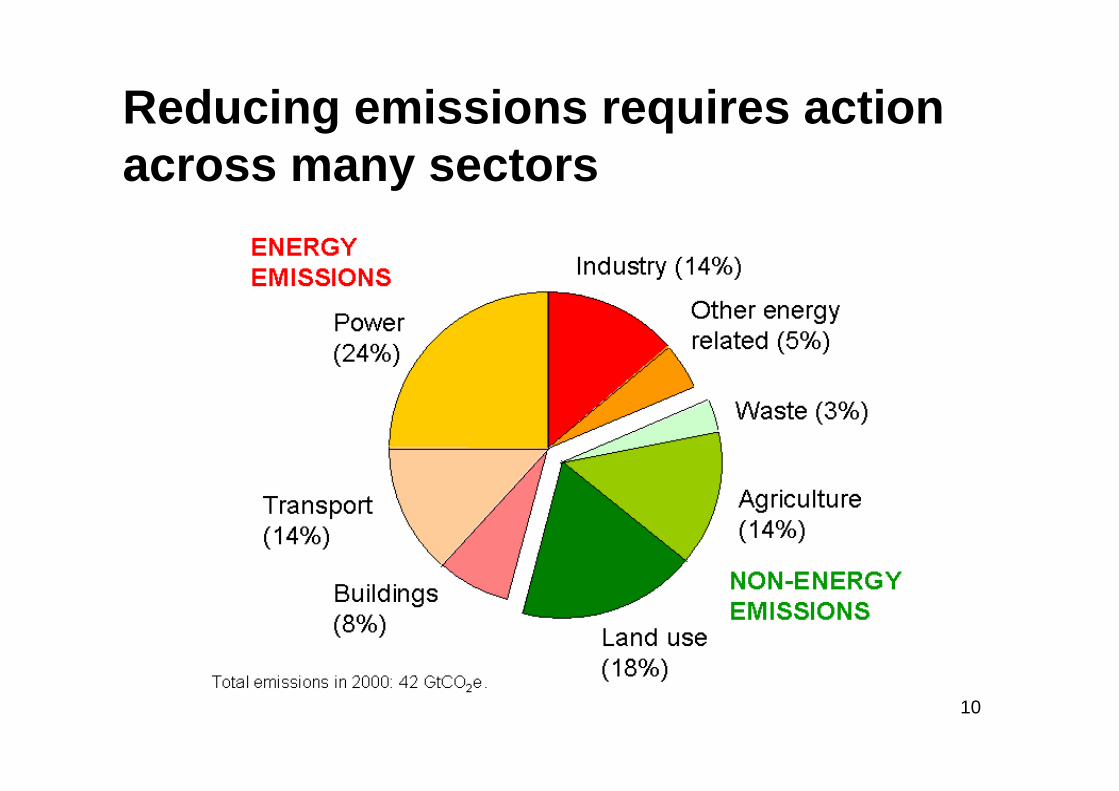
Reducing emissions requires action across many sectors

11
Cost estimates• Review examined results from bottom-up & top-down
studies: concluded that world could stabilise below 550ppm CO2e for around 1% of global GDP
• Subsequent analyses Edenhofer/IPCC top down have indicated lower figures
• So too have bottom-up IEA and McKinsey
• Options for mitigation: McKinsey analysis examines approach of chapter 10 of Review in more detail

12
2030
3 10 11 12 13 14 15 16 17 18 192 20 21 22 23 24 25 26 270
-150
1
-140-130-120
-110-100
-10
4030
2010
0
987654
-160
-20-30-40
-50-60-70
-80-90
Cost of abatementEUR/tCO2e
Insulation improvements
Fuel efficient commercial vehicles
Lighting systemsAir Conditioning
Water heatingFuel efficient vehicles
Sugarcanebiofuel
Nuclear
Livestock/soils
Forestation
Industrialnon-CO2
CCS EOR;New coal
Industrial feedstock substitution
Wind;lowpen.
Forestation
Celluloseethanol CCS;
new coal
Soil
Avoided deforestation
America
Industrial motorsystems
Coal-to-gas shiftCCS;
coal retrofit
Waste
Industrial CCS
AbatementGtCO2e/year
AvoiddeforestationAsia
Stand-by losses
Co-firingbiomass
Smart transitSmall hydro
Industrial non-CO2Airplane efficiency
Solar
• ~27 Gton CO2e below 40 EUR/ton (-46% vs. BAU)
• ~7 Gton of negative and zero cost opportunities• Fragmentation of opportunities
McKinsey bottom-up approach

13
Possible impacts on India
14
• Number of extreme rainfall events likely to increase
• Rapid retreat of Himalayan glaciers and snow
• Severity of droughts and floods likely to increase; torrents in rainy season, dry rivers in dry season
• Water scarcity in the long run caused by reduced inflows in river system
Intense monsoons, glaciers’recession, flooding and water scarcity

15
Rate of Glacier Retreat in the Himalaya
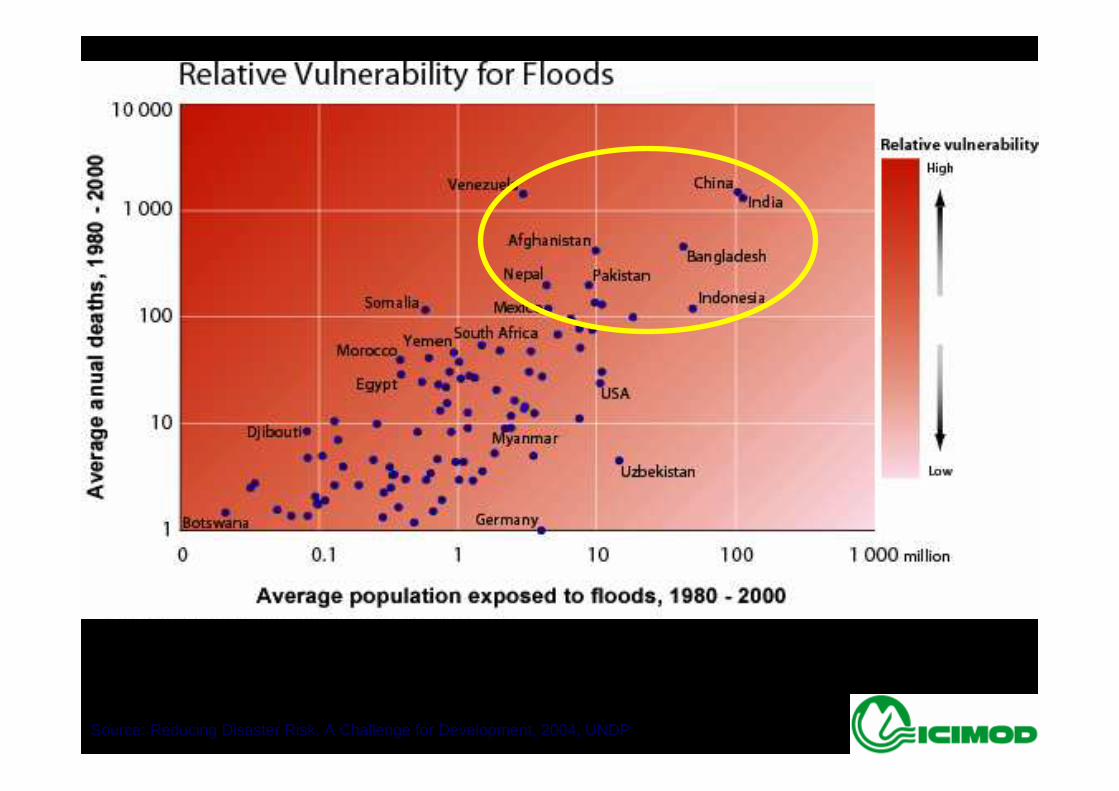
16Source: Reducing Disaster Risk, A Challenge for Development, 2004, UNDP

17
Population and agriculture water use
0
500
1000
1500
2000
2500
1900 1940 1950 1960 1970 1980 1990 1995 2000 2010 2025
Year
Pop
ulat
ion
(mill
ion)
0
200
400
600
800
1000
1200
1400
Agr
icul
ture
wat
er u
se
(Km
3 /yea
r)
Water use: S Asia
Pop: S Asia
Water use: SE Asia
Pop: SE Asia
PROGNOSIS
Increase in Population and Agricultural Water Use in Asia

18
Planning for Adaptation

19
Adaptation and development
• Development key to adaptation: enhances resilience and increases capacity
• Adaptation to current climate variability reduces costs of natural disasters
• Adaptation requires economy-wide planning and regional co-operation– Leadership and co-ordination is essential: key role
for Heads of Government, Finance and Economic Ministries
• How well is India prepared for the change in climate? For example record floods this year

20
Responsibilities for adaptation• Central role for individuals, firms, and civil society in responding
to climate change• Measures for strengthening adaptation include
– Ensuring access to high-quality information – Increasing the resilience of livelihoods and infrastructure – Improving governance– Integrating climate change impacts in issues in all national, sub-
national and sectoral planning processes and macro-economic projections.
– Encouraging a core ministry with a broad mandate, such as finance, economics or planning, to be fully involved in mainstreaming adaptation
• Local study of impacts and possible responses is crucial

21
International support for adaptation
• Development in context of climate change will be much more costly: likely to be scores of billions of dollars p.a.
• Rich countries are main source of climate problem: responsibility to help finance consensus
• Essential to meet commitments made to double aid flows by 2010
• UNFCCC process and funds essential to support capacity-building and prioritisation
• Given necessary scale additional ODA flows will be a bigger source of funding for adaptation and development

22
Global opportunities for adaptationInternational action also has a key role in supporting global public goods for adaptation:– Forecasting climate and weather– Disaster response– More resilient crop varieties – Technologies for water conservation and
irrigation– New methods to combat land degradation – Prevention and treatment of malaria and other
water- and vector- borne diseases

23
Mitigation Policy

24
Carbon dioxide emission projections
98.90%3.00%678341Brazil
94.30%2.90%1,9931,026India
144.80%4.00%8,1343,323China
11.40%0.50%3,9533,550Western Europe
38.70%1.40%7,9805,752United States of America
100.50%3.10%20,53310,241non-Annex I
28.90%1.10%18,25814,169Annex I
58.90%2.00%38,79124,410World
Total GrowthAvg. Annual Growth20252002Country
EIA Reference Case, MtCO2 (from energy): 2002-2025
Source: Climate Analysis Indicators Tool (CAIT) Version 4.0.
(Washington, DC: World Resources Institute, 2007).
25
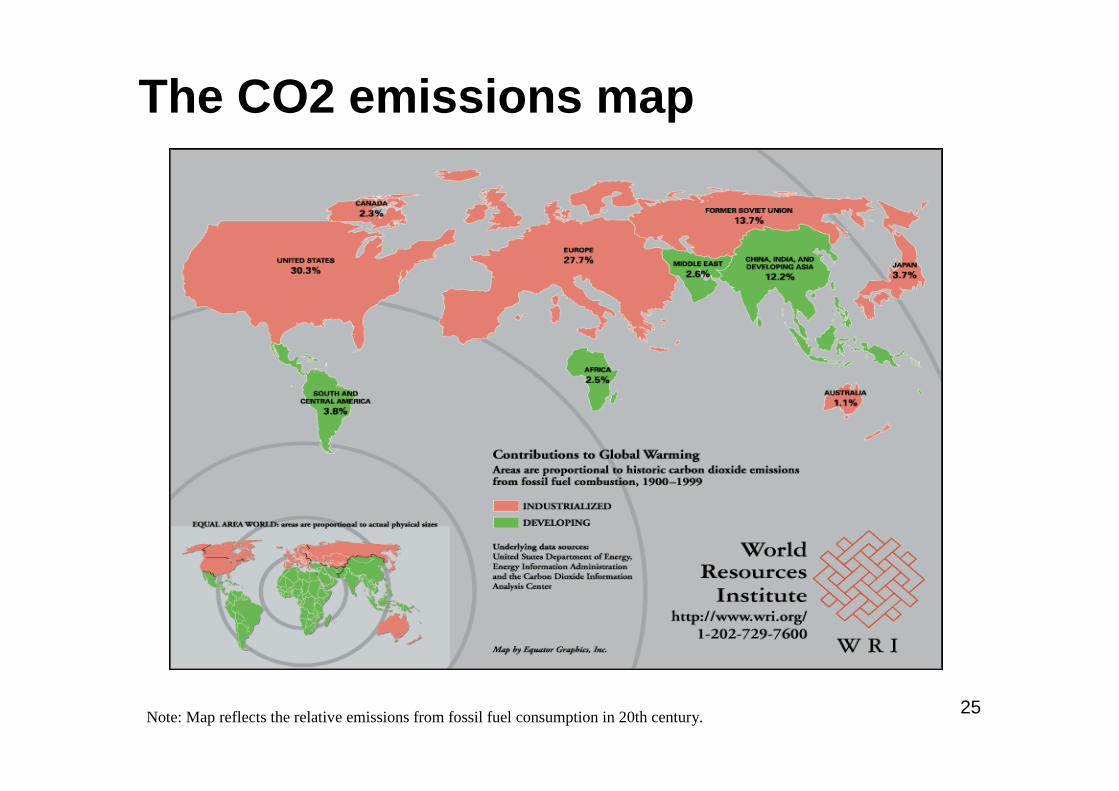
The CO2 emissions map
Note: Map reflects the relative emissions from fossil fuel consumption in 20th century.

26
Target flows• Current 40-45 GtCO2e p.a. Current stocks around
430ppm; pre-industrial stocks 280ppm
• Heiligendamm 2007 pledge to halve global emissions by 2050 – consistent with stabilisation of CO2e below 500ppm
• The United States and the EU countries combined accounted for over half of cumulative global emissions from 1900 to 2005
• 50% reduction by 2050 requires per capita global GHG emissions of 2-3T/capita (20-25 Gt divided by 9 billion population)
• Currently US ~ 20+, Europe ~10+, China ~4, India ~1 T/capita

27
The GHG ‘reservoir’• Long-term stabilisation at 550ppm CO2e implies that only
a further 120ppm CO2e can be ‘allocated’ for emission, given that we start at 430ppm
• Developing country can largely claim this 120ppm given their low emissions in the past. Note that rich countries largely responsible for increase from 280ppm to 430ppm
• Equity requires a discussion of the appropriate use of this reservoir given past history
• Thus convergence of flows does not fully capture the equity story, from emissions perspective
• Equity issues arise also in adaptation, given responsibilities for past increases

28
Mitigation policy instruments
• Pricing the externality- carbon pricing via tax or trading, or implicitly through regulation
• Bringing forward lower carbon technology-research, development and deployment
• Overcoming information barriers and transaction costs– regulation, standards
• Promoting a shared understanding of responsible behaviour across all societies –beyond sticks and carrots
29
Growth, change and opportunity
• Strong mitigation costs around 1% p.a. worldwide• Strong mitigation is fully consistent with the aspirations for growth and development in poor and rich countries. Business as usual is not.• Costs will not be evenly distributed:
•Competitiveness impacts can be reduced by acting together.
•New markets will be created. Investment in low-carbon electricity sources could be over $500bn a year by 2050.
• Mitigation policy can also be designed to support other objectives:
•energy - air quality, energy security and energy access
•forestry - watershed protection, biodiversity, rural livelihoods

30
Global deal

31
Key elements of a global deal: I
Targets and Trade
•Rich countries to take on strong individual targets, creating demand side for reductions
•Rich country reductions and trading schemes designed to be open to trade with other countries, including developing countries
•Supply side from developing countries simplified to allow much bigger markets for emissions reductions, through sectoral or technological benchmarking

32
Key elements of a global deal: IIFunding Issues• Strong initiatives, with public funding, on deforestation to
prepare for inclusion in trading
• Demonstration and sharing of technologies
• Rich countries to deliver on Monterrey and Gleneagles commitments on ODA in context of extra costs of development arising from climate change
Combination of the above can, with appropriate market institutions, help overcome the inequities of climate change and provide incentives for developing countries to play strong role in global deal, eventually taking on their own targets.

33
India: starting point for policy
• India is very vulnerable to climate change
• India will be central to discussion of a global deal
• India’s contribution to past emissions is low & India has very small current emissions per capita
• India has strong and important objectives in growth and poverty reduction
• Note Stern Review has no policy recommendations for India

34
India: possible policy
• Support global target: Heiligendamm : 50% by 2050• Insist on strong responsibilities for rich countries: at least
75% reductions by 2050• Promote GHG trading to generate financial flow• Encourage rapid technological advance with sharing of
technologies at reasonable cost• Work towards targets which take into account history of
flows, standard of living and development aspirations, as flows and technologies are established
• Pursue urgently intensive study of challenges of adaptation