Secondary Structural Analysis of Families of Protein ... · PDF filethe biological sequences...
5
Volume 5(2): 047-051 (2012) - 047 J Comput Sci Syst Biol ISSN:0974-7230 JCSB, an open access journal Research Article Open Access Manikandakumar et al., J Comput Sci Syst Biol 2012, 5:2 http://dx.doi.org/10.4172/jcsb.1000089 Research Article Open Access Computer Science Systems Biology Keywords: Secondary structure; Chaos game representation; Protein sequences; Self-similar structure Introduction CGR is an effective method for visualizing any structural features if it is given as a sequence of elements [1,2] analyzed by the genomic signature appears as a powerful tool for investigating the mechanisms of DNA maintenance from which the DNA structure results. It would be necessary to understand the patterns they exhibit and to be able to interpret them in a biologically meaningful way [3]. All informational macromolecules of biological interest are linear polymers. e subsequences of a genome exhibit the main characteristics of the whole genome, attesting to the validity of the genomic signature concept [2]. A great extent concentration has newly been focused on analyzing the biological sequences of both Deoxyribo Nucleic Acid (DNA) and proteins using the patterns observed in their graphical representations [1-9] and mathematical descriptions. ese studies have shown applications in chemo informatics and bioinformatics. Chaos Game Representation (CGR) for gene (or DNA) sequences was introduced by [4,5] the underlying structures of genome sequences of a few model organisms that were obtained using CGR plots. CGR also offers new possibilities to resolve scale dependencies for information content in sequences [7]. CGR is a technique for studying the non randomness of genetic sequences. Statistical analysis of DNA sequences has been explored by a number of researchers [4]. CGR is an algorithm that reveals the sequence pattern in DNA in the form of fractal structures in graphical representations. Since genome sequences of many organisms are now available it is possible for the CGR method to analyze the intrinsic structures of the gene or protein sequences and hence to classify them. [3] Used CGR method to explain the observed patterns by calculating the di-nucleotide and tri-nucleotide frequencies. [2] Converted CGR pattern of DNA sequences into structures and used the distances between them to find out phylogenetic proximity. [10-15] analyzed different proteome and genome sequences. Research using particular sequences of numbers to control the chaos game, and thereby analyze or characterize the sequences themselves, would be highly relevant. No such other work has been found [4]. e mathematical properties of DNA sequences from coding and noncoding regions are analyzed by [16]. Multifractal characterization of length sequences of coding and noncoding segments in a complete genome are analysed [17]. ose plots were found to exhibit distinct and visually identifiable patterns. A less detailed structure description, with reference to helix, sheet, turn and random coil structures are used for characterizing the polypeptide structure [1]. e amino acid sequence itself is also redundant in the sense that protein function is not affected by some amino acid substitutions. Redundancy in proteins is a function of position and a consequence of similar physicochemical properties between some amino acids [7]. e concept of protein structural class was first proposed by [18]. According to this concept, a globular protein can be assigned to one of the four structural classes, i.e. all- α, all- β, α + β and α / β. e all- α and all - β proteins were denoted to be composed of almost entirely α - helices and β - strands, respectively. e α + β proteins were denoted to be composed of separate segments of α - helices and β - strands, whereas the α / β proteins were denoted to be composed of mixed segments of α - helices and β - strands. In this paper, we describe a novel way of applying CGR method to different secondary structural classification of protein sequences, to produce ‘Sierpinski triangle’ type fractal objects possessing self-similar structure. In this method, we have considered the twenty different amino acid residues as belonging to convert in three types of secondary structure residues namely, Helix (H), Sheet (E) and Coiled (C) [5]. *Corresponding author: K. Manikandakumar, Department of Physics, Bharathidasan University College, Lalgudi, Tiruchirappalli District, Tamil Nadu, India, E-mail: [email protected] Received Febraury 28, 2012; Accepted April 20, 2012; Published April 23, 2012 Citation: Manikandakumar K, Raj KG, Muthukumaran S, Srikumar R (2012) Secondary Structural Analysis of Families of Protein Sequences using Chaos Game Representation. J Comput Sci Syst Biol 5: 047-051. doi:10.4172/jcsb.1000089 Copyright: © 2012 Manikandakumar K, et al. This is an open-access article distributed under the terms of the Creative Commons Attribution License,which permits unrestricted use, distribution, and reproduction in any medium, provided the original author and source are credited. Abstract We describe a novel way of applying Chaos Game Representation (CGR) method to protein sequences of different families by considering the amino acids into three secondary structure groups of residues. The present study to identify the patterns of the secondary structure of family of protein sequences for different ratios and to analyze to apply CGR method to protein structures, so as to find out any intrinsic self-similar pattern exhibited in the CGR plot. Further, we find that the sequences of different protein families belonging to all the four major structural classes namely, all α, all β, α plus β and α by β produce a similar kind of self-similar fractal structure. In a broader sense, is there any way to obtain a single graphical representation depicting any intrinsic self-similar pattern exhibited by the different protein families? Secondary Structural Analysis of Families of Protein Sequences using Chaos Game Representation K. Manikandakumar 1 *, K. Gokul Raj 2 , S. Muthukumaran 3 and R. Srikumar 4 1 Department of Physics, Bharathidasan University College, Tamil Nadu, India 2 Department of Computer Science, Jamal Mohamed College, Tamil Nadu, India 3 Department of Physics, The H.H. Raja’s College, Tamil Nadu, India 4 Tamil Nadu State AIDS Control Society (TANSACS), Tamil Nadu, India
Transcript of Secondary Structural Analysis of Families of Protein ... · PDF filethe biological sequences...

Volume 5(2): 047-051 (2012) - 047 J Comput Sci Syst Biol ISSN:0974-7230 JCSB, an open access journal
Research Article Open Access
Manikandakumar et al., J Comput Sci Syst Biol 2012, 5:2http://dx.doi.org/10.4172/jcsb.1000089
Research Article Open Access
Computer Science
Systems Biology
Keywords: Secondary structure; Chaos game representation; Protein sequences; Self-similar structure
IntroductionCGR is an effective method for visualizing any structural features
if it is given as a sequence of elements [1,2] analyzed by the genomic signature appears as a powerful tool for investigating the mechanisms of DNA maintenance from which the DNA structure results. It would be necessary to understand the patterns they exhibit and to be able to interpret them in a biologically meaningful way [3]. All informational macromolecules of biological interest are linear polymers. The subsequences of a genome exhibit the main characteristics of the whole genome, attesting to the validity of the genomic signature concept [2]. A great extent concentration has newly been focused on analyzing the biological sequences of both Deoxyribo Nucleic Acid (DNA) and proteins using the patterns observed in their graphical representations [1-9] and mathematical descriptions. These studies have shown applications in chemo informatics and bioinformatics. Chaos Game Representation (CGR) for gene (or DNA) sequences was introduced by [4,5] the underlying structures of genome sequences of a few model organisms that were obtained using CGR plots. CGR also offers new possibilities to resolve scale dependencies for information content in sequences [7].
CGR is a technique for studying the non randomness of genetic sequences. Statistical analysis of DNA sequences has been explored by a number of researchers [4]. CGR is an algorithm that reveals the sequence pattern in DNA in the form of fractal structures in graphical representations. Since genome sequences of many organisms are now available it is possible for the CGR method to analyze the intrinsic structures of the gene or protein sequences and hence to classify them. [3] Used CGR method to explain the observed patterns by calculating the di-nucleotide and tri-nucleotide frequencies. [2] Converted CGR pattern of DNA sequences into structures and used the distances between them to find out phylogenetic proximity. [10-15] analyzed different proteome and genome sequences.
Research using particular sequences of numbers to control the chaos game, and thereby analyze or characterize the sequences themselves,
would be highly relevant. No such other work has been found [4]. The mathematical properties of DNA sequences from coding and noncoding regions are analyzed by [16]. Multifractal characterization of length sequences of coding and noncoding segments in a complete genome are analysed [17]. Those plots were found to exhibit distinct and visually identifiable patterns. A less detailed structure description, with reference to helix, sheet, turn and random coil structures are used for characterizing the polypeptide structure [1]. The amino acid sequence itself is also redundant in the sense that protein function is not affected by some amino acid substitutions. Redundancy in proteins is a function of position and a consequence of similar physicochemical properties between some amino acids [7].
The concept of protein structural class was first proposed by [18]. According to this concept, a globular protein can be assigned to one of the four structural classes, i.e. all- α, all- β, α + β and α / β. The all- α and all - β proteins were denoted to be composed of almost entirely α - helices and β - strands, respectively. The α + β proteins were denoted to be composed of separate segments of α - helices and β - strands, whereas the α / β proteins were denoted to be composed of mixed segments of α - helices and β - strands.
In this paper, we describe a novel way of applying CGR method to different secondary structural classification of protein sequences, to produce ‘Sierpinski triangle’ type fractal objects possessing self-similar structure. In this method, we have considered the twenty different amino acid residues as belonging to convert in three types of secondary structure residues namely, Helix (H), Sheet (E) and Coiled (C) [5].
*Corresponding author: K. Manikandakumar, Department of Physics, Bharathidasan University College, Lalgudi, Tiruchirappalli District, Tamil Nadu, India, E-mail: [email protected]
Received Febraury 28, 2012; Accepted April 20, 2012; Published April 23, 2012
Citation: Manikandakumar K, Raj KG, Muthukumaran S, Srikumar R (2012) Secondary Structural Analysis of Families of Protein Sequences using Chaos Game Representation. J Comput Sci Syst Biol 5: 047-051. doi:10.4172/jcsb.1000089
Copyright: © 2012 Manikandakumar K, et al. This is an open-access article distributed under the terms of the Creative Commons Attribution License,which permits unrestricted use, distribution, and reproduction in any medium, provided the original author and source are credited.
AbstractWe describe a novel way of applying Chaos Game Representation (CGR) method to protein sequences of
different families by considering the amino acids into three secondary structure groups of residues. The present study to identify the patterns of the secondary structure of family of protein sequences for different ratios and to analyze to apply CGR method to protein structures, so as to find out any intrinsic self-similar pattern exhibited in the CGR plot. Further, we find that the sequences of different protein families belonging to all the four major structural classes namely, all α, all β, α plus β and α by β produce a similar kind of self-similar fractal structure. In a broader sense, is there any way to obtain a single graphical representation depicting any intrinsic self-similar pattern exhibited by the different protein families?
Secondary Structural Analysis of Families of Protein Sequences using Chaos Game RepresentationK. Manikandakumar1*, K. Gokul Raj2, S. Muthukumaran3 and R. Srikumar4 1Department of Physics, Bharathidasan University College, Tamil Nadu, India2Department of Computer Science, Jamal Mohamed College, Tamil Nadu, India3Department of Physics, The H.H. Raja’s College, Tamil Nadu, India4Tamil Nadu State AIDS Control Society (TANSACS), Tamil Nadu, India
Citation: Manikandakumar K, Raj KG, Muthukumaran S, Srikumar R (2012) Secondary Structural Analysis of Families of Protein Sequences using Chaos Game Representation. J Comput Sci Syst Biol 5: 047-051. doi:10.4172/jcsb.1000089
Volume 5(2): 047-051 (2012) - 048 J Comput Sci Syst Biol ISSN:0974-7230 JCSB, an open access journal
Analyzed by four kinds of elements can be used by replacing the four nucleotides with the four secondary structure elements at the vertices of the square. Using this CGR technique, we show that the protein sequences of different structural classification produce an intrinsic fractal structure of ‘Sierpinski triangle’ type. We find that all the four major structural classes of proteins namely, all α, all β, α plus β and α by β produce similar kinds of self-similar fractal structure.
Materials and MethodsDetails of data used
There are four major classes of Structural Classification of Proteins (SCOP) namely, all α, all β, α plus β and α by β. In the present study, we have chosen a few representative families of proteins from each of these four classes. The selected protein sequences are downloaded from the Protein Data Bank (PDB) web site using SCOP option (http://www.rcsb.org/pdb/browse/browse.do?t=11&useMenu=no). These se-quences are used for generating the CGR of the corresponding protein families.
Grouping and conversion of secondary structure residues from amino acid residues
The confirmation of a macromolecule may be given as the sequence of dihedral angles around the single bonds along the polymer chain [1]. In order to find out the intrinsic secondary structures of protein sequences, we have grouped the amino acid residues mainly into three groups [19] namely, Helix, Sheet and Coiled residues and denoted them as H, E and C, respectively. We fully converted the primary structure of family of protein sequences into secondary structure of family of protein sequences based on the above grouping method. This will represent and coding by the secondary structure of the residues. The list of amino acids selected in each of these three groups is shown in Table 1.
Generation of sierpinski objects from protein sequences
The H, E and C positions are represented by the vertices (0.0, 0.0), (1.0, 0.0) and (0, 5, 1.0) respectively of a triangle. Here, we use the representative of the secondary structure residues of the protein sequences belonging to different families as data. The initial point may be chosen arbitrarily as any point within the triangle under consideration. We begin with the initial point xi = 0.5, yi = 0.5. The first amino acid residue is read in and depending on the group, we identify the vertex it belongs. For example, if the first amino acid residue is Cystine (C), which belongs to Sheet (E) group, it corresponds to the vertex vix = 1.0, viy = 0.0. The successive points (xi+1, yi+1) are calculated iteratively as
xi+1 = ½ (xi + vix) & yi+1 = ½ (yi + viy). (A)
The above Equation (A) actually computes the mid-point between the initial value (0.5, 0.5) and the first value (1.0, 0.0), which is calculated as xi+1 = 0.75, yi+1 = 0.25 and we mark this point with a dot. Next we
have taken the second amino acid residue and if it is Aspartic acid (D), which belongs to the coiled (C) group (vertex vix = 0.5, viy = 1.0), then the mid-point between the previous point (0.75, 0.25) and the second vertex (0.5, 1.0) is calculated by using Equation (A) as (0.625, 0.625), where we mark the next dot. By repeating this procedure for all the remaining amino acid residues of the sequences in a protein family, we obtain the CGR plot of the given family.
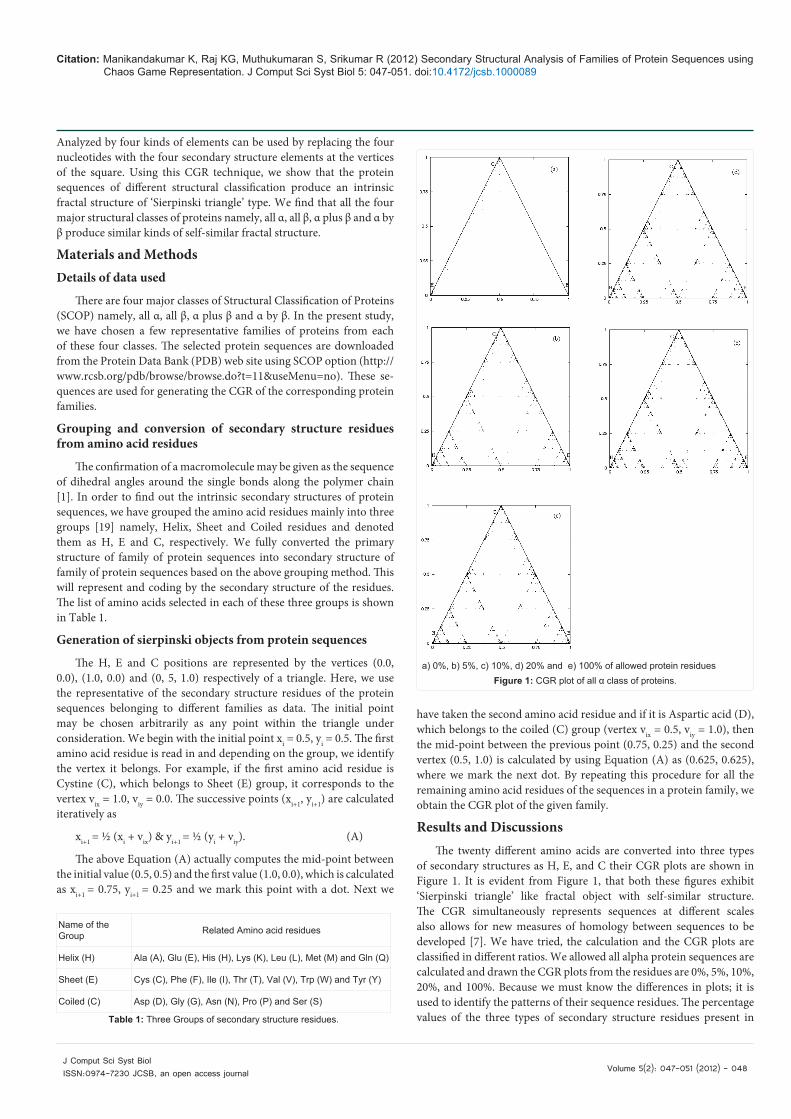
Results and DiscussionsThe twenty different amino acids are converted into three types
of secondary structures as H, E, and C their CGR plots are shown in Figure 1. It is evident from Figure 1, that both these figures exhibit ‘Sierpinski triangle’ like fractal object with self-similar structure. The CGR simultaneously represents sequences at different scales also allows for new measures of homology between sequences to be developed [7]. We have tried, the calculation and the CGR plots are classified in different ratios. We allowed all alpha protein sequences are calculated and drawn the CGR plots from the residues are 0%, 5%, 10%, 20%, and 100%. Because we must know the differences in plots; it is used to identify the patterns of their sequence residues. The percentage values of the three types of secondary structure residues present in
a) 0%, b) 5%, c) 10%, d) 20% and e) 100% of allowed protein residuesFigure 1: CGR plot of all α class of proteins.
Name of the Group Related Amino acid residues
Helix (H) Ala (A), Glu (E), His (H), Lys (K), Leu (L), Met (M) and Gln (Q)
Sheet (E) Cys (C), Phe (F), Ile (I), Thr (T), Val (V), Trp (W) and Tyr (Y)
Coiled (C) Asp (D), Gly (G), Asn (N), Pro (P) and Ser (S)
Table 1: Three Groups of secondary structure residues.

Citation: Manikandakumar K, Raj KG, Muthukumaran S, Srikumar R (2012) Secondary Structural Analysis of Families of Protein Sequences using Chaos Game Representation. J Comput Sci Syst Biol 5: 047-051. doi:10.4172/jcsb.1000089
Volume 5(2): 047-051 (2012) - 049 J Comput Sci Syst Biol ISSN:0974-7230 JCSB, an open access journal
Sl. No. SCOPClass
Allowed Sequence (%)
Total No. of Seq.
No. of UsedSeq.
No. of LeftSeq.
No. ofHelix residues
(H)
No. of Sheets residues
(E)
No. of Coiled residues
(C)
Total No. of residues
1. all α 0 4641 1855 2786 202211 (64.88%) 0(0.00%) 109462 (35.12%) 311673
2. all α 5 4641 2526 2115 318627 (58.17%) 5746 (1.05%) 223386 (40.78%) 547759
3. all α 10 4641 3354 1287 434916 (56.55%) 22572 (2.93%) 311590 (40.51%) 769078
4. all α 20 4641 4162 479 569435 (53.66%) 62636 (5.90%) 429140 (40.44%) 1061211
5. all α 100 4641 4495 146 604231 (51.51%) 92557 (7.89%) 476184 (40.60%) 1172972
6. all β 0 6796 488 6308 0 (0.00%)
21956 (38.66%) 34834 (61.34%) 56790
7. all β 5 6796 942 5854 3175 (1.63%)
56816(29.13%) 135029 (69.24%) 195020
8. all β 10 6796 2447 4349 24785 (4.97%)
163917 (32.85%) 310249 (62.18%) 498951
9. all β 20 6796 4422 2374 92777 (9.44%)
307011 (31.23%) 583385 (59.34%) 983173
10. all β 100 6796 6467 329 342132 (19.97%) 458777 (26.77%) 912713 (53.26%) 1713622
11. α plus β 100 6698 6518 180 572570(35.71)
283286 (17.67%) 747396 (46.62%) 1603252
12. α by β 100 7618 7380 238 1014915 (39.96%) 398610 (15.70%) 1126088 (44.34%) 2539613
Table 2: Details of the sequences of different structural classes of protein families used for CGR plot.
the sequence of all α protein are provided in Table 2 for each ratio. It must be noted that the number of allowed residues denoted as ‘%’. We have given the information of total number of sequences; how many sequences are used and how many sequences are left from the plots.
We have analyzed Figure 1; the Figure (1a) is having few residues and it is forming a line between H and C points. Because it is having only 0% of sheet (E) residues i.e., not allowed in sheet residues and only in Helix (64.88%) and coiled residues (35.12%). The Figure (1b) is having 1.5% of sheet residues, 58.17% of Helix residues and 40.78% of Coiled residues and it is to start forming a self similar structure. The Figure (1c) is forming a self similar structure and the residues are prominent between the points E and C. i.e., 0.625-0.625, 0.125-0.125, 0.25-0.25 etc. Because the H is having 56.55%, E is 2.93% and C is 40.51% of residues. So, the points between H and C are blurred. The Figure (1d) is having 53.66% of H, 5.90% of E and 40.44% of C residues; found that the fractal structure is more prominent in (c). The Figure (1e) is having 51.51% of H, 7.89% of E and 40.60% of C residues. So it is also more prominent as Figure (1d). We critically found that the point between H and E are not having more residues in all the figures. Hence, the sheet (E) residues are allowed only a little amount by all the figures. In this sense we know that the all alpha secondary structure is having more prominent between E and C points. This is mainly due to the higher percentage of coiled (C) residues and sheet (E) residues. In Table 1 the all alpha structure except in Sl.no.1. (0% allowed sheet residues) is maintained the coiled (C) residues percentage in uniquely except some fraction of changes. The helix (H) residues have decreased from starting to end, i.e., 0% to 100%. But the sheet (E) residues increased from starting to end, i.e., 0% to 100%. So, all the alpha class of secondary structures developing due to helix (H) and sheet (E) residues. But, more prominent may be due to, the increasing of sheet (E) and decreasing of (H) residues which makes the geometrical structure.
In a similar way, we tried the calculation and the CGR plots are classified in different ratios for all beta class of protein sequences. We
allowed all beta protein sequences to be calculated and drew the CGR plots from the residues are 0%, 5%, 10%, 20%, and 100%. Because we must know the differences in plots; it is used to identify the patterns of their sequence residues. The percentage values of the three types of secondary structure residues in the sequences of all β protein are provided in Table 2. It must be noted that the number of allowed residues denoted as ‘%’.We have given the information of total number of sequences, how many sequences are used and how many sequences are left from the plots.
We analyzed Figure 2; the Figure (2a) is having few residues and it is forming a line between E and C points. Because it is having only 0% helix (H) residues i.e., which is not allowed in helix residues and only in Sheet (38.66%) and coiled residues (61.34%). The Figure (2b) is having 1.63% of helix residues, 29.13% of sheet residues and 69.24% of coiled residues and it is start to forming a self similar structure. The Figure (2c) is forming a self similar structure and the residues are prominent between the points E - C and H - C i.e., 0.625-0.625, 0.125-0.125, 0.25-0.25 etc. The residues having H is 4.97%, E is 32.85% and C is 62.18%. So, the points between H and C are little blurred. The Figure (2d) is having 9.44% of H, 31.23% of E and 59.34% of C residues; found that the fractal structure is more prominent in (c). The Figure (2e) is having 19.97% of H, 27.77% of E and 53.26% of C residues. So it is also more prominent as Figure (2d). We critically found that the point between H and E do not have more residues in all figures. Hence the helix (H) has allowed little amount of residues. In this sense we know that the all beta classification of secondary structure sequences having more prominent between E and C points. This is mainly due to the higher percentage of coiled (C) residues and sheet (E) residues. In table 1, the helix (H) residues have increased from starting to end, i.e., 0% to 100%. But the sheet (E) and coiled (C) residues decreased from starting to end, i.e., 0% to 100% except Sl.no.7. i.e. 5% of helix and coiled residues. So, all the beta class of secondary structure developing due to the sheet (E) and

Citation: Manikandakumar K, Raj KG, Muthukumaran S, Srikumar R (2012) Secondary Structural Analysis of Families of Protein Sequences using Chaos Game Representation. J Comput Sci Syst Biol 5: 047-051. doi:10.4172/jcsb.1000089
Volume 5(2): 047-051 (2012) - 050 J Comput Sci Syst Biol ISSN:0974-7230 JCSB, an open access journal
coiled (C) residues. But the more prominent may be due to increasing of sheet (H) residues and hence makes the geometrical structure.
We have also computed for other secondary structure classification of α plus β and α by β protein sequence classes. The Figure 3(a) shows α plus β class of protein sequences. In α plus β class of protein sequence have 35.21% of helix, 17.67% of sheet and 46.62% of coiled residues. So the coiled (C) residues as more prominent in helix (H) residues in α plus β class of protein sequences. In similar way α by β class of protein sequence have 39.96% of helix, 15.70% of sheet and 44.34% of coiled residues. So the coiled (C) residues as more prominent in helix residues in α by β class of protein sequences. The Figure 3(b) shows α by β class of protein sequences. We find that all these four secondary structure classification of protein sequences exhibit ‘Sierpinski triangle’ like fractal object with self-similar structure in their CGR plots.
ConclusionThe present study describes the importance of CGR for secondary
structure of sequence for the different protein families and quantitative measurement of the preconception. It has been demonstrated that the different protein families exhibit distinct patterns in their CGR with
characteristics. All CGR plots depict ‘Sierpinski triangle’ type of fractal objects possessing self-similar structure. The differences in degree of prominence of the fractal structures among the same class of protein families is due to the differences in the percentage values of the three types of secondary structure residues. In future the CGR method may be used to know the functional relationships between the proteins even which has no significant sequence identity.
References
1. Fiser A, Tusn´ady GE, Simon I (1994) Chaos game representation of protein structures. J Mol Graph 12: 302-304,295.
2. Deschavanne PJ, Giron A, Vilain J, Fagot G, Fertil B (1999) Genomics signature: Characterization and classification of species assessed by chaos game representation of sequences. Mol Biol Evol 16: 1391-1399.
3. Goldman N (1993) Nucleotide, dinucleotide and trinucleotide frequencies explain patterns observed in chaos game representations of DNA sequences. Nucleic Acids Res 21: 2487-2491.
4. Jeffrey H J (1990) Chaos game representation of gene structure. Nucleic Acids Res 18: 2163-2170.
5. Jeffrey H J (1992) Chaos game visualization of sequences. Computer Graphics 16: 25-33.
6. Dutta C, Das J (1992) Mathematical characterization of chaos game representation: New algorithms for nucleotide sequence analysis. J Mol Biol 228: 715-729.
7. Almeida JS, Carrico JA, Maretzek A, Noble PA, Fletcher M (2001) Analysis of genomic sequences by Chaos Game Representation. Bioinformatics 17: 429-437.
8. Randi´cM, LerˇsN, Plavˇsi´cD, Basak SC, Balaban AT (2005) Four-color map representation of DNA or RNA sequences and their numerical characterization. Chem Phys Lett 407: 205-208.
9. Basu S, Pan A, Dutta C, Das J (1997) Chaos game representation of proteins. J Mol Graphics and Modelling 15: 279-289.
10. Manikandakumar K, Muthu Kumaran S, Srikumar R (2009) Matrix Frequency Analysis of Oryza Sativa (japonica cultivar-group) Complete Genomes. Journal of Computer Science & Systems Biology 2: 159-166.
11. Manikandakumar K, Muthukumaran S, Srikumar R, Gokulraj K and Santhosh Baboo S (2009) Analysis of Homo sapiens (Human) Chromosomes Complete Genome Using Matrix Frequency. nst Life Sciences and Bioinformatics 1: 57-66.
12. Manikandakumar K, Gokulraj K, Srikumar R and Muthu Kumaran S (2010) Analysis of parity ratio of protein sequences: A new approach based on Chargaff’s rule, Romanian Journal of Biophysics 20: 183 - 191.
13. Manikandakumar K, Gokulraj K, Srikumar R and Muthu Kumaran S (2010) Matrix Frequency Analysis of Genome Sequences: Pattern Identification of Turf grass Species. World Applied Sciences Journal 11: 315-320.
14. Manikandakumar K, Gokul Raj K, Srikumar R and Muthukumaran S (2010)
a) 0%, b) 5%, c) 10%, d) 20% and e) 100% of allowed protein residuesFigure 2: CGR plot of all β class of proteins.
Figure 3: CGR plot of a) α plus β and b) α by β class of protein sequences.
Citation: Manikandakumar K, Raj KG, Muthukumaran S, Srikumar R (2012) Secondary Structural Analysis of Families of Protein Sequences using Chaos Game Representation. J Comput Sci Syst Biol 5: 047-051. doi:10.4172/jcsb.1000089
Volume 5(2): 047-051 (2012) - 051 J Comput Sci Syst Biol ISSN:0974-7230 JCSB, an open access journal
Classification of Protein Structural Classes using Isoluecine and Lysine Amino Acids. Journal of Proteomics and Bioinformatics 3: 221-229.
15. Manikandakumar K, Muthukumaran S, Srikumar R and Gokulraj K (2012) Graphical Representation of Protein Sequences by CGR: Analysis of Pentagon and Hexagon Structures. Journal of Pharmacy Research 5: 514-518.
16. Garcia JA and Jose MV (2005) Mathematical Properties of DNA sequences from Coding and Noncoding Regions. Revista Mexicana de fisica 51: 122-130.
17. Yu ZG, Anh V, Lau KS (2001) Measure representation and multifractal analysis of complete genomes. Phys Rev E Stat Nonlin Soft Matter Phys 64: 031903.
18. Levitt M and Chothia C (1976) Structural patterns in globular proteins. Nature 261: 552-558.
19. Thomas E. Creighton (1993) Proteins – structures and Molecular properties, second edition, W.H. Freeman and Company, New York.
Submit your next manuscript and get advantages of OMICS Group submissionsUnique features:
• Userfriendly/feasiblewebsite-translationofyourpaperto50world’sleadinglanguages• AudioVersionofpublishedpaper• Digitalarticlestoshareandexplore
Special features:
• 200OpenAccessJournals• 15,000editorialteam• 21daysrapidreviewprocess• Qualityandquickeditorial,reviewandpublicationprocessing• IndexingatPubMed(partial),Scopus,DOAJ,EBSCO,IndexCopernicusandGoogleScholaretc• SharingOption:SocialNetworkingEnabled• Authors,ReviewersandEditorsrewardedwithonlineScientificCredits• Betterdiscountforyoursubsequentarticles
Submityourmanuscriptat:http://www.editorialmanager.com/proteomics