Secondary Education Development Project - OECD. · PDF file... project completion report PMU...
49
Project Performance Audit Report PPA: NEP 18011 (Final) Secondary Education Development Project (Loan 1196-NEP[SF]) in Nepal December 2004 Operations Evaluation Department Asian Development Bank
Transcript of Secondary Education Development Project - OECD. · PDF file... project completion report PMU...

Project Performance Audit Report
PPA: NEP 18011 (Final)
Secondary Education Development Project (Loan 1196-NEP[SF]) in Nepal
December 2004
Operations Evaluation Department
Asian Development Bank

CURRENCY EQUIVALENTS
Currency Unit – Nepalese rupee/s (NRe/s)
At Appraisal At Project Completion At Operations Evaluation (October 1992) (November 2000) (April 2004)
NRe1.00 = $0.0234 $0.0136 $0.0137 $1.00 = NRs42.7 NRs73.5 NRs73.0
ABBREVIATIONS
ADB – Asian Development Bank BME – benefit monitoring and evaluation CDC – Curriculum Development Center DEO – district education office DFID – Department for International Development EIRR – economic internal rate of return GER – gross enrollment rate HSEB – Higher Secondary Education Board MDG – Millennium Development Goal MOES – Ministry of Education and Sports NCED – National Center for Educational Development NER – net enrollment rate OCE – Office of Controller of Examination OEM – Operations Evaluation Mission PCL – proficiency certificate level PCR – project completion report PMU – project management unit PPAR – project performance audit report
PTA – parent-teacher association SEDC – secondary education development committee SEDEC – Secondary Education Development Center SEDU – secondary education development unit SESP – Secondary Education Support Project SLC – school leaving certificate SMC – school management committee SSRC – secondary school resources center TA – technical assistance TEVT – technical education and vocational training
NOTES
(i) The fiscal year (FY) of the Government ends on 15 July. FY before a calendar
year denotes the year in which the fiscal year ends, e.g., FY2005 ends on 15 July 2005.
(ii) In this report, “$” refers to US dollars. Director General, Operations Evaluation Department: Bruce Murray Director, Operations Evaluation Division 1: Graham Walter Evaluation Team Leader: Suganya Hutaserani
Operations Evaluation Department, PE-656
CONTENTS
Page BASIC DATA iii EXECUTIVE SUMMARY iv MAP vii I. BACKGROUND 1 A. Rationale 1
B. Formulation 1 C. Purpose and Outputs 1 D. Cost, Financing, and Executing Arrangements 2 E. Completion and Self-Evaluation 2 F. Operations Evaluation 2
II. PLANNING AND IMPLEMENTATION PERFORMANCE 3
A. Formulation and Design 3 B. Achievement of Outputs 4 C. Cost and Scheduling 5 D. Procurement and Construction 5 E. Organization and Management 6
III. ACHIEVEMENT OF PROJECT PURPOSE 7
A. Operational Performance 7 B. Performance of the Operating Entity 12 C. Sustainability 13 D. Economic Reevaluation 13
IV. ACHIEVEMENT OF OTHER DEVELOPMENT IMPACTS 14
A. Socioeconomic Impact 14 B. Environmental Impact 14 C. Impact on Institutions and Policy 14
Suganya Hutaserani, principal evaluation specialist (team leader), prepared this report, conducted document reviews and key informant interviews, and guided the fieldwork undertaken by the international consultant. Shiva Lohani, international consultant, managed a local team of facilitators and enumerators, conducted field surveys, and prepared survey tables and background of the education system in Nepal. Olive Nuestro, evaluation officer, supported the team with research assistance from Manila. The guidelines formally adopted by the Operations Evaluation Department (OED) on avoiding conflict of interest in its independent evaluations were observed in the preparation of this report. To the knowledge of the management of OED, there were no conflicts of interest of the persons preparing, reviewing, or approving this report.

ii
V. OVERALL ASSESSMENT 15 A. Relevance 15 B. Efficacy 15 C. Efficiency 15 D. Sustainability 15 E. Institutional Development and Other Impacts 15 F. Overall Project Rating 16 G. Assessment of Asian Development Bank and Borrower Performance 16
VI. ISSUES, LESSONS, AND FOLLOW-UP ACTIONS 16
A. Key Issues for the Future 16 B. Lessons Identified 18 C. Follow-Up Actions 18
APPENDIXES 1. Estimated and Actual Project Costs 20 2. Sample Size of Beneficiary Surveys 21 3. Education System and Enrollment in Nepal 22 4. Achievement of Output Targets 25 5. Output and Outcome Analysis 29 6. Long-Term Financial Sustainability Prospects 34 7. Economic Analysis 35 8. Socioeconomic Status of Parents in Sample Schools 38 Attachment: Management Response on the Project Performance Audit Report on the
Secondary Education Project (Loan 1196-NEP[SF]) in Nepal

BASIC DATA Secondary Education Development Project (Loan 1196-NEP[SF])
Project Preparation TA No. TA Name Type Person-
Months Amount1
($) Approval
Date 1376 Secondary Education
Development Project PPTA 28 300,000 19 Sep 1990
Key Project Data ($ million) As per ADB Loan Documents Actual Total Project Cost 15.8 14.9 Foreign Exchange Cost 6.6 7.1 Local Currency Cost 9.2 7.8 ADB Loan Amount/Utilization 12.6 6.5 ADB Loan Amount/Cancellation 5.62 Key Dates Expected Actual Fact-Finding 26 Mar–12 Apr 1992Appraisal 22 Jun–11 Jul 1992Loan Negotiations 19–21 Oct 1992Board Approval 24 Nov 1992Loan Agreement 15 Mar 1993Loan Effectiveness 13 Jun 1993 10 Aug 1993First Disbursement 1 Dec 1993Project Completion 31 Dec 1998 30 Jun 2000Loan Closing 30 Jun 1999 14 Nov 2000Months (effectiveness to completion) 66 82 Key Performance Indicators Internal Rate of Return (%) Appraisal PCR PPAR Economic Internal Rate of Return 17.2% (estimated by PPAR) – 15.5% Borrower The Kingdom of Nepal Executing Agency Ministry of Education and Sports Mission Data Type of Mission No. of Missions No. of Person-Days Appraisal 1 100 Project Administration Inception 1 12 Review Review3 2 29 Joint Review4 7 125 Review 3 57 Project Completion 1 72 Operations Evaluation5 1 36 ADB = Asian Development Bank, No. = number, PCR = project completion report, PPAR = project performance audit report, PPTA = project preparatory technical assistance, TA = Technical assistance. 1 Approved amount. 2 Utilization and cancellation amounts did not add up to actual loan amount because the loan was denominated in
special drawing rights (SDR) and the Nepalese rupee per SDR depreciated from NRs68.5 at loan effectiveness to NRs94.2 at loan completion.
3 The Mission also reviewed Loan 974-NEP: Technical Education and Vocational Training Project, for $11.8 million, approved in September 1989; and Loan 1141-NEP: Primary Education Development Project, for $19.5 million, approved in December 1991.
4 Joint review with the Department for International Development of the United Kingdom. 5 Comprising S. Hutaserani (Mission Leader/Principal Evaluation Specialist) and S. Lohani (Staff Consultant/
Education Evaluation Specialist), who visited Nepal during 30 March to 16 April 2004.

EXECUTIVE SUMMARY
The National Education Systems Plan was introduced in Nepal’s Fourth Five-Year Plan (1970–1974) to reform the education system. It focused on skills development for productive enterprises. To support the Government’s efforts, the Asian Development Bank (ADB) provided three loans in technical education and vocational training and science education during 1977–1990. However, by the early 1990s, only about 36% of the population was literate and less than 8% of the post school-age population had completed secondary education. The quality and efficiency of primary and secondary education were poor due to the lack of mandatory teacher training, modern curricula and textbooks, effective student assessment system, and effective planning and management system. Thus, the Government shifted its focus to basic education in the Eighth Five-Year Plan (1992–1997) and requested ADB to finance the Secondary Education Development Project to improve the quality and efficiency of secondary education. During this period, ADB’s education strategy also shifted from skills development and TEVT to basic education, as reflected in its five subsequent education loans to Nepal. The objectives of the Project were to improve the quality and efficiency of lower secondary (grades 6–8) and secondary (grades 9–10) education nationwide, thereby producing middle-level human resources and qualified entrants into higher secondary education (grades 11–12). The Project had five components: (i) enhancing teacher effectiveness by improving teacher training curricula and providing teacher training in core subjects; (ii) developing new secondary curricula and textbooks in the core subjects; (iii) improving the student assessment system; (iv) providing learning materials, science equipment, and civil works for school laboratories and buildings extension; and (v) strengthening the capacity of the Ministry of Education and Sports (MOES) in planning, management, and benefit monitoring and evaluation. MOES was the Executing Agency, while the Secondary Education Development Center (SEDEC) was the Implementing Agency. A secondary education development committee (SEDC) was established to provide policy guidance for the project management unit, whose project director was also concurrently the director of SEDEC. Regional SEDCs were established in all five regions to coordinate project implementation at the regional level. Three important project partners—the Curriculum Development Center, the Higher Secondary Education Board, and the Office of Controller of Examination (OCE)—were later included in SEDC to expedite project implementation and improve coordination among concerned agencies.
Implementation of the Project at appraisal was envisaged to be 5 years and 6 months. Actual implementation took almost 7 years. The Project moved slowly, particularly at the early stage, due to (i) a 2-month delay in loan effectiveness because of the delay in constituting SEDC; (ii) a roughly 15-month delay in recruiting consultants under the grant from the Department for International Development, which cofinanced the Project; (iii) the Project’s weak leadership at the start; and (iv) the frequent changes of senior- and middle-level project personnel, including those within the Curriculum Development Center, OCE, and SEDEC. At appraisal, the total project cost was estimated at about $15.8 million, comprising $6.6 million in foreign exchange cost and $9.2 million equivalent in local currency cost. An ADB loan of $12.6 million from its Special Funds resources was approved to finance 80% of the total cost, including $6.6 million of foreign exchange cost and $6.0 million equivalent of local currency cost. The Government was to provide the remaining $3.2 million equivalent. The actual project cost of $14.9 million was 6% lower than the appraisal estimate. ADB’s loan was reduced by 48% to $6.5 million, due to (i) provision of the grant from the Department for International Development of $6.3 million equivalent to replace a portion of ADB’s loan in various activities (e.g., learning materials, equipment, staff development, consulting services, and recurrent cost); and (ii) loan savings associated with the lower cost of equipment, compared with appraisal

vestimates, and the devaluation of the Nepalese rupee by 42% from appraisal to project completion. The share of the Government decreased by 34% to $2.1 million equivalent. The Project was consistent with the Government’s plan and ADB’s education strategy, which shifted its focus since the early 1990s from technical education and vocational training to basic education. However, the Project focused on delivery of teacher training without developing a viable teacher training plan. The Project was also designed without strategic links to higher secondary education. The Project is thus rated relevant, rather than highly relevant.
The Project achieved most of the outputs envisaged at appraisal. Various outcome indicators (promotion rates, cohort survival rates from grade 6 to grade 10, and transition rate from secondary to higher secondary education) improved satisfactorily. Although the school leaving certificate (SLC) examination pass rate remained low, it started to increase slightly during 2001–2002. On balance, since many outcome indicators were achieved, the Project is considered efficacious. Project facilities were generally well utilized. The exception is that the science equipment, laboratories, and library book packages provided to some higher secondary schools were not well used, because these schools lacked resources for maintenance. However, this accounted for only 5.4% of the total project cost. Since the Project had an economic internal rate of return of 15.5%, the Project is considered efficient.
The Government bears a high fiscal burden, as it pays 100% of teacher salaries. However, since public secondary schools are now allowed to collect tuition fees, and since many schools are expected to generate more resources under ADB’s ongoing Secondary Education Support Project (SESP), the burden on the government budget is likely to decrease in the future. On balance, overall sustainability is considered likely, but at the lower end of the range, depending upon the capacity of the schools to generate additional resources. The Project had a satisfactory institutional impact. The trained teachers were able to generally use the knowledge gained from training, the positions created at SEDEC and the secondary education development units were institutionalized, the technical unit at OCE was created to facilitate the administration of SLC examination. But a viable teacher training policy framework and action plan are yet to be developed for long-term institutional impact. The Project addressed gender concerns by developing special training courses for female teachers. No adverse environmental impact was noted. The Project addressed some equity issues, providing assistance to many schools in poor rural areas. Overall, the Project’s institutional development and other impacts are considered significant (satisfactory). Based on the results of the five evaluation criteria and the standard weighting system of the Operations Evaluation Department, the Project is rated as successful. Six key issues emerge from the evaluation: (i) weak governance in the education sector, (ii) weak SLC examination system, (iii) weak school supervision system by MOES’ district education offices (DEOs) to monitor teacher attendance and performance, (iv) lack of detailed teacher training policy framework and action plan to develop an effective teacher training system, (v) lack of appropriate regulatory framework to promote public-private partnerships, and (vi) lack of integration of higher secondary education with the core secondary education system. The first two issues are addressed as lessons for ADB’s ongoing interventions, whereas the remaining four issues are addressed as follow-up actions by MOES. The following are lessons for ADB’s ongoing and future interventions:
(i) Under the ongoing SESP, ADB should conduct policy dialogue with MOES to explore ways to improve governance in the education sector, particularly the

vi allegation that people have to pay certain amounts of money to get the teaching jobs. Opportunities to extract bribes from unqualified persons in return for jobs should be reduced when only qualified persons (with 10-month teacher training) can be recruited in accordance with the new teacher policy. ADB’s policy dialogue with MOES should support the actual enforcement of this policy.
(ii) Under the ongoing SESP, ADB should conduct policy dialogue with MOES and the Ministry of Finance to explore the possibility of undertaking further SLC examination reforms to improve the SLC pass rate, make the SLC examination more reflective of students’ learning achievement, and improve OCE’s efficiency and autonomy in providing SLC services in the light of its increased responsibilities.
(iii) In-service teacher training should not last more than a few months. Otherwise, it would lead to prolonged absence of teachers. In-service training should be followed-up by 1- or 2-week refresher courses.
(iv) If a project will be cofinanced, the Government should sign agreements with the cofinancing agencies prior to Board approval to avoid delays in implementation.
MOES agreed to implement the following follow-up actions, in conjunction with the
ongoing projects and technical assistance. The proposed timeframes are tentative, depending upon the timing in the relevant ongoing projects.
(i) MOES should prepare a school supervision and monitoring framework, in conjunction with the ongoing SESP, by December 2005 and an indicative action plan by June 2006. The framework should aim to empower the roles of school management committees and parent-teacher associations in monitoring teacher attendance and performance and improve DEOs’ school supervision system.
(ii) MOES should expand the teacher training policy framework, in conjunction with
the ongoing Teacher Education Project and SESP, by December 2005 and prepare an indicative action plan by June 2006. The expanded framework should identify the number of teachers needed per subject and per student; the number of teachers needed for initial, in-service, and refresher training; the number of teacher trainers needed; appropriate deployment scheme; management training needs; training needs for DEOs’ school supervisors to enable them to monitor teachers’ application of the training acquired to classroom teaching.
(iii) MOES, in close collaboration with private schools and in conjunction with the
ongoing SESP, should develop a regulatory framework and incentive system to encourage some good private schools to provide in-kind support (e.g., books, management, study visits, and teachers) to some public schools in the locality by December 2005 and prepare an indicative action plan by June 2006.
(iv) MOES, in conjunction with the ongoing technical assistance on the Preparation
for Education Sector Development Policy and Strategy, should develop an overall secondary education framework to integrate the curricula of secondary and higher secondary education by December 2005 and prepare an indicative action plan by June 2006.
Bruce Murray Director General Operations Evaluation Department
vii

I. BACKGROUND A. Rationale 1. The National Education Systems Plan was introduced in Nepal’s Fourth Five-Year Plan (1970–1974) to reform the education system. It focused on skills development for productive enterprises. To support the Government’s efforts, the Asian Development Bank (ADB) provided three loans1 in technical education and vocational training (TEVT) and science education during 1977–1990. However, by the early 1990s, only about 35% of the population was literate and less than 8% of the post school-age population had completed secondary education. The quality and efficiency of primary and secondary education were poor due to the lack of mandatory teacher training, modern curricula and textbooks, effective student assessment system, and effective planning and management system. Thus, the Government shifted the focus to basic education (primary, secondary, and nonformal education) in the Eighth Five-Year Plan (1992–1997) and requested ADB to finance the Secondary Education Development Project2 to improve the quality and efficiency of secondary education. During this period, ADB’s education strategy also shifted from skills development and TEVT to basic education, as reflected in five subsequent education loans to Nepal, especially in secondary education.3 B. Formulation 2. In response to the Government’s request, ADB provided project preparatory technical assistance4 to help design the Project. Based on its findings and recommendations, ADB fielded a fact-finding mission during March–April 1992. An appraisal mission was fielded during June–July 1992 to confirm the viability of the Project and its suitability for ADB financing. C. Purpose and Outputs 3. The Project aimed to improve the quality and efficiency of lower secondary (grades 6–8) and secondary (grades 9–10) education nationwide, thereby producing middle-level human resources and qualified entrants into higher secondary education (grades 11–12). The Project had five components: (i) enhancing teacher effectiveness by improving teacher training curricula in core subjects5 for grades 6–10 and providing in-country and international training; (ii) developing new secondary curricula and textbooks in the core subjects; (iii) improving the student assessment and examination system; (iv) providing necessary learning materials, science equipment, and civil works for school laboratories and building extension; and (v) strengthening the capacity of the Ministry of Education and Sports (MOES) in planning, management, and benefit monitoring and evaluation (BME).
1 ADB. 1977. Vocational Education Project. Manila; ADB. 1982. Science Education Project. Manila; ADB. 1989.
Technical Education and Vocational Training Development Project. Manila. 2 ADB. 1992. Secondary Education Development Project. Manila. 3 Since 1991, ADB has approved five loans in basic education (primary, secondary, and nonformal education) to
Nepal, totaling $86.4 million. Of the total value of the eight approved education loans to Nepal since 1977 ($110.4 million), 35% was for primary (two loans), 39% for secondary (two loans), 4% for nonformal (one loan), and 22% for TEVT and science (three loans) education.
4 ADB. 1990. Secondary Education Development Project. Manila. 5 Grades 6–8 had five core subjects (English, Nepali, mathematics, science, and social studies), and grades 9–10
had six (with health and environmental studies as the sixth core subject). Grades 9–10 also had two electives.

2
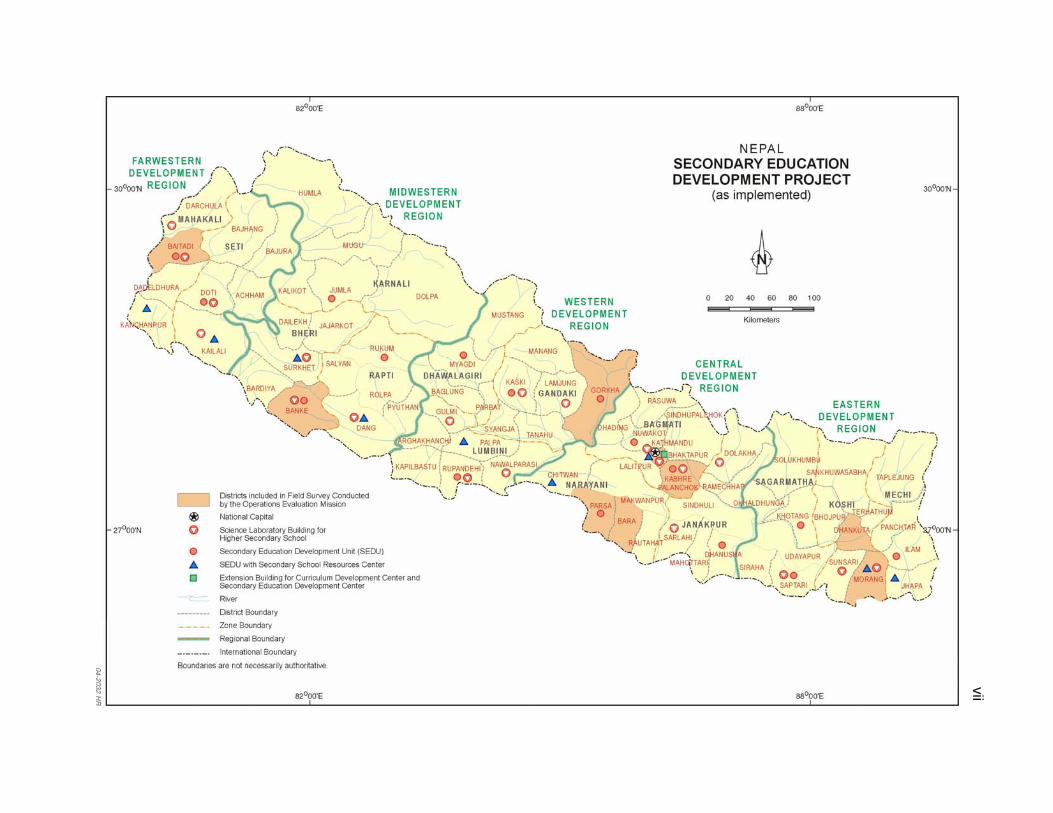
D. Cost, Financing, and Executing Arrangements 4. At appraisal, the total project cost was estimated at about $15.8 million, comprising $6.6 million in foreign exchange cost and $9.2 million equivalent in local currency cost (Appendix 1). An ADB loan of $12.6 million from ADB’s Special Funds resources was approved to finance 80% of the total cost, including $6.6 million of foreign exchange cost and $6.0 million equivalent of local currency cost. The Government was to provide the remaining $3.2 million equivalent. MOES was the Executing Agency. The Secondary Education Development Center (SEDEC) was the Implementing Agency, reporting directly to MOES’ secretary. A secondary education development committee (SEDC) was established to provide policy guidance for the project management unit (PMU), whose project director was also concurrently the director of SEDEC. Regional SEDCs were established in all five regions to coordinate project implementation at the regional level. Three important project partners—the Curriculum Development Center (CDC), the Higher Secondary Education Board (HSEB), and the Office of Controller of Examination (OCE)—were later included in SEDC to expedite project implementation and improve coordination among concerned agencies.6 E. Completion and Self-Evaluation 5. The Project was physically completed in June 2000. A project completion report (PCR), prepared by ADB’s South Asia Department, was circulated to the Board in December 2001. The PCR rated the overall Project as successful because of its physical outputs achievement, substantial institutional impact, and high relevance to ADB’s education strategy and the Government’s development plans, which focused on basic education. The PCR indicated that the Project built an institutional foundation for quality improvement, but efficiency and quality indicators (e.g., promotion rate and pass rate of school leaving certificate (SLC) examination at the end of grade 10) did not improve much. Thus, the PCR regarded the achievement of project objectives as less efficacious. The PCR also regarded financial sustainability as less likely, due to limited government capacity to finance recurrent expenditure for secondary education. The PCR, however, did not assess the relevance of project design and the efficiency of investment. F. Operations Evaluation 6. This project performance audit report (PPAR) evaluates the Project based on the five standard evaluation criteria of the Operations Evaluation Department, including relevance, efficacy, efficiency, sustainability, and institutional and other impacts. Key issues, lessons learned, and follow-up actions are identified. The main data used are MOES’ nationwide secondary data, which are supplemented by primary data from beneficiary surveys.7 The surveys, conducted by the Operations Evaluation Mission (OEM), consisted of 10 sample public schools across the country’s five development regions (Map),8 10 head teachers (one per school), 50 teachers, 8 chiefs of secondary education development units (SEDUs), and 6 CDC is responsible for developing curricula and textbooks for grades 1–10. HSEB is responsible for developing
and providing curricula, textbooks, and examinations and in-service teacher training for grades 11–12. OCE is responsible for preparing and marking the SLC examination at the end of grade 10. SEDEC is responsible for designing and providing in-service teacher training to teachers of grades 6–10. As for primary schools (grades 1–5), the National Center for Educational Development is responsible for developing and providing in-service teacher training.
7 The surveys were based on purposive sampling, taking into account accessibility, security, willingness to respond, and budget and time constraints. Thus, the actual sample size of each category of respondents is small and not equal to the planned number.
8 Nepal has five development regions (Eastern, Central, Western, Midwestern, and Far Western) and the Kathmandu Valley.

3
70 parents whose students enrolled in the sample schools during the project period (Appendix 2). Additional information used was obtained through (i) desk reviews of project-related documents, including the Project’s BME studies; (ii) consultations with concerned ADB divisions; and (iii) focus group discussions with staff of MOES and other concerned agencies. Copies of the draft PPAR were submitted for review to MOES and ADB divisions concerned. Comments have been incorporated in finalizing the PPAR.
II. PLANNING AND IMPLEMENTATION PERFORMANCE A. Formulation and Design 7. The Project was consistent with the objectives of the Government’s development plans, from the Eighth Five-Year Plan (1992–1997) to the Tenth Five-Year Plan (2002–2007). The Project continues to be consistent with ADB’s education strategy, the focus of which shifted since the early 1990s from skills development and TEVT to basic education. 8. Project design focused on delivery of teacher training without developing a viable teacher training plan. Such a plan should take into account short- and long-term training balance, follow-up support mechanism, proper deployment scheme to avoid prolonged absence during the training, and proper recruitment and incentive scheme especially in remote rural areas. The Project was also designed without considering strategic links to higher secondary education. Nepal has two isolated and parallel public higher secondary education (grades 11–12) streams using different curricula, neither of which are integrated with the core education (grades 1–10) system. One of the streams, called proficiency certificate level (PCL), is provided by Tribuvan University on its campus and on the campuses of some other universities. The other stream is provided by MOES, through HSEB (Appendix 3, Figure A3). Given the existing two nonintegrated higher secondary education streams that are isolated from the core education system, the Project should initiate some strategic links between secondary education and higher secondary education through proper policy covenants. Otherwise, higher secondary education will continue to be a bottleneck slowing the improvement of overall secondary education. 9. Table A3.1 (Appendix 3) shows that during 1993–2002, the nationwide enrollment rates at lower secondary (grades 6–8) and secondary (grades 9–10) education combined increased from 0.9 million to 1.6 million, at an average annual rate of 7%. Most current data on the number of schools, students, and teachers are shown in Table A3.2 (Appendix 3), in which public schools constituted the majority of lower secondary and secondary schools (82%).9 The remaining 18% were private schools. In terms of enrollment, of the total number of about 1.6 million of lower secondary and secondary students combined, 86% enrolled in public schools and 14% in private schools. However, private schools could afford to hire more teachers. This resulted in their having lower student-teacher ratios than public counterparts (14:1 versus 40:1) and generally better quality. Gender gaps existed as females accounted for less than half—43% of the total enrollment in public and private lower secondary and secondary schools combined, 34% of SLC pass rate, and 12% of lower secondary and secondary school teachers.
9 Public schools normally include government schools and proposed schools. Proposed schools are community
schools that are nonprofit private schools partly funded by the Government but proposing to be fully funded. Private schools normally include corporate (for-profit) schools registered under the company act and trust (generally nonprofit) schools run by nongovernment organizations.
4
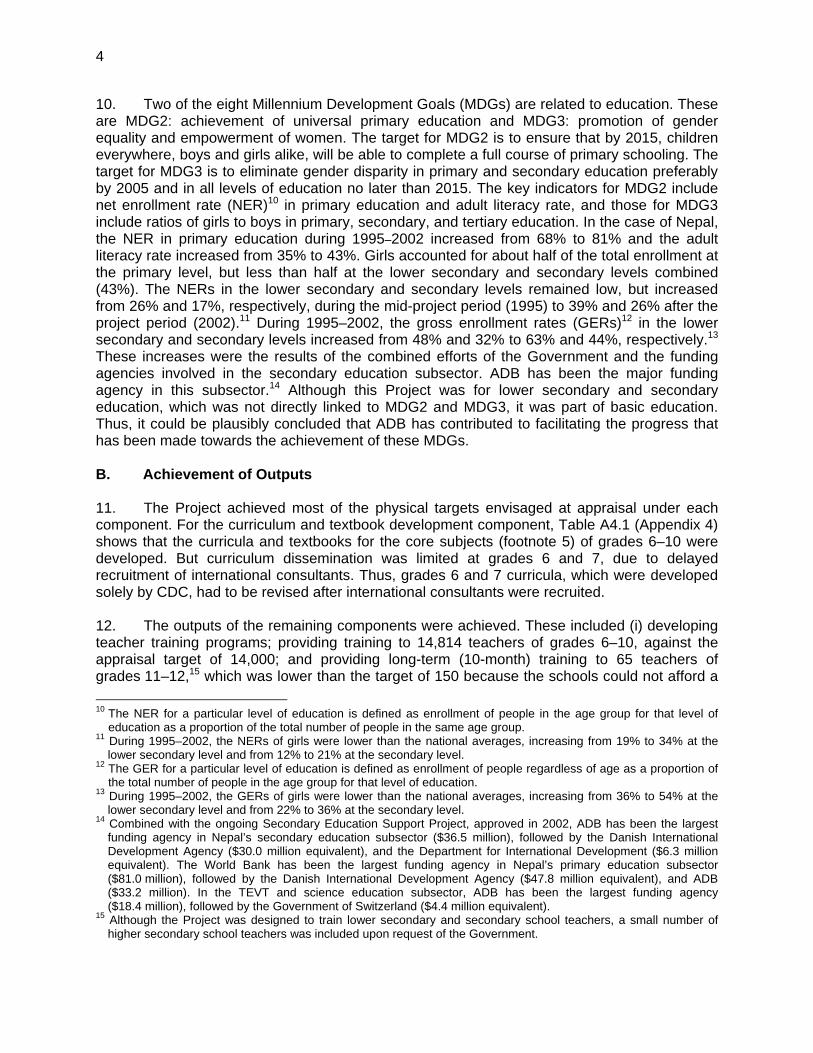
10. Two of the eight Millennium Development Goals (MDGs) are related to education. These are MDG2: achievement of universal primary education and MDG3: promotion of gender equality and empowerment of women. The target for MDG2 is to ensure that by 2015, children everywhere, boys and girls alike, will be able to complete a full course of primary schooling. The target for MDG3 is to eliminate gender disparity in primary and secondary education preferably by 2005 and in all levels of education no later than 2015. The key indicators for MDG2 include net enrollment rate (NER)10 in primary education and adult literacy rate, and those for MDG3 include ratios of girls to boys in primary, secondary, and tertiary education. In the case of Nepal, the NER in primary education during 1995–2002 increased from 68% to 81% and the adult literacy rate increased from 35% to 43%. Girls accounted for about half of the total enrollment at the primary level, but less than half at the lower secondary and secondary levels combined (43%). The NERs in the lower secondary and secondary levels remained low, but increased from 26% and 17%, respectively, during the mid-project period (1995) to 39% and 26% after the project period (2002).11 During 1995–2002, the gross enrollment rates (GERs)12 in the lower secondary and secondary levels increased from 48% and 32% to 63% and 44%, respectively.13 These increases were the results of the combined efforts of the Government and the funding agencies involved in the secondary education subsector. ADB has been the major funding agency in this subsector.14 Although this Project was for lower secondary and secondary education, which was not directly linked to MDG2 and MDG3, it was part of basic education. Thus, it could be plausibly concluded that ADB has contributed to facilitating the progress that has been made towards the achievement of these MDGs. B. Achievement of Outputs 11. The Project achieved most of the physical targets envisaged at appraisal under each component. For the curriculum and textbook development component, Table A4.1 (Appendix 4) shows that the curricula and textbooks for the core subjects (footnote 5) of grades 6–10 were developed. But curriculum dissemination was limited at grades 6 and 7, due to delayed recruitment of international consultants. Thus, grades 6 and 7 curricula, which were developed solely by CDC, had to be revised after international consultants were recruited. 12. The outputs of the remaining components were achieved. These included (i) developing teacher training programs; providing training to 14,814 teachers of grades 6–10, against the appraisal target of 14,000; and providing long-term (10-month) training to 65 teachers of grades 11–12,15 which was lower than the target of 150 because the schools could not afford a 10 The NER for a particular level of education is defined as enrollment of people in the age group for that level of
education as a proportion of the total number of people in the same age group. 11 During 1995–2002, the NERs of girls were lower than the national averages, increasing from 19% to 34% at the
lower secondary level and from 12% to 21% at the secondary level. 12 The GER for a particular level of education is defined as enrollment of people regardless of age as a proportion of
the total number of people in the age group for that level of education. 13 During 1995–2002, the GERs of girls were lower than the national averages, increasing from 36% to 54% at the
lower secondary level and from 22% to 36% at the secondary level. 14 Combined with the ongoing Secondary Education Support Project, approved in 2002, ADB has been the largest
funding agency in Nepal’s secondary education subsector ($36.5 million), followed by the Danish International Development Agency ($30.0 million equivalent), and the Department for International Development ($6.3 million equivalent). The World Bank has been the largest funding agency in Nepal’s primary education subsector ($81.0 million), followed by the Danish International Development Agency ($47.8 million equivalent), and ADB ($33.2 million). In the TEVT and science education subsector, ADB has been the largest funding agency ($18.4 million), followed by the Government of Switzerland ($4.4 million equivalent).
15 Although the Project was designed to train lower secondary and secondary school teachers, a small number of higher secondary school teachers was included upon request of the Government.

5
long period of teacher absence; (ii) reforming student assessment and decentralization of SLC examination by designating 36 locations across the country as SLC marking centers, against the target of 31; (iii) providing science equipment, library books, school furniture, and other learning materials to 1,000 schools for grades 6–10 and 25 schools for grades 11–12;16 providing building extension and renovation for CDC, OCE, SEDEC, and some SEDUs,17 nine of which were upgraded to secondary school resources centers (SSRCs); and (iv) providing training in education planning, management, and BME to 135 education managers and school supervisors, against the target of 100; providing training in school-based and SEDU management to 411 head teachers for grades 6–8 and 2,222 head teachers for grades 9–10, against the targets of 2,000 for grades 6–10 combined; and preparing secondary education perspective and action plans, higher secondary school perspective plan, and BME and 14 policy research studies (Appendix 4, Table A4.2). C. Cost and Scheduling 13. Implementation of the Project at appraisal was envisaged to be 5 years and 6 months. Actual implementation took almost 7 years. Loan closing was extended once to complete the preparation of grade-10 textbooks and provide more teacher training. The Project moved slowly, particularly at the early stage, due to (i) a 2-month delay in loan effectiveness because of the delay in constituting SEDC; (ii) a roughly 15-month delay in recruiting consultants under the grant from the Department for International Development (DFID),18 which cofinanced the Project; (iii) the Project’s weak leadership at the start; and (iv) the frequent changes of senior- and middle-level project personnel.19 14. The actual project cost of $14.9 million was 6% lower than the appraisal estimate of $15.8 million (Appendix 1). ADB’s loan was reduced by 48%, from $12.6 million to $6.5 million, due to (i) provision of DFID’s grant of $6.3 million equivalent to replace a portion of ADB’s loan in various activities (e.g., learning materials and equipment, staff development, consulting services, and recurrent cost), and (ii) loan savings associated with the lower cost of equipment and library and reference books, compared with appraisal estimates, and the devaluation of the Nepalese rupee by 42% from appraisal to project completion. The share of the Government decreased by 34%, from $3.2 million equivalent to $2.1 million equivalent. D. Procurement and Construction 15. At appraisal, 90 person-months of international and 180 person-months of domestic consultants were envisaged for education planning, curriculum and textbook development, teacher training, examination reforms, and BME. International consultants were canceled from ADB’s loan when DFID’s grant became available, and domestic consultants from ADB’s loan were reduced to 127 person-months for education planning and BME. Domestic architecture and engineering firms were recruited under lump-sum contracts for designing civil works. The 16 Although the Project was designed to support lower secondary and secondary schools, a small number of higher
secondary schools was included upon request of the Government. 17 Twenty-five SEDUs existed during project implementation, nine of which were upgraded to SSRCs. SEDUs are
implementation units of SEDEC that provide in-service training to teachers and head teachers of grades 6–10. SEDUs are located on some secondary school premises. SSRCs also provide other educational and professional services to teachers, in addition to training.
18 DFID provided grant cofinancing on a parallel basis and administered its activities separately. The grant agreement between DFID and the Government was signed on 30 December 1993, about 5 months after loan effectiveness. DFID’s consultants were not fielded until November 1994, about 16 months after loan effectiveness. Coordination between ADB and DFID was maintained through regular joint project review missions.
19 The Project saw eight project directors, six CDC directors general, and four OCE controllers.

6
recruitment of consultants was in accordance with ADB’s Guidelines on the Use of Consultants. The consultants’ performance was generally satisfactory, although with some delays in the recruitment of engineering consultants. The recruitment of consultants under DFID’s financing was delayed by about 15 months, due to the delay in the agreement signing between DFID and the Government. The recruitment had to follow DFID’s procedures, and was beyond MOES’ control. As such, the curricula for grades 6 and 7 were initially developed without international consultants. These were later revised with assistance from the DFID-financed consultants. 16. All civil work contracts were awarded based on local competitive bidding, in accordance with the Government’s standard procurement procedures acceptable to ADB. Major equipment was procured through ADB’s international shopping procedures, while other equipment and furniture was procured through direct purchase procedures acceptable to ADB. No major problems were encountered in following ADB’s Guidelines for Procurement. The contractors’ performance was generally satisfactory. Of the 40 major civil work contracts, 35 were completed on or ahead of time; 4 were completed with a delay of a few months; and 1 was delayed by 6 months, due to the contractor’s poor management and weak financial condition. The suppliers’ performance was also generally satisfactory, except for that of some furniture suppliers. E. Organization and Management
17. The Government committed itself to the Project by ensuring that adequate counterpart funds were made available for project implementation. The PMU performance improved from late 1995, as reflected in its close coordination with concerned government agencies, external funding agencies, and various contractors and suppliers. The involvement of CDC, HSEB, and OCE in SEDC, which was not envisaged at appraisal, helped facilitate project activities carried out in those institutions. SEDC met 35 times during the project period, reflecting a concern to implement the Project effectively. Despite a large number of civil works scattered throughout the country, together with the time-consuming selection procedures of science laboratories for higher secondary schools, the PMU satisfactorily completed all the civil works. 18. Generally, compliances with loan covenants was satisfactory. However, the OEM found that the Government could not comply with one loan covenant because the covenant contradicted MOES’ subsequent policy on free secondary education introduced in 1995. The covenant required MOES to maintain the existing level of cost recovery by providing recurrent salary support of not more than 75% of teacher salaries for grades 6 and 7 and not more than 50% for grades 8 to 10. But the free secondary education policy required MOES to provide 100% support for teacher salaries and pubic schools to not collect tuition fees. The resulting quality of public secondary education deteriorated, as it did not have enough funding support for quality improvement. Meanwhile, private secondary education flourished in urban and semiurban areas. Consequently, MOES discarded its free secondary education policy, with the introduction of the Seventh Amendment of the Education Act in 2002 to allow public schools to collect tuition fees,20 except from poor children whose parents’ incomes were below the poverty line.21 ADB agreed that MOES continue to support 100% of teacher salaries, at least for a few years, in view of insufficient tuition fees collected by the schools to finance teacher salaries. However, MOES planned to increase decentralization of secondary education through provision 20 At the lower secondary level, the average annual tuition fee per student in a public school is about NRs1,500
($20.5 equivalent). In a private school, it is about NRs9,000 ($123.3 equivalent). At the secondary level, the fee in a public school is about NRs2,000 ($27.4 equivalent). In a private school, it is about NRs12,000 ($164.4 equivalent).
21 About 30,000 poor children at the lower secondary and secondary levels also received full or partial scholarships of NRs1,700 ($23.3 equivalent) and NRs700 ($9.6 equivalent), respectively, per student per year.
7
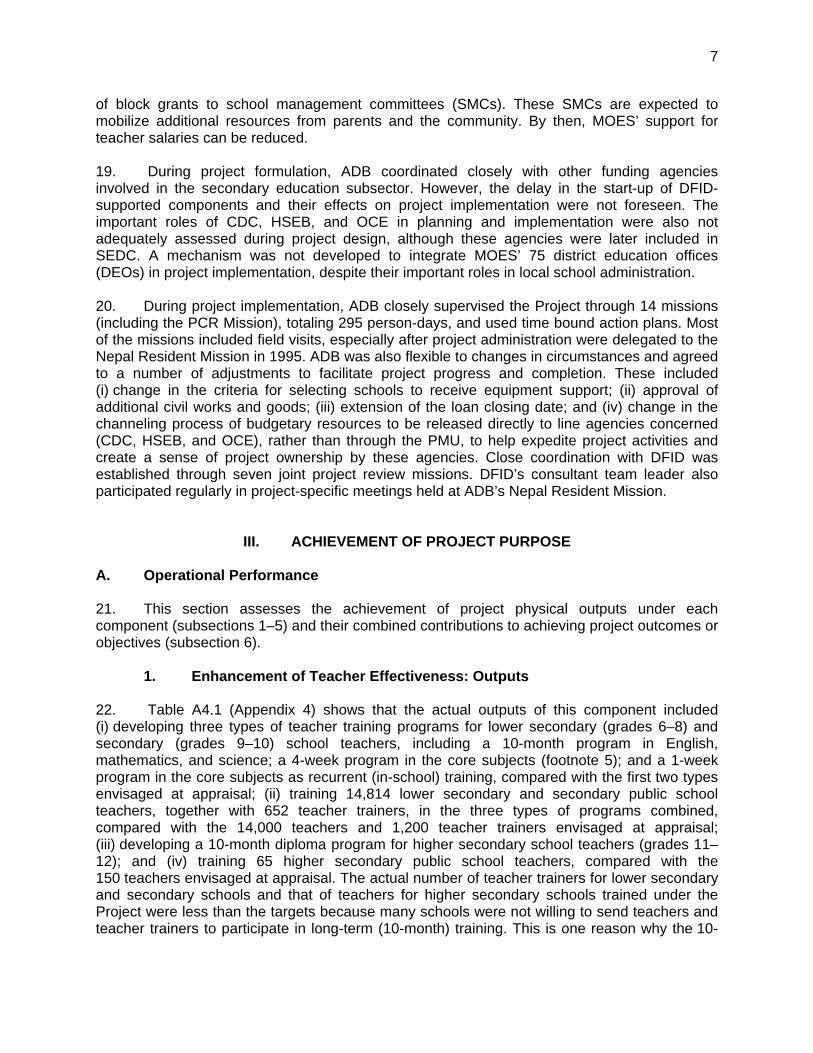
of block grants to school management committees (SMCs). These SMCs are expected to mobilize additional resources from parents and the community. By then, MOES’ support for teacher salaries can be reduced. 19. During project formulation, ADB coordinated closely with other funding agencies involved in the secondary education subsector. However, the delay in the start-up of DFID-supported components and their effects on project implementation were not foreseen. The important roles of CDC, HSEB, and OCE in planning and implementation were also not adequately assessed during project design, although these agencies were later included in SEDC. A mechanism was not developed to integrate MOES’ 75 district education offices (DEOs) in project implementation, despite their important roles in local school administration. 20. During project implementation, ADB closely supervised the Project through 14 missions (including the PCR Mission), totaling 295 person-days, and used time bound action plans. Most of the missions included field visits, especially after project administration were delegated to the Nepal Resident Mission in 1995. ADB was also flexible to changes in circumstances and agreed to a number of adjustments to facilitate project progress and completion. These included (i) change in the criteria for selecting schools to receive equipment support; (ii) approval of additional civil works and goods; (iii) extension of the loan closing date; and (iv) change in the channeling process of budgetary resources to be released directly to line agencies concerned (CDC, HSEB, and OCE), rather than through the PMU, to help expedite project activities and create a sense of project ownership by these agencies. Close coordination with DFID was established through seven joint project review missions. DFID’s consultant team leader also participated regularly in project-specific meetings held at ADB’s Nepal Resident Mission.
III. ACHIEVEMENT OF PROJECT PURPOSE
A. Operational Performance 21. This section assesses the achievement of project physical outputs under each component (subsections 1–5) and their combined contributions to achieving project outcomes or objectives (subsection 6).
1. Enhancement of Teacher Effectiveness: Outputs
22. Table A4.1 (Appendix 4) shows that the actual outputs of this component included (i) developing three types of teacher training programs for lower secondary (grades 6–8) and secondary (grades 9–10) school teachers, including a 10-month program in English, mathematics, and science; a 4-week program in the core subjects (footnote 5); and a 1-week program in the core subjects as recurrent (in-school) training, compared with the first two types envisaged at appraisal; (ii) training 14,814 lower secondary and secondary public school teachers, together with 652 teacher trainers, in the three types of programs combined, compared with the 14,000 teachers and 1,200 teacher trainers envisaged at appraisal; (iii) developing a 10-month diploma program for higher secondary school teachers (grades 11–12); and (iv) training 65 higher secondary public school teachers, compared with the 150 teachers envisaged at appraisal. The actual number of teacher trainers for lower secondary and secondary schools and that of teachers for higher secondary schools trained under the Project were less than the targets because many schools were not willing to send teachers and teacher trainers to participate in long-term (10-month) training. This is one reason why the 10-

8
month training programs for lower secondary and secondary school teachers were dropped after completing one training cycle and replaced by additional 4-week and 1-week training. 23. Although some outputs were below appraisal targets, key outputs (i.e., the number of teachers trained) exceeded the targets. Given limited project funding, the Project trained about 40% of the total number of nationwide lower secondary and secondary school teachers combined.22 While this is a substantial accomplishment for one project, about 60% of the teachers were not trained. 24. Primary data from the OEM surveys23 show that the training provided by the Project was useful. Most of the sample public school teachers have generally well utilized (59%) and fully utilized (35%) the training (Appendix 5, Table A5.1). Most of the sample teachers felt that they still needed more training. The area of further training needs most frequently mentioned (44%) was use of teaching materials and resources (Appendix 5, Table A5.2). This was followed by refresher training (18%), curriculum and testing training (10%), experience sharing (8%), long-term subject-based training (6%), and teaching methods training (4%). Most of the teachers trained continue to teach in the areas trained in the same schools. 25. The majority of the sample head teachers (80%) said that there was a satisfactory improvement in the performance of their teachers (e.g., improved teaching methods and subject-based knowledge) as a result of the training provided by the Project (Appendix 5, Table A5.3). About 10% perceived substantial improvement and another 10% said only a slight improvement. The sample head teachers indicated the need for a viable teacher training plan, with balanced opportunities for short- and long-term training and proper deployment system. They also stressed the need for DEO’s better school supervision and monitoring system that should focus on observing classroom teaching and teacher attendance, rather than checking administrative records. 26. Widespread teacher absenteeism is a key governance issue in Nepal’s education sector, which is believed to have adverse effects on student performance. Although there are no official statistics on teacher absenteeism, key informants alleged that teacher absenteeism accounted for about 40%, 30%, and 20% of the mandatory requirement of 220 working days24 per year at the primary, lower secondary, and secondary levels, respectively. In some remote rural schools, the problem is more severe and borders on complete absenteeism or ghost teachers as some teachers just come to record attendance once a month. The OEM observed that in the schools where school-based management is strong, SMCs and parent-teacher associations (PTAs)25 played important roles in temporarily reducing teacher absenteeism through school visits. Thus, their roles need to be strengthened to help monitor teacher attendance more systematically. Another governance issue in Nepal’s education sector is the allegation that some prospective teachers pay certain amounts of money to get the teaching jobs. The amounts vary (e.g., between NRs5,000 and NRs40,000) with the type of teaching status (permanent versus temporary) and the level of education of the applicants. According to the new teacher policy,26 22 The total number of lower secondary and secondary (public and private) teachers combined, averaging over the
project period (1993–2000), was 36,125 per year. 23 The analysis drawn from these survey data is qualitative, focusing on interpreting the data and information to gain
insight into the real situations, rather than doing statistical tests. 24 Each teacher is required to teach 5–6 periods (40–45 minutes per period), which are equivalent to about 4 hours,
per day. 25 SMC and PTA differ in that the former is more formal, consisting of seven members (including a representative of
parents) elected by parents and MOES. The latter includes parents and teachers as members. 26 The new teacher policy requires that the minimum official entry requirement for primary school teachers is SLC
plus 10-month teacher training, for lower secondary school teachers is PCL or HSEB’s grade 12 completion plus

9
only qualified persons (with 10-month teacher training) can be recruited as teachers. This should help reduce opportunities to extract bribes from unqualified teachers in return for jobs. However, in practice, this is not likely to happen in the near future as the recent Eighth Amendment of the Education Act in 2004 allows temporary teachers (without 10 months of teacher training) to apply for a permanent status.
2. Curriculum and Textbook Development: Outputs
27. Table A4.1 (Appendix 4) shows that all the outputs of this component, envisaged at appraisal, were achieved. These included (i) formation of Curriculum Task Forces in core subjects of grades 6–10 (footnote 5); (ii) audit of student curricula and textbooks in these core subjects; (iii) development of student curricula, student textbooks, and teacher guides in these core subjects; (iv) establishment of publishing unit at CDC; and (v) curriculum dissemination. Due to the delay in fielding international consultants provided by DFID, curriculum revisions of grades 6 and 7 had to take place without those consultants, although these were revised thereafter. This slowed curriculum dissemination at grades 6 and 7. 28. The OEM survey results in Table A5.4 (Appendix 5) show that the majority of the sample teachers and head teachers felt that the new student curricula, textbooks, and teacher guides were useful (56% and 50%, respectively), while the majority of the sample SEDU chiefs perceived them to be highly useful (63%). This was mainly because the new curricula laid out the system for lower secondary and secondary education development in the country.
3. Improvement in Student Assessment System: Outputs
29. Table A4.1 (Appendix 4) shows that, at appraisal, the outputs of this component included (i) preparations of specification grids for grades 9 and 10, to ensure uniformity and objectivity in scoring; formative assessment booklets for grades 9 and 10; standardized tests and marking schemes for grades 9 and 10, to increase efficiency in scoring; and SLC test samples, to provide a sound foundation for upgrading learning assessment; (ii) training workshops in the use of these outputs; and (iii) marking centers designation, to decentralize the marking of SLC examination papers. Most of the outputs were achieved, except the standardized tests and marking scheme preparation, which required massive testing. Work in this area, however, continued after project completion. The number of SLC marking centers exceeded the appraisal target of 31, as 36 were designated. 30. The OEM survey results in Table A5.5 (Appendix 5) show that the majority of the sample teachers, head teachers, and SEDU chiefs (56%, 80%, and 63%, respectively) found the new marking and student assessment system for SLC examination to be generally useful. However, students’ learning achievement, in terms of SLC pass rate, needs improvement as it has remained low. OCE, which administered SLC examination, could not operate efficiently because it was assigned more responsibilities without additional recurrent funds. Its responsibilities were overstretched due to the (i) increase in the number of students taking the SLC examination—both regular and supplementary, (ii) introduction of parallel questions for some subjects, (iii) requirement that all copies should be marked at the marking centers, and (iv) requirement that regular and supplementary examination results should be published on stipulated dates. Although OCE can generate a large amount of recurrent funds from SLC examination fees and
10-month teacher training, and for secondary school teachers is Bachelor’s degree plus 10-month teacher training. The proportions of existing teachers meeting these minimum requirements are about 16%, 26%, and 38% at the primary, lower secondary, and secondary levels, respectively.

10
grade 9 registration fees (totaling about NRs66 million,27 or $0.9 million equivalent, each year), it must deposit these funds at the government treasury without being entitled to use them.
4. Provision of Learning Materials, Equipment, and Civil Works: Outputs
31. Table A4.1 (Appendix 4) shows that all the outputs of this component, envisaged at appraisal, were achieved. These included (i) supply of learning materials, equipment,28 and furniture to 1,000 lower secondary and secondary schools, 25 higher secondary schools, CDC, Faculty of Education at Tribuvan University, OCE, PMU, SEDEC, and 9 SEDUs that were upgraded to SSRCs; (ii) buildings extension for CDC, SEDEC, and 9 SEDUs that were upgraded to SSRCs; (iii) construction of OCE’s training hall; (iv) construction of a hostel at Khotang SEDU; (v) repair of the remaining SEDUs; (vi) renovation of a science laboratory at the Faculty of Education; and (vii) construction of science laboratories in 25 higher secondary schools. However, civil works were completed with long delays and rather poor quality. 32. Based on the OEM surveys, the outputs of this component were highly appreciated and generally well utilized, except for the science equipment, laboratories, and packages of library books provided to 25 higher secondary schools. The Project provided these without assessing needs. Many of these schools lacked resources to replace consumables and broken items and did not have suitable library and storage facilities. One of these schools stopped running higher secondary classes. However, the main outputs of this component were generally well utilized in 1,000 lower secondary and secondary schools, OCE, SEDEC, and SEDUs.29
5. Strengthening of Planning, Management, and Evaluation: Outputs
33. Table A4.1 (Appendix 4) shows that all the outputs of this component, envisaged at appraisal, were achieved. These included (i) provision of 6-week training in education planning and management to 135 education managers, including school supervisors (compared with 100 at appraisal); (ii) provision of 1-week training in school-based and SEDU management to 411 head teachers of lower secondary schools and 2,222 head teachers of secondary schools (compared with the total of 2,000 teachers at appraisal); (iii) provision of roughly 4 weeks of international training in education planning and management to 222 education managers (276 person-months) (compared with 82 person-months at appraisal); (iv) provision of regional workshops on local education planning techniques to 252 education officers from five regional education directorates and 75 DEOs; (v) preparation of the 15-year secondary education perspective plan, secondary education action plan, and higher secondary school perspective plan; (vi) preparation of 14 policy research studies in curriculum and instructional materials, testing and assessment, management and supervision, financing of secondary education, gender balance, relevance of curriculum contents, and SSRC sustainability; and (vii) preparation of BME studies. 34. Based on the OEM surveys, different types of management training by the Project were found to be useful. For example, half the sample head teachers generally well used the management training acquired, while 17% fully used this training (Appendix 5, Table A5.6). 27 This amount was generated from SLC examination fees of NRs180 per student (about 200,000 students per year)
and from grade 9 registration fees of NRs100 per student (about 300,000 students per year). 28 The equipment provided to the schools was science equipment, whereas that provided to nonschool institutions
consisted of personal computers, photocopy machines, television sets, and video players. 29 The building extension for CDC was fully used by HSEB. Since CDC had adequate space, the use of a new
building by HSEB was justified. HSEB already added two additional floors to the building.

11
6. All Components Combined: Outcomes/Objectives
35. The project objectives were to improve student performance in terms of improving efficiency and quality of lower secondary and secondary education nationwide. Outcome indicators measuring efficiency include promotion rates30 and cohort survival rates,31 both of which are inclusive of dropout and repetition rates. Outcome indicators measuring quality include SLC pass or graduation rate.32 The data used here include both primary data from the OEM sample surveys (e.g., perceptions of the sample teachers on the improvement in overall student performance) and MOES’ nationwide secondary data (e.g., promotion, survival, and SLC pass rates). 36. Based on the OEM surveys, the majority of the sample teachers (76%) perceived satisfactory improvement in overall student performance (e.g., reduced dropout and repetition rates) as a result of the Project, while 14% perceived substantial improvement (Appendix 5, Table A5.7). The perception on improved student performance is considered to be a qualitative outcome indicator, resulting from the achievement of project outputs under the five components combined. However, most of the sample teachers felt that student performance can be further improved through new teaching methods (23%), more use of teaching materials and resources (21%), more home support (12%), improved physical facilities (11%), and smaller class sizes (11%) (Appendix 5, Table A5.8). 37. Based on the OEM surveys of parents whose children were attending the sample schools during the project period (Appendix 5, Table A5.9), less than one-fourth of the sample (21%) had children repeating classes (11% repeating lower secondary and 10% repeating secondary grades). The same table shows that 33% of the sample had children dropping out of school (16% at lower secondary and 17% at secondary grades). According to Table A5.10 (Appendix 5), the main reasons for dropping out were marriage (26%), failure in examination (22%), helping with family work (17%), and high fees and sickness (13% each). Lack of interest of children was quoted only by 9% of the sample parents as the reason for dropping out. Table A5.11 (Appendix 5) shows that most dropouts were found working on farms (57%), followed by their own businesses (17%), government services (13%), and private services (13%). 38. Quantitative outcome indicators on student performance based on MOES’ nationwide secondary data are used below to capture the overall impact of the Project, which was intended for national coverage. 39. Table A5.12 (Appendix 5) shows nationwide, grade-wise and average repetition, dropout, and promotion rates for 3 years—during the start (1993), middle (1998), and end (2000) of the project period. With the declines in repetition and dropout rates over time, average promotion rate increased from 80% to 85% during 1993–2000. This indicates internal efficiency 30 The promotion rate is defined as the proportion of students advancing from one grade to the next. It is equal to
100% minus dropout and repetition rates. Generally, the promotion rate for lower secondary and secondary grades combined is presented in terms of an average of the promotion rates for grades 6–10.
31 The cohort survival rate is defined as the number of students who remained in school up to a certain grade as a proportion of their cohorts who enrolled in a specific earlier grade in earlier year. For example, the cohort survival rate for lower secondary (grades 6–8) and secondary (grades 9–10) students combined in 2000 would be equal to the number of students who enrolled in grade 10 in 2000 as a proportion of students who enrolled in grade 6 in 1996.
32 The SLC pass rate is defined as the number of students who passed the SLC examination at the end of grade 10, both regular and supplementary, as a proportion of those taking the examination in that year. This rate is considered the graduation rate.

12
gains associated with the reduction in wastage. Table A5.13 (Appendix 5) shows nationwide enrollment in lower secondary and secondary grades. The enrollment decreased as the students entered successive grades, due to the existence of repetition and dropouts, although both declined over time. Based on this table, another internal efficiency indicator (cohort survival rates from grade 6 to grade 10) was calculated in Table A5.14 (Appendix 5). Although the rates fluctuated during the project period (1993–2000), they increased after (2001–2002). For example, from grade 6 to 8, the rate increased from an average of 86% during the project period to 90% after. Whereas from grade 6 to 10, the rate increased from an average of 60% to 65%. This table also shows improvement in the transition rate from SLC pass at the end of secondary to higher secondary schooling (averaging 53% versus 89% during and after the project periods). Such a high transition rate (almost 90%) implies that most of the secondary school graduates generally intend to complete higher secondary education, rather than entering the labor market. 40. In this table, the only indicator showing no improvement is the cohort survival rate from grade 6 to SLC pass at the end of grade 10. The rate averaged 41% during the project period and 28% after. However, between 2001 and 2002, the rate started to increase slightly from 27% to 30%. This trend followed the trend of the SLC pass or graduation rate, shown in Table A5.15 (Appendix 5), which averaged 73% during the project period and 56% after. Between 2001 and 2002, the rate increased slightly from 55% to 57%. The small impact of the Project on the SLC pass rate is not surprising since less than half (about 40%) of lower secondary and secondary teachers were trained under the Project (para. 23). More time is required for the Project to have a larger impact on the SLC pass rate because the SLC pass rate reflects students’ learning achievement more than other indicators (e.g., promotion rates) do. 41. Although the SLC pass rate increased slightly, other outcome indicators (promotion rates and cohort survival rates from grade 6 to grade 10, and transition rate from SLC pass at the end of secondary to higher secondary schooling) improved satisfactorily. Since ADB is the major donor in the secondary education subsector (footnote 14), the achievement of the project outputs under the five components combined are considered as the contributing factors to achieving these project outcomes. The two MDGs related to education (MDG2 and MDG3) focused on increasing access to education, by boys and girls alike, particularly at the primary level (para. 10). In 2003, ADB committed itself to the management for development results. Although this Project focused on improving the quality and efficiency of lower secondary and secondary education, rather than primary education, the achievement of many project outcomes is likely to help Nepal to achieve these MDGs. B. Performance of the Operating Entity 42. As the Government’s Eighth Five-Year Plan (1992–1997) started to focus on the social sector and poverty reduction, the Government’s total recurrent education budget33 as a proportion of gross domestic product increased more than six fold, from 0.4% in FY1993 to 2.5% in FY2003 (Appendix 6). This indicates the Government’s commitment to the education sector. In this area, Nepal compares favorably to some other developing member countries, such as Bangladesh (1.4%) and Indonesia (1.0%). The share of the Government’s total recurrent education budget in the overall recurrent budget in Nepal more than tripled, from 6% in FY1993 to 20% in FY2003. Again, this share is higher in Nepal than in Bangladesh (11%) and Indonesia (8%). As the Government’s education priority in Nepal shifted to basic education since the Eighth Five-Year Plan, the share of primary education in total education budget
33 In this case, budget and expenditure are used interchangeably, because budget allocated from one source to a
recipient will finally become an expenditure of the recipient.
13
averaged 53% and that of all levels of secondary education combined averaged 27%, during and after the Project. The remaining shares consisted of tertiary education and others (averaging 12% and 7%, respectively, after the Project). During this period, the Borrower performed well in terms of increasing the budget allocation to education. C. Sustainability 43. The PCR did not analyze the financial sustainability of the Project. The National Center for Educational Development (NCED) drafted a teacher training policy framework34 that will address some institutional sustainability issues relating to primary and secondary teacher training. The annual recurrent cost of the Project accounts for only about 1% of the Government’s annual recurrent budget allocated to secondary education as a whole (Appendix 6). However, the Government still bears a high fiscal burden through the 100% financing of teacher salaries, which raises concerns about financial sustainability of the Project. At the school level, the reintroduction of the cost-recovery principle allowed public secondary schools to collect tuition fees from students (para. 18). Coupled with additional support under ADB’s ongoing Secondary Education Support Project (SESP),35 many schools are expected to generate additional resources, thus reducing fiscal burden on the Government’s budget in the future and increasing the probability of financial sustainability. D. Economic Reevaluation 44. No economic analysis was done at appraisal or by the PCR. The OEM believes that economic analysis should be done to provide a measure of economic efficiency. This PPAR estimates the economic internal rate of return (EIRR) on investment in the Project, using nationwide secondary data to calculate project benefits and the project capital and recurrent costs to calculate project costs (Appendix 7). The calculations show the OEM’s estimate of what the EIRR would have been at appraisal and at the time of evaluation. The project benefits are efficiency gains (in terms of increased cohort survivals from grade 6 to SLC pass at the end of grade 10) due to the Project compared with the non-project situation. The economic value of the increased cohort survivals was the incremental wage rate, which is the difference between the average wage rates of those passing the SLC examination and those finishing less than or up to grade 10 without passing the SLC examination. Based on the actual nationwide data after project completion, the cohort survival rate increased slightly from 27% in 2001 to 30% in 2002. To estimate the EIRR (Appendix 7, Table A7.1), this rate was forecast to increase gradually from 30% to the average rate achieved in the past (37%) by the cutoff year (2020). Compared with the standard cost of capital of 12.0%, the EIRR was estimated at 15.5% at the time of evaluation. Despite the current low SLC pass rate at the end of grade 10, the improved cohort survival rate from grade 6 to grade 10 (due to decreased repetition and dropouts) made the Project an economically viable investment. Using the same methodology, the EIRR at appraisal was estimated at 17.2% (Appendix 7, Table A7.2), which gives further support for ADB’s decision to finance the Project.
34 This draft is awaiting formal approval from MOES. 35 ADB. 2002. Secondary Education Support Project. Manila.

14
IV. ACHIEVEMENT OF OTHER DEVELOPMENT IMPACTS A. Socioeconomic Impact 45. Although the Project was not designed to directly reduce poverty,36 about half of the schools that receive equipment and facilities support from the Project were located in rural poor areas. Poverty is multi-dimensional in nature. A good education is widely recognized as one of the best investments that can be made to help people escape poverty. With the skills acquired through education, people have a higher probability of getting jobs that will generate the income necessary to escape poverty. The OEM surveys show that the sample parents in urban areas are generally better-off when compared with those in rural areas (Appendix 8). A larger proportion of urban parents belong to the moderate and higher income group compared with rural parents (34% versus 20%), and a lower proportion belong to the poor and very poor income groups (63% versus 71% and 3% versus 9%, respectively). Of the total sample parents, the majority (67%) belong to the poor income group. As the Project focused on assisting many schools in poor areas, these findings imply that the Project addressed the equity issue to some extent. 46. Because of the pro-poor nature of investments in education, universal access to education is one of the MDGs (para. 10). Although the Project was not designed to focus on gender issues, the Project prepared a policy research study addressing gender concerns, developed special training courses for female teachers, sensitized teachers to gender issues in some training courses, scrutinized textbooks to avoid gender bias, and gave preferential treatment in distributing project-supported science equipment and other learning materials to schools with higher percentages of girls’ enrollment and with increased recruitment of female teachers. Despite these positive efforts, gender gaps in secondary education remain wide (para. 9). B. Environmental Impact
47. The Project addressed environmental concerns by emphasizing conservation of natural resources and personal and community hygiene in some teacher training courses. Moreover, a separate subject on health, population, and environment was introduced in grade 9. Construction activities were undertaken within the existing premises, with due attention to the environment. C. Impact on Institutions and Policy
48. At the school level, the Project achieved satisfactory institutional impact because the knowledge gained by the trained teachers from in-service training was generally well used. At a broader level, the Project also achieved good institutional impact. It institutionalized 25 positions at SEDEC and 100 positions at SEDUs; created the technical unit at OCE, to facilitate the administration of SLC examination; institutionalized three positions at OCE’s technical unit; decentralized the SLC system by designating 36 marking centers; increased project ownership, by involving various stakeholder groups in curriculum development; and trained more teachers and education administrators than appraisal targets, with some skills transfers and follow-up support under the ongoing SESP.
36 In 2002/03, the annual per capita poverty line was NRs6,471, poverty incidence was 38%, rural poverty incidence
was 40%, and urban poverty incidence was 21%. The corresponding figures for 1995/96 were NRs4,404, 42%, 44%, and 23%, respectively.
15
V. OVERALL ASSESSMENT A. Relevance 49. The Project was consistent with the objectives of the Government’s plans, from the Eighth Five-Year Plan (1992–1997) to the Tenth Five-Year Plan (2002–2007). The Project continues to be consistent with ADB’s education strategy, which shifted its focus since the early 1990s from skills development and TEVT to basic education. However, the Project focused on delivery of teacher training without intending to develop a viable teacher training plan (para. 8). The Project was also designed without strategic links to higher secondary education. On balance, the Project is considered relevant, rather than highly relevant. B. Efficacy 50. The Project achieved most of the outputs envisaged at appraisal and built a foundation for quality and efficiency improvements. Various outcome indicators (promotion rates, cohort survival rates from grade 6 to grade 10, and transition rate from secondary to higher secondary education) improved satisfactorily (para. 41). Although the SLC pass rate remained low, it started to increase slightly between 2001 and 2002. On balance, since many outcome indicators were achieved, the Project is considered efficacious. C. Efficiency 51. Project facilities were generally well utilized, including those provided to lower secondary and secondary schools, OCE, SEDEC, and SEDUs (para. 32). The exception is that the science equipment, laboratories, and library book packages provided to higher secondary schools were not well used, because these schools lacked resources for maintenance as well as library space. However, this was a minor part of the Project (5.4% of the total project cost). Since the Project had an EIRR of 15.5% (para. 44), the Project as a whole is considered efficient. D. Sustainability 52. Many of the training and reform activities initiated under the Project are likely to be sustained with the follow-up support from the SESP. However, the Government still bears a high fiscal burden, as it finances 100% of teacher salaries. Since public secondary schools are now allowed to collect tuition fees from students, and since many schools are expected to generate additional resources under ADB’s ongoing SESP (para. 43), the fiscal burden on the government budget is expected to decrease in the future. Thus, overall sustainability of the Project is considered likely, but at the lower end of the range, depending upon the extent of additional resources generated by these schools. E. Institutional Development and Other Impacts 53. The Project had a satisfactory institutional impact, as the trained teachers were able to generally use the knowledge gained from training, the positions created at SEDEC and SEDUs were institutionalized, and the technical unit at OCE was created to facilitate the administration and decentralization of SLC examination (para. 48). But a viable teacher training policy framework and action plan are yet to be developed for long-term institutional impact. The Project addressed gender concerns in a policy research study and developed special training courses for female teachers. No adverse environmental impact was noted. The Project incorporated environmental awareness in some teacher training and student courses.

16
The Project addressed some equity issues by providing assistance to many schools in poor rural areas (para. 45). Overall, the institutional development and other impacts of the Project are considered significant (satisfactory). F. Overall Project Rating 54. Based on the overall results of the five evaluation criteria and the standard weighting system of the Operations Evaluation Department, the Project is rated as successful.
G. Assessment of Asian Development Bank and Borrower Performance 55. Except for one loan covenant requiring the Borrower to limit contributions to teacher salaries, which could not be fulfilled due to the subsequent change in an education policy to support free secondary education in 1995 (para. 18), the Borrower fulfilled other obligations. Adequate counterpart funds were made available on time. The PMU performance improved from 1995, as reflected in its close coordination with concerned agencies. SEDC met 35 times during the project period, reflecting a concern to implement the Project effectively. Although ADB coordinated closely with DFID during project formulation, the delay in the start-up of DFID-supported components and their effects on project implementation were not adequately assessed. During implementation, ADB coordinated closely with DFID through seven joint project review missions, which included field visits to schools outside Kathmandu. ADB was also flexible to changes in circumstances to facilitate project progress. Overall, the performance of both the Borrower and ADB is rated as satisfactory.
VI. ISSUES, LESSONS, AND FOLLOW-UP ACTIONS A. Key Issues for the Future 56. The following six key issues emerged from the evaluation: 57. Weak Governance in the Education Sector. To improve the quality and efficiency of education in the long-run, key governance issues need to be addressed. The first issue is the allegation that some unqualified people pay bribes to get the teaching jobs. Ensuring that only qualified people are recruited as teachers will help to address this problem. The second issue is the widespread teacher absenteeism. SMCs and PTAs have potential roles to play in monitoring teacher attendance and in creating incentives for teachers to come to work (para. 26). Both SMCs’ and PTAs’ roles should be systematically empowered by MOES to help reduce absenteeism. 58. Weak SLC Examination System. The SLC pass rate is still low. OCE’s responsibilities in administering the SLC system have been overstretched without sufficient autonomy (para. 30). Further SLC examination reforms are needed. 59. Weak School Supervision System. MOES recently established a monitoring, evaluation, and inspection division to carry out periodic external inspections of school performance on a random basis. It does not interact much with MOES’ internal supervision and monitoring of school performance through 75 DEOs. The internal supervision system itself is weak and fragmented due to inadequate travel funds for school visits and a role misunderstanding by DEOs’ school supervisors. They generally spend most of their time checking administrative records during school visits, rather than observing how teachers applied

17
their knowledge trained at SEDUs to classroom teaching or observing teacher attendance (para. 25). 60. Lack of Detailed Teacher Training Policy Framework and Action Plan to Develop an Effective Teacher Training and Deployment System. Although the in-service teacher training provided under the Project was effective, a viable training system has yet to be developed (para. 8). MOES, through NCED, recently developed a draft teacher training policy framework that integrates teacher training for primary and secondary education as well as management training for head teachers and other education personnel. This policy37 is rather broad and did not specify teacher norms and standards (e.g., students-teacher ratio, teachers per subject, and teachers’ time on tasks) required to produce a sufficient number of qualified teachers within a certain timeframe. 61. Lack of Appropriate Regulatory Framework to Promote Public-Private Partnerships. Of the 7,917 lower secondary and secondary schools, about 18% are private. Most for-profit private schools do not need MOES to monitor their quality, due to market-based competition for students and their generally satisfactory performance (para. 9). However, their roles and functions should be monitored and regulated to encourage them to help improve public school performance through public-private partnerships. These partnerships would be particularly useful given people’s perceptions that private schools exploit parents (by charging high fees) and teachers (by paying inadequate salaries). 62. Lack of Integration of Higher Secondary Education with the Core Secondary Education System. Two isolated and parallel public higher secondary education (grades 11–12) streams (PCL and HSEB) exist, neither of which are integrated with the core education (grades 1–10) system (para. 8). Although HSEB-affiliated schools are located in urban and rural areas, poor students in rural areas normally cannot afford to attend these schools, due to the relatively high tuition fees charged (NRs200 per student per month). PCL-affiliated institutions charge lower tuition fees (NRs30 per student per month) but are mostly located in urban areas. Students from rural areas cannot afford the high living expenses in urban areas.38 Of the 100,000 grade 11 students, about 75% are under HSEB’s stream, and 25% are under the PCL stream. Taken together, these factors have an anti-poor bias because rural students face more barriers in continuing their education at the higher secondary level. The poverty incidence in rural areas is higher than that in urban areas (footnote 36). Coupled with the lack of sufficient financial support to both streams, higher secondary education has become a constraint to the improvement of overall secondary education. The current Tenth Five-Year Plan (2002–2007) intends to provide full support to 205 HSEB-affiliated schools.39 However, shortages of funds are likely to deter implementation.40
37 To facilitate the integration of primary- and secondary-level teacher training and management training, MOES also
proposed to develop with NCED an apex training institution to coordinate and implement training programs, and SEDEC and the Distance Education Center are to be merged into this institution. Subsequently, the 25 SEDUs (11 of which are SSRCs) under SEDEC that are responsible for delivering training to secondary school teachers will be upgraded to training centers. Together with NCED’s existing 9 training centers for primary school teachers, the number of total training centers for primary and secondary education under the proposed apex institution will be 34.
38 Living expenses in Kathmandu are about NRs2,000 ($27.4 equivalent) per student per month. 39 At present, the financial support provided by MOES to HSEB-affiliated schools covers only salaries for one teacher
per school. As a result, these schools cannot find or retain qualified teachers. 40 Possibilities of phasing out the PCL stream were explored by MOES. However, agreements could not be reached
with Tribuvan University, which is the major provider of the PCL stream.

18
B. Lessons Identified 63. The first two issues (paras. 57–58) are addressed as lessons for ADB’s ongoing interventions, whereas the remaining four issues (paras. 59–62) are addressed as follow-up actions by MOES. The following are lessons for ADB’s ongoing and future interventions:
(i) Under the ongoing SESP, ADB should conduct policy dialogue with MOES to explore ways to improve governance in the education sector, particularly the allegation that people have to pay certain amounts of money to get the teaching jobs. Opportunities to extract bribes from unqualified persons in return for jobs should be reduced when only qualified persons (with 10-month teacher training) can be recruited in accordance with the new teacher policy. ADB’s policy dialogue with MOES should support the actual enforcement of this policy.
(ii) Under the ongoing SESP, ADB should conduct policy dialogue with MOES and the Ministry of Finance to explore the possibility of undertaking further SLC examination reforms to improve the SLC pass rate, make the SLC examination more reflective of students’ learning achievement, and improve OCE’s efficiency and autonomy in providing SLC services in the light of its increased responsibilities.
(iii) In-service teacher training should not last more than a few months. Otherwise, it would lead to prolonged absence of teachers. In-service training should be followed-up by 1- or 2-week refresher courses and by DEO’s monitoring on how the training acquired is actually applied to classroom teaching.
(iv) If a project will be cofinanced, the Government should sign agreements with the
cofinancing agencies prior to Board approval to avoid delays in implementation. Project design should allow sufficient time for consultant recruitment under the procedures of the cofinancing agencies, with a monitored and time bound implementation plan.
C. Follow-Up Actions 64. To address the remaining four issues (paras. 59–62), MOES agreed to implement the following follow-up actions, in conjunction with the ongoing projects and technical assistance (TA). The proposed timeframes are tentative, depending upon the timing in the relevant ongoing projects and TA.
(i) MOES should prepare a school supervision and monitoring framework, in conjunction with the ongoing SESP, by December 2005 and an indicative action plan by June 2006. The framework should aim to systematically empower the roles of SMCs and PTAs in monitoring teacher attendance41 and performance and improve DEOs’ school supervision system. The framework should also link to the teacher training policy framework and encourage interactions between DEOs’ internal supervision and MOES’ external inspections initiated under the ongoing SESP.
41 Various possibilities to systematically empower the roles of SMCs and PTAs to reduce teacher absenteeism should
be explored and implemented. One possibility is to follow an experience of Uganda by encouraging the SMCs and PTAs to post the names of the teachers who are and who are not absent on the school board on a weekly basis.

19
(ii) MOES (through NCED) should expand the teacher training policy framework, in conjunction with the ongoing Teacher Education Project42 and SESP, by December 2005 and prepare an indicative action plan by June 2006. The expanded framework should include estimates of demand-based training for lower secondary and secondary schools to identify the number of teachers needed per subject and per student; the number of teachers needed for initial, in-service, and refresher training; the number of teacher trainers needed; appropriate deployment scheme; management training needs; training needs for DEOs’ school supervisors to enable them to monitor teachers’ application of the training acquired to classroom teaching.
(iii) MOES, in close collaboration with private schools and in conjunction with the
ongoing SESP, should develop a regulatory framework and incentive system to encourage some good private schools to provide in-kind support (e.g., in terms of books, management, study visits to private schools, and teachers) to some public schools in the locality by December 2005 and prepare an indicative action plan by June 2006.
(iv) MOES, in conjunction with the ongoing TA on the Preparation for Education
Sector Development Policy and Strategy,43 should develop an overall secondary education framework, based on the guideline in the Tenth Five-Year Plan (2002–2007), to integrate the curricula of secondary and higher secondary education by December 2005 and prepare an indicative action plan by June 2006.
42 ADB. 2001. Teacher Education Project. Manila. 43 ADB. 2004. Preparation for Education Sector Development Policy and Strategy. Manila.

($'000) Appraisal Estimate Actual (ADB & Gov't) Actual (DFID) Actual (All) %(Underrun)/Overrun
Item Foreign Local Total Foreign Local Total Foreign Local Total Foreign Local Total Foreign Local TotalA. Physical Facilities
1 Land Acquisition 0 50 50 0 50 50 0 0 0 0 50 50 – 0.0 0.02 Site Development 21 121 142 10 64 74 0 0 0 10 64 74 (52.4) (47.1) (47.9)3 Construction 365 1,185 1,550 417 1,252 1,669 0 0 0 417 1,252 1,669 14.2 5.7 7.7
Subtotal 386 1,356 1,742 427 1,366 1,793 0 0 0 427 1,366 1,793 10.6 0.7 2.9
B. Equipment1 Furniture 8 179 187 61 60 121 0 30 30 61 90 151 662.5 (49.7) (19.3)2 Equipment 2,654 420 3,074 1,564 247 1,811 148 148 296 1,712 395 2,107 (35.5) (6.0) (31.5)3 Vehicles 25 0 25 49 0 49 110 0 110 159 0 159 536.0 – 536.0
Subtotal 2,687 599 3,286 1,674 307 1,981 258 178 436 1,932 485 2,417 (28.1) (19.0) (26.4)
C. Learning Materials 586 220 806 236 89 325 0 41 41 236 130 366 (59.7) (40.9) (54.6)
D. Professional Dev. & Institutional Building
1 Curriculum and Textbook 0 908 908 0 234 234 0 0 0 0 234 234 – (74.2) (74.2)2 Examination Reforms 0 540 540 0 267 267 0 0 0 0 267 267 – (50.6) (50.6)3 Institutional Strengthening 0 286 286 0 22 22 0 0 0 0 22 22 – (92.3) (92.3)
Subtotal 0 1,734 1,734 0 523 523 0 0 0 0 523 523 – (69.8) (69.8)
E. Staff Development1 In Country 0 2,439 2,439 0 2,150 2,150 0 255 255 0 2,405 2,405 – (1.4) (1.4)2 Overseas 893 0 893 166 0 166 633 0 633 799 0 799 (10.5) – (10.5)
Subtotal 893 2,439 3,332 166 2,150 2,316 633 255 888 799 2,405 3,204 (10.5) (1.4) (3.8)
F. Consulting Services1 International 1,454 348 1,802 0 0 0 3,555 810 4,365 3,555 810 4,365 144.5 132.8 142.2 2 Domestic 0 536 536 0 29 29 0 0 0 0 29 29 – (94.6) (94.6)
Subtotal 1,454 884 2,338 0 29 29 3,555 810 4,365 3,555 839 4,394 144.5 (5.1) 87.9 G. BME/EMIS/Policy Studies 110 257 367 0 91 91 0 0 0 0 91 91 (100.0) (64.6) (75.2)H. Recurrent Cost
1 Project Management Unit 0 268 268 0 366 366 0 200 200 0 566 566 – 111.2 111.2 2 Operation & Maintenance 0 1,424 1,424 0 1,004 1,004 0 370 370 0 1,374 1,374 – (3.5) (3.5)
Subtotal 0 1,692 1,692 0 1,370 1,370 0 570 570 0 1,940 1,940 – 14.7 14.7
I. Service Charge 433 0 433 166 0 166 0 0 0 166 0 166 (61.7) – (61.7)
Total 6,549 9,181 15,730 2,669 5,925 8,594 4,446 1,854 6,300 7,115 7,779 14,894 8.6 (15.3) (5.3)ADB = Asian Development Bank, BME = benefit monitoring and evaluation, dev. = development, DFID = Department for International Development, EMIS = education management and information system, Gov't = Government.Source: ADB. 2001. Project Completion Report on the Secondary Education Development Project in Nepal . Manila.
ESTIMATED AND ACTUAL PROJECT COSTS 20 Appendix 1

Appendix 2 21
SAMPLE SIZE OF BENEFICIARY SURVEYSa
Category of Respondents No.Head Teachersb 10Teachersc 50SEDU Chiefs 8Parents whose Children Enrolled in Sample Schools during the Project Periodd 70No. = number, SEDU = secondary education development unit.a The surveys were conducted in 10 districts from the country's 5 develoment regions plus the Kathmandu Valley. These districts included Baitadi, Banke, Bara, Bhaktapur, Dhankuta, Gorkha, Kabhrepalanchok, Kathmandu, Morang, and Parsa (Map).b One head teacher was interviewed per school. The sample schools are some public schools assisted by the Project. From the total sample of 10 head teachers, 6 received management training by the Project.c From the total sample of 50 teachers, 37 received subjects-based training and training on teaching methods by the Project.d From the total sample of 70 parents, 15 had children repeating classes and 23 had children dropping out. Source: Field surveys conducted in April 2004.

1312 11 19 1817161514
Lower Secondary
Primary Secondary Higher Secondary
Diploma Master’s Degree
Bachelor’s Degree
OJT 3 months
PS 15141312 11SLC1098761 3 2 4 5 1716
Level 3 Level 1 Level 4 Level 2
OJT 5 months 12
11
11
Bachelor’s Degree
Master’s Degree
• HSEB Stream
• PCL Stream
Vocational training of different durations offered by various agencies
No academic prerequisite
Skilled/semi-skilled labor
Skills-Testing Framework
Technical Education and Vocational Training
TSLC
TSLC
Figure A3: Education System
HSEB = Higher Secondary Education Board, MOES = Ministry of Education and Sports, OJT = on-the-job training, PCL = proficiency certificate level, PS = preschool, SLC = school leaving certificate, TSLC = technical school leaving certificate. Source: MOES.
EDUCATION SYSTEM AND ENROLLMENT IN NEPAL
22 Appendix 3

Pub. Priv.a Total Pub. Priv. Total Pub. Priv. Total Pub. Priv. Total Pub. Priv. Total Pub. Priv. Total Pub. Priv. Total Pub. Priv. Total Pub. Priv. Total Pub. Priv. Total
Preschool 26 232 258 88 171 259 50 198 248
Primary Grade 1 1,204 45 1,249 1,229 53 1,283 1,244 79 1,323 1,314 102 1,416 1,243 117 1,361 1,278 112 1,390 1,329 183 1,512 1,217 102 1,319 1,195 138 1,333 1,115 173 1,288 Grade 2 544 37 580 566 38 604 546 50 596 565 48 612 597 52 649 638 55 693 617 84 701 656 71 727 683 100 783 652 124 777 Grade 3 439 37 476 449 36 485 465 42 507 490 45 536 490 49 539 528 50 578 519 71 590 537 56 594 588 80 668 589 109 698 Grade 4 399 34 433 406 35 441 404 45 450 438 46 485 436 50 486 445 51 496 459 67 526 484 45 529 519 62 581 542 93 635 Grade 5 329 25 354 349 29 378 354 34 388 361 39 400 383 43 426 387 44 431 391 59 450 415 39 454 435 54 489 451 79 530 Subtotal 2,914 178 3,092 3,000 192 3,192 3,012 251 3,263 3,168 279 3,448 3,149 312 3,461 3,276 312 3,588 3,317 464 3,780 3,310 313 3,623 3,419 435 3,854 3,350 578 3,929
Lower Secondary Grade 6 214 35 248 224 39 263 249 39 288 254 47 301 253 58 312 260 66 326 267 81 348 261 100 362 363 48 411 337 97 434 Grade 7 184 30 214 178 35 213 198 35 233 221 38 258 207 53 260 213 57 270 227 72 300 223 80 302 295 44 339 282 87 369 Grade 8 110 65 176 116 79 194 136 70 205 181 51 233 199 58 258 184 62 246 193 74 267 232 61 293 270 38 309 260 75 334 Subtotal 508 130 637 517 153 670 582 144 726 656 135 792 659 169 829 658 185 843 688 228 916 717 241 957 928 131 1,058 879 259 1,137
Secondary Grade 9 90 51 141 86 58 144 99 57 156 143 37 180 145 42 187 159 54 213 140 56 196 156 64 220 218 35 252 201 61 262 Grade 10 87 45 132 78 52 130 88 47 134 121 29 150 128 29 157 123 39 162 141 48 189 109 45 153 168 29 197 168 51 219 Subtotal 176 96 273 164 110 274 187 103 290 263 66 330 273 71 344 282 94 375 281 104 385 264 109 373 386 64 449 368 112 481
Total (1–10) 3,598 404 4,002 3,681 455 4,136 3,781 498 4,279 4,088 481 4,569 4,081 552 4,634 4,215 591 4,806 4,286 795 5,081 4,291 662 4,954 4,732 629 5,361 4,597 949 5,546
Total (6–10) 684 226 910 681 263 945 769 248 1,016 919 202 1,121 932 240 1,173 939 278 1,218 969 331 1,301 981 350 1,330 1,313 195 1,508 1,247 371 1,618
Higher Secondaryb
Grade 11 30 1 32 29 1 30 31 3 34 33 6 39 31 9 40 30 12 43 33 19 52 32 28 60 38 50 88 30 44 75 Grade 12 32 0 32 25 1 26 23 1 24 24 2 27 27 5 32 25 7 32 24 10 35 25 16 41 29 24 53 31 42 73 Subtotal 63 1 64 54 2 56 54 4 57 57 9 66 58 14 71 55 19 75 57 29 86 58 44 102 67 74 141 61 86 147
Total (1–12) 3,660 406 4,066 3,735 457 4,192 3,835 502 4,337 4,145 490 4,635 4,139 566 4,705 4,270 610 4,880 4,343 824 5,167 4,349 706 5,055 4,799 704 5,503 4,658 1,036 5,694HSEB = Higher Secondary Education Board, MOES = Ministry of Education and Sports, NGO = nongovernment organizations, priv. = private, pub. = public.a In this table, enrollment in private schools includes not only that in corporate and NGO/trust schools, but also in proposed/community schools which have been proposing to become government schoolsb In this table, enrollment in higher secondary schools includes only the HSEB stream funded by MOESSources: MOES, staff estimates.
20022001
Table A3.1: Nationwide Annual Enrollment of Students from Public and Private Schools by Education Level (1993–2002)
1997 1998 1999 20001993 1994 1995
('000)
1996Level
Appendix 3 23
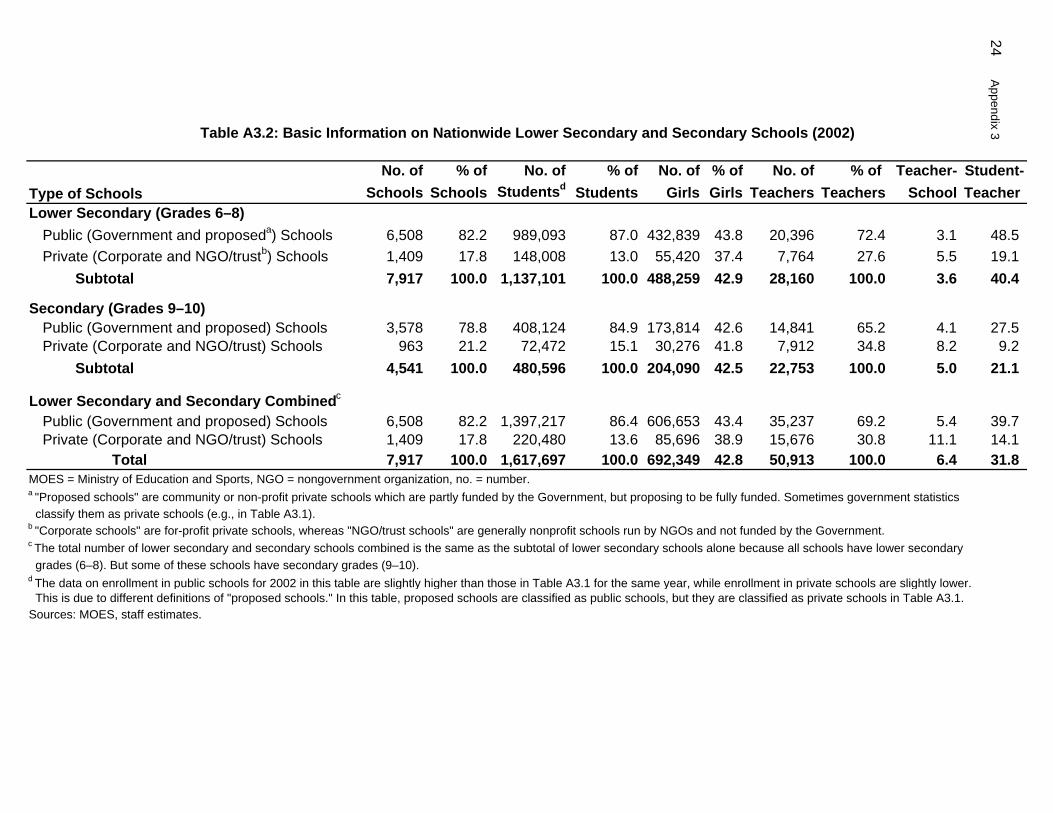
No. of % of No. of % of No. of % of No. of % of Teacher- Student-Schools Schools Studentsd Students Girls Girls Teachers Teachers School Teacher
Lower Secondary (Grades 6–8)Public (Government and proposeda) Schools 6,508 82.2 989,093 87.0 432,839 43.8 20,396 72.4 3.1 48.5Private (Corporate and NGO/trustb) Schools 1,409 17.8 148,008 13.0 55,420 37.4 7,764 27.6 5.5 19.1 Subtotal 7,917 100.0 1,137,101 100.0 488,259 42.9 28,160 100.0 3.6 40.4
Secondary (Grades 9–10) Public (Government and proposed) Schools 3,578 78.8 408,124 84.9 173,814 42.6 14,841 65.2 4.1 27.5Private (Corporate and NGO/trust) Schools 963 21.2 72,472 15.1 30,276 41.8 7,912 34.8 8.2 9.2 Subtotal 4,541 100.0 480,596 100.0 204,090 42.5 22,753 100.0 5.0 21.1
Lower Secondary and Secondary Combinedc Public (Government and proposed) Schools 6,508 82.2 1,397,217 86.4 606,653 43.4 35,237 69.2 5.4 39.7Private (Corporate and NGO/trust) Schools 1,409 17.8 220,480 13.6 85,696 38.9 15,676 30.8 11.1 14.1 Total 7,917 100.0 1,617,697 100.0 692,349 42.8 50,913 100.0 6.4 31.8
MOES = Ministry of Education and Sports, NGO = nongovernment organization, no. = number.
classify them as private schools (e.g., in Table A3.1).b "Corporate schools" are for-profit private schools, whereas "NGO/trust schools" are generally nonprofit schools run by NGOs and not funded by the Government.c The total number of lower secondary and secondary schools combined is the same as the subtotal of lower secondary schools alone because all schools have lower secondary grades (6–8). But some of these schools have secondary grades (9–10).
This is due to different definitions of "proposed schools." In this table, proposed schools are classified as public schools, but they are classified as private schools in Table A3.1.Sources: MOES, staff estimates.
Table A3.2: Basic Information on Nationwide Lower Secondary and Secondary Schools (2002)
Type of Schools
a "Proposed schools" are community or non-profit private schools which are partly funded by the Government, but proposing to be fully funded. Sometimes government statistics
d The data on enrollment in public schools for 2002 in this table are slightly higher than those in Table A3.1 for the same year, while enrollment in private schools are slightly lower.
24 A
ppendix 3

Item Appraisal Actual (at OEM) Remarks
A. Enhancement of Teacher Effectiveness
1. Development of Teacher Training Programs Developing 10-month program in Completed As agreed upon in January 1996, 10-monthfor Lower Secondary (grades 6–8) and English, mathematics, and science training was dropped after completing oneSecondary (grades 9–10) Teachers for grades 6–10 teachers training cycle, and replaced by more
short-term trainingDeveloping 4-week program in core Completedsubjectsa for grades 6–10 teachers
1-week program in core subjectsas a recurrent (in-school) trainingdeveloped
2. Provision of Training to Grades 6–10 For 14,000 teachers of grades 6–10 14,814 teachers of grades 6–10 Including 868 teachers for 10-month courseTeachers trained plus 13,413 teachers for 4-week course
plus 533 teachers for 1-week course,totaling 22,226 person-months of training
For 1,200 teacher trainers of 652 teacher trainers of grades 6–10grades 6–10 trained
3. Development of Teacher Training Program for Developing 10-month diploma program CompletedHigher Secondary (grades 11–12) Teachers for grades 11–12 teachers
4. Provision of Training to Grades 11–12 For 150 teachers of grades 11–12 65 teachers of grades 11–12 trained Schools were not willing to send teachersTeachers for long-term training
B. Curriculum and Textbook Development
1. Formation of Curriculum Task Forces in Forming tasks forces in core subjects CompletedCore Subjects of Grades 6–10 of grades 6–10
2. Audit of Student Curricula and Textbooks in Auditing Curricula and textbooks in CompletedCore Subjects of Grades 6–10 core subjects of grades 6–10
3. Curriculum and Textbook Development in Developing curricula and textbooks Completed Further improvement in grades 6–7 wasCore Subjects of Grades 6–10 in core subjects of grades 6–10 undertaken after international consultants
under the DFID grant had been recruited
4. Dissemination/Orientation of Curricula in Disseminating curricula in core Completed Delayed dissemination activities at grades Core Subjects of Grades 6–10 subjects of grades 6–10 6–7 due to further revision
ACHIEVEMENT OF OUTPUT TARGETS
Table A4.1: Achievement of Actual Output Versus Appraisal Targets
Appendix 4 25
Continued on next page

Item Appraisal Actual (at OEM) Remarks
C. Improvement in Student Assessment System
1. Reform in Student Assessment in Preparing specification grids for CompletedConjunction with Curriculum Development grades 9–10
Preparing formative assessment booklets Completedfor grades 9–10
Preparing standardized tests and marking Not fully completed Dummy exams were conducted, andschemes for core subjects of grades 9–10 massive exercises needed
Preparing SLC test samples Completed
2. Workshops Use of specification grids to ensure Completed; 3,031 participantsuniformity and objectivity in scoring
Scoring and verifying exam papers Completed; 12,000 participants
Use of marking schemes to increase Completed; 494 participantsefficiency and quality of scoring
Use of sample test items to provide Completed; 270 participantssound foundation for upgradinglearning assessment
3. Examination Decentralization Designating 31 SLC marking centers 36 SLC marking centers designated
D. Provision of Learning Materials, Equipment, and Civil Works
1. Provision of Science Equipment, Furniture, To 1,000 lower secondary and CompletedLibrary Books, and Other Learning Materials secondary (grades 6–10) schools to Grades 6–12 Schools
To 25 higher secondary (grades 11–12) Completedschools
2. Provision of Training in the Use/Maintenance To the total of 1,025 schools of 981 schools trained Some grades 11–12 schools did notof Science Equipment grades 6–12 adequately maintain the equipment
3. Provision of Equipment, Furniture, Vehicle, To CDC, FOE, OCE, PMU, SEDEC, Completed Apart from PMU, one vehicle each wasLibrary Books, and Other Learning Materials and 9 SEDUs (which were later provided to CDC and OCEto Concened Agencies upgraded to 9 SSRCs)
Continued on next page
26 Appendix 4
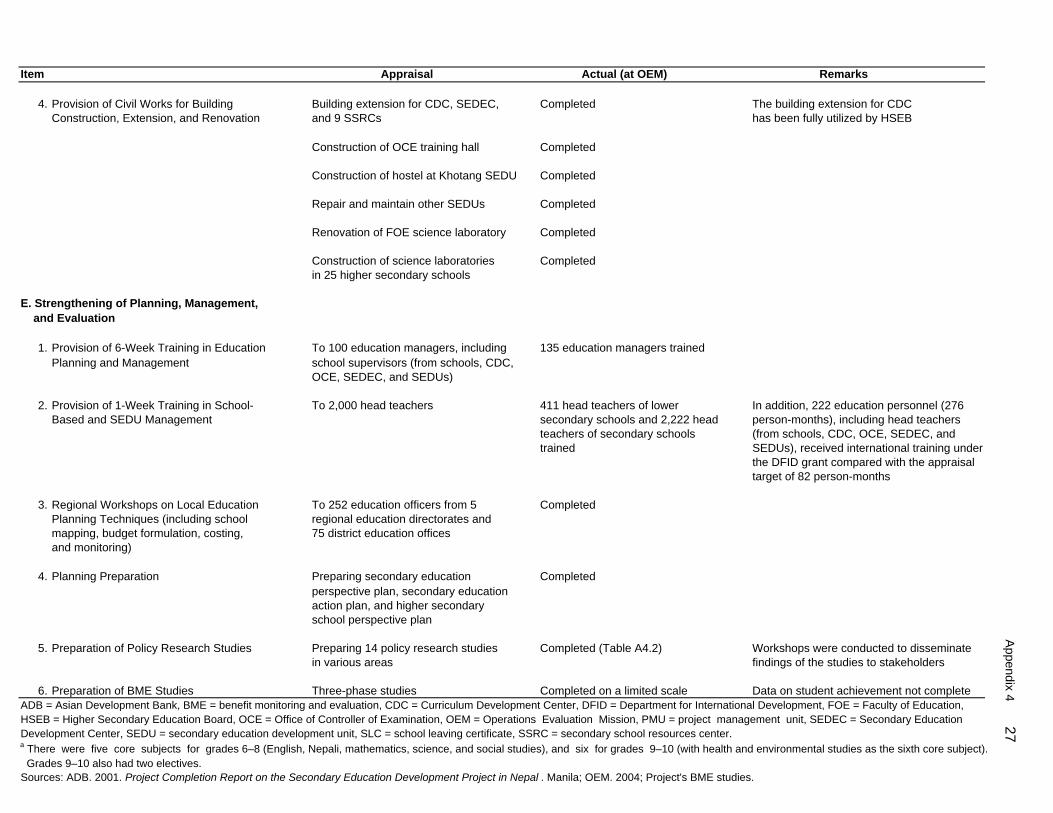
Item Appraisal Actual (at OEM) Remarks
4. Provision of Civil Works for Building Building extension for CDC, SEDEC, Completed The building extension for CDCConstruction, Extension, and Renovation and 9 SSRCs has been fully utilized by HSEB
Construction of OCE training hall Completed
Construction of hostel at Khotang SEDU Completed
Repair and maintain other SEDUs Completed
Renovation of FOE science laboratory Completed
Construction of science laboratories Completedin 25 higher secondary schools
E. Strengthening of Planning, Management, and Evaluation
1. Provision of 6-Week Training in Education To 100 education managers, including 135 education managers trainedPlanning and Management school supervisors (from schools, CDC,
OCE, SEDEC, and SEDUs)
2. Provision of 1-Week Training in School- To 2,000 head teachers 411 head teachers of lower In addition, 222 education personnel (276Based and SEDU Management secondary schools and 2,222 head person-months), including head teachers
teachers of secondary schools (from schools, CDC, OCE, SEDEC, andtrained SEDUs), received international training under
the DFID grant compared with the appraisaltarget of 82 person-months
3. Regional Workshops on Local Education To 252 education officers from 5 CompletedPlanning Techniques (including school regional education directorates and mapping, budget formulation, costing, 75 district education officesand monitoring)
4. Planning Preparation Preparing secondary education Completedperspective plan, secondary educationaction plan, and higher secondary school perspective plan
5. Preparation of Policy Research Studies Preparing 14 policy research studies Completed (Table A4.2) Workshops were conducted to disseminatein various areas findings of the studies to stakeholders
6. Preparation of BME Studies Three-phase studies Completed on a limited scale Data on student achievement not completeADB = Asian Development Bank, BME = benefit monitoring and evaluation, CDC = Curriculum Development Center, DFID = Department for International Development, FOE = Faculty of Education, HSEB = Higher Secondary Education Board, OCE = Office of Controller of Examination, OEM = Operations Evaluation Mission, PMU = project management unit, SEDEC = Secondary Education Development Center, SEDU = secondary education development unit, SLC = school leaving certificate, SSRC = secondary school resources center. a There were five core subjects for grades 6–8 (English, Nepali, mathematics, science, and social studies), and six for grades 9–10 (with health and environmental studies as the sixth core subject). Grades 9–10 also had two electives.Sources: ADB. 2001. Project Completion Report on the Secondary Education Development Project in Nepal . Manila; OEM. 2004; Project's BME studies.
Appendix 4 27
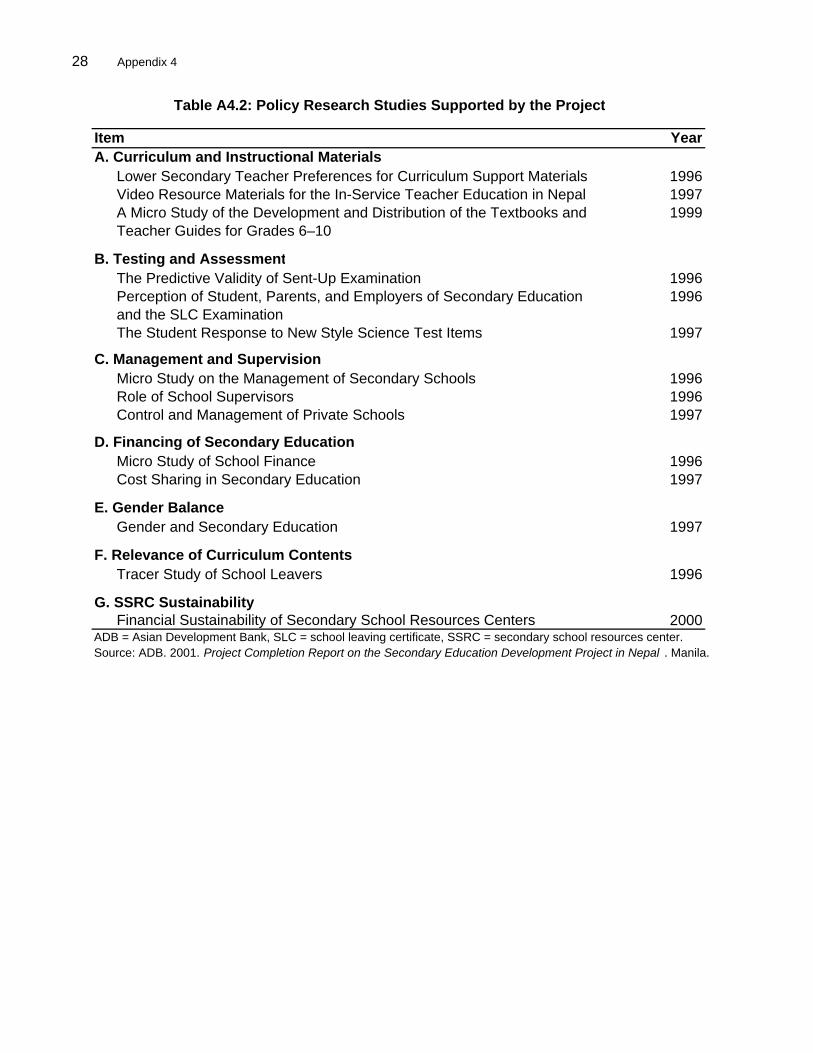
28 Appendix 4
Table A4.2: Policy Research Studies Supported by the Project
Item YearA. Curriculum and Instructional Materials
Lower Secondary Teacher Preferences for Curriculum Support Materials 1996Video Resource Materials for the In-Service Teacher Education in Nepal 1997A Micro Study of the Development and Distribution of the Textbooks and 1999Teacher Guides for Grades 6–10
B. Testing and AssessmentThe Predictive Validity of Sent-Up Examination 1996Perception of Student, Parents, and Employers of Secondary Education 1996and the SLC ExaminationThe Student Response to New Style Science Test Items 1997
C. Management and SupervisionMicro Study on the Management of Secondary Schools 1996Role of School Supervisors 1996Control and Management of Private Schools 1997
D. Financing of Secondary EducationMicro Study of School Finance 1996Cost Sharing in Secondary Education 1997
E. Gender BalanceGender and Secondary Education 1997
F. Relevance of Curriculum ContentsTracer Study of School Leavers 1996
G. SSRC SustainabilityFinancial Sustainability of Secondary School Resources Centers 2000
ADB = Asian Development Bank, SLC = school leaving certificate, SSRC = secondary school resources center.Source: ADB. 2001. Project Completion Report on the Secondary Education Development Project in Nepal . Manila.
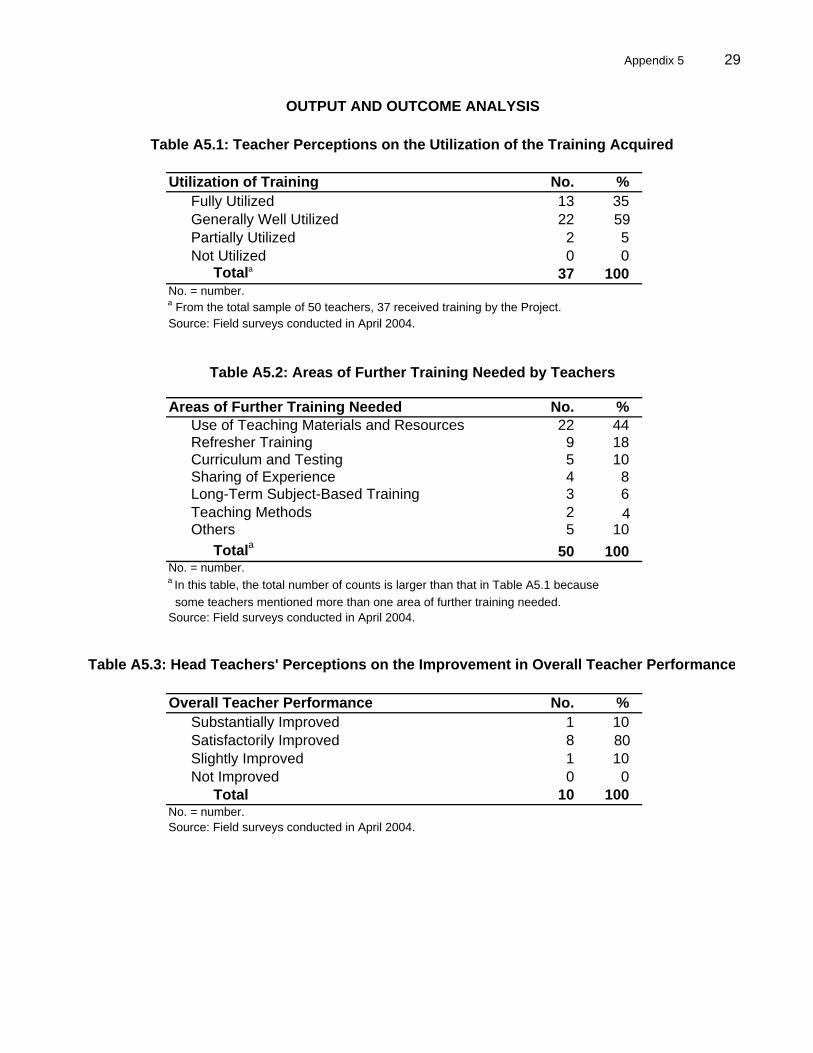
Utilization of Training No. %Fully Utilized 13 35Generally Well Utilized 22 59Partially Utilized 2 5Not Utilized 0 0
Totala 37 100No. = number.a From the total sample of 50 teachers, 37 received training by the Project.Source: Field surveys conducted in April 2004.
Areas of Further Training Needed No. %Use of Teaching Materials and Resources 22 44Refresher Training 9 18Curriculum and Testing 5 10Sharing of Experience 4 8Long-Term Subject-Based Training 3 6Teaching Methods 2 4Others 5 10
Totala 50 100No. = number.a In this table, the total number of counts is larger than that in Table A5.1 because some teachers mentioned more than one area of further training needed.Source: Field surveys conducted in April 2004.
Overall Teacher Performance No. %Substantially Improved 1 10Satisfactorily Improved 8 80Slightly Improved 1 10Not Improved 0 0
Total 10 100No. = number.Source: Field surveys conducted in April 2004.
OUTPUT AND OUTCOME ANALYSIS
Table A5.1: Teacher Perceptions on the Utilization of the Training Acquired
Table A5.2: Areas of Further Training Needed by Teachers
Table A5.3: Head Teachers' Perceptions on the Improvement in Overall Teacher Performance
Appendix 5 29

Table A5.4: Perceptions on the Usefulness of New Curriculum
Perceptions by SEDU Chiefs
Usefulness No. % No. % No. %Highly Useful 14 28 3 30 5 63Generally Useful 28 56 5 50 2 25Partially Useful 8 16 2 20 1 13Not Useful 0 0 0 0 0 0
Total 50 100 10 100 8 100No. = number, SEDU = secondary education development unit.Source: Field surveys conducted in April 2004.
Perceptions by Perceptions by Perceptions by Teachers Head Teachers SEDU Chiefs
Usefulness No. % No. % No. %Highly Useful 20 40 0 0 1 13Generally Useful 28 56 8 80 5 63Partially Useful 1 2 2 20 2 25Not Useful 0 0 0 0 0 0No Response 1 2 0 0 0 0
Total 50 100 10 100 8 100No. = number, SEDU = secondary education development unit.Source: Field surveys conducted in April 2004.
Table A5.6: Head Teachers' Perceptions on the Utilization of Management Training
Utilization of Management Training No. % Fully Utilized 1 17 Generally Well Utilized 3 50 Partially Utilized 2 33 Not Utilized 0 0
Totala 6 100No. = number.a From the total sample of 10 head teachers, 6 received management training by the Project.Source: Field surveys conducted in April 2004.
Teachers Perceptions by Perceptions by
Head Teachers
Table A5.5: Perceptions on the Usefulness of Improved Examination and Marking System
30 Appendix 5
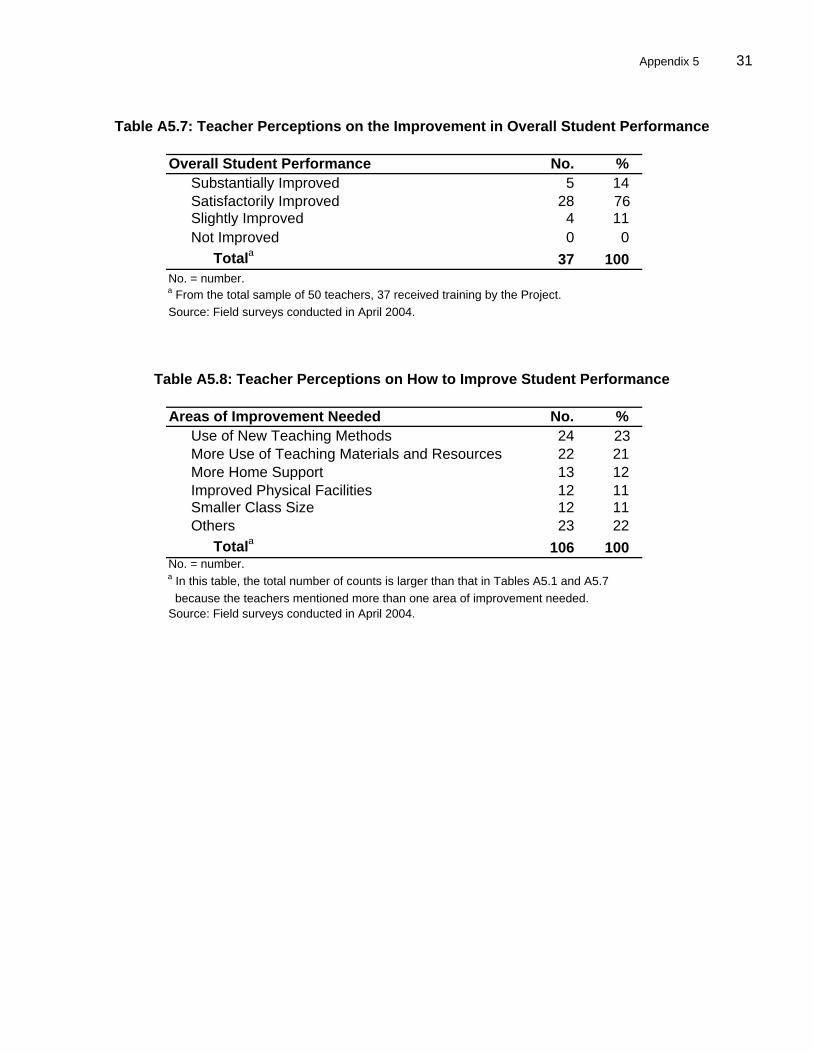
Overall Student Performance No. %Substantially Improved 5 14Satisfactorily Improved 28 76Slightly Improved 4 11Not Improved 0 0
Totala 37 100No. = number.a From the total sample of 50 teachers, 37 received training by the Project.Source: Field surveys conducted in April 2004.
Areas of Improvement Needed No. %Use of New Teaching Methods 24 23More Use of Teaching Materials and Resources 22 21More Home Support 13 12Improved Physical Facilities 12 11Smaller Class Size 12 11Others 23 22
Totala 106 100No. = number.a In this table, the total number of counts is larger than that in Tables A5.1 and A5.7 because the teachers mentioned more than one area of improvement needed.Source: Field surveys conducted in April 2004.
Table A5.8: Teacher Perceptions on How to Improve Student Performance
Table A5.7: Teacher Perceptions on the Improvement in Overall Student Performance
Appendix 5 31

Parents Having Children Repeating Dropping OutClasses or Dropping Out No. % No. %At Lower Secondary Level (Grades 6–8) 8 11 11 16At Secondary Level (Grades 9–10) 7 10 12 17No Children Repeating or Dropping Out 55 79 47 67 Totala 70 100 70 100No. = number. a From the total sample of 70 parents, 15 had 17 children repeating classes, and 23 had 31 children dropping out.Source: Field surveys conducted in April 2004.
Main Reasons for Dropping Out No. %Marriage 6 26Failure in Examination 5 22Helping with Family Work 4 17High Fees 3 13Sickness 3 13Lack of Interest of Children 2 9 Total 23 100No = number.Source: Field surveys conducted in April 2004.
Type of Work No. %Farming 13 57Own Business 4 17Government Services 3 13Private Services 3 13 Total 23 100No = number.Source: Field surveys conducted in April 2004.
(%)
Grade 1993 1998 2000 1993 1998 2000 1993 1998 20006 77.5 83.9 84.0 15.4 12.1 10.8 7.1 4.0 5.27 80.8 85.6 88.5 11.5 9.8 8.8 7.7 4.6 2.78 72.7 74.3 79.2 16.7 14.6 10.6 10.5 11.1 10.29 83.5 80.3 82.2 15.7 6.1 9.8 0.8 13.6 8.0
10 83.0 88.9 89.7 17.0 11.1 10.3 0.0 0.0 0.0
Average 79.5 82.6 84.7 15.3 10.7 10.1 5.2 6.7 5.2Source: Ministry of Education and Sports, staff estimates.
Promotion Rate Repetition Rate Dropout Rate
Table A5.9: Parents' Information on Children Repeating Classes and Dropping Out by Schooling Level
Table A5.10: Parents' Information on the Main Reasons for Children Dropping Out of School
Table A5.12: Nationwide Internal Efficiency Indicators of Lower Secondary and Secondary Grades
Table A5.11: Parents' Information on the Type of Work Done by Dropout Children
Repeating Classes
32 Appendix 5
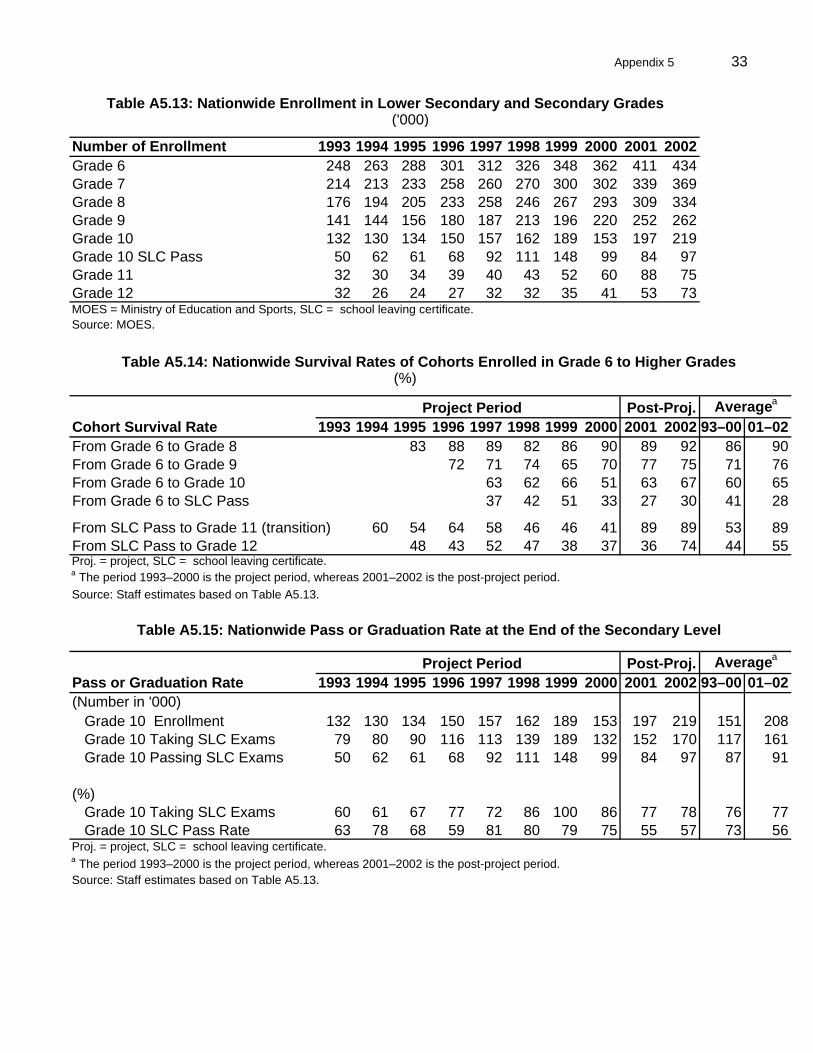
('000)
Number of Enrollment 1993 1994 1995 1996 1997 1998 1999 2000 2001 2002Grade 6 248 263 288 301 312 326 348 362 411 434Grade 7 214 213 233 258 260 270 300 302 339 369Grade 8 176 194 205 233 258 246 267 293 309 334Grade 9 141 144 156 180 187 213 196 220 252 262Grade 10 132 130 134 150 157 162 189 153 197 219Grade 10 SLC Pass 50 62 61 68 92 111 148 99 84 97Grade 11 32 30 34 39 40 43 52 60 88 75Grade 12 32 26 24 27 32 32 35 41 53 73
Source: MOES.
(%)
Project Period Post-Proj. Averagea
Cohort Survival Rate 1993 1994 1995 1996 1997 1998 1999 2000 2001 2002 93–00 01–02From Grade 6 to Grade 8 83 88 89 82 86 90 89 92 86 90From Grade 6 to Grade 9 72 71 74 65 70 77 75 71 76From Grade 6 to Grade 10 63 62 66 51 63 67 60 65From Grade 6 to SLC Pass 37 42 51 33 27 30 41 28
From SLC Pass to Grade 11 (transition) 60 54 64 58 46 46 41 89 89 53 89From SLC Pass to Grade 12 48 43 52 47 38 37 36 74 44 55Proj. = project, SLC = school leaving certificate.a The period 1993–2000 is the project period, whereas 2001–2002 is the post-project period.Source: Staff estimates based on Table A5.13.
Project Period Post-Proj. Averagea
Pass or Graduation Rate 1993 1994 1995 1996 1997 1998 1999 2000 2001 2002 93–00 01–02(Number in '000) Grade 10 Enrollment 132 130 134 150 157 162 189 153 197 219 151 208 Grade 10 Taking SLC Exams 79 80 90 116 113 139 189 132 152 170 117 161 Grade 10 Passing SLC Exams 50 62 61 68 92 111 148 99 84 97 87 91
(%) Grade 10 Taking SLC Exams 60 61 67 77 72 86 100 86 77 78 76 77 Grade 10 SLC Pass Rate 63 78 68 59 81 80 79 75 55 57 73 56Proj. = project, SLC = school leaving certificate.a The period 1993–2000 is the project period, whereas 2001–2002 is the post-project period.Source: Staff estimates based on Table A5.13.
MOES = Ministry of Education and Sports, SLC = school leaving certificate.
Table A5.13: Nationwide Enrollment in Lower Secondary and Secondary Grades
Table A5.14: Nationwide Survival Rates of Cohorts Enrolled in Grade 6 to Higher Grades
Table A5.15: Nationwide Pass or Graduation Rate at the End of the Secondary Level
Appendix 5 33

Item FY1993 FY1994 FY1995 FY1996 FY1997 FY1998 FY1999 FY2000 FY2001 FY2002 FY 2003GDP (at current price, NRs billion)a 171 199 219 249 281 301 342 380 410 428 446Overall Recurrent Exp. (NRs billion)b 11 12 19 22 24 27 31 35 43 49 57Total Recurrent Education Exp. (NRs billion) 0.7 0.7 3.6 4.4 4.8 5.7 6.0 6.8 8.3 10.8 11.0Overall Recurrent Exp./GDP (%) 6.7 6.2 8.8 8.7 8.6 9.0 9.1 9.1 10.4 11.5 12.7Total Recurrent Education Exp./GDP (%) 0.4 0.4 1.6 1.8 1.7 1.9 1.8 1.8 2.0 2.5 2.5
Overall Recurrent Exp. (NRs million) 11,484 12,409 19,265 21,562 24,181 27,174 31,048 34,523 42,769 49,150 56,556Total Recurrent Education Exp. (NRs million)c 685 742 3,612 4,359 4,822 5,742 6,040 6,774 8,285 10,776 11,048 Primary 358 416 1,950 2,445 2,542 3,007 3,167 3,656 4,504 5,620 5,830 Secondaryd 192 179 775 1,050 1,299 1,573 1,668 1,758 2,248 2,910 3,025 Tertiary 106 116 644 679 775 937 936 946 1,000 1,390 1,363 Others 29 32 243 186 206 224 270 414 534 856 831Project Recurrent Cost (NRs million) 2.03 7.60 8.92 16.57 23.13 29.57 34.10 26.26 20.00 20.00 20.00
Total Recurrent Education Exp./Overall Recurrent Exp. (%) 6.0 6.0 18.7 20.2 19.9 21.1 19.5 19.6 19.4 21.9 19.5 Primary Recurrent Exp./Total Recurrent Education Exp. (%) 52.3 56.1 54.0 56.1 52.7 52.4 52.4 54.0 54.4 52.2 52.8 Secondary Recurrent Exp./Total Recurrent Education Exp. (%) 28.1 24.1 21.4 24.1 26.9 27.4 27.6 25.9 27.1 27.0 27.4 Tertiary Recurrent Exp./Total Recurrent Education Exp. (%) 15.4 15.6 17.8 15.6 16.1 16.3 15.5 14.0 12.1 12.9 12.3 Others Recurrent Exp./Total Recurrent Education Exp. (%) 4.2 4.3 6.7 4.3 4.3 3.9 4.5 6.1 6.5 7.9 7.5Project Recurrent Cost/Secondary Recurrent Exp. (%) 1.1 4.3 1.2 1.6 1.8 1.9 2.0 1.5 0.9 0.7 0.7Exp. = expenditure, GDP = gross domestic product, MOES = Ministry of Education and Sports, MOF = Ministry of Finance. a GDP figure for FY2003 is preliminary estimates.b All expenditure figures for FY2003 are preliminary estimates.c In this case, "budget" and "expenditure" are used interchangeably because budget allocated from one source to a recipient will finally become an expenditure of the recipient.d Consists of all levels of secondary education.Sources: MOES, MOF, staff estimates.
Project Implementation Period Postproject Period
LONG-TERM FINANCIAL SUSTAINABILITY PROSPECTS
34 Appendix 6
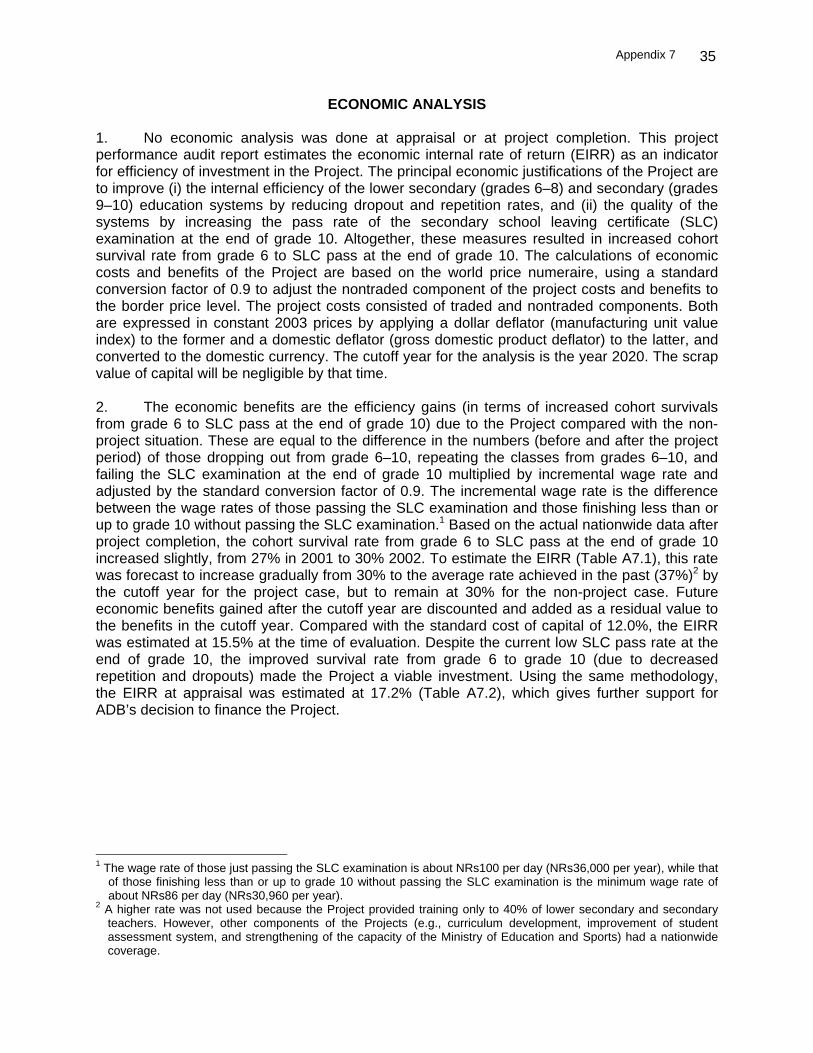
Appendix 7 35
ECONOMIC ANALYSIS
1. No economic analysis was done at appraisal or at project completion. This project performance audit report estimates the economic internal rate of return (EIRR) as an indicator for efficiency of investment in the Project. The principal economic justifications of the Project are to improve (i) the internal efficiency of the lower secondary (grades 6–8) and secondary (grades 9–10) education systems by reducing dropout and repetition rates, and (ii) the quality of the systems by increasing the pass rate of the secondary school leaving certificate (SLC) examination at the end of grade 10. Altogether, these measures resulted in increased cohort survival rate from grade 6 to SLC pass at the end of grade 10. The calculations of economic costs and benefits of the Project are based on the world price numeraire, using a standard conversion factor of 0.9 to adjust the nontraded component of the project costs and benefits to the border price level. The project costs consisted of traded and nontraded components. Both are expressed in constant 2003 prices by applying a dollar deflator (manufacturing unit value index) to the former and a domestic deflator (gross domestic product deflator) to the latter, and converted to the domestic currency. The cutoff year for the analysis is the year 2020. The scrap value of capital will be negligible by that time. 2. The economic benefits are the efficiency gains (in terms of increased cohort survivals from grade 6 to SLC pass at the end of grade 10) due to the Project compared with the non-project situation. These are equal to the difference in the numbers (before and after the project period) of those dropping out from grade 6–10, repeating the classes from grades 6–10, and failing the SLC examination at the end of grade 10 multiplied by incremental wage rate and adjusted by the standard conversion factor of 0.9. The incremental wage rate is the difference between the wage rates of those passing the SLC examination and those finishing less than or up to grade 10 without passing the SLC examination.1 Based on the actual nationwide data after project completion, the cohort survival rate from grade 6 to SLC pass at the end of grade 10 increased slightly, from 27% in 2001 to 30% 2002. To estimate the EIRR (Table A7.1), this rate was forecast to increase gradually from 30% to the average rate achieved in the past (37%)2 by the cutoff year for the project case, but to remain at 30% for the non-project case. Future economic benefits gained after the cutoff year are discounted and added as a residual value to the benefits in the cutoff year. Compared with the standard cost of capital of 12.0%, the EIRR was estimated at 15.5% at the time of evaluation. Despite the current low SLC pass rate at the end of grade 10, the improved survival rate from grade 6 to grade 10 (due to decreased repetition and dropouts) made the Project a viable investment. Using the same methodology, the EIRR at appraisal was estimated at 17.2% (Table A7.2), which gives further support for ADB’s decision to finance the Project.
1 The wage rate of those just passing the SLC examination is about NRs100 per day (NRs36,000 per year), while that
of those finishing less than or up to grade 10 without passing the SLC examination is the minimum wage rate of about NRs86 per day (NRs30,960 per year).
2 A higher rate was not used because the Project provided training only to 40% of lower secondary and secondary teachers. However, other components of the Projects (e.g., curriculum development, improvement of student assessment system, and strengthening of the capacity of the Ministry of Education and Sports) had a nationwide coverage.

36 Appendix 7
Table A7.1: Economic Internal Rate of Return at Project Evaluation (NRs'000)
Efficiency Project Cost Gains from
Increased Recurrent Total NetCohort Capital Cost Cost Project Economic
Year Survivals Traded Nontraded Nontraded Cost Benefits1993 0 4,830 5,586 2,141 12,558 (12,558)1994 0 18,698 21,014 8,055 47,768 (47,768)1995 0 44,149 49,211 9,432 102,792 (102,792)1996 0 69,339 68,330 17,462 155,131 (155,131)1997 0 99,724 85,122 24,472 209,318 (209,318)1998 0 103,879 81,797 31,355 217,031 (217,031)1999 0 103,879 75,147 36,007 215,033 (215,033)2000 0 52,978 36,243 27,786 117,007 (117,007)2001 0 27,786 27,786 (27,786)2002 0 27,786 27,786 (27,786)2003 0 27,786 27,786 (27,786)2004 20,450 27,786 27,786 (7,336)2005 43,668 27,786 27,786 15,8822006 68,185 27,786 27,786 40,3992007 114,864 27,786 27,786 87,0782008 164,157 27,786 27,786 136,3712009 216,210 27,786 27,786 188,4242010 295,659 27,786 27,786 267,8732011 379,080 27,786 27,786 351,2942012 466,672 27,786 27,786 438,8862013 586,983 27,786 27,786 559,1972014 713,309 27,786 27,786 685,5232015 845,952 27,786 27,786 818,1662016 1,017,213 27,786 27,786 989,4272017 1,196,182 27,786 27,786 1,168,3962018 1,383,203 27,786 27,786 1,355,4172019 1,615,900 27,786 27,786 1,588,1142020 11,499,039 27,786 27,786 11,471,253
EIRR = 15.5%EIRR = economic internal rate of return. Source: Staff estimates. .
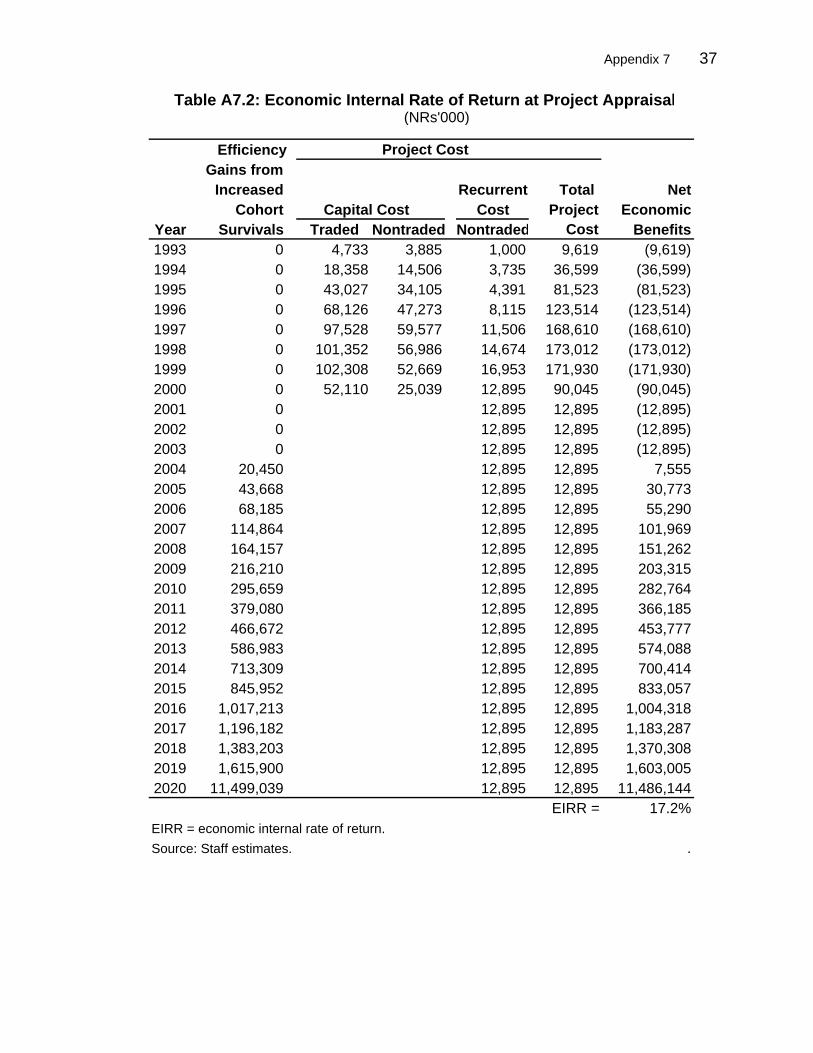
Appendix 7 37
Table A7.2: Economic Internal Rate of Return at Project Appraisal (NRs'000)
Efficiency Project Cost Gains from
Increased Recurrent Total NetCohort Capital Cost Cost Project Economic
Year Survivals Traded Nontraded Nontraded Cost Benefits1993 0 4,733 3,885 1,000 9,619 (9,619)1994 0 18,358 14,506 3,735 36,599 (36,599)1995 0 43,027 34,105 4,391 81,523 (81,523)1996 0 68,126 47,273 8,115 123,514 (123,514)1997 0 97,528 59,577 11,506 168,610 (168,610)1998 0 101,352 56,986 14,674 173,012 (173,012)1999 0 102,308 52,669 16,953 171,930 (171,930)2000 0 52,110 25,039 12,895 90,045 (90,045)2001 0 12,895 12,895 (12,895)2002 0 12,895 12,895 (12,895)2003 0 12,895 12,895 (12,895)2004 20,450 12,895 12,895 7,5552005 43,668 12,895 12,895 30,7732006 68,185 12,895 12,895 55,2902007 114,864 12,895 12,895 101,9692008 164,157 12,895 12,895 151,2622009 216,210 12,895 12,895 203,3152010 295,659 12,895 12,895 282,7642011 379,080 12,895 12,895 366,1852012 466,672 12,895 12,895 453,7772013 586,983 12,895 12,895 574,0882014 713,309 12,895 12,895 700,4142015 845,952 12,895 12,895 833,0572016 1,017,213 12,895 12,895 1,004,3182017 1,196,182 12,895 12,895 1,183,2872018 1,383,203 12,895 12,895 1,370,3082019 1,615,900 12,895 12,895 1,603,0052020 11,499,039 12,895 12,895 11,486,144
EIRR = 17.2%EIRR = economic internal rate of return. Source: Staff estimates. .

38 Appendix 8
Urban Rural TotalAnnual Per Capita Income Rangea No. % No. % No. %
Moderate and Above 12 34 7 20 19 27Poor 22 63 25 71 47 67Very Poor 1 3 3 9 4 6
Total 35 100 35 100 70 100No = number.a Annual per capita income of less than NRs6,500 is classified as very poor, NRs6,500-18,500 as poor, and more than NRs18,500 as moderate and above. Source: Field surveys conducted in April 2004.
SOCIOECONOMIC STATUS OF PARENTS IN SAMPLE SCHOOLS

MANAGEMENT RESPONSE ON THE PROJECT PERFORMANCE AUDIT REPORT ON THE SECONDARY EDUCATION DEVELOPMENT PROJECT IN NEPAL
(Loan 1196-NEP[SF])
On 28 February 2005, the Director General, Operations Evaluation Department, received the following response from the Managing Director General on behalf of Management:
1. Management found the report well prepared and useful in highlighting key issues and lessons learned from the Secondary Education Development Project in Nepal. We found it particularly useful to improve the performance of the ongoing loans and technical assistance, and to design future support programs for the education sector in Nepal. 2. The PPAR found weaknesses in governance in the education sector, in the School Leaving Certificate (SLC) examination system, and the school supervision system by the District Education Offices. The governance issue is indeed a major challenge in Nepal’s education sector. It is related to the absence of quality and performance standard and accountability mechanism at all levels. For the education system to improve its performance and efficiency, it is crucial that such performance standard and accountability mechanism become an integral part of the education policies and operations. The Ministry of Education and Sport (MOES) is currently looking at such policy issues within the ongoing Advisory Technical Assistance on Preparing an Education Sector Development Policy and Strategy (TA ESDPS).1 Management agrees with the recommendations of the report that strengthening of the SLC examination system and improvement of the school supervision system should be further part of the policy dialogue with MOES, in conjunction with the ongoing Secondary Education Support Project (SESP).2 3. The PPAR emphasized the importance of developing a more detailed teacher training framework and action plan to develop an effective teacher training and deployment system. The National Center for Educational Development (NCED) is currently working on a Teacher Education Master Plan with a more detailed strategic plan for teacher training. Subsequently, it plans to develop a Human Resources Development Plan with a more holistic approach to teacher education and development. 4. The PPAR’s concern for the lack of integration of higher secondary education (grades 11–12) with the core secondary education (grades 6–10) is well-founded. The Government’s plan is to integrate grades 11–12 into secondary education, and ultimately to develop a fully integrated school education system from grades 1–12. ADB, together with other interested development partners in education intends to support the Government’s long-term plan to develop a sector-wide education policy. It aims at consolidating key areas such as curriculum and assessment, teacher management and development, performance standards, sector and school finance from a school sector-wide perspective. In that context, the next support program from ADB will
1 TA 4326-NEP Preparing an Education Sector Development Policy and Strategy. 2 Loan 1917-NEP Secondary Education Support Project.

focus on assisting the Government in formulating a fully integrated education sector development program covering school education from grades 1–12. 5. We are pleased to note that the proposed timeframe for the recommended follow-up actions is subject to the timing of policy related actions undertaken by MOES and its line agencies in the ongoing projects and technical assistance.