Secondary earners and fiscal policies in Europe€¦ · The identified characteristics of secondary...
89
Secondary earners and fiscal policies in Europe Olga Rastrigina and Alina Verashchagina (supervision of Francesca Bettio) Justice and Consumers
Transcript of Secondary earners and fiscal policies in Europe€¦ · The identified characteristics of secondary...
Secondary earners and fiscal policies in Europe
Olga Rastrigina and Alina Verashchagina(supervision of Francesca Bettio)
Justice and Consumers

This report was financed by and prepared for the use of the European Commission, Directorate-General for Justice; Unit D2 ‘Equality between men and women’, in the framework of a contract managed by the Fondazione Giacomo Brodolini (FGB) in partnership with Istituto per la Ricerca Sociale (IRS). It does not necessarily reflect the opinion or position of the European Commission or of the Directorate-General for Justice and nor is any person acting on their behalf responsible for the use that might be made of the information contained in this publication.
FGB - Fondazione Giacomo Brodolini
Via Solferino 3200185 RomeItalyTel +39 064424 9625Fax +39 0644249565www.fondazionebrodolini.it
IRS - Istituto per la Ricerca Sociale
Via XX Settembre 2420123 MilanoItalyTel. +39 2467 641www.irs-online.it
to your questions about the European Union.Freephone number (*):
00 800 6 7 8 9 10 11
(*) Certain mobile telephone operators do not allow access to 00 800 numbers or these calls may be billed.
European Commission - Directorate-General for JusticeMore information on the European Union is available on the Internet (http://europa.eu).Cataloguing data can be found at the end of this publication.Luxembourg, Publication Office of the European Union, 2015ISBN: 978-92-79-47457-6doi: 10.2838/539560© European Union, 2015Reproduction is authorised provided the source is acknowledged.

Secondary earners and fiscal policies
in Europe
Olga Rastrigina and Alina Verashchagina
(supervision of Francesca Bettio)

This report was financed by, and prepared for the use of the European Commission, Directorate-General for Justice and Consumers, Unit D2 ‘Equality between men and women’, in the framework of a contract managed by Fondazione Giacomo Brodolini (FGB) in partnership with Istituto per la Ricerca Sociale (IRS). It does not necessarily reflect the opinion or position of the European Commission or of the Directorate-General for Justice, nor may any person acting on their behalf be held responsible for the use which may be made of the information contained in this publication.
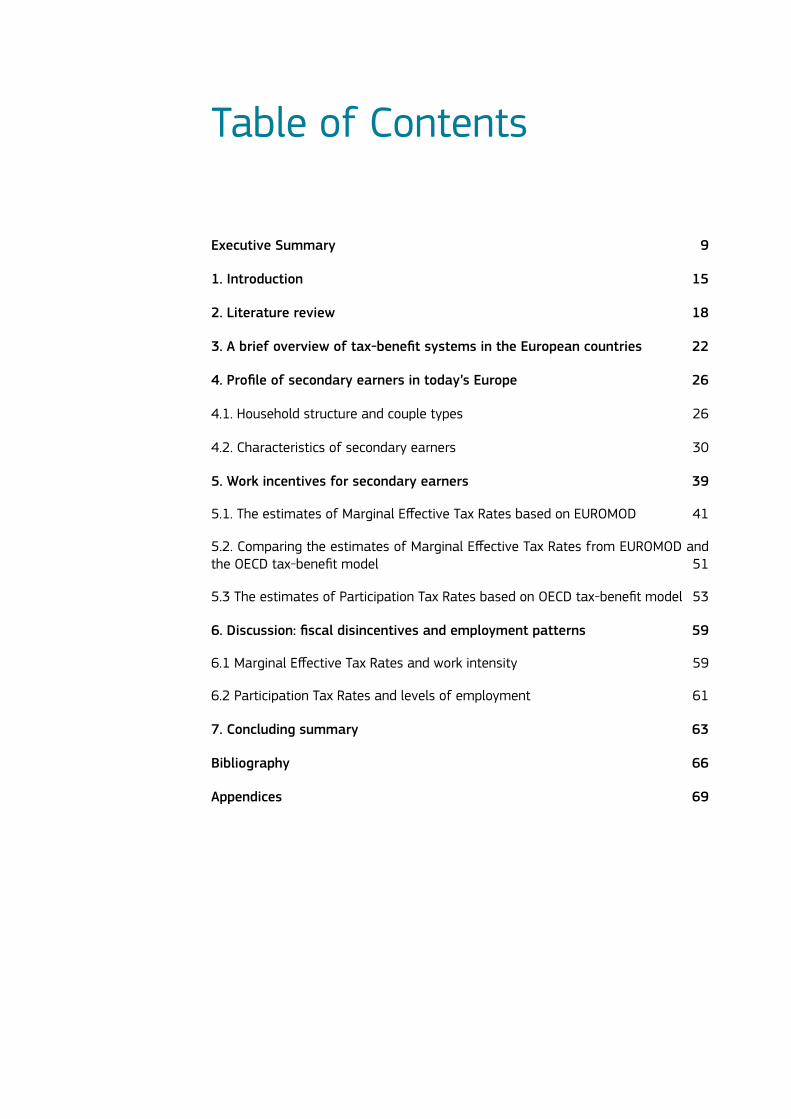
Table of Contents
Executive Summary 9
1. Introduction 15
2. Literature review 18
3. A brief overview of tax-benefit systems in the European countries 22
4. Profile of secondary earners in today’s Europe 26
4.1. Household structure and couple types 26
4.2. Characteristics of secondary earners 30
5. Work incentives for secondary earners 39
5.1. The estimates of Marginal Effective Tax Rates based on EUROMOD 41
5.2. Comparing the estimates of Marginal Effective Tax Rates from EUROMOD and the OECD tax-benefit model 51
5.3 The estimates of Participation Tax Rates based on OECD tax-benefit model 53
6. Discussion: fiscal disincentives and employment patterns 59
6.1 Marginal Effective Tax Rates and work intensity 59
6.2 Participation Tax Rates and levels of employment 61
7. Concluding summary 63
Bibliography 66
Appendices 69
Table of Figures
Figure 1. Household types prevalent in Europe, SILC 2011 27
Figure 2. Highest levels of attained education of women as secondary earners, SILC 2011 35
Figure 3. Occupations of secondary earners-women, SILC 2011 36
Figure 4. Economic sectors where secondary earners-women work, SILC 2011 37
Figure 5. Distribution of Marginal Effective Tax Rates for secondary earners-women, 2012 42
Figure 6. Decomposition of the average Marginal Effective Tax Rates for secondary earners-women, 2012 43
Figure 7. Proportion of secondary earners-women facing Marginal Effective Tax Rates above 50%, 2012 44
Figure 8. Median Marginal Effective Tax Rates for secondary earners and individuals with roughly the same earnings as their partners, 2012 45
Figure 9. Median Marginal Effective Tax Rates for secondary earners and individuals with roughly the same earnings as their partners, by tertile, 2012 46
Figure 10. Participation Tax Rates for female potential entrants, 2012 54
Figure 13. Participation Tax Rates for female potential entrants and equal earning women with children, 2012 57
List of Tables
Table 1. Who are secondary earners? 17
Table 2. Tax and benefit systems in Europe 24
Table 3. Percentage distribution of working age couples by share of female earnings, SILC 2011 29
Table 4. Percentages of secondary earners-women by main economic activities, SILC 2011 31
Table 5. Couples with dependent children as percentage of all couples, by share of female earnings, SILC 2011 33
Table 6. Shares of female earnings in couples with and without children, SILC 2011 34
Table 7. Median Marginal Effective Tax Rates for secondary earners-women with and without children, 2012 50
Table 8. Comparison between Marginal Effective Tax Rates for secondary earners obtained using EUROMOD and the OECD tax-benefit model, 2012 52
Figure 11. Participation Tax Rates for female potential entrants and equal earning women without children, 2012 55
Figure 12. Participation Tax Rates for female potential entrants at low-medium-high levels of earnings, no children, 2012 55
Table 9. Work intensity and fiscal disincentives for female secondary earners (relative to women in balanced couples) by level of earnings, 2012 60

AT Austria FR France NL Netherlands
BE Belgium GR Greece NO Norway
BG Bulgaria HU Hungary PL Poland
CY Cyprus IE Ireland PT Portugal
CZ Czech Republic IS Iceland RO Romania
DE Germany IT Italy SE Sweden
DK Denmark LT Lithuania SI Slovenia
EE Estonia LU Luxembourg SK Slovak Republic
ES Spain LV Latvia UK United Kingdom
FI Finland MT Malta
Country Abbreviations

9
Executive Summary
Executive Summary
Secondary Earners
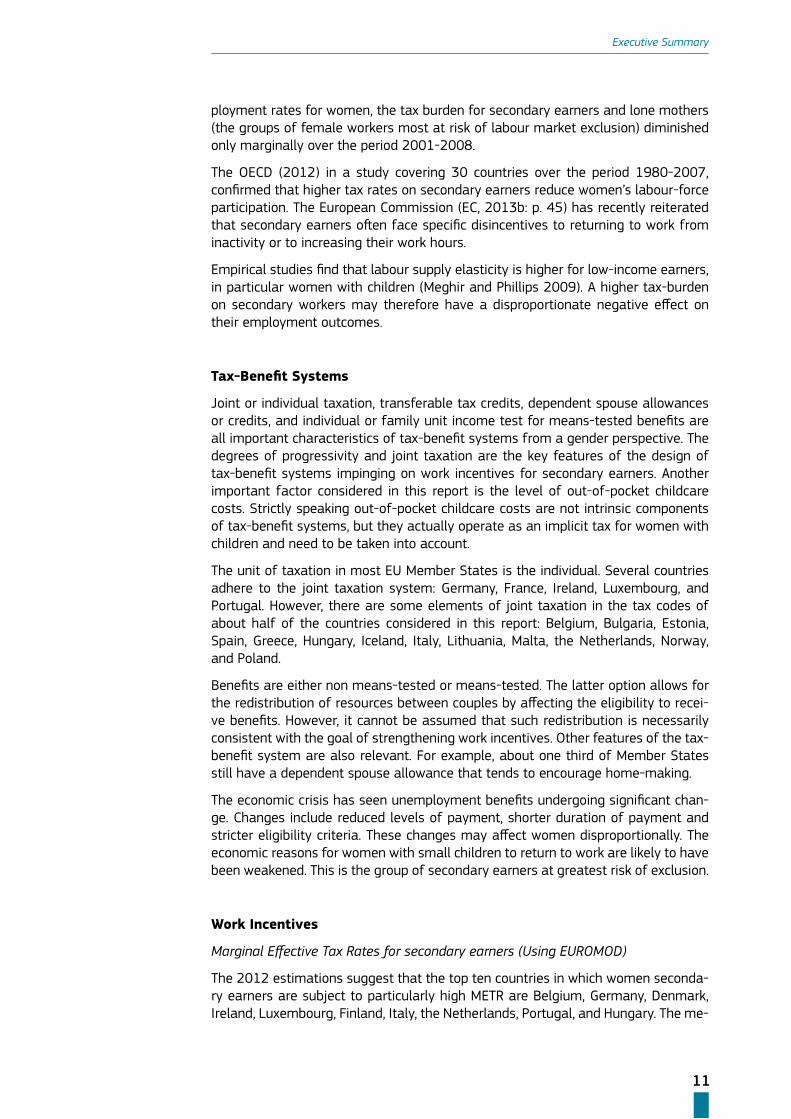
Secondary earners are a specific group of individuals who are employed and earn less than their partners. They represent the majority of working women in married or cohabiting couples. Women in the European Union earn on average about one third of a couple’s joint income. The share they earn is highest in Denmark and Lithuania (44%) and lowest in Italy (25%). The income share earned by women in couples has tended to increase over the past decade. This is due to a stronger presence of women in the labour market alongside a weakening of men’s labour market status due to the economic crisis.
The identified characteristics of secondary earners provide tentative explanations as to why their earning capacity may be lower than that of their partners. Three factors that may lead to these lower incomes are:
• The intensity of work. This can be due to special circumstances such as unem-ployment, sickness and care responsibilities, or due to work arrangements such as part-time work.
• The low level of skills, occupation or sector of employment of the secondary earner.
• The presence of children for the couple, in particular dependent children. The age of such children also matters.
A common policy agenda is made more difficult by the heterogeneity of situations across the EU Member States. Some countries have low levels of labour force parti-cipation by women coupled with low shares of part-time work, others have high par-ticipation rates coupled with high shares of part-time work for women, and others are situated between these two extremes. Women secondary earners are often in part-time jobs in the old Member States while full-time workers are the majority of this group in the Eastern part of Europe.
Non-employed women in one-earner couples can be viewed as potential secondary earners. In this report they are referred to as potential entrants.
The Scope of the Report
Women’s labour market participation is known to be responsive to fiscal (dis)incen-tives. The effects of different fiscal policies can be seen in increased hours worked, income earned or labour force participation rates for women. For potential entrants the effects can be seen in increased numbers starting work. This report examines work incentives and disincentives for secondary earners created by tax-benefit sy-stems. Its aim is to identify potential work disincentives created by fiscal systems for secondary earners in couples.

10
Executive Summary
The conventional measures of disincentives are the Marginal Effective Tax Rate (METR), which is expected to influence decisions about how much to work, and the Participation Tax Rate (PTR) which is expected to affect decisions whether to work or not.1 Statistical techniques and EU-SILC data comparable across the EU Member States are used to obtain the values of METR and PTR by means of EUROMOD and the OECD tax-benefit models.
EUROMOD is a static tax-benefit microsimulation model used to estimate work in-centives for the real population based on the EU-SILC microdata. This makes it pos-sible to account for the socio-economic differences found within the population. It is used to analyse the actual distribution of METR across the population of secondary earners, as well as to disentangle the impact of taxes, social contributions, and be-nefits on particularly high METR.
The OECD tax-benefit model is used to calculate work-related fiscal incentive effects on family types. This uses ‘synthetic’ household types with pre-defined characte-ristics and earnings rather than being based on actual data. This provides an illu-strative way to understand the mechanisms built into tax-benefit systems. In this report the standard OECD model is modified by feeding in ‘actual’ levels of earnings of secondary earners drawn from the EU-SILC 2011 data. The results, due to this innovation, correspond better to the actual distribution of earnings within the target group. They are also more comparable to the results from EUROMOD as they use the same data on earnings.
The two models are used together to estimate and check the robustness of the findings on work disincentives for people in employment (the METR) obtained by means of EUROMOD. The OECD model is also used to estimate disincentives for potential entrants into employment (the PTR).2 The effect of out-of-pocket childcare costs on work disincentives is taken into account by using OECD figures for 2012.
These indicators are suitable for inter-country comparisons of the treatment of secondary earners. Within each country, however, a benchmark is needed to assess whether the tax burden on secondary earners is to be considered high or low in re-lative terms. The benchmarking exercise in this report compares the fiscal treatment of women secondary earners in a couple to that of women working and earning roughly as much as their partner (i.e. women in ‘equally earning’ couples). The report thus provides estimates of absolute disincentives across countries as well as rela-tive disincentives within countries, taking out-of-pocket childcare costs into account where appropriate.
Context
Fiscal stimuli designed to encourage women’s employment have not been used extensively in Europe in recent decades. Bettio and Verashchagina (2013) showed that in eight European countries, belonging to the group with middle-to-low em-
1 The Marginal Effective Tax Rate is a measure of work disincentives for a person who is already in employment. It shows the percentage of a marginal increase in gross earnings that will be taxed away due to an increase in taxes and social insurance contributions, and a reduction in benefits. The Partici-pation Tax Rate measures the share of earnings that are taxed away when a person enters work due to the increase in taxes or benefits withdrawal. This is different from METR, where it is assumed that the person was already working and is facing a marginal increase in earnings (due to increased hours of work or greater workload for example). For more details see Box 2.
2 The task of calculating PTR with EUROMOD involves estimation of potential wages with econometric techniques and is outside the scope of this report.
11
Executive Summary
ployment rates for women, the tax burden for secondary earners and lone mothers (the groups of female workers most at risk of labour market exclusion) diminished only marginally over the period 2001-2008.
The OECD (2012) in a study covering 30 countries over the period 1980-2007, confirmed that higher tax rates on secondary earners reduce women’s labour-force participation. The European Commission (EC, 2013b: p. 45) has recently reiterated that secondary earners often face specific disincentives to returning to work from inactivity or to increasing their work hours.
Empirical studies find that labour supply elasticity is higher for low-income earners, in particular women with children (Meghir and Phillips 2009). A higher tax-burden on secondary workers may therefore have a disproportionate negative effect on their employment outcomes.
Tax-Benefit Systems
Joint or individual taxation, transferable tax credits, dependent spouse allowances or credits, and individual or family unit income test for means-tested benefits are all important characteristics of tax-benefit systems from a gender perspective. The degrees of progressivity and joint taxation are the key features of the design of tax-benefit systems impinging on work incentives for secondary earners. Another important factor considered in this report is the level of out-of-pocket childcare costs. Strictly speaking out-of-pocket childcare costs are not intrinsic components of tax-benefit systems, but they actually operate as an implicit tax for women with children and need to be taken into account.
The unit of taxation in most EU Member States is the individual. Several countries adhere to the joint taxation system: Germany, France, Ireland, Luxembourg, and Portugal. However, there are some elements of joint taxation in the tax codes of about half of the countries considered in this report: Belgium, Bulgaria, Estonia, Spain, Greece, Hungary, Iceland, Italy, Lithuania, Malta, the Netherlands, Norway, and Poland.
Benefits are either non means-tested or means-tested. The latter option allows for the redistribution of resources between couples by affecting the eligibility to recei-ve benefits. However, it cannot be assumed that such redistribution is necessarily consistent with the goal of strengthening work incentives. Other features of the tax-benefit system are also relevant. For example, about one third of Member States still have a dependent spouse allowance that tends to encourage home-making.
The economic crisis has seen unemployment benefits undergoing significant chan-ge. Changes include reduced levels of payment, shorter duration of payment and stricter eligibility criteria. These changes may affect women disproportionally. The economic reasons for women with small children to return to work are likely to have been weakened. This is the group of secondary earners at greatest risk of exclusion.
Work Incentives
Marginal Effective Tax Rates for secondary earners (Using EUROMOD)
The 2012 estimations suggest that the top ten countries in which women seconda-ry earners are subject to particularly high METR are Belgium, Germany, Denmark, Ireland, Luxembourg, Finland, Italy, the Netherlands, Portugal, and Hungary. The me-

12
Executive Summary
dian METR in these countries ranges from 34.5% in Hungary to 54.2% in Belgium.
However, the distribution of METR within the countries differs considerably and fo-cusing on the median for policy purposes might fail to address some less typical cases at either end of the distribution. The distribution is quite wide in countries like Ireland, Austria, Spain, the Netherlands, Luxembourg, Finland, and France. There is very little variation in Bulgaria, the Czech Republic, Latvia, Slovakia, and Estonia, due to a ‘flat tax’ system. The lack of variation in Sweden, Poland and Denmark could be explained by a quite homogenous population of secondary earners.
The report assesses which are the tax-benefit instruments that lie behind these figures. In most of the countries examined, the largest component of the average METR is the increase in taxes paid by the household resulting from a marginal in-crease in the earnings of a secondary earner. The highest values are in Belgium and Denmark, both of which have highly progressive tax systems where the average tax rate is high. The exceptions are the Netherlands, Greece, Austria, Bulgaria, Cyprus, Slovenia, Hungary, and France, where the social insurance contribution component is somewhat larger than the tax component. The social contribution component is quite high in Germany but still lower than the tax component.
The reduction in benefits due to an increase in the income of a secondary earner is the smallest component in all countries. It is, however, relatively large in the United Kingdom, France, Finland, Luxembourg, Ireland, Lithuania, and Slovenia. Three of these countries (France, the United Kingdom, and Ireland) have key means-tested benefits and a high benefit component in METR for the population at large (Jara and Tumino, 2013).
In a single country context, an assessment as to whether secondary earners are particularly disadvantaged with respect to work incentives can be made through comparison between secondary earners and equal earners, the two non-overlapping groups by definition. The report highlights that when it comes to decisions about employment it is the relative tax outcomes within the country that exert influence. The absolute level of METR in the international context is likely to be of lower im-portance.
There are a number of countries in which secondary earners women have higher work disincentives (METR) than the equally earning partners. Fiscal disincentives are sufficiently high to discourage female secondary workers from increasing work intensity in five countries: Belgium, Germany, Slovenia, Portugal, and Luxembourg (Germany, Portugal and Luxembourg operate a joint taxation system). Belgium, Ger-many and Luxembourg evidence a high proportion of part-time work, while this is not the case in Portugal and Slovenia. The evidence that strong disincentives in the low and medium income groups may partly account for relatively high part-time ra-tes is not conclusive for the Netherlands and Ireland because of small sample size.
In the majority of countries there is no association between incentives to increase work intensity and presence of children in the family. Exceptions are Belgium, Fin-land, Greece, Ireland, Luxembourg, and the United Kingdom where women secon-dary earners with children face higher median METR than those without children. These results vary in the different countries by children’s age.
It should be noted that EUROMOD estimates of work incentives do not account for changes in out-of-pocket childcare costs under the assumption that they should not be exceedingly important for marginal increase in earnings. Childcare costs may be an important obstacle in case of entry into work and are, therefore, referenced below.

13
Executive Summary
The report finds a fair degree of consistency between the estimates of METR from the two models despite some inherent differences between the OECD tax-benefit model and the EUROMOD that hinder full comparability. This is an indicator of the robustness of the findings.
Participation Tax Rates for potential entrants (Using the modified OECD Tax-Benefit Model)
Belgium, Germany, Denmark, Iceland, Hungary, Latvia, and Slovenia have the hi-ghest PTR for women potential secondary earners without children in 2012. More than one third of additional earnings are forgone on entry into work. Large PTR values may be indicative of the so-called inactivity trap. The lowest PTR values for women potential secondary earners without children are found in Greece, Ireland, the United Kingdom, Spain, Lithuania, Portugal and Finland (less than 20%).
Out of the 16 countries featuring relatively high PTR for women potential secondary earners without children (greater than 25%) 8 report employment rates below the (European) average: Belgium, Hungary, Italy, Luxembourg, Malta, Poland, Romania, and Slovakia. In most of these countries, disincentives for secondary earners are in fact higher than elsewhere at any level of entry income, except for low-income earners in Luxembourg and Italy and medium-to-high income earners in Malta.
PTR values augmented by out-of-pocket childcare costs reach more than 66% for women potential secondary earners with children in the United Kingdom, Ireland, Germany, Slovakia, Luxembourg, Slovenia, and the Czech Republic. They remain low for this group in Greece, the Netherlands, Austria, Portugal, Spain and Sweden (less than 33%).
Large PTR may simply be indicative of heavy taxation, high progression or even ge-nerous means-tested benefits. They may reflect large differences between countries while individual decisions are more influenced by comparisons with other tax-payers within a person’s own country. PTR values for women potential secondary earners were therefore compared with those for women potential equal earners in each country. ‘Potential’ means a hypothetical situation of entry into work that turns a person into either a secondary or an equal earner.
PTR values are found to be generally higher for equal rather than secondary earners without children. This suggests the existence of disincentives to enter work on equal grounds with the male partner.
The disincentives are found to be higher for women with children, especially when out-of-pocket childcare costs and child benefits are taken into account. In 19 out of the 26 countries considered, women potential secondary earners fare worse than (potential) equal earners when childcare costs are factored in. The gap ranges from about 4 p.p. in Bulgaria up to almost 50 p.p. in the United Kingdom. Only in three countries, Spain, Sweden and Belgium is the gap almost negligible, at below 3 p.p.
Ireland and the United Kingdom stand out as countries where women potential secondary earners with children are penalized. Childcare is very expensive in those countries and it is relatively expensive in Slovakia and Luxembourg. Taking out-of-pocket childcare costs into account results in considerably larger PTR. Out-of-pocket childcare costs are likely to influence employment decisions as much as, if not more than, ‘explicit’ fiscal (dis)incentives.

14
Executive Summary
Conclusion
The evidence gathered in this report is consistent with the presumption that the design of the tax-benefit system, or out-of-pocket childcare costs, or both affect to various degrees the choice of working hours or the choice of entering employment by secondary earners.
Ten of the countries considered feature shares of part-time employment higher than the European average for women workers. Eleven of the countries feature em-ployment rates below the European average. Most of these countries are found to exhibit comparatively higher tax-burdens on secondary earners – METR, PTR or PTR augmented with out-of-pocket childcare costs. This gives cogency to the findings. However, neither the design of the tax-benefit system nor childcare costs suffice on their own to account for country-specific employment outcomes, as several counte-rexamples in both cases are found.
When out-of-pocket childcare costs are added to the traditional entries of the tax system, PTR values for secondary earners in five countries considered exceed benchmark values (those for equal earners) by at least 20%. Mothers of children in these countries envisaging entry into the labour market in a secondary earner posi-tion face considerably higher fiscal disincentives than do those envisaging entry as equal earners. In five other countries potential secondary earners are also penalized with respect to the benchmark group, but to a lesser extent (relative PTR is 10 p.p. higher).
The degree of progressivity in the tax code and of joint taxation are found to be among the most important elements of system design impinging on work incentives for secondary earners. The pros and cons of a joint versus individual tax-benefit system might need careful reassessment if the primary goal is to remove disincen-tives for groups of women in paid work at risk of labour market exclusion.

15
Introduction
1. Introduction
Closing gender gaps remains an important policy issue. Despite certain progress made in recent decades there is still a long way to go before equality in male and female earnings is achieved. Understanding what lies behind persisting gender gaps has proved to be a complicated task and has prompted abundant academic rese-arch.3
With this report we aim to contribute to the debate by considering a specific group of women: those who are employed and earn less than a male partner.4 It is to these women that we refer in this report as secondary earners, and they actually represent the majority of working women in couples. Our unit of analysis is thus a woman living in a couple, married or cohabiting.
Currently, European women earn on average about one third of the joint couple’s income. This share is the highest in Denmark and Lithuania (44%) and the lowest in Italy (25%). At the same time, there has been a tendency for the income share contributed by women to increase over the past decade (Bettio and Verashchagina 2013). There are two reasons for this:
• entrenchment of the female presence in the labour market during recent decades;
• the weakening of the male’s labour-market status in the wake of the recent economic crisis, which is known to have hit men more than women (Bettio et al. 2013).
It would be interesting to consider cases where men earn less than a female part-ner, which are not so rare in today’s Europe.5 However, in this report we can only provide a brief description of who those men are. Our main concern will be with couples where the woman earns less.
What is so special about being a secondary earner,6 and why does this term ge-nerally apply to women? A semantic clarification is necessary before addressing this question. From a strictly fiscal perspective, it is often appropriate to speak of second rather than secondary earners. In joint, progressive taxation systems, for example, the partner who enters employment after his/her spouse has already done so is likely to face a higher tax rate whether or not s/he is a low earner. In practice, however, the vast majority of second earners are the women that this report calls ‘secondary earners’. Our main reason for choosing ‘secondary’ instead of ‘second’ is that data do not record the sequence of entry into employment, whilst they record the level of earnings.
To return to the question of why secondary earners are feminised, women on ave-
3 See for example OECD (2013) and, for a survey on the gender pay gap, Blau et al. (2012).
4 A detailed definition of ‘secondary earner’ as used in the report will be given in Chapter 3.
5 Typified by more than 20% of couples in BG, DK, FI, HR, LT, LV, PL and SI, the majority being Eastern European countries (see Table 2 for more details).
6 This does not only concern low-earners, although the policy instruments to be used in order to in-centivize low-/middle- and high-paid secondary-earners would be different.
16
Introduction
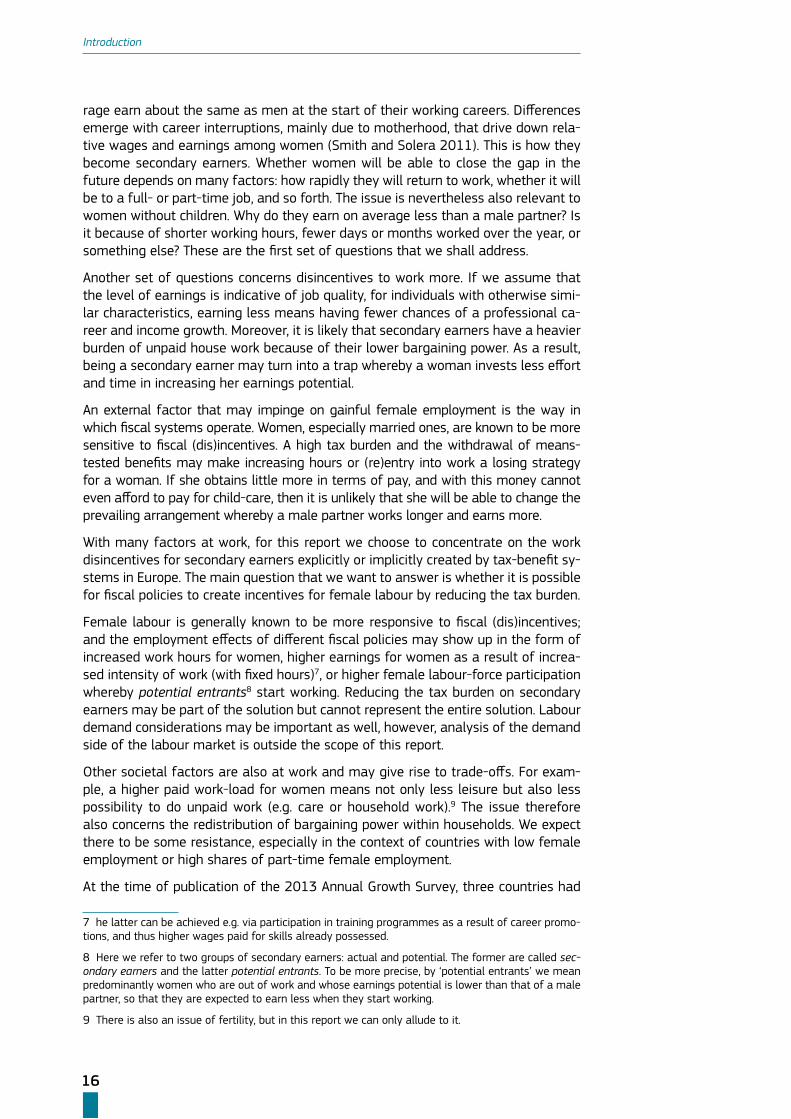
rage earn about the same as men at the start of their working careers. Differences emerge with career interruptions, mainly due to motherhood, that drive down rela-tive wages and earnings among women (Smith and Solera 2011). This is how they become secondary earners. Whether women will be able to close the gap in the future depends on many factors: how rapidly they will return to work, whether it will be to a full- or part-time job, and so forth. The issue is nevertheless also relevant to women without children. Why do they earn on average less than a male partner? Is it because of shorter working hours, fewer days or months worked over the year, or something else? These are the first set of questions that we shall address.
Another set of questions concerns disincentives to work more. If we assume that the level of earnings is indicative of job quality, for individuals with otherwise simi-lar characteristics, earning less means having fewer chances of a professional ca-reer and income growth. Moreover, it is likely that secondary earners have a heavier burden of unpaid house work because of their lower bargaining power. As a result, being a secondary earner may turn into a trap whereby a woman invests less effort and time in increasing her earnings potential.
An external factor that may impinge on gainful female employment is the way in which fiscal systems operate. Women, especially married ones, are known to be more sensitive to fiscal (dis)incentives. A high tax burden and the withdrawal of means-tested benefits may make increasing hours or (re)entry into work a losing strategy for a woman. If she obtains little more in terms of pay, and with this money cannot even afford to pay for child-care, then it is unlikely that she will be able to change the prevailing arrangement whereby a male partner works longer and earns more.
With many factors at work, for this report we choose to concentrate on the work disincentives for secondary earners explicitly or implicitly created by tax-benefit sy-stems in Europe. The main question that we want to answer is whether it is possible for fiscal policies to create incentives for female labour by reducing the tax burden.
Female labour is generally known to be more responsive to fiscal (dis)incentives; and the employment effects of different fiscal policies may show up in the form of increased work hours for women, higher earnings for women as a result of increa-sed intensity of work (with fixed hours)7, or higher female labour-force participation whereby potential entrants8 start working. Reducing the tax burden on secondary earners may be part of the solution but cannot represent the entire solution. Labour demand considerations may be important as well, however, analysis of the demand side of the labour market is outside the scope of this report.
Other societal factors are also at work and may give rise to trade-offs. For exam-ple, a higher paid work-load for women means not only less leisure but also less possibility to do unpaid work (e.g. care or household work).9 The issue therefore also concerns the redistribution of bargaining power within households. We expect there to be some resistance, especially in the context of countries with low female employment or high shares of part-time female employment.
At the time of publication of the 2013 Annual Growth Survey, three countries had
7 he latter can be achieved e.g. via participation in training programmes as a result of career promo-tions, and thus higher wages paid for skills already possessed.
8 Here we refer to two groups of secondary earners: actual and potential. The former are called sec-ondary earners and the latter potential entrants. To be more precise, by ‘potential entrants’ we mean predominantly women who are out of work and whose earnings potential is lower than that of a male partner, so that they are expected to earn less when they start working.
9 There is also an issue of fertility, but in this report we can only allude to it.

17
Introduction
already received country-specific recommendations on this matter (Germany, Italy and the Netherlands), with fiscal measures seen as the main tool.10 More countries are likely to be concerned by this issue. We aim to identify those countries by inve-stigating the existing tax-benefit systems in the EU and the burden that they impose on secondary earners.
It is important to stress that secondary earners are not necessarily low earners, although this is often the case. As it will be shown later, a typical female secondary earner gets about half the average wage in the country.11
Table 1. Who are secondary earners?
Earnings
Dominance within the couple
Low-earning couple Medium High-earning couple
Male-dominance dual-earner couple
F < M 50+100=150 (I) F<M 75+125=200 (II) F < M
100+150=250(III)
Equal-dual-earner couple
F = M 75+75=150
(IV)F = M 100+100=200
(V)F = M 125+125=250
(VI)
Female-dominance dual-earner couple
F > M 100+50=150
(VII)F > M 125+75=200
(VIII)F > M 150+100=250
(IX)
Note: Arbitrary levels of earnings have been used in this table for illustrative purposes, which can be conceived as percentage shares of the average wage in the country.
For purely illustrative purposes, Table 1 typifies couples by the level of earnings and the within-couple dominance using arbitrary level of earnings that range from 50 to 250. Our main focus will be on male-dominance dual-earner couples, and in particular types I and II, which best approximate the real distribution of earnings within couples.
Two complementary tools will be used to examine financial (dis)incentives to work:
i. the EU tax-benefit microsimulation model EUROMOD;
ii. the OECD tax-benefit model for family types.
The two models are already being used in parallel for policy prescriptions, but to our knowledge no attempt has been made to compare their results. This double-check is expected to increase the robustness of our findings, but it can also be a useful exercise to improve the models.
10 Germany was advised to take measures to improve incentives to work for second earners by re-moving disincentives (high taxes and social security contributions, especially for low-wage earners) and increasing the availability of full-time childcare facilities. Reduction of tax disincentives on labour, including the phasing-out of transferable tax credits for second income earners, was recommended to the Netherlands (European Commission, 2012).Italy was advised to reduce financial disincentives for second earners to work and improve the provision of care and out-of-school services.
11 Here we refer to the OECD average wage. For the level of reference earnings used throughout the report see Table 6A in the Appendix.

18
2. Literature review
2. Literature review
Women nowadays play a non-marginal income role. Interest in taking couples as a unit of analysis has grown considerably in recent years.
Stancanelli (2007) was among the first to pinpoint the growth in dual-earner cou-ples in European countries by considering the labour-market behaviour of French couples over the period 1990-2002. Not so long ago, married women were catego-rized as true secondary earners with an attachment to the labour market weaker than that of their partners. The literature on the added worker effect has brought the role of women to the fore, as they started entering the labour force on a tem-porary basis in order to substitute for the loss of a male partner’s income. The added worker effect first appeared in the economic literature in the 1940s, and it continued to influence research on female employment long after the paradigm had lost salience.
Times have changed to such an extent that nowadays some commentators talk of ‘Toyboys and Supergirls’, the latter being women who out-earn their partners (Blo-emen and Stancanelli 2013). ‘Toyboys’ and ‘supergirls’ indicate real change in the income role of women and predict an increase in the role of women as tax-payers, but they are still minority groups. How able are tax-benefit systems to fuel ongoing change and draw more women into the labour force? Or are they being used to inhibit change? In what follows we provide a brief overview of the growing body of studies dealing with the effects of fiscal policies on female employment.
Bettio and Verashchagina (2013) show that fiscal stimuli designed to encourage female employment have not been used fully in Europe in recent decades. By consi-dering eight European countries belonging to the group with middle-to-low female employment rates, and focusing on the groups of female workers most at risk of labour market exclusion (lone mothers and secondary earners), the authors show that the tax burden diminished only marginally over the period 2001-2008.
Part of the explanation may lie in the controversy surrounding appropriate instru-ments. The so-called Negative Income Tax programmes with a substantial guaran-teed income level and high phasing-out rates are considered to be optimal when labour supply responses are concentrated along the intensive margin, i.e. wherever women work in fairly large numbers but tend to work short hours. At the extensive margin, the optimal scheme appears to be of the Earned Income Tax Credit type (Saez 2002), which is of primary interest for countries in which women do not work in large numbers but tend to work full time.
The observed heterogeneity across European countries – with some exhibiting low female labour-force participation rates coupled with relatively low shares of part-time work (e.g. Italy and other Mediterranean countries), others having high partici-pation rates coupled with high part-time work rates (e.g. the Netherlands or Scan-dinavian countries), and still others in between the two extremes – makes it difficult to work out a common policy agenda. Attempts are being made nevertheless. One of them is the recent proposal by Alesina et al. (2011) to lower the tax burden on women by reducing tax rates for female workers, which received the name of
19
2. Literature review
gender-based taxation. The idea is not a new one (see e.g. Rosen 1977), but it has apparently been discarded in the USA for equity reasons. Nevertheless, it has sti-mulated the academic debate (see e.g. Colombino and Narazani 2012, Colonna and Marcassa 2013).
Overall, policy-makers have paid scant attention to gender-based taxation, and one of the reasons may be that, in some countries, economic and labour market diffe-rences among women are increasingly becoming as large as those between men and women. This justifies the selective approach that has been adopted for this report: we will concentrate on a selection of countries and on specific groups of women.
This approach is also consistent with the recent findings of Econpubblica (2011), which investigated the labour supply impact of tax reforms in Europe over the pe-riod 1990-2008. The study concluded that tax policies have played a minor role in determining labour market outcomes. Positive results accrued to those policies that were targeted on specific groups of workers (like married women, lone mothers, low-educated workers). The report also showed that tax policies are more efficient in increasing work hours than in affecting the participation decision.
The issue of secondary workers is of special importance in joint taxation sy-stems, owing to the so-called ‘secondary earner bias’. While it is well understo-od that joint systems of taxation may impose excessive tax burdens on secon-dary earners, there are still countries in Europe which adhere to the joint system
and justify their choice with equity considerations. There have also been relatively recent attempts to switch from individual to joint taxation, as in the Czech Republic in 2005.
Bettio and Verashchagina (2009) point out that the secondary earner bias can also be found in tax-benefit systems where the unit of taxation is the individual rather than the household. There may be some elements of jointness, e.g. the option of joint filing is allowed under some circumstances, or there may be forms of means-tested benefits provided against the total family income.
The OECD (2012) has recently reconsidered the factors determining female labour-force participation in 30 OECD countries over the period 1980-2007. The findings confirm that higher tax rates on secondary earners reduce female labour-force par-ticipation. The European Commission (EC, 2013b: p. 45) has recently reiterated that secondary earners often face specific disincentives to returning to work from inac-tivity or to increasing their work hours. Disincentives have been found to be high for potential entrants in Belgium, Germany and the Netherlands and for actual se-condary earners in Belgium, Germany, Italy and Denmark. The female employment rates are generally above the EU average in countries with high disincentives, but at the same time work hours are relatively low (ibid.). This may be taken as an indica-tion that, in these countries, fiscal policies geared to secondary workers should first of all be concerned with labour supply at the intensive margin (that is, increasing working time).
The focal question in the latest academic research on how to tackle fiscal disincen-tives regards the composition of the optimal policy mix; and the preferred analytical tool is the microsimulation model. Immervoll (2002) and Jara and Tumino (2013) are examples of the use of microsimulation tax-benefit models to compute mar-ginal effective tax rates across the household population of EU countries. Recent applications of microsimulation models to analyse the effects of hypothetical policy changes on employment and/or social welfare outcomes for women include Colom-bino and Narazani (2013), De Luca et al. (2012), Figari (2010), and Kleven et al.
20
2. Literature review
(2009) (for a brief summary of their findings see Box 1).
In this type of research, trade-offs are typically encountered between income re-distribution (e.g. with a view to protecting families with children from poverty) and work incentives (for secondary earners as well). Unsurprisingly, the answer seems to depend on both the country context and the local policy priorities. Again, this supports the case-by-case approach that we take in this report.
Box.1 Available evidence from microsimulation studies
Using EUROMOD
Immervoll (2002) analysed the distributions of average and marginal effective tax rates. They appeared to depend on incomes, labour-market situations and fa-mily circumstances. Using single averages or macro-based indicators therefore pro-vides an inappropriate picture of the tax burdens on large parts of the population.
Bargain and Orsini (2006) simulated the effects of a reform similar to the British Working Families’ Tax Credit in three EU countries with rather different labour mar-ket and welfare institutions: Finland, France, and Germany. The first round effects on income distribution were found to be considerable, but the interaction of the new instrument with the structural characteristics of the economy and the population may lead to counterproductive second round effects (i.e. changes in economic beha-viour). Implementation of the reform, in this case, could only be justified if the social inclusion of some specific groups of workers (e.g. single mothers) is valued more than a rise in employment per se.
Immervoll et al. (2007) compared the effects of increasing traditional welfare versus introducing in-work benefits in 15 old EU Member States. Increasing tradi-tional welfare was found to be undesirable unless the redistributive tastes of the government are extreme. Conversely, the in-work benefit was found to be desirable in a wide set of cases.
Figari (2010) modelled the effect of family-based and individual in-work benefits in Southern European countries. The results suggested that family-based in-work benefits are more redistributive, but the presence of extended families does not enable them to be well targeted on the poorest. By contrast, individual in-work be-nefits create better incentives to work, especially for Italy and Spain.
Figari et al. (2011) analysed the effects of tax and benefit systems on differences in income and fiscal incentives within couples in nine EU countries. They established the relative effects of different policy regimes, given the characteristics of each national population. Within-couple equalizing effects varied across countries and depended on whose market income was larger – the male’s or the female’s.
Jara and Tumino (2013) studied the impact of tax-benefit systems on income inequality and work incentives in EU27 and highlighted the presence of a trade-off between income redistribution and work incentives.
Colombino and Narazani (2013) analysed gender-based taxation (GBT) in com-parison to subsidies on low wages and unconditional transfers in relation to their effect on female employment in Italy. GBT ranked first in terms of welfare effects among single women; but for the whole population the best policies were subsidies on low wages, unconditional transfers, or a combination of the two.
21
2. Literature review
Figari (2014) analysed possible effects from introducing either a family based or an individual in-work benefit, financed through the abolition of the existing tax credit targeted at dependent adults in Italy. Both the redistributive and the incenti-ve effects were in focus. The results show an increase in the labour supply of both women in couples and lone mothers, in particular among the poorest with important redistributive effects.
Using other microsimulation models
De Luca et al. (2012) used EconLav, a tax-benefit microsimulation model deve-loped by ISFOL12, to study the labour supply and redistributive effects of in-work benefits for Italian married couples. The standard design was augmented with a benefit premium for two-earner households in order to overcome the disincentive effects that these instruments may generate on secondary earners. The proposed in-work benefits were financed through the abolition of Italian family allowances for dependent employees and contingent workers, thus ensuring tax revenue neu-trality. The Earned Income Tax Credit (EITC)- and Working Tax Credit (WTC)-type of reforms were found to have strong positive effects on the labour supply of wives, weak negative effects on the labour supply of husbands, and strong positive effects on equity.
Colonna and Marcassa (2013) estimated a structural labour supply model for women, and used the estimated parameters to simulate the effects of alternative revenue-neutral tax systems. Joint taxation was found to reduce the participation rate. Conversely, working tax credit and gender-based taxation were found to boost it in particular for low-educated women.
Kleven et al. (2009) used TAXBEN (at the Institute for Fiscal Studies) to analyse the general non-linear optimal income tax for couples. If second-earner partici-pation is a signal that the couple is better (worse) off, they proved that optimal tax schemes display a positive tax (subsidy) on secondary earnings and that the tax(subsidy) on secondary earnings decreases with primary earnings and converges to zero asymptotically. The authors presented calibrated microsimulations for the United Kingdom showing that decreasing tax rates on secondary earnings is quanti-tatively significant and consistent with actual income tax and transfer programmes.
12 ISFOL (ital. Istituto per lo sviluppo della formazione professionale dei lavoratori) is a public re-search institute operating at the national level in Italy. The main scope of it is to develop Vocational Training, Social and Employment policies.
22
3. A brief overview of tax-benefit systems in the European countries
3. A brief overview of tax-benefit systems in the European countries
Empirical studies find that labour supply elasticity is higher for secondary earners, in particular women with children (Meghir and Phillips 2009). Thus, a higher tax-burden on secondary workers may have a disproportionate negative effect on their employment outcomes. What are the possible sources of such distortions?
This chapter maps the main features of the tax-benefit systems operating in the Member States. It draws on the most recent information about European tax-benefit systems available from the OECD tax-benefit model13 and EUROMOD.14 The referen-ce year is 2012. The national tax-benefit systems are classified according to their most important features from a gender perspective: joint or individual taxation, transferable tax credits, dependent spouse allowances or credits, joint or individual benefits, individual or family unit income test for means-tested benefits, and other characteristics potentially impacting on biases. The information is summarized in Table 2 (which updates Table 2 in Bettio and Verashchagina, 2009). Comparison between the two tables shows that not many changes have actually taken place over the five-year span.
The degrees of progressivity and jointness inherent in the tax codes are the most important factors that impinge on work incentives for secondary earners. They are also important for redistributing resources within couples (Figari et al. 2011). In the majority of European countries, the unit of taxation is the individual, although there are several countries which adhere to the joint taxation system: Germany, France, Ireland, Luxembourg, and Portugal. Moreover, there are some elements of jointness in the tax codes of about half of the countries considered: Belgium, Bulgaria, Esto-nia, Spain, Greece, Hungary, Iceland, Italy, Lithuania, Malta, the Netherlands, Norway, Poland. In particular, benefits can be either non means-tested or means-tested. The latter option allows for redistribution of resources between couples by affecting the eligibility to receive benefits. But it cannot be assumed that such redistribution is necessarily consistent with the goal of strengthening work incentives.
Other features of tax-benefit systems may be less consequential for work incentives but they matter nevertheless. For example about one third of EU Member countries still feature a dependent spouse allowance, which tends to encourage homemaking. It is therefore worth spending a few remarks on how these features may have been affected by the recent crisis, though we already noted that few major changes oc-curred. Unemployment benefits underwent significant changes in several countries
13 Policy description used for OECD tax-benefit models: http://www.oecd.org/els/soc/benefit-sandwagescountryspecificinformation.htm
14 Policy description used for EUROMOD: https://www.iser.essex.ac.uk/euromod/resources-for-euromod-users/country-reports

23
3. A brief overview of tax-benefit systems in the European countries
often involving a reduction in the maximum amount, shorter duration, and stricter eligibility conditions. All this may hit women disproportionally, especially in countries where illegal practices are widespread, such as so-called ‘blank dismissal’ in Italy.15
Restrictions also resulted in the reductions of key benefits for female workers in some of the countries most exposed to the financial crisis. Hungary (since 2008) and Latvia (since 2010) provide examples: parents caring for children under 1 year of age can no longer pursue a gainful activity in order to be eligible for childcare al-lowances. Iceland saw the abolition in 2012 of benefits to parents who care for their children at home between six months of age and pre-school entry (cash-for-care). In Lithuania, on 1 March 2009, an income test was introduced for child benefits, thus restricting availability to low-income families.
Overall, the economic reasons for returning to work are likely to have been wea-kened among women with small children, who make up the segment of secondary earners at highest risk of labour-market exclusion. This does not bode well for the expansion of labour-force participation in the near future, unless measures are ta-ken to counteract these negative spillover of the crisis.
15 Forced dismissal due to e.g. pregnancy. This is often done on the basis of a resignation letter which the woman is asked to sign at the moment of hiring. The date is left blank and filled in when the em-ployer fires the woman.
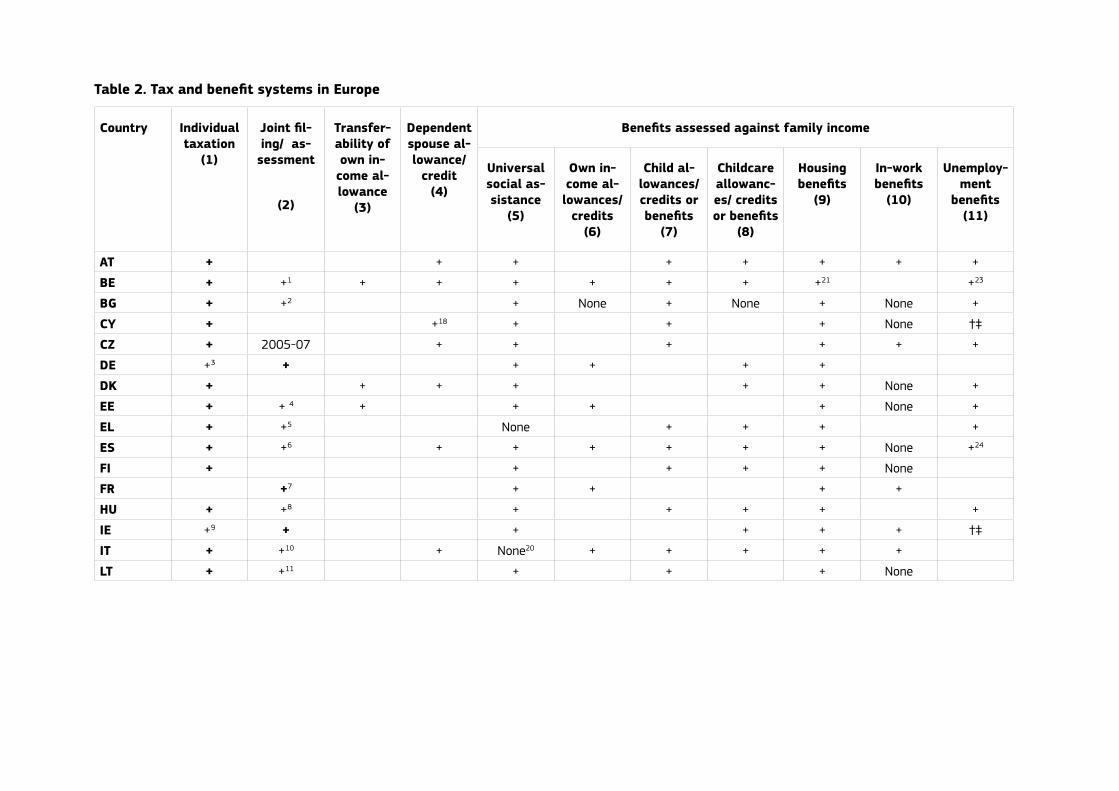
Table 2. Tax and benefit systems in Europe
Country Individual taxation
(1)
Joint fil-ing/ as-sessment
(2)
Transfer-ability of own in-
come al-lowance
(3)
Dependent spouse al-lowance/
credit (4)
Benefits assessed against family income
Universal social as-sistance
(5)
Own in-come al-lowances/
credits (6)
Child al-lowances/ credits or benefits
(7)
Childcare allowanc-es/ credits or benefits
(8)
Housing benefits
(9)
In-work benefits
(10)
Unemploy-ment
benefits (11)
AT + + + + + + + +
BE + +1 + + + + + + +21 +23
BG + +2 + None + None + None +
CY + +18 + + + None †‡
CZ + 2005-07 + + + + + +
DE +3 + + + + +
DK + + + + + + None +
EE + + 4 + + + + None +
EL + +5 None + + + +
ES + +6 + + + + + + None +24
FI + + + + + None
FR +7 + + + +
HU + +8 + + + + +
IE +9 + + + + + †‡
IT + +10 + None20 + + + + +
LT + +11 + + + None

IE +9 + + + + + †‡
IT + +10 + None20 + + + + +
LT + +11 + + + None
LU + + + + None ‡
LV + +12 + + None
MT + +13 + + None + +†
NL + +14 + + 19 + + + +
PL + +15 + + + None
PT + + + + None +
RO + + + None
SE + + + +
SI + + + + +22
SK + + + + None
UK + + + + + +
IS + +16 + + + + + None +
NO + +17 + + + + None ‡Note: ‘+’ means Yes (column 1-4)/Assessed against family income (column 5-11); ‘blank’ means No/ Not assessed against family income; ‘None’- there is not this type of benefit.
1BE: The tax calculation system is individual, but in order to apply the correct credits and allowances, the level at which the tax return is to be filed is the nuclear family (including dependants); moreover, the marital quotient system applies, so that the tax burden on a single earner in the family can be reduced; 2 BG: when the standard child deductions are assessed, the family tax unit is used; 3 DE: married couples are taxed jointly with full income splitting, i.e. the tax function is applied to half of the sum of the spouses’ taxable incomes, and then the resulting tax amount is doubled; they have the right to be taxed individually when this is more advantageous to them; 4 EE: married couples can file a joint return; 5EL: spouses file a joint income tax return, but their incomes are entered separately and taxed individually. Some tax allowances and/or tax credits are assessed jointly; 6 ES: family units have the option of filing their tax returns on a joint basis; 7FR: the tax unit for income taxation consists of one taxpayer plus the persons who fiscally depend on him/her (known as ‘foyer fiscal’, “fiscal household”); 8 HU: family tax credits are jointly assessed; 9 IE: either spouse may opt for separate assessment; 10 IT: the size and composition of the family are taken into account by means of tax allowances and tax credits; 11 LT: some tax allowances are based on a family tax unit; 12 LV: for tax allowance purposes, an extended family unit is defined, including a partner, dependent children and dependent parent; 13 MT: individual and joint taxation coexist; each person is considered individually for tax purposes unless married and living with his/her partner and opting for a married rate tax computation; 14 NL: income of other members of the household is taken into account in the calculation of the income tax credits; 15 PL: couples have the option of filing a joint tax return; 16 IS: non-wage income of married couples is taxed jointly; 17 NO: joint taxation is also possible, and is more favourable if one of the spouses has little or no own income;18 CY: only in the case of unemployment or receipt of social assistance; 19 NL: from 2009, the payment of the general tax credit to a spouse with a low or zero income will be reduced to zero in 15 years (i.e. by 6.67% per year); 20 IT: available only in the form of social assistance for people aged over 65 without other sources of income (assegnosociale, “social allowance”); 21 BE: in the form of housing deduction;22 SI: only for disabled workers; 23 BE: depends on family status; 24 ES: if the worker is not entitled to receive contributory benefits, a non-contributory means-tested benefit is available; †/‡ supplement for dependent spouse/children.
Source: OECD policy description (the reference date is July 1st 2012) and EUROMOD country reports (the reference date is June 30st 2012).
26
4. Profile of secondary earners in today’s Europe
4. Profile of secondary earners in today’s Europe
This chapter provides the background information for analysis of work incentives for secondary earners. How prevalent are secondary earners in the European countri-es, and who are they? We start by describing prevalent household types in Europe, focusing, in particular, on households with couples. Then, the characteristics of se-condary earners are examined. The analysis is based on the 2011 EU-SILC microda-ta.16 The EU-SILC 2011 provides information on characteristics of households as of 2011. For the majority of countries, however, the information on income collected in 2011 refers to the previous year (2010).
4.1. Household structure and couple types
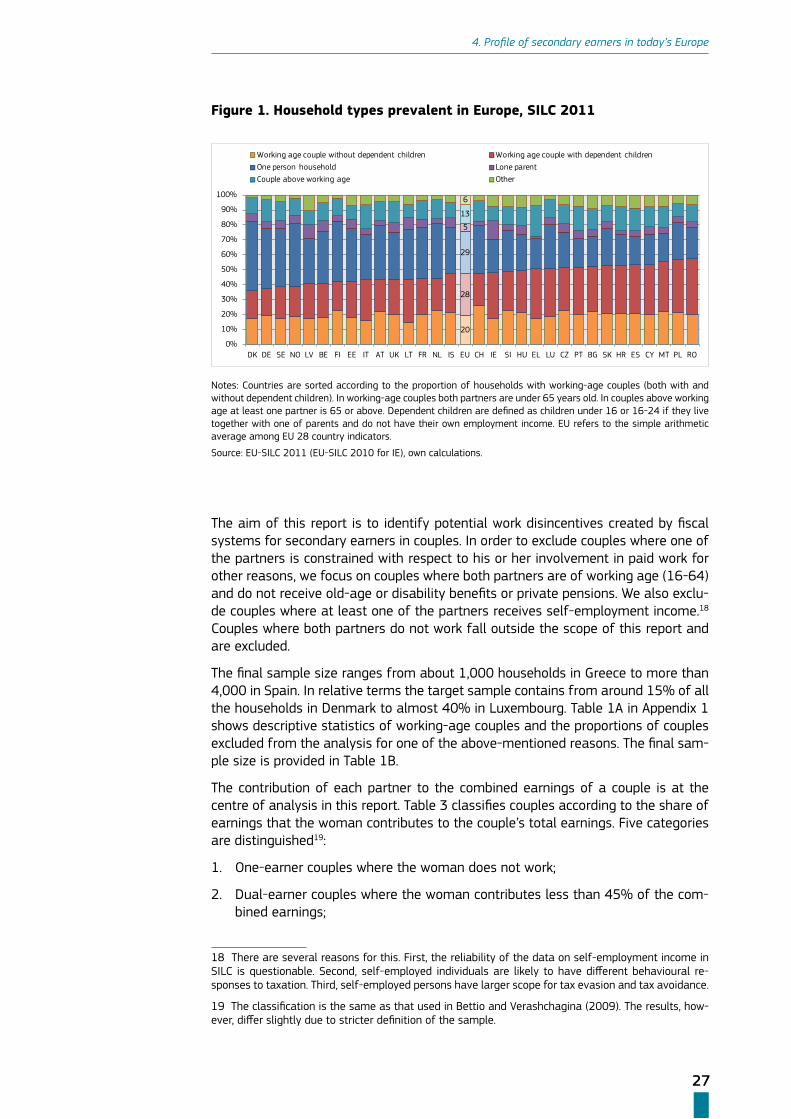
The structure of households differs significantly across Europe. These differences may reflect cultural norms, demographic trends (e.g. fertility), financial well-being, availability and affordability of housing, as well as tax-benefit policies which af-fect individuals’ decisions to form household units. Households with at least one working-age couple (with or without dependent children)17 constitute 35-57% of all households (see Figure 1). Interestingly, the percentage of working-age couples wi-thout children is relatively similar across countries: between 15-26%. However, the percentage of working-age couples with dependent children is more volatile: from 18% in Denmark to 37% in Romania.
The proportion of couples with dependent children is low in Scandinavian countries (Denmark, Finland, Norway, Sweden), as well as in Germany, Austria, the Nether-lands. This is off-set by a relatively large share of one-person households. The situation is the reverse in the south of Europe (Spain, Greece, Cyprus, Malta), as well as in Poland, Romania and Croatia. In these countries, working-age couples living together with their children are more common. By contrast, the proportion of one-person households is relatively low. The difference in the structure of households across Europe is partly explained by how early children become independent, leave the parental home, or start to earn their livings. This is also likely to influence the role of women in couples as care providers, and therefore their financial contribution to the family’s budget.
16 We use the second version of UDB SILC 2011 released on 1 August 2013. This is the latest EU-SILC micro-data available in time of writing this report. Because this dataset does not include IE, throughout this section the data on IE refer to the fourth version of UDB SILC 2010.
17 It should be noted that these households can contain other household members, such as adult children or parents or other members of households.
27
4. Profile of secondary earners in today’s Europe
Figure 1. Household types prevalent in Europe, SILC 2011
20
28
29
5
13
6
0%
10%
20%
30%
40%
50%
60%
70%
80%
90%
100%
DK DE SE NO LV BE FI EE IT AT UK LT FR NL IS EU CH IE SI HU EL LU CZ PT BG SK HR ES CY MT PL RO
Working age couple without dependent children Working age couple with dependent childrenOne person household Lone parentCouple above working age Other
Notes: Countries are sorted according to the proportion of households with working-age couples (both with and without dependent children). In working-age couples both partners are under 65 years old. In couples above working age at least one partner is 65 or above. Dependent children are defined as children under 16 or 16-24 if they live together with one of parents and do not have their own employment income. EU refers to the simple arithmetic average among EU 28 country indicators.
Source: EU-SILC 2011 (EU-SILC 2010 for IE), own calculations.
The aim of this report is to identify potential work disincentives created by fiscal systems for secondary earners in couples. In order to exclude couples where one of the partners is constrained with respect to his or her involvement in paid work for other reasons, we focus on couples where both partners are of working age (16-64) and do not receive old-age or disability benefits or private pensions. We also exclu-de couples where at least one of the partners receives self-employment income.18 Couples where both partners do not work fall outside the scope of this report and are excluded.
The final sample size ranges from about 1,000 households in Greece to more than 4,000 in Spain. In relative terms the target sample contains from around 15% of all the households in Denmark to almost 40% in Luxembourg. Table 1A in Appendix 1 shows descriptive statistics of working-age couples and the proportions of couples excluded from the analysis for one of the above-mentioned reasons. The final sam-ple size is provided in Table 1B.
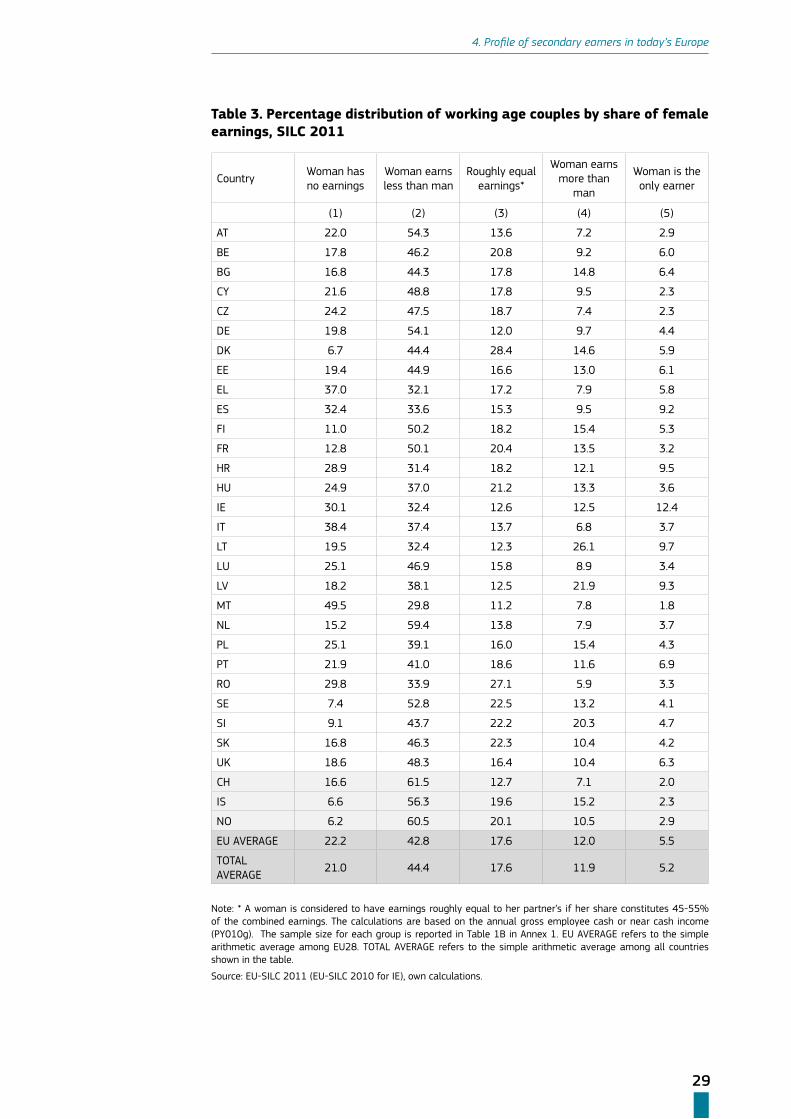
The contribution of each partner to the combined earnings of a couple is at the centre of analysis in this report. Table 3 classifies couples according to the share of earnings that the woman contributes to the couple’s total earnings. Five categories are distinguished19:
1. One-earner couples where the woman does not work;
2. Dual-earner couples where the woman contributes less than 45% of the com-bined earnings;
18 There are several reasons for this. First, the reliability of the data on self-employment income in SILC is questionable. Second, self-employed individuals are likely to have different behavioural re-sponses to taxation. Third, self-employed persons have larger scope for tax evasion and tax avoidance.
19 The classification is the same as that used in Bettio and Verashchagina (2009). The results, how-ever, differ slightly due to stricter definition of the sample.
28
4. Profile of secondary earners in today’s Europe
3. Dual-earner couples where both partners have roughly similar earnings (betwe-en 45% and 55% of the combined earnings);
4. Dual-earner couples where the woman contributes more than 55% of the com-bined earnings;
5. One-earner couples where the man does not work.
Women in the couples of the 2nd type and men in the couples of the 4th type are considered to be secondary earners. In the majority of the countries, dual-earner couples with a secondary earner-woman constitute the largest group. The excep-tions are Malta and Greece, where one-earner couples with a male breadwinner prevail. The proportion of couples with a secondary earner-woman ranges from around 30% in Malta to more than 60% in Switzerland. Dual-earner couples with a secondary earner-man are much less common: from around 6% in Romania to 26% in Lithuania. Couples with roughly equal earnings are relatively widespread in Norway, France, Belgium, Hungary, Slovenia, Slovakia, Sweden, Romania, Denmark. They make up around 1/5 of all couples considered in Table 3.
In this report, partners with roughly equal earnings are defined in the following way. The earnings of both partners are considered to be ‘roughly equal’ if deviation from an absolutely equal situation (50/50%) is not more than 5%. This means that individual’s earnings in a couple can range between 45% and 55% of the combined earnings. It is assumed that differences in earnings within this interval are spora-dic and do not indicate inequality with respect to the partner’s position within the couple and in the labour market. The threshold of 5% is also convenient because it splits the sample of dual-earner couples into three sufficiently large groups, so that each of them can be analysed on its own. If a deviation larger than 5% is allowed, the sample of couples where men earn less than women shrinks considerably. Con-versely, if a stricter threshold for equal earnings is imposed, the sample of couples with roughly equal earnings becomes very small.
29
4. Profile of secondary earners in today’s Europe
Table 3. Percentage distribution of working age couples by share of female earnings, SILC 2011
CountryWoman has no earnings
Woman earns less than man
Roughly equal earnings*
Woman earns more than
man
Woman is the only earner
(1) (2) (3) (4) (5)
AT 22.0 54.3 13.6 7.2 2.9
BE 17.8 46.2 20.8 9.2 6.0
BG 16.8 44.3 17.8 14.8 6.4
CY 21.6 48.8 17.8 9.5 2.3
CZ 24.2 47.5 18.7 7.4 2.3
DE 19.8 54.1 12.0 9.7 4.4
DK 6.7 44.4 28.4 14.6 5.9
EE 19.4 44.9 16.6 13.0 6.1
EL 37.0 32.1 17.2 7.9 5.8
ES 32.4 33.6 15.3 9.5 9.2
FI 11.0 50.2 18.2 15.4 5.3
FR 12.8 50.1 20.4 13.5 3.2
HR 28.9 31.4 18.2 12.1 9.5
HU 24.9 37.0 21.2 13.3 3.6
IE 30.1 32.4 12.6 12.5 12.4
IT 38.4 37.4 13.7 6.8 3.7
LT 19.5 32.4 12.3 26.1 9.7
LU 25.1 46.9 15.8 8.9 3.4
LV 18.2 38.1 12.5 21.9 9.3
MT 49.5 29.8 11.2 7.8 1.8
NL 15.2 59.4 13.8 7.9 3.7
PL 25.1 39.1 16.0 15.4 4.3
PT 21.9 41.0 18.6 11.6 6.9
RO 29.8 33.9 27.1 5.9 3.3
SE 7.4 52.8 22.5 13.2 4.1
SI 9.1 43.7 22.2 20.3 4.7
SK 16.8 46.3 22.3 10.4 4.2
UK 18.6 48.3 16.4 10.4 6.3
CH 16.6 61.5 12.7 7.1 2.0
IS 6.6 56.3 19.6 15.2 2.3
NO 6.2 60.5 20.1 10.5 2.9
EU AVERAGE 22.2 42.8 17.6 12.0 5.5
TOTAL AVERAGE
21.0 44.4 17.6 11.9 5.2
Note: * A woman is considered to have earnings roughly equal to her partner’s if her share constitutes 45-55% of the combined earnings. The calculations are based on the annual gross employee cash or near cash income (PY010g). The sample size for each group is reported in Table 1B in Annex 1. EU AVERAGE refers to the simple arithmetic average among EU28. TOTAL AVERAGE refers to the simple arithmetic average among all countries shown in the table.
Source: EU-SILC 2011 (EU-SILC 2010 for IE), own calculations.

30
4. Profile of secondary earners in today’s Europe
4.2. Characteristics of secondary earners
In this section we consider the characteristics of secondary earners (mainly women) and provide tentative explanations as to why their earning capacity may be lower than that of their partners.
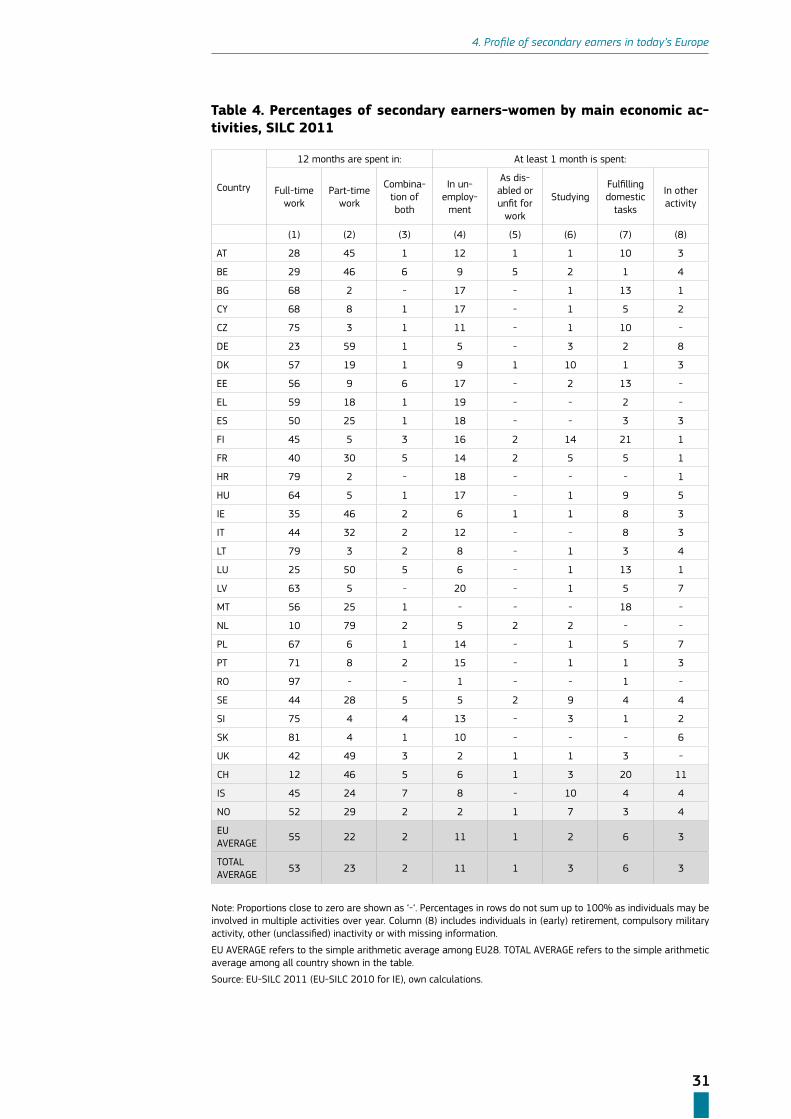
The first factor that may lead to low income is the intensity of work across the year. Income in the SILC data is recorded on an annual basis. When we compare the contri-bution by each partner in a couple to the combined earnings, it may happen that one of the partners has contributed less than the other because of special circumstan-ces (e.g. unemployment, sickness, studies, care responsibilities) or work arrangements (e.g. part-time work). Table 4 shows the percentages of secondary earners-women involved in different activities in the income reference period (i.e. 2010).
Interestingly, quite high proportions of secondary earners-women in the Eastern part of Europe work in full-time jobs throughout the year. Thus, their capacity to contribute to the couple’s combined earnings is likely to be low because of relatively low wages (as compared to their partners), type of job, or sector of employment, rather than low working hours or other circumstances. In the EU13 (except Cyprus and Malta), median working hours equal 40 for both secondary earners-women and for their partners. Some of the countries where this is the case have relatively wide (unadjusted) gender pay gaps: e.g. Estonia, the Czech Republic, Slovakia, Hun-gary.20 By contrast, in many of the EU15 countries, relatively high proportions of women work part-time (especially in the Netherlands, but also in Luxembourg and Germany). The exceptions are Finland and Portugal, where part-time employment among women is not common in general.
Unemployment is likely to have affected women’s earning capacity in EE, HU, BG, CY, HR, ES, EL and LV. Greece, Spain, and Latvia were heavily affected by the economic crisis and recorded the highest unemployment rates for women in the EU in 2010.21 Estonia and Croatia were only slightly below them. While Hungary suffered much less from the crisis, it still had a relatively high unemployment rate: above 10% (hi-gher than the EU average). In the Scandinavian countries, about 10% of secondary earners-women spent at least one month studying (which may also include training or unpaid work experience). Considerable proportions of women fulfilling domestic tasks and care responsibilities are found in such diverse countries as Malta, Finland and Switzerland.
20 EUROSTAT [earn_gr_gpgr2].
21 For more details on the impact of the crisis on men and women in Europe see Bettio et al. (2013).
31
4. Profile of secondary earners in today’s Europe
Table 4. Percentages of secondary earners-women by main economic ac-tivities, SILC 2011
Country
12 months are spent in: At least 1 month is spent:
Full-time work
Part-time work
Combina-tion of both
In un-employ-
ment
As dis-abled or unfit for
work
StudyingFulfilling domestic
tasks
In other activity
(1) (2) (3) (4) (5) (6) (7) (8)
AT 28 45 1 12 1 1 10 3
BE 29 46 6 9 5 2 1 4
BG 68 2 - 17 - 1 13 1
CY 68 8 1 17 - 1 5 2
CZ 75 3 1 11 - 1 10 -
DE 23 59 1 5 - 3 2 8
DK 57 19 1 9 1 10 1 3
EE 56 9 6 17 - 2 13 -
EL 59 18 1 19 - - 2 -
ES 50 25 1 18 - - 3 3
FI 45 5 3 16 2 14 21 1
FR 40 30 5 14 2 5 5 1
HR 79 2 - 18 - - - 1
HU 64 5 1 17 - 1 9 5
IE 35 46 2 6 1 1 8 3
IT 44 32 2 12 - - 8 3
LT 79 3 2 8 - 1 3 4
LU 25 50 5 6 - 1 13 1
LV 63 5 - 20 - 1 5 7
MT 56 25 1 - - - 18 -
NL 10 79 2 5 2 2 - -
PL 67 6 1 14 - 1 5 7
PT 71 8 2 15 - 1 1 3
RO 97 - - 1 - - 1 -
SE 44 28 5 5 2 9 4 4
SI 75 4 4 13 - 3 1 2
SK 81 4 1 10 - - - 6
UK 42 49 3 2 1 1 3 -
CH 12 46 5 6 1 3 20 11
IS 45 24 7 8 - 10 4 4
NO 52 29 2 2 1 7 3 4
EU AVERAGE
55 22 2 11 1 2 6 3
TOTAL AVERAGE
53 23 2 11 1 3 6 3
Note: Proportions close to zero are shown as ‘-‘. Percentages in rows do not sum up to 100% as individuals may be involved in multiple activities over year. Column (8) includes individuals in (early) retirement, compulsory military activity, other (unclassified) inactivity or with missing information.
EU AVERAGE refers to the simple arithmetic average among EU28. TOTAL AVERAGE refers to the simple arithmetic average among all country shown in the table.
Source: EU-SILC 2011 (EU-SILC 2010 for IE), own calculations.
32
4. Profile of secondary earners in today’s Europe
The presence of children in the family is another factor that traditionally decreases the earning capacity of women. Table 5 shows the percentages of couples with de-pendent children among the five couple types identified at the beginning of this Sec-tion. In the majority of the countries, couples where the woman does not work account for the largest proportion of families with dependent children. This result still holds even if couples with children under one are excluded. In dual-earner couples where the woman earns less than the man, the share of families with children is also high. Only in Greece, Portugal, and Cyprus is there a considerable share of couples with children among dual-earner couples where the woman earns more than the man. This result should be viewed with caution as it is based on relatively small sample size. In practically all countries, the percentage of families with children among couples with roughly equal earnings is lower than among couples where the woman earns less than the man. The largest discrepancy is for Germany and Switzerland.
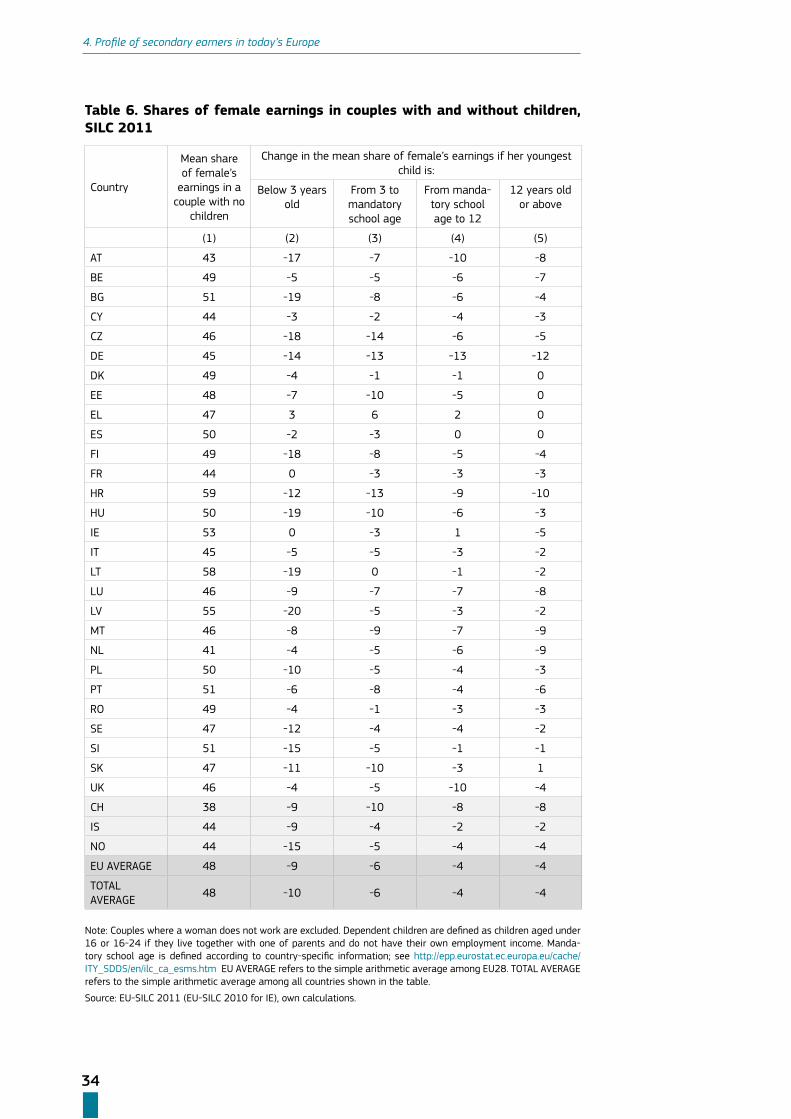
The age of children also matters. Childcare facilities for older children are usually more available and affordable.22 This makes it easier for both parents (and especial-ly for women) to combine work and family life. Table 6 sets out the mean shares of female’s earnings in couples with no dependent children (column 1). In columns 2 to 5 this is compared to the woman’s earnings share in couples with children, distin-guishing by the age of the youngest child. Negative numbers indicate a decrease in the share of female earnings.
In most countries, the mean share of female’s earnings in couples without children is larger than 45% or close to this threshold (with the lowest mean shares obser-ved in Austria, the Netherlands and Switzerland, countries characterized by high part-time employment). Having small children under 3 years old reduces women’s earnings capacity the most. In 14 countries (out of 31), the female’s earnings share in couples with children under 3 is at least 10 percentage points lower than in cou-ples with no children. This still holds in 9 countries (except Croatia) if women with children under one are excluded from estimation. In couples with older children, the mean share of the female’s earnings usually increases. In many countries (e.g. in FI, SE, HU, SI, BG, CZ, LT, LV, SK, NO), the difference between women’s and male’s earnings notably reduces as the age of the youngest child increases. However, this is not the case in Austria, Germany, Croatia and Switzerland, where the women’s earnings share is persistently lower in all couples with dependent children regardless of their age.
22 See for example European Commission (2013a).

33
4. Profile of secondary earners in today’s Europe
Table 5. Couples with dependent children as percentage of all couples, by share of female earnings, SILC 2011
CountryWoman has no earnings
Woman earns less than man
Roughly equal earnings*
Woman earns more than
man
Woman is the only earner
AT 75 56 38 28 35BE 61 67 59 52 43BG 69 66 61 51 45CY 62 70 64 74 38CZ 85 65 48 44 33DE 68 57 29 30 36DK 50 59 53 51 45EE 79 65 55 56 55EL 76 75 77 85 76ES 65 68 64 68 66FI 59 56 47 37 26FR 71 65 61 59 53HR 69 83 79 73 57HU 87 67 57 56 48IE 76 71 42 58 74IT 75 71 66 66 61LT 75 75 59 61 69LU 75 75 57 62 63LV 69 68 63 58 56MT 70 70 52 66 39NL 51 58 46 45 32PL 76 73 65 66 48PT 69 72 71 73 49RO 76 74 63 64 63SE 57 62 54 47 38SI 64 69 66 60 45SK 81 66 64 60 67UK 72 61 47 46 53CH 63 53 26 31 52IS 67 57 50 51 48NO 44 61 57 41 33EU AVERAGE 70 67 57 57 51TOTAL AVERAGE
69 66 56 55 50
Note: * A woman is considered to have earnings roughly equal to her partner’s if her share constitutes 45-55% of the combined earnings. Dependent children are defined as children aged under 16 or 16-24 if they live together with one of parents and do not have their own employment income. Numbers in bold indicate the couple type where the percentage of couples with children is the highest for a given country. EU AVERAGE refers to the simple arithmetic average among EU28. TOTAL AVERAGE refers to the simple arithmetic average among all countries shown in the table.
Source: EU-SILC 2011 (EU-SILC 2010 for IE), own calculations.
34
4. Profile of secondary earners in today’s Europe
Table 6. Shares of female earnings in couples with and without children, SILC 2011
Country
Mean share of female’s
earnings in a couple with no
children
Change in the mean share of female’s earnings if her youngest child is:
Below 3 years old
From 3 to mandatory school age
From manda-tory school age to 12
12 years old or above
(1) (2) (3) (4) (5)
AT 43 -17 -7 -10 -8
BE 49 -5 -5 -6 -7
BG 51 -19 -8 -6 -4
CY 44 -3 -2 -4 -3
CZ 46 -18 -14 -6 -5
DE 45 -14 -13 -13 -12
DK 49 -4 -1 -1 0
EE 48 -7 -10 -5 0
EL 47 3 6 2 0
ES 50 -2 -3 0 0
FI 49 -18 -8 -5 -4
FR 44 0 -3 -3 -3
HR 59 -12 -13 -9 -10
HU 50 -19 -10 -6 -3
IE 53 0 -3 1 -5
IT 45 -5 -5 -3 -2
LT 58 -19 0 -1 -2
LU 46 -9 -7 -7 -8
LV 55 -20 -5 -3 -2
MT 46 -8 -9 -7 -9
NL 41 -4 -5 -6 -9
PL 50 -10 -5 -4 -3
PT 51 -6 -8 -4 -6
RO 49 -4 -1 -3 -3
SE 47 -12 -4 -4 -2
SI 51 -15 -5 -1 -1
SK 47 -11 -10 -3 1
UK 46 -4 -5 -10 -4
CH 38 -9 -10 -8 -8
IS 44 -9 -4 -2 -2
NO 44 -15 -5 -4 -4
EU AVERAGE 48 -9 -6 -4 -4
TOTAL AVERAGE
48 -10 -6 -4 -4
Note: Couples where a woman does not work are excluded. Dependent children are defined as children aged under 16 or 16-24 if they live together with one of parents and do not have their own employment income. Manda-tory school age is defined according to country-specific information; see http://epp.eurostat.ec.europa.eu/cache/ITY_SDDS/en/ilc_ca_esms.htm EU AVERAGE refers to the simple arithmetic average among EU28. TOTAL AVERAGE refers to the simple arithmetic average among all countries shown in the table.
Source: EU-SILC 2011 (EU-SILC 2010 for IE), own calculations.
35
4. Profile of secondary earners in today’s Europe
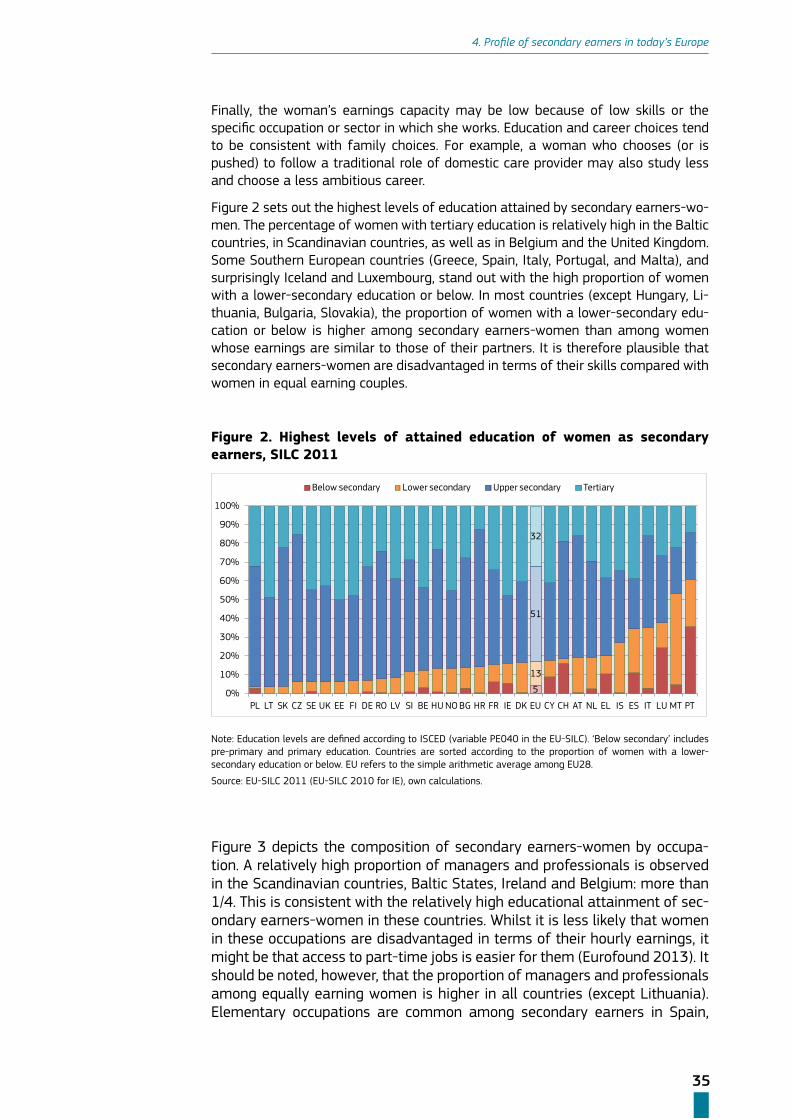
Finally, the woman’s earnings capacity may be low because of low skills or the specific occupation or sector in which she works. Education and career choices tend to be consistent with family choices. For example, a woman who chooses (or is pushed) to follow a traditional role of domestic care provider may also study less and choose a less ambitious career.
Figure 2 sets out the highest levels of education attained by secondary earners-wo-men. The percentage of women with tertiary education is relatively high in the Baltic countries, in Scandinavian countries, as well as in Belgium and the United Kingdom. Some Southern European countries (Greece, Spain, Italy, Portugal, and Malta), and surprisingly Iceland and Luxembourg, stand out with the high proportion of women with a lower-secondary education or below. In most countries (except Hungary, Li-thuania, Bulgaria, Slovakia), the proportion of women with a lower-secondary edu-cation or below is higher among secondary earners-women than among women whose earnings are similar to those of their partners. It is therefore plausible that secondary earners-women are disadvantaged in terms of their skills compared with women in equal earning couples.
Figure 2. Highest levels of attained education of women as secondary earners, SILC 2011
5
13
51
32
0%
10%
20%
30%
40%
50%
60%
70%
80%
90%
100%
PL LT SK CZ SE UK EE FI DE RO LV SI BE HU NO BG HR FR IE DK EU CY CH AT NL EL IS ES IT LU MT PT
Below secondary Lower secondary Upper secondary Tertiary
Note: Education levels are defined according to ISCED (variable PE040 in the EU-SILC). ‘Below secondary’ includes pre-primary and primary education. Countries are sorted according to the proportion of women with a lower-secondary education or below. EU refers to the simple arithmetic average among EU28.
Source: EU-SILC 2011 (EU-SILC 2010 for IE), own calculations.
Figure 3 depicts the composition of secondary earners-women by occupa-tion. A relatively high proportion of managers and professionals is observed in the Scandinavian countries, Baltic States, Ireland and Belgium: more than 1/4. This is consistent with the relatively high educational attainment of sec-ondary earners-women in these countries. Whilst it is less likely that women in these occupations are disadvantaged in terms of their hourly earnings, it might be that access to part-time jobs is easier for them (Eurofound 2013). It should be noted, however, that the proportion of managers and professionals among equally earning women is higher in all countries (except Lithuania). Elementary occupations are common among secondary earners in Spain,
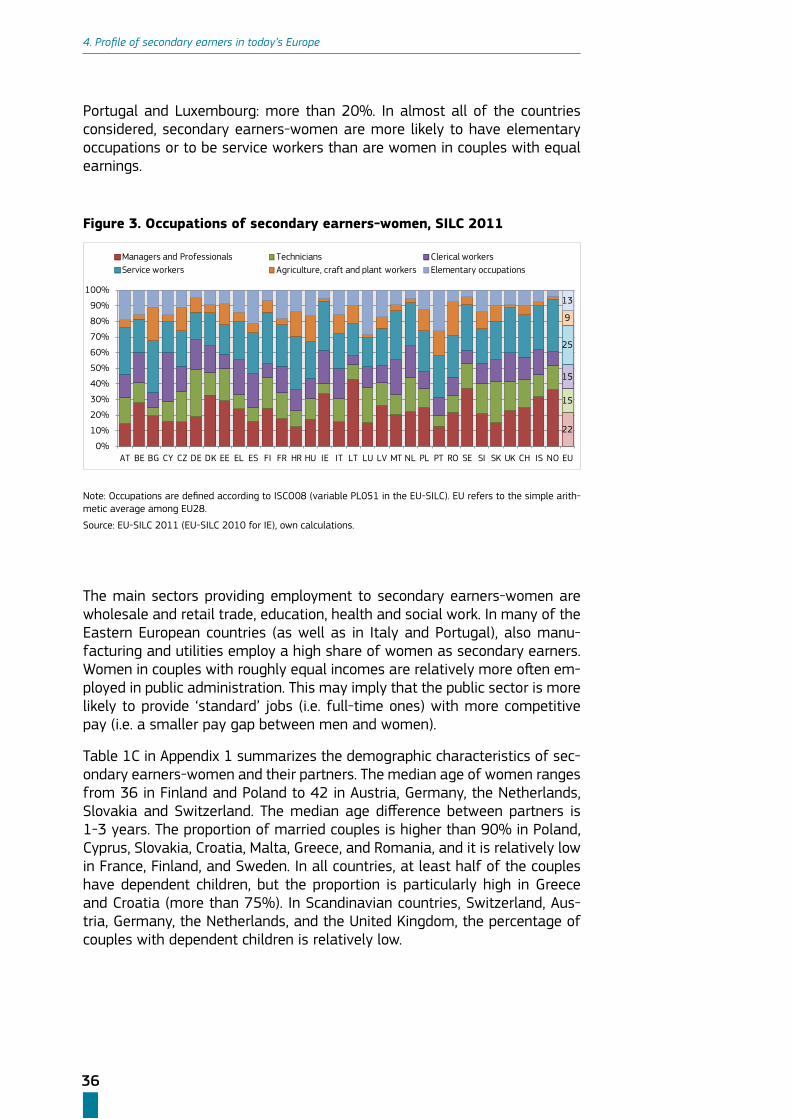
36
4. Profile of secondary earners in today’s Europe
Portugal and Luxembourg: more than 20%. In almost all of the countries considered, secondary earners-women are more likely to have elementary occupations or to be service workers than are women in couples with equal earnings.
Figure 3. Occupations of secondary earners-women, SILC 2011
22
15
15
25
9
13
0%
10%
20%
30%
40%
50%
60%
70%
80%
90%
100%
AT BE BG CY CZ DE DK EE EL ES FI FR HR HU IE IT LT LU LV MT NL PL PT RO SE SI SK UK CH IS NO EU
Managers and Professionals Technicians Clerical workersService workers Agriculture, craft and plant workers Elementary occupations
Note: Occupations are defined according to ISCO08 (variable PL051 in the EU-SILC). EU refers to the simple arith-metic average among EU28.
Source: EU-SILC 2011 (EU-SILC 2010 for IE), own calculations.
The main sectors providing employment to secondary earners-women are wholesale and retail trade, education, health and social work. In many of the Eastern European countries (as well as in Italy and Portugal), also manu-facturing and utilities employ a high share of women as secondary earners. Women in couples with roughly equal incomes are relatively more often em-ployed in public administration. This may imply that the public sector is more likely to provide ‘standard’ jobs (i.e. full-time ones) with more competitive pay (i.e. a smaller pay gap between men and women).
Table 1C in Appendix 1 summarizes the demographic characteristics of sec-ondary earners-women and their partners. The median age of women ranges from 36 in Finland and Poland to 42 in Austria, Germany, the Netherlands, Slovakia and Switzerland. The median age difference between partners is 1-3 years. The proportion of married couples is higher than 90% in Poland, Cyprus, Slovakia, Croatia, Malta, Greece, and Romania, and it is relatively low in France, Finland, and Sweden. In all countries, at least half of the couples have dependent children, but the proportion is particularly high in Greece and Croatia (more than 75%). In Scandinavian countries, Switzerland, Aus-tria, Germany, the Netherlands, and the United Kingdom, the percentage of couples with dependent children is relatively low.

37
4. Profile of secondary earners in today’s Europe
Figure 4. Economic sectors where secondary earners-women work, SILC 2011
14
18
88
13
16
22
0%
10%
20%
30%
40%
50%
60%
70%
80%
90%
100%
AT BE BG CY CZ DE DK EE EL ES FI FR HR HU IE IT LT LU LV MT NL PL PT RO SE SI SK UK CH IS NO EU
Mining, Manufacturing and Utilities Wholesale and retail tradeReal estate and business activities Public administration and defenceEducation Health and social workOther
Note: Economic sectors are defined according to NACE Rev.2 (variable PL111 in the EU-SILC). EU refers to the simple arithmetic average among EU28.
Source: EU-SILC 2011 (EU-SILC 2010 for IE), own calculations.
Table 1D shows the same list of demographic characteristics of couples as in Table 1C, but this time for couples where both partners earn roughly the same wage. The differences between the characteristics of the two types of couples are country-specific. For example, in Belgium, Ireland, Luxembourg, the Netherlands, the United Kingdom, Malta and Switzerland, the median age of partners in couples with similar earnings is lower than in couples where the woman earns less. This implies that, in these countries, earning patterns for partners start to diverge later in the life cycle (perhaps when couples have children) or that there is a tendency towards more equal earnings in the younger age cohorts. By contrast, in Finland, Sweden, Hungary, Slovenia, Lithuania, partners with unequal earnings tend to be younger. This is in line with the previous findings (Table 6), suggesting that inequality in earnings is a temporary phenomenon for mothers of small children. In many countries the proportion of married couples is considerably higher among couples with a secondary earner-woman, e.g. in Belgium, Ireland, Germany, the Nether-lands, Switzerland, as well as in Austria, Frances, and Luxembourg. In practi-cally all countries (except Greece), the percentage of couples with dependent children is lower among couples with equal earnings.
The share of couples with secondary earners-men is relatively low. However, it has been growing in recent years given the adverse effect of the crisis on men (Bettio et al. 2013). Small sample size prevents detailed analysis of the group of male secondary earners. However, there is no doubt that the characteristics of couples with secondary earners-women and secondary earners-men are very different, and so are the reasons for the low earning capacity of one of the partners. Table 1E in Appendix 1 shows the distri-bution of secondary earners-men according to their activity status during the income reference period. The share of male secondary earners working part time and performing domestic tasks is lower than the respective shares among secondary earners-women in practically all countries. Conversely, the

38
5. Work incentives for secondary earners
percentage of men experiencing at least one month of unemployment is con-siderably higher. Given substantial differences between secondary earners-men and women, the next chapter considers them separately.
39
5. Work incentives for secondary earners
5. Work incentives for secondary earners
This chapter analyses work incentives for secondary earners by estimating two sta-tic indicators: the Marginal Effective Tax Rate (METR) and the Participation Tax Rate (PTR) defined in Box 2.
Section 5.1 uses EUROMOD to estimate work incentives for the real population based on the EU-SILC microdata. This approach makes it possible to account for the socio-economic differences found within the population. EUROMOD is used to analyse the actual distribution of METR across the population of secondary earners, as well as to disentangle the impact of benefits, taxes, and social contributions on particularly high METR.
Sections 5.2 and 5.3 uses a modified version of the OECD tax-benefit model to cal-culate work-related fiscal incentive effects on family types. The standard version of the OECD tax-benefit model is the one currently adopted by both OECD and EC (see e.g. OECD 2013 and EC 2013b). It considers ‘synthetic’ households with characteri-stics and earnings defined a-priori rather than being based on actual data, e.g. ‘his’ earnings are fixed at 67% of the national wage and ‘her’ earnings are fixed at 33% of the national wage. Analysis based on ‘synthetic’ households provides an illu-strative way to understand the mechanisms built into tax-benefit systems, but the prevalence of such households in the population may differ across countries. Our modified version uses actual earnings figures drawn from EU-SILC 2011 data thus reflecting the actual distribution of households types. For example, figures for the earnings of female secondary earners are the average, actual, earnings of female employees in the country who contribute less than 45% of the joint labour income of the couple. The key message is that some of the real-life complexity is put back into the calculations with OECD models. Also, by feeding into the model the same data on earnings that the EUROMOD exploits we enhance comparability between the estimates that the two modes yield.
Our modified OECD model will in fact be put to a double use: (i) checking the ro-bustness of the current METR estimates obtained by means of EUROMOD, and (ii) estimating current PTR for individuals considering entry or re-entry into the labour market (potential secondary earners).

40
5. Work incentives for secondary earners
Box 2. Definition of work incentive indicators used in the report
METR (Marginal Effective Tax Rate) is the indicator that can be used to measu-re the extent to which taxes, social insurance contributions and benefits affect the financial gain from work. It measures the share of additional earnings ‘taxed away’ through the combined effect of increasing taxes, social insurance contributions and decreasing benefits. It is defined as:
i
hh
EYMETR∆∆
−= 1
where iE∆ - change in individual gross earnings, hhY∆ - change in household dispo-sable income after all the taxes and benefits have been applied.
Estimation of METR in EUROMOD and in OECD tax-benefit model is based on the same formula. However, there are little differences in how the formula is applied.
In EUROMOD METR is estimated by increasing individual gross earnings (observed in the input data) by 3%. This corresponds to approximately one additional hour of work per week for a full-time worker. The values of METR are estimated for each individual with positive earnings. The result is the distribution of METR that appro-ximates the true distribution in the population. It can be summarized by looking at the mean, median value of METR or other summary statistic.
In the OECD tax-benefit model the level of earnings at which METR is estimated is defi-ned by the user (e.g. 100% of the average wage). The increase in gross earnings is equal to 1% of the average wage. The model can produce METR estimates at the chosen points in the interval of earnings, e.g. from 0 to 200% of the average wage (with a step of 1%). The result is a ‘synthetic’ (uniform) distribution of METR covering an interval of plausible earnings. It also can be characterized by its mean or median values.
PTR (Participation Tax Rate)* is the indicator that measures how the transition of an individual from non-employment to employment affects household disposa-ble income. It is defined in a similar way as METR, however the initial earnings are zero and the increase is equal to earnings in a new job:
OWiIWi
OWhhIWhh
i
hh
EEYY
EYPTR
−−
−=∆∆
−= 11
where indices IW and OW stand for ‘in-work’ and ‘out-of-work’, and OWiE is zero.
Calculation of PTR involves some assumptions regarding the level of wage at which a non-employed person enters employment. In EUROMOD this requires estimation of individual wages for potential entrants using, for example, a wage equation. As this is outside the scope of this study, EUROMOD estimates of PTR are not available in this report. In OECD model the wage is defined by the user in the same way as it is done for the estimation of METR. Unlike METR, PTR are calculated for a single point (i.e. for the assumed level of wage). In this report we present PTR values calculated at three different levels of wages (low, medium and high).
* Note that in OECD publications the same measure is referred to as AETR (Average Effective Tax Rate) (see e.g. OECD 2007, p.107), whereas Carone et al. (2004) call it METRit (the index stands for inactivity trap). In this report we choose to call it PTR which is the name usually used in academic publications (see e.g. Adam et al. 2006) and which better reflects the meaning of this indicator.
41
5. Work incentives for secondary earners
5.1. The estimates of Marginal Effective Tax Rates based on EU-
ROMOD
This section analyses work incentives for secondary earners using the EU tax-be-nefit microsimulation model EUROMOD. EUROMOD is a static tax-benefit microsi-mulation model that estimates, in a comparable manner, the effects of taxes and benefits on income distribution, work incentives, and public budgets for each of the EU Member States and the EU as a whole. EUROMOD operates on anonymized EU-SILC cross-sectional microdata. Technical information about EUROMOD and its design can be found in Appendix 3.
Unlike the OECD tax-benefit model for family types, EUROMOD estimates work in-centives for a representative sample of the actual population based on the EU-SILC microdata. The advantage of this approach is that the diversity of secondary ear-ners in each country can be taken into account: the structure of households in which secondary earners live, and the precise level of employment income, and income from other sources of all household members. The use of microdata makes it pos-sible to look at the distribution of work incentives within the target group.
This section reports estimation of the METR for the pool of secondary earners-women as they are defined in Chapter 4. Estimates for other population groups are provided in Section 5.1.1. to assess work incentives for secondary earners within the country’s context.
Figure 5 shows the distribution of the METR for secondary earners-women: the mean, the median, and the distance between the 25th and the 75th percentiles. The highest median METR (above 40%) are observed in Belgium, Germany, and Denmark. These are also the countries characterised by high METR for the popula-tion at large (Jara and Tumino, 2013). The lowest median METR are in Cyprus and Austria: below 20%.
The values for the 25th and the 75th percentiles provide insight into the variation of METR within the respective population groups. For example, in Cyprus and Austria the median METR are quite low. However, the METR for the 75th percentile are con-siderably higher. This implies that a substantial proportion of secondary earners-women in these countries have relatively high METR (e.g. as high as 40% in Austria). Conversely, in Spain a sizable proportion of women have relatively low METR (close to 10%). In Ireland, the distribution of METR is quite wide, with both low and high values present.
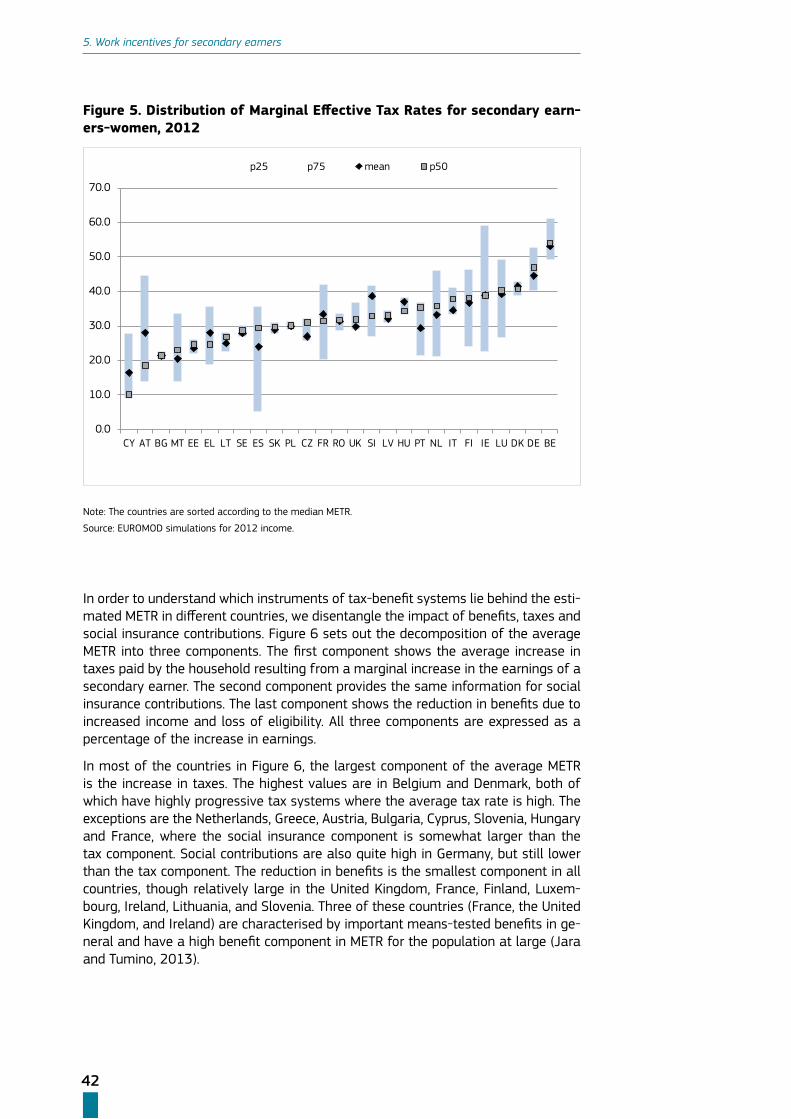
42
5. Work incentives for secondary earners
Figure 5. Distribution of Marginal Effective Tax Rates for secondary earn-ers-women, 2012
0.0
10.0
20.0
30.0
40.0
50.0
60.0
70.0
CY AT BG MT EE EL LT SE ES SK PL CZ FR RO UK SI LV HU PT NL IT FI IE LU DK DE BE
p25 p75 mean p50
Note: The countries are sorted according to the median METR.
Source: EUROMOD simulations for 2012 income.
In order to understand which instruments of tax-benefit systems lie behind the esti-mated METR in different countries, we disentangle the impact of benefits, taxes and social insurance contributions. Figure 6 sets out the decomposition of the average METR into three components. The first component shows the average increase in taxes paid by the household resulting from a marginal increase in the earnings of a secondary earner. The second component provides the same information for social insurance contributions. The last component shows the reduction in benefits due to increased income and loss of eligibility. All three components are expressed as a percentage of the increase in earnings.
In most of the countries in Figure 6, the largest component of the average METR is the increase in taxes. The highest values are in Belgium and Denmark, both of which have highly progressive tax systems where the average tax rate is high. The exceptions are the Netherlands, Greece, Austria, Bulgaria, Cyprus, Slovenia, Hungary and France, where the social insurance component is somewhat larger than the tax component. Social contributions are also quite high in Germany, but still lower than the tax component. The reduction in benefits is the smallest component in all countries, though relatively large in the United Kingdom, France, Finland, Luxem-bourg, Ireland, Lithuania, and Slovenia. Three of these countries (France, the United Kingdom, and Ireland) are characterised by important means-tested benefits in ge-neral and have a high benefit component in METR for the population at large (Jara and Tumino, 2013).
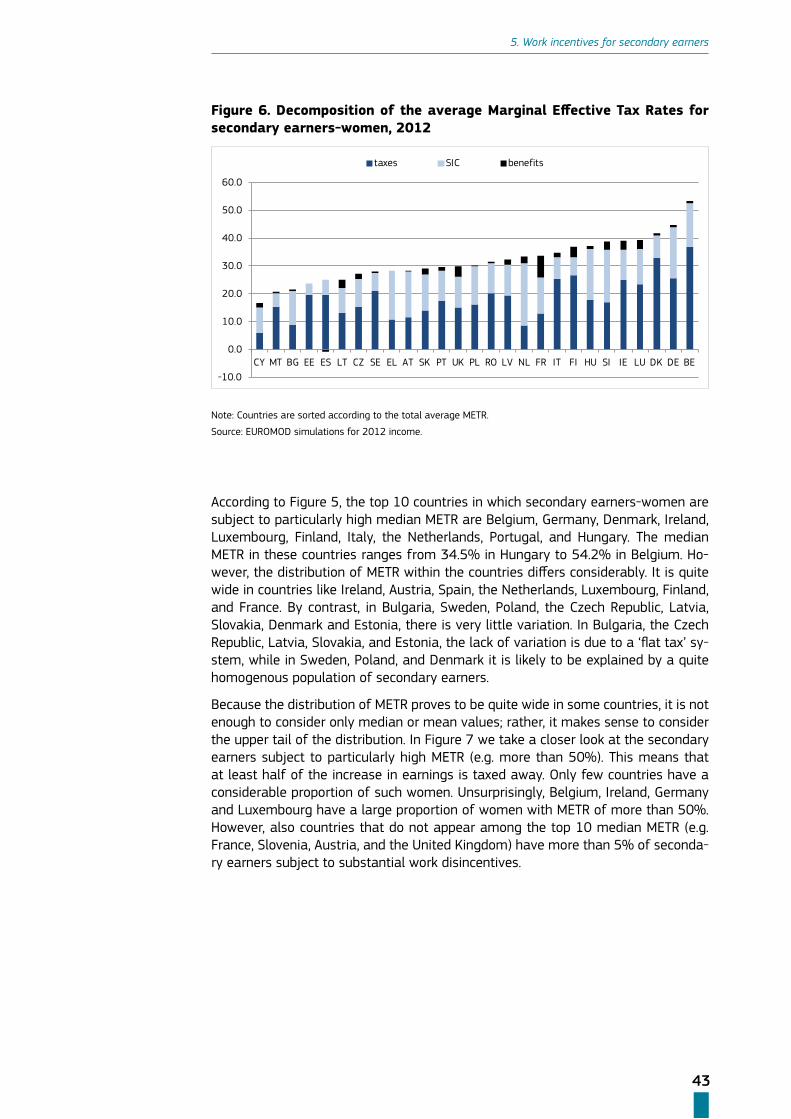
43
5. Work incentives for secondary earners
Figure 6. Decomposition of the average Marginal Effective Tax Rates for secondary earners-women, 2012
-10.0
0.0
10.0
20.0
30.0
40.0
50.0
60.0
CY MT BG EE ES LT CZ SE EL AT SK PT UK PL RO LV NL FR IT FI HU SI IE LU DK DE BE
taxes SIC benefits
Note: Countries are sorted according to the total average METR.
Source: EUROMOD simulations for 2012 income.
According to Figure 5, the top 10 countries in which secondary earners-women are subject to particularly high median METR are Belgium, Germany, Denmark, Ireland, Luxembourg, Finland, Italy, the Netherlands, Portugal, and Hungary. The median METR in these countries ranges from 34.5% in Hungary to 54.2% in Belgium. Ho-wever, the distribution of METR within the countries differs considerably. It is quite wide in countries like Ireland, Austria, Spain, the Netherlands, Luxembourg, Finland, and France. By contrast, in Bulgaria, Sweden, Poland, the Czech Republic, Latvia, Slovakia, Denmark and Estonia, there is very little variation. In Bulgaria, the Czech Republic, Latvia, Slovakia, and Estonia, the lack of variation is due to a ‘flat tax’ sy-stem, while in Sweden, Poland, and Denmark it is likely to be explained by a quite homogenous population of secondary earners.
Because the distribution of METR proves to be quite wide in some countries, it is not enough to consider only median or mean values; rather, it makes sense to consider the upper tail of the distribution. In Figure 7 we take a closer look at the secondary earners subject to particularly high METR (e.g. more than 50%). This means that at least half of the increase in earnings is taxed away. Only few countries have a considerable proportion of such women. Unsurprisingly, Belgium, Ireland, Germany and Luxembourg have a large proportion of women with METR of more than 50%. However, also countries that do not appear among the top 10 median METR (e.g. France, Slovenia, Austria, and the United Kingdom) have more than 5% of seconda-ry earners subject to substantial work disincentives.
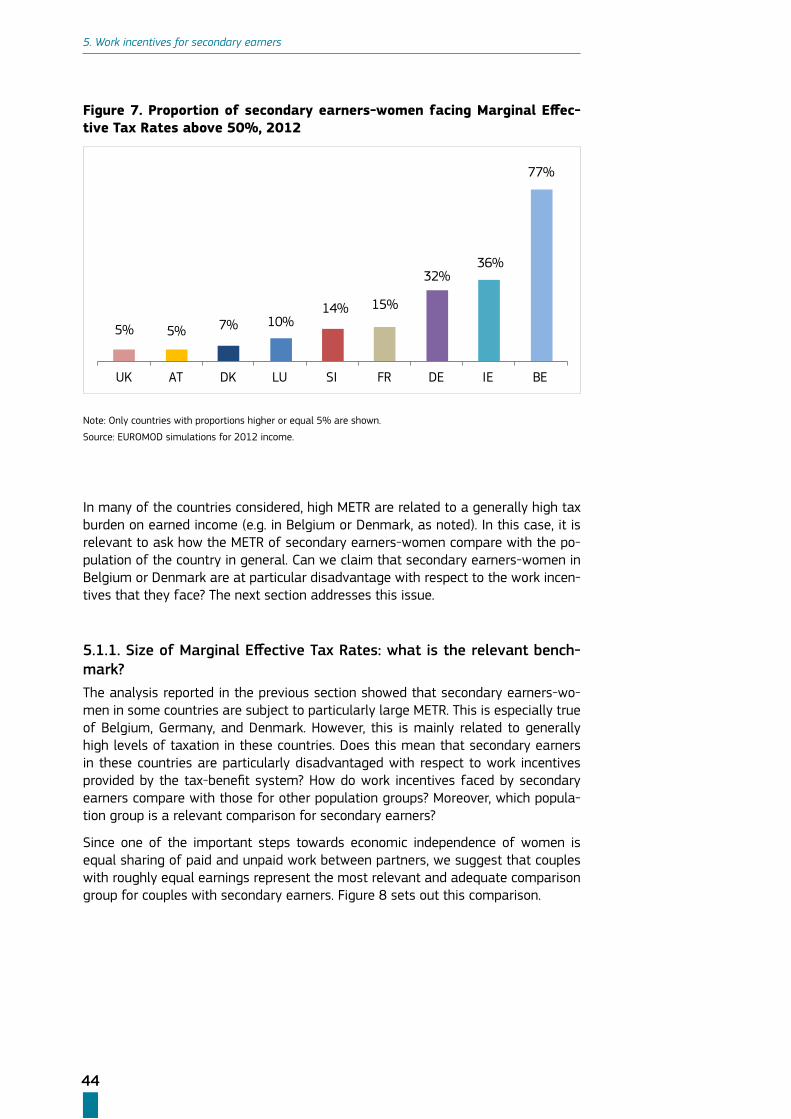
44
5. Work incentives for secondary earners
Figure 7. Proportion of secondary earners-women facing Marginal Effec-tive Tax Rates above 50%, 2012
5% 5% 7% 10%14% 15%
32%36%
77%
UK AT DK LU SI FR DE IE BE
Note: Only countries with proportions higher or equal 5% are shown.
Source: EUROMOD simulations for 2012 income.
In many of the countries considered, high METR are related to a generally high tax burden on earned income (e.g. in Belgium or Denmark, as noted). In this case, it is relevant to ask how the METR of secondary earners-women compare with the po-pulation of the country in general. Can we claim that secondary earners-women in Belgium or Denmark are at particular disadvantage with respect to the work incen-tives that they face? The next section addresses this issue.
5.1.1. Size of Marginal Effective Tax Rates: what is the relevant bench-mark?The analysis reported in the previous section showed that secondary earners-wo-men in some countries are subject to particularly large METR. This is especially true of Belgium, Germany, and Denmark. However, this is mainly related to generally high levels of taxation in these countries. Does this mean that secondary earners in these countries are particularly disadvantaged with respect to work incentives provided by the tax-benefit system? How do work incentives faced by secondary earners compare with those for other population groups? Moreover, which popula-tion group is a relevant comparison for secondary earners?
Since one of the important steps towards economic independence of women is equal sharing of paid and unpaid work between partners, we suggest that couples with roughly equal earnings represent the most relevant and adequate comparison group for couples with secondary earners. Figure 8 sets out this comparison.
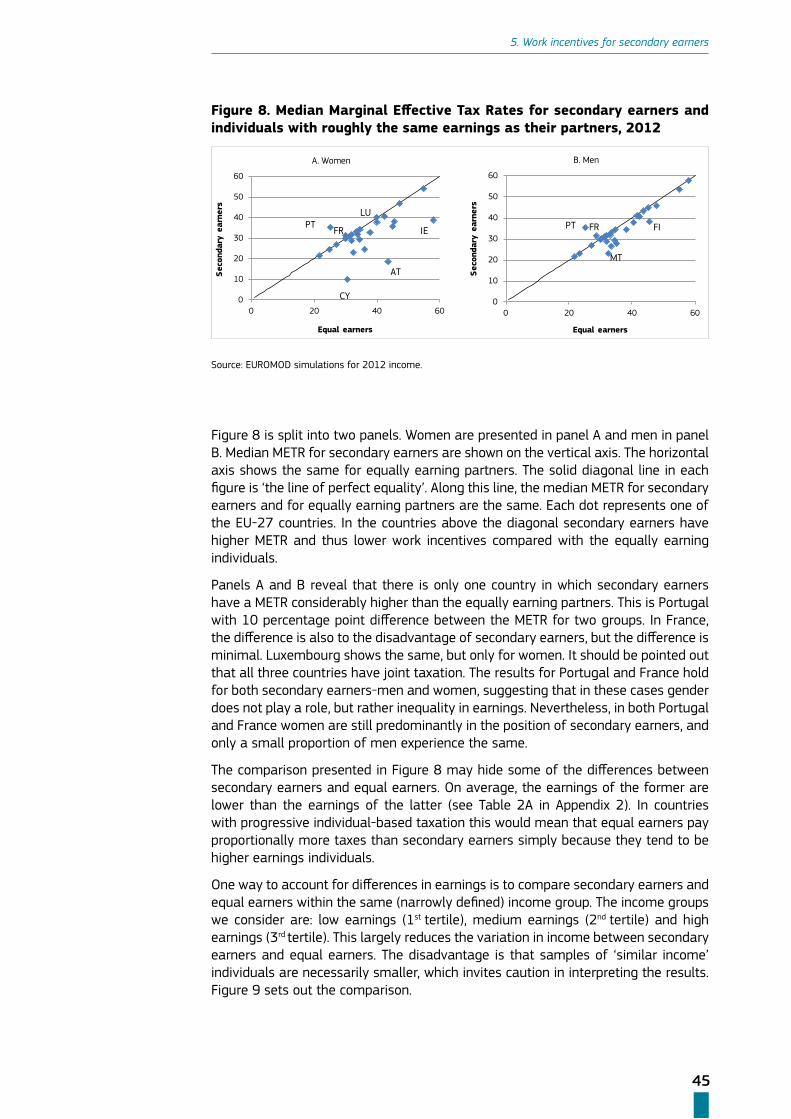
45
5. Work incentives for secondary earners
Figure 8. Median Marginal Effective Tax Rates for secondary earners and individuals with roughly the same earnings as their partners, 2012
0
10
20
30
40
50
60
0 20 40 60
Seco
ndar
y ea
rner
s
Equal earners
A. Women
PTFR
CY
AT
IE
LU
0
10
20
30
40
50
60
0 20 40 60
Seco
ndar
y ea
rner
s
Equal earners
B. Men
PT FR
MT
FI
Source: EUROMOD simulations for 2012 income.
Figure 8 is split into two panels. Women are presented in panel A and men in panel B. Median METR for secondary earners are shown on the vertical axis. The horizontal axis shows the same for equally earning partners. The solid diagonal line in each figure is ‘the line of perfect equality’. Along this line, the median METR for secondary earners and for equally earning partners are the same. Each dot represents one of the EU-27 countries. In the countries above the diagonal secondary earners have higher METR and thus lower work incentives compared with the equally earning individuals.
Panels A and B reveal that there is only one country in which secondary earners have a METR considerably higher than the equally earning partners. This is Portugal with 10 percentage point difference between the METR for two groups. In France, the difference is also to the disadvantage of secondary earners, but the difference is minimal. Luxembourg shows the same, but only for women. It should be pointed out that all three countries have joint taxation. The results for Portugal and France hold for both secondary earners-men and women, suggesting that in these cases gender does not play a role, but rather inequality in earnings. Nevertheless, in both Portugal and France women are still predominantly in the position of secondary earners, and only a small proportion of men experience the same.
The comparison presented in Figure 8 may hide some of the differences between secondary earners and equal earners. On average, the earnings of the former are lower than the earnings of the latter (see Table 2A in Appendix 2). In countries with progressive individual-based taxation this would mean that equal earners pay proportionally more taxes than secondary earners simply because they tend to be higher earnings individuals.
One way to account for differences in earnings is to compare secondary earners and equal earners within the same (narrowly defined) income group. The income groups we consider are: low earnings (1st tertile), medium earnings (2nd tertile) and high earnings (3rd tertile). This largely reduces the variation in income between secondary earners and equal earners. The disadvantage is that samples of ‘similar income’ individuals are necessarily smaller, which invites caution in interpreting the results. Figure 9 sets out the comparison.
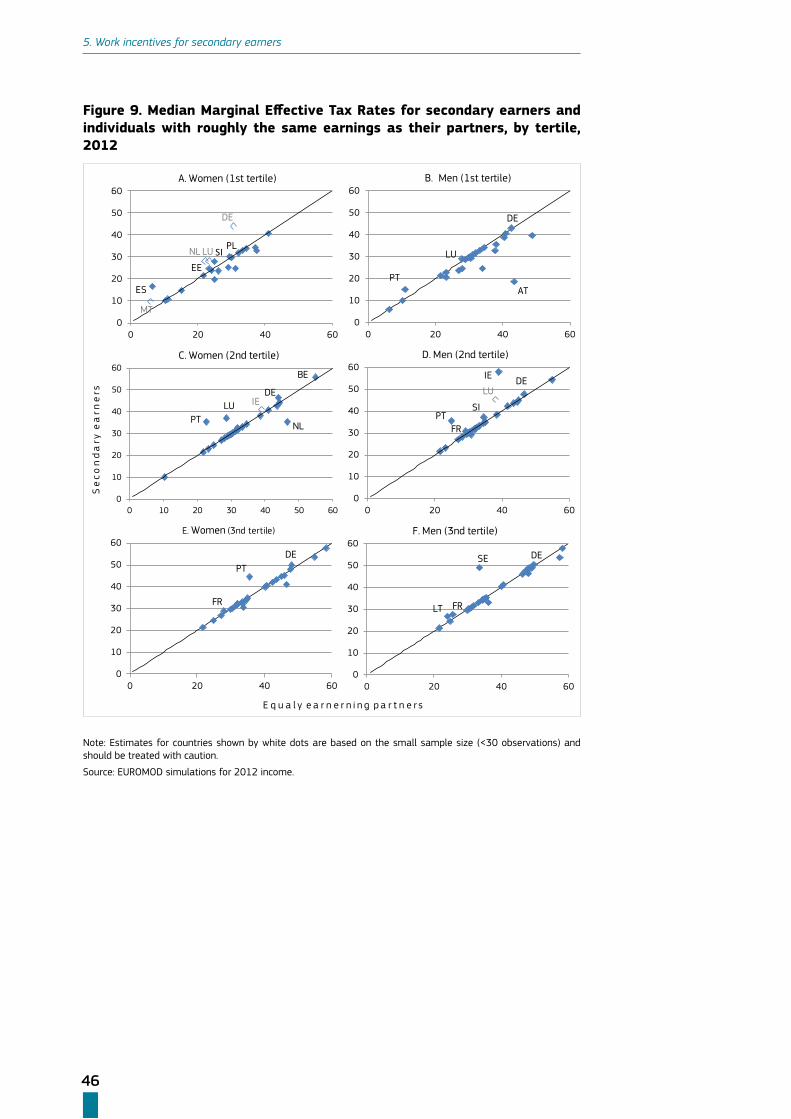
46
5. Work incentives for secondary earners
Figure 9. Median Marginal Effective Tax Rates for secondary earners and individuals with roughly the same earnings as their partners, by tertile, 2012
0
10
20
30
40
50
60
0 10 20 30 40 50 60
C. Women (2nd tertile)
PTLU
NL
DE
BE
IE
0
10
20
30
40
50
60
0 20 40 60
A. Women (1st tertile)
SI
ES
DE
MT
NL LU
EE
PL
0
10
20
30
40
50
60
0 20 40 60
B. Men (1st tertile)
PTAT
LU
DE
0
10
20
30
40
50
60
0 20 40 60
D. Men (2nd tertile)
PT
IE
SI
LU
FR
DE
0
10
20
30
40
50
60
0 20 40 60
E. Women (3nd tertile)
PT
FR
DE
0
10
20
30
40
50
60
0 20 40 60
F. Men (3nd tertile)
LT
SE
FR
DE
E q u a l y e a r n e r n i n g p a r t n e r s
Se
co
nd
ary
ea
rne
rs
Note: Estimates for countries shown by white dots are based on the small sample size (<30 observations) and should be treated with caution.
Source: EUROMOD simulations for 2012 income.

47
5. Work incentives for secondary earners
Box. 3 Choosing the relevant benchmark
In Section 5.1.1 women who are secondary earners are compared to women in couples where partners earn roughly the same. This comparison is complicated by the fact that in reality secondary earners are likely to earn less than equally earning individuals. In order to account for this, we select women with roughly similar level of earnings from the two groups of interest and compare them to each other (Figure 9, panels A, C, E).
In a stylized way this comparison can be shown as follows:
Couple with a secondary earner
Couple with equally earning partners
(1) She earns X
He earns Y
( X< Y )
She earns X
He earns X
In individual taxation systems this type of comparison largely removes the effect of progressivity. In a joint taxation system the disadvantage that secondary earners face is intrinsically due to progressivity and it is thus aptly captured by the com-parison. The drawback is that, by construction, balanced couples have lower joint earnings than unbalanced couples. This means that at low levels of earnings ba-lanced couples are more likely to receive means-tested benefits than couples with secondary earners. Withdrawal of these benefits from equally earning couples (due to a marginal increase in her earnings) may offset some of the otherwise important differences between the two groups.
An alternative option is to choose a benchmark that keeps couple’s joint earnings at the same level:
Couple with a secondary earner
Couple with equally earning partners
(2) She earns X
He earns Y
( X< Y )
She earns Z
He earns Z
( Z+Z ) = ( X+Y )
This benchmark, however, removes the effect of taxation progressivity in individual taxation systems only partially. And in case of joint taxation (in its pure form where the income of both partners is pooled and assessed together) this type of compari-son will not show higher work disincentives for the secondary earner because joint income does not change. The advantage of using this benchmark is that couples in joint taxation systems would be affected similarly to those in individual systems by reductions or withdrawals of means-tested benefits based on family income. It can also capture some non-linearities in joint taxation that penalize secondary earners.

48
5. Work incentives for secondary earners
The third possible option is to keep the earnings of the main earner constant:
Couple with
a secondary earner
Couple with equally earning partners
(3) She earns X
He earns Y
( X< Y )
She earns Y
He earns Y
This case represents the ‘natural’ benchmark. Here a couple becomes balanced when the secondary earner moves up to the position of equal earner. Though this is what one would expect to happen in reality it implies, by construction, that cou-ples with a secondary earner have lower income and are likely to be exposed to withdrawal of means-tested benefits more than balanced couples. This clouds the interpretation of results. In individual taxation systems, moreover, results are fur-ther clouded because they also reflect progressivity.
Joint taxation is supposedly one of the main elements of tax-benefit systems that affects negatively work incentives for secondary earners. The first benchmark is well suited to capture such cases. This is why we give preference to the first benchmark. For comparison, we also provide the results which rely on benchmarks 2 and 3 (see Appendix 4).
The main finding is that secondary earners face higher METR than equal earners in twelve countries compared to the three identified in Figure 8. Portugal, France, and Luxembourg are still in the picture. For Portugal, the largest differences are observed in the middle-income group (i.e. the 2nd tertile). In France, the disadvanta-ges faced by secondary earners are still marginal, and are likely to show up in the top income group (and also in the middle-income group for men). Disincentives for secondary earners-women in Luxembourg appear more clearly after the split in the middle-income group. Similar disincentives may occur for men as well; however, the sample is too small to reach a confident conclusion.
The new countries above the diagonal are: Belgium, Germany, Estonia, Spain, Ire-land, Lithuania, Poland, Sweden, and Slovenia. Germany, with small discrepancies in favour of balanced couples, appears in almost all panels of the figure. In Spain, Estonia, Poland and Slovenia, secondary earners-women in the low-income group are likely to face higher METR than women in balanced couples. The difference is especially large in Spain. However, despite being at a disadvantage, secondary ear-ners in Spain still face the 5th lowest METR among the EU27 (16.8%). Small diffe-rences (around 1 p.p.) to the disadvantage of secondary earners are also observed for women in Belgium (2nd tertile).
When we compare men, Ireland, Lithuania and Sweden show up as countries where male secondary earners have substantially lower work incentives than those part-nered with equal earnings spouses. Although this is an interesting result, it deserves further investigation as the sample size for men is just above the critical threshold, especially in the case of Sweden and Ireland where discrepancies are relatively large.
49
5. Work incentives for secondary earners
The comparison in Figure 9 is an attempt to account for difference in earnings between secondary earners and individuals in balanced couples. But it does not ac-count for differences in other characteristics between the two groups. Couples with a secondary earner-woman or man will be somewhat different from couples with both partners earning equally (as was shown by descriptive analysis in Chapter 4). Different characteristics imply differing eligibility for benefits and liability for taxes. Thus, the analysis presented above does identify differences in work incentives that we observe in real world, but it does not claim that the differences are due solely to imbalance between the earnings of the partners.
Box. 4 Comparison of our findings to existing studies
Previous research by OECD and EC (OECD 2012, EC 2013) identified France and Germany as countries where secondary earners women are penalized by marginal effective taxation. Results presented in this section support these findings partially. We also find that secondary earners in Germany and France face higher work disin-centives than women in couples with balanced earnings. However, the discrepancies between the two groups are not substantial. Moreover we find that several other countries show similar or larger disadvantages for secondary earners (Portugal, Belgium, Estonia, Greece, Spain, Ireland, Lithuania, Poland, Sweden, and Slovenia).
Such discrepancy in results is due to differences in methodology. Our estimates con-sider households as they are actually observed in the population whereas estimates from both the OECD and EC refer to ‘synthetic’ households. To the extent that the characteristics of synthetic households differ from those of actual households the respective results are bound to differ.
The benchmark used for comparison is also different. The studies by OECD and EC (see for example, OECD, 2012: Tab. III.A5.1, p. 253) assume that the combined earnings of partners are the same for unbalanced and balanced couples. This corre-sponds to benchmark 2 in Box 3, whereas we use benchmark 1.
5.1.2. Marginal Effective Tax Rates for women with and without childrenIn many countries, tax-benefit systems are designed to support families with children and to prevent poverty among children through child-related benefits or child-related tax reliefs. Eligibility for these elements of tax-benefit systems is often linked with the level of income of an individual or a family. While providing financial support, such policies may at the same time create additional work disincentives for parents (or for one of the parents). To see whether in some countries the competing objectives of child support and stimulating labour force participation of women conflict with each other, we compare METR for secondary earners-women with and without children in Table 7.
Column 1 in Table 7 shows the median METR for secondary earners-women without children. The differences between the latter and the median METR for women with children (distinguishing by the age of the youngest child) are shown in columns 2, 3, 4, and 5. In the majority of countries, the median METR for all five groups are quite similar. However, in Belgium, Finland, Greece, Ireland, Luxembourg, and the United Kingdom, secondary earners-women with children face higher median METR than do women without children (by more than 1 p.p). In Ireland and the United Kingdom, slightly higher work disincentives seem to arise only for mothers with children below
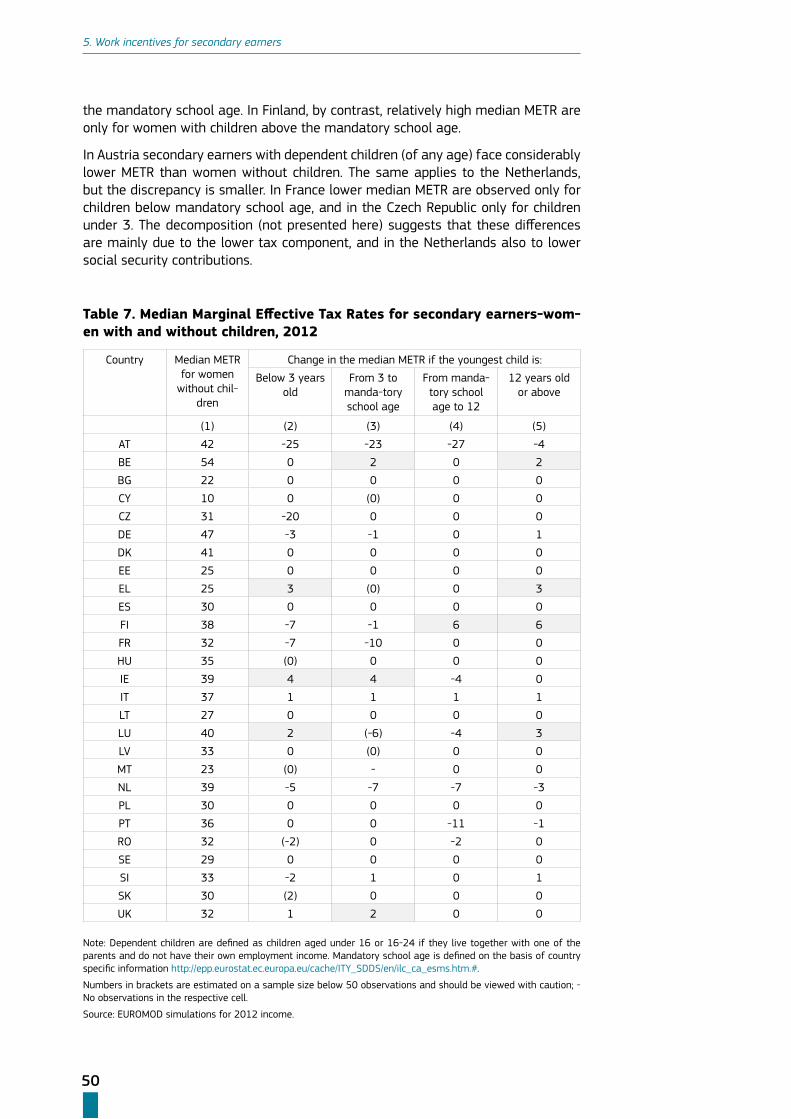
50
5. Work incentives for secondary earners
the mandatory school age. In Finland, by contrast, relatively high median METR are only for women with children above the mandatory school age.
In Austria secondary earners with dependent children (of any age) face considerably lower METR than women without children. The same applies to the Netherlands, but the discrepancy is smaller. In France lower median METR are observed only for children below mandatory school age, and in the Czech Republic only for children under 3. The decomposition (not presented here) suggests that these differences are mainly due to the lower tax component, and in the Netherlands also to lower social security contributions.
Table 7. Median Marginal Effective Tax Rates for secondary earners-wom-en with and without children, 2012
Country Median METR for women
without chil-dren
Change in the median METR if the youngest child is:
Below 3 years old
From 3 to manda-tory school age
From manda-tory school age to 12
12 years old or above
(1) (2) (3) (4) (5)
AT 42 -25 -23 -27 -4
BE 54 0 2 0 2
BG 22 0 0 0 0
CY 10 0 (0) 0 0
CZ 31 -20 0 0 0
DE 47 -3 -1 0 1
DK 41 0 0 0 0
EE 25 0 0 0 0
EL 25 3 (0) 0 3
ES 30 0 0 0 0
FI 38 -7 -1 6 6
FR 32 -7 -10 0 0
HU 35 (0) 0 0 0
IE 39 4 4 -4 0
IT 37 1 1 1 1
LT 27 0 0 0 0
LU 40 2 (-6) -4 3
LV 33 0 (0) 0 0
MT 23 (0) - 0 0
NL 39 -5 -7 -7 -3
PL 30 0 0 0 0
PT 36 0 0 -11 -1
RO 32 (-2) 0 -2 0
SE 29 0 0 0 0
SI 33 -2 1 0 1
SK 30 (2) 0 0 0
UK 32 1 2 0 0
Note: Dependent children are defined as children aged under 16 or 16-24 if they live together with one of the parents and do not have their own employment income. Mandatory school age is defined on the basis of country specific information http://epp.eurostat.ec.europa.eu/cache/ITY_SDDS/en/ilc_ca_esms.htm.#.
Numbers in brackets are estimated on a sample size below 50 observations and should be viewed with caution; - No observations in the respective cell.
Source: EUROMOD simulations for 2012 income.
51
5. Work incentives for secondary earners
It should be clarified that the results presented in Table 7 (as well as other results based on EUROMOD simulations presented in this report) do not consider the incre-ase in out-of-pocket childcare costs when the secondary earner’s wage increases. Calculations of METR in EUROMOD are based on a marginal increase in earnings (by 3%).23 This is a small increase that is better conceived as an increase arising from exerting more effort, increased productivity, promotion, or moving to a better paid job. In this case, it is reasonable to assume that the childcare choices of individuals will not be affected by a small increase in the wage. Of course, when more substan-tial increases in earnings are considered, e.g. when a part-time worker moves to a full-time job, it is important to take childcare into account, because the associated cost may be an important obstacle to an increase in working hours. The next chap-ter, based on the OECD tax-benefit model, will address this issue.
5.2. Comparing the estimates of Marginal Effective Tax Rates from
EUROMOD and the OECD tax-benefit model
In order to assess robustness of the above findings this section will compare esti-mates from the EUROMOD to those from the OECD model. Should the two model yield fairly similar results, we’ll take this to indicate robustness. Recall that we shall be using here the modified version of the OECD model which relies on the same source of data for earnings as the EUROMOD (i.e. EU-SILC 2011).
Table 8 sets out the values of METR for secondary earners obtained from EUROMOD and the OECD model. Table 8.1 stands for childless couples, table 8.2 for couples with children. For each of these two family types we report mean and median va-lues of METR. The values of median METR are either the same or differ by less than 1 p.p. for 15 out of the 26 countries covered by both of the models. For six countries, the differences are minor, within 5%. Only for Greece and the Netherlands (Malta and Portugal only for couples without children) do we find higher differences in the values of METR, but they do not exceed 10 p.p.
The key message to emerge from the above comparison is that the two models yield fairly consistent results for METR values once both sets of calculations use real earnings from the same data source. Having ascertained (broad) comparability, in the next section we further exploit the (modified) OECD model in order to compu-te the tax burden on potential entrants.24
23 If the hourly wage is fixed, this increase would roughly correspond to an increase in working time by 1 hour per week for a full-time employee.
24 In EUROMOD calculation of PTR requires estimation of individual wages for potential entrants us-ing, for example, wage equation. As this is outside the scope of this study, EUROMOD estimates of PTR are not available in this report.

52
5. Work incentives for secondary earners
Table 8. Comparison between Marginal Effective Tax Rates for secondary earners obtained using EUROMOD and the OECD tax-benefit model, 2012
8.1. Couples without children 8.2. Couples with children
Country
EUROMOD OECD
Mean Median Mean Median
(1) (2) (3) (4)
AT 30.6 42 32.2 44.4BE 51.7 53.8 51.1 53.8BG 21 21.6 21.6 21.6CY 15.4 10.3 - -CZ 27.8 31.1 24.5 31.1DE 45.5 47.3 46.1 47.9DK 42.4 40.9 44.8 40.9EE 23.6 24.8 24.8 24.8EL 27.1 24.9 19.8 17.3ES 24.7 29.5 25.7 29.5FI 38.9 38.5 30.9 36.7FR 35.1 31.6 31.1 31.8HU 37.9 34.5 35.8 34.5IE 37.3 39 32.5 31IT 34.2 37.4 34.7 39.3LT 23.2 27 22.2 27LU 38.3 40.4 41.7 43.2LV 31.8 33.3 32.1 33.3MT 20.9 23.2 26.1 32.3NL 35.7 39.4 38.4 47.7PL 30.2 30.3 29.8 30.3PT 31.2 35.5 26.8 25RO 31.4 31.9 29.4 29.9SE 27.4 28.9 26.3 28.7SI 37.7 33.2 35.6 34.6SK 28.2 29.9 29.9 29.9UK 28.6 32 23.5 32IS - - 41.7 42.6
NO - - 32.8 35.8
Country
EUROMOD OECD
Mean Median Mean Median
(1) (2) (3) (4)
AT 26.5 15.1 29.1 16.1BE 54.1 54.9 51 53.8BG 21.9 21.6 22.5 21.6CY 17 10.3 - -CZ 26.7 31.1 24.2 31.1DE 44.1 46.9 44.7 47DK 41.2 40.9 46.2 40.9EE 23.8 24.8 24.8 24.8EL 28.6 28.0 16.7 18.8ES 24 29.5 25.7 29.5FI 35 38.3 30.3 35.9FR 32.6 31.6 31.3 31.8HU 36.8 34.5 35.9 34.5IE 39.8 39 34.6 31IT 34.9 38.3 34.7 40.6LT 25.9 27 22.7 27LU 39.9 41 36.2 36.6LV 32.4 33.3 32 33.2MT 20.5 23.2 22.9 22.3NL 31.5 33.1 31.7 39.4PL 30 30.3 29.8 30.3PT 28.9 35.5 28.9 35.5RO 31.6 31.9 29.9 29.9SE 28.5 28.9 24.5 28.7SI 39.3 32.9 41.4 34.6SK 29.5 29.9 29.9 29.9UK 31 32 22 32IS - - 46.8 44.8NO - - 31.9 35.8
Note: ‘-’ Results are not available.
Source: Authors’ calculations using EUROMOD and the OECD Tax-Benefit model, 2012.
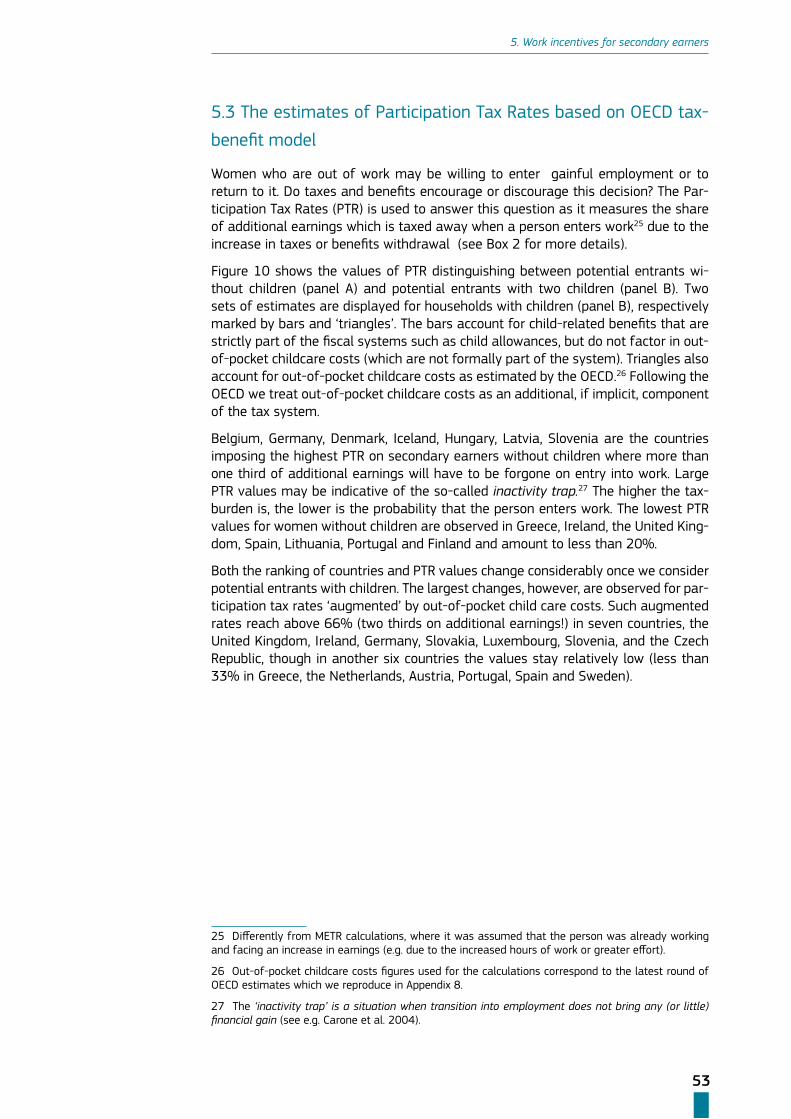
53
5. Work incentives for secondary earners
5.3 The estimates of Participation Tax Rates based on OECD tax-
benefit model
Women who are out of work may be willing to enter gainful employment or to return to it. Do taxes and benefits encourage or discourage this decision? The Par-ticipation Tax Rates (PTR) is used to answer this question as it measures the share of additional earnings which is taxed away when a person enters work25 due to the increase in taxes or benefits withdrawal (see Box 2 for more details).
Figure 10 shows the values of PTR distinguishing between potential entrants wi-thout children (panel A) and potential entrants with two children (panel B). Two sets of estimates are displayed for households with children (panel B), respectively marked by bars and ‘triangles’. The bars account for child-related benefits that are strictly part of the fiscal systems such as child allowances, but do not factor in out-of-pocket childcare costs (which are not formally part of the system). Triangles also account for out-of-pocket childcare costs as estimated by the OECD.26 Following the OECD we treat out-of-pocket childcare costs as an additional, if implicit, component of the tax system.
Belgium, Germany, Denmark, Iceland, Hungary, Latvia, Slovenia are the countries imposing the highest PTR on secondary earners without children where more than one third of additional earnings will have to be forgone on entry into work. Large PTR values may be indicative of the so-called inactivity trap.27 The higher the tax-burden is, the lower is the probability that the person enters work. The lowest PTR values for women without children are observed in Greece, Ireland, the United King-dom, Spain, Lithuania, Portugal and Finland and amount to less than 20%.
Both the ranking of countries and PTR values change considerably once we consider potential entrants with children. The largest changes, however, are observed for par-ticipation tax rates ‘augmented’ by out-of-pocket child care costs. Such augmented rates reach above 66% (two thirds on additional earnings!) in seven countries, the United Kingdom, Ireland, Germany, Slovakia, Luxembourg, Slovenia, and the Czech Republic, though in another six countries the values stay relatively low (less than 33% in Greece, the Netherlands, Austria, Portugal, Spain and Sweden).
25 Differently from METR calculations, where it was assumed that the person was already working and facing an increase in earnings (e.g. due to the increased hours of work or greater effort).
26 Out-of-pocket childcare costs figures used for the calculations correspond to the latest round of OECD estimates which we reproduce in Appendix 8.
27 The ‘inactivity trap’ is a situation when transition into employment does not bring any (or little) financial gain (see e.g. Carone et al. 2004).
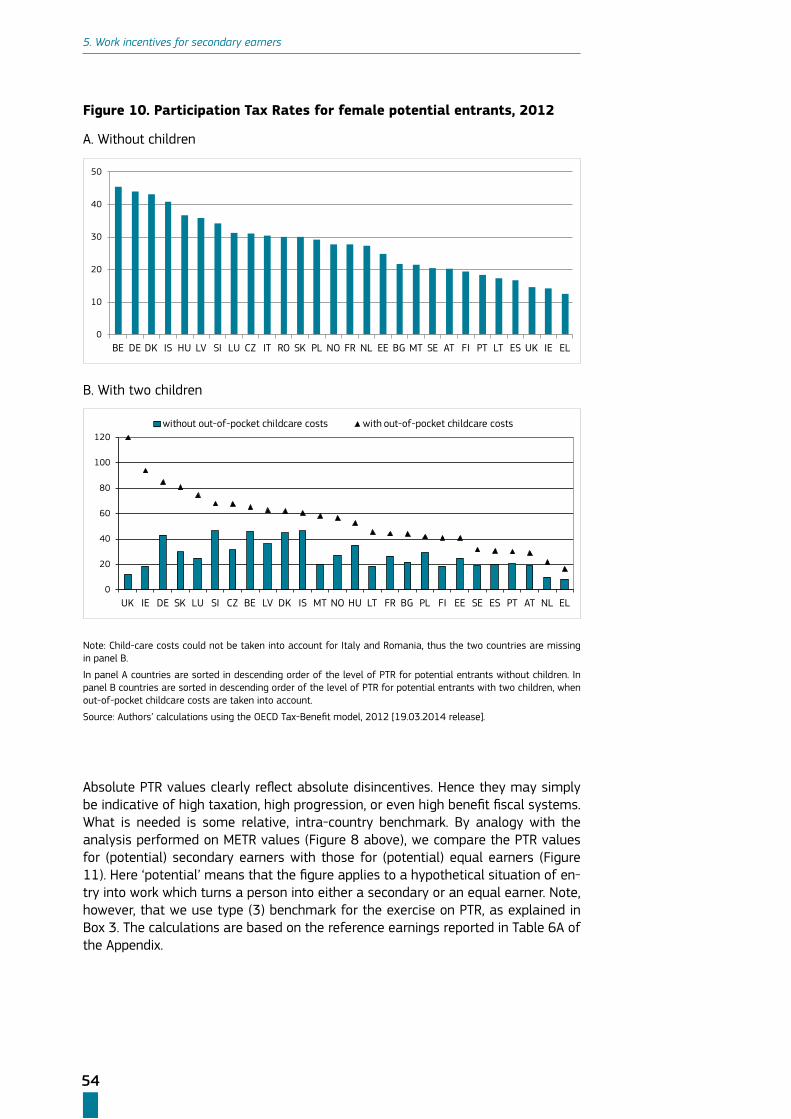
54
5. Work incentives for secondary earners
Figure 10. Participation Tax Rates for female potential entrants, 2012
A. Without children
0
10
20
30
40
50
BE DE DK IS HU LV SI LU CZ IT RO SK PL NO FR NL EE BG MT SE AT FI PT LT ES UK IE EL
B. With two children
0
20
40
60
80
100
120
UK IE DE SK LU SI CZ BE LV DK IS MT NO HU LT FR BG PL FI EE SE ES PT AT NL EL
without out-of-pocket childcare costs with out-of-pocket childcare costs
Note: Child-care costs could not be taken into account for Italy and Romania, thus the two countries are missing in panel B.
In panel A countries are sorted in descending order of the level of PTR for potential entrants without children. In panel B countries are sorted in descending order of the level of PTR for potential entrants with two children, when out-of-pocket childcare costs are taken into account.
Source: Authors’ calculations using the OECD Tax-Benefit model, 2012 [19.03.2014 release].
Absolute PTR values clearly reflect absolute disincentives. Hence they may simply be indicative of high taxation, high progression, or even high benefit fiscal systems. What is needed is some relative, intra-country benchmark. By analogy with the analysis performed on METR values (Figure 8 above), we compare the PTR values for (potential) secondary earners with those for (potential) equal earners (Figure 11). Here ‘potential’ means that the figure applies to a hypothetical situation of en-try into work which turns a person into either a secondary or an equal earner. Note, however, that we use type (3) benchmark for the exercise on PTR, as explained in Box 3. The calculations are based on the reference earnings reported in Table 6A of the Appendix.

55
5. Work incentives for secondary earners
Figure 11. Participation Tax Rates for female potential entrants and equal earning women without children, 2012
0
25
50
0 25 50
Seco
ndar
y
Equal
EL
AT
BE
IE
DEDK
IS
LVHU
RO
NL
LU
Source: Authors’ calculations using OECD Tax-Benefit model, 2012.
Visual inspection of Figure 11 suggests that PTR values are generally higher for equal earners without children. This indicates the existence of disincentives to enter work on equal grounds with the male partner. In order to delve deeper into disincen-tives at different level of earnings, the PTR was estimated for entry at low, medium and high earnings, again for couples without children (Figure 12).
Figure 12. Participation Tax Rates for female potential entrants at low-medium-high levels of earnings, no children, 2012
0
10
20
30
40
50
60
BE DE DK IS HU LV SI CZ LU IT SK PL FR NO NL RO EE BG MT AT SE FI PT LT ES UK IE EL
AETR_low AETR_med AETR_high
Note: Countries are sorted by the level of AETR_med which corresponds to the median earnings of female secon-dary earners by country (see Table 6A in the Appendix).
Source: Authors’ calculations using OECD Tax-Benefit model, 2012.
56
5. Work incentives for secondary earners
There is a tendency for PTR to grow with the level of earnings, except for Denmark and Eastern European countries like Bulgaria, Hungary, Latvia, the Czech Republic, Slovakia, Poland, Estonia. This partly reflects the extent of income tax progressi-vity.28 However, differences between top and bottom values are generally contai-ned, except for Luxembourg, Italy, Austria, Finland, Ireland and the United Kingdom. These are the countries where entry into work at higher levels of earnings is less convenient.
Figure 13 compares potential secondary earners with children to potential equal earners with children. Panel A shows the results of simulations without out-of-pocket childcare costs, whereas panel B takes such costs into account.
In panel A, only Latvia appears to penalize secondary earners, but to a marginal extent since the PTR values for the latter are only slightly higher than for equal ear-ning women. Once out-of-pocket childcare costs are taken into account, however, the picture changes completely. The majority of countries move above the diago-nal line, implying that secondary earners face a higher participation tax compared to equal earners. The largest gap (more than 20 p.p.) is observed in the United Kingdom, Ireland, Germany, Slovakia, and the Czech Republic, where moreover, PTR levels are among the highest. Still penalized, but to a lesser extent, are secondary earners with children in Latvia, Lithuania, Estonia, Malta, and Luxembourg (in some other countries the gap is minor, less than 10 p.p).
There are only two clear instances where the combination of taxes and out-of-pocket childcare costs amounts to stronger disincentives for equal earners in com-parison to secondary earners, namely the Netherlands and Austria (panel B, Figure 13). In both cases this can contribute to explain strong attractiveness of part-time work in the respective countries. The cases of Hungary, Greece and Portugal are less easy to read in the light of employment patterns although here too entry as secon-dary earner is somewhat favoured and may partly account for the recent growth in part-time employment. We will come back to the possible links between PTR and employment in the next chapter.
Overall, what do these findings suggest? Figure 10 is suggestive of how strong fiscal disincentives can be for women considering entry into the labour market once out-of-pocket childcare costs are factored in as implicit taxes. Figure 13 adds that in 19 out of the 29 counties considered potential secondary workers with children fare worse than potential equal earners as they enter work.
28 Note that many Eastern European countries have recently adopted the flat income tax rate.
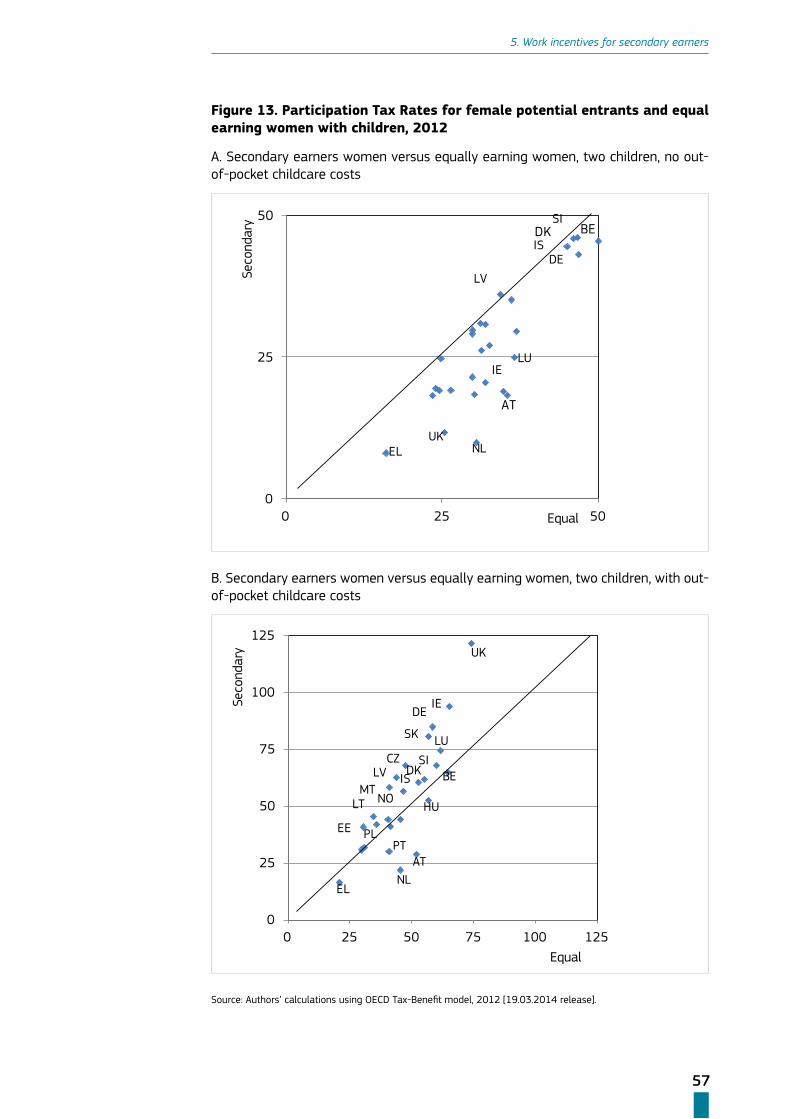
57
5. Work incentives for secondary earners
Figure 13. Participation Tax Rates for female potential entrants and equal earning women with children, 2012
A. Secondary earners women versus equally earning women, two children, no out-of-pocket childcare costs
0
25
50
0 25 50
Seco
ndar
y
Equal
EL
AT
BE
NL
DE
SIDKIS
LV
IE
UK
LU
B. Secondary earners women versus equally earning women, two children, with out-of-pocket childcare costs
0
25
50
75
100
125
0 25 50 75 100 125
Seco
ndar
y
Equal
EL
AT
BE
NL
DE
SK
DKIS
LTMT
NO
IE
LUSI
EE
LVCZ
PT
HU
UK
PL
Source: Authors’ calculations using OECD Tax-Benefit model, 2012 [19.03.2014 release].
58
6. Discussion: fiscal disincentives and employment patterns
Ireland and the United Kingdom stand out as the countries where potential secon-dary earners are penalized the most. Childcare is very expensive in these countries and it is relatively expensive also in Slovakia and Luxembourg, though to a lesser extent. However, the findings for Germany send a different message. Here potential secondary earners continue to be penalized with respect to equal earners despite evidence of a considerable reduction in out-of-pocket childcare costs over the re-cent years (see Table 8A in the Appendix).
The findings for Germany are somewhat puzzling, but so are those for the United Kingdom, if the expectations are that high PTR hinder participation.29 This sends a warning about how we should gauge the evidence in Figure 13. The estimates of PTR which factor in out-of-pocket childcare costs are a sophisticated exercise. Gross childcare costs fed into the model are generally fixed for a country (or region) while net childcare costs – those that matter for the PTR - are allowed to vary with income and in response to the specific design of the national tax-benefit system. To see this note how, for example, secondary earners in Austria and the Netherlands are less penalized than equal earners by the introduction of childcare costs, whereas the op-posite happens in Ireland and the United Kingdom. However, the initial assumption of fixed, gross childcare costs per country may not do full justice to the dispersion of such costs within as well as between countries (regions). Gathering accurate in-formation on out-of-pocket childcare costs and modelling their interaction with the tax-benefit system is still fraught with difficulties.
All this boils down to a simple message. Out-of-pocket childcare costs are likely to influence employment decisions as much as, if not more than, other ‘explicit’ fiscal (dis)incentives. But the robustness of this finding is inevitably conditional on the quality of OECD out-of-pocket childcare costs estimates.
However one may assess the suggestions from the above simulations, validations of these suggestions and, more generally, solid policy inference requires analysis which is outside the scope of this report. In gathering the threads of our investiga-tion in the chapter that follows we shall nevertheless draw some plausible, albeit speculative and general implications from our findings for policies targeting the design of the taxation system and the growth of labour supply.
29 UK records female employment rates higher than the EU average, see Table 9A in the Appendix.
59
6. Discussion: fiscal disincentives and employment patterns
6. Discussion: fiscal disincentives and employment patterns
In this chapter we make a very rough attempt to link the findings on METR and PTR to the employment patterns by country. We first ask to what extent a clear link is discernible between high marginal tax rates and low work intensity among actual secondary earners. We then repeat the question for participation tax rates and ac-tual decisions to enter work among potential entrants. Several attempts to identify such links exist in the literature and some use rather sophisticated econometric me-thodology (see e.g. Jaumotte 2003, Thévenon 2013). However some of the results we obtained for METR and PTR are relatively new, making it worthwhile to take a fresh, if cursory, look at the issue.
6.1 Marginal Effective Tax Rates and work intensity
High METR are expected to discourage work intensity, as repeatedly noted. In this section we take part-time to epitomize low work intensity, although a finer analysis should go beyond the part-time full-time dichotomy.
Table 9 classifies countries using the METR estimates from EUROMOD. It includes all the countries above the diagonal in Figure 9, namely countries where secondary earners are ‘penalized’ with respect to equal earners in terms of METR values. The table distinguishes between large and small fiscal disincentives for secondary ear-ners (based on the distance from the diagonal) at low, medium and high levels of earnings, respectively. The bold font in the table denotes countries with an average share of part-timers above the EU28 average (31.4%)30, while countries with small sample sizes are shown in light grey.
30 This level corresponds to the average share of part-time among working women in the EU28 in 2012 (see Table 9A in the Appendix).
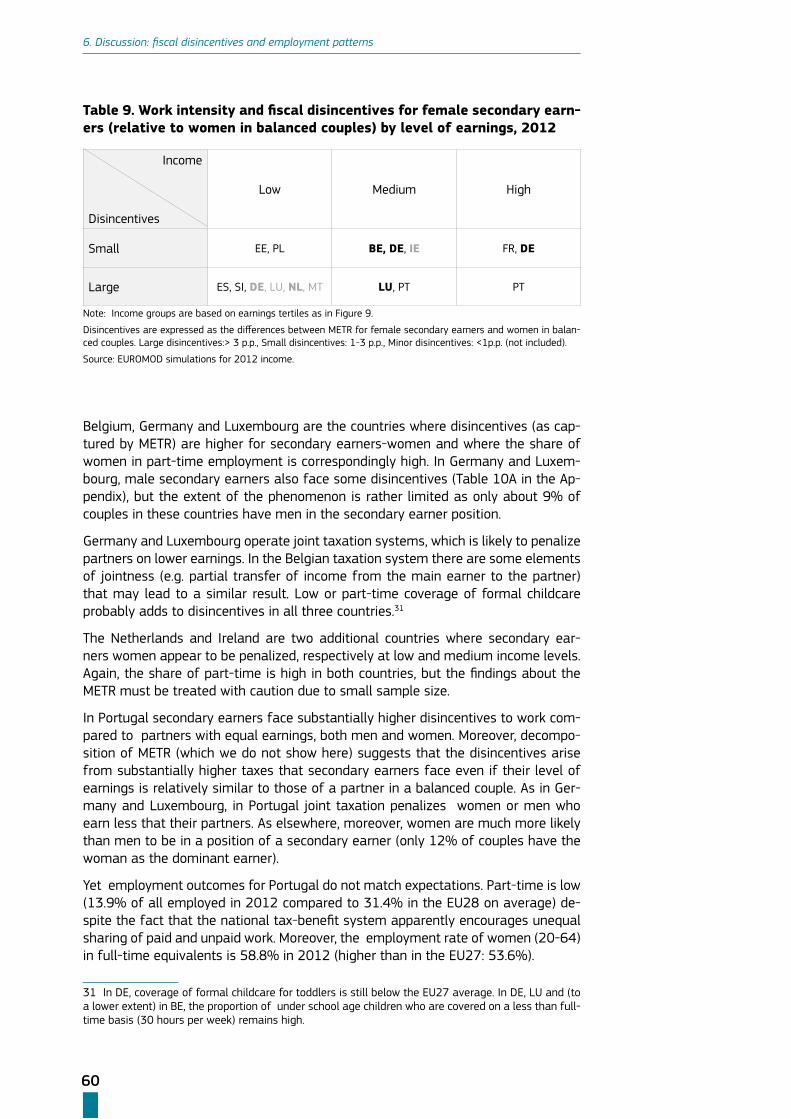
60
6. Discussion: fiscal disincentives and employment patterns
Table 9. Work intensity and fiscal disincentives for female secondary earn-ers (relative to women in balanced couples) by level of earnings, 2012
Income
Disincentives
Low Medium High
Small EE, PL BE, DE, IE FR, DE
Large ES, SI, DE, LU, NL, MT LU, PT PT
Note: Income groups are based on earnings tertiles as in Figure 9.
Disincentives are expressed as the differences between METR for female secondary earners and women in balan-ced couples. Large disincentives:> 3 p.p., Small disincentives: 1-3 p.p., Minor disincentives: <1p.p. (not included).
Source: EUROMOD simulations for 2012 income.
Belgium, Germany and Luxembourg are the countries where disincentives (as cap-tured by METR) are higher for secondary earners-women and where the share of women in part-time employment is correspondingly high. In Germany and Luxem-bourg, male secondary earners also face some disincentives (Table 10A in the Ap-pendix), but the extent of the phenomenon is rather limited as only about 9% of couples in these countries have men in the secondary earner position.
Germany and Luxembourg operate joint taxation systems, which is likely to penalize partners on lower earnings. In the Belgian taxation system there are some elements of jointness (e.g. partial transfer of income from the main earner to the partner) that may lead to a similar result. Low or part-time coverage of formal childcare probably adds to disincentives in all three countries.31
The Netherlands and Ireland are two additional countries where secondary ear-ners women appear to be penalized, respectively at low and medium income levels. Again, the share of part-time is high in both countries, but the findings about the METR must be treated with caution due to small sample size.
In Portugal secondary earners face substantially higher disincentives to work com-pared to partners with equal earnings, both men and women. Moreover, decompo-sition of METR (which we do not show here) suggests that the disincentives arise from substantially higher taxes that secondary earners face even if their level of earnings is relatively similar to those of a partner in a balanced couple. As in Ger-many and Luxembourg, in Portugal joint taxation penalizes women or men who earn less that their partners. As elsewhere, moreover, women are much more likely than men to be in a position of a secondary earner (only 12% of couples have the woman as the dominant earner).
Yet employment outcomes for Portugal do not match expectations. Part-time is low (13.9% of all employed in 2012 compared to 31.4% in the EU28 on average) de-spite the fact that the national tax-benefit system apparently encourages unequal sharing of paid and unpaid work. Moreover, the employment rate of women (20-64) in full-time equivalents is 58.8% in 2012 (higher than in the EU27: 53.6%).
31 In DE, coverage of formal childcare for toddlers is still below the EU27 average. In DE, LU and (to a lower extent) in BE, the proportion of under school age children who are covered on a less than full-time basis (30 hours per week) remains high.
61
6. Discussion: fiscal disincentives and employment patterns
Other countries where secondary earners women may face substantial disincenti-ves to increasing work intensity are Spain and Slovenia. But this has not resulted in high shares of part-time. For Spain the qualification is that, despite being at a di-sadvantage relative to individuals in balanced couples, secondary earners still face one of the lowest METR in the EU27. Slovenia, on the other hand, has inherited low part-time from the socialist era.
In Estonia, Poland, France, and Lithuania, disadvantages are comparatively small and none of these countries displays large part-time share.
In sum, the evidence we garnered suggests that fiscal disincentives are high enou-gh to discourage female secondary workers from increasing work intensity in five countries: Belgium, Germany, Slovenia, Portugal, and Luxembourg (Germany, Portu-gal and Luxembourg operate a joint taxation system32). Three of the countries show a high proportion of part-time work: Belgium, Germany and Luxembourg, while this is not the case in Portugal and Slovenia. Because of small sample size the evidence that strong disincentives in the low and medium income groups may (partly) ac-count for relatively high part-time is not conclusive for NL and IE. In the remaining countries disincentives are small enough not to exercise a strong influence, which is broadly consistent with a share of part-time below the EU average. Overall, the weight of the evidence supports some but not overwhelming influence of fiscal in-centives on work intensity.
6.2 Participation Tax Rates and levels of employment
Here we take the female employment rate as the outcome variable that should capture the influence of participation tax rates. Table 10 classifies countries by the level of PTR and by the level of income upon (re-)entering employment. The black and bold font indicates countries where the disincentives to enter work are medium-to-high and the current employment rates for women are below the EU28 average (62.4%).33 The table refers to women without children but we shall recall discursi-vely the difference that children make.
Our previous simulations indicate that out of the 16 countries featuring relatively high participation tax rates for female secondary earners without children (PTR>25%) 8 report employment rates below the (European) average: Belgium, Hungary, Italy, Luxembourg, Malta, Poland, Romania, and Slovakia (Figure 10). In most of these countries, disincentives for secondary earners are in fact higher than elsewhere at any level of entry income, except for low income earners in Luxembourg and Italy and medium-to-high income earners in Malta (Figure 12).
32 With an option to be taxed individually in DE.
33 This level corresponds to the average employment rate for women in the EU28 in 2012 (see Table 9A in the Appendix).
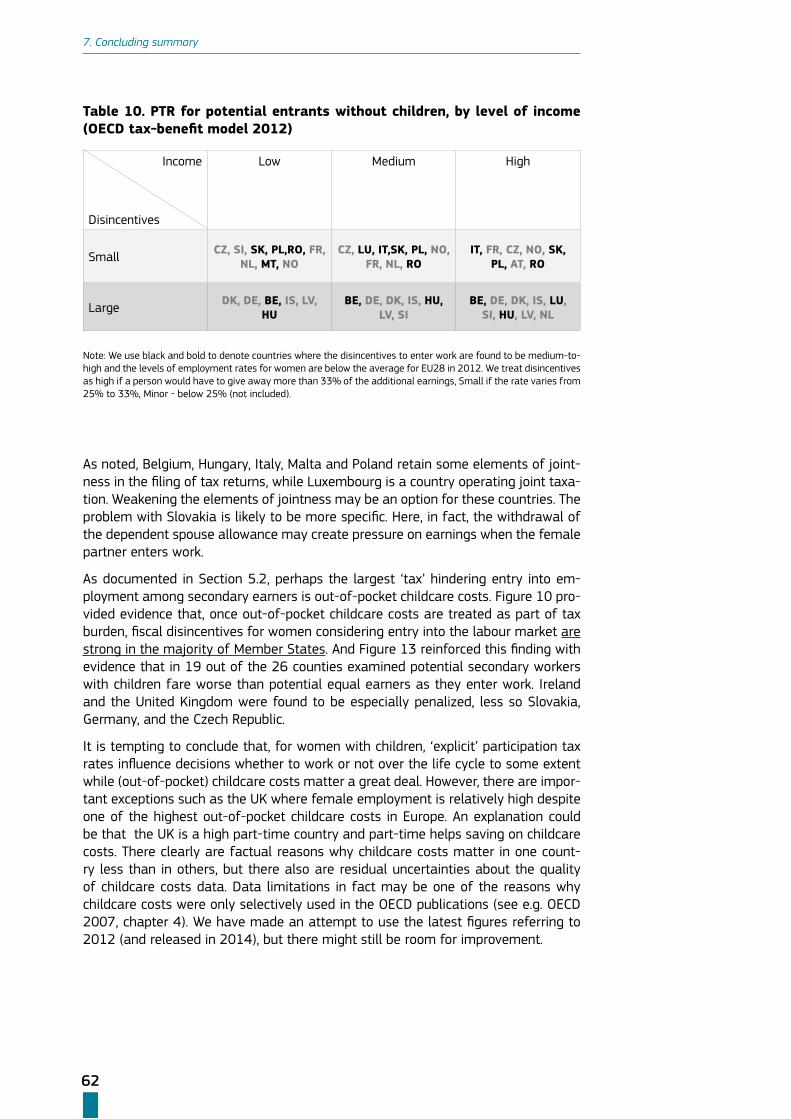
62
7. Concluding summary
Table 10. PTR for potential entrants without children, by level of income (OECD tax-benefit model 2012)
Income
Disincentives
Low Medium High
Small CZ, SI, SK, PL,RO, FR, NL, MT, NO
CZ, LU, IT,SK, PL, NO, FR, NL, RO
IT, FR, CZ, NO, SK, PL, AT, RO
Large DK, DE, BE, IS, LV, HU
BE, DE, DK, IS, HU, LV, SI
BE, DE, DK, IS, LU, SI, HU, LV, NL
Note: We use black and bold to denote countries where the disincentives to enter work are found to be medium-to-high and the levels of employment rates for women are below the average for EU28 in 2012. We treat disincentives as high if a person would have to give away more than 33% of the additional earnings, Small if the rate varies from 25% to 33%, Minor - below 25% (not included).
As noted, Belgium, Hungary, Italy, Malta and Poland retain some elements of joint-ness in the filing of tax returns, while Luxembourg is a country operating joint taxa-tion. Weakening the elements of jointness may be an option for these countries. The problem with Slovakia is likely to be more specific. Here, in fact, the withdrawal of the dependent spouse allowance may create pressure on earnings when the female partner enters work.
As documented in Section 5.2, perhaps the largest ‘tax’ hindering entry into em-ployment among secondary earners is out-of-pocket childcare costs. Figure 10 pro-vided evidence that, once out-of-pocket childcare costs are treated as part of tax burden, fiscal disincentives for women considering entry into the labour market are strong in the majority of Member States. And Figure 13 reinforced this finding with evidence that in 19 out of the 26 counties examined potential secondary workers with children fare worse than potential equal earners as they enter work. Ireland and the United Kingdom were found to be especially penalized, less so Slovakia, Germany, and the Czech Republic.
It is tempting to conclude that, for women with children, ‘explicit’ participation tax rates influence decisions whether to work or not over the life cycle to some extent while (out-of-pocket) childcare costs matter a great deal. However, there are impor-tant exceptions such as the UK where female employment is relatively high despite one of the highest out-of-pocket childcare costs in Europe. An explanation could be that the UK is a high part-time country and part-time helps saving on childcare costs. There clearly are factual reasons why childcare costs matter in one count-ry less than in others, but there also are residual uncertainties about the quality of childcare costs data. Data limitations in fact may be one of the reasons why childcare costs were only selectively used in the OECD publications (see e.g. OECD 2007, chapter 4). We have made an attempt to use the latest figures referring to 2012 (and released in 2014), but there might still be room for improvement.
63
7. Concluding summary
7. Concluding summary
In today’s Europe, women no longer play a marginal income role within couples. Ho-wever, the contribution of male and female partners to common earnings remains very unequal. In more than half of working age-couples in European countries wo-men earn less than men or do not work at all.
The factors that affect women’s earning capacity differ across countries. In the EU15, the low contribution of women to couples’ earnings is likely to be related to widespread part-time jobs. This is not the case in the majority of the Eastern Euro-pean countries or even in part of Southern Europe, where such jobs are either not available or not financially attractive.
Labour market choices and outcomes are strongly influenced by the family situa-tion, most importantly the number and age of dependent children. In many countri-es, having children under 3 years of age considerably reduces the share of women’s earnings. In most countries this is a temporary effect, in part related to career in-terruptions while on maternity leave. But there are countries where the decrease in women’s earning capacity is more persistent because it is observed in all couples with dependent children regardless of their age. Countries like Austria, Germany, Croatia, and, outside the EU, Switzerland, are clearer instances of persistent decre-ase.
In this report we have investigated the extent to which formal tax-benefit policies and implicit taxes such as out-of-pocket childcare costs inhibit women from wor-king to their full capacity. We have utilized two tax-benefit simulation models (EU-ROMOD and a modified version of the OECD tax-benefit model) to estimate com-mon measures of work incentives: the Marginal Effective Tax Rate which is expected to influence decisions about how much to work, and the Participation Tax Rate which is expected to affect decisions whether to work or not. We have also brought into play the Participation Tax Rate augmented by the latest OECD estimates of out-of-pocket childcare costs in the different countries.
Work Intensity
Once real earnings (from the same data source) are used for estimation in both models, the values of the median METR estimated by the two models are largely consistent and point to the robustness of the results.34 In particular, the countri-es with the highest METR for secondary earners appear to be Belgium, Germany and Denmark. However, this finding is largely driven by high tax burden in these countries compared to others (see OECD 2013 and the results of the decomposition analysis presented in Figure 6). Within these countries secondary earners might not feel particularly penalized since everybody faces high taxation. We thus chose a benchmark against which to assess the comparative treatment of secondary ear-ners within each country, namely: members of couples with roughly equal earnings.
34 Differences are observed for two countries (EL, NL) and need further investigation.

64
7. Concluding summary
The comparison of METR obtained for secondary and equal earners identified five countries, Belgium, Germany, Portugal, Luxembourg and Slovenia, where secondary earners appear to be at a considerable disadvantage. However, only Belgium, Lu-xembourg and Germany combine high disincentives to work longer with high part-time employment among women. In Slovenia and Portugal other factors are at work that counteract such disincentives.
An important qualification is in order. Simulations using EUROMOD (and EU-SILC data) revealed a wide distribution of METR among secondary earners in several countries, specifically in Ireland, Austria, Spain, the Netherlands, Luxembourg, Fin-land, and France. Hence focussing on median values for policy purposes may ignore some problematic non-typical cases at the tails of the distribution.
To work or not to work?
Simulations by means of the OECD model suggest that, among couples without children, disincentives to enter or re-enter employment as measured by the Par-ticipation Tax Rate are generally higher for equal rather than secondary potential earners. As expected, in the absence of children PTR values tend to grow with ear-nings, although this does not hold for countries like Denmark and, in Eastern Europe, countries like Bulgaria, Hungary, Latvia, the Czech Republic, Slovakia, Poland, Esto-nia. However, differences between the PTR at higher and lower levels of earnings are limited across countries, except in Luxembourg, Austria, Finland, Ireland and the United Kingdom.
The picture is markedly different among couples with children. When out-of-pocket childcare costs are added to the traditional entries of the tax system, PTR values for secondary earners in the United Kingdom, Ireland, Germany, the Czech Republic, and Slovakia exceed benchmark values (those for equal earners) by at least 20%. In plain words, mothers of children in these countries envisaging entry into the labour market in a secondary earner position face considerably higher fiscal disincentives than do those envisaging entry as equal earners. In Latvia, Lithuania, Estonia, Malta, and Luxembourg potential secondary earners are also penalized with respect to the benchmark group, but to a lesser extent. In all these cases penalization is primarily the result of accounting for out-of-pocket childcare costs. The clearest examples in this regard are Ireland and the United Kingdom where childcare costs are the highest in Europe according to OECD 2014 estimations.
Yet it would be hasty to conclude that explicit participation taxes weakly influence women’s decision to (re)enter employment while the implicit childcare costs ‘tax’ matters more. There are cases such as the UK where female employment is relati-vely high despite one of the highest out-of-pocket childcare costs in Europe. Howe-ver, the UK is a high part-time country and part-time helps saving on childcare costs. Also, we have used sophisticated OECD child-care costs estimates for our exercises – and the latest available - but childcare costs vary tremendously between and within countries adding uncertainty to any such exercise.
Overall the evidence that we have gathered is roughly consistent with the pre-sumption that either the design of the tax benefit system or out-of-pocket childcare costs, or both, affect the choice of working hours or the choice of entering em-ployment among secondary earners. Out of the countries considered in this study, 10 feature shares of part-time higher than the European average among female
65
Bibliography
workers (Denmark, Ireland, Luxembourg, Sweden, Norway, the United Kingdom, Bel-gium, Germany, Austria, the Netherlands] and 11 feature employment rates below the European average [Greece, Malta, Italy, Spain, Romania, Hungary, Slovakia, Po-land, Ireland, Bulgaria, Belgium). Most of these countries were found to exhibit com-paratively higher tax-burdens on secondary earners – METR, PTR or PTR augmented with out-of-pocket childcare costs – which gives cogency to our findings.
However, neither the design of the tax-benefit system nor child-care costs suffice on their own to account for country-specific employment outcomes, as we found several counterexamples in both cases. More importantly, this report focused on estimating disincentives while their influence on employment pattern was given only brief attention and warrants further investigation.
With specific reference to the tax system design, our findings are broadly consistent with some widely held tenets in the literature, namely that the degrees of progres-sivity and jointness inherent in the tax codes are the most important factors impin-ging on work incentives for secondary earners. According to the updated overview of tax-benefits system that this study provides (Chapter 3) the unit of taxation is the individual in the vast majority of Member States. However a non-negligible subgroup of countries adhere to the joint taxation system: Germany, France, Ireland, Luxembourg, and Portugal. Moreover, there are some elements of jointness in the tax codes of about half of the countries considered. The pros and cons of a joint versus individual tax-benefit system might thus need careful reassessment if the primary goal is to remove (dis)incentives for groups of working women at risk of labour market exclusion.
In regard to progressivity, our findings that countries like Denmark, Norway and Sweden do not feature among those penalizing secondary earners may seem at odds with some studies in the literature that stress the discouraging effect of high taxes in these countries. Let us reiterate, however, that what counts for a subgroup of the population such as secondary earners is the relative rather than the absolute level of taxation. To measure relative taxation, we chose to compare secondary earners with individuals in ‘earnings balanced’ couples. Whilst our specific choice of benchmark may be open to question, that of looking at relative taxation is unas-sailable.
One specific limitation of the simulations that we carried out is small sample size.35 Due to this problem, uncertainties remain in several cases (see, for example, the discussion on the findings for Germany, the Netherlands and Ireland in Table 9).
A more general concern is the multiplicity of policy objectives that should be ad-dressed when focusing analysis on female secondary earners. In this report we have concentrated on employment choices – whether or not to work and how much – while neglecting fertility, child well-being, child poverty, and so on. Trade-offs between different policy objectives inevitably complicate the analysis but cannot be ignored if policies aim to be welfare improving.
35 This only regards calculations based on EUROMOD.
66
Bibliography
Bibliography
Adam, S., Brewer, M. and Shephard, A. (2006) ‘Financial Work Incentives in Britain: Comparisons over Time and between Family Types’, The Institute for Fiscal Studies WP06/20.
Alesina, A., Ichino, A. and Karabarbounis, L. (2011) ‘Gender Based Taxation and the Allocation of Family Chores’, American Economic Journal: Economic Policy, 3(2): 1-40.
Bach, S. (2014) ‘Frauen erzielen im Durchschnitt nur halb so hohe Einkommen wie Mӓnner’, DIW WOCHENBERICHT NR. 35/2014 VOM 27, August.
Bargain, O. and K. Orsini (2006) ‘Beans for Breakfast? How Exportable is the British Workfare Model?’ Research in Labor Economics, 25: 165-198.
Bettio, F., Corsi, M., D’Ippoliti, C., Lyberaki, A.,SamekLodovici, M. and Verashchagina, A. (2013)The impact of the economic crisis on the situation of women and men and on gender equality policies, EGGE and EGGSI joint synthesis report prepared for the European Commission, Directorate-General for Justice; unit D2 ‘Equality between men and women’.
Bettio, F and Verashchagina, A. (2009), Fiscal System and Female Employment in Europe, EGGE synthesis report prepared for the European Commission, Di-rectorate-General for Justice; unit D2 ‘Equality between men and women’.
Bettio, F. and Verashchagina, A. (2013) ‘Current tax-benefit systems in Europe: are they fare to working women?’ in F. Bettio, J. Plantenga and M. Smith (eds) Gender and the European Labour Market. Routledge studies in the European Economy.
Blau, F. D., Gielen, A. C. and Zimmermann, K. F. (2012) Gender, Inequality, and Wages, Oxford.
Blundell, R., Bozio, A., and Laroque, G. (2013) ‘Extensive and intensive margins of labour supply: working hours in the US, UK and France’, Fiscal Studies, 34 (1): 1-29.
Bloemen, H.G. and Stancanelli, E. (2013) ‘Toyboys or supergirls? An analysis of earnings and employment outcomes of spouses’, Review of Economics of the Household, August. [DOI: 10.1007/s11150-013-9212-y]
Carone, G. et al. (2004) ‘Indicators of unemployment and low-wage traps’ (Marginal Effective Tax Rates on Labour), Directorate for Employment, Labour and So-cial Affairs. Employment, Labour and Social Affairs Committee. OECD Social, Employment and Migration Working Paper No. 18., 15 March.
Colombino, U. and Narazani, E. (2013)’What’s Best for Women: Gender Based Taxa-tion, Wage Subsidies or Basic Income?’ EUROMOD Working Paper No. EM 10/13.
67
Bibliography
Colonna, F. and Marcassa, S. (2013) ‘Taxation and Labor Force Participation: The Case of Italy’, Bank of Italy Occasional Papers, no. 191.
De Luca, G., Rossetti, C. and Vuri, D. (2012)’In-Work Benefits for Married Couples: An Ex-Ante Evaluation of EITC and WTC Policies in Italy’, IZA Discussion Paper No. 6739.
Econpubblica (2011) The Role and Impact of Labour Taxation Policies, European Commission.
Eurofound (2013) Women, men and working conditions in Europe. A report based on the fifth European Working Conditions Survey.
European Commission (2012)Annual Growth Survey 2013, Brussels.
European Commission (2013a), Barcelona Objectives, Luxembourg.
European Commission (2013b) Tax reforms in EU Member States. Taxation Papers series. Working Paper N. 38.
Figari, F. (2010) ‘Can in-work benefits improve social inclusion in the Southern Euro-pean countries?’ Journal of European Social Policy 20(4): 301-315.
Figari, F., Immervoll, H., Levy, H. and Sutherland, H. (2011) ‘Inequalities within Cou-ples in Europe: Market Incomes and the Role of Taxes and Benefits’, Eastern Economic Journal 37: 344–366.
Figari, F. (2014) ‘From housewives to independent earners: How the tax system can help women to work in a context of strong familialism’, forthcoming in Jour-nal of Social Policy. Available as ISER WP2011-15.
Haan, P. and Myck, M. (2007) ‘Apply with Caution: Introducing UK-Style In-work Support in Germany’, Fiscal Studies, vol. 28.
Hakim (1996) ‘The sexual division of labour and women’s heterogeneity’, British Journal of Sociology, 47 (1): 178-188.
Immervoll, H. (2002)’The Distribution of Average and Marginal Effective Tax Rates in European Union Member States’, EUROMOD Working paper No. EM2/02.
Immervoll, H., Kleven, H. J., Kreiner, C. T. and Saez, E. (2007) ‘Welfare Reform in European Countries: A Microsimulation Analysis’, Economic Journal 117: 1-44.
Jara, H. and Sutherland, H. (2013) ‘Baseline results from the EU27 EUROMOD (2009-2012)’, EUROMOD Working Paper No. EM13/13.
Jara, H. X. and Tumino, A. (2013) ‘Tax-benefit Systems, Income Distribution and Work Incentives in the European Union’, International Journal of Microsimu-lation 6(1): 27-62.
Jaumotte, F. (2003) ‘Labour Force Participation of Women: Empirical Evidence on The Role of Policy and Other Determinants in OECD Countries’, OECD Eco-nomic Studies, OECD Publishing, vol. 2: 51-108.
Kalísková, K. (2013) ‘Family Taxation and the Female Labor Supply: Evidence from a Natural Experiment in the Czech Republic’, CERGE_EI Working Paper 496, November.
68
Appendices
Keane, M.P. (2011) ‘Labour Supply and Taxes: A Survey’, Journal of Economic Litera-ture, 49(4): 961-1075.
Kleven, H.J., Kreiner, C. T. and Saez E. (2009) The Optimal Income Taxation of Cou-ples, Econometrica, 77 (2): 537–560.
Meghir, C. and Phillips, D. (2009) Labour Supply and Taxes. Mirrlees Review, Institute for Fiscal Studies.
Mundy, L. (2012) The Richer Sex: How the New Majority of Female Breadwinners Is Transforming Sex, Love and Family.
Navicke, J., Rastrigina, O. and Sutherland, H. (2013) ‘Nowcasting Indicators of Pov-erty Risk in the European Union: A Microsimulation Approach’, Social Indi-cators Research. [DOI: 10.1007/s11205-013-0491-8]
OECD (2007) Benefits and Wages 2007. OECD Publishing.
OECD (2012) Closing the Gender Gap: Act Now, OECD Publishing.
OECD (2013) Taxing Wages 2011-2012. Special Feature: Average personal income tax rate and tax wedge progression in OECD countries, OECD Publishing.
Rosen, H. (1977) ‘Is It Time to Abandon Joint Filing?’ National Tax Journal 30(4): 423-428.
Saez, E. (2002) ‘Optimal income transfer programs: intensive versus extensive la-bor supply responses’, Quarterly Journal of Economics 117: 1039–1073.
Smith, M. and Solera, C. (2011) Women’s and Men’s career interruptions: their im-pact and the role of social policies. Analysis Note, ENEGE network.
Stancanelli, E. (2007) ‘Marriage and Work: an analysis for French couples in the last decade’, Documents de Travail de l’OFCE 2007-10, Observatoire Fran-cais des Conjonctures Economiques (OFCE).
Sutherland, H. and Figari, F. (2013)’EUROMOD: the European Union tax-benefit mi-crosimulation model’, International Journal of Microsimulation6(1): 4-26.
Tavora, I. (2013) ‘Female employment, labour market institutions and gender cul-ture in Portugal’, European Journal of Industrial Relations, 19: 221-237.
Thévenon, O. (2013) ‘Drivers of Female Labour Force Participation in the OECD‘. OECD Social, Employment and Migration Working Papers No. 145.
Woytinsky, W. S. (1940) ‘Additional Workers and the Volume of Unemployment in the Depression’, Washington Committee on Social Security, Social Science Research Council.

Secondary earners
and fiscal policies
in Europe
Appendices

70
Appendices
Appendix 1: Heterogeneity among couples in Europe
Table 1A. Descriptive statistics of working-age couples, SILC 2011
CountryNumber of
working age couples
Out of working age couples (%):
Couples where at least one partner receives.. Couple where both part-
ners have no employment
..old-age ben-efits
..disability benefits
..private pen-sions
..self-employ-ment income
AT 2,693 10.3 6.5 0.3 25.5 6.5
BE 2,644 6.8 8.4 0.4 16.0 11.9
BG 3,222 16.3 10.5 0.4 16.6 7.0
CY 2,182 6.3 5.0 0.5 29.7 3.7
CZ 4,004 13.0 12.9 1.6 28.0 7.5
DE 5,628 6.1 6.5 1.5 11.9 5.4
DK 3,008 0.0 13.1 0.0 47.2 3.1
EE 2,553 9.4 14.8 0.6 12.2 6.2
EL 2,686 14.6 2.5 0.3 36.4 13.3
ES 6,490 6.7 4.2 0.7 15.3 12.8
FI 5,198 6.5 15.0 6.3 22.2 3.7
FR 5,387 19.2 2.7 0.1 14.9 7.2
HR 3,056 13.9 19.8 0.0 22.6 18.5
HU 5,639 14.4 14.4 0.0 19.4 10.2
IE 1,879 5.9 22.0 1.5 21.4 13.9
IT 8,595 15.0 6.9 0.4 33.2 8.3
LT 2,331 7.4 22.1 0.0 19.6 8.8
LU 3,158 9.9 6.4 0.0 9.4 8.7
LV 2,507 8.8 10.3 0.0 11.9 5.6
MT 2,133 12.3 5.1 1.2 21.8 11.7
NL 5,563 24.3 7.9 1.4 22.0 5.0
PL 7,520 15.1 11.0 0.0 28.1 10.3
PT 2,673 9.5 5.3 0.7 21.0 10.3
RO 3,484 12.4 9.3 0.0 25.6 12.1
SE 3,359 12.0 10.0 5.8 21.7 2.4
SI 5,810 15.4 14.4 0.4 26.2 7.8
SK 2,931 12.9 11.3 0.8 16.7 8.5
UK 3,323 13.2 7.5 2.7 19.2 8.0
CH 3,540 4.0 6.7 1.1 15.8 2.2
IS 1,896 2.8 8.1 0.0 19.5 1.0
NO 2,555 10.9 21.2 1.2 17.1 1.6
Notes: Working age couples are in the age 16-64. Sources of income are defined by the standard EU-SILC varia-bles: old-age benefits (PY100g), disability benefits (PY130g), private pensions (PY080g), self-employment income (PY050g). Employment income includes self-employment income (PY050g) and employee cash or near cash inco-me (PY010g).
Source: EU-SILC 2011 (EU-SILC 2010 for Ireland), own calculations.
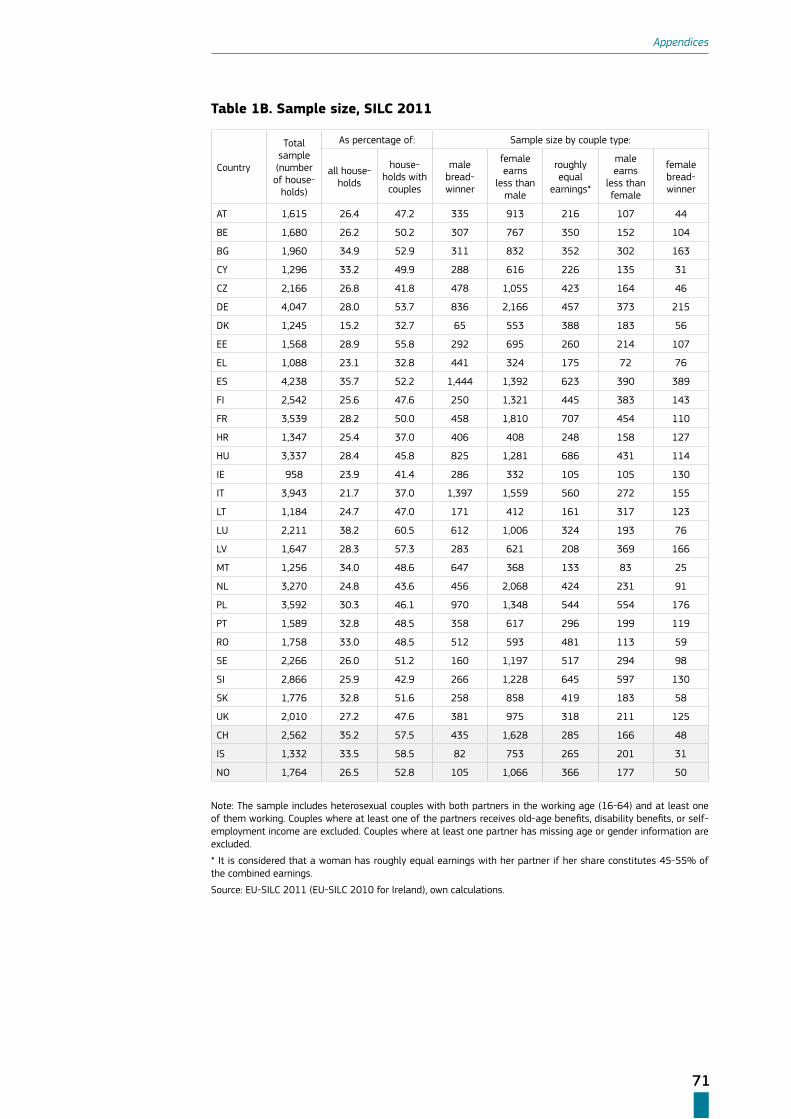
71
Appendices
Table 1B. Sample size, SILC 2011
Country
Total sample (number of house-
holds)
As percentage of: Sample size by couple type:
all house-holds
house-holds with
couples
male bread-winner
female earns
less than male
roughly equal
earnings*
male earns
less than female
female bread-winner
AT 1,615 26.4 47.2 335 913 216 107 44
BE 1,680 26.2 50.2 307 767 350 152 104
BG 1,960 34.9 52.9 311 832 352 302 163
CY 1,296 33.2 49.9 288 616 226 135 31
CZ 2,166 26.8 41.8 478 1,055 423 164 46
DE 4,047 28.0 53.7 836 2,166 457 373 215
DK 1,245 15.2 32.7 65 553 388 183 56
EE 1,568 28.9 55.8 292 695 260 214 107
EL 1,088 23.1 32.8 441 324 175 72 76
ES 4,238 35.7 52.2 1,444 1,392 623 390 389
FI 2,542 25.6 47.6 250 1,321 445 383 143
FR 3,539 28.2 50.0 458 1,810 707 454 110
HR 1,347 25.4 37.0 406 408 248 158 127
HU 3,337 28.4 45.8 825 1,281 686 431 114
IE 958 23.9 41.4 286 332 105 105 130
IT 3,943 21.7 37.0 1,397 1,559 560 272 155
LT 1,184 24.7 47.0 171 412 161 317 123
LU 2,211 38.2 60.5 612 1,006 324 193 76
LV 1,647 28.3 57.3 283 621 208 369 166
MT 1,256 34.0 48.6 647 368 133 83 25
NL 3,270 24.8 43.6 456 2,068 424 231 91
PL 3,592 30.3 46.1 970 1,348 544 554 176
PT 1,589 32.8 48.5 358 617 296 199 119
RO 1,758 33.0 48.5 512 593 481 113 59
SE 2,266 26.0 51.2 160 1,197 517 294 98
SI 2,866 25.9 42.9 266 1,228 645 597 130
SK 1,776 32.8 51.6 258 858 419 183 58
UK 2,010 27.2 47.6 381 975 318 211 125
CH 2,562 35.2 57.5 435 1,628 285 166 48
IS 1,332 33.5 58.5 82 753 265 201 31
NO 1,764 26.5 52.8 105 1,066 366 177 50
Note: The sample includes heterosexual couples with both partners in the working age (16-64) and at least one of them working. Couples where at least one of the partners receives old-age benefits, disability benefits, or self-employment income are excluded. Couples where at least one partner has missing age or gender information are excluded.
* It is considered that a woman has roughly equal earnings with her partner if her share constitutes 45-55% of the combined earnings.
Source: EU-SILC 2011 (EU-SILC 2010 for Ireland), own calculations.

72
Appendices
Table 1C. Demographic characteristics of couples with women as second-ary earners, SILC 2011
CountryWoman’s me-
dian ageMan’s me-dian age
Median age difference
Percentage of married
couples
Percentage of couples
with depen-dent children
Median age of the young-
est child
AT 42 45 3 82 56 8
BE 40 42 2 72 67 8
BG 38 42 3 89 66 9
CY 37 41 3 93 70 6
CZ 39 42 2 82 65 9
DE 42 44 2 84 57 8
DK 39 41 2 73 59 4
EE 38 40 2 68 65 6
EL 39 41 3 99 75 6
ES 39 42 2 88 68 7
FI 36 38 2 64 56 4
FR 38 41 2 64 65 6
HR 41 44 3 97 83 11
HU 39 42 3 80 67 9
IE 41 43 1 88 71 7
IT 41 44 3 90 71 7
LT 40 43 2 100* 75 10
LU 39 42 2 83 75 6
LV 38 40 2 79 68 6
MT 38 42 2 98 70 8
NL 42 44 2 82 58 6
PL 36 38 2 91 73 7
PT 39 41 2 85 72 8
RO 39 42 2 100 74 11
SE 39 41 2 65 62 4
SI 37 40 3 73 69 4
SK 42 45 2 95 66 12
UK 41 43 1 80 61 7
CH 42 44 2 83 53 6
IS 40 42 1 67 57 4
NO 39 42 2 69 61 5
Note: * In Lithuania all individuals who have a partner are coded as married.
Source: EU-SILC 2011 (EU-SILC 2010 for Ireland), own calculations.
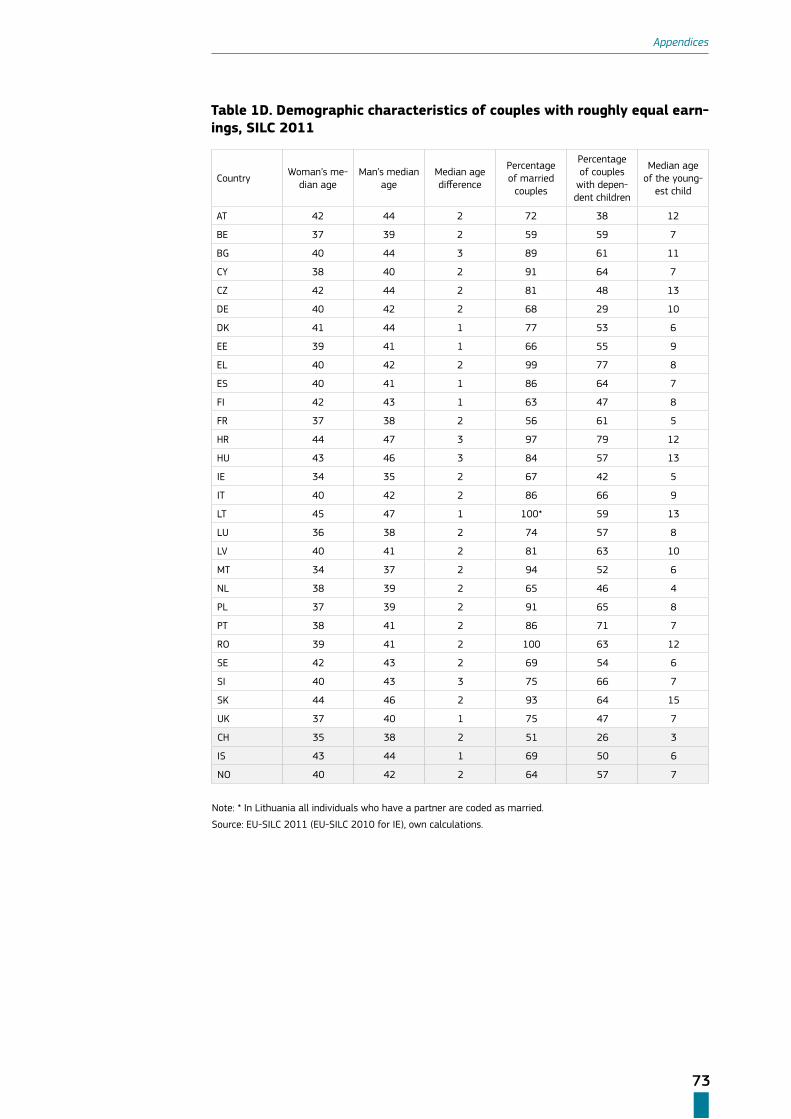
73
Appendices
Table 1D. Demographic characteristics of couples with roughly equal earn-ings, SILC 2011
CountryWoman’s me-
dian ageMan’s median
ageMedian age difference
Percentage of married
couples
Percentage of couples
with depen-dent children
Median age of the young-
est child
AT 42 44 2 72 38 12
BE 37 39 2 59 59 7
BG 40 44 3 89 61 11
CY 38 40 2 91 64 7
CZ 42 44 2 81 48 13
DE 40 42 2 68 29 10
DK 41 44 1 77 53 6
EE 39 41 1 66 55 9
EL 40 42 2 99 77 8
ES 40 41 1 86 64 7
FI 42 43 1 63 47 8
FR 37 38 2 56 61 5
HR 44 47 3 97 79 12
HU 43 46 3 84 57 13
IE 34 35 2 67 42 5
IT 40 42 2 86 66 9
LT 45 47 1 100* 59 13
LU 36 38 2 74 57 8
LV 40 41 2 81 63 10
MT 34 37 2 94 52 6
NL 38 39 2 65 46 4
PL 37 39 2 91 65 8
PT 38 41 2 86 71 7
RO 39 41 2 100 63 12
SE 42 43 2 69 54 6
SI 40 43 3 75 66 7
SK 44 46 2 93 64 15
UK 37 40 1 75 47 7
CH 35 38 2 51 26 3
IS 43 44 1 69 50 6
NO 40 42 2 64 57 7
Note: * In Lithuania all individuals who have a partner are coded as married.
Source: EU-SILC 2011 (EU-SILC 2010 for IE), own calculations.
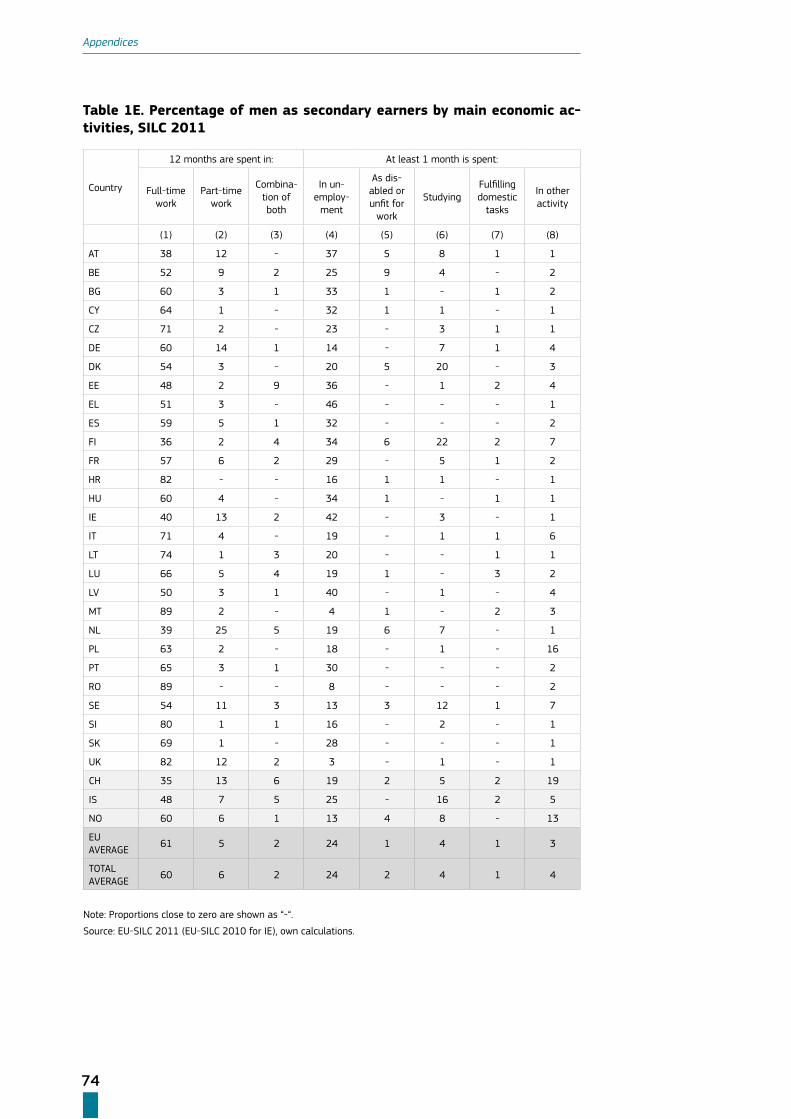
74
Appendices
Table 1E. Percentage of men as secondary earners by main economic ac-tivities, SILC 2011
Country
12 months are spent in: At least 1 month is spent:
Full-time work
Part-time work
Combina-tion of both
In un-employ-
ment
As dis-abled or unfit for
work
StudyingFulfilling domestic
tasks
In other activity
(1) (2) (3) (4) (5) (6) (7) (8)
AT 38 12 - 37 5 8 1 1
BE 52 9 2 25 9 4 - 2
BG 60 3 1 33 1 - 1 2
CY 64 1 - 32 1 1 - 1
CZ 71 2 - 23 - 3 1 1
DE 60 14 1 14 - 7 1 4
DK 54 3 - 20 5 20 - 3
EE 48 2 9 36 - 1 2 4
EL 51 3 - 46 - - - 1
ES 59 5 1 32 - - - 2
FI 36 2 4 34 6 22 2 7
FR 57 6 2 29 - 5 1 2
HR 82 - - 16 1 1 - 1
HU 60 4 - 34 1 - 1 1
IE 40 13 2 42 - 3 - 1
IT 71 4 - 19 - 1 1 6
LT 74 1 3 20 - - 1 1
LU 66 5 4 19 1 - 3 2
LV 50 3 1 40 - 1 - 4
MT 89 2 - 4 1 - 2 3
NL 39 25 5 19 6 7 - 1
PL 63 2 - 18 - 1 - 16
PT 65 3 1 30 - - - 2
RO 89 - - 8 - - - 2
SE 54 11 3 13 3 12 1 7
SI 80 1 1 16 - 2 - 1
SK 69 1 - 28 - - - 1
UK 82 12 2 3 - 1 - 1
CH 35 13 6 19 2 5 2 19
IS 48 7 5 25 - 16 2 5
NO 60 6 1 13 4 8 - 13
EU AVERAGE
61 5 2 24 1 4 1 3
TOTAL AVERAGE
60 6 2 24 2 4 1 4
Note: Proportions close to zero are shown as “-“.
Source: EU-SILC 2011 (EU-SILC 2010 for IE), own calculations.

75
Appendices
Appendix 2: Couples’ earnings
Table 2A. Median earnings in couples with a secondary earner (as a propor-tion of median earnings in balanced couples), 2012
Country
Couple with a secondary earner woman Couple with a secondary earner man
Her earnings His earningsCouple’s earnings
His earnings Her earningsCouple’s earnings
AT 48 118 87 65 117 88
BE 69 126 96 76 117 98
BG 66 136 105 59 109 85
CY 51 107 78 73 133 105
CZ 66 125 97 79 125 104
DE 41 125 86 53 100 76
DK 75 125 100 60 109 82
EE 65 148 109 73 126 99
EL 62 123 89 68 120 91
ES 48 105 78 56 99 79
FI 67 127 97 51 99 72
FR 66 125 95 65 114 89
HU 73 148 111 66 122 94
IE 45 119 81 64 110 88
IT 65 120 93 71 113 90
LT 47 132 92 51 118 86
LU 56 130 98 72 132 100
LV 53 148 107 51 119 89
MT 58 131 97 80 126 99
NL 52 132 94 59 114 87
PL 58 126 91 60 120 90
PT 74 145 114 84 148 118
RO 77 131 106 83 118 97
SE 67 120 93 60 105 79
SI 67 133 98 79 146 112
SK 74 125 104 67 115 84
UK 54 134 96 70 131 101
EU AVERAGE 61 128 96 66 119 92
Source: EUROMOD simulations for 2012 income.
76
Appendices
Appendix 3: Tax-benefit microsimulation model EUROMOD. Design, inputs and assumptions
EUROMOD is a static tax-benefit microsimulation model that estimates, in a compa-rable manner, the effects of taxes and benefits on income distribution, work incenti-ves and public budgets for the EU Member States. EUROMOD operates on anonymi-zed EU-SILC cross-sectional microdata.
EUROMOD is a static model in a sense that it does not capture changes in demo-graphic or labour market characteristics of the population between the data baseli-ne year and the analysed policy year36. However, it captures changes in the average levels of market incomes and in tax-benefit policies.
Changes in market income and other non-simulated sources of income (e.g. pen-sions or disability benefits) are modelled via uprating. Uprating is carried out using country and income specific updating factors based on available administrative or survey statistics. These factors reflect the change in the average amount of income from a particular source per recipient between the income data reference period and the target year. Whenever possible uprating factors are computed separately for different population groups, e.g. by sector for employment income or by pension bracket for old-age pensions.
EUROMOD simulates taxes, social security contributions and benefits based on their rules each year and information on characteristics of households and mar-ket incomes updated as described above. Tax-benefit policy elements simulated by EUROMOD include income taxes (national and local), social contributions (paid by the employees, self-employed and employers), family benefits, housing benefits, social assistance and other income-related benefits. Exceptions are those benefits and taxes that cannot be simulated due to the lack of necessary information in the underlying data. This mostly concerns benefits for which entitlement is based on previous contribution history (e.g. pensions) or unobserved characteristics (e.g. disability benefits). In these cases the values recorded in the data are uprated. All simulations are carried out on the basis of the tax-benefit rules in place on the 30th of June of the given policy year.
The results presented in this report are calculated using the latest available relea-se of the model: EUROMOD G1.0+ (released in August 2013).37 This version of the model contains policy systems updated up to 2012. The input datasets, with some exceptions, are based on the EU-SILC 2008 (with 2007 incomes) and EU-SILC 2010 (with 2009 incomes). Table 3A provides a comprehensive list of the datasets used.
36 Attempts to incorporate employment changes in EUROMOD are described in Navicke et al. (2013).
37 For Hungary and Greece the results are obtained using EUROMOD G2.0+ (July 2014).
77
Appendices
Documentation and validation of EUROMOD for each of the 27 Member States is available in EUROMOD Country Reports.38
Detailed information on the EUROMOD baseline results, the main reasons for dif-ferences between these and EU-SILC based indicators are reported in Jara and Su-therland (2013). The paper also highlights potential of EUROMOD as a tool for policy analysis and the caveats that should be borne in mind when using it and interpre-ting results. For to the current state of the art of EUROMOD development and its applications see Sutherland and Figari (2013).
The process of extending and updating EUROMOD is financially supported by the Directorate General for Employment, Social Affairs and Inclusion of the European Commission [Progress grant no. VS/2011/0445].
Access to EU-SILC microdata is made available by Eurostat under contracts EU-SILC/2009/17 and EU-SILC/2011/55, the Italian version of the EU-SILC (IT-SILC) made available by ISTAT, the Austrian version of the EU-SILC made available by Statistics Austria, the Lithuanian version of the EU-SILC (PGS) made available by the Lithuanian Department of Statistics, variables from the Greek SILC Production Database (PDB) made available by the Greek Statistical Office and the Family Re-sources Survey (FRS), made available by the UK Department of Work and Pensions (DWP) through the UK Data Archive. Material from the FRS is Crown Copyright and is used with permission. Neither the DWP nor the Data Archive bears any respon-sibility for the analysis or interpretation of the data reported here. An equivalent disclaimer applies to all other data sources and their respective providers cited in this acknowledgement.
38 https://www.iser.essex.ac.uk/euromod/resources-for-euromod-users/country-reports
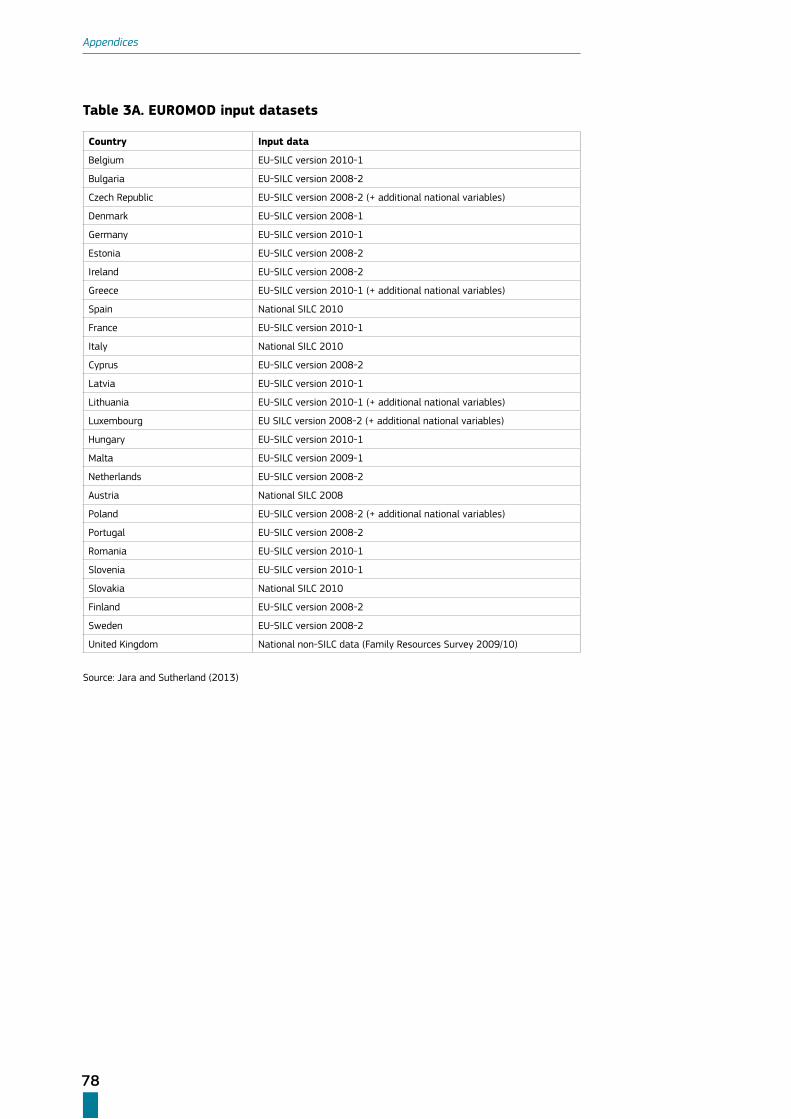
78
Appendices
Table 3A. EUROMOD input datasets
Country Input data
Belgium EU-SILC version 2010-1
Bulgaria EU-SILC version 2008-2
Czech Republic EU-SILC version 2008-2 (+ additional national variables)
Denmark EU-SILC version 2008-1
Germany EU-SILC version 2010-1
Estonia EU-SILC version 2008-2
Ireland EU-SILC version 2008-2
Greece EU-SILC version 2010-1 (+ additional national variables)
Spain National SILC 2010
France EU-SILC version 2010-1
Italy National SILC 2010
Cyprus EU-SILC version 2008-2
Latvia EU-SILC version 2010-1
Lithuania EU-SILC version 2010-1 (+ additional national variables)
Luxembourg EU SILC version 2008-2 (+ additional national variables)
Hungary EU-SILC version 2010-1
Malta EU-SILC version 2009-1
Netherlands EU-SILC version 2008-2
Austria National SILC 2008
Poland EU-SILC version 2008-2 (+ additional national variables)
Portugal EU-SILC version 2008-2
Romania EU-SILC version 2010-1
Slovenia EU-SILC version 2010-1
Slovakia National SILC 2010
Finland EU-SILC version 2008-2
Sweden EU-SILC version 2008-2
United Kingdom National non-SILC data (Family Resources Survey 2009/10)
Source: Jara and Sutherland (2013)
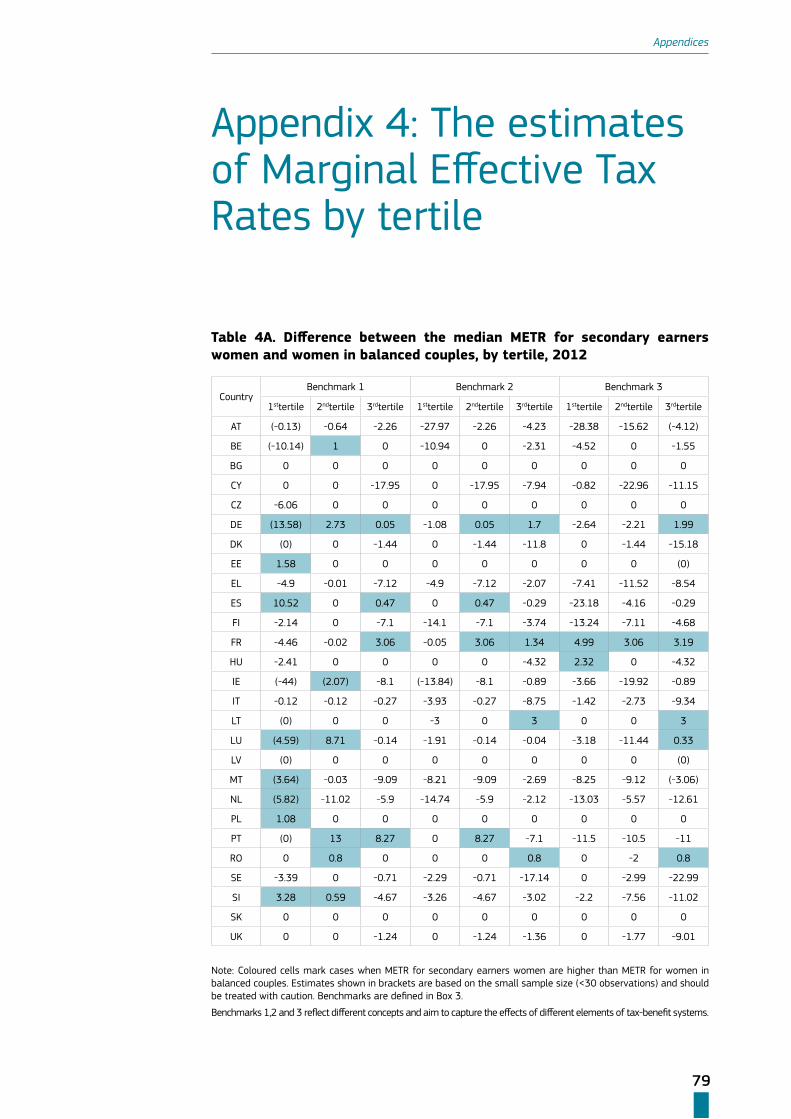
79
Appendices
Appendix 4: The estimates of Marginal Effective Tax Rates by tertile
Table 4A. Difference between the median METR for secondary earners women and women in balanced couples, by tertile, 2012
CountryBenchmark 1 Benchmark 2 Benchmark 3
1sttertile 2ndtertile 3rdtertile 1sttertile 2ndtertile 3rdtertile 1sttertile 2ndtertile 3rdtertile
AT (-0.13) -0.64 -2.26 -27.97 -2.26 -4.23 -28.38 -15.62 (-4.12)
BE (-10.14) 1 0 -10.94 0 -2.31 -4.52 0 -1.55
BG 0 0 0 0 0 0 0 0 0
CY 0 0 -17.95 0 -17.95 -7.94 -0.82 -22.96 -11.15
CZ -6.06 0 0 0 0 0 0 0 0
DE (13.58) 2.73 0.05 -1.08 0.05 1.7 -2.64 -2.21 1.99
DK (0) 0 -1.44 0 -1.44 -11.8 0 -1.44 -15.18
EE 1.58 0 0 0 0 0 0 0 (0)
EL -4.9 -0.01 -7.12 -4.9 -7.12 -2.07 -7.41 -11.52 -8.54
ES 10.52 0 0.47 0 0.47 -0.29 -23.18 -4.16 -0.29
FI -2.14 0 -7.1 -14.1 -7.1 -3.74 -13.24 -7.11 -4.68
FR -4.46 -0.02 3.06 -0.05 3.06 1.34 4.99 3.06 3.19
HU -2.41 0 0 0 0 -4.32 2.32 0 -4.32
IE (-44) (2.07) -8.1 (-13.84) -8.1 -0.89 -3.66 -19.92 -0.89
IT -0.12 -0.12 -0.27 -3.93 -0.27 -8.75 -1.42 -2.73 -9.34
LT (0) 0 0 -3 0 3 0 0 3
LU (4.59) 8.71 -0.14 -1.91 -0.14 -0.04 -3.18 -11.44 0.33
LV (0) 0 0 0 0 0 0 0 (0)
MT (3.64) -0.03 -9.09 -8.21 -9.09 -2.69 -8.25 -9.12 (-3.06)
NL (5.82) -11.02 -5.9 -14.74 -5.9 -2.12 -13.03 -5.57 -12.61
PL 1.08 0 0 0 0 0 0 0 0
PT (0) 13 8.27 0 8.27 -7.1 -11.5 -10.5 -11
RO 0 0.8 0 0 0 0.8 0 -2 0.8
SE -3.39 0 -0.71 -2.29 -0.71 -17.14 0 -2.99 -22.99
SI 3.28 0.59 -4.67 -3.26 -4.67 -3.02 -2.2 -7.56 -11.02
SK 0 0 0 0 0 0 0 0 0
UK 0 0 -1.24 0 -1.24 -1.36 0 -1.77 -9.01
Note: Coloured cells mark cases when METR for secondary earners women are higher than METR for women in balanced couples. Estimates shown in brackets are based on the small sample size (<30 observations) and should be treated with caution. Benchmarks are defined in Box 3.
Benchmarks 1,2 and 3 reflect different concepts and aim to capture the effects of different elements of tax-benefit systems.

80
Appendices
Therefore in general one should not expect the same outcomes for each benchmark. Yet, independently of the choice of benchmark, there are three strong cases where female secondary earners appear to be penalized: DE, FR and PT.
Source: EUROMOD simulations for 2012 income.
Table 4B. Difference between the median METR for secondary earners men and men in balanced couples, by tertile, 2012
Country
Benchmark 1 Benchmark 2 Benchmark 3
1st tertile
2nd ter-
tile 3rd tertile 1st tertile
2nd ter-
tile 3rd tertile 1st tertile
2nd ter-
tile 3rd tertile
AT -24.61 (0.08) 0.63 -25.26 (-0.08) 0.03 (-28.38) (-0.63) -3.84
BE -10.74 -0.59 (-3.56) -11.21 0.64 -3.56 -11.4 0 -2.46
BG 0 0 (0) 0 0 0 0 0 0
CY 0 (0) (-2.99) 0 -3.7 (-4.07) (-0.82) (-6.45) -9.81
CZ 0 0 (0) 0 0 0 -6 0 0
DE 0.76 1.18 0.97 -1.84 -0.46 0.84 -5.74 -2.69 0.49
DK 0 0.64 0.96 0 (-1.44) -6.9 0 (-1.44) -13.07
EE 0 0 0 0 0 0 0 0 0
EL -3.08 (0) (0.49) -8 (-5.56) (0) (-8) (-10.05) -2.08
ES 0 0 -0.01 -23.18 0 -0.01 -23.18 -4.63 -0.29
FI -9.07 -0.31 0 -14.61 -1.09 -3.74 -20.46 -10.41 -3.74
FR -4.78 1.54 2.25 0.8 3.9 1.74 4.38 6.71 1.99
HU 0 0 0 1.97 0 -4.32 2.53 0 -4.32
IE (-1.46) 18.9 (-0.01) -4 0 -0.3 (-6.68) 0 -0.3
IT -2.08 -0.12 -1.48 -3.42 -0.88 -7.02 -6.99 -1.6 -8.97
LT -3 0 3 -3 0 3 0 0 3
LU 1.34 (7.6) (0.34) -5.08 -2.1 -0.5 -5.38 -12.08 -0.07
LV (0) 0 0 0 0 0 0 0 0
MT (-2.19) (-0.01) (0) -8.22 (-9.05) (0) (-13.7) (-9.14) (-2.68)
NL -8.8 0 0 -7.35 -0.03 -1.39 -4.34 -0.05 -1.39
PL 0 0 0 0 0 0 0 0 0
PT 4.41 10.5 0 0 0 -7.1 (0) 0 -11
RO 0 0 (0) 0 0 0.8 (0) 0 0
SE 0 -1.55 15.62 -1.17 -2.99 -19.99 -1.17 -2.99 -20.61
SI -0.97 2.62 0.73 -3.1 -3.86 -6.8 -2.94 -5.75 -11.22
SK 0 0 -0.01 -0.15 0 0 -5.02 0 0
UK 0 0 -0.18 0 0 -2.4 0 -0.62 -5.45
Note: Coloured cells mark cases when METR for secondary earners men are higher than METR for men in balanced couples. Estimates shown in brackets are based on the small sample size (<30 observations) and should be treated with caution. Benchmarks are defined in Box 3.
Source: EUROMOD simulations for 2012 income.
81
Appendices
Appendix 5: OECD Tax-benefit model: design, inputs and assumptions
The OECD Tax-Benefit models39 are available for 33 OECD countries and 6 addi-tional EU countries40 for the period 2001-2012. They provide basis for analysis of the effects of taxes and benefits on the incomes of working age individuals and their families both in and out of work. These data reveal country-specific trends in the generosity and incentive effects of tax and benefit regimes. More specifically, the models allow calculating the net in-work and out-of-work incomes on a comparable basis across countries. Net incomes are equal to gross earnings, plus cash benefits, minus income taxes and own social security contributions.
The models are designed for different types of families (single with/without children, one-earner couples with/without children, two-earner couples with/without children). There is a standard set of family types, with income levels fixed at 33/67/100/167% of the OECD estimated Average Wage in the country. The interactive variant of the model allows using control files in order to change the parameters of the model. We used that option in order to get closer to the real wage of specific category of workers. In particular, we set the level of income shares for the male and female partner based on the EU-SILC calculations for the specific group, in percentage of OECD AW (for more details on this approach see Bettio and Verashchagina 2009).
In our estimates based on OECD model we used the latest EU-SILC 2011 release for all countries, with income data for the end of 2010, differently from EUROMOD which for a large set of countries relies on projected values of income in 2012.41
An advantage of the OECD model is that it allows calculating both METR and PTR, the latter being an incentive indicator for potential entrants (see Box 2). The proce-dure for calculating PTR is more complex in EUROMOD, thus we could only report PTR values calculated with OECD models.
39 The Models are available for download from http://www.oecd.org/els/soc/Models.zip
In addition, OECD has an open access database with description of tax-benefit system for each country covered by this project: http://www.oecd.org/social/benefitsandwagesoecdindicators.htm
40 Including Cyprus, Lithuania, Latvia, Malta (2005+), Bulgaria, Romania (2008+).
41 We use the version of Tax-Benefit models made available by the 19th of March 2014, with the latest tax-benefit rules for the 1st of July 2012.
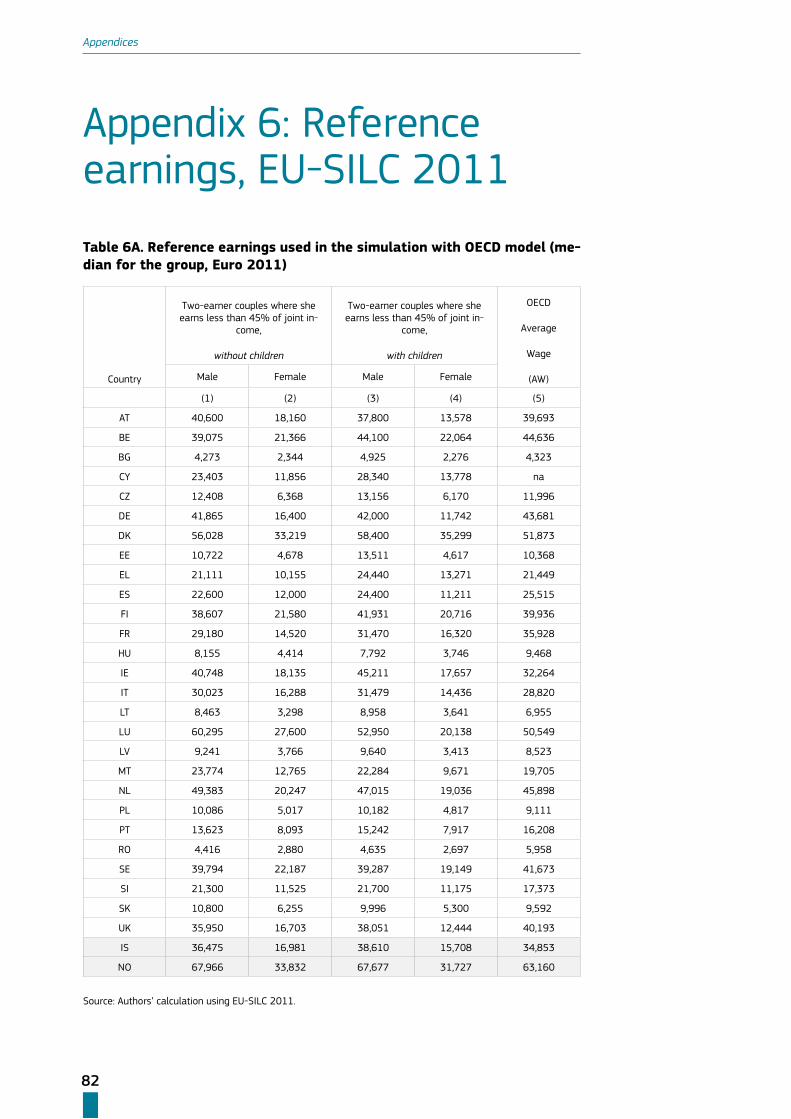
82
Appendices
Appendix 6: Reference earnings, EU-SILC 2011
Table 6A. Reference earnings used in the simulation with OECD model (me-dian for the group, Euro 2011)
Country
Two-earner couples where she earns less than 45% of joint in-
come,
without children
Two-earner couples where she earns less than 45% of joint in-
come,
with children
OECD
Average
Wage
(AW)Male Female Male Female
(1) (2) (3) (4) (5)
AT 40,600 18,160 37,800 13,578 39,693
BE 39,075 21,366 44,100 22,064 44,636
BG 4,273 2,344 4,925 2,276 4,323
CY 23,403 11,856 28,340 13,778 na
CZ 12,408 6,368 13,156 6,170 11,996
DE 41,865 16,400 42,000 11,742 43,681
DK 56,028 33,219 58,400 35,299 51,873
EE 10,722 4,678 13,511 4,617 10,368
EL 21,111 10,155 24,440 13,271 21,449
ES 22,600 12,000 24,400 11,211 25,515
FI 38,607 21,580 41,931 20,716 39,936
FR 29,180 14,520 31,470 16,320 35,928
HU 8,155 4,414 7,792 3,746 9,468
IE 40,748 18,135 45,211 17,657 32,264
IT 30,023 16,288 31,479 14,436 28,820
LT 8,463 3,298 8,958 3,641 6,955
LU 60,295 27,600 52,950 20,138 50,549
LV 9,241 3,766 9,640 3,413 8,523
MT 23,774 12,765 22,284 9,671 19,705
NL 49,383 20,247 47,015 19,036 45,898
PL 10,086 5,017 10,182 4,817 9,111
PT 13,623 8,093 15,242 7,917 16,208
RO 4,416 2,880 4,635 2,697 5,958
SE 39,794 22,187 39,287 19,149 41,673
SI 21,300 11,525 21,700 11,175 17,373
SK 10,800 6,255 9,996 5,300 9,592
UK 35,950 16,703 38,051 12,444 40,193
IS 36,475 16,981 38,610 15,708 34,853
NO 67,966 33,832 67,677 31,727 63,160
Source: Authors’ calculation using EU-SILC 2011.
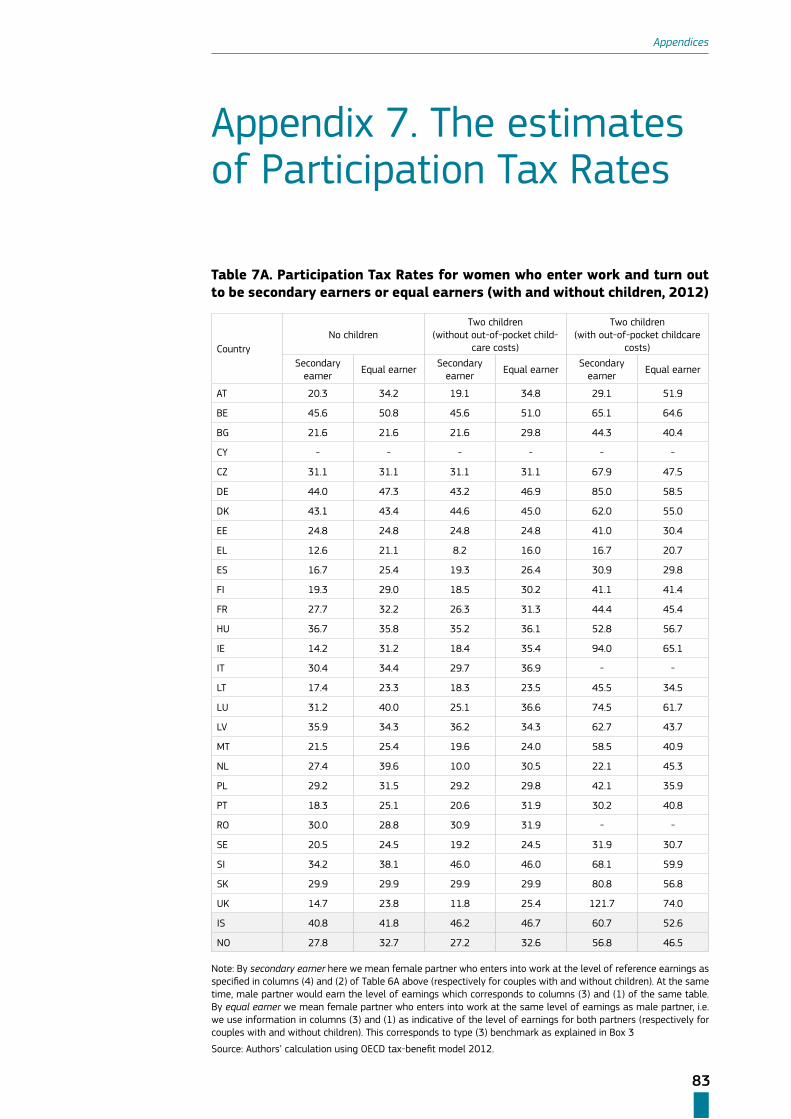
83
Appendices
Appendix 7. The estimates of Participation Tax Rates
Table 7A. Participation Tax Rates for women who enter work and turn out to be secondary earners or equal earners (with and without children, 2012)
CountryNo children
Two children (without out-of-pocket child-
care costs)
Two children (with out-of-pocket childcare
costs)Secondary
earnerEqual earner
Secondary earner
Equal earnerSecondary
earnerEqual earner
AT 20.3 34.2 19.1 34.8 29.1 51.9
BE 45.6 50.8 45.6 51.0 65.1 64.6
BG 21.6 21.6 21.6 29.8 44.3 40.4
CY - - - - - -
CZ 31.1 31.1 31.1 31.1 67.9 47.5
DE 44.0 47.3 43.2 46.9 85.0 58.5
DK 43.1 43.4 44.6 45.0 62.0 55.0
EE 24.8 24.8 24.8 24.8 41.0 30.4
EL 12.6 21.1 8.2 16.0 16.7 20.7
ES 16.7 25.4 19.3 26.4 30.9 29.8
FI 19.3 29.0 18.5 30.2 41.1 41.4
FR 27.7 32.2 26.3 31.3 44.4 45.4
HU 36.7 35.8 35.2 36.1 52.8 56.7
IE 14.2 31.2 18.4 35.4 94.0 65.1
IT 30.4 34.4 29.7 36.9 - -
LT 17.4 23.3 18.3 23.5 45.5 34.5
LU 31.2 40.0 25.1 36.6 74.5 61.7
LV 35.9 34.3 36.2 34.3 62.7 43.7
MT 21.5 25.4 19.6 24.0 58.5 40.9
NL 27.4 39.6 10.0 30.5 22.1 45.3
PL 29.2 31.5 29.2 29.8 42.1 35.9
PT 18.3 25.1 20.6 31.9 30.2 40.8
RO 30.0 28.8 30.9 31.9 - -
SE 20.5 24.5 19.2 24.5 31.9 30.7
SI 34.2 38.1 46.0 46.0 68.1 59.9
SK 29.9 29.9 29.9 29.9 80.8 56.8
UK 14.7 23.8 11.8 25.4 121.7 74.0
IS 40.8 41.8 46.2 46.7 60.7 52.6
NO 27.8 32.7 27.2 32.6 56.8 46.5
Note: By secondary earner here we mean female partner who enters into work at the level of reference earnings as specified in columns (4) and (2) of Table 6A above (respectively for couples with and without children). At the same time, male partner would earn the level of earnings which corresponds to columns (3) and (1) of the same table. By equal earner we mean female partner who enters into work at the same level of earnings as male partner, i.e. we use information in columns (3) and (1) as indicative of the level of earnings for both partners (respectively for couples with and without children). This corresponds to type (3) benchmark as explained in Box 3
Source: Authors’ calculation using OECD tax-benefit model 2012.
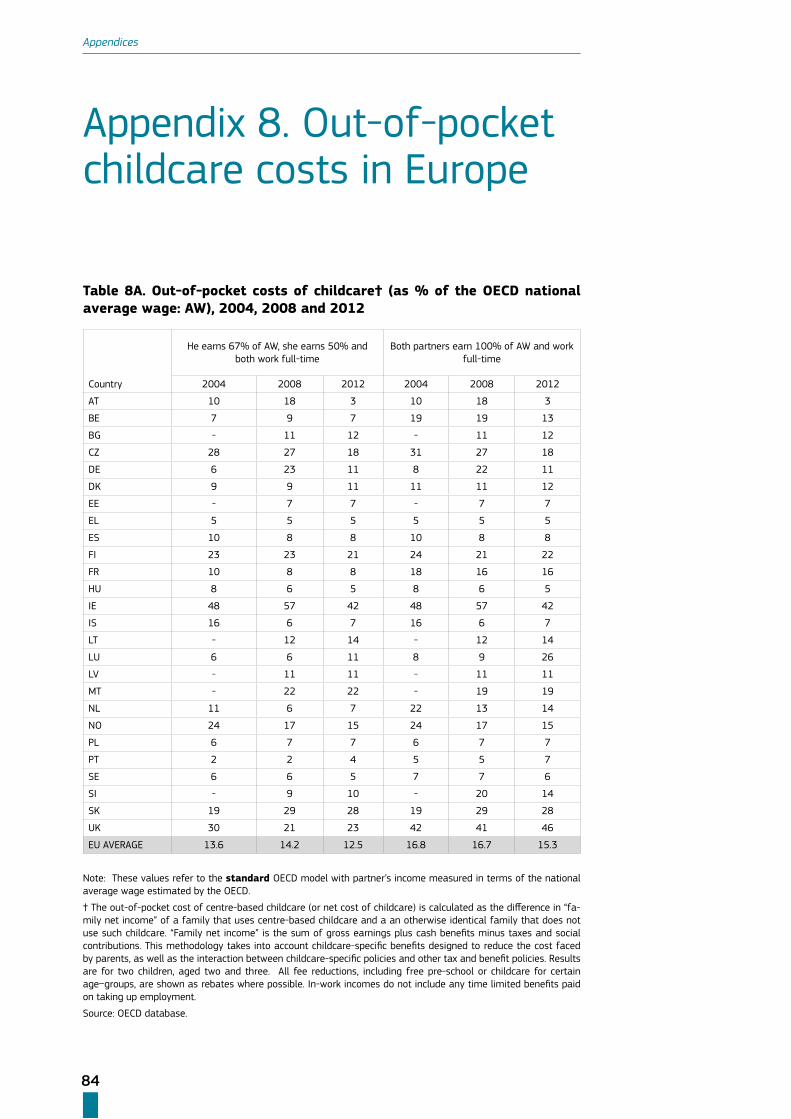
84
Appendices
Appendix 8. Out-of-pocket childcare costs in Europe
Table 8A. Out-of-pocket costs of childcare† (as % of the OECD national average wage: AW), 2004, 2008 and 2012
Country
He earns 67% of AW, she earns 50% and both work full-time
Both partners earn 100% of AW and work full-time
2004 2008 2012 2004 2008 2012
AT 10 18 3 10 18 3
BE 7 9 7 19 19 13
BG - 11 12 - 11 12
CZ 28 27 18 31 27 18
DE 6 23 11 8 22 11
DK 9 9 11 11 11 12
EE - 7 7 - 7 7
EL 5 5 5 5 5 5
ES 10 8 8 10 8 8
FI 23 23 21 24 21 22
FR 10 8 8 18 16 16
HU 8 6 5 8 6 5
IE 48 57 42 48 57 42
IS 16 6 7 16 6 7
LT - 12 14 - 12 14
LU 6 6 11 8 9 26
LV - 11 11 - 11 11
MT - 22 22 - 19 19
NL 11 6 7 22 13 14
NO 24 17 15 24 17 15
PL 6 7 7 6 7 7
PT 2 2 4 5 5 7
SE 6 6 5 7 7 6
SI - 9 10 - 20 14
SK 19 29 28 19 29 28
UK 30 21 23 42 41 46
EU AVERAGE 13.6 14.2 12.5 16.8 16.7 15.3
Note: These values refer to the standard OECD model with partner’s income measured in terms of the national average wage estimated by the OECD.
† The out-of-pocket cost of centre-based childcare (or net cost of childcare) is calculated as the difference in “fa-mily net income” of a family that uses centre-based childcare and a an otherwise identical family that does not use such childcare. “Family net income” is the sum of gross earnings plus cash benefits minus taxes and social contributions. This methodology takes into account childcare-specific benefits designed to reduce the cost faced by parents, as well as the interaction between childcare-specific policies and other tax and benefit policies. Results are for two children, aged two and three. All fee reductions, including free pre-school or childcare for certain age‑groups, are shown as rebates where possible. In-work incomes do not include any time limited benefits paid on taking up employment.
Source: OECD database.
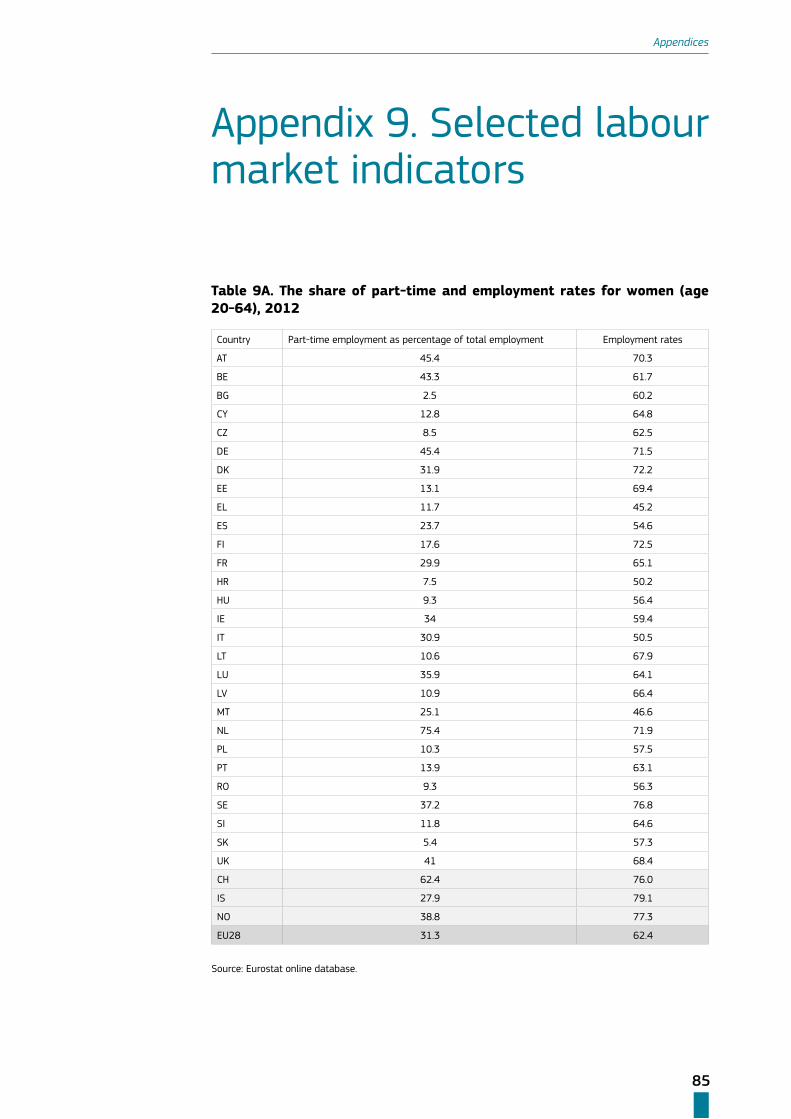
85
Appendices
Appendix 9. Selected labour market indicators
Table 9A. The share of part-time and employment rates for women (age 20-64), 2012
Country Part-time employment as percentage of total employment Employment rates
AT 45.4 70.3
BE 43.3 61.7
BG 2.5 60.2
CY 12.8 64.8
CZ 8.5 62.5
DE 45.4 71.5
DK 31.9 72.2
EE 13.1 69.4
EL 11.7 45.2
ES 23.7 54.6
FI 17.6 72.5
FR 29.9 65.1
HR 7.5 50.2
HU 9.3 56.4
IE 34 59.4
IT 30.9 50.5
LT 10.6 67.9
LU 35.9 64.1
LV 10.9 66.4
MT 25.1 46.6
NL 75.4 71.9
PL 10.3 57.5
PT 13.9 63.1
RO 9.3 56.3
SE 37.2 76.8
SI 11.8 64.6
SK 5.4 57.3
UK 41 68.4
CH 62.4 76.0
IS 27.9 79.1
NO 38.8 77.3
EU28 31.3 62.4
Source: Eurostat online database.
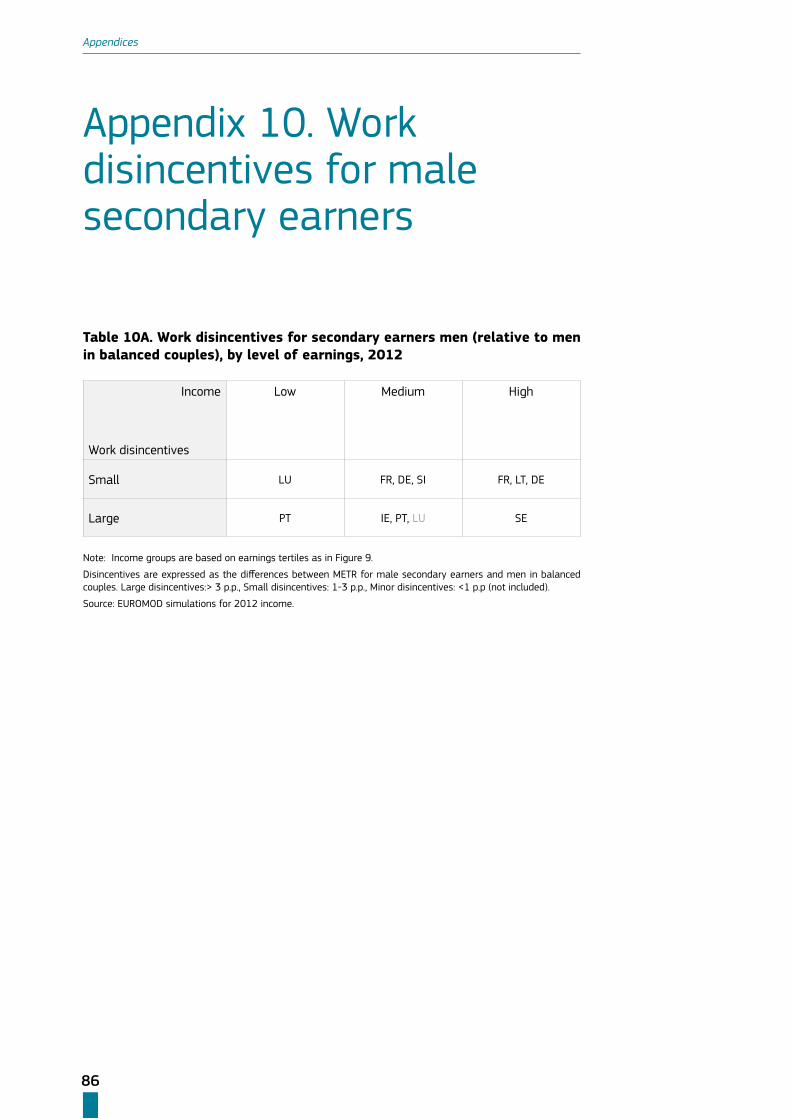
86
Appendices
Appendix 10. Work disincentives for male secondary earners
Table 10A. Work disincentives for secondary earners men (relative to men in balanced couples), by level of earnings, 2012
Income
Work disincentives
Low Medium High
Small LU FR, DE, SI FR, LT, DE
Large PT IE, PT, LU SE
Note: Income groups are based on earnings tertiles as in Figure 9.
Disincentives are expressed as the differences between METR for male secondary earners and men in balanced couples. Large disincentives:> 3 p.p., Small disincentives: 1-3 p.p., Minor disincentives: <1 p.p (not included).
Source: EUROMOD simulations for 2012 income.


European CommissionSecondary earners and fiscal policies in EuropeLuxembourg: Publications Office of the European Union 2015ISBN: 978-92-79-47457-6doi: 10.2838/539560

DS-02-15-322-EN
-Ndoi: 10.2838/539560