Second Quarter 2014 Consolidated Financial Statements · Second Quarter 2014 Consolidated Financial...
17
1 Second Quarter 2014 Consolidated Financial Statements Revenues reached S/. 1,562.6 million, a 6.7% increase versus 2Q13; sales volume reached 441.3 thousand tons, a 6.3% increase versus 2Q13. Net Income reached S/.66.9 million, a remarkable 34.8% increase compared to 2Q13 Lima, Peru, July 30, 2014. Alicorp S.A.A. (“the Company” or “Alicorp”) (BVL: ALICORC1 and ALICORI1) announced today its unaudited financial results corresponding to the Second Quarter 2014 (2Q14). Financial figures are reported on a consolidated basis in accordance with International Financial Reporting Standards (“IFRS”) in nominal Peruvian Nuevos Soles, based on the following statements, which should be read in conjunction with the Financial Statements and Notes to the Financial Statements published at the Peruvian Securities and Exchange Commission (Superintendencia del Mercado de Valores (SMV)). I. FINANCIAL HIGHLIGHTS During 2Q14, Net Sales reached S/. 1,562.6 million, a 6.7% increase versus 2Q13. Sales volume reached 441.3 thousand tons, a 6.3% increase versus 2Q13, due mainly from revenue increases in pasta, laundry detergents, sauces, industrial flour and fish and shrimp feed. International Revenues represented 38.9% of Total Revenues due to strong sales in Argentina, Ecuador and Brazil. INVESTOR RELATIONS CONTACT Fiorella Debernardi Baertl Treasury Manager & IRO T: (511) 315-0820 F: (511) 315-0867 E-mail: [email protected]
Transcript of Second Quarter 2014 Consolidated Financial Statements · Second Quarter 2014 Consolidated Financial...
1
Second Quarter 2014 Consolidated Financial Statements
Revenues reached S/. 1,562.6 million, a 6.7% increase
versus 2Q13; sales volume reached 441.3 thousand tons, a
6.3% increase versus 2Q13. Net Income reached S/.66.9
million, a remarkable 34.8% increase compared to 2Q13
Lima, Peru, July 30, 2014. Alicorp S.A.A. (“the Company” or “Alicorp”) (BVL: ALICORC1 and ALICORI1) announced today
its unaudited financial results corresponding to the Second Quarter 2014 (2Q14). Financial figures are reported on a
consolidated basis in accordance with International Financial Reporting Standards (“IFRS”) in nominal Peruvian Nuevos
Soles, based on the following statements, which should be read in conjunction with the Financial Statements and
Notes to the Financial Statements published at the Peruvian Securities and Exchange Commission (Superintendencia
del Mercado de Valores (SMV)).
I. FINANCIAL HIGHLIGHTS
During 2Q14, Net Sales reached S/. 1,562.6 million, a 6.7% increase versus 2Q13. Sales volume reached 441.3
thousand tons, a 6.3% increase versus 2Q13, due mainly from revenue increases in pasta, laundry detergents,
sauces, industrial flour and fish and shrimp feed. International Revenues represented 38.9% of Total Revenues due
to strong sales in Argentina, Ecuador and Brazil.
INVESTOR RELATIONS CONTACT
Fiorella Debernardi Baertl
Treasury Manager & IRO
T: (511) 315-0820
F: (511) 315-0867
E-mail: [email protected]
2
Gross Profit totaled S/. 433.3 million during 2Q14, a 7.0% increase compared to S/. 404.8 million in 2Q13, mainly
due to an increase in Sales. Gross Margin increased to 27.7% in 2Q14 compared to 27.6% reported in 2Q13.
EBITDA reached S/. 164.1 million during 2Q14, a 16.3% decrease compared to the S/. 196.1 million reported in
2Q13, the second highest EBITDA in Alicorp´s history. EBITDA margin decreased from 13.4% in 2Q13 to 10.5% in
2Q14, due to higher SG&A expenses, non-recurring expenses related to the recent acquisition of Global Alimentos,
marketing expenses for new launchings and other operational expenses. Without considering Global´s expenses,
EBITDA margin for 2Q14 would be 11.4%. Net income for the quarter reached S/._66.9 million, a 34.8% increase
compared to S/. 49.7 million reported in 2Q13.
Alicorp strategic focus in organic growth has been very important this year. As such, the company was very active
in product innovation during 2Q14, with the launching and re-launching of a variety of products: In Peru, in the
consumer goods business, Alicorp launched a softener under the Bolivar brand. In the household flour category,
we launched a new line of ready to cook premixes under the Blanca Flor brand. In the industrial products segment,
Alicorp re-launched 2 products under the Blanca Nieve brand and 1 under the Inca brand. In the shortenings
category, we launched 2 new presentations under the Famosa brand. In Argentina, Alicorp introduced to the
market a new pasta sub-line under the Nutregal brand, named “Nutregal Energia”; as well as a new cookie line
under the Okebon brand, a new variety of Plusbelle kids and a new laundry detergent format under the Zorro
brand. In Brazil, the company also introduce a new variety of household flour under the Santa Amalia brand, a new
sub-line of pasta named Santa Amalia Speciale Romance, a shredded cheese under the same brand and 3 flavors of
ready-to-eat pasta under the Santa Amalia Lamen brand.
In April, Alicorp acquired Global Alimentos S.A.C., the leading cereal and snack bars company in Peru. This
transaction result in non-recurring expenses in consulting, legal fees, as well as other services that generated an
impact of 14.4 million in Administrative Expenses in the second quarter.
Alicorp, completed a capital injection to its subsidiary in Brazil, Pastificio Santa Amalia, for USD 59.6 million In May
and July of 2014. These funds were used to reduce the Company’s financial leverage as well as to restructure the
consolidated debt at lower interest rates.
3
FINANCIAL INFORMATION
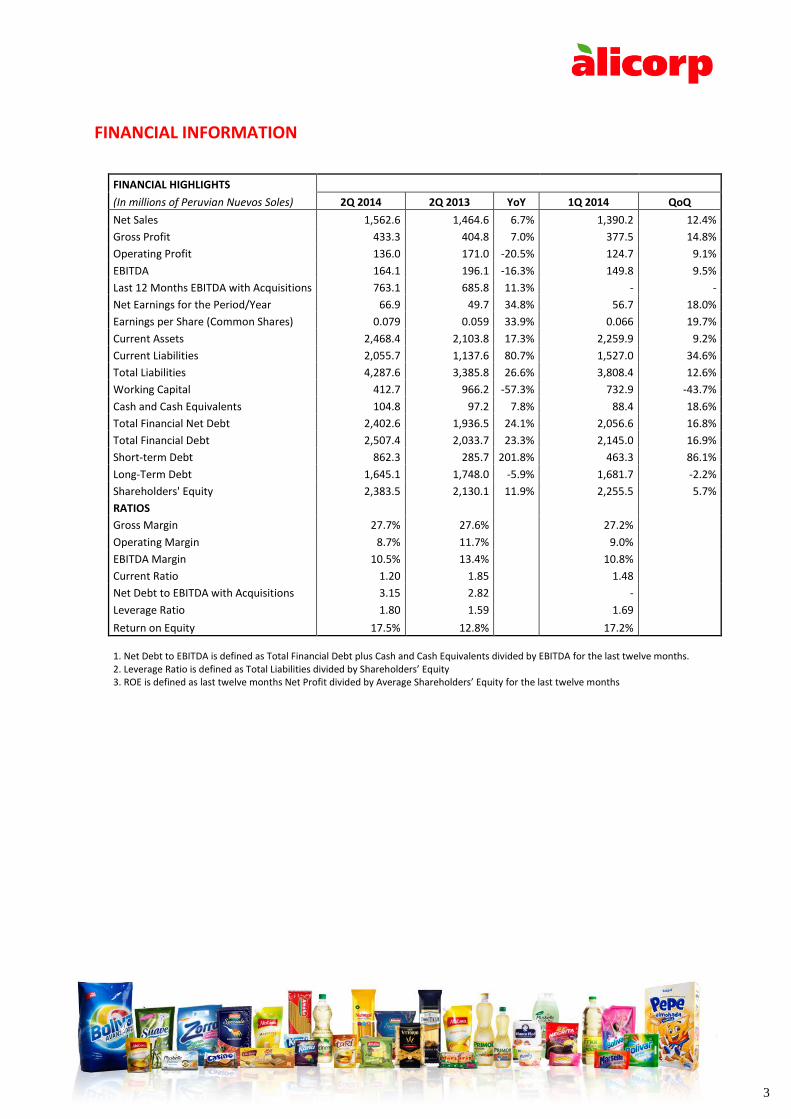
FINANCIAL HIGHLIGHTS (In millions of Peruvian Nuevos Soles) 2Q 2014 2Q 2013 YoY 1Q 2014 QoQ
Net Sales 1,562.6 1,464.6 6.7% 1,390.2 12.4%
Gross Profit 433.3 404.8 7.0% 377.5 14.8%
Operating Profit 136.0 171.0 -20.5% 124.7 9.1%
EBITDA 164.1 196.1 -16.3% 149.8 9.5%
Last 12 Months EBITDA with Acquisitions 763.1 685.8 11.3% - -
Net Earnings for the Period/Year 66.9 49.7 34.8% 56.7 18.0%
Earnings per Share (Common Shares) 0.079 0.059 33.9% 0.066 19.7%
Current Assets 2,468.4 2,103.8 17.3% 2,259.9 9.2%
Current Liabilities 2,055.7 1,137.6 80.7% 1,527.0 34.6%
Total Liabilities 4,287.6 3,385.8 26.6% 3,808.4 12.6%
Working Capital 412.7 966.2 -57.3% 732.9 -43.7%
Cash and Cash Equivalents 104.8 97.2 7.8% 88.4 18.6%
Total Financial Net Debt 2,402.6 1,936.5 24.1% 2,056.6 16.8%
Total Financial Debt 2,507.4 2,033.7 23.3% 2,145.0 16.9%
Short-term Debt 862.3 285.7 201.8% 463.3 86.1%
Long-Term Debt 1,645.1 1,748.0 -5.9% 1,681.7 -2.2%
Shareholders' Equity 2,383.5 2,130.1 11.9% 2,255.5 5.7%
RATIOS Gross Margin 27.7% 27.6%
27.2%
Operating Margin 8.7% 11.7%
9.0% EBITDA Margin 10.5% 13.4%
10.8%
Current Ratio 1.20 1.85
1.48 Net Debt to EBITDA with Acquisitions 3.15 2.82
-
Leverage Ratio 1.80 1.59
1.69 Return on Equity 17.5% 12.8%
17.2%
1. Net Debt to EBITDA is defined as Total Financial Debt plus Cash and Cash Equivalents divided by EBITDA for the last twelve months. 2. Leverage Ratio is defined as Total Liabilities divided by Shareholders’ Equity 3. ROE is defined as last twelve months Net Profit divided by Average Shareholders’ Equity for the last twelve months
4
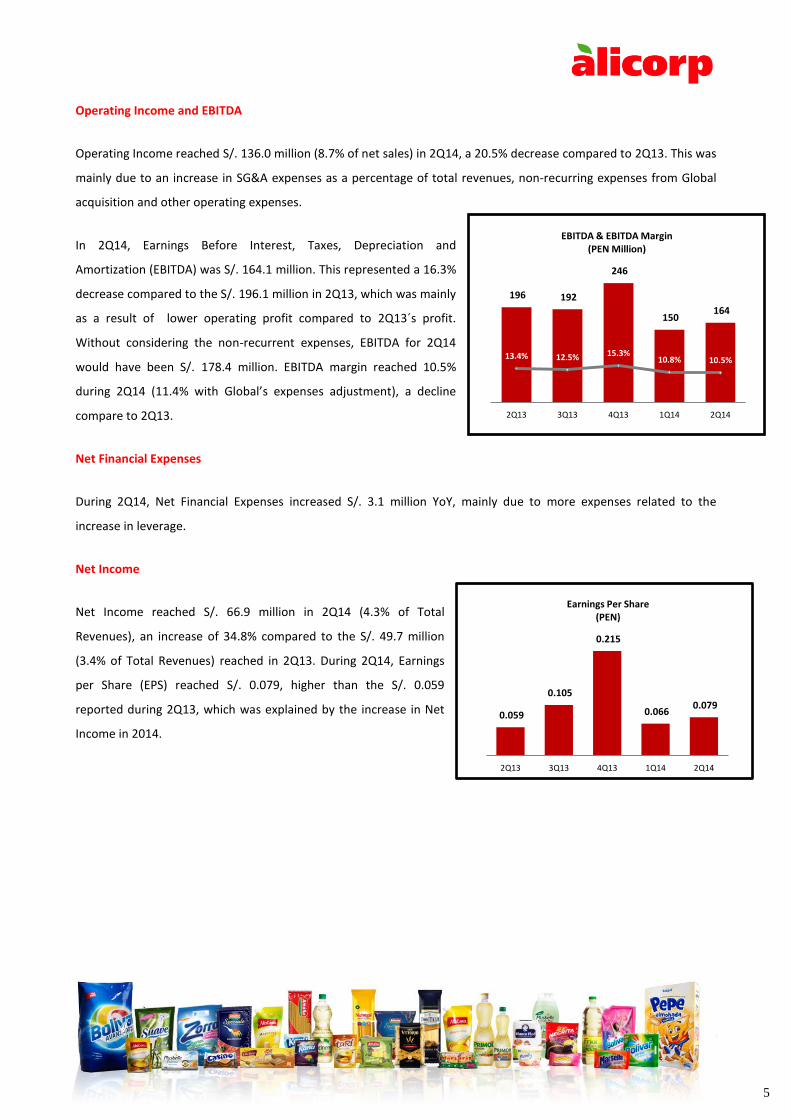
Argentina 23.6% Ecuador
23.1%
Brazil 23.0%
Chile 20.6%
Others 9.7%
International Revenues (2Q14)
II. INCOME STATEMENT
Revenues
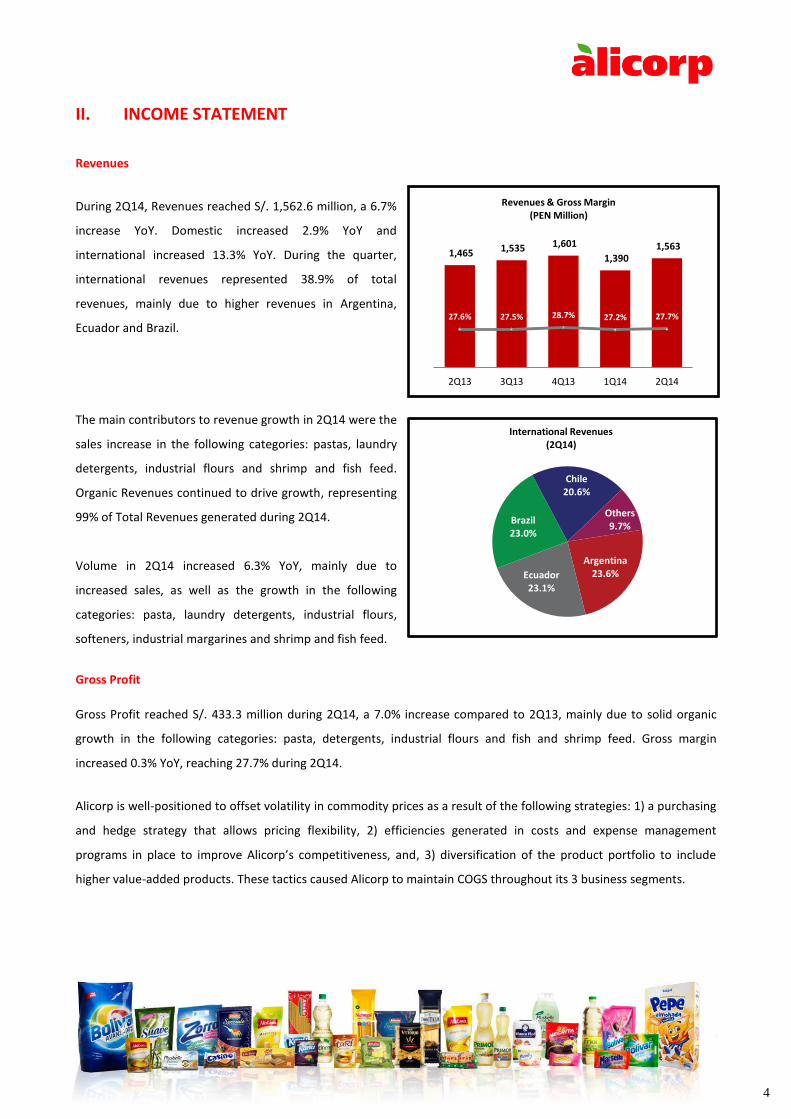
During 2Q14, Revenues reached S/. 1,562.6 million, a 6.7%
increase YoY. Domestic increased 2.9% YoY and
international increased 13.3% YoY. During the quarter,
international revenues represented 38.9% of total
revenues, mainly due to higher revenues in Argentina,
Ecuador and Brazil.
The main contributors to revenue growth in 2Q14 were the
sales increase in the following categories: pastas, laundry
detergents, industrial flours and shrimp and fish feed.
Organic Revenues continued to drive growth, representing
99% of Total Revenues generated during 2Q14.
Volume in 2Q14 increased 6.3% YoY, mainly due to
increased sales, as well as the growth in the following
categories: pasta, laundry detergents, industrial flours,
softeners, industrial margarines and shrimp and fish feed.
Gross Profit
Gross Profit reached S/. 433.3 million during 2Q14, a 7.0% increase compared to 2Q13, mainly due to solid organic
growth in the following categories: pasta, detergents, industrial flours and fish and shrimp feed. Gross margin
increased 0.3% YoY, reaching 27.7% during 2Q14.
Alicorp is well-positioned to offset volatility in commodity prices as a result of the following strategies: 1) a purchasing
and hedge strategy that allows pricing flexibility, 2) efficiencies generated in costs and expense management
programs in place to improve Alicorp’s competitiveness, and, 3) diversification of the product portfolio to include
higher value-added products. These tactics caused Alicorp to maintain COGS throughout its 3 business segments.
1,465 1,535 1,601
1,390 1,563
27.6% 27.5% 28.7% 27.2% 27.7%
2Q13 3Q13 4Q13 1Q14 2Q14
Revenues & Gross Margin (PEN Million)
5
Operating Income and EBITDA
Operating Income reached S/. 136.0 million (8.7% of net sales) in 2Q14, a 20.5% decrease compared to 2Q13. This was
mainly due to an increase in SG&A expenses as a percentage of total revenues, non-recurring expenses from Global
acquisition and other operating expenses.
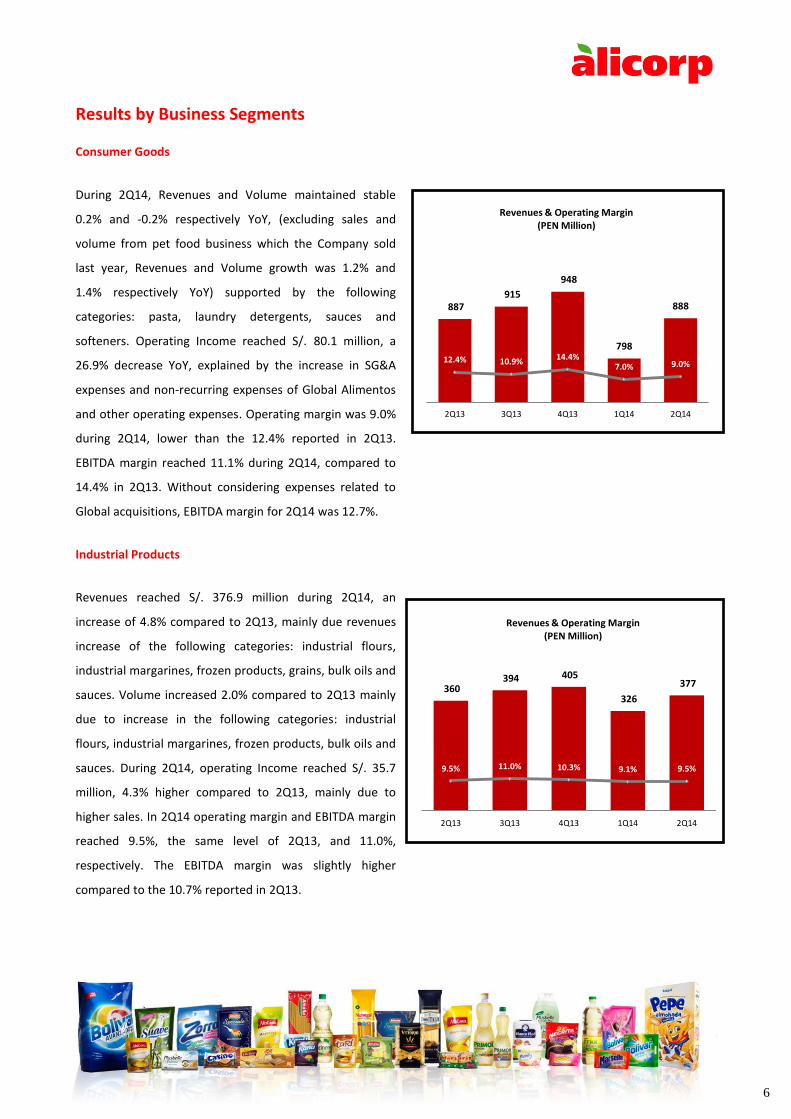
In 2Q14, Earnings Before Interest, Taxes, Depreciation and
Amortization (EBITDA) was S/. 164.1 million. This represented a 16.3%
decrease compared to the S/. 196.1 million in 2Q13, which was mainly
as a result of lower operating profit compared to 2Q13´s profit.
Without considering the non-recurrent expenses, EBITDA for 2Q14
would have been S/._178.4 million. EBITDA margin reached 10.5%
during 2Q14 (11.4% with Global’s expenses adjustment), a decline
compare to 2Q13.
Net Financial Expenses
During 2Q14, Net Financial Expenses increased S/. 3.1 million YoY, mainly due to more expenses related to the
increase in leverage.
Net Income
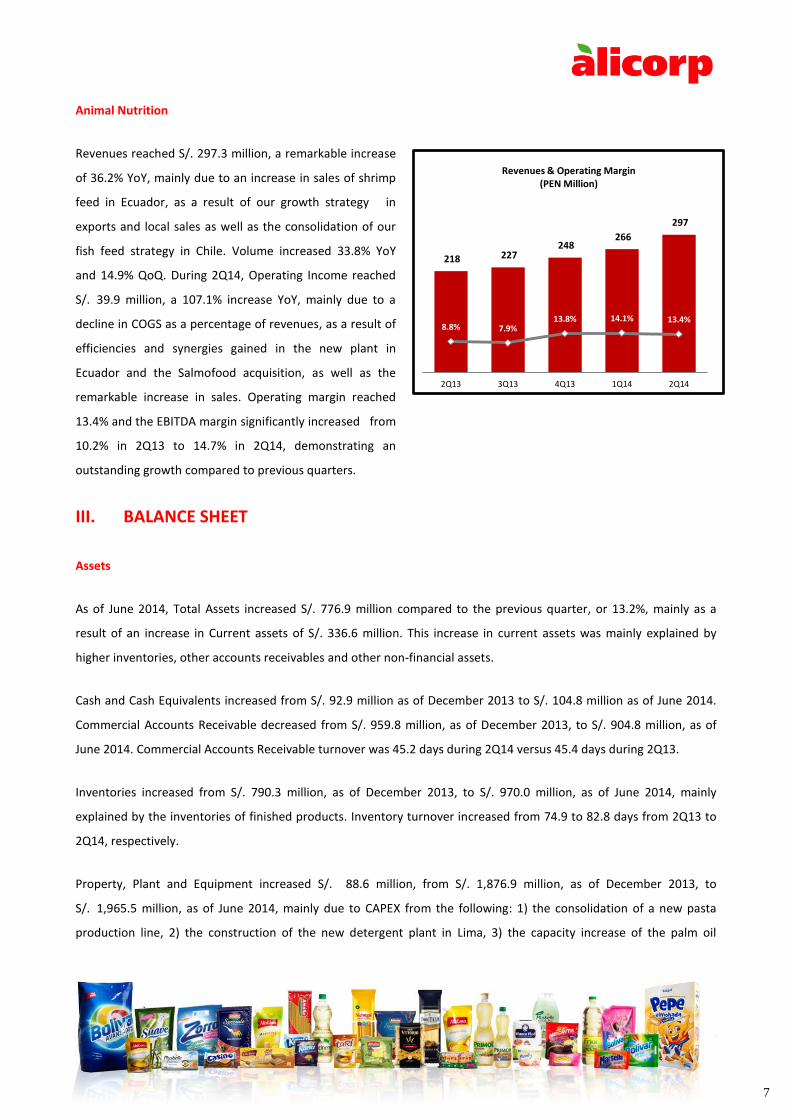
Net Income reached S/. 66.9 million in 2Q14 (4.3% of Total
Revenues), an increase of 34.8% compared to the S/. 49.7 million
(3.4% of Total Revenues) reached in 2Q13. During 2Q14, Earnings
per Share (EPS) reached S/. 0.079, higher than the S/. 0.059
reported during 2Q13, which was explained by the increase in Net
Income in 2014.
0.059
0.105
0.215
0.066 0.079
2Q13 3Q13 4Q13 1Q14 2Q14
Earnings Per Share (PEN)
196 192
246
150 164
13.4% 12.5% 15.3% 10.8% 10.5%
2Q13 3Q13 4Q13 1Q14 2Q14
EBITDA & EBITDA Margin (PEN Million)
6
Results by Business Segments
Consumer Goods
During 2Q14, Revenues and Volume maintained stable
0.2% and -0.2% respectively YoY, (excluding sales and
volume from pet food business which the Company sold
last year, Revenues and Volume growth was 1.2% and
1.4% respectively YoY) supported by the following
categories: pasta, laundry detergents, sauces and
softeners. Operating Income reached S/._80.1 million, a
26.9% decrease YoY, explained by the increase in SG&A
expenses and non-recurring expenses of Global Alimentos
and other operating expenses. Operating margin was 9.0%
during 2Q14, lower than the 12.4% reported in 2Q13.
EBITDA margin reached 11.1% during 2Q14, compared to
14.4% in 2Q13. Without considering expenses related to
Global acquisitions, EBITDA margin for 2Q14 was 12.7%.
Industrial Products
Revenues reached S/. 376.9 million during 2Q14, an
increase of 4.8% compared to 2Q13, mainly due revenues
increase of the following categories: industrial flours,
industrial margarines, frozen products, grains, bulk oils and
sauces. Volume increased 2.0% compared to 2Q13 mainly
due to increase in the following categories: industrial
flours, industrial margarines, frozen products, bulk oils and
sauces. During 2Q14, operating Income reached S/. 35.7
million, 4.3% higher compared to 2Q13, mainly due to
higher sales. In 2Q14 operating margin and EBITDA margin
reached 9.5%, the same level of 2Q13, and 11.0%,
respectively. The EBITDA margin was slightly higher
compared to the 10.7% reported in 2Q13.
887 915
948
798
888
12.4% 10.9% 14.4%
7.0% 9.0%
2Q13 3Q13 4Q13 1Q14 2Q14
Revenues & Operating Margin (PEN Million)
360 394 405
326
377
9.5% 11.0% 10.3% 9.1% 9.5%
2Q13 3Q13 4Q13 1Q14 2Q14
Revenues & Operating Margin (PEN Million)
7
Animal Nutrition
Revenues reached S/. 297.3 million, a remarkable increase
of 36.2% YoY, mainly due to an increase in sales of shrimp
feed in Ecuador, as a result of our growth strategy in
exports and local sales as well as the consolidation of our
fish feed strategy in Chile. Volume increased 33.8% YoY
and 14.9% QoQ. During 2Q14, Operating Income reached
S/._39.9 million, a 107.1% increase YoY, mainly due to a
decline in COGS as a percentage of revenues, as a result of
efficiencies and synergies gained in the new plant in
Ecuador and the Salmofood acquisition, as well as the
remarkable increase in sales. Operating margin reached
13.4% and the EBITDA margin significantly increased from
10.2% in 2Q13 to 14.7% in 2Q14, demonstrating an
outstanding growth compared to previous quarters.
III. BALANCE SHEET
Assets
As of June 2014, Total Assets increased S/. 776.9 million compared to the previous quarter, or 13.2%, mainly as a
result of an increase in Current assets of S/. 336.6 million. This increase in current assets was mainly explained by
higher inventories, other accounts receivables and other non-financial assets.
Cash and Cash Equivalents increased from S/. 92.9 million as of December 2013 to S/. 104.8 million as of June 2014.
Commercial Accounts Receivable decreased from S/. 959.8 million, as of December 2013, to S/. 904.8 million, as of
June 2014. Commercial Accounts Receivable turnover was 45.2 days during 2Q14 versus 45.4 days during 2Q13.
Inventories increased from S/. 790.3 million, as of December 2013, to S/. 970.0 million, as of June 2014, mainly
explained by the inventories of finished products. Inventory turnover increased from 74.9 to 82.8 days from 2Q13 to
2Q14, respectively.
Property, Plant and Equipment increased S/. 88.6 million, from S/. 1,876.9 million, as of December 2013, to
S/._1,965.5 million, as of June 2014, mainly due to CAPEX from the following: 1) the consolidation of a new pasta
production line, 2) the construction of the new detergent plant in Lima, 3) the capacity increase of the palm oil
218 227 248
266
297
8.8% 7.9% 13.8% 14.1% 13.4%
2Q13 3Q13 4Q13 1Q14 2Q14
Revenues & Operating Margin (PEN Million)
8
processing plant, and 4) the automatization of the laundry soap plant.
Liabilities
As of June 2014, Total Liabilities increased S/. 759.4 million, mainly due to increased short-term financial liabilities and
commercial accounts payable.
The change in Current Liabilities was primarily due to the increase in Short-Term Financial Liabilities of S/. 623.4
million, and an increase of Commercial Accounts Payable in S/. 238.5 million. Accounts Payable turnover increased 7.1
days, from 52.9 to 59.9 days from 2Q13 to 2Q14, respectively.
Long-term Liabilities decreased in S/. 104.9 million, mainly due to the decrease of Long-Term Financial Liabilities of
S/._62.1 million and lower deferred taxes of S/. 33.7 million.
Total Financial Short-Term Liabilities as of June 2014, was S/. 915.6 million. The Company operates with revolving
credit lines for import financing and working capital requirements.
Total Financial Long-Term Liabilities at June 2014 was S/. 1,700.1 million, representing 64.9% of Total Financial Debt.
The currency mix for the financial debt, after the derivatives hedge, was: 49% in Peruvian Nuevos Soles, 31% in U.S.
Dollars, 12% in Brazilian Reais, with the remaining 7% in Argentine Pesos. The duration of the debt was 6.03 years (not
including short-term debt). During 2Q14, Alicorp undertook 17 foreign exchange forward agreements in order to cover
net cash flow exposure. Currently, the majority of liabilities are fixed-rate, either direct or through derivative
transactions. The average rate of U.S. dollar-denominated debt was 3.13% during 2Q14.
Equity
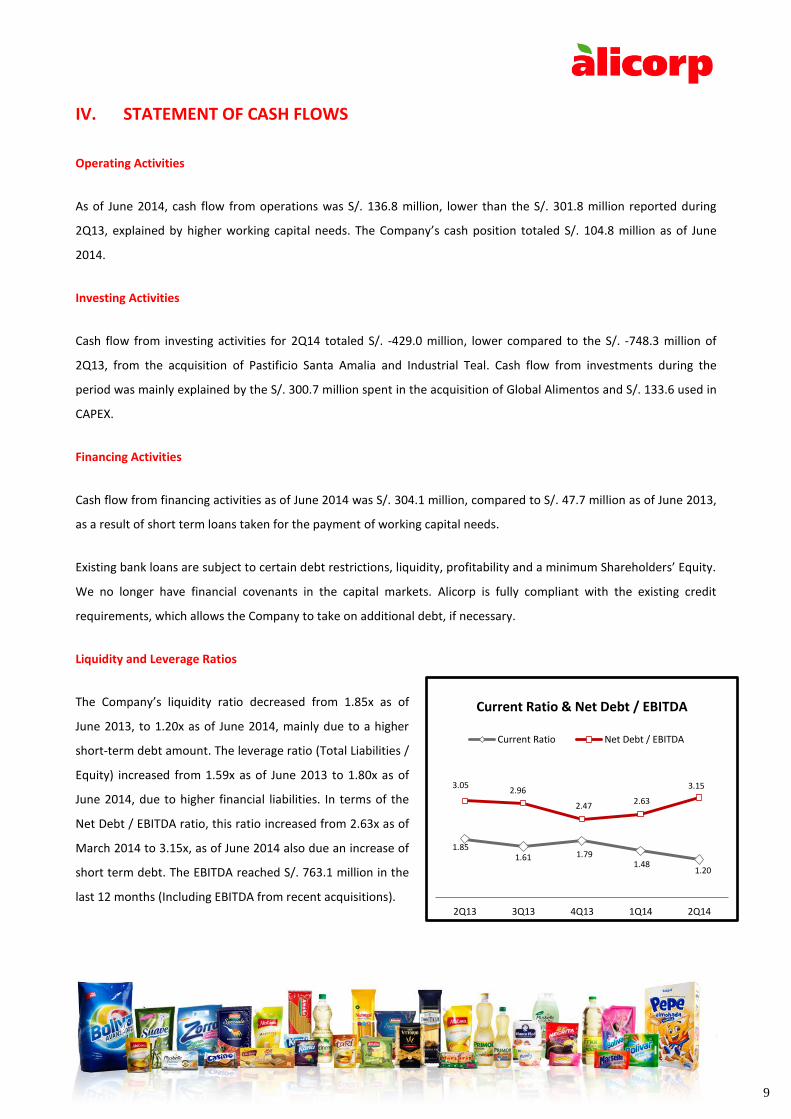
Shareholders’ Equity increased by S/. 17.5 million, or
0.7%, from S/. 2,366.0 million as of December 2013, to
S/. 2,383.5 million as of June 2014, mainly due to the
effect of net profit and dividend payment during the
quarter. As of June 2014, ROE reached 17.5% (this ratio
considers the average Shareholders’ Equity and Net
Earnings for the last twelve months), close to the
16.9% reported in 2013. This was mainly due to a
higher Net Profit reported on the 2Q14.
351
369
398
17.6%
16.9% 17.5%
2012 2013 LTM 2Q14
Net Income & ROE (PEN Million)
9
IV. STATEMENT OF CASH FLOWS
Operating Activities
As of June 2014, cash flow from operations was S/. 136.8 million, lower than the S/. 301.8 million reported during
2Q13, explained by higher working capital needs. The Company’s cash position totaled S/. 104.8 million as of June
2014.
Investing Activities
Cash flow from investing activities for 2Q14 totaled S/. -429.0 million, lower compared to the S/. -748.3 million of
2Q13, from the acquisition of Pastificio Santa Amalia and Industrial Teal. Cash flow from investments during the
period was mainly explained by the S/. 300.7 million spent in the acquisition of Global Alimentos and S/. 133.6 used in
CAPEX.
Financing Activities
Cash flow from financing activities as of June 2014 was S/. 304.1 million, compared to S/. 47.7 million as of June 2013,
as a result of short term loans taken for the payment of working capital needs.
Existing bank loans are subject to certain debt restrictions, liquidity, profitability and a minimum Shareholders’ Equity.
We no longer have financial covenants in the capital markets. Alicorp is fully compliant with the existing credit
requirements, which allows the Company to take on additional debt, if necessary.
Liquidity and Leverage Ratios
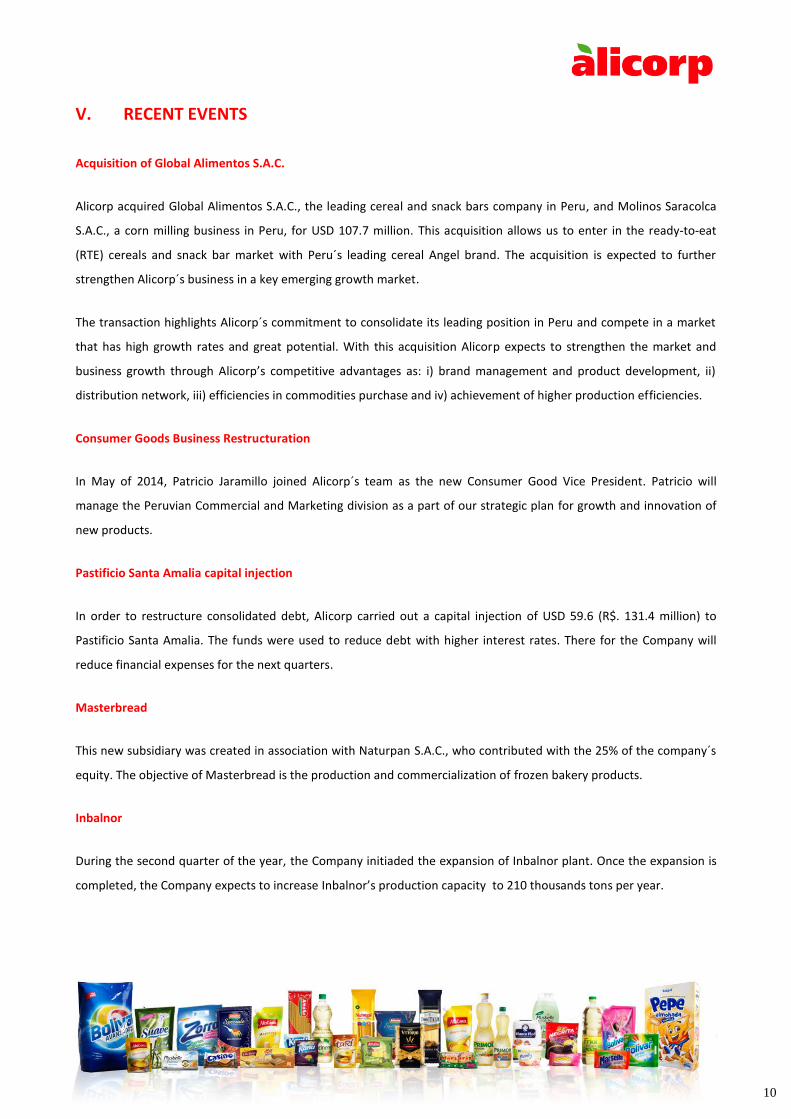
The Company’s liquidity ratio decreased from 1.85x as of
June 2013, to 1.20x as of June 2014, mainly due to a higher
short-term debt amount. The leverage ratio (Total Liabilities /
Equity) increased from 1.59x as of June 2013 to 1.80x as of
June 2014, due to higher financial liabilities. In terms of the
Net Debt / EBITDA ratio, this ratio increased from 2.63x as of
March 2014 to 3.15x, as of June 2014 also due an increase of
short term debt. The EBITDA reached S/. 763.1 million in the
last 12 months (Including EBITDA from recent acquisitions).
1.85 1.61 1.79
1.48 1.20
3.05 2.96
2.47 2.63
3.15
2Q13 3Q13 4Q13 1Q14 2Q14
Current Ratio & Net Debt / EBITDA
Current Ratio Net Debt / EBITDA
10
V. RECENT EVENTS
Acquisition of Global Alimentos S.A.C.
Alicorp acquired Global Alimentos S.A.C., the leading cereal and snack bars company in Peru, and Molinos Saracolca
S.A.C., a corn milling business in Peru, for USD 107.7 million. This acquisition allows us to enter in the ready-to-eat
(RTE) cereals and snack bar market with Peru´s leading cereal Angel brand. The acquisition is expected to further
strengthen Alicorp´s business in a key emerging growth market.
The transaction highlights Alicorp´s commitment to consolidate its leading position in Peru and compete in a market
that has high growth rates and great potential. With this acquisition Alicorp expects to strengthen the market and
business growth through Alicorp’s competitive advantages as: i) brand management and product development, ii)
distribution network, iii) efficiencies in commodities purchase and iv) achievement of higher production efficiencies.
Consumer Goods Business Restructuration
In May of 2014, Patricio Jaramillo joined Alicorp´s team as the new Consumer Good Vice President. Patricio will
manage the Peruvian Commercial and Marketing division as a part of our strategic plan for growth and innovation of
new products.
Pastificio Santa Amalia capital injection
In order to restructure consolidated debt, Alicorp carried out a capital injection of USD 59.6 (R$. 131.4 million) to
Pastificio Santa Amalia. The funds were used to reduce debt with higher interest rates. There for the Company will
reduce financial expenses for the next quarters.
Masterbread
This new subsidiary was created in association with Naturpan S.A.C., who contributed with the 25% of the company´s
equity. The objective of Masterbread is the production and commercialization of frozen bakery products.
Inbalnor
During the second quarter of the year, the Company initiaded the expansion of Inbalnor plant. Once the expansion is
completed, the Company expects to increase Inbalnor’s production capacity to 210 thousands tons per year.
11
New Product Launches and Re-launches
During 2Q14, Alicorp´s Consumer Goods Business had many launches and re-launches, mainly in Peru, Argentina and
Brazil.
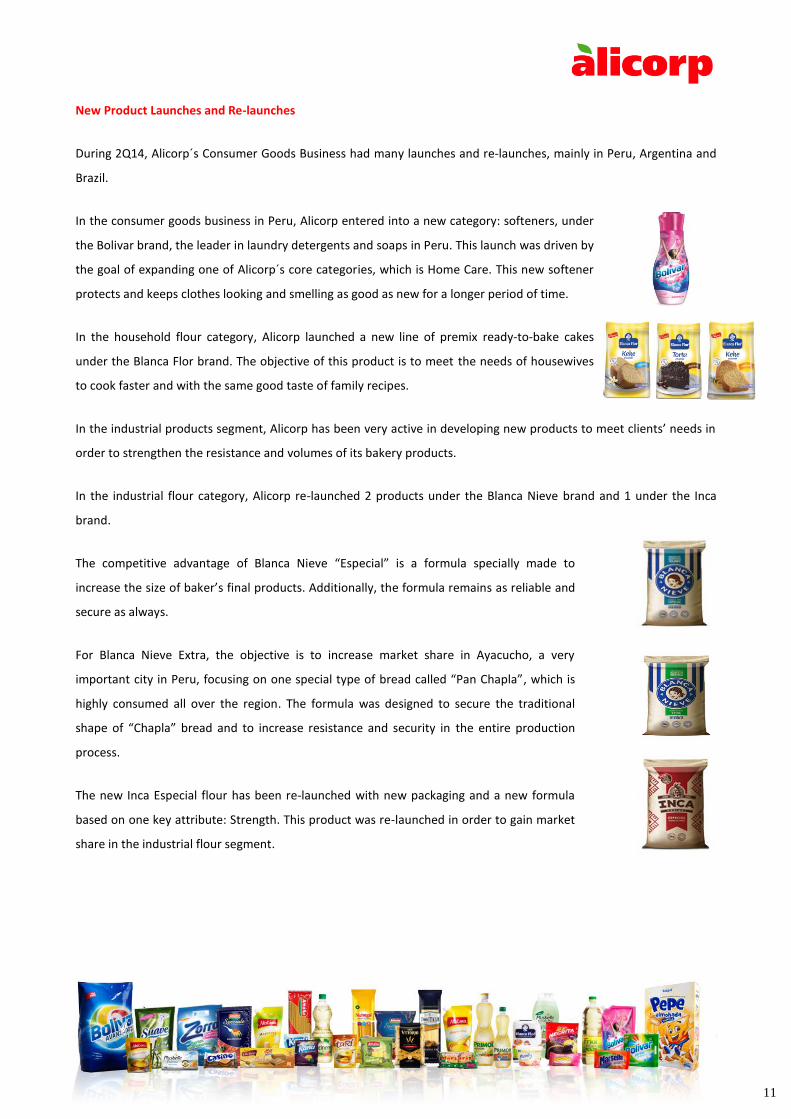
In the consumer goods business in Peru, Alicorp entered into a new category: softeners, under
the Bolivar brand, the leader in laundry detergents and soaps in Peru. This launch was driven by
the goal of expanding one of Alicorp´s core categories, which is Home Care. This new softener
protects and keeps clothes looking and smelling as good as new for a longer period of time.
In the household flour category, Alicorp launched a new line of premix ready-to-bake cakes
under the Blanca Flor brand. The objective of this product is to meet the needs of housewives
to cook faster and with the same good taste of family recipes.
In the industrial products segment, Alicorp has been very active in developing new products to meet clients’ needs in
order to strengthen the resistance and volumes of its bakery products.
In the industrial flour category, Alicorp re-launched 2 products under the Blanca Nieve brand and 1 under the Inca
brand.
The competitive advantage of Blanca Nieve “Especial” is a formula specially made to
increase the size of baker’s final products. Additionally, the formula remains as reliable and
secure as always.
For Blanca Nieve Extra, the objective is to increase market share in Ayacucho, a very
important city in Peru, focusing on one special type of bread called “Pan Chapla”, which is
highly consumed all over the region. The formula was designed to secure the traditional
shape of “Chapla” bread and to increase resistance and security in the entire production
process.
The new Inca Especial flour has been re-launched with new packaging and a new formula
based on one key attribute: Strength. This product was re-launched in order to gain market
share in the industrial flour segment.
12
In the shortenings category, Alicorp launched 2 new presentations of the Famosa brand. In
order to mitigate production costs for both the client and Alicorp, the Famosa brand will be
available in two additional formats: 10Kg and 14Kg.
In Argentina, Alicorp launched a new pasta sub-line under the Nutregal brand geared
towards the value segment of local consumers, as they look for highly nutritional and tasty
alternatives to feed their families. This new “Nutregal Energia” format offers an important
source of magnesium, zinc, phosphorus and fiber. Within the same category, Alicorp re-
launched the Nutregal brand with new advertising which includes the famous Argentine
soccer player Martin Palermo, to leverage the success of the 2014 FIFA World Cup.
Alicorp launched a new cookie line under the Okebon brand. The product was launched in
order to expand Okebon’s portfolio and to adapt it to changing market trends towards
healthier products.
In the personal care category, Alicorp launched a new variety of Plusbelle Kids: “Easy to
comb”, aimed at the value segment of children’s between four and eleven years of age,
offering a reliable and low cost product.
In the home care category, Alicorp launched a new sub-line of laundry detergent under the
Zorro brand, in a new format of 5 kilograms.
In Brazil, Alicorp launched a new variety of household flour under the brand Santa Amalia to
increase sales of the category. This new product is enhanced with nutrients such as vitamin
B9 and iron.
In the pasta category, Alicorp launched a new variety of hard bean noodles under the name
Santa Amalia Speciale Romance (limited edition – available for sale for only 3 moths) and a
new shredded cheese under the same portfolio, to consolidate the pasta portfolio.
Additionally, the Company expanded its ready-to-eat pasta portfolio launching “Lámen
Cremoso” in 3 different flavors: Pizza, four cheeses sauce and barbecue.
13
Awards and Social Responsibility
Alicorp was recognized as being one of the 10 best employers of Peru by Merco (El Monitor Empresarial de
Reputación Corporativa). This award is a result of 7,000 surveys with employees, students and experts in human
resources. Additionally, Alicorp is in the second place of the best employers of the Food & Beverage industry in
Peru.
For the fourth consecutive year, Alicorp is one of the companies that form the Good Corporate Governance Index
2014. Alicorp has been recognized for its good corporate practices, highly transparency and professionalism
standards that impacts in the Company’s results and generates confidence in the stock market.
For third consecutive year, and for the first time in Cusco, Alicorp launched “The healthy Radio” contest. This
program teaches radio communicators so they disseminate educative messages about healthy eating and
improvements in child nutrition. The contest is orientated for those radio communicators that, through radio,
educate families in their community.
Alicorp was recognized as being the third company with best reputation in Peru, this time by “Inmark Perú” and
the “Reputation Institute”. These results are measured by the admiration, respect, good impression and
confidence of stakeholders to the company.
14
About Alicorp
Alicorp is a leading consumer goods company headquartered in Peru, with operations in other Latin American
countries, such as Argentina, Brazil, Chile, Ecuador, and exports to 23 other countries. The Company focuses on three
core businesses: (1) Consumer Products (food, personal and home care products), in Peru, Brazil, Argentina, Ecuador,
Colombia and Chile, among other countries, (2) Industrial Food Products (industrial flour, industrial lard, pre-mix and
food service products), and (3) Animal Nutrition (fish and shrimp feeding). Alicorp has over 7,300 employees in its
operations in Peru and international subsidiaries. The Company´s common and investment shares are listed on the
Lima Stock Exchange under the ticker symbols ALICORC1 and ALICORI1, respectively.
Disclaimer
This Press Release may contain forward-looking statements concerning recent acquisitions, its financial and business
impact, management’s beliefs and objectives with respect thereto, and management’s current expectations for future
operating and financial performance, based on assumptions currently believed to be valid. Forward-looking
statements are all statements other than statements of historical facts. The words “anticipates,” “may,” “can,”
“plans,” “believes,” “estimates,” “expects,” “projects,” “intends,” “likely,” “will,” “should,” “to be,” and any similar
expressions or other words of similar meaning are intended to identify those assertions as forward-looking
statements. It is uncertain whether the events anticipated will transpire, or if they do occur what impact they will have
on the results of operations and financial condition of Alicorp or of the consolidated company. Alicorp does not
undertake any obligation to update the forward-looking statements included in this press release to reflect
subsequent events or circumstances.
15
NotesJune 30
2014
December 31
2013Notes June 30 2014
December 31
2013
Assets Liabilities and Shareholders´ Equity
Current Assets Current Liabilities
Cash and Cash Equivalents 2 104,802 92,890 Other Financial Liabilities 9 915,610 292,175
Other Financial Assets 3 8,062 4,740 Trade Account Payables 917,491 678,974
Trade Account Receivables, Net 904,810 959,774 Other Account Payables 10 100,635 104,871
Other Account Receivables, Net 4 261,713 164,478 Account Payables to Related Parties 4,498 5,151
Account Receivables from Related Parties 250 425 Provisions 20,026 12,358
Advances to Suppliers 65,427 35,531 Current Income Tax 12,615 2,593
Inventories 5 970,002 790,252 Provision for Employee Benefits 11 84,824 95,326
Biological Assets 0 0 Total Current Liabilities 2,055,699 1,191,448
Deferred Tax 72,668 61,967
Other non f inancial assets 62,692 12,104
Assets classif ied as held for sale 17,932 9,559 Non-Current Liabilities
Total Current Assets 2,468,358 2,131,720 Other Financial Liabilities 9 1,700,121 1,762,184
Other Account Payables 10 118,158 126,597
Non-Current Assets Account Payables to Related Parties 0 0
Other Financial Assets 3 311,956 271,609 Deferred Income Tax Liabilities 398,621 432,357
Investments in associates 6 29,267 29,205 Provisions 8,579 8,265
Other Account Receivables 4 18,944 21,375 Provision for Employee Benefits 11 6,469 7,403
Property, Plant and Equipments, Net 7 1,965,494 1,876,942
Intangible Assets, Net 8 789,531 777,069 Total Non-Current Liabilities 2,231,948 2,336,806
Deferred Tax 85,674 89,067 Total Liabilities 4,287,647 3,528,254
Goodw ill 1,001,944 697,310
Total Non-Current Assets 4,202,810 3,762,577 Sharedholders' Equity
Share Capital 12 847,192 847,192
Investment Shares 12 7,388 7,388
Reserves 12 169,438 160,903
Retained Earnings 12 1,275,964 1,263,996
Other Shareholders' Equity Reserves 12 71,129 77,734
Equity Attributable to Owners of the Company 2,371,111 2,357,213
Non-Controlling Interests 12,410 8,830
Total Shareholders' Equity 2,383,521 2,366,043
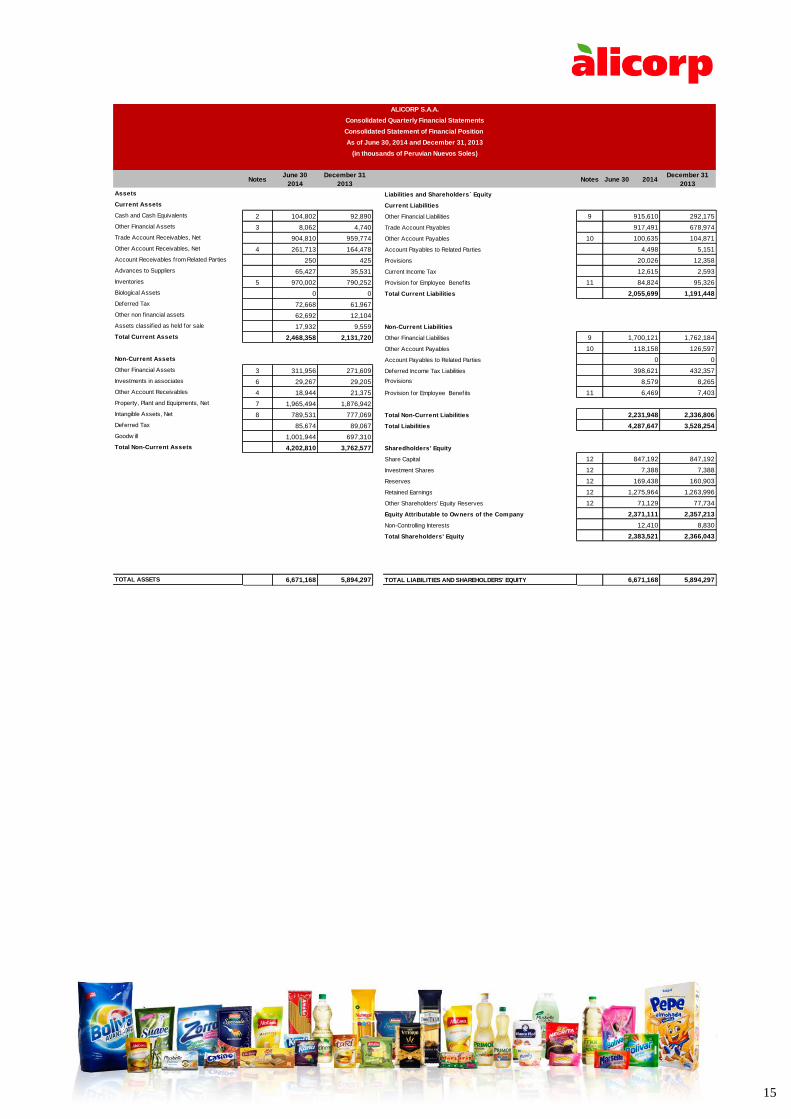
TOTAL ASSETS 6,671,168 5,894,297 TOTAL LIABILITIES AND SHAREHOLDERS' EQUITY 6,671,168 5,894,297
ALICORP S.A.A.
Consolidated Quarterly Financial Statements
As of June 30, 2014 and December 31, 2013
(in thousands of Peruvian Nuevos Soles)
Consolidated Statement of Financial Position
16
Notes
For the Quarter
Ended June 30,
2014
For the Quarter
Ended June 30,
2013
For the cumulative
period Starting on
January 1 and
Ending June 30,
2014
For the cumulative
period Starting on
January 1 and Ending
June 30, 2013
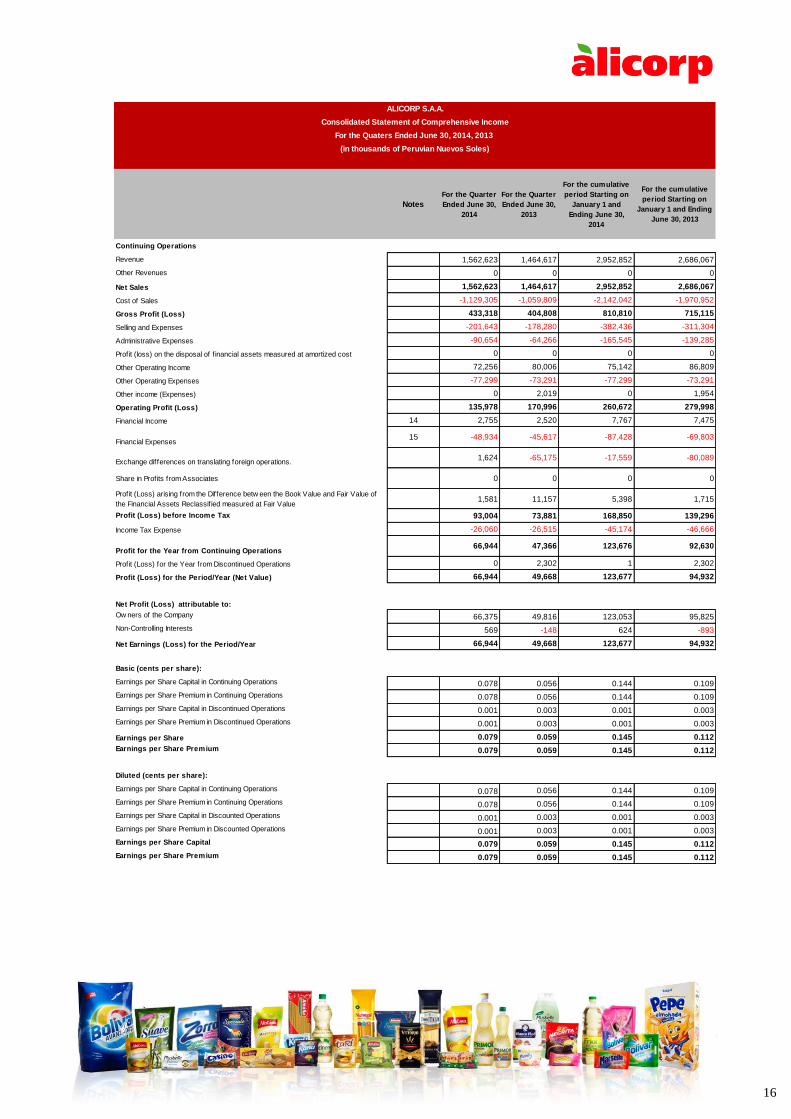
Continuing Operations
Revenue 1,562,623 1,464,617 2,952,852 2,686,067
Other Revenues 0 0 0 0
Net Sales 1,562,623 1,464,617 2,952,852 2,686,067
Cost of Sales -1,129,305 -1,059,809 -2,142,042 -1,970,952
Gross Profit (Loss) 433,318 404,808 810,810 715,115
Selling and Expenses -201,643 -178,280 -382,436 -311,304
Administrative Expenses -90,654 -64,266 -165,545 -139,285
Profit (loss) on the disposal of f inancial assets measured at amortized cost 0 0 0 0
Other Operating Income 72,256 80,006 75,142 86,809
Other Operating Expenses -77,299 -73,291 -77,299 -73,291
Other income (Expenses) 0 2,019 0 1,954
Operating Profit (Loss) 135,978 170,996 260,672 279,998
Financial Income 14 2,755 2,520 7,767 7,475
Financial Expenses15 -48,934 -45,617 -87,428 -69,803
Exchange differences on translating foreign operations.1,624 -65,175 -17,559 -80,089
Share in Profits from Associates 0 0 0 0
Profit (Loss) arising from the Difference betw een the Book Value and Fair Value of
the Financial Assets Reclassif ied measured at Fair Value1,581 11,157 5,398 1,715
Profit (Loss) before Income Tax 93,004 73,881 168,850 139,296
Income Tax Expense -26,060 -26,515 -45,174 -46,666
Profit for the Year from Continuing Operations66,944 47,366 123,676 92,630
Profit (Loss) for the Year from Discontinued Operations 0 2,302 1 2,302
Profit (Loss) for the Period/Year (Net Value) 66,944 49,668 123,677 94,932
Net Profit (Loss) attributable to:
Ow ners of the Company 66,375 49,816 123,053 95,825
Non-Controlling Interests 569 -148 624 -893
Net Earnings (Loss) for the Period/Year 66,944 49,668 123,677 94,932
Basic (cents per share):
Earnings per Share Capital in Continuing Operations 0.078 0.056 0.144 0.109
Earnings per Share Premium in Continuing Operations 0.078 0.056 0.144 0.109
Earnings per Share Capital in Discontinued Operations 0.001 0.003 0.001 0.003
Earnings per Share Premium in Discontinued Operations 0.001 0.003 0.001 0.003
Earnings per Share 0.079 0.059 0.145 0.112
Earnings per Share Premium 0.079 0.059 0.145 0.112
Diluted (cents per share):
Earnings per Share Capital in Continuing Operations 0.078 0.056 0.144 0.109
Earnings per Share Premium in Continuing Operations 0.078 0.056 0.144 0.109
Earnings per Share Capital in Discounted Operations 0.001 0.003 0.001 0.003
Earnings per Share Premium in Discounted Operations 0.001 0.003 0.001 0.003
Earnings per Share Capital 0.079 0.059 0.145 0.112
Earnings per Share Premium 0.079 0.059 0.145 0.112
ALICORP S.A.A.
Consolidated Statement of Comprehensive Income
For the Quaters Ended June 30, 2014, 2013
(in thousands of Peruvian Nuevos Soles)
17
Notes
For the cumulative
period Starting on
January 1 and Ending
June 30, 2014
For the cumulative
period Starting on
January 1 and Ending
June 30, 2013
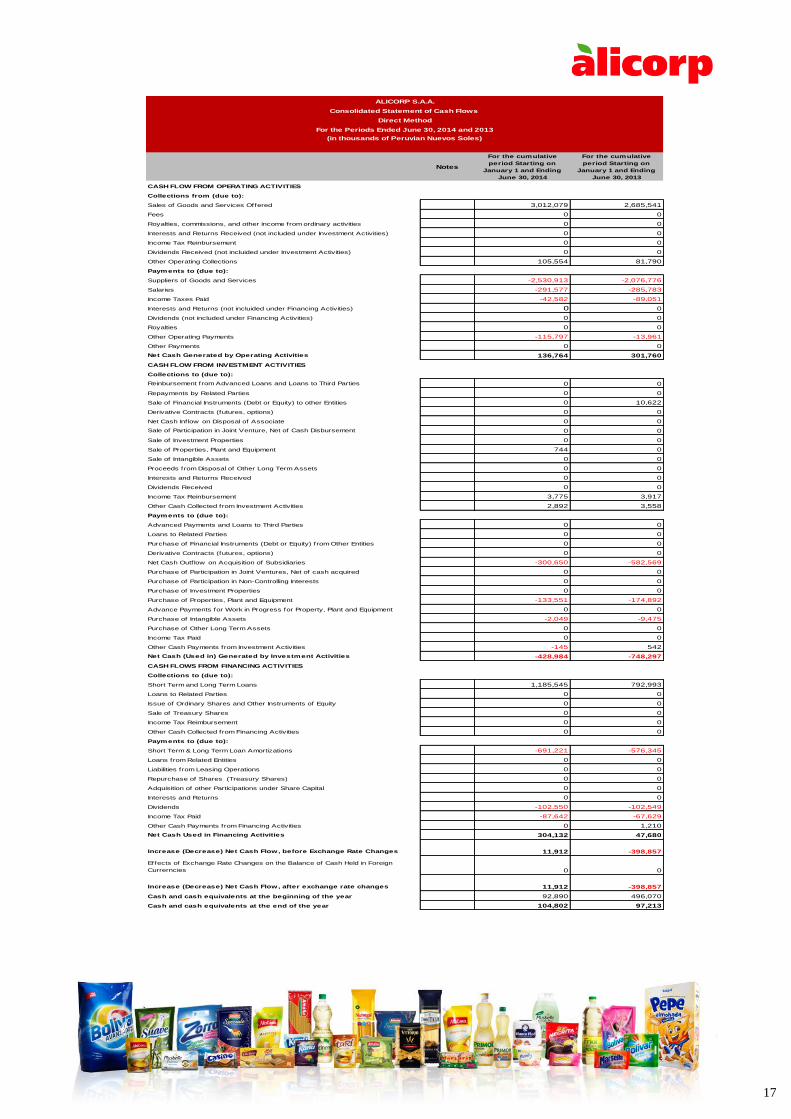
CASH FLOW FROM OPERATING ACTIVITIES
Collections from (due to):
Sales of Goods and Services Offered 3,012,079 2,685,541
Fees 0 0
Royalties, commissions, and other income from ordinary activities 0 0
Interests and Returns Received (not included under Investment Activities) 0 0
Income Tax Reinbursement 0 0
Dividends Received (not incluided under Investment Activities) 0 0
Other Operating Collections 105,554 81,790
Payments to (due to):
Suppliers of Goods and Services -2,530,913 -2,076,776
Salaries -291,577 -285,783
Income Taxes Paid -42,582 -89,051
Interests and Returns (not incluided under Financing Activities) 0 0
Dividends (not included under Financing Activities) 0 0
Royalties 0 0
Other Operating Payments -115,797 -13,961
Other Payments 0 0
Net Cash Generated by Operating Activities 136,764 301,760
CASH FLOW FROM INVESTMENT ACTIVITIES
Collections to (due to):
Reinbursement from Advanced Loans and Loans to Third Parties 0 0
Repayments by Related Parties 0 0
Sale of Financial Instruments (Debt or Equity) to other Entities 0 10,622
Derivative Contracts (futures, options) 0 0
Net Cash Inflow on Disposal of Associate 0 0
Sale of Participation in Joint Venture, Net of Cash Disbursement 0 0
Sale of Investment Properties 0 0
Sale of Properties, Plant and Equipment 744 0
Sale of Intangible Assets 0 0
Proceeds from Disposal of Other Long Term Assets 0 0
Interests and Returns Received 0 0
Dividends Received 0 0
Income Tax Reinbursement 3,775 3,917
Other Cash Collected from Investment Activities 2,892 3,558
Payments to (due to):
Advanced Payments and Loans to Third Parties 0 0
Loans to Related Parties 0 0
Purchase of Financial Instruments (Debt or Equity) from Other Entities 0 0
Derivative Contracts (futures, options) 0 0
Net Cash Outflow on Acquisition of Subsidiaries -300,650 -582,569
Purchase of Participation in Joint Ventures, Net of cash acquired 0 0
Purchase of Participation in Non-Controlling Interests 0 0
Purchase of Investment Properties 0 0
Purchase of Properties, Plant and Equipment -133,551 -174,892
Advance Payments for Work in Progress for Property, Plant and Equipment 0 0
Purchase of Intangible Assets -2,049 -9,475
Purchase of Other Long Term Assets 0 0
Income Tax Paid 0 0
Other Cash Payments from Investment Activities -145 542
Net Cash (Used in) Generated by Investment Activities -428,984 -748,297
CASH FLOWS FROM FINANCING ACTIVITIES
Collections to (due to):
Short Term and Long Term Loans 1,185,545 792,993
Loans to Related Parties 0 0
Issue of Ordinary Shares and Other Instruments of Equity 0 0
Sale of Treasury Shares 0 0
Income Tax Reimbursement 0 0
Other Cash Collected from Financing Activities 0 0
Payments to (due to):
Short Term & Long Term Loan Amortizations -691,221 -576,345
Loans from Related Entities 0 0
Liabilities from Leasing Operations 0 0
Repurchase of Shares (Treasury Shares) 0 0
Adquisition of other Participations under Share Capital 0 0
Interests and Returns 0 0
Dividends -102,550 -102,549
Income Tax Paid -87,642 -67,629
Other Cash Payments from Financing Activities 0 1,210
Net Cash Used in Financing Activities 304,132 47,680
Increase (Decrease) Net Cash Flow, before Exchange Rate Changes 11,912 -398,857
Effects of Exchange Rate Changes on the Balance of Cash Held in Foreign
Currerncies 0 0
Increase (Decrease) Net Cash Flow, after exchange rate changes 11,912 -398,857
Cash and cash equivalents at the beginning of the year 92,890 496,070
Cash and cash equivalents at the end of the year 104,802 97,213
(in thousands of Peruvian Nuevos Soles)
ALICORP S.A.A.
Consolidated Statement of Cash Flows
Direct Method
For the Periods Ended June 30, 2014 and 2013