Second Quarter 2002 Conference Call July 29, 2002.
30
Second Quarter 2002 Second Quarter 2002 Conference Call Conference Call July 29, 2002
-
Upload
jesse-fletcher -
Category
Documents
-
view
217 -
download
0
Transcript of Second Quarter 2002 Conference Call July 29, 2002.

Second Quarter 2002Second Quarter 2002Conference CallConference Call
July 29, 2002

2
Safe Harbor StatementSafe Harbor Statement
PPortions of this presentation are forward-looking and, as such, reflect
only the Company’s best assessment at this time. Investors are
cautioned that forward-looking statements involve risks and uncertainty,
that actual results may differ materially from such statements and that
investors should not place undue reliance on such statements. Factors
that may affect actual results include, but are not limited to potential
regulations; the Company’s ability to effectively manufacture, market and
distribute new products; the success of the Company’s operating plans;
regional weather conditions; and the condition of the industry and the
economy. For a further discussion of risk factors, investors should refer
to the Company’s Securities and Exchange Commission reports,
including, but not limited to, Form 10-K for the quarter ended March 31,
2001.
First Half 2002First Half 2002AccomplishmentsAccomplishments

4
• Customer Loyalty & SatisfactionCustomer Loyalty & Satisfaction
– Sales reorganization - zone conceptSales reorganization - zone concept– Implementing Hub & Spoke - Avon Lake, Ohio; Sebring, Implementing Hub & Spoke - Avon Lake, Ohio; Sebring,
Florida; and Hamilton, New Jersey conversions near Florida; and Hamilton, New Jersey conversions near completioncompletion
– Improved in-stock position from Gains softwareImproved in-stock position from Gains software
– LESCO on-line web siteLESCO on-line web site
– ““40th Anniversary” promotions40th Anniversary” promotions
– Improved terms and financingImproved terms and financing
– Customer satisfaction surveysCustomer satisfaction surveys
First Half 2002First Half 2002AccomplishmentsAccomplishments
5
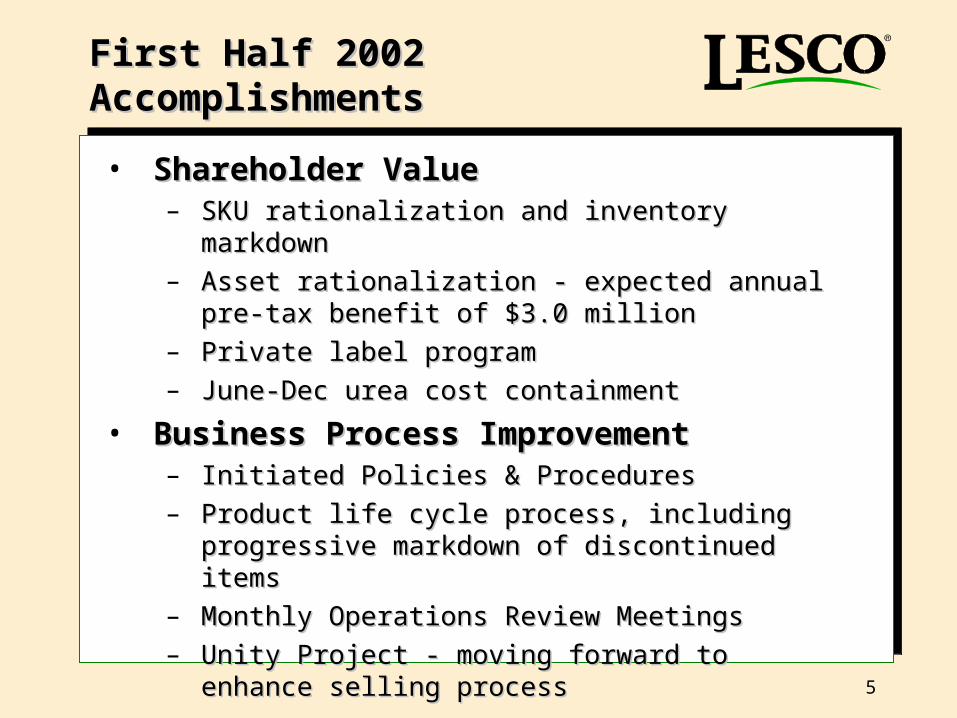
• Shareholder ValueShareholder Value– SKU rationalization and inventory markdownSKU rationalization and inventory markdown– Asset rationalization - expected annual pre-tax benefit Asset rationalization - expected annual pre-tax benefit
of $3.0 millionof $3.0 million– Private label programPrivate label program– June-Dec urea cost containmentJune-Dec urea cost containment
• Business Process ImprovementBusiness Process Improvement– Initiated Policies & ProceduresInitiated Policies & Procedures– Product life cycle process, including progressive Product life cycle process, including progressive
markdown of discontinued itemsmarkdown of discontinued items– Monthly Operations Review MeetingsMonthly Operations Review Meetings– Unity Project - moving forward to enhance selling Unity Project - moving forward to enhance selling
processprocess
First Half 2002First Half 2002AccomplishmentsAccomplishments
6
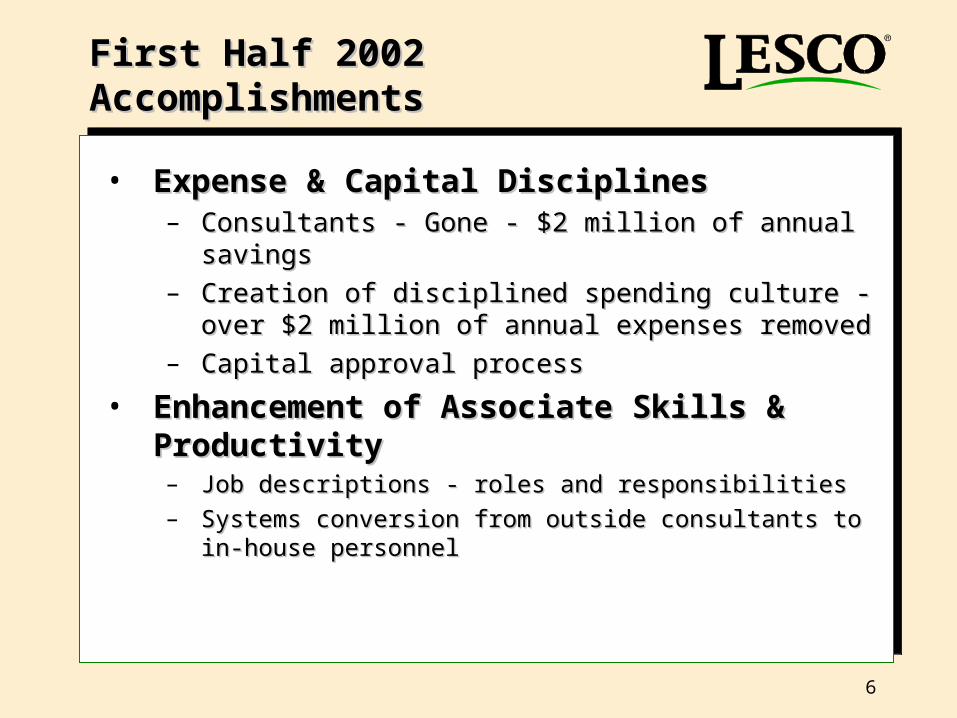
• Expense & Capital DisciplinesExpense & Capital Disciplines– Consultants - Gone - $2 million of annual savingsConsultants - Gone - $2 million of annual savings– Creation of disciplined spending culture - over $2 million Creation of disciplined spending culture - over $2 million
of annual expenses removedof annual expenses removed– Capital approval processCapital approval process
• Enhancement of Associate Skills & Enhancement of Associate Skills & ProductivityProductivity– Job descriptions - roles and responsibilitiesJob descriptions - roles and responsibilities
– Systems conversion from outside consultants to in-house Systems conversion from outside consultants to in-house personnelpersonnel
First Half 2002First Half 2002AccomplishmentsAccomplishments

7
Summary of One-time ChargesSummary of One-time ChargesSecond Quarter 2002Second Quarter 2002
Inventory markdown $9,581Asset Rationalization:
Asset Impairment Charges 9,214Lease Payments on Closed Facilities 1,149Other Exit Costs 1,681
12,044
Severance 1,791Total $23,416

Second Quarter 2002Second Quarter 2002Operating ResultsOperating Results

9
Income Statement - 2nd QuarterIncome Statement - 2nd Quarter
Reported Results Three Months(GAAP) One-time Excluding Ended %
(In thousands, except per share data) Results Charges Charges (a) June 30, 2001 Change
Net sales $ 166,493 -$ $ 166,493 $ 164,129 1.4%
Gross profit on sales 47,418 (9,581) 56,999 54,846 3.9%
Expenses, excluding severance and asset rationalization 40,711 40,711 41,521 (2.0%)
Asset rationalization 12,044 (12,044) - -
Severance expense 1,791 (1,791) - 380 - -
Other, net (424) - (424) (766)
Earnings (loss) before interest and taxes (6,704) 23,416 16,712 13,711 21.9%
Interest expense 1,323 - 1,323 1,659 (20.3%)
Income tax expense (benefit) (3,020) 8,806 5,786 4,517 28.1%
Income (Loss) $ (5,007) $ 14,610 $ 9,603 $ 7,535 27.4%
Fully Diluted EPS $ (0.59) $ 1.69 $ 1.10 $ 0.88 25.0%
Three Months Ended June 30, 2002
(a) Results exclude total one-time charges of $23.4 million comprised of inventory markdown of $9.6 million; manufacturing rationalization of $12.0 million; and severance expense of $1.8 million.

10
80
100
120
140
160
180
1st Qtr 2nd Qtr 3rd Qtr 4th Qtr
$'s
in m
illi
on
s
1999 2000 2001 *2002 Forecast
*2002 (First Half Actual & Second Half Forecast)
Sales SeasonalitySales Seasonality

11
$150.7
$158.3
$166.5
$164.1
$150.0
$160.0
$170.0
1999 2000 2001 2002
$'s
in m
illi
on
s
Second Quarter Sales - 1.4% Second Quarter Sales - 1.4% Increase over 2001Increase over 2001

12
84.1 86.5
91.7 96.4
45.2 46.7 48.0 45.9
21.826.3 25.0 24.7
$0
$10
$20
$30
$40
$50
$60
$70
$80
$90
$100
$'s
in m
illio
ns
Lawn Care Golf National Accounts
1999 2000 2001 2002
Second Quarter SalesSecond Quarter Sales - Channels - Channels
5.2%
(4.3)%
(1.5)%

13
53.6
57.2
65.366.7
49.152.3 49.4 51.2
20.9 20.9 20.4 20.8
12.514.9
16.015.8
14.6 12.9 12.9 11.9
$0
$10
$20
$30
$40
$50
$60
$70
$'s
in m
illio
ns
Fertilizer &Combination
Control Equipment,Parts &Service
TurfgrassSeed
Other*
1999 2000 2001 2002
Second Quarter Sales - Second Quarter Sales - ProductsProducts
*Other includes Pest Control, Golf Accessories, Irrigation, and Miscellaneous.
(7.8)%
3.6%
2.0%(1.3)%
2.1%

14
2nd Quarter
$57.0
$54.8
$56.0
$51.2
$50.0
$52.0
$54.0
$56.0
$58.0
$60.0
1999 2000 2001 2002*
$'s
in m
illi
on
s
Gross Profit on SalesGross Profit on Sales
34.2%33.4%35.4%34.0%
%’s are percent of sales.
*Excludes one-time charges for asset impairment of $23.4 million comprised of inventory markdown of $9.6 million; manufacturing rationalization of $12.0 million; and severance expense of $1.8 million.

15
2nd Quarter
$36.0
$38.7
$41.5$40.7
$35
$40
$45
1999 2000 2001 2002
$ in
Mil
lio
ns
Expenses - Total Expenses - Total
Note: Excludes one-time charges for asset impairment of $13.8 million comprised of manufacturing rationalization of $12.0 million and severance expense of $1.8 million.

16
2nd Quarter
$12.9
$19.7$19.9$19.1
$17.1
$7.7 $8.1$7.7 $7.2
$13.9$11.2
$12.4
$0
$10
$20
$30
1999 2000 2001 2002
$ in
Mil
lio
ns
Selling Warehouse & Delivery General & Administrative
Expenses - ComponentsExpenses - Components
Note: Excludes one-time charges for asset impairment of $13.8 million comprised of manufacturing rationalization of $12.0 million and severance expense of $1.8 million.

17
1.3
$1.9
$1.7
$1.5
$1.1
$1.3
$1
$2
1Q01 2Q01 3Q01 4Q01 1Q02 2Q02
$ in
Mil
lio
ns
Interest ExpenseInterest Expense

18
2nd Quarter
$9.0
$10.0
$7.5
$9.6
$7
$10
$13
1999 2000 2001 2002
$ in
Mil
lio
ns
Net IncomeNet IncomeBefore One-time ChargesBefore One-time Charges
Note: Excludes one-time charges for asset impairment of $23.4 million comprised of inventory markdown of $9.6 million; manufacturing rationalization of $12.0 million; and severance expense of $1.8 million.
28% increase
19
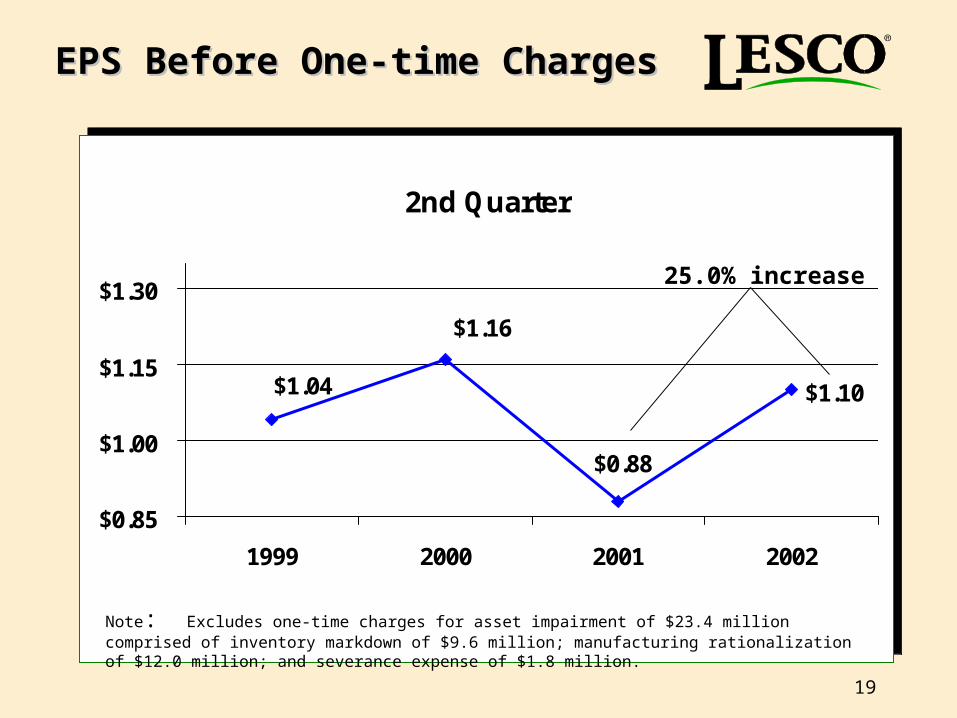
2nd Quarter
$1.10$1.04
$1.16
$0.88
$0.85
$1.00
$1.15
$1.30
1999 2000 2001 2002
EPS Before One-time ChargesEPS Before One-time Charges
25.0% increase
Note: Excludes one-time charges for asset impairment of $23.4 million comprised of inventory markdown of $9.6 million; manufacturing rationalization of $12.0 million; and severance expense of $1.8 million.

First Half 2002First Half 2002Operating ResultsOperating Results

21
Income StatementIncome StatementFirst Half 2002First Half 2002
Reported Results Six Months(GAAP) One-time Excluding Ended %
(In thousands, except per share data) Results Charges Charges (b) June 30, 2001 Change
Net sales $ 259,972 - $ 259,972 $ 254,857 2.0%
Gross profit on sales 77,470 (9,581) 87,051 82,243 5.8%
Expenses, excluding severance and Asset rationalization 77,494 77,494 76,301 1.6%
Asset rationalization 12,044 (12,044) - -
Severance expense 3,866 (3,866) - 498 - -
Other, net (537) - (537) (1,170)
Earnings (loss) before interest and taxes (15,397) 25,491 10,094 6,614 52.6%
Interest expense 2,657 - 2,657 3,567 (25.5%)
Income tax expense (benefit) (6,788) 9,584 2,796 1,113 151.2%
Net Income (loss) before extraordinary charge and cumulative effect of accounting change(a) $ (11,266) $ 15,907 $ 4,641 $ 1,934 140.0%
Fully Diluted EPS $ (1.33) $1.86 $ 0.53 $ 0.23 130.0%
(b) Results exclude total one-time charges of $25.5 million comprised of inventory markdown of $9.6 million; manufacturing rationalization of $12.0 million; and severance expense of $3.9 million.
Six Months Ended June 30, 2002
(a) Net loss before extraordinary charge and cumulative effect of accounting change is not a measure of financial performance under GAAP.

June 30, 2002June 30, 2002Balance Sheet &Balance Sheet &
Cash FlowsCash Flows

23
Consolidated Balance SheetConsolidated Balance Sheet
(a) As of 6/30/01 and 12/31/01, LESCO had sold trade receivables in securitization transactions totaling $35.0 million and $31.2 million, respectively.
June 30 June 30 December 312002 2001 2001
(Audited)ASSETSCURRENT ASSETS: Cash $ 4,043 $ 5,366 $ 5,035 Accounts receivable - net 84,842 53,859 (a) 37,571 (a) Inventories 101,845 114,062 92,996 Other current assets 14,842 4,260 8,086 TOTAL CURRENT ASSETS 205,572 177,547 143,688
Net property, plant and equipment 35,560 47,249 49,260 Other assets 5,328 10,504 11,648 TOTAL ASSETS $ 246,460 $ 235,300 $ 204,596
LIABILITIES & SHAREHOLDERS' EQUITYCURRENT LIABILITIES: Accounts Payable $ 85,886 $ 72,110 $ 46,847 Other current liabilities 17,441 9,618 9,181 Current portion of debt 1,140 5,813 970 TOTAL CURRENT LIABILITIES 104,467 87,541 56,998
Long-term debt 64,266 45,347 (a) 50,141 (a)Deferred income taxes 1,347 3,120 3,541
Shareholders' equity 76,380 99,292 93,916 TOTAL LIABILITIES & SHAREHOLDERS' EQUITY $ 246,460 $ 235,300 $ 204,596
(Unaudited)
24
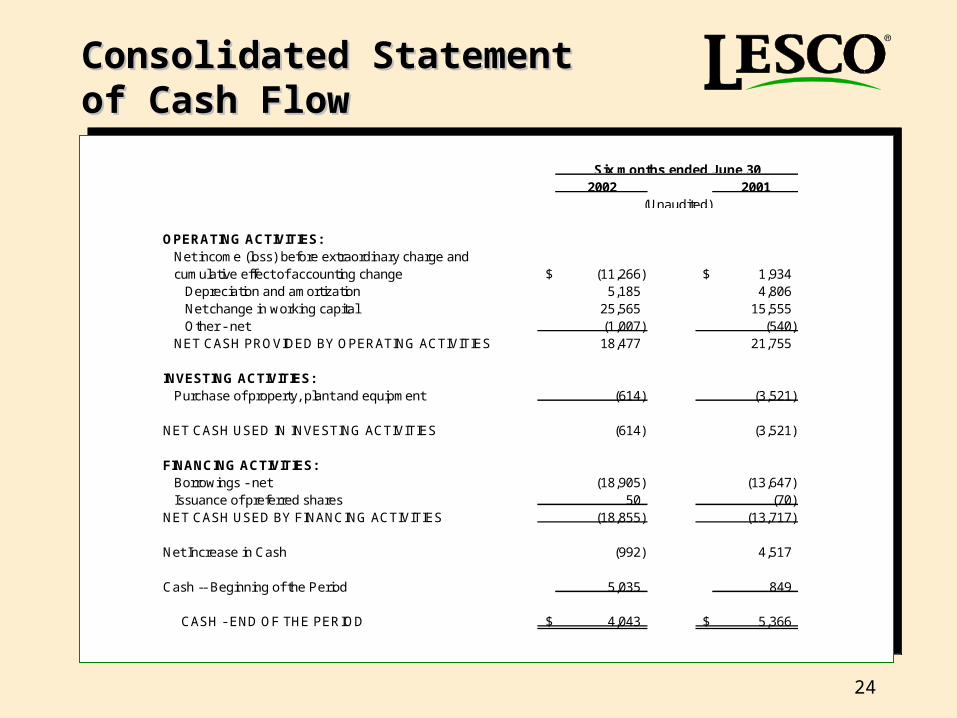
Consolidated StatementConsolidated Statementof Cash Flowof Cash Flow
2002 2001
OPERATING ACTIVITIES: Net income (loss) before extraordinary charge and cumulative effect of accounting change $ (11,266) $ 1,934 Depreciation and amortization 5,185 4,806 Net change in working capital 25,565 15,555 Other - net (1,007) (540) NET CASH PROVIDED BY OPERATING ACTIVITIES 18,477 21,755
INVESTING ACTIVITIES: Purchase of property, plant and equipment (614) (3,521)
NET CASH USED IN INVESTING ACTIVITIES (614) (3,521)
FINANCING ACTIVITIES: Borrowings - net (18,905) (13,647) Issuance of preferred shares 50 (70)NET CASH USED BY FINANCING ACTIVITIES (18,855) (13,717)
Net Increase in Cash (992) 4,517
Cash -- Beginning of the Period 5,035 849
CASH - END OF THE PERIOD $ 4,043 $ 5,366
(Unaudited)
Six months ended June 30
25
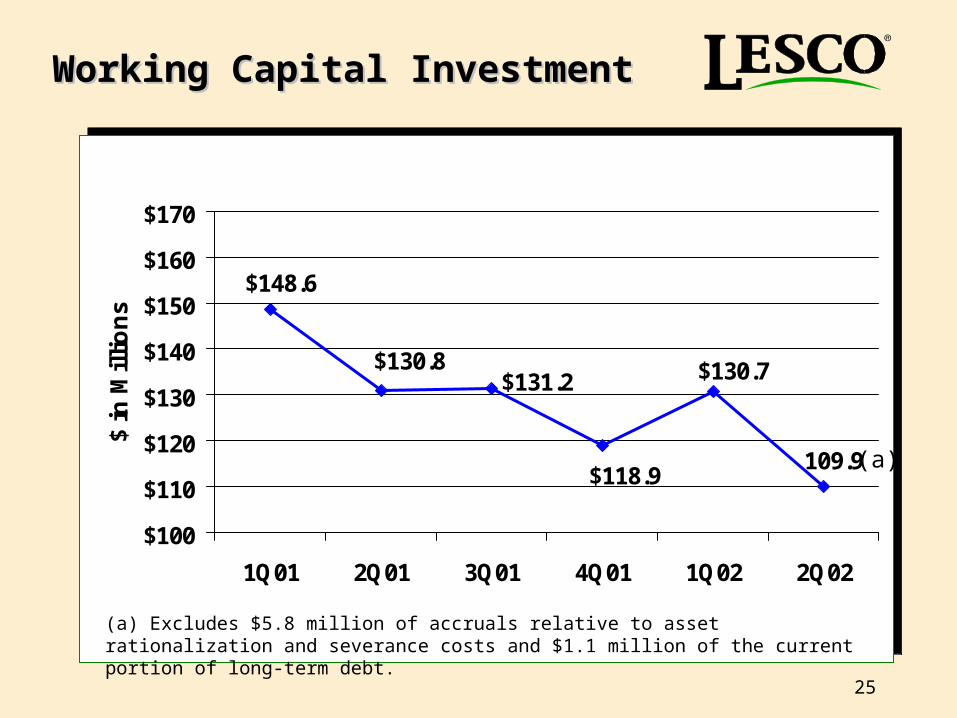
109.9
$130.7
$118.9
$131.2$130.8
$148.6
$100
$110
$120
$130
$140
$150
$160
$170
1Q01 2Q01 3Q01 4Q01 1Q02 2Q02
$ in
Mil
lio
ns
Working Capital InvestmentWorking Capital Investment
(a)
(a) Excludes $5.8 million of accruals relative to asset rationalization and severance costs and $1.1 million of the current portion of long-term debt.
26
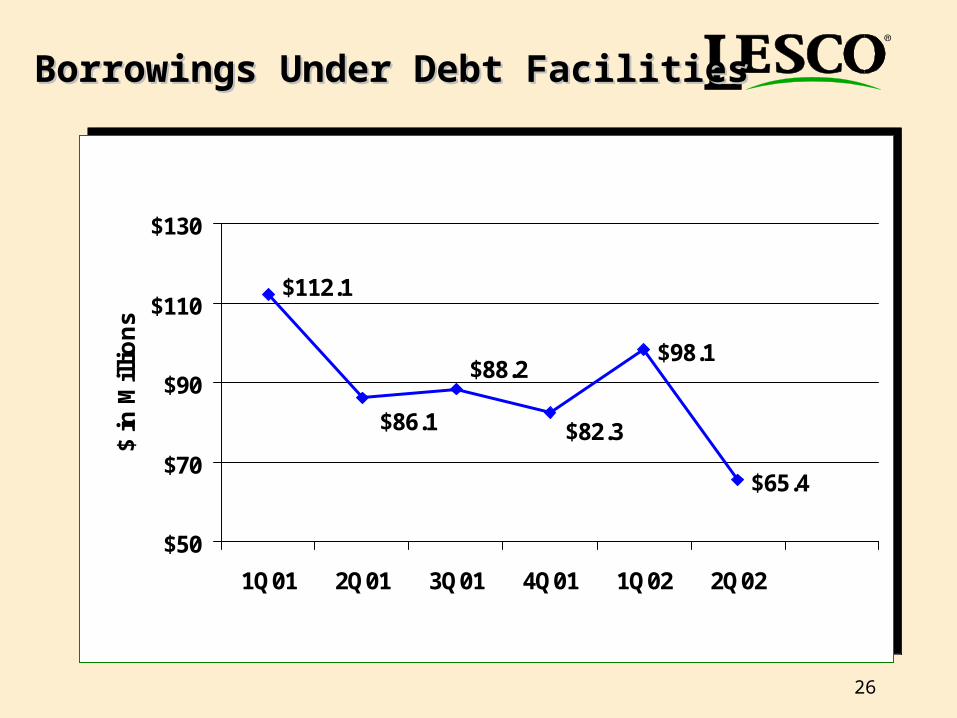
$98.1
$65.4
$82.3
$88.2
$86.1
$112.1
$50
$70
$90
$110
$130
1Q01 2Q01 3Q01 4Q01 1Q02 2Q02
$ in
Mil
lio
ns
Borrowings Under Debt FacilitiesBorrowings Under Debt Facilities

27
2002 Full Year 2002 Full Year GuidanceGuidance

28
• Sales growth 2-4%; was 4-5%Sales growth 2-4%; was 4-5%
• GM% increase 150 bpsGM% increase 150 bps
• Expenses - flat to prior yearExpenses - flat to prior year
• EPS in the range of $0.60 - $0.70*EPS in the range of $0.60 - $0.70*** Excludes one-time charges for inventory markdown of $9.6 million, Excludes one-time charges for inventory markdown of $9.6 million,
manufacturing rationalization of $12.0 million, severance expense of manufacturing rationalization of $12.0 million, severance expense of $3.8 million, debt restructuring of $2.9 million, net of taxes, and $3.8 million, debt restructuring of $2.9 million, net of taxes, and FASB No. 142 of $4.6 million, net of taxes. FASB No. 142 of $4.6 million, net of taxes.
2002 Forecast2002 Forecast
29
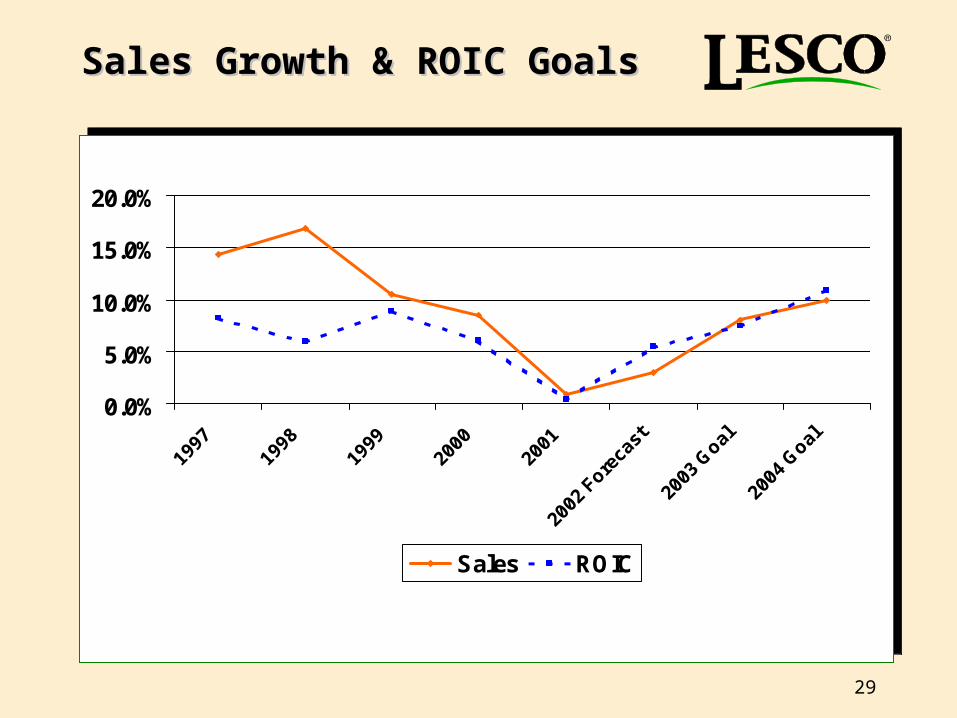
Sales Growth & ROIC GoalsSales Growth & ROIC Goals
0.0%
5.0%
10.0%
15.0%
20.0%
1997
1998
1999
2000
2001
2002
Fore
cast
2003
Goal
2004
Goal
Sales ROIC

30
QuestionsQuestions & &
AnswersAnswers