Second General Assembly The IEA/NEA Nuclear Energy ...€¦ · NEA Sustainable Nuclear Energy...
19
© OECD/IEA 2010 Steven Lee, IEA Martin Taylor, NEA Sustainable Nuclear Energy Technology Platform Second General Assembly 14 September 2010, Brussels The IEA/NEA Nuclear Energy Technology Roadmap
Transcript of Second General Assembly The IEA/NEA Nuclear Energy ...€¦ · NEA Sustainable Nuclear Energy...

© OECD/IEA 2010
Steven Lee, IEA
Martin Taylor, NEA
Sustainable Nuclear Energy Technology Platform Second General Assembly
14 September 2010, Brussels The IEA/NEA Nuclear Energy Technology Roadmap

© O
ECD
/IEA
& O
ECD
/NEA
20
10
2
0
5
10
15
20
25
30
35
40
45
50
55
60
2010 2015 2020 2025 2030 2035 2040 2045 2050
Gt
CO
2
CCS 19%
Renewables 17%
Nuclear 6%
Power generation efficiency and fuel switching 5%
End-use fuel switching 15%
End-use fuel and electricity efficiency 38%
BLUE Map emissions 14 Gt
Baseline emissions 57 Gt
WEO 2009 450 ppm case ETP2010 analysis
Key Technology Options

© O
ECD
/IEA
& O
ECD
/NEA
20
10
3
Power Sector 2050 CO2 Emissions Reductions in BLUE Map Scenario
Nuclear, 19%
Hydro; 2%
Wind; 11%
Solar PV; 7%
Solar CSP; 9%
Geothermal; 3% Biomass & waste; 2%
Carbon capture & storage; 31%
IGCC coal; 4%
Ultra/supercritical coal; 3%
Gas efficiency; 2%
Coal to gas switching; 7%
Total CO2 emissions reductions from electricity sector: 14 Gt
Emissions reductions compared to Baseline scenario

© O
ECD
/IEA
& O
ECD
/NEA
20
10
4
Based on a scenario to halve CO2 emissions by 2050 Establish a baseline of technology status today Identify and address technology-specific barriers
Create technical, policy, legal, financial, and public acceptance milestones and priority near-term actions
Create a process for stakeholder collaboration Special developing country focus on engagement,
national roadmaps Identify partners for implementation Support technology diffusion, knowledge sharing
among countries
The Role of the IEA Energy Technology Roadmaps
How Do We Get There From Here?
© O
ECD
/IEA
& O
ECD
/NEA
20
10
5
Present Status of Roadmaps
2009 releases Carbon capture & storage, Electric vehicles,
Cement sector, Wind energy
2010 releases Solar PV, Concentrating solar power – May
Nuclear energy – June
Efficient buildings: heating and cooling – September
Smart grids, Biofuels – November
Vehicle efficiency, Geothermal power – December
2011 releases Hydrogen & fuel cells; Clean/high-efficiency coal;
Energy efficiency in buildings: design & operation; Biomass combustion for heat & power

© O
ECD
/IEA
& O
ECD
/NEA
20
10
6
Nuclear is Already a Widely Used Low-Carbon Technology
Natural gas,
21,7%
Wind, 1,4%
Nuclear, 21.4%
Other, 0,4%
Hydro, 11,8%
Biomass & waste, 2,0%
Oil, 4,1%
Coal, 37.2%
OECD Total: 10 642 TWh
Natural gas;
20,9%
Wind; 0,9%
Nuclear, 13.8%
Other; 0,3%
Hydro; 15,6% Biomass
& waste; 1,3%
Oil; 5,7%
Coal, 41.6%
World Total: 19 756 TWh
Data for 2007. Source: World Energy Outlook, IEA 2009

© O
ECD
/IEA
& O
ECD
/NEA
20
10
7
0
50
100
150
200
250
Nuclear Coal Gas WindOnshore
Nuclear Coal Gas WindOnshore
Nuclear Coal Gas WindOnshore
N. America Europe Asia Pacific
USD
/MW
h
Median Line
Nuclear is already a very cost competitive technology
Levelised Electricity Generation Cost by Region (5% Discount Rate)
Source: Projected Costs of Generating Electricity, IEA/NEA 2010

© O
ECD
/IEA
& O
ECD
/NEA
20
10
8
Levelised Electricity Generation Cost by Region (10% Discount Rate)
0
50
100
150
200
250
Nuclear Coal Gas WindOnshore
Nuclear Coal Gas WindOnshore
Nuclear Coal Gas WindOnshore
N. America Europe Asia Pacific
USD
/MW
h
Median Line
But nuclear costs depend strongly on the discount rate Source: Projected Costs of Generating Electricity, IEA/NEA 2010

© O
ECD
/IEA
& O
ECD
/NEA
20
10
9
A New Age of Electrification
0
5 000
10 000
15 000
20 000
25 000
30 000
35 000
40 000
45 000
50 000
2007 Baseline 2050 BLUE Map 2050 BLUE HighNuclear 2050
Ele
ctr
icit
y g
en
era
tio
n (
TW
h)
Other
Solar
Wind
Biomass + CCS
Biomass/waste
Hydro
Nuclear
Natural gas + CCS
Natural gas
Oil
Coal + CCS
Coal
© O
ECD
/IEA
& O
ECD
/NEA
20
10
10
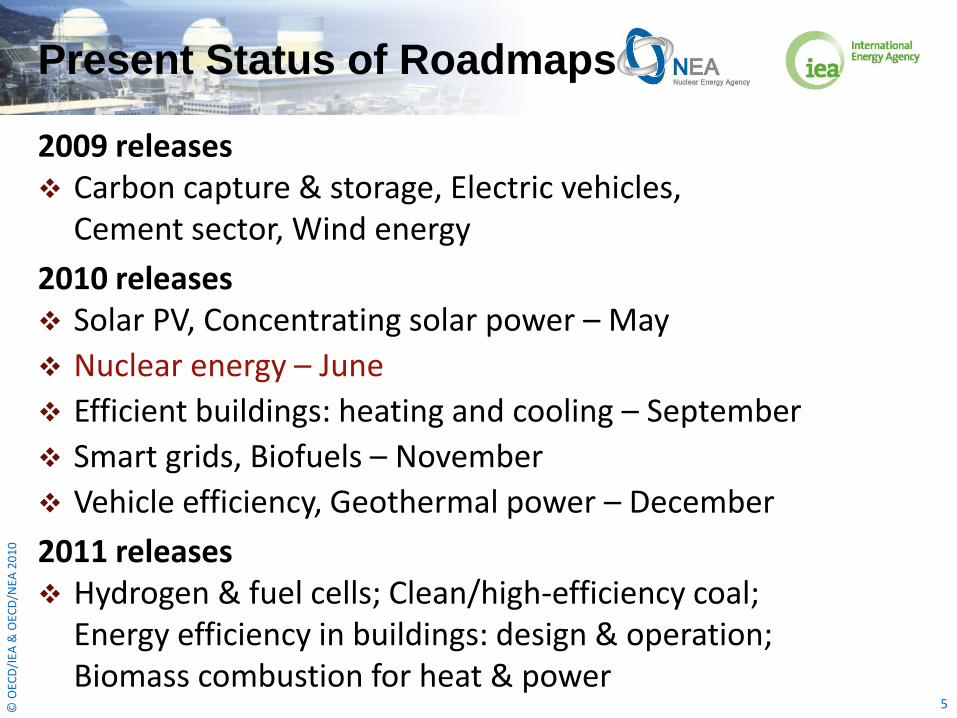
Growth in Nuclear Capacity in BLUE Map Scenario to 2050
0%
5%
10%
15%
20%
25%
30%
35%
40%
0
200
400
600
800
1 000
1 200
1 400
2010 2020 2030 2040 2050
Sh
are
of
glo
bal
ele
ctr
icit
y p
rod
ucti
on
Insta
lled
cap
acit
y (
GW
)
China India United States & CanadaLatin America OECD Europe OECD PacificOther developing Asia Economies in transition Africa & Middle EastBLUE Map % share BLUE High Nuclear % share
© O
ECD
/IEA
& O
ECD
/NEA
20
10
11
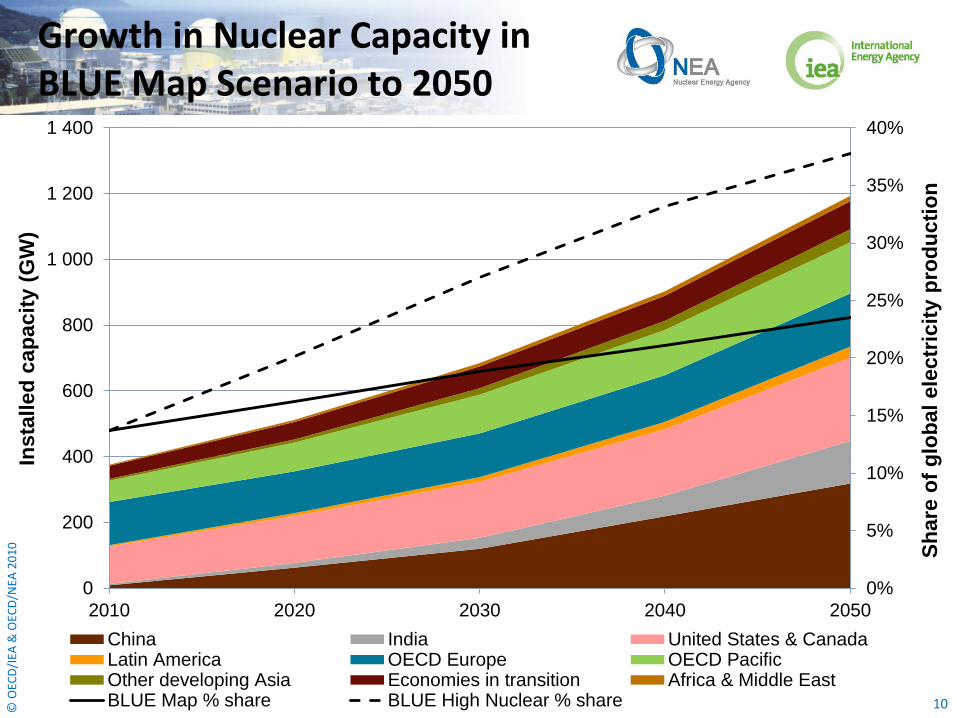
Demonstrate the ability to build the latest nuclear plant designs on time and within budget
Develop the industrial capacities and skilled human resources to support sustained growth in nuclear capacity
Establish the required legal frameworks and institutions in countries where these do not yet exist
Encourage the participation of private sector investors in nuclear power projects
Make progress in implementing plans for permanent disposal of high-level radioactive wastes
Enhance public dialogue to inform stakeholders about the role of nuclear in energy strategy
Expand the supply of nuclear fuel in line with increased nuclear generating capacity
Key Actions for Next 10 Years

© O
ECD
/IEA
& O
ECD
/NEA
20
10
12
Milestones: Policy Support
2010 2020 2030 2040 2050
Clear & stable
commitment to
nuclear power in
energy policy Harmonise regulatory requirements to
facilitate the use of standardised designs
Strengthen non-proliferation regimes,
while providing security of fuel supply
Ensure legal &
regulatory
systems work
effectively
Ensure institutions & funding are in place
for waste disposal & decommissioning
Develop legal & institutional frameworks
for wider use of advanced fuel cycles

© O
ECD
/IEA
& O
ECD
/NEA
20
10
13
Milestones: Capacity Building & Industry
2010 2020 2030 2040 2050
Increase capacity
to supply nuclear
plant components
& systems
Strengthen & broaden global supply chains as more countries
launch nuclear programmes
Increase uranium production & nuclear fuel cycle capacities to
meet rapid demand growth
Develop the
qualified & skilled
human resources
needed
Achieve nuclear
construction rates
from 2020 double
present levels
Continue to
increase nuclear
construction rates
Develop industrial
capacities to
support advanced
fuel cycles
© O
ECD
/IEA
& O
ECD
/NEA
20
10
14
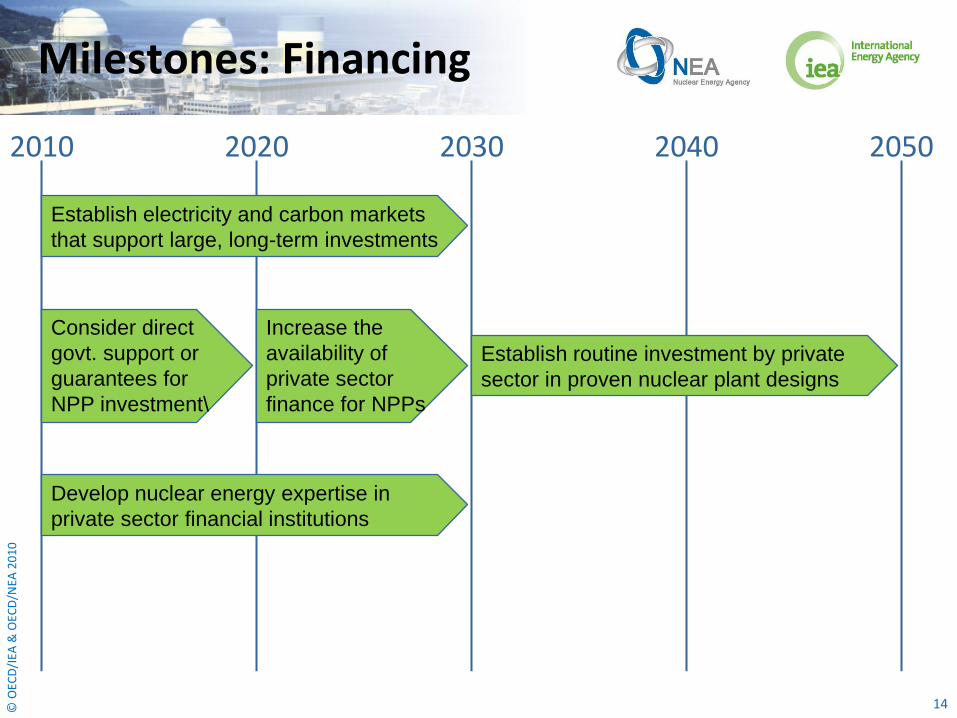
Milestones: Financing
2010 2020 2030 2040 2050
Consider direct
govt. support or
guarantees for
NPP investment\
Establish electricity and carbon markets
that support large, long-term investments
Develop nuclear energy expertise in
private sector financial institutions
Establish routine investment by private
sector in proven nuclear plant designs
Increase the
availability of
private sector
finance for NPPs

© O
ECD
/IEA
& O
ECD
/NEA
20
10
15
Regional Investment Needs for Nuclear in BLUE Map Scenario
China 893 USD bn
India 389 USD bn
Latin America 116 USD bn
United States & Canada
883 USD bn
OECD Europe 586 USD bn
OECD Pacific 615 USD bn
Other Developing Asia
107 USD bn
Economies in Transition
330 USD bn
Africa & Middle East
56 USD bn

© O
ECD
/IEA
& O
ECD
/NEA
20
10
16
Milestones: Technology Development & Deployment
2010 2020 2030 2040 2050
Fully
establish
Gen III+
designs,
bring
FOAK
plants
on-line
Implement plans to build & operate
geological repositories for waste disposal
Show
on-time
& on-
budget
completion
of further
Gen III+
plants Complete demonstration of the most
promising Gen IV nuclear plants
Increase use of nuclear energy for non-
electricity applications (e.g. heat)
Strengthen RD&D
in advanced fuel
cycles
Build & operate
commercial-scale
Gen IV plants

© O
ECD
/IEA
& O
ECD
/NEA
20
10
17
Key Findings (1)
Nuclear is a mature low-carbon energy technology that is already available for wider deployment
In the ETP BLUE Map scenario, nuclear capacity grows to 1 200 GWe by 2050, providing 24% of global electricity
Obstacles to this expansion are mainly policy-related, industrial and financial, rather than technological
But in the longer term, technological development will be needed for nuclear to remain competitive
A clear and stable commitment to nuclear as part of national energy strategy is a prerequisite
Financing will be a major challenge, and government support may be needed for private-sector investment

© O
ECD
/IEA
& O
ECD
/NEA
20
10
18
Key Findings (2)
Industrial capacity to build nuclear plants will need to double by 2020 for expansion in line with the scenario; fuel cycle capacities will also need to increase
A great increase in highly qualified and skilled human resources will also be needed
Progress needs to be made in building and operating facilities for the disposal of spent fuel & high-level waste
Safeguards and physical protection measures must be maintained and strengthened where necessary
Generation IV reactor and fuel cycle technologies may offer improved sustainability, economics, proliferation-resistance, safety and reliability, starting before 2050

© O
ECD
/IEA
& O
ECD
/NEA
20
10
19
The Nuclear Energy Roadmap was released on 16 June
All roadmaps are
available at:
www.iea.org/roadmaps