SECARB Citronelle Hill Thomas Trautz Library/Events/2015/carbon storage... · streams monitoring...
42
Southeast Regional Carbon Sequestration Partnership Citronelle Project Carbon Storage R&D Project Review Meeting Pittsburgh, PA August 18, 2015 Gerald R. Hill, Ph.D. Senior Technical Advisor Southern States Energy Board
-
Upload
truongkien -
Category
Documents
-
view
217 -
download
3
Transcript of SECARB Citronelle Hill Thomas Trautz Library/Events/2015/carbon storage... · streams monitoring...

Southeast Regional Carbon Sequestration Partnership
Citronelle Project
Carbon Storage R&D Project Review Meeting Pittsburgh, PA
August 18, 2015
Gerald R. Hill, Ph.D.
Senior Technical Advisor Southern States Energy Board

Presentation Outline
l Jerry Hill, SSEB l SECARB Overview
l Jerrad Thomas, Southern Company l Capture Unit Overview l Capture R&D Accomplishments
l Rob Trautz, EPRI l Storage Overview l Storage R&D Accomplishments
2
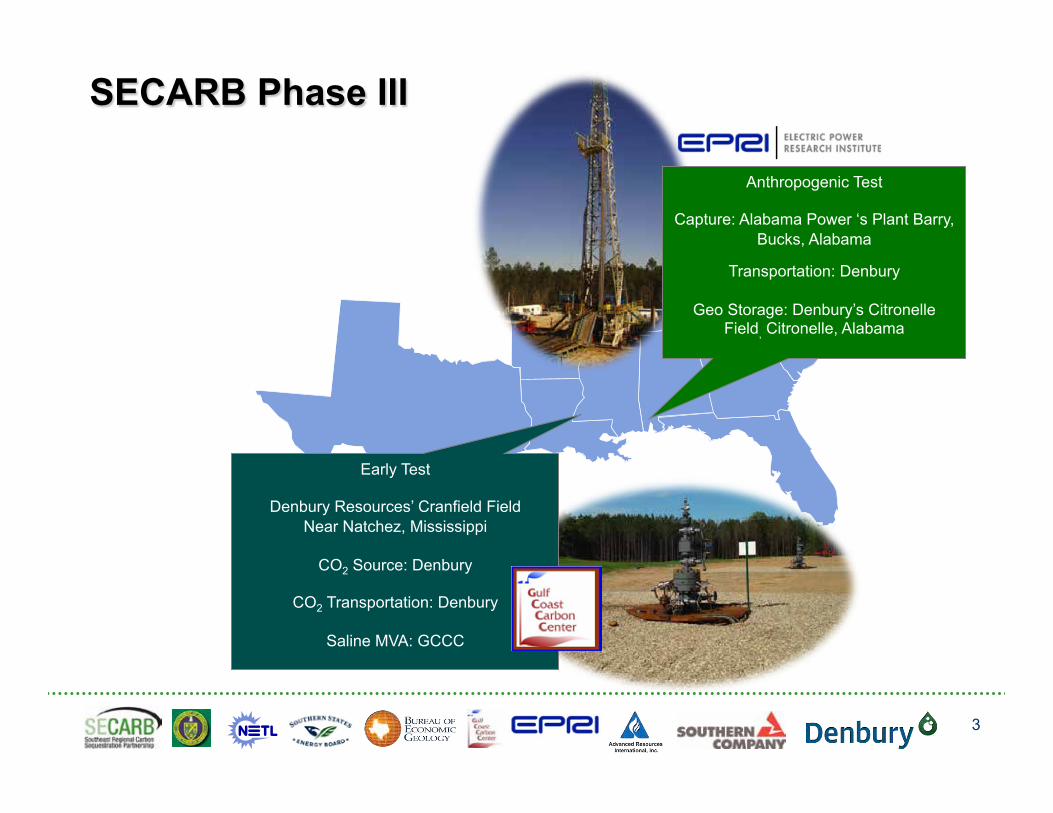
Early Test
Denbury Resources’ Cranfield Field Near Natchez, Mississippi
CO2 Source: Denbury
CO2 Transportation: Denbury
Saline MVA: GCCC
Anthropogenic Test
Capture: Alabama Power ‘s Plant Barry, Bucks, Alabama
Transportation: Denbury
Geo Storage: Denbury’s Citronelle
Field, Citronelle, Alabama
SECARB Phase III
3

SECARB Phase III Anthropogenic Test l Carbon capture from Plant Barry
(equivalent to 25MW of electricity).
l 12 mile CO2 pipeline constructed by Denbury Resources.
l CO2 injection into ~9.400 ft. deep saline formation (Paluxy) above Citronelle Field
l Monitoring of CO2 storage during injection and 3years post-injection.
4

Plant Barry 25 MW Demo
Jerrad Thomas | Research Engineer Southern Company Services, Inc.

Carbon Capture and Storage Projects
Kemper County IGCC project
25-MW CCS Demo at Plant Barry
National Carbon Capture Center • U.S. DOE facility operated by Southern Company. • Accelerates commercialization of technologies. • Coal or natural gas constituents tests. • Enables coal-based power plants to achieve near-zero emissions
• 90% CO2 capture. • Capture, compression, transport, sequestration. • ~115,000 tons sequestered, ~240,000 tons captured. • Largest CCS facility on a fossil-fueled power plant in the U.S.
• 582 megawatts of power. • State-of-the-art coal gasification design. • Will use a four-billion-ton reserve of Mississippi lignite. • Affordable, abundant, but little-used natural resource. • Will capture at least 65% of its CO2 emissions for EOR use. • Will reduce nitrogen oxide, sulfur dioxide and mercury.

Project Overview
• Located just north of Mobile, Alabama at Alabama Power Plant Barry • Largest CO2 capture project on a coal-fired power plant in the United States
• First CO2 pipeline permitted and constructed in the State of Alabama • First integration of a CO2 capture plant on a coal plant with pipeline transportation and injection for geologic storage
Barry CCS 25 MW Demo
APC Plant Barry

Information and Goals • CO2 Capture and Compression
• SCS/MHI collaboration with partners • KM-CDR capture technology
• Transportation and Sequestration • DOE SECARB Phase III “Anthropogenic Test” • 100-300 kMton of CO2 will be injected into a
saline formation over 2-3 years • 12 mile CO2 pipeline to Denbury Resources,
Inc. injection site into Citronelle Dome • Objectives/Goals
• Advance saline sequestration technology through large field test
• Characterize CCS operations to support larger scale development and deployment
• Continue outreach and education to ensure seamless deployment
8

CO2 Capture Plant Flue gas demister and outlet
CO2 absorber (lower) and Water wash (upper) column
Solvent regeneration (“CO2 stripper”) column
CO2 compression and dehydration unit
Flue gas inlet
Flue gas quench column
9
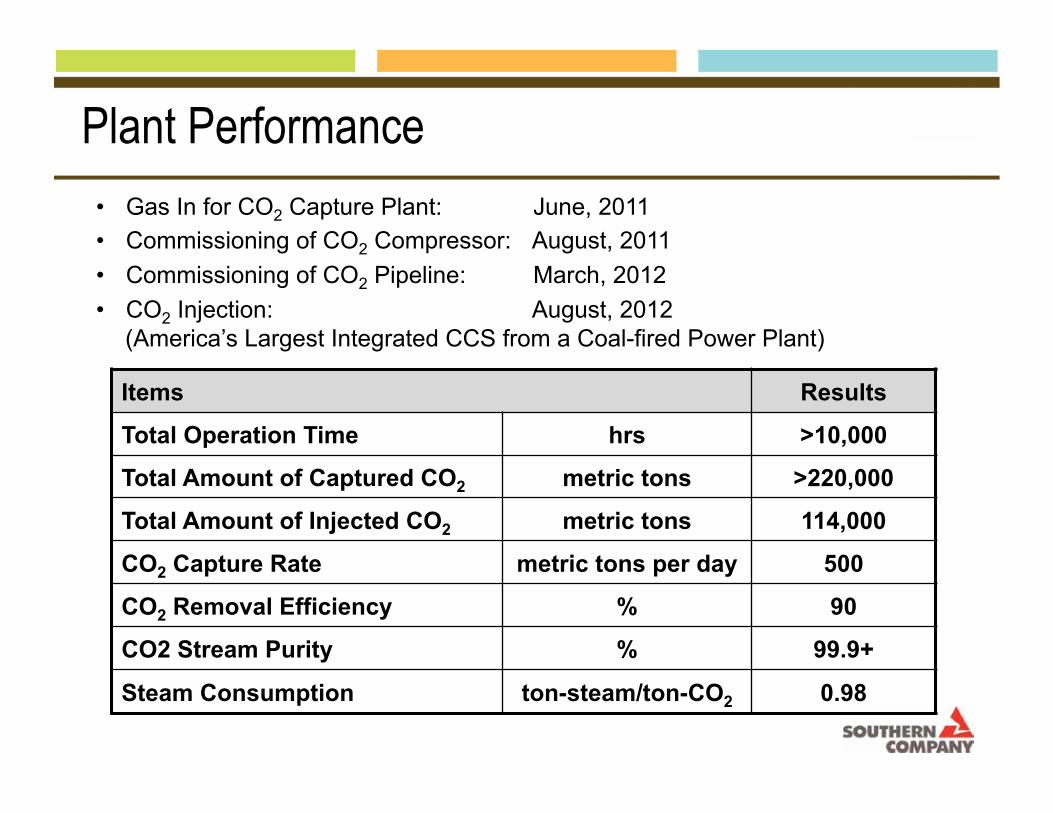
Plant Performance • Gas In for CO2 Capture Plant: June, 2011 • Commissioning of CO2 Compressor: August, 2011 • Commissioning of CO2 Pipeline: March, 2012 • CO2 Injection: August, 2012
(America’s Largest Integrated CCS from a Coal-fired Power Plant)
Items Results
Total Operation Time hrs >10,000
Total Amount of Captured CO2 metric tons >220,000
Total Amount of Injected CO2 metric tons 114,000
CO2 Capture Rate metric tons per day 500
CO2 Removal Efficiency % 90
CO2 Stream Purity % 99.9+
Steam Consumption ton-steam/ton-CO2 0.98
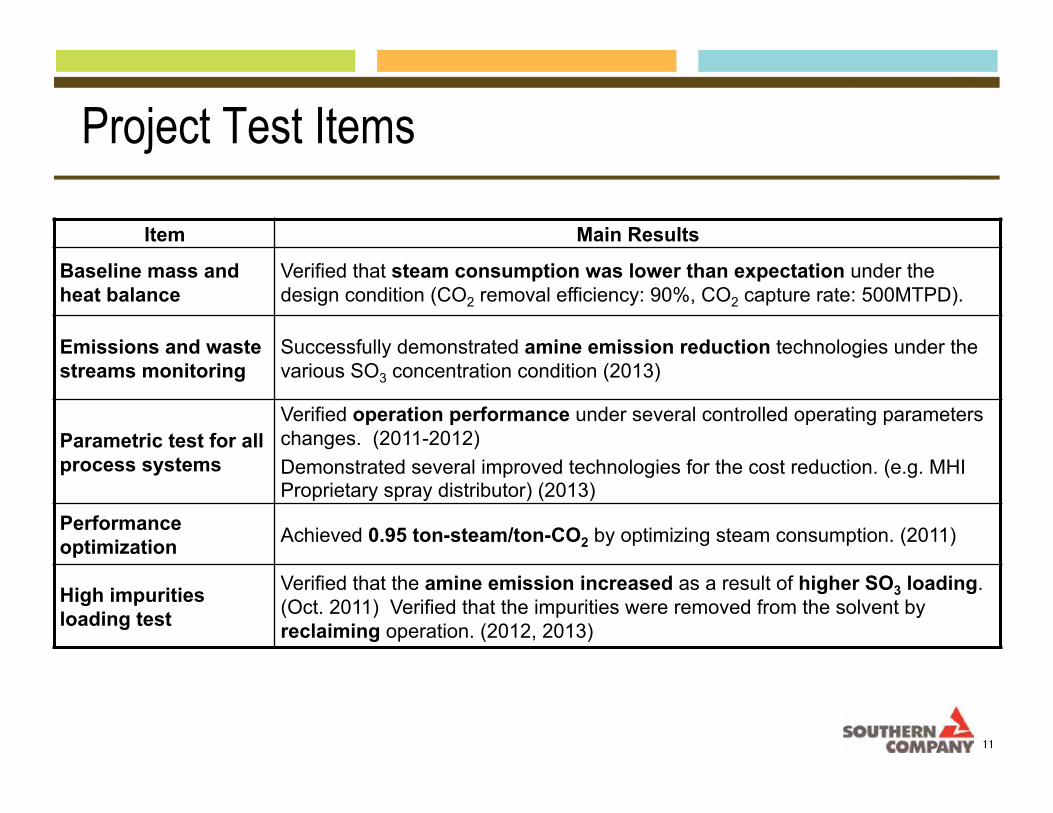
Project Test Items
Item Main Results
Baseline mass and heat balance
Verified that steam consumption was lower than expectation under the design condition (CO2 removal efficiency: 90%, CO2 capture rate: 500MTPD).
Emissions and waste streams monitoring
Successfully demonstrated amine emission reduction technologies under the various SO3 concentration condition (2013)
Parametric test for all process systems
Verified operation performance under several controlled operating parameters changes. (2011-2012) Demonstrated several improved technologies for the cost reduction. (e.g. MHI Proprietary spray distributor) (2013)
Performance optimization Achieved 0.95 ton-steam/ton-CO2 by optimizing steam consumption. (2011)
High impurities loading test
Verified that the amine emission increased as a result of higher SO3 loading. (Oct. 2011) Verified that the impurities were removed from the solvent by reclaiming operation. (2012, 2013)
11

(1) Amine Emission Evaluation
More than 90% Reduction
Fig. Relationship between SO3 conc. and solvent emission
High SO3 in the gas
Low SO3 in the gas
• Amine emissions increased significantly with a small amount of SO3. • MHI’s amine emission reduction system decreases amine emissions down to
less than 1/10 of the conventional system
12

(2) Improved Technology
Fig. Trough Type Distributer Fig. Spray Type Distributer
(MHI Proprietary)
• Proprietary spray type distributor developed by MHI to reduce weight of tower internals
• Keeping the same performance as the trough type distributor approximately 50% cost reduction of tower internals was achieved
13

High Efficiency System
14

Project Scope
• Integrate a 25 MW waste heat recovery technology termed Mitsubishi High Efficiency System (HES) into 25 MW CCS plant and Plant Barry, Unit 5
• Recover low grade waste heat in flue gas and CO2 to preheat condensate replacing LP steam
• Evaluate improvements in the energy performance and emissions profile of the integrated plants
• Employ 0.5MW mini ESP to test effect of HES on SO3 and trace metals emissions
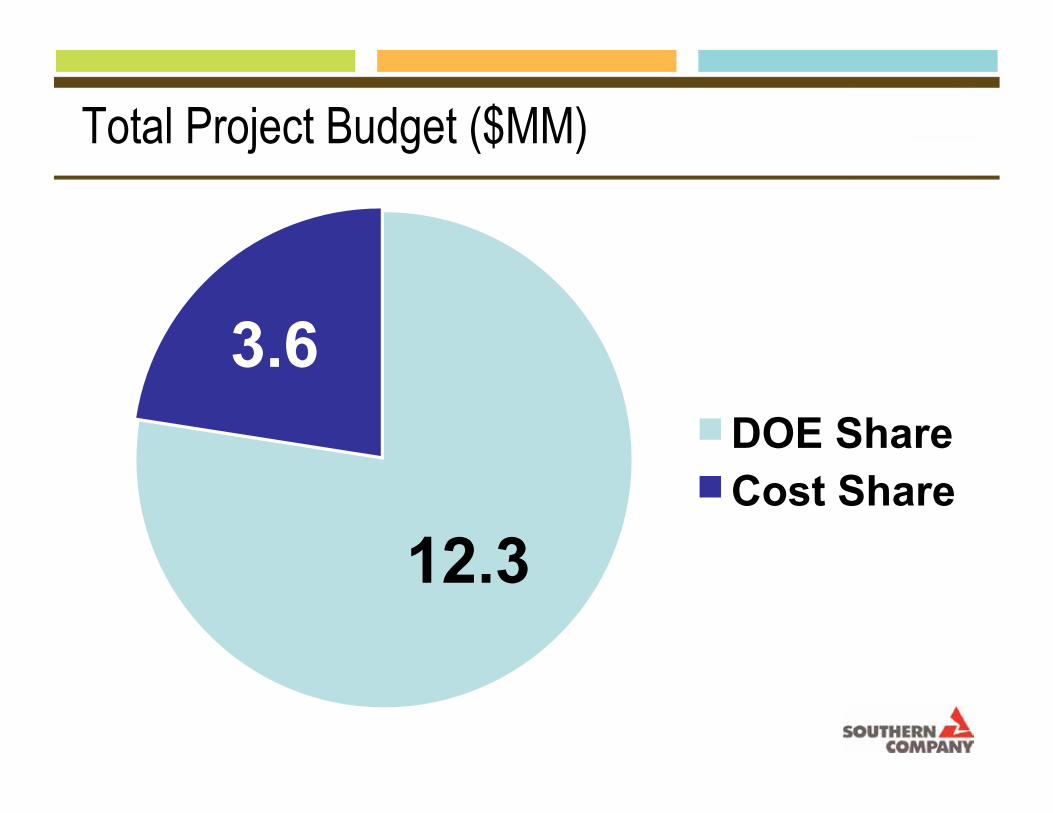
Total Project Budget ($MM)
12.3
3.6 DOE Share Cost Share

Flue Gas Cooler captures SO3 • Operates downstream of the APH • Mechanism for removal of SO3 from flue gas
• SO3 (g) + H2O (g) --> H2SO4 (g) • H2SO4 (g) --> H2SO4 (l) • H2SO4 (l) condenses on fly ash in flue gas and a protective layer
of ash on tube bundles
• Flue Gas Cooler tube skin temperature < SO3 dewpoint • Alkaline species in fly ash (Ca, Na) neutralize H2SO4 • Silicates, etc. physically adsorb H2SO4

Other benefits of Flue Gas Cooler • Improve removal of Hg, Se, SO3 across the ESP • Reduce AQCS cost
• Improve ESP performance • Improve FGD performance • Improve CCS performance
• Potential to simplify boiler/steam turbine cycles • Improve plant heat rate

Air Pre-heater Dry ESP FGD
Steam Cycle
Boiler Feed Water
CO2 Cooler in
CCS Plant
Flue Gas Boiler Feed Water Flue
Gas Cooler
350°
202°
90°
269° 167°
SCR 700°
Miniature ESP
25 MW
0.5 MW
Fly Ash
T o S C R Outlet
PROJECT = Boiler feed water will be heated with CO2 Cooler and Flue Gas Cooler

BP3 completes March 2016
BP1 • FEED and Target Cost Estimate • Permitting
BP2 • Engineering, Procurement,
Construction
BP3 • Operations • Field Testing Analysis

Remaining project work
Complete Constructi
on Operations and Testing Commission
Dec 2014 May 2015 June 2015 – Nov 2015
• Verify efficiency • Estimate reduction in FGD water use • Measure corrosion, erosion • Test water quality • Measure SO3, trace metal removal

Thank You!
For more information please contact:
Jerrad Thomas – Southern Company Services Project Manager for CCUS and Research Engineer
Email: [email protected] Tel: 205-257-2425
22

© 2015 Electric Power Research Institute, Inc. All rights reserved.
Rob Trautz, Princ. Tech. Leader, EPRI
Carbon Storage R&D Project Review Meeting
18-August-2015
SECARB Phase III Citronelle Project
(Anthropogenic Test) in Alabama

24
This presentation is based upon work supported by the Department of Energy National Energy Technology Laboratory under DE-FC26-05NT42590 and was prepared as an account of work sponsored by an agency of the United States Government. Neither the United States Government nor any agency thereof, nor any of their employees, makes any warranty, express or implied, or assumes any legal liability or responsibility for the accuracy, completeness, or usefulness of any information, apparatus, product, or process disclosed, or represents that its use would not infringe privately owned rights. Reference herein to any specific commercial product, process, or service by trade name, trademark, manufacturer, or otherwise does not necessarily constitute or imply its endorsement, recommendation, or favoring by the United States Government or any agency thereof. The views and opinions of authors expressed herein do not necessarily state or reflect those of the United States Government or any agency thereof.
Acknowledgement
25 © 2015 Electric Power Research Institute, Inc. All rights reserved.
Storage Project Objectives
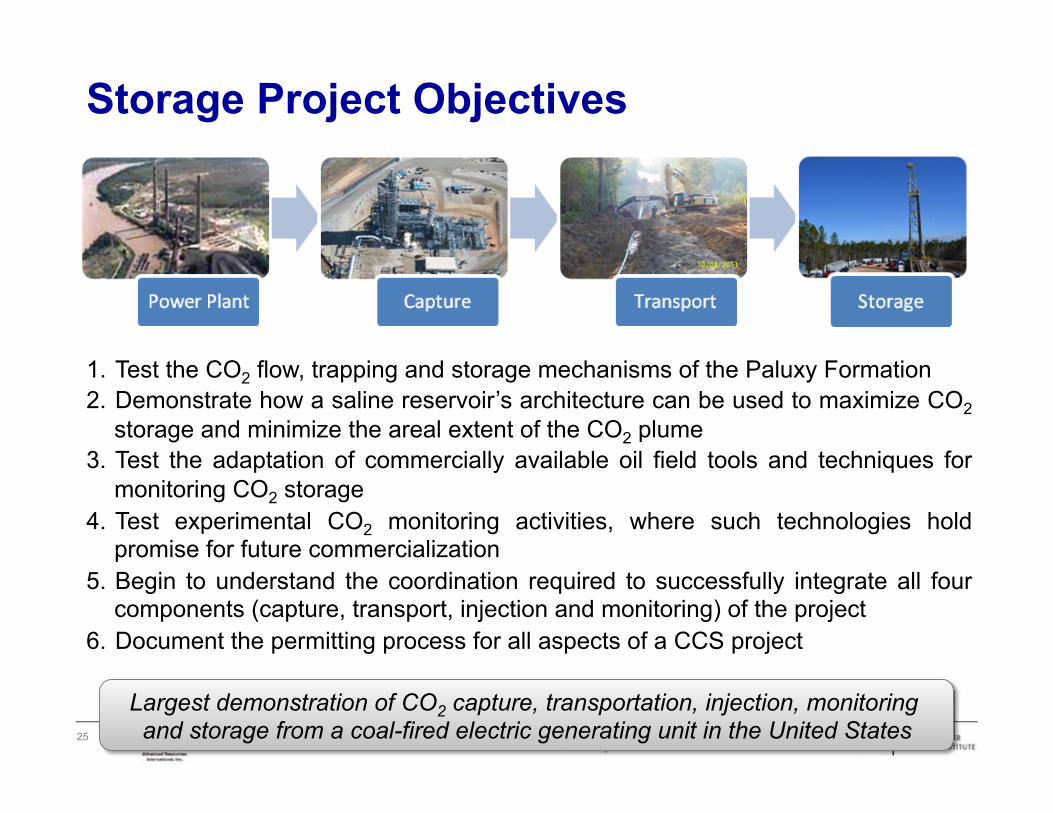
1. Test the CO2 flow, trapping and storage mechanisms of the Paluxy Formation 2. Demonstrate how a saline reservoir’s architecture can be used to maximize CO2
storage and minimize the areal extent of the CO2 plume 3. Test the adaptation of commercially available oil field tools and techniques for
monitoring CO2 storage 4. Test experimental CO2 monitoring activities, where such technologies hold
promise for future commercialization 5. Begin to understand the coordination required to successfully integrate all four
components (capture, transport, injection and monitoring) of the project 6. Document the permitting process for all aspects of a CCS project
Largest demonstration of CO2 capture, transportation, injection, monitoring and storage from a coal-fired electric generating unit in the United States

26 © 2015 Electric Power Research Institute, Inc. All rights reserved.
Storage Site Overview—Citronelle Oilfield

27 © 2015 Electric Power Research Institute, Inc. All rights reserved.
Storage Project Status
• Alabama Department of Environmental Management (ADEM) issued Class V permit, Nov. 2011
• ADEM granted permission to inject on August 8, 2012 Ø Injection commenced on August 20, 2012
• Injection ended September 1, 2014 Ø Approximately 114,104 metric tons of CO2 injected
• A crosswell seismic survey acquired in June, 2014 captured a time-lapse image of the CO2 plume
• Other testing and monitoring activities have indicated containment
• The project entered the Post-Injection Site Care Period on September 2, 2014
• Site closure based on demonstration of CO2 containment and non-endangerment of USDW

28 © 2015 Electric Power Research Institute, Inc. All rights reserved.
1. Monitoring & Modeling Lines of Evidence

29 © 2015 Electric Power Research Institute, Inc. All rights reserved.
Anthropogenic Test MVA Program • Multiple lines of evidence to
confirm CO2 containment include: • Soil CO2 flux • PFT monitoring • Crosswell Seismic and VSP
surveys • PNC logging (above zone
saturation) • Pressure monitoring
• Assure non-endangerment of USDWs
• Monitoring geochemistry of multiple aquifers
• Monitoring results are used to inform the reservoir simulation

30 © 2015 Electric Power Research Institute, Inc. All rights reserved.
MVA Elements and Frequency
Continuous Monthly Quarterly Annual
Milestone (Baseline, Injection, Post)
Shallow Soil fluxGroundwater sampling (USDW)PFT surveyDeep CO2 volume, pressure & compositionReservoir fluid samplingInjection, temperature & spinner logsPulse neutron logsCrosswell seismicVertical seismic profile (VSP)ExperimentalDistributed Temperature Sensing (DTS)Comparative fluid sampling methodsMBM VSPDistributed Acoustic Sensing (DAS)MBM VSP & OVSP Seismic
MVA MethodFrequency

31 © 2015 Electric Power Research Institute, Inc. All rights reserved.
CO2 Containment—Soil CO2 Flux and Tracer Monitoring
Soil CO2 Flux
Tracer Results
Soil CO2 results appear to vary as a function of mean temperature and tracer surveys have been non-detect
Well Innoculation Jun-‐13 Nov-‐13 Mar-‐15D-‐9-‐1 ND ND ND NDD-‐9-‐2 ND ND ND NDD-‐9-‐3 ND ND ND NDD-‐9-‐6 ND ND ND NDD-‐9-‐7 ND ND ND NDD-‐9-‐8 Invalid Data ND ND NDD-‐9-‐9 ND ND ND NDD-‐9-‐9 ND ND ND NDD-‐9-‐10 Invalid Data ND ND NDD-‐9-‐11 ND ND ND ND

32 © 2015 Electric Power Research Institute, Inc. All rights reserved.
• Crosswell seismic surveys allow for high-resolution mapping of the acoustic travel time (velocity) and seismic reflectors between a pair of wells
• When CO2 displaces water in the formation, it changes the acoustic impedance of the rock
• Acoustic wave decreases and its direct travel time increases
• Results from “repeat” surveys performed during or after CO2 injection can be compared to a pre-injection “baseline” survey to image the extent of the CO2 plume (referred to as “time-lapse imaging”)
• Baseline and repeat 2-D crosswell seismic surveys were performed between the injection well and the observation well
Deep Monitoring— Time-Lapse Crosswell Seismic
33 © 2015 Electric Power Research Institute, Inc. All rights reserved.
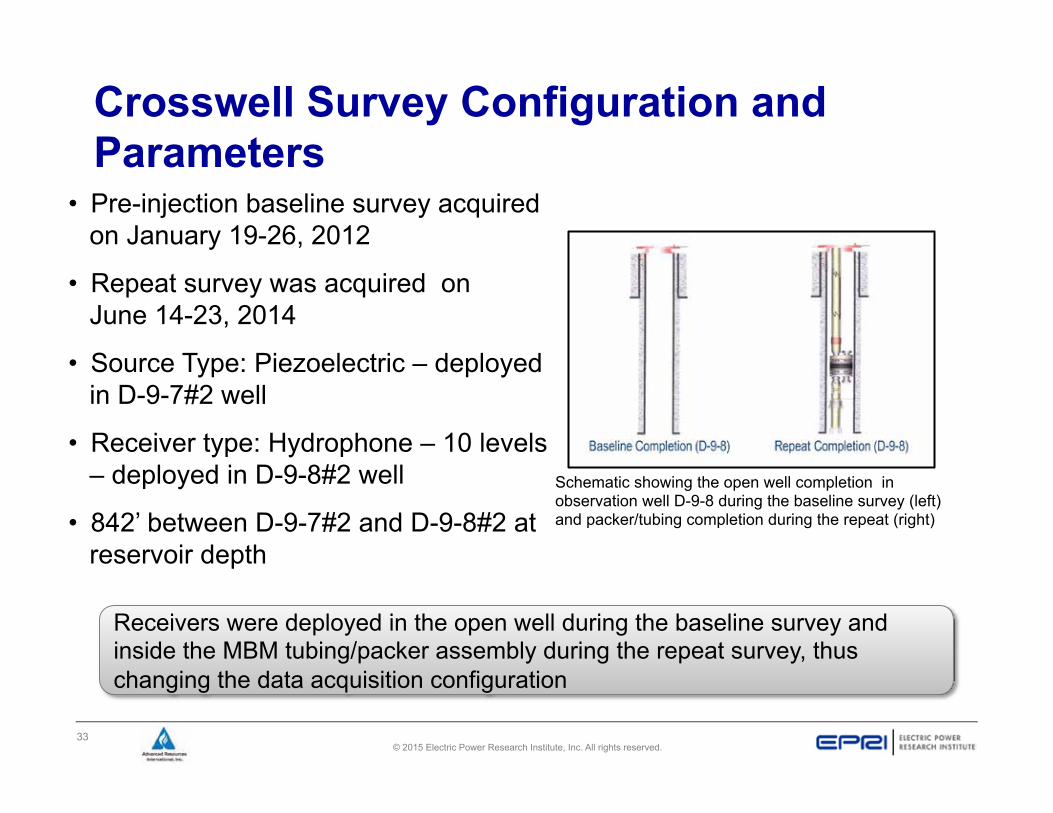
Crosswell Survey Configuration and Parameters
• Pre-injection baseline survey acquired on January 19-26, 2012
• Repeat survey was acquired on June 14-23, 2014
• Source Type: Piezoelectric – deployed in D-9-7#2 well
• Receiver type: Hydrophone – 10 levels – deployed in D-9-8#2 well
• 842’ between D-9-7#2 and D-9-8#2 at reservoir depth
Schematic showing the open well completion in observation well D-9-8 during the baseline survey (left) and packer/tubing completion during the repeat (right)
Receivers were deployed in the open well during the baseline survey and inside the MBM tubing/packer assembly during the repeat survey, thus changing the data acquisition configuration

34 © 2015 Electric Power Research Institute, Inc. All rights reserved.
Baseline Survey Results
Inje
ctio
n Zo
ne
Confining Zone
Composite image mapping the seismic reflections (squiggles) superimposed on top of the velocity tomogram (colored background)
• Velocity tomograph and reflection image (right) provided a good representation of the reservoir and confining unit
• ~10 feet vertical resolution
• No reservoir or confining unit discontinuities or small-scale faults were observed in the reflection data
• Layering observed in the Upper Paluxy will help disperse the CO2 plume, thus minimizing its footprint
• Baseline velocity tomogram should be of sufficient quality for time-lapse CO2 plume imaging

35 © 2015 Electric Power Research Institute, Inc. All rights reserved.
Comparison of Baseline and Repeat Data Quality
• First arrivals and reflection data from the baseline survey have strong amplitudes and little noise, representing good quality data
• The first arrivals for the repeat survey are fairly “weak” probably due to signal attenuation caused by deploying the hydrophones inside the “stiff” production tubing and packer
• The reflection data that follow the first arrivals are noisy and of poor quality for the repeat survey
Side-by-side comparison of a baseline (left) and repeat (right) shot gather
There is a noticeable decrease in the signal-to-noise ratio (SNR) between the baseline and repeat surveys, which limits data interpretation
First Arrivals or “Picks” Poor quality reflection data

36 © 2015 Electric Power Research Institute, Inc. All rights reserved.
Comparison of Crosswell Reflectors Baseline Tomogram
Repeat Tomogram
Inje
ctio
n Zo
ne
Confining Zone
Strong, continuous reflectors
Weak and/or discontinuous reflectors
No reflector was detected at or near the top of the CO2 where one should be present
Reflection data from the repeat survey are of poor quality and limited use. Likely cause is interference by tube waves moving up and down the well

37 © 2015 Electric Power Research Institute, Inc. All rights reserved.
Inje
ctio
n Zo
ne
Confining Zone
Pixelized difference tomography results without seismic reflection overlay showing positive velocity differences in warm colors and negative differences in cool colors
• First arrivals from repeat survey were of sufficient quality to produce a velocity difference image (right) showing regions where seismic velocity has changed over time
• Time-lapse difference image indicates a decrease in seismic velocity in the upper injection zone of up to 3%, suggesting an increase in CO2 saturation
Time-Lapse Differencing Using the Baseline and Repeat Velocity Tomograms
More importantly, no negative velocity anomalies are observed in or above the confining unit…implying no detectable leakage out of inj. zone
No significant negative velocity anomalies
Decrease in velocity (negative anomaly)

38 © 2015 Electric Power Research Institute, Inc. All rights reserved.
Sand Nov 2012 Aug 2013 Oct 2013Unit Bottom Top Thickness Flow % Flow % Flow %
J 9,454 9,436 18 14.8 18.7 16.7I 9,474 9,460 14 8.2 20.4 19.6H 9,524 9,514 10 2.8 7.4 7.7G 9,546 9,534 12 2.7 2.1 0.9F 9,580 9,570 10 0.0 1.2 1.2E 9,622 9,604 18 26.8 23.5 30.8D 9,629 9,627 2 0.0 0.0 0.0C 9,718 9,698 20 16.5 11.8 10.3B 9,744 9,732 12 4.9 0.6 0.4A 9,800 9,772 28 23.3 14.3 12.4
Sand Unit Properties (ft)
A
B
C
D
E
F
G
H
I
J
Plume Image Comparison with Spinner Surveys
• Time-lapse image shows CO2 plume located primarily in Paluxy sands F-H
• October 2013 spinner survey show these sands taking only 10% of the flow

39 © 2015 Electric Power Research Institute, Inc. All rights reserved.
Plume Image Comparison with Simulation D 9-7 #2 D 9-8 #2
D 9-7 #2 D 9-8 #2

40 © 2015 Electric Power Research Institute, Inc. All rights reserved.
Deep MVA – Pressure Response
D9-8#2 In Zone
D4-14 In Zone
D4-13 Above Confinement
CO2 Rate
Downhole pressure data is a primary input to the history match and plume model

41 © 2015 Electric Power Research Institute, Inc. All rights reserved.
• Continue to use multiple lines of evidence to demonstrate CO2 containment and non-endangerment during PISC
• Continue shallow subsurface and surface monitoring activities
• Conduct full VSP and crosswell seismic repeats
• Additional water injection tests to monitor pressure transient times
• Engage regulators throughout project closure process
• Permit closure
Plan Next Steps

Southeast Regional Carbon Sequestration Partnership
QUESTIONS
Carbon Storage R&D Project Review Meeting Pittsburgh, PA
August 18, 2015