
SEBD Tutorial, June 2006 1 Monitoring Distributed Streams Joint works with Tsachi Scharfman, Daniel...
41
SEBD Tutorial, June 2006 1 Monitoring Monitoring Distributed Distributed Streams Streams Joint works with Joint works with Tsachi Scharfman, Daniel Keren Tsachi Scharfman, Daniel Keren
-
date post
20-Dec-2015 -
Category
Documents
-
view
216 -
download
0
Transcript of SEBD Tutorial, June 2006 1 Monitoring Distributed Streams Joint works with Tsachi Scharfman, Daniel...

SEBD Tutorial, June 2006 1
Monitoring Monitoring Distributed Distributed
StreamsStreams
Joint works withJoint works withTsachi Scharfman, Daniel KerenTsachi Scharfman, Daniel Keren

SEBD Tutorial, June 2006 2
SourcesSources
A Geometric Approach to Monitoring A Geometric Approach to Monitoring Distributed Data StreamsDistributed Data Streams, SIGMOD , SIGMOD 06 (Honorable Mention)06 (Honorable Mention)
Aggregate Threshold Queries in Aggregate Threshold Queries in Sensor NetworksSensor Networks, Submitted to , Submitted to SENSYS 06SENSYS 06
Monitoring Many Features in Monitoring Many Features in Distributed Data Streams. Distributed Data Streams. In In preparation for ICDM 06.preparation for ICDM 06.

SEBD Tutorial, June 2006 3
Problem DefinitionProblem Definition A set of distributed data streamsA set of distributed data streams
Mirrored web siteMirrored web site Distributed spam filtering systemDistributed spam filtering system A sensor networkA sensor network
A data vector is collected from each streamA data vector is collected from each stream Stream is infiniteStream is infinite Sliding/jumping windowsSliding/jumping windows
Given: A function over the Given: A function over the averageaverage of the data of the data vectorsvectors
Given: A predetermined thresholdGiven: A predetermined threshold Question: did the function value cross the Question: did the function value cross the
threshold?threshold?
SEBD Tutorial, June 2006 4
Example 1: Web Page Example 1: Web Page Frequency CountsFrequency Counts
Mirrored web siteMirrored web site Each mirror maintains the frequency Each mirror maintains the frequency
each page was accessed in last 5 each page was accessed in last 5 min.min.
We would like to constantly maintain We would like to constantly maintain a list of the most frequently a list of the most frequently accessed web pages (as defined by a accessed web pages (as defined by a threshold)threshold)

SEBD Tutorial, June 2006 5
Example 2:Example 2: Air Quality Air Quality MonitoringMonitoring
Sensors monitoring Sensors monitoring the concentration of the concentration of air pollutants.air pollutants.
Each sensor holds a data vector comprising of Each sensor holds a data vector comprising of the measured concentration of various the measured concentration of various pollutants (COpollutants (CO22, SO, SO22, O, O33, etc.)., etc.).
A function on the A function on the average average data vector data vector determines the Air Quality Index (AQI)determines the Air Quality Index (AQI)
Alert in case the AQI exceeds a given threshold.Alert in case the AQI exceeds a given threshold.
SEBD Tutorial, June 2006 6
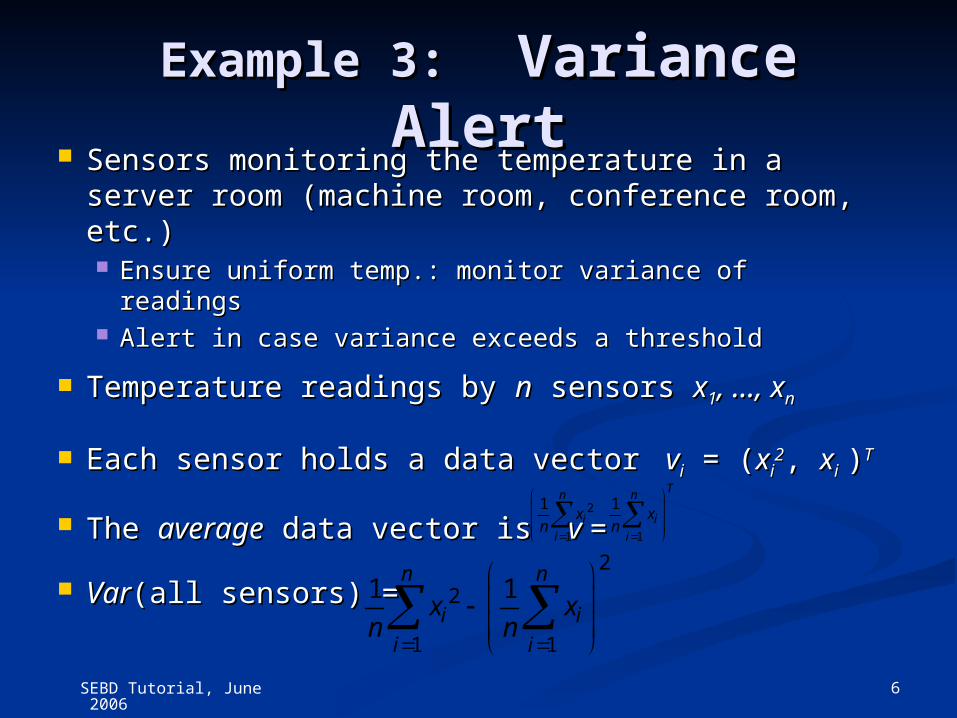
Example 3:Example 3: Variance Alert Variance Alert Sensors monitoring the temperature in a server Sensors monitoring the temperature in a server
room (machine room, conference room, etc.)room (machine room, conference room, etc.) Ensure uniform temp.: monitor variance of readingsEnsure uniform temp.: monitor variance of readings Alert in case variance exceeds a thresholdAlert in case variance exceeds a threshold
Temperature readings by Temperature readings by nn sensors sensors xx11, …, x, …, xnn
Each sensor holds a data vector Each sensor holds a data vector v vii = ( = (xxii22, , xxii ))TT
The The averageaverage data vector is data vector is v v ==
VarVar(all sensors) = (all sensors) =
2
1 1
1 1Tn n
i i
i i
x xn n
2
2
1 1
1 1n n
i i
i i
x xn n
SEBD Tutorial, June 2006 7
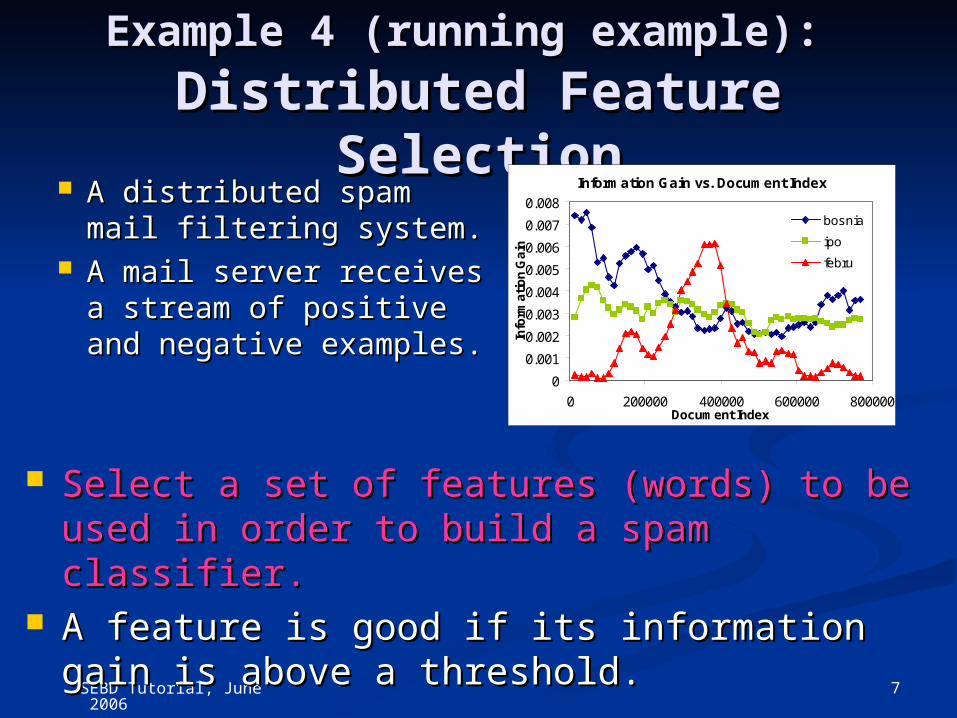
Example 4 (running example):Example 4 (running example): Distributed Feature Distributed Feature
SelectionSelection A distributed spam A distributed spam
mail filtering system.mail filtering system. A mail server receives A mail server receives
a stream of positive a stream of positive and negative and negative examples.examples.
Select a set of features (words) to be used in Select a set of features (words) to be used in order to build a spam classifier.order to build a spam classifier.
A feature is good if its information gain is A feature is good if its information gain is above a threshold.above a threshold.
Information Gain vs. Document Index
0
0.001
0.002
0.003
0.004
0.005
0.006
0.007
0.008
0 200000 400000 600000 800000Document Index
Info
rma
tio
n G
ain
bosnia
ipo
febru
SEBD Tutorial, June 2006 8
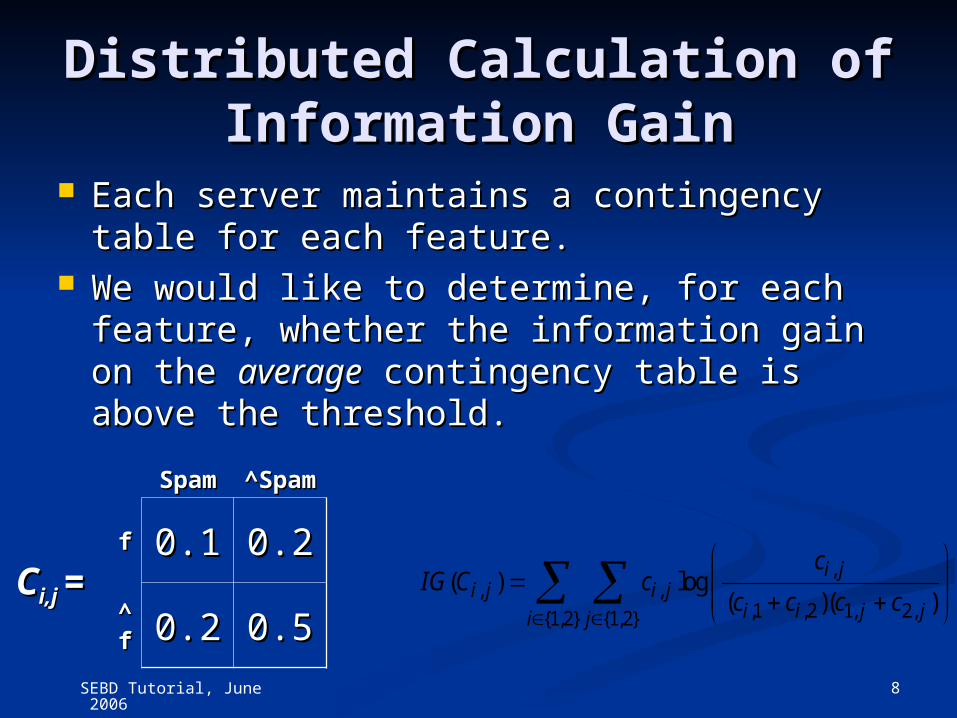
Distributed Calculation of Distributed Calculation of Information GainInformation Gain
Each server maintains a contingency table Each server maintains a contingency table for each feature.for each feature.
We would like to determine, for each We would like to determine, for each feature, whether the information gain on the feature, whether the information gain on the averageaverage contingency table is above the contingency table is above the threshold.threshold.
SpaSpamm
^Spa^Spamm
CCi,j i,j
==
ff 0.10.1 0.20.2
^̂ff 0.20.2 0.50.5
,, ,
,1 ,2 1, 2,{1,2} {1,2}
( ) log( )( )
i ji j i j
i i j ji j
cIG C c
c c c c
SEBD Tutorial, June 2006 9
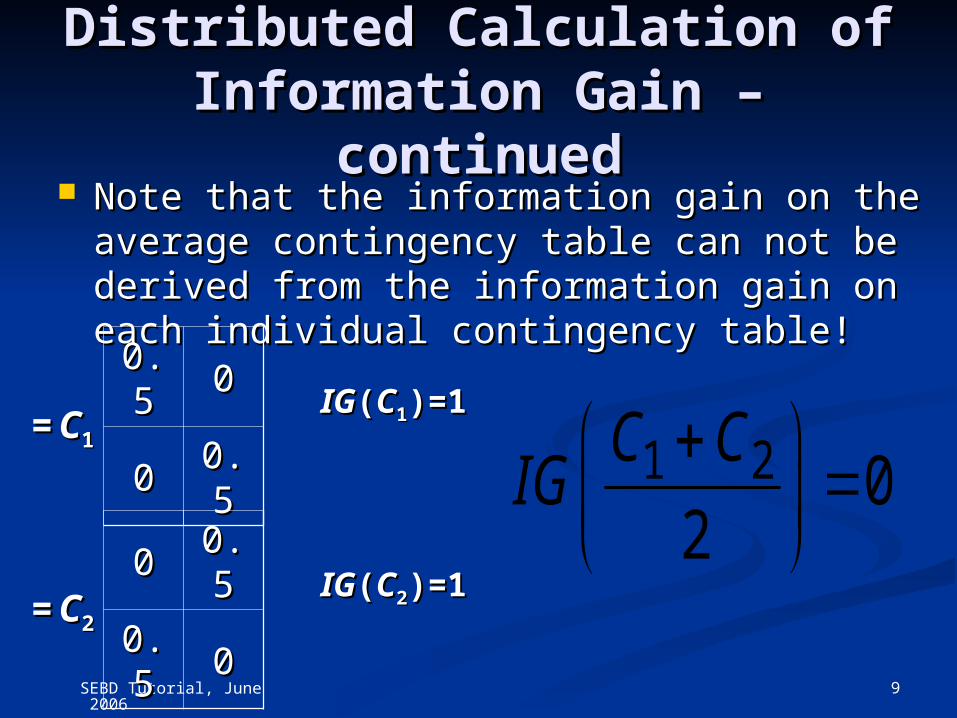
Distributed Calculation of Distributed Calculation of Information Gain – Information Gain –
continuedcontinued Note that the information gain on the Note that the information gain on the
average contingency table can not be average contingency table can not be derived from the information gain on each derived from the information gain on each individual contingency table!individual contingency table!
CC11
==
0.50.5 00
00 0.50.5
CC22
==
00 0.50.5
0.50.5 00
IGIG((CC11)=1)=1
IGIG((CC22)=1)=1
1 2 02
C CIG
SEBD Tutorial, June 2006 10
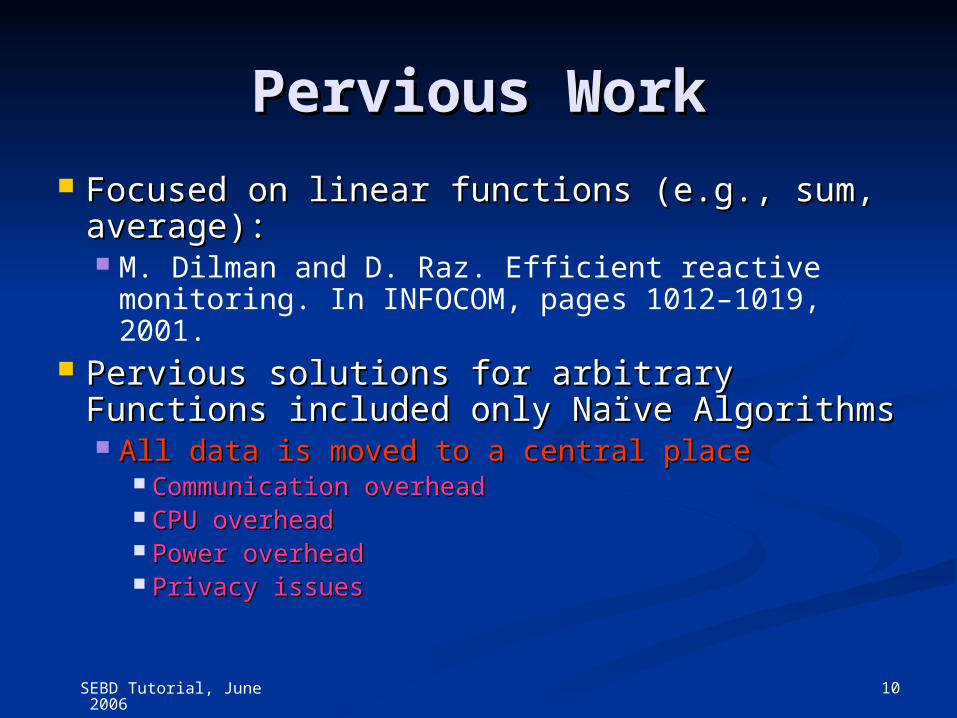
Pervious WorkPervious Work Focused on linear functions (e.g., sum, Focused on linear functions (e.g., sum,
average):average): M. Dilman and D. Raz. Efficient reactive
monitoring. In INFOCOM, pages 1012–1019, 2001.
Pervious solutions for arbitrary Functions Pervious solutions for arbitrary Functions included only Naïve Algorithms included only Naïve Algorithms All data is moved to a central placeAll data is moved to a central place
Communication overheadCommunication overhead CPU overheadCPU overhead Power overheadPower overhead Privacy issuesPrivacy issues

SEBD Tutorial, June 2006 11
Novel Geometric Novel Geometric ApproachApproach
Geometric Interpretation:Geometric Interpretation: Each node hold a statistics Each node hold a statistics
vectorvector Coloring the vector space Coloring the vector space
Grey:: function > thresholdGrey:: function > threshold White:: function <= thresholdWhite:: function <= threshold
Goal: determine color of global data vector Goal: determine color of global data vector (average).(average).

SEBD Tutorial, June 2006 12
Geometric Approach – Geometric Approach – Bounding the Convex HullBounding the Convex Hull
Observation: average is in the convex hull of drift Observation: average is in the convex hull of drift vectorsvectors
If convex hull monochromatic then average is same If convex hull monochromatic then average is same colorcolor
SEBD Tutorial, June 2006 13
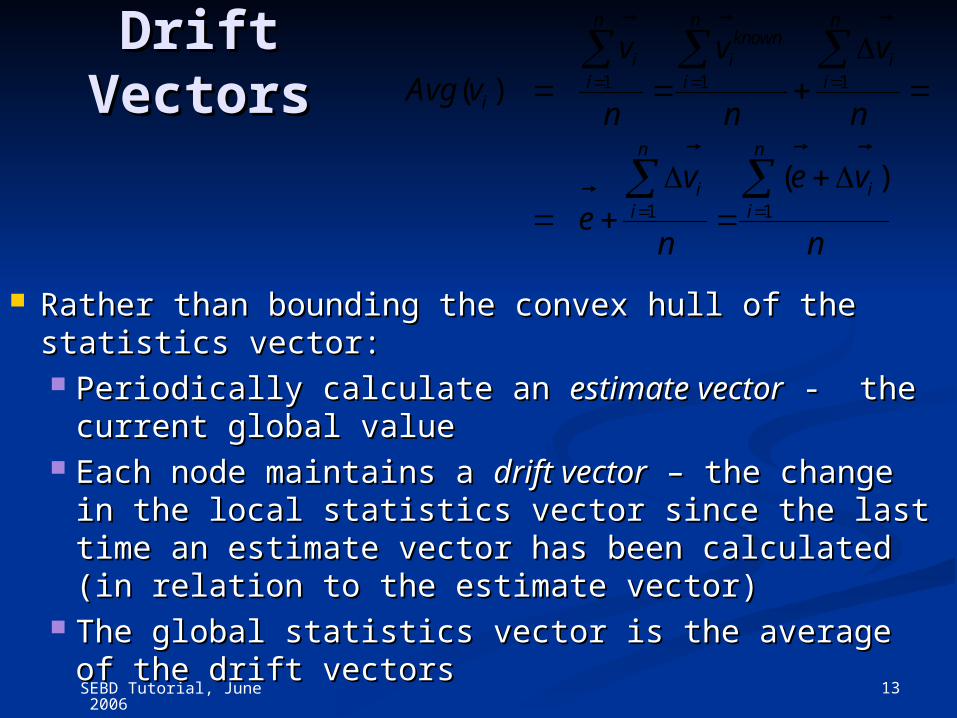
Drift Drift VectorsVectors
Rather than bounding the convex hull of the Rather than bounding the convex hull of the statistics vector:statistics vector: Periodically calculate an Periodically calculate an estimate vectorestimate vector - the - the
current global valuecurrent global value Each node maintains a Each node maintains a drift vectordrift vector – the change in – the change in
the local statistics vector since the last time an the local statistics vector since the last time an estimate vector has been calculated (in relation to estimate vector has been calculated (in relation to the estimate vector)the estimate vector)
The global statistics vector is the average of the The global statistics vector is the average of the drift vectorsdrift vectors
1 1 1
1 1
( )
( )
n n nknown
i i ii i i
i
n n
i ii i
v v vAvg v
n n n
v e ve
n n

SEBD Tutorial, June 2006 14
Distributively Bounding Distributively Bounding the the
Convex HullConvex Hull A reference point is known A reference point is known
to all nodesto all nodes Each node constructs a Each node constructs a
ballball Theorem: convex hull is Theorem: convex hull is
bound by the union of ballsbound by the union of balls

SEBD Tutorial, June 2006 15
Basic AlgorithmBasic Algorithm An initial estimate An initial estimate
vector is calculatedvector is calculated Nodes check color of Nodes check color of
drift spheredrift sphere Drift vector is the Drift vector is the
diameter of the drift balldiameter of the drift ball If any ball non If any ball non
monochromatic monochromatic synchronize nodessynchronize nodes

SEBD Tutorial, June 2006 16
Reuters Corpus (RCV1-Reuters Corpus (RCV1-v2)v2)
Information Gain vs. Document Index
0
0.001
0.002
0.003
0.004
0.005
0.006
0.007
0.008
0 200000 400000 600000 800000Document Index
Info
rma
tio
n G
ain
bosnia
ipo
febru
Broadcast Messages vs. Threshold
0
100
200
300
400
500
600
700
800
0 0.001 0.002 0.003 0.004 0.005 0.006Threshold
Bro
ad
ca
st
Me
ss
ag
es
(x
10
00
)
bosnia
ipo
febru
Naive Alg.
800,000+ news stories 800,000+ news stories Aug 20 1996 -- Aug 19 1997Aug 20 1996 -- Aug 19 1997 Corporate/Industrial tagging simulates spamCorporate/Industrial tagging simulates spam
n=10
SEBD Tutorial, June 2006 17
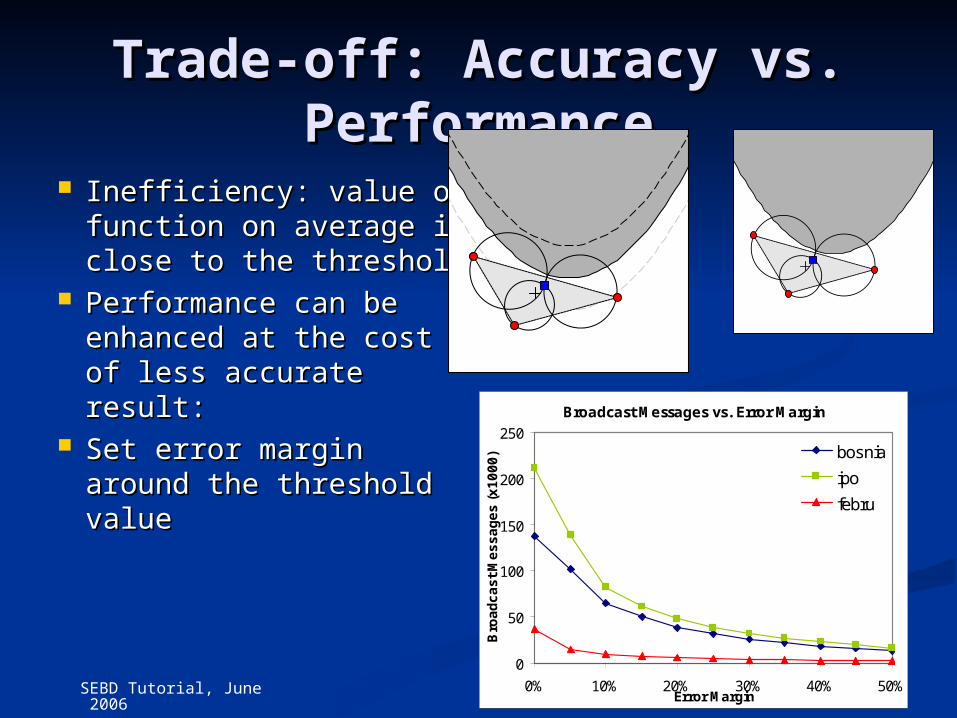
Trade-off: Accuracy vs. Trade-off: Accuracy vs. PerformancePerformance
Inefficiency: value of Inefficiency: value of function on average is function on average is close to the thresholdclose to the threshold
Performance can be Performance can be enhanced at the cost enhanced at the cost of less accurate of less accurate result: result:
Set error margin Set error margin around the threshold around the threshold valuevalue
Broadcast Messages vs. Error Margin
0
50
100
150
200
250
0% 10% 20% 30% 40% 50%Error Margin
Bro
ad
ca
st
Me
ss
ag
es
(x
10
00
) bosnia
ipo
febru

SEBD Tutorial, June 2006 18
ScalabilityScalability
Broadcast Messages vs. Number of Nodes (0.003)
0
100
200
300
400
500
600
700
800
0 25 50 75 100Number of Nodes
Bro
ad
ca
st
Me
ss
ag
es
(x
10
00
) bonsia
ipo
febru
naive
Broadcast Messages vs. Number of (0.006)
0
100
200
300
400
500
600
700
800
0 25 50 75 100Number of Nodes
Bro
adca
st M
essa
ges
(x1
000)
bonsia
ipo
febru
naive
# messages per node is constant.
SEBD Tutorial, June 2006 19
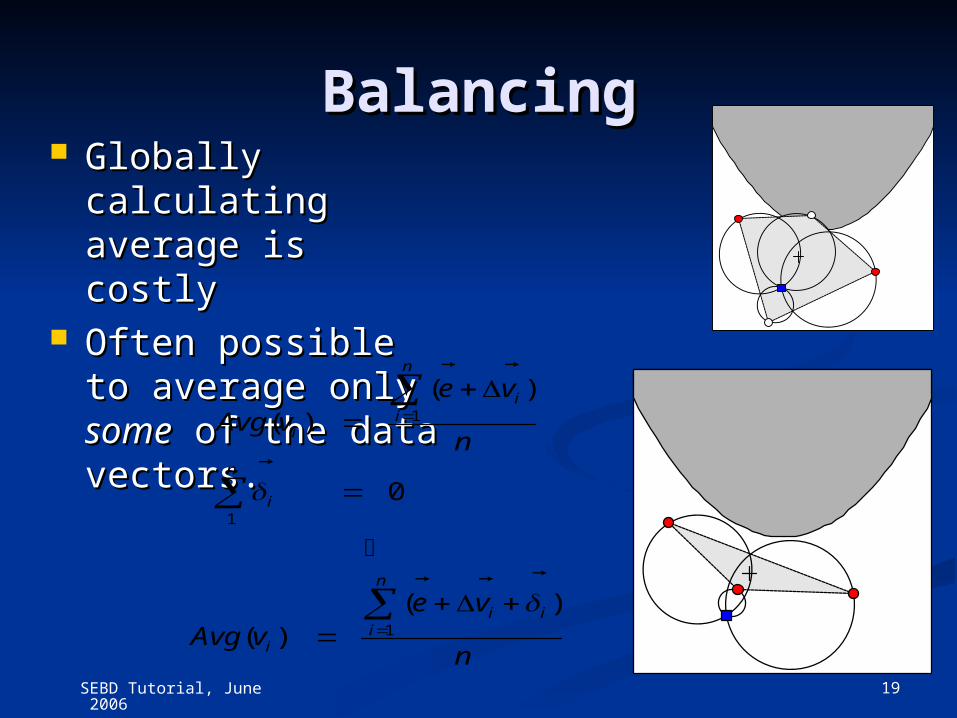
BalancingBalancing Globally calculating Globally calculating
average is costly average is costly Often possible to Often possible to
average only average only somesome of the data vectors.of the data vectors.
1
1
1
( )( )
0
( )( )
n
ii
i
n
i
n
i ii
i
e vAvg v
n
e vAvg v
n
SEBD Tutorial, June 2006 20
Computational Complexity Computational Complexity of Calculating Distance of Calculating Distance
from Zero Surface from Zero Surface Closed form solutions (Variance Closed form solutions (Variance
alert)alert) Numerical MethodsNumerical Methods Offline Computations and CachingOffline Computations and Caching

SEBD Tutorial, June 2006 21
Performance AnalysisPerformance Analysis
-10
-5
0
5
10
-10 -5 0 5 10
-10
-5
0
5
10
-10 -5 0 5 10

SEBD Tutorial, June 2006 22
Performance Analysis Performance Analysis (continued)(continued)
-10
-5
5
10
-10 -5 5 10
Exp. Global Stats.
[ ]E v
Distance Sphere
-10
-5
5
10
-10 -5 5 10
global
DDistance Sphere
Local Stats. Vector iv
Exp. Global Stats. Vector
[ ]E v
( [ ( )], ( ))iB E v t v t

SEBD Tutorial, June 2006 24
Upper Bounds on Upper Bounds on Probability of Constraint Probability of Constraint
ViolationViolation
12
[ ]Pr
( )
d
ii
violationglobal
V X
N D
2
2 1
[ ]Pr exp 2 /
d
ii
violation global
V XD d
N

SEBD Tutorial, June 2006 25
Tiered Sensor NetworksTiered Sensor Networks
Network comprised Network comprised of two types of of two types of sensors, Macro-sensors, Macro-Nodes and MotesNodes and Motes
Motes:Motes: Simple, Simple,
inexpensive inexpensive sensing unitssensing units
Based on 8-bit Based on 8-bit processorsprocessors
Macro Nodes:Macro Nodes: Less resource constrainedLess resource constrained Based on 32-bit processors. Support more Based on 32-bit processors. Support more
advanced OS and development toolsadvanced OS and development tools
SEBD Tutorial, June 2006 26
Monitoring Sensor Monitoring Sensor Networks (1)Networks (1)
A spanning tree is constructed over the A spanning tree is constructed over the connectivity graphconnectivity graph
Initial measurement vector aggregated over the Initial measurement vector aggregated over the tree, and flooded to all Motestree, and flooded to all Motes
Motes use aggregated vector as estimate vectorMotes use aggregated vector as estimate vector An attempt is made to balance constraint An attempt is made to balance constraint
violations within the cluster (intra cluster violations within the cluster (intra cluster balancing):balancing): Cluster Head iteratively selects motes and requests their drift Cluster Head iteratively selects motes and requests their drift
vectorsvectors Balancing succeeds if the average of the drift vectors collected Balancing succeeds if the average of the drift vectors collected
from motes creates a monochromatic ball with the estimate from motes creates a monochromatic ball with the estimate vectorvector
SEBD Tutorial, June 2006 27
Monitoring Sensor Monitoring Sensor Networks (2)Networks (2)
In case intra cluster balancing failed, an In case intra cluster balancing failed, an attempt is made to balance the constraint attempt is made to balance the constraint violation by passing a token among the Cluster violation by passing a token among the Cluster Heads (extra cluster balancing)Heads (extra cluster balancing):: The token consists of the average of the drift The token consists of the average of the drift
vectors held by the motes in the clusters the token vectors held by the motes in the clusters the token has visitedhas visited
Upon receipt of token, the Cluster Head collects Upon receipt of token, the Cluster Head collects drift vectors from motes, and adds them to the drift vectors from motes, and adds them to the tokentoken
In case extra cluster balancing has failed, the In case extra cluster balancing has failed, the vector held by the token is flooded to the vector held by the token is flooded to the motes, which use it as the new estimate vectormotes, which use it as the new estimate vector

SEBD Tutorial, June 2006 28
Monitoring Sensor Monitoring Sensor Networks (3)Networks (3)
Token traversal implemented as a Token traversal implemented as a DFS searchDFS search
Several tokens may simultaneously Several tokens may simultaneously traverse the network, in which case traverse the network, in which case they may be required to mergethey may be required to merge

SEBD Tutorial, June 2006 29
Data SetData Set
A 144x36 data points of A 144x36 data points of temperature readings in temperature readings in the northern hemispherethe northern hemisphere
Readings are taken Readings are taken every 6h for a period of a every 6h for a period of a yearyear
Strong Spatial and Temporal Strong Spatial and Temporal correlation among data readingscorrelation among data readings
Average temperature ranges from -Average temperature ranges from -3.15 to 15 degrees Centigrade3.15 to 15 degrees Centigrade
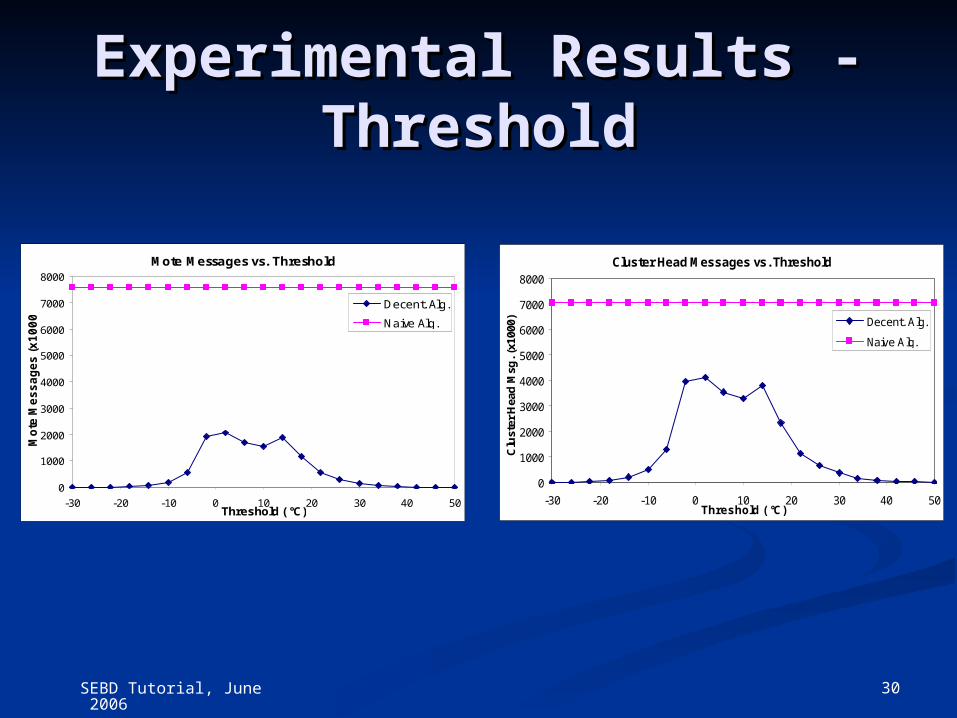
SEBD Tutorial, June 2006 30
Experimental Results - Experimental Results - ThresholdThreshold
Mote Messages vs. Threshold
0
1000
2000
3000
4000
5000
6000
7000
8000
-30 -20 -10 0 10 20 30 40 50Threshold ( °C)
Mo
te M
es
sa
ge
s (
x1
00
0)
Decent. Alg.
Naive Alg.
Cluster Head Messages vs. Threshold
0
1000
2000
3000
4000
5000
6000
7000
8000
-30 -20 -10 0 10 20 30 40 50Threshold ( °C)
Clu
ster
Hea
d M
sg. (
x100
0) Decent. Alg.
Naive Alg.
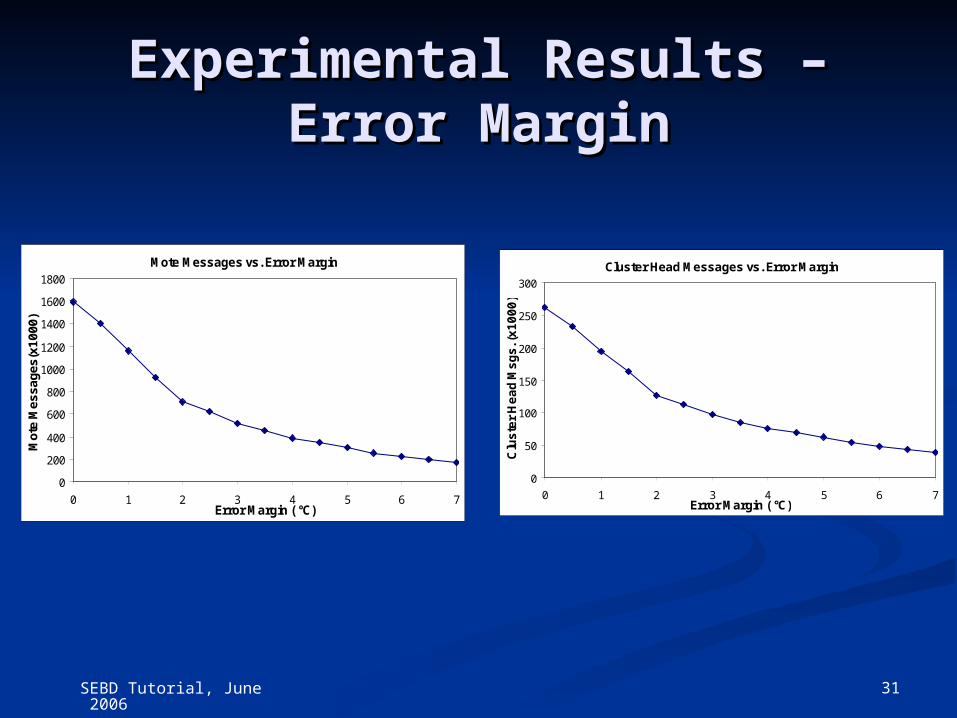
SEBD Tutorial, June 2006 31
Cluster Head Messages vs. Error Margin
0
50
100
150
200
250
300
0 1 2 3 4 5 6 7Error Margin ( °C)
Clu
ste
r H
ea
d M
sg
s. (
x1
00
0)
Experimental Results – Experimental Results – Error MarginError Margin
Mote Messages vs. Error Margin
0
200
400
600
800
1000
1200
1400
1600
1800
0 1 2 3 4 5 6 7Error Margin ( °C)
Mot
e M
es
sag
es(x
10
00)
SEBD Tutorial, June 2006 32
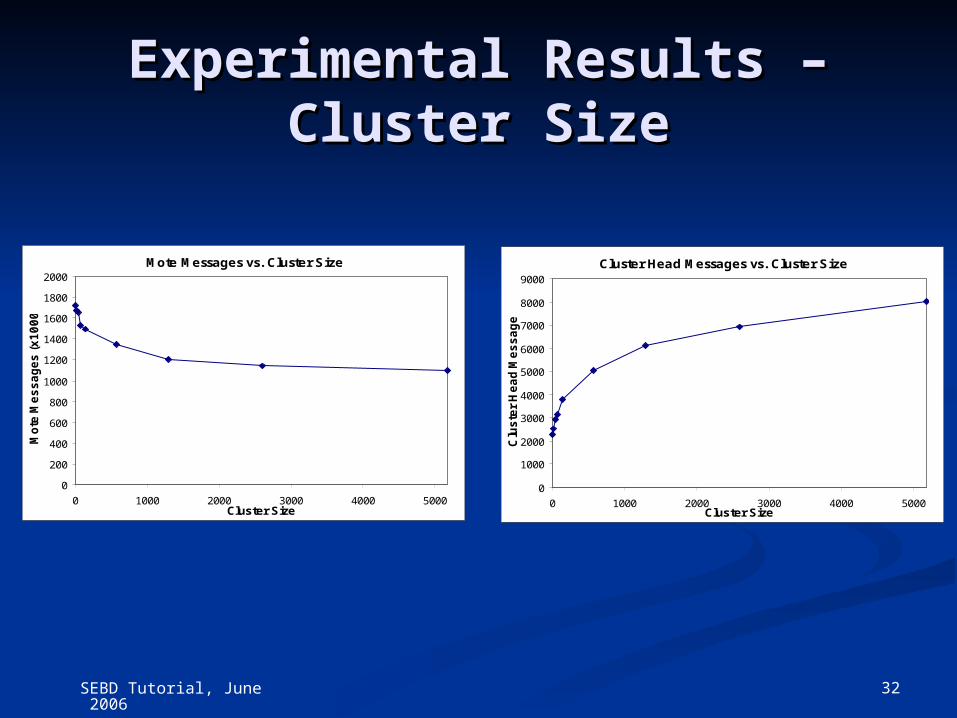
Cluster Head Messages vs. Cluster Size
0
1000
2000
3000
4000
5000
6000
7000
8000
9000
0 1000 2000 3000 4000 5000Cluster Size
Clu
ste
r H
ea
d M
es
sa
ge
s
Experimental Results – Experimental Results – Cluster SizeCluster Size
Mote Messages vs. Cluster Size
0
200
400
600
800
1000
1200
1400
1600
1800
2000
0 1000 2000 3000 4000 5000Cluster Size
Mo
te M
es
sa
ge
s (
x1
00
0)

SEBD Tutorial, June 2006 33
Window SizeWindow Size
Broadcast Messages vs. Window Size
0
50
100
150
200
250
6700 8040 9380 10720 12060 13400Window size
Bro
ad
ca
st
Me
ss
ag
es
(x
10
00
) bosnia
ipo
febru

SEBD Tutorial, June 2006 34
Simultaneous FeaturesSimultaneous Features
Broadcast Messages vs. Simultaneous Features
0
50
100
150
200
250
300
0 1000 2000 3000 4000 5000Num. of Monitored Features
Bro
ad
ca
st
Me
ss
ag
es
(x
10
00
)
Decnt. Alg.
Naive Alg.
SEBD Tutorial, June 2006 35
Future WorkFuture Work
Efficiently Efficiently monitoring multiple monitoring multiple objectsobjects Exploiting Exploiting
Correlations among Correlations among objectsobjects
Monitoring Top-k Monitoring Top-k objectsobjects
Improving spherical Improving spherical bounds bounds
Large scale networksLarge scale networks
SEBD Tutorial, June 2006 36
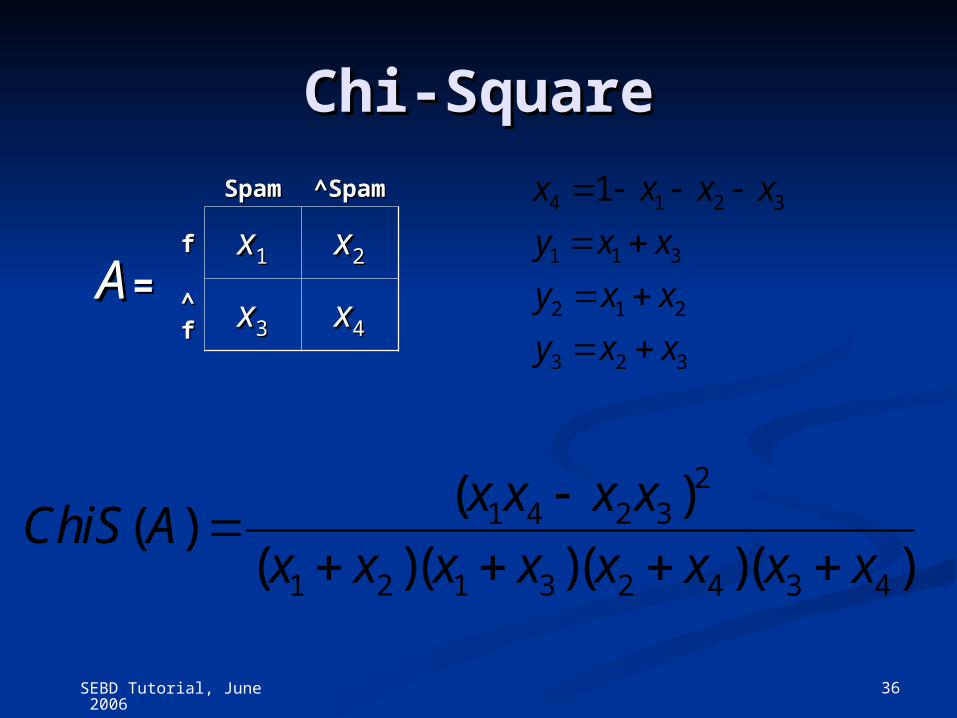
Chi-SquareChi-Square
21 4 2 3
1 2 1 3 2 4 3 4
( )( )
( )( )( )( )
x x x xChiS A
x x x x x x x x
SpamSpam^Spa^Spa
mm
AA ==ff xx11 xx22
^̂ff xx33 xx44
4 1 2 3
1 1 3
2 1 2
3 2 3
1x x x x
y x x
y x x
y x x

SEBD Tutorial, June 2006 37
Questions?Questions?

SEBD Tutorial, June 2006 38
Bounding Theorem – Bounding Theorem – Proof (1)Proof (1)

SEBD Tutorial, June 2006 39
Bounding Theorem – Bounding Theorem – Proof (2)Proof (2)

SEBD Tutorial, June 2006 40
Bounding Theorem – Bounding Theorem – Proof (3)Proof (3)A
B
C

SEBD Tutorial, June 2006 41
Bounding Theorem – Bounding Theorem – Proof (4)Proof (4)
A
BC

SEBD Tutorial, June 2006 42
Bounding Theorem – Bounding Theorem – Proof (5)Proof (5)
A
BC


![SEBD ‘16 · SEBD ‘16. Conference Program ... [12:00-12:15] - Claudia Diamantini, Domenico Potena and Emanuele Storti - ... • Mauro Draoli, AGID](https://static.fdocuments.net/doc/165x107/5b5dc43a7f8b9ad2198f1272/sebd-16-sebd-16-conference-program-1200-1215-claudia-diamantini.jpg)


