SEB Retail Banking 2009
17
Mats Torstendahl Head of Retail Banking January – June 2009 Retail Banking presentation
-
Upload
sebgroup -
Category
Devices & Hardware
-
view
7.752 -
download
2
description
Retail Banking Presentation. January - June 2009.
Transcript of SEB Retail Banking 2009
Mats TorstendahlHead
of Retail
Banking
January –
June 2009
Retail Banking presentation

OrganisationPresident &
CEO
Annika Falkengren
Group Credits & Group Risk Control
Johan Andersson
Compliance
Gent Jansson
Wealth ManagementFredrik Boheman
Life
Anders Mossberg
CFO
Jan Erik Back
Group IT
Ulf Thorstensson
Group Operations
Pia Warnerman
Group Staff
Bo Magnusson
Merchant Banking
Magnus Carlsson
Retail Banking
Mats Torstendahl
Group Strategy & Business Dev.Hans Larsson
HR & Org. Dev.
Ingrid Engström
Business Support &
Group Staff
Bo Magnusson,Deputy CEO
* Reports directly to the Board
Internal Audit
Agneta Brevenhag*
Baltic
Martin Johansson

SEB's
retail
operations H1: 2009
945 FTE's
59 branches
#2 position, ~25% market share
883 FTE's
60 branches
#2 position, ~15% market share
1 411 FTE's
75 branches
# 1 position, ~30% market share
1 716 FTE's
174 branches
~1% market share
2 642 FTE's
161 branches
#4 position, 10-15% market share
812 FTE's
3.2m cards
#1 inom charge card

Retail Sweden -
Strong performance
Retail Sweden in short
Attractive customer base–
sustained growth in SME and affluent segment
Proven earnings capacity–
4% income growth H1-09 vs. H1-08–
Mortgage volumes +6% since year start
Competitive profitability–
19% RoE in first half of 2009
Innovative product offerings–
Enkla
firman, SME product of the year
Healthy credit quality–
Credit losses in H1 manageable: SEK 185m

Retail Sweden, H1 2009HighlightsSEK m
Jan –
Jun 2009
2008
Total income
3,231
4%Interest, net
2,344
6%Commission, net 727
-4%Total expenses -2,034
4%
Profit bef. credit losses
1,197
3%Credit losses, net
-185
462%Operating profit 1,012
-10%
RoE, %
19.0
22.0C/I 0.63
0.63
Total lending
322,500
6%Total deposits
155,000
4%
Both the SME and mass affluent segment has continued to develop well during 2009–
2,800 net new SME customers–
1,400 net new mass affluent customers
Importance of lending is growing–
Increasing margins and sustained growth in lending volumes, not least in mortgages
–
Sharply falling margins and limited growth in deposit volumes
Although higher than previous year, credit loss-level is still reflecting good credit quality

Financial performance over time Retail Banking Sweden
-2000
200400600800
Q1-07 Q2-07 Q3-07 Q4-07 Q1-08 Q2-08 Q3-08 Q4-08 Q1-09 Q2-09
Credit losses Profit (after Credit losses)
0
500
1 000
1 500
2 000
Q1 07 Q2 07 Q3 Q4 Q1 08 Q2 08 Q3 Q4 Q1 09 Q2 09
Income Expenses SEK m

Changes in income generation NII Q3 ’08 –
Q2 ’09, Retail Banking, Sweden
Deposits
Other lending
Mortgages
Q3 2008 Q4 2008 Q1 2009 Q2 2009
35%
33%
33%
28%
30%
42%
24%
28%
48%
21%
25%
54%

Mortgages private market Total Sweden, volumes and margins
0
50
100
150
200
250
Q12006
Q2 Q3 Q4 Q12007
Q2 Q3 Q4 Q12008
Q2 Q3 Q4 Q12009
Q20,00%
0,25%
0,50%
0,75%
1,00%
1,25%Outstanding volume, SEK bn Average margin

Mortgages private market Retail Sweden, market share, per cent
* New measurement method from Q4 2007. Lowers the volume market share with approximately 0.2 percentage points
*10
12
14
16
18
20
Q106
Q2 Q3 Q4 Q107
Q2 Q3 Q4 Q108
Q2 Q3 Q4 Q109
Q2
Sales Volume

YTD2007
YTD2008
YTD2009
Q1 2009 Q2 2009
Equities
-17%
Q1 2009 Q2 2009
Q1 2009 Q2 2009
+21%
+26%
+20%
Total commissions, netEquity linked bonds
Mutual funds
Commissions re-bounce Light in the tunnel….?

1 950
176
1 000
1 200
1 400
1 600
1 800
2 000
2 200
Total expenses H1-08 Total expenses H1-09
Cost base Increased pension cost
Number of FTEs:
2 865
2 642
Change in expense level –
driven by pensions
Swedish Retail, H12009 vs. H12008, SEK m

Credit losses Retail Sweden Q1 ’07 –
Q2 ’09, SEK m
-20
0
20
40
60
80
100
120
Q1'07
Q2'07
Q3'07
Q4'07
Q1'08
Q2'08
Q3'08
Q4'08
Q1'09
Q2'09
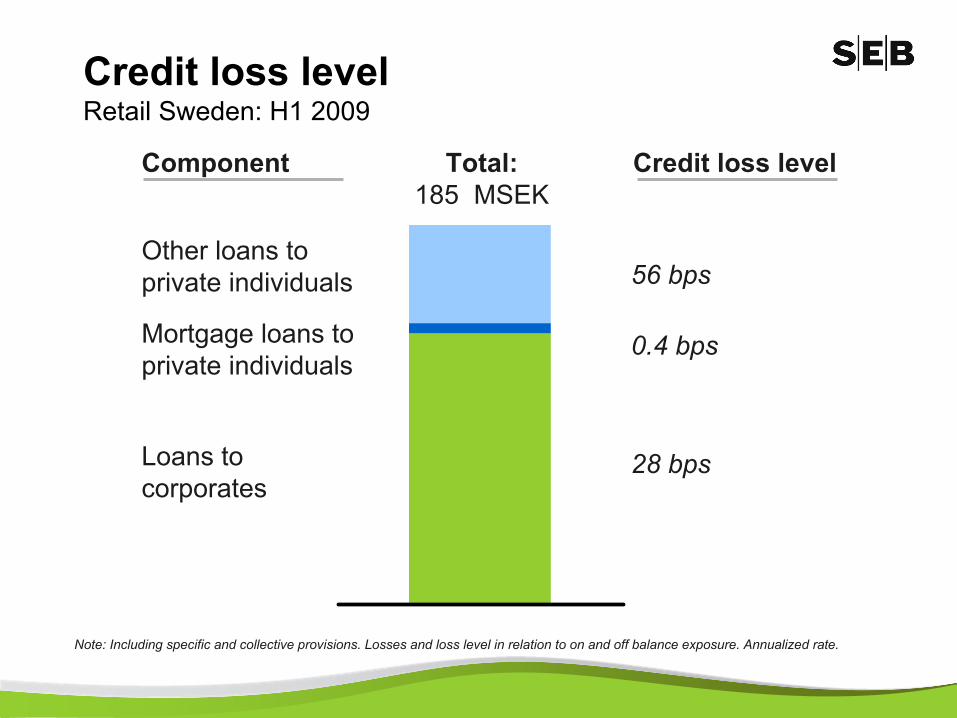
Total:185 MSEK
Other loans to private individuals
Mortgage loans to private individuals
Loans to corporates
Component
Note: Including specific and collective provisions. Losses and loss level in relation to on and off balance exposure. Annualized rate.
28 bps
0.4 bps
56 bps
Credit loss level
Credit loss level Retail Sweden: H1 2009

Stabilising economy but long and winding road to recovery
SEB well positioned to support our customers and develop the business in core areas
Swedish Retail is one of these core areas
Improve customer experience & satisfaction
Grow SME –
not only the micro segment
Strengthen remote channels (e.g. OITR)
Leadership & employee development


Appendix

Business volume development Retail Sweden, SEK bn
Mortgages
0
50
100
150
200
250
Q206
Q4 Q207
Q4 Q208
Q4 Q209
CorporatePrivate
Other lending*
0
50
100
150
200
250
Q206
Q4 Q207
Q4 Q208
Q4 Q209
Deposits
0
50
100
150
200
250
Q206
Q4 Q207
Q4 Q208
Q4 Q209
*
Excluding leasing