Seattle Center Monorail Ridership Survey & Financial...
13
Seattle Center Monorail Ridership Survey & Financial Analysis Ridership & Revenue Report Technical Memorandum June 2017—using values from v1.3 of the model Prepared for: Prepared by:
Transcript of Seattle Center Monorail Ridership Survey & Financial...
Seattle Center Monorail Ridership Survey & Financial Analysis
Ridership & Revenue Report Technical Memorandum
June 2017—using values from v1.3 of the model
Prepared for:
Prepared by:

1
EXECUTIVE SUMMARY
The Ridership & Revenue Report is the culmination of a 12-month process of evaluating existing monorail
ridership patterns and fare categories, an assessment of rider characteristics on the Seattle Center
Monorail and on relevant bus routes, and a review of ORCA fare system attributes. The forecasts
presented in this report build upon a public survey and travel demand modeling documented in two
technical memoranda published as part of this project: Survey Methodology & Results and Modeling
Methodology & Results.
Seattle Center Monorail
The Seattle Center Monorail connects Westlake Center in downtown Seattle to The Armory at Seattle
Center with fast, frequent transit service. Service operates for 12.5-15.5 hours per day, typically with 10
minute headways; during peak hours in the summer and for events and with two train operation, the 250-
passenger trains can operate every five minutes. Approximately 2 million one-way riders use the monorail
annually. Monorail ridership has a much greater degree of variation based on day of the week and season
of the year than other transit services in the region.
ORCA Acceptance
Several transit agencies across the region accept the ORCA card. The ORCA card allows riders to pay for
their fares using stored value or pass products, while also receiving inclusive transfers across most
services. Additionally, reduced fares are provided for children, seniors, and low-income riders. The
monorail does not accept the ORCA card and currently offers different discounted fare categories than
those used by the ORCA system.
Allowing the use of ORCA on the Monorail would have effects on both ridership and revenue, principally:
• Increased ridership & revenue—associated with shifts from existing bus routes due to reduced
cost and increased convenience to riders
• Decreased revenue—associated with:
o Changes to existing monorail fare categories, which would need to be realigned to
match those used by other transit agencies. The updated categories would include a
larger range of ages in both the children and youth fare categories.
o Shifts from cash to ORCA for existing riders. Revenue per boarding would be lower due
to acceptance of transfers and passes.
o Costs related to being an ORCA affiliate, including ORCA participation fee and
contribution toward regionally-shared costs. Note that this report does not include
other potential one-time or annual fees.
o Fare revenue received from riders who pay with the ORCA Business Passport product is
phased in during the initial 16 months of ORCA acceptance.
2
Survey Results
Surveys of existing monorail riders were conducted from April through July 2016, capturing a total of 11
days that reflected typical ridership patterns. 3,032 surveys were collected, reflecting 7,635 riders. The
majority of existing riders do not have an ORCA card with only 24% of spring season riders and 12% of
summer season riders having one. Also, the majority of surveyed riders with ORCA cards would have a
transfer during their trip (67% in spring, 87% in summer), either transferring to a bus or train downtown
or returning to Seattle Center on the monorail.
Ridership Estimates
The increases in ridership were estimated using a ridership forecasting model. These ridership estimates
were adjusted based on existing ORCA usage near Seattle Center, including the percent of bus boardings
paying with ORCA and the fare categories of those boardings. An estimated 155,800 to 346,500 additional
monorail boardings are be expected on a typical year due to acceptance of ORCA cards, reflecting a 7 to
16 percent increase over existing ridership.
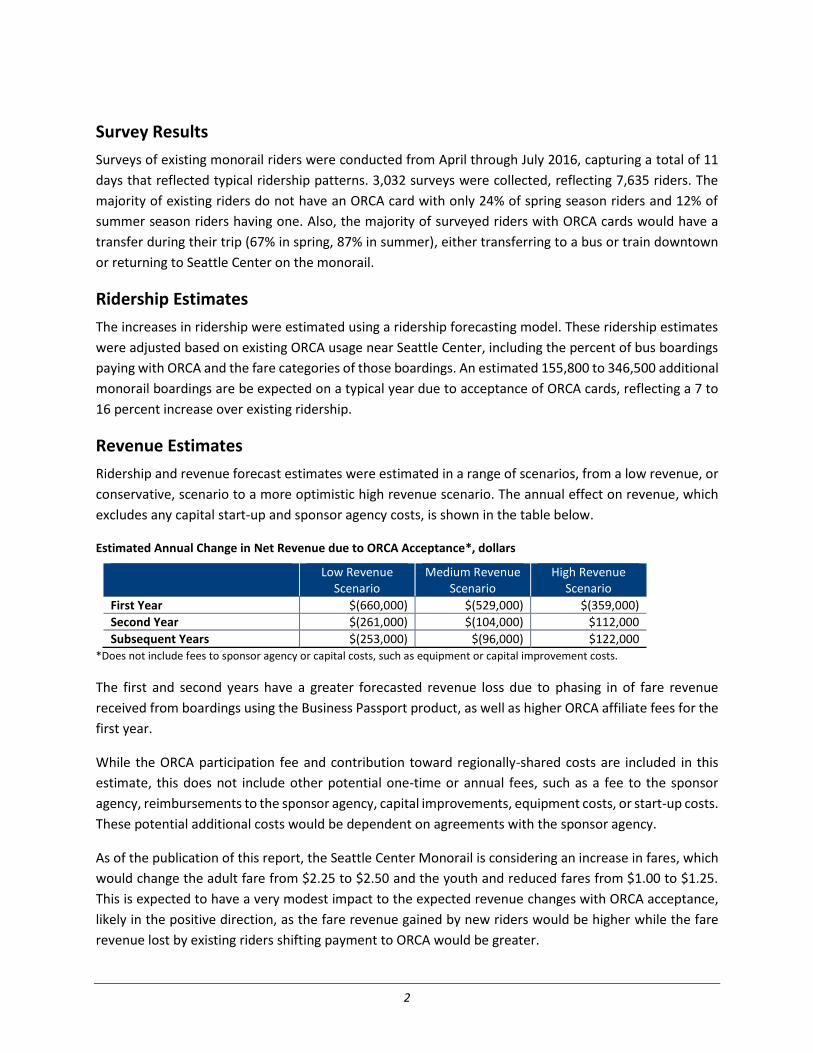
Revenue Estimates
Ridership and revenue forecast estimates were estimated in a range of scenarios, from a low revenue, or
conservative, scenario to a more optimistic high revenue scenario. The annual effect on revenue, which
excludes any capital start-up and sponsor agency costs, is shown in the table below.
Estimated Annual Change in Net Revenue due to ORCA Acceptance*, dollars
Low Revenue Scenario
Medium Revenue Scenario
High Revenue Scenario
First Year $(660,000) $(529,000) $(359,000)
Second Year $(261,000) $(104,000) $112,000
Subsequent Years $(253,000) $(96,000) $122,000 *Does not include fees to sponsor agency or capital costs, such as equipment or capital improvement costs.
The first and second years have a greater forecasted revenue loss due to phasing in of fare revenue
received from boardings using the Business Passport product, as well as higher ORCA affiliate fees for the
first year.
While the ORCA participation fee and contribution toward regionally-shared costs are included in this
estimate, this does not include other potential one-time or annual fees, such as a fee to the sponsor
agency, reimbursements to the sponsor agency, capital improvements, equipment costs, or start-up costs.
These potential additional costs would be dependent on agreements with the sponsor agency.
As of the publication of this report, the Seattle Center Monorail is considering an increase in fares, which
would change the adult fare from $2.25 to $2.50 and the youth and reduced fares from $1.00 to $1.25.
This is expected to have a very modest impact to the expected revenue changes with ORCA acceptance,
likely in the positive direction, as the fare revenue gained by new riders would be higher while the fare
revenue lost by existing riders shifting payment to ORCA would be greater.
3
1 INTRODUCTION
In estimating the effect on monorail ridership and fare revenue with acceptance of ORCA cards, it is
necessary to combine the results from the ridership modeling and the survey of existing monorail riders.
Findings from the ridership modeling and surveys have been presented in the Modeling Methodology &
Results Technical Memo and the Survey Methodology & Results Technical Memo.
This memo and its associated spreadsheet model combine the data from those two other analyses. The
ridership increases and changes are presented in Section 2 with changes in fare revenue presented in
Section 3. The resulting annual revenue change is summarized in Section 4.
As with any model, the spreadsheet model that was used to develop the ridership and revenue estimates
in this memo is dependent on its input data. The spreadsheet model used to develop the values was
included as a deliverable for this project and can be used in the future for further testing and investigation
of how different inputs and assumptions could change the ridership and revenue results.
1.1 Revenue Scenarios
Permitting the use of ORCA cards would result in some additional new riders due to the convenience of
the ORCA payment system and some decreases in revenue resulting from the acceptance of ORCA
transfers and passes along with changes in fare categories. The results of the analysis are presented
throughout this report for the following three revenue scenarios:
• Low Revenue Scenario – This scenario uses a set of assumptions that result in the highest shift
from existing cash fares to ORCA and the lowest number of new monorail riders.
• High Revenue Scenario – This scenario uses a set of assumptions that result in the lowest shift
from existing cash fares to ORCA and the highest number of new monorail riders induced by the
convenience and fare savings of the ORCA payment system.
• Medium Revenue Scenario – This scenario represents the mid-point for riders shifting from
existing cash fares to ORCA and a moderate estimate of the number of new riders based on the
ridership forecasting model. This scenario represents a moderate forecast but it is not the exact
mid-point in ridership or revenue between low and high scenarios.
2 RIDERSHIP CHANGES
Acceptance of ORCA cards would lead to some changes in ridership levels and changes to the types of
payment methods used to purchase trips.
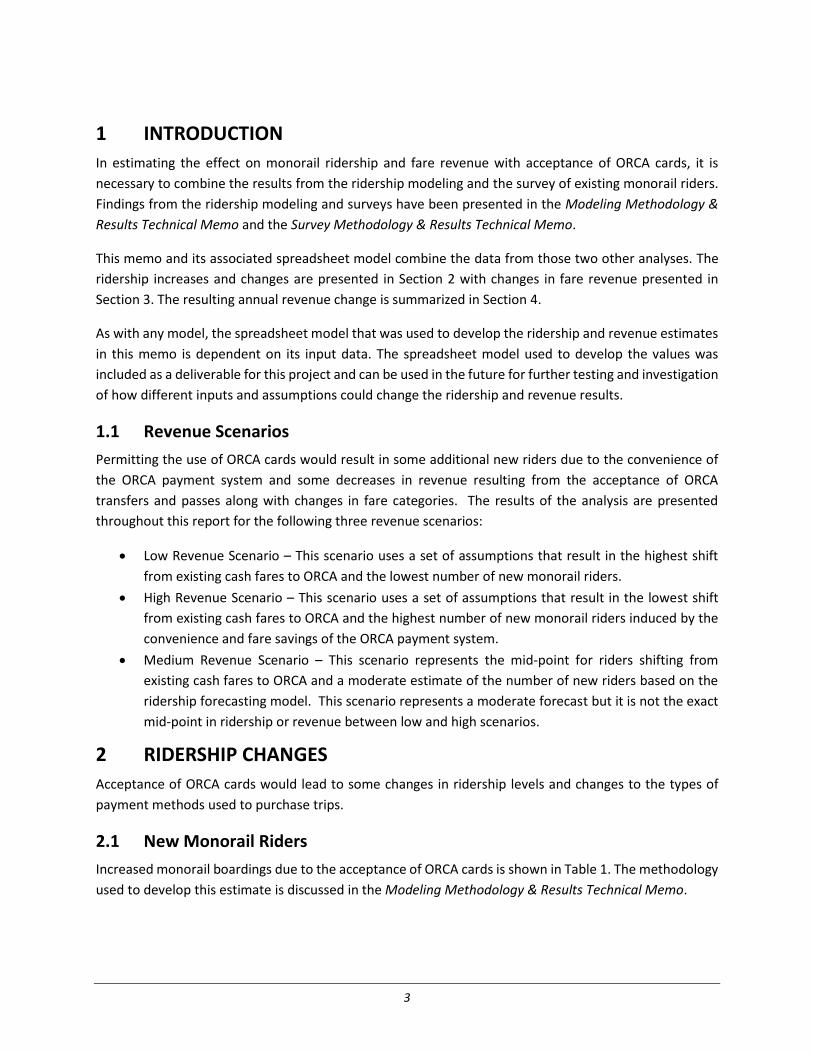
2.1 New Monorail Riders
Increased monorail boardings due to the acceptance of ORCA cards is shown in Table 1. The methodology
used to develop this estimate is discussed in the Modeling Methodology & Results Technical Memo.
4
Table 1: Estimated Annual New Monorail Boardings, persons
Fare Category Low Revenue
Scenario Medium Revenue
Scenario High Revenue
Scenario
Children (0-5) - - -
Youth (6-18) 5,000 7,000 10,000
Adult (18-64) 132,000 195,000 293,000
Senior (65+) 7,000 9,000 15,000
Disabled 11,000 17,000 26,000
ORCA LIFT 1,000 1,000 2,000
Total 156,000 229,000 346,000
The increase in ridership is due to several factors, principally reduced cost to riders through the
acceptance of ORCA passes and transfers. These new monorail riders, who had used buses or other modes
between downtown and Seattle Center, are the primary source of increased revenue associated with the
acceptance of ORCA cards. Approximately 9 to 13 percent of the new monorail boardings would be
expected to be from trips that previously occurred by car, taxi, and walking with the remainder coming
from buses.
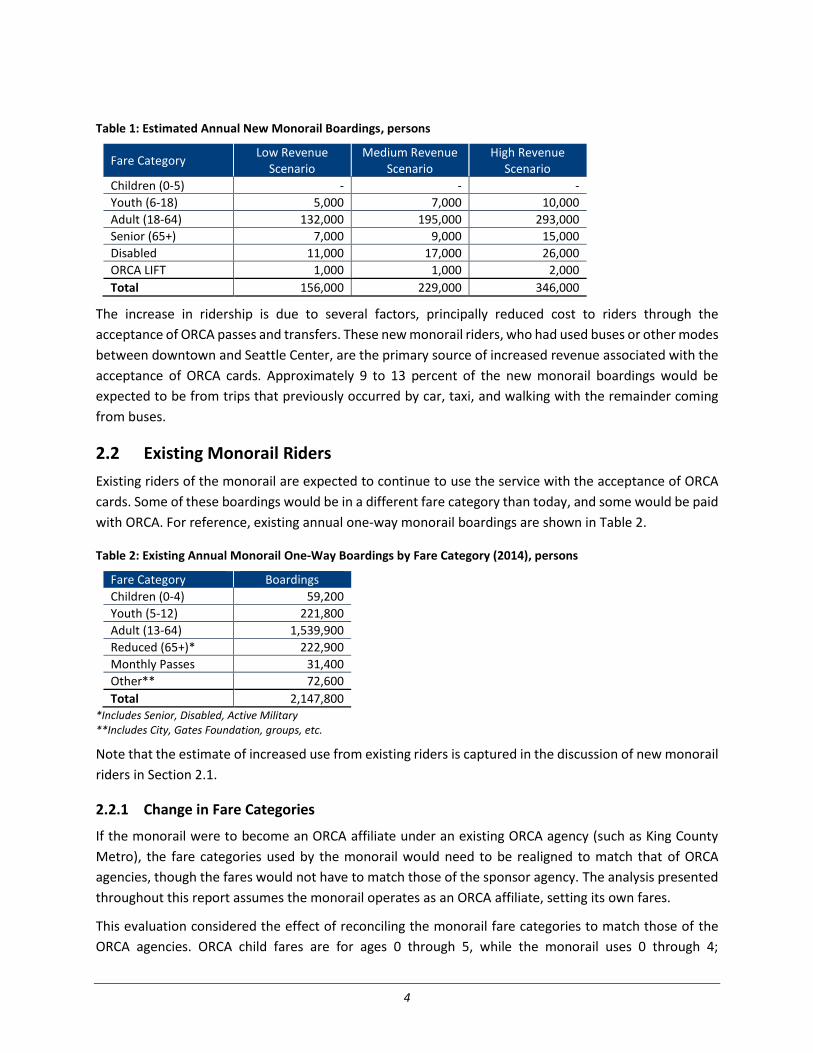
2.2 Existing Monorail Riders
Existing riders of the monorail are expected to continue to use the service with the acceptance of ORCA
cards. Some of these boardings would be in a different fare category than today, and some would be paid
with ORCA. For reference, existing annual one-way monorail boardings are shown in Table 2.
Table 2: Existing Annual Monorail One-Way Boardings by Fare Category (2014), persons
Fare Category Boardings
Children (0-4) 59,200
Youth (5-12) 221,800
Adult (13-64) 1,539,900
Reduced (65+)* 222,900
Monthly Passes 31,400
Other** 72,600
Total 2,147,800 *Includes Senior, Disabled, Active Military **Includes City, Gates Foundation, groups, etc.
Note that the estimate of increased use from existing riders is captured in the discussion of new monorail
riders in Section 2.1.
2.2.1 Change in Fare Categories
If the monorail were to become an ORCA affiliate under an existing ORCA agency (such as King County
Metro), the fare categories used by the monorail would need to be realigned to match that of ORCA
agencies, though the fares would not have to match those of the sponsor agency. The analysis presented
throughout this report assumes the monorail operates as an ORCA affiliate, setting its own fares.
This evaluation considered the effect of reconciling the monorail fare categories to match those of the
ORCA agencies. ORCA child fares are for ages 0 through 5, while the monorail uses 0 through 4;
5
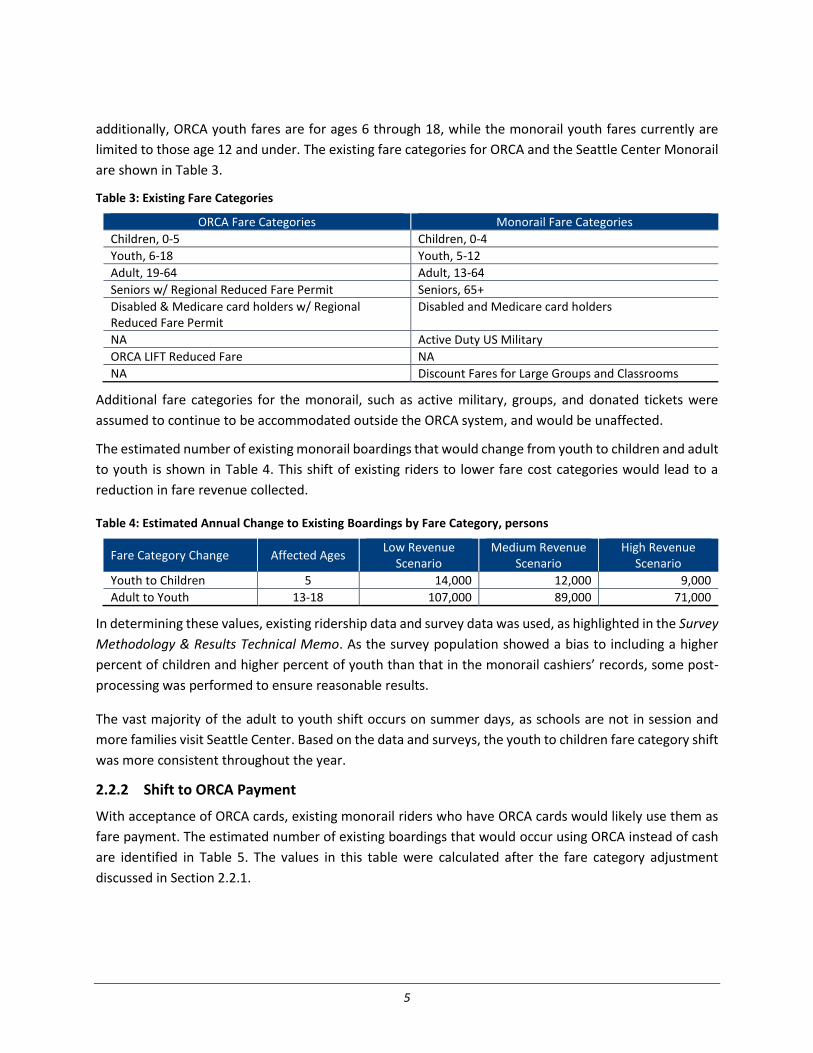
additionally, ORCA youth fares are for ages 6 through 18, while the monorail youth fares currently are
limited to those age 12 and under. The existing fare categories for ORCA and the Seattle Center Monorail
are shown in Table 3.
Table 3: Existing Fare Categories
ORCA Fare Categories Monorail Fare Categories
Children, 0-5 Children, 0-4
Youth, 6-18 Youth, 5-12
Adult, 19-64 Adult, 13-64
Seniors w/ Regional Reduced Fare Permit Seniors, 65+
Disabled & Medicare card holders w/ Regional Reduced Fare Permit
Disabled and Medicare card holders
NA Active Duty US Military
ORCA LIFT Reduced Fare NA
NA Discount Fares for Large Groups and Classrooms
Additional fare categories for the monorail, such as active military, groups, and donated tickets were
assumed to continue to be accommodated outside the ORCA system, and would be unaffected.
The estimated number of existing monorail boardings that would change from youth to children and adult
to youth is shown in Table 4. This shift of existing riders to lower fare cost categories would lead to a
reduction in fare revenue collected.
Table 4: Estimated Annual Change to Existing Boardings by Fare Category, persons
Fare Category Change Affected Ages Low Revenue
Scenario Medium Revenue
Scenario High Revenue
Scenario
Youth to Children 5 14,000 12,000 9,000
Adult to Youth 13-18 107,000 89,000 71,000
In determining these values, existing ridership data and survey data was used, as highlighted in the Survey
Methodology & Results Technical Memo. As the survey population showed a bias to including a higher
percent of children and higher percent of youth than that in the monorail cashiers’ records, some post-
processing was performed to ensure reasonable results.
The vast majority of the adult to youth shift occurs on summer days, as schools are not in session and
more families visit Seattle Center. Based on the data and surveys, the youth to children fare category shift
was more consistent throughout the year.
2.2.2 Shift to ORCA Payment
With acceptance of ORCA cards, existing monorail riders who have ORCA cards would likely use them as
fare payment. The estimated number of existing boardings that would occur using ORCA instead of cash
are identified in Table 5. The values in this table were calculated after the fare category adjustment
discussed in Section 2.2.1.
6
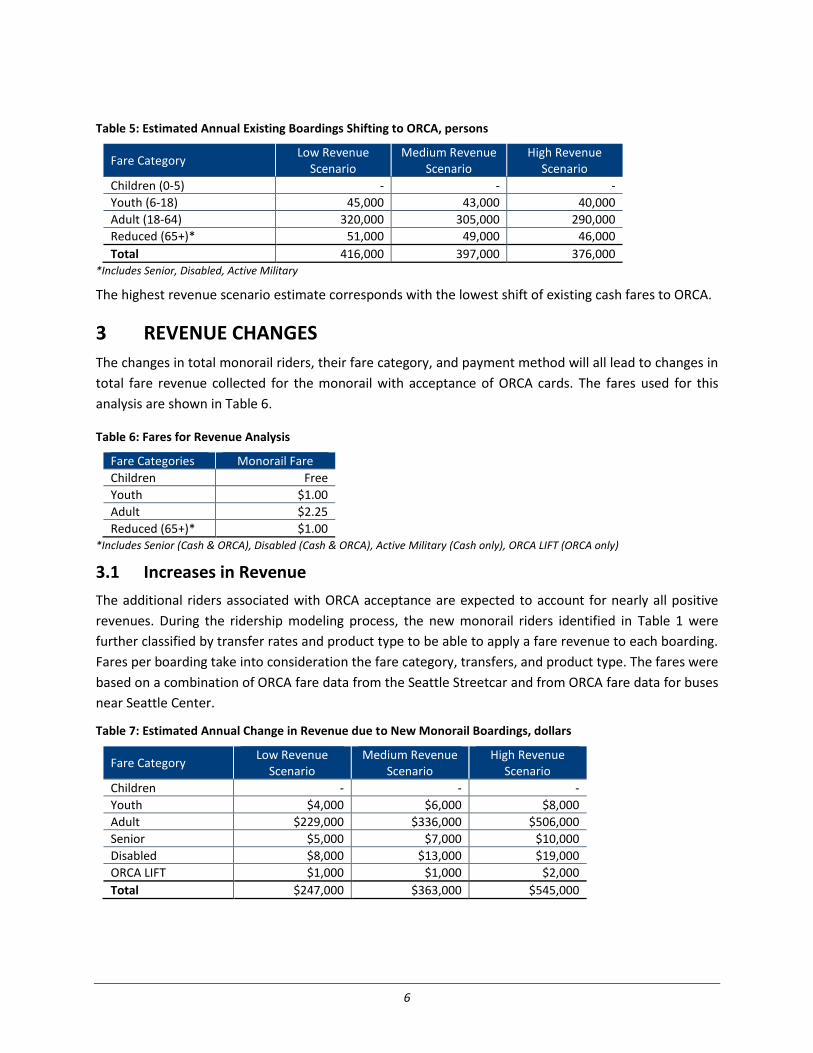
Table 5: Estimated Annual Existing Boardings Shifting to ORCA, persons
Fare Category Low Revenue
Scenario Medium Revenue
Scenario High Revenue
Scenario
Children (0-5) - - -
Youth (6-18) 45,000 43,000 40,000
Adult (18-64) 320,000 305,000 290,000
Reduced (65+)* 51,000 49,000 46,000
Total 416,000 397,000 376,000 *Includes Senior, Disabled, Active Military
The highest revenue scenario estimate corresponds with the lowest shift of existing cash fares to ORCA.
3 REVENUE CHANGES
The changes in total monorail riders, their fare category, and payment method will all lead to changes in
total fare revenue collected for the monorail with acceptance of ORCA cards. The fares used for this
analysis are shown in Table 6.
Table 6: Fares for Revenue Analysis
Fare Categories Monorail Fare
Children Free
Youth $1.00
Adult $2.25
Reduced (65+)* $1.00 *Includes Senior (Cash & ORCA), Disabled (Cash & ORCA), Active Military (Cash only), ORCA LIFT (ORCA only)
3.1 Increases in Revenue
The additional riders associated with ORCA acceptance are expected to account for nearly all positive
revenues. During the ridership modeling process, the new monorail riders identified in Table 1 were
further classified by transfer rates and product type to be able to apply a fare revenue to each boarding.
Fares per boarding take into consideration the fare category, transfers, and product type. The fares were
based on a combination of ORCA fare data from the Seattle Streetcar and from ORCA fare data for buses
near Seattle Center.
Table 7: Estimated Annual Change in Revenue due to New Monorail Boardings, dollars
Fare Category Low Revenue
Scenario Medium Revenue
Scenario High Revenue
Scenario
Children - - -
Youth $4,000 $6,000 $8,000
Adult $229,000 $336,000 $506,000
Senior $5,000 $7,000 $10,000
Disabled $8,000 $13,000 $19,000
ORCA LIFT $1,000 $1,000 $2,000
Total $247,000 $363,000 $545,000
7
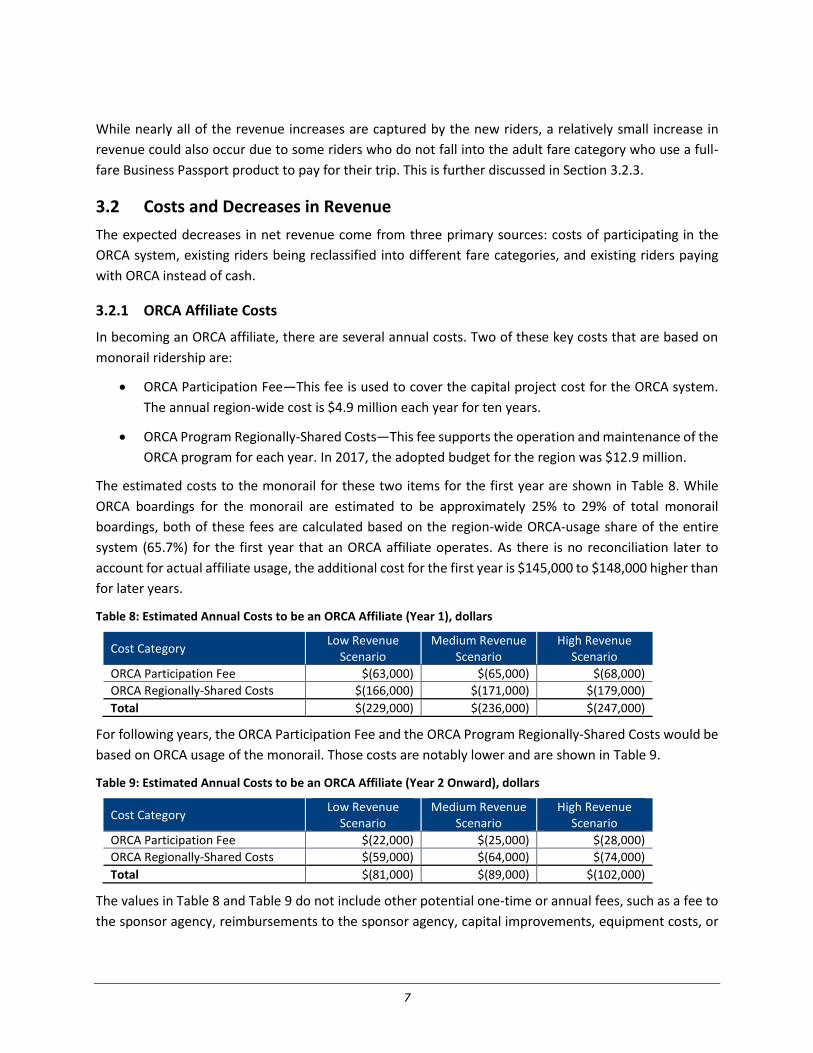
While nearly all of the revenue increases are captured by the new riders, a relatively small increase in
revenue could also occur due to some riders who do not fall into the adult fare category who use a full-
fare Business Passport product to pay for their trip. This is further discussed in Section 3.2.3.
3.2 Costs and Decreases in Revenue
The expected decreases in net revenue come from three primary sources: costs of participating in the
ORCA system, existing riders being reclassified into different fare categories, and existing riders paying
with ORCA instead of cash.
3.2.1 ORCA Affiliate Costs
In becoming an ORCA affiliate, there are several annual costs. Two of these key costs that are based on
monorail ridership are:
• ORCA Participation Fee—This fee is used to cover the capital project cost for the ORCA system.
The annual region-wide cost is $4.9 million each year for ten years.
• ORCA Program Regionally-Shared Costs—This fee supports the operation and maintenance of the
ORCA program for each year. In 2017, the adopted budget for the region was $12.9 million.
The estimated costs to the monorail for these two items for the first year are shown in Table 8. While
ORCA boardings for the monorail are estimated to be approximately 25% to 29% of total monorail
boardings, both of these fees are calculated based on the region-wide ORCA-usage share of the entire
system (65.7%) for the first year that an ORCA affiliate operates. As there is no reconciliation later to
account for actual affiliate usage, the additional cost for the first year is $145,000 to $148,000 higher than
for later years.
Table 8: Estimated Annual Costs to be an ORCA Affiliate (Year 1), dollars
Cost Category Low Revenue
Scenario Medium Revenue
Scenario High Revenue
Scenario
ORCA Participation Fee $(63,000) $(65,000) $(68,000)
ORCA Regionally-Shared Costs $(166,000) $(171,000) $(179,000)
Total $(229,000) $(236,000) $(247,000)
For following years, the ORCA Participation Fee and the ORCA Program Regionally-Shared Costs would be
based on ORCA usage of the monorail. Those costs are notably lower and are shown in Table 9.
Table 9: Estimated Annual Costs to be an ORCA Affiliate (Year 2 Onward), dollars
Cost Category Low Revenue
Scenario Medium Revenue
Scenario High Revenue
Scenario
ORCA Participation Fee $(22,000) $(25,000) $(28,000)
ORCA Regionally-Shared Costs $(59,000) $(64,000) $(74,000)
Total $(81,000) $(89,000) $(102,000)
The values in Table 8 and Table 9 do not include other potential one-time or annual fees, such as a fee to
the sponsor agency, reimbursements to the sponsor agency, capital improvements, equipment costs, or
8
start-up costs. These potential additional costs would be dependent on agreements with the sponsor
agency.
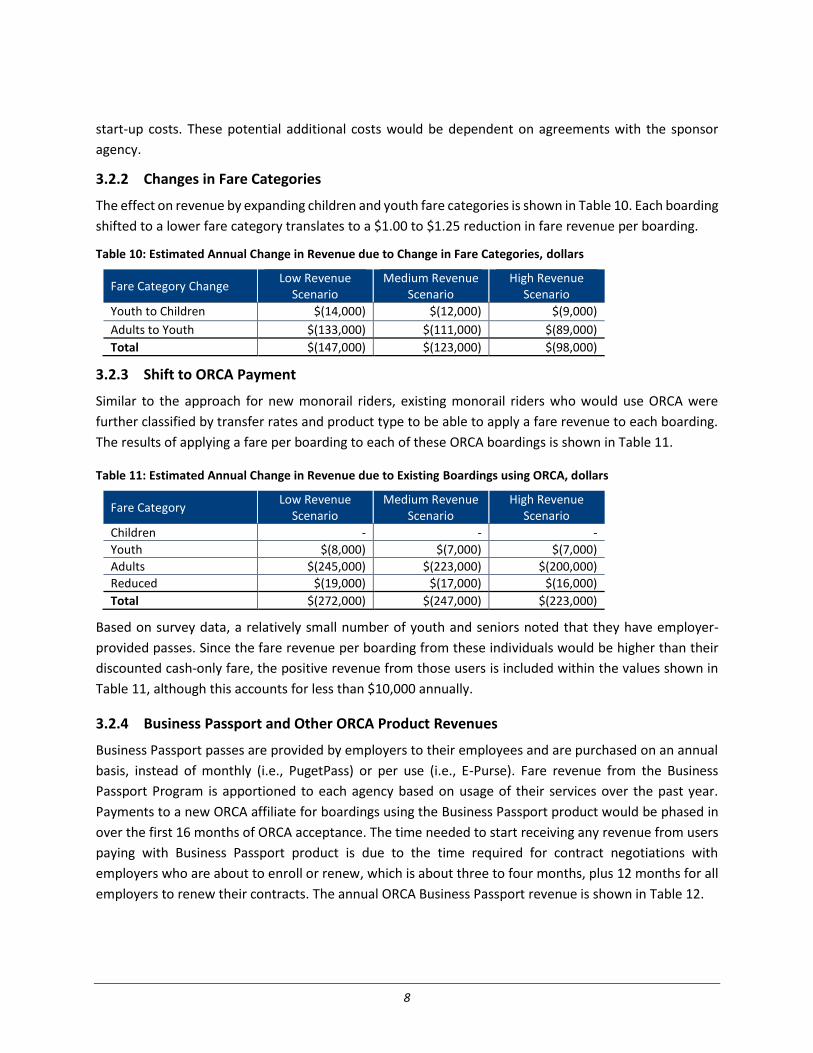
3.2.2 Changes in Fare Categories
The effect on revenue by expanding children and youth fare categories is shown in Table 10. Each boarding
shifted to a lower fare category translates to a $1.00 to $1.25 reduction in fare revenue per boarding.
Table 10: Estimated Annual Change in Revenue due to Change in Fare Categories, dollars
Fare Category Change Low Revenue
Scenario Medium Revenue
Scenario High Revenue
Scenario
Youth to Children $(14,000) $(12,000) $(9,000)
Adults to Youth $(133,000) $(111,000) $(89,000)
Total $(147,000) $(123,000) $(98,000)
3.2.3 Shift to ORCA Payment
Similar to the approach for new monorail riders, existing monorail riders who would use ORCA were
further classified by transfer rates and product type to be able to apply a fare revenue to each boarding.
The results of applying a fare per boarding to each of these ORCA boardings is shown in Table 11.
Table 11: Estimated Annual Change in Revenue due to Existing Boardings using ORCA, dollars
Fare Category Low Revenue
Scenario Medium Revenue
Scenario High Revenue
Scenario
Children - - -
Youth $(8,000) $(7,000) $(7,000)
Adults $(245,000) $(223,000) $(200,000)
Reduced $(19,000) $(17,000) $(16,000)
Total $(272,000) $(247,000) $(223,000)
Based on survey data, a relatively small number of youth and seniors noted that they have employer-
provided passes. Since the fare revenue per boarding from these individuals would be higher than their
discounted cash-only fare, the positive revenue from those users is included within the values shown in
Table 11, although this accounts for less than $10,000 annually.
3.2.4 Business Passport and Other ORCA Product Revenues
Business Passport passes are provided by employers to their employees and are purchased on an annual
basis, instead of monthly (i.e., PugetPass) or per use (i.e., E-Purse). Fare revenue from the Business
Passport Program is apportioned to each agency based on usage of their services over the past year.
Payments to a new ORCA affiliate for boardings using the Business Passport product would be phased in
over the first 16 months of ORCA acceptance. The time needed to start receiving any revenue from users
paying with Business Passport product is due to the time required for contract negotiations with
employers who are about to enroll or renew, which is about three to four months, plus 12 months for all
employers to renew their contracts. The annual ORCA Business Passport revenue is shown in Table 12.
9
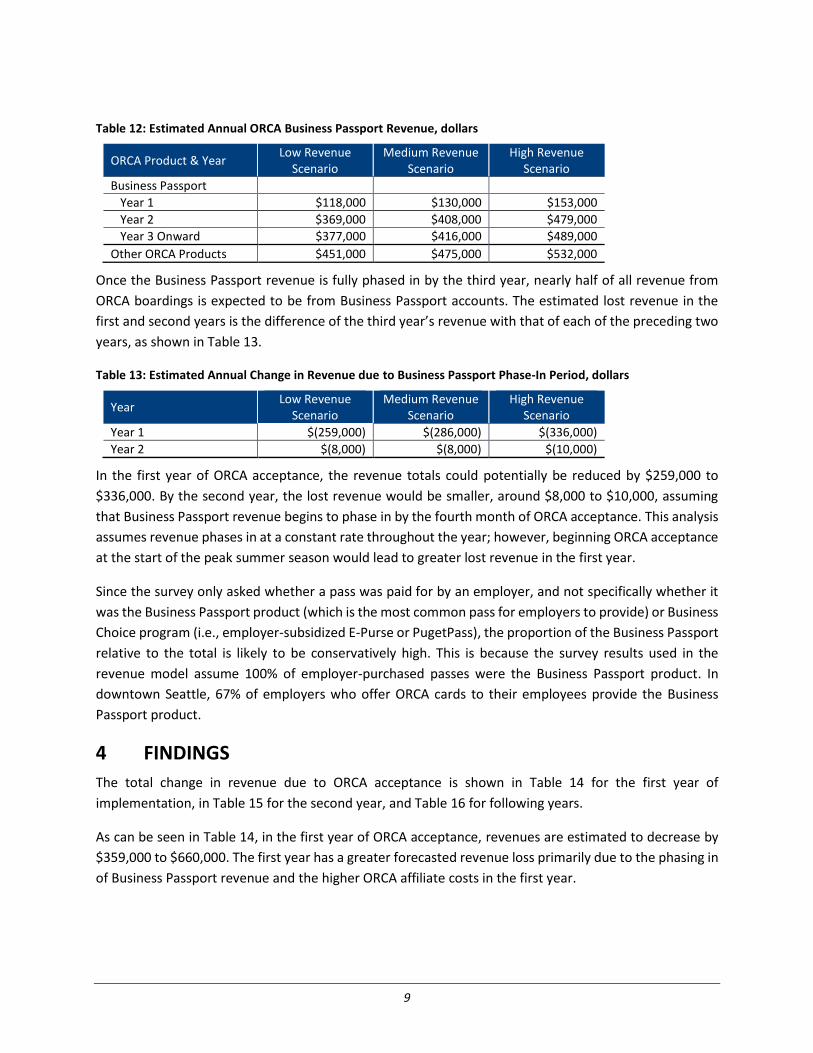
Table 12: Estimated Annual ORCA Business Passport Revenue, dollars
ORCA Product & Year Low Revenue
Scenario Medium Revenue
Scenario High Revenue
Scenario
Business Passport
Year 1 $118,000 $130,000 $153,000
Year 2 $369,000 $408,000 $479,000
Year 3 Onward $377,000 $416,000 $489,000
Other ORCA Products $451,000 $475,000 $532,000
Once the Business Passport revenue is fully phased in by the third year, nearly half of all revenue from
ORCA boardings is expected to be from Business Passport accounts. The estimated lost revenue in the
first and second years is the difference of the third year’s revenue with that of each of the preceding two
years, as shown in Table 13.
Table 13: Estimated Annual Change in Revenue due to Business Passport Phase-In Period, dollars
Year Low Revenue
Scenario Medium Revenue
Scenario High Revenue
Scenario
Year 1 $(259,000) $(286,000) $(336,000)
Year 2 $(8,000) $(8,000) $(10,000)
In the first year of ORCA acceptance, the revenue totals could potentially be reduced by $259,000 to
$336,000. By the second year, the lost revenue would be smaller, around $8,000 to $10,000, assuming
that Business Passport revenue begins to phase in by the fourth month of ORCA acceptance. This analysis
assumes revenue phases in at a constant rate throughout the year; however, beginning ORCA acceptance
at the start of the peak summer season would lead to greater lost revenue in the first year.
Since the survey only asked whether a pass was paid for by an employer, and not specifically whether it
was the Business Passport product (which is the most common pass for employers to provide) or Business
Choice program (i.e., employer-subsidized E-Purse or PugetPass), the proportion of the Business Passport
relative to the total is likely to be conservatively high. This is because the survey results used in the
revenue model assume 100% of employer-purchased passes were the Business Passport product. In
downtown Seattle, 67% of employers who offer ORCA cards to their employees provide the Business
Passport product.
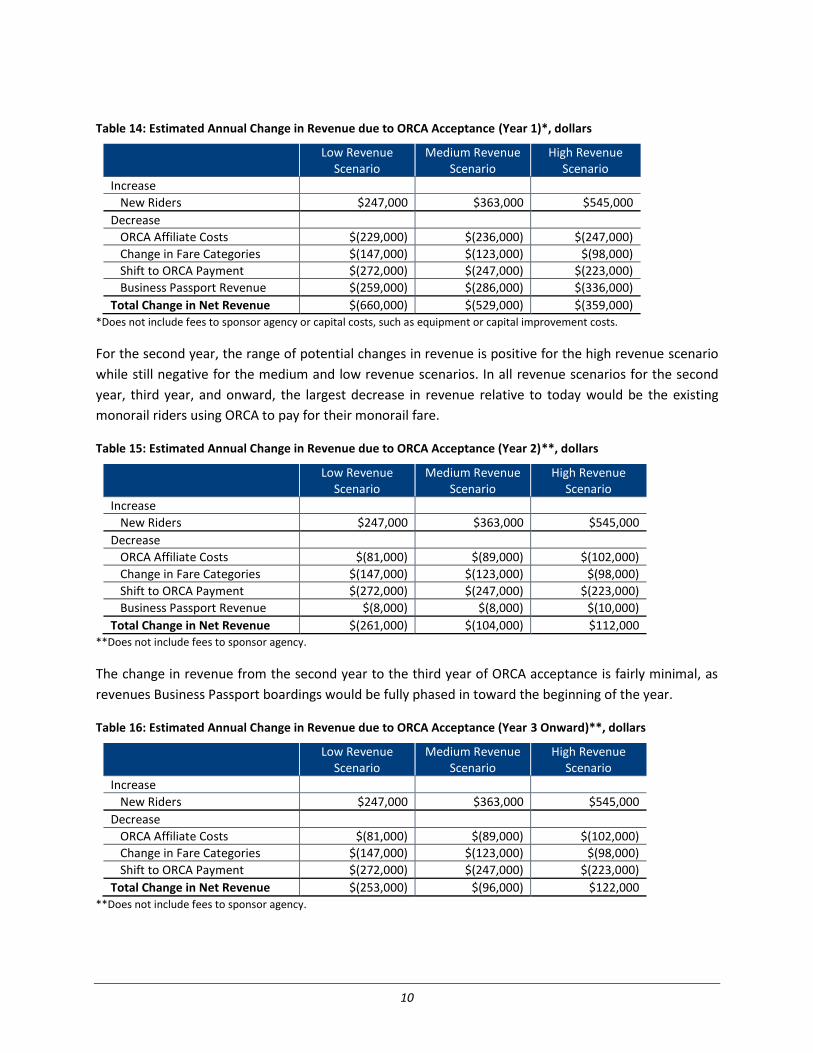
4 FINDINGS
The total change in revenue due to ORCA acceptance is shown in Table 14 for the first year of
implementation, in Table 15 for the second year, and Table 16 for following years.
As can be seen in Table 14, in the first year of ORCA acceptance, revenues are estimated to decrease by
$359,000 to $660,000. The first year has a greater forecasted revenue loss primarily due to the phasing in
of Business Passport revenue and the higher ORCA affiliate costs in the first year.
10
Table 14: Estimated Annual Change in Revenue due to ORCA Acceptance (Year 1)*, dollars
Low Revenue Scenario
Medium Revenue Scenario
High Revenue Scenario
Increase
New Riders $247,000 $363,000 $545,000
Decrease
ORCA Affiliate Costs $(229,000) $(236,000) $(247,000)
Change in Fare Categories $(147,000) $(123,000) $(98,000)
Shift to ORCA Payment $(272,000) $(247,000) $(223,000)
Business Passport Revenue $(259,000) $(286,000) $(336,000)
Total Change in Net Revenue $(660,000) $(529,000) $(359,000) *Does not include fees to sponsor agency or capital costs, such as equipment or capital improvement costs.
For the second year, the range of potential changes in revenue is positive for the high revenue scenario
while still negative for the medium and low revenue scenarios. In all revenue scenarios for the second
year, third year, and onward, the largest decrease in revenue relative to today would be the existing
monorail riders using ORCA to pay for their monorail fare.
Table 15: Estimated Annual Change in Revenue due to ORCA Acceptance (Year 2)**, dollars
Low Revenue Scenario
Medium Revenue Scenario
High Revenue Scenario
Increase
New Riders $247,000 $363,000 $545,000
Decrease
ORCA Affiliate Costs $(81,000) $(89,000) $(102,000)
Change in Fare Categories $(147,000) $(123,000) $(98,000)
Shift to ORCA Payment $(272,000) $(247,000) $(223,000)
Business Passport Revenue $(8,000) $(8,000) $(10,000)
Total Change in Net Revenue $(261,000) $(104,000) $112,000 **Does not include fees to sponsor agency.
The change in revenue from the second year to the third year of ORCA acceptance is fairly minimal, as
revenues Business Passport boardings would be fully phased in toward the beginning of the year.
Table 16: Estimated Annual Change in Revenue due to ORCA Acceptance (Year 3 Onward)**, dollars
Low Revenue Scenario
Medium Revenue Scenario
High Revenue Scenario
Increase
New Riders $247,000 $363,000 $545,000
Decrease
ORCA Affiliate Costs $(81,000) $(89,000) $(102,000)
Change in Fare Categories $(147,000) $(123,000) $(98,000)
Shift to ORCA Payment $(272,000) $(247,000) $(223,000)
Total Change in Net Revenue $(253,000) $(96,000) $122,000 **Does not include fees to sponsor agency.
11
5 DISCLAIMER
This report was prepared by WSP USA for Seattle Center.
While WSP USA believes that the projections or other forward-looking statements contained within the
report are based on reasonable assumptions and correctly represent the inputs and estimates as of the
date of the report, such forward looking statements involve risks and uncertainties that may cause actual
results to differ materially from the results predicted.
WSP USA, Inc. is not a registered Municipal Advisor, and is not subject to the fiduciary duty a Municipal
Advisor has to a municipal entity client as established in Section 15B (c)(1) of the Securities Exchange Act
(Revised). We acknowledge that the City of Seattle is currently represented by registered Municipal
Advisors Piper Jaffray & Co., Seattle-Northwest Division, and that the City will rely on those advisors, or
their successors, prior to taking action regarding municipal securities as it may derive from or in any way
depend upon any work performed by WSP | Parsons Brinckerhoff related to the Seattle Center Monorail
ridership and revenue projections.
This report does not constitute a recommendation on the part of WSP USA, Seattle Center, of the Seattle
Department of Transportation.