Seat Rear End BioRID II and Insurance Data - IRCOBI · Abstract The BioRID is recommended for...
14
Abstract The BioRID is recommended for legislative rear‐end impact seat tests. Recommended injury criteria are, however, lacking; biomechanical data are limited and confines any evaluation of proposed criteria. This study aimed at addressing these limitations by comparing BioRID II data from sled tests with real‐life accident data. Results will evaluate injury predictability of the complete sled test method, which includes performance criteria, the use of a generic acceleration pulse, and the BioRID, etc. Real‐life injury risk was calculated for 17 groups of similar seat designs from data provided by Folksam. The number of insurance cases range from 150 to 1136 per group. Regression coefficients were calculated. Two types of injury risks were used: those leading to documented symptoms of more than one month’s duration and those classified as leading to permanent medical impairment as a consequence of a rear‐end impact. These risks were compared to parameter values from sled tests performed with a BioRID II at 16 km/h pulses. NIC, the maximum rearward Occipital Condyle relative T1 x‐displacements and L1 x‐acceleration best predicted the risk of developing permanent medical impairment and symptoms of more than one month, given the occupant had initial symptoms following a rear‐end impact. Keywords BioRID, injury criteria, real life data, rear‐end, WAD I. INTRODUCTION Several studies have compared BioRID rear‐end crash test results to real‐life performance with the main goal of recommending seat evaluation methods. Linder et al. [1] reconstructed 25 rear‐end impacts with a known one month duration of neck injury symptoms. In the reconstructions, the BioRID II was placed in the same type of seat as in the struck vehicle, and vehicle accelerations were reproduced. They found that the following criteria and parameters should be further studied: the neck injury criterion NIC [2] and Nkm [3]; maximum upper neck loads and T1 x‐acceleration. Cappon et al. [4] correlated crash test parameters by using the RID3D and the BioRID II with German accident statistics (acute injuries). The injury risk of each vehicle model was estimated using insurance claims combined with the number of vehicles registered in the data collection region for the particular model. This approach gave a rough estimate of real‐life risk. The study found a reasonable correlation between the NIC as measured in the BioRID II and real‐life risk. Boström and Kullgren [5] compared the real‐life performance of car seats with BioRID II test results for Saab, Volvo and Toyota seats, before and after introduction of the anti‐whiplash systems. The J. Davidsson is an assistant professor at the Division of Vehicle Safety, Department of Mechanical Engineering, Chalmers University of Technology (tel: +46‐31‐7723640, e‐mail: [email protected]). A. Kullgren is Head of Research, Folksam insurance Company and an adjunct professor, Division of Vehicle Safety, Department of Mechanical Engineering, Chalmers University of Technology. Evaluation of Seat Performance Criteria for Rear‐End Impact Testing BioRID II and Insurance Data Johan Davidsson and Anders Kullgren IRC-13-15 IRCOBI Conference 2013 - 63 -
Transcript of Seat Rear End BioRID II and Insurance Data - IRCOBI · Abstract The BioRID is recommended for...

Abstract The BioRID is recommended for legislative rear‐end impact seat tests. Recommended
injury criteria are, however, lacking; biomechanical data are limited and confines any evaluation of
proposed criteria.
This study aimed at addressing these limitations by comparing BioRID II data from sled tests with
real‐life accident data. Results will evaluate injury predictability of the complete sled test method, which
includes performance criteria, the use of a generic acceleration pulse, and the BioRID, etc.
Real‐life injury risk was calculated for 17 groups of similar seat designs from data provided by
Folksam. The number of insurance cases range from 150 to 1136 per group. Regression coefficients
were calculated. Two types of injury risks were used: those leading to documented symptoms of more
than one month’s duration and those classified as leading to permanent medical impairment as a
consequence of a rear‐end impact. These risks were compared to parameter values from sled tests
performed with a BioRID II at 16 km/h pulses.
NIC, the maximum rearward Occipital Condyle relative T1 x‐displacements and L1 x‐acceleration best
predicted the risk of developing permanent medical impairment and symptoms of more than one
month, given the occupant had initial symptoms following a rear‐end impact.
Keywords BioRID, injury criteria, real life data, rear‐end, WAD
I. INTRODUCTION
Several studies have compared BioRID rear‐end crash test results to real‐life performance with the
main goal of recommending seat evaluation methods.
Linder et al. [1] reconstructed 25 rear‐end impacts with a known one month duration of neck injury
symptoms. In the reconstructions, the BioRID II was placed in the same type of seat as in the struck
vehicle, and vehicle accelerations were reproduced. They found that the following criteria and
parameters should be further studied: the neck injury criterion NIC [2] and Nkm [3]; maximum upper
neck loads and T1 x‐acceleration.
Cappon et al. [4] correlated crash test parameters by using the RID3D and the BioRID II with German
accident statistics (acute injuries). The injury risk of each vehicle model was estimated using insurance
claims combined with the number of vehicles registered in the data collection region for the particular
model. This approach gave a rough estimate of real‐life risk. The study found a reasonable correlation
between the NIC as measured in the BioRID II and real‐life risk.
Boström and Kullgren [5] compared the real‐life performance of car seats with BioRID II test results
for Saab, Volvo and Toyota seats, before and after introduction of the anti‐whiplash systems. The
J. Davidsson is an assistant professor at the Division of Vehicle Safety, Department of Mechanical Engineering, Chalmers University of Technology (tel: +46‐31‐7723640, e‐mail: [email protected]). A. Kullgren is Head of Research, Folksam insurance Company and an adjunct professor, Division of Vehicle Safety, Department of Mechanical Engineering, Chalmers University of Technology.
Evaluation of Seat Performance Criteria for Rear‐End Impact Testing BioRID II and Insurance Data
Johan Davidsson and Anders Kullgren
IRC-13-15 IRCOBI Conference 2013
- 63 -

authors presented data indicating that the NIC and upper neck shear loads were reduced more than
other parameters when seats were fitted with anti‐whiplash systems. The reduction of these two
parameters may have contributed largely to the reduced injury risk observed in the seats with anti‐
whiplash systems.
Farmer et al. [6] investigated the relationship between the seat rating schemes used by the Insurance
Institute for Highway Safety and the rating schemes used by the Swedish Road Administration (SRA) to
real‐world neck injury rates due to rear‐end impacts. The main finding was that the better performing
seat systems in dynamic sled tests had a lower risk of neck injury than seats that rated poorly. This was
especially clear for long term injuries (> 3 month injury claim). However, the study also concluded that
further research is needed in the fields of injury criteria, injury thresholds and test design to improve the
predictability of real‐world neck injuries by mechanical tests of seat systems.
Zuby and Farmer [7] studied the correlation between 26 BioRID II test parameters and seat design
injury rates. Fifty‐five seat designs were included in the analysis for which more than 30 claims had been
filed. The study found that none of the 26 studied parameters were highly correlated with neck injury
rates. It was mentioned that variables other than sled test variables, such as the insurance system used
in the States from which data were collected, crash damage or vehicle price, could have reduced the
expected correlations.
Ono et al. [8] used mathematical modeling to reconstruct real‐life, rear‐end impact accidents with
known initial, short and long‐term risks for neck injury symptoms, as well as known crash pulse and seat
characteristics, to recommend criteria for the BioRID II. In all, 20 cases were reconstructed; velocity
change ranged from 9 km/h to 28 km/h. Results revealed that displacements between the cervical
vertebrae may have been responsible for the persistent neck symptoms. The study also suggested
adopting the NIC and neck loads (Upper My, Lower Fx and Fz) to assess the risk of these injuries.
Davidsson and Kullgren [9‐10] correlated insurance claims data following rear‐end impacts with
BioRID II measurements. They used a limited number of seat models. This paper is an update of those
two earlier works; the differences between the studies are presented in the discussion section.
The objective of this study was to assess the applicability of BioRID II seat performance criteria, i.e.
crash test dummy parameter values and injury criteria values, for rear‐end impact seat‐system testing.
This was done by finding a correlation between the risk for whiplash‐associated disorders (WAD), as
calculated from real‐life insurance data, and BioRID II values. An analysis of groups of seats of the same
seat design, e.g. all cars from Volvo in which WHIPS seats were installed, will be presented.
II. METHODS
Insurance data
Whiplash injury claims from crashes that occurred between 1998 and 2012, at +/‐30 degrees from
straight rear‐end impacts and in the driver position only, as reported to the Folksam Insurance Company
were used in this study. 7 893 drivers reporting initial neck and spine injuries were included. Insurance
claims were used to verify whether reported WAD led to long‐term symptoms. Three combinations
were studied; merged male and female data, and female and male data separately.
Medical expertise in Sweden has gradually been classifying WAD more restrictively. A reduction
factor for compensating for this change in classification can be calculated by studying the injury claim
outcome for vehicles with an identical introduction year over the sampling period. The risk of long term
symptoms, given reported initial symptoms, should not change over the sampling period. The reduction
in the likelihood of classifying an injury as a permanent medical impairment (PMI) appears to be linear
over the sampling period, from 1998 to 2012, and was found to be 11% yearly for a large number of
IRC-13-15 IRCOBI Conference 2013
- 64 -

vehicle models, and for a representative distribution of males and females. In the same way, the
reduction in classification of those with symptoms lasting longer than one month was found to be 6.5%
per year. Adjustments were made by weighting the number of occupants with long‐term symptoms
according to the year of impact. In order to retain the total number of occupants with long‐term
symptoms, weighting was made based on the accident year 2005, the middle accident year in the
accident sample. All occupants with long‐term symptoms in crashes occurring before 2005 were
weighted lower, and all those after 2005 were weighted higher (Equations 1 and 2). By making an
adjustment for the accident year for each occupant, outcomes from all groups of cars under study could
be compared.
,
, ; (1)
,
, ; 1 (2)
Risk measures used:
- Symptoms >1 month were defined as: occupants who had medical records of symptoms lasting
longer than one month and claiming compensation for symptoms, divided by all those reporting
initial symptoms. These claims entitled the occupant to a payment of 2000 SEK (about 210 €). The
symptoms >1 month category included both those who possibly recovered after one month or later
and those later classified as sustaining a permanent medical impairment (PMI).
- PMI was considered as: occupants with medical records of PMI and claiming compensation for injury
symptoms, divided by all those reporting initial symptoms. This classification is set after
approximately one year, although it usually takes longer to determine a final degree of PMI.
Grouping based on seat design
To obtain a reliable statistical result regarding the risks used, insurance claim data for seats of similar
design were grouped (Table 1). For some of these groups, traditional seats and anti‐whiplash seat
designs, as well as older and newer models from the same car manufacturer, were included. Heavy and
light cars were excluded to reduce differences in average vehicle weight between groups (Table 1).
Sled test data
All sled tests included in this study were conducted at Autoliv, Sweden, from 2004 to 2006, and at
Thatcham, UK, between 2003 and 2006 according to the SRA and Folksam seat performance rating
procedure and the International Insurance Whiplash Prevention Group (IIWPG), respectively. In
addition, tests were carried out at Thatcham in 2012 according the Euro‐NCAP test protocol. The main
differences between the series included were the make and build level of the H‐point machine, the Head
Restraint Measuring Device (HRMD) and the BioRID II. Table 2 lists the conditions in the sled tests used
to represent each group. All criteria/parameter values used in the analysis were taken from a single seat
test from each seat group. The following seat test data selection criteria were applied:
1. Primarily Thatcham data were selected; the H‐point machine with an HRMD had dimensions close
to the standard tool used today.
2. When multiple tests from Thatcham were available for a seat group, the number of accidents with
initial symptoms was used to select the test for use in further analyses.
3. When the dataset first selected provided results deemed as outliers when compared with the
median values within the particular vehicle model, the dataset was discarded and another chosen.
IRC-13-15 IRCOBI Conference 2013
- 65 -
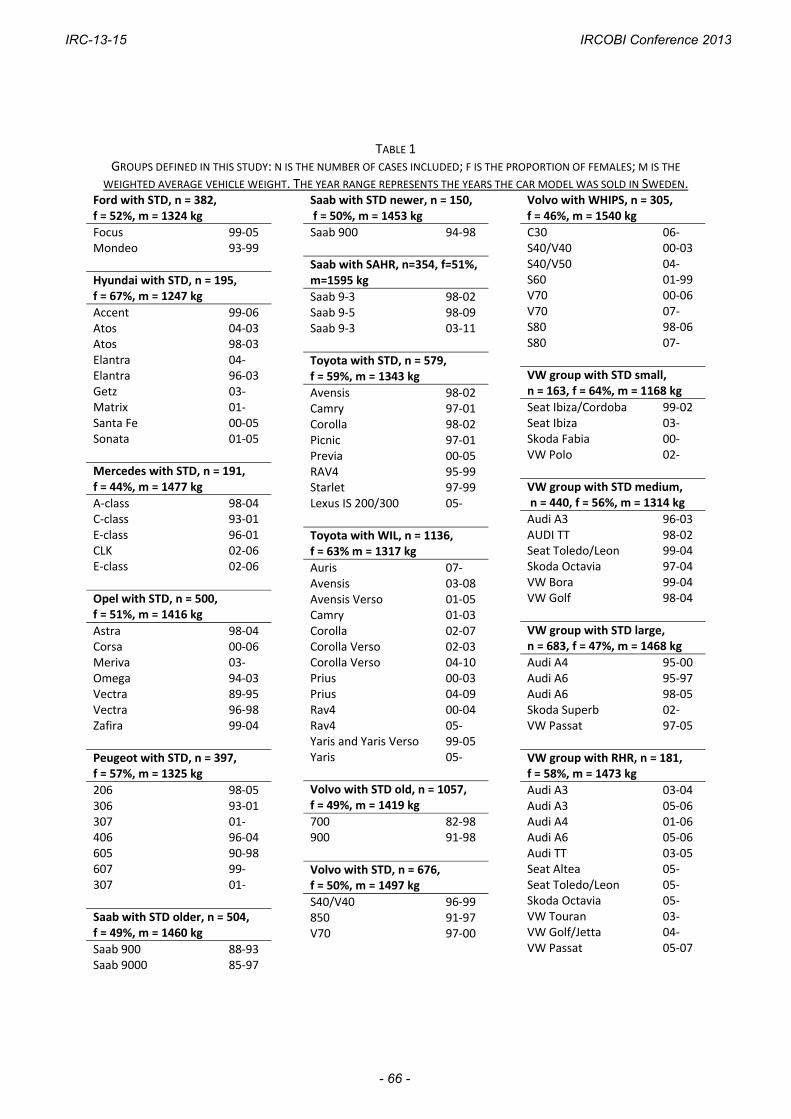
TABLE 1 GROUPS DEFINED IN THIS STUDY: N IS THE NUMBER OF CASES INCLUDED; F IS THE PROPORTION OF FEMALES; M IS THE
WEIGHTED AVERAGE VEHICLE WEIGHT. THE YEAR RANGE REPRESENTS THE YEARS THE CAR MODEL WAS SOLD IN SWEDEN. Ford with STD, n = 382, f = 52%, m = 1324 kg
Focus 99‐05 Mondeo 93‐99
Hyundai with STD, n = 195, f = 67%, m = 1247 kg
Accent 99‐06 Atos 04‐03 Atos 98‐03 Elantra 04‐ Elantra 96‐03 Getz 03‐ Matrix 01‐ Santa Fe 00‐05 Sonata 01‐05
Mercedes with STD, n = 191, f = 44%, m = 1477 kg
A‐class 98‐04 C‐class 93‐01 E‐class 96‐01 CLK 02‐06 E‐class 02‐06
Opel with STD, n = 500, f = 51%, m = 1416 kg
Astra 98‐04 Corsa 00‐06 Meriva 03‐ Omega 94‐03 Vectra 89‐95 Vectra 96‐98 Zafira 99‐04
Peugeot with STD, n = 397, f = 57%, m = 1325 kg
206 98‐05 306 93‐01 307 01‐ 406 96‐04 605 90‐98 607 99‐ 307 01‐
Saab with STD older, n = 504, f = 49%, m = 1460 kg
Saab 900 88‐93 Saab 9000 85‐97
Saab with STD newer, n = 150, f = 50%, m = 1453 kg
Saab 900 94‐98
Saab with SAHR, n=354, f=51%, m=1595 kg
Saab 9‐3 98‐02 Saab 9‐5 98‐09Saab 9‐3 03‐11
Toyota with STD, n = 579,f = 59%, m = 1343 kg
Avensis 98‐02Camry 97‐01 Corolla 98‐02Picnic 97‐01Previa 00‐05RAV4 95‐99Starlet 97‐99Lexus IS 200/300 05‐
Toyota with WIL, n = 1136, f = 63% m = 1317 kg
Auris 07‐Avensis 03‐08Avensis Verso 01‐05Camry 01‐03Corolla 02‐07Corolla Verso 02‐03Corolla Verso 04‐10Prius 00‐03Prius 04‐09Rav4 00‐04Rav4 05‐Yaris and Yaris Verso 99‐05Yaris 05‐
Volvo with STD old, n = 1057,f = 49%, m = 1419 kg
700 82‐98900 91‐98
Volvo with STD, n = 676, f = 50%, m = 1497 kg
S40/V40 96‐99850 91‐97V70 97‐00
Volvo with WHIPS, n = 305, f = 46%, m = 1540 kg
C30 06‐S40/V40 00‐03 S40/V50 04‐S60 01‐99 V70 00‐06V70 07‐S80 98‐06S80 07‐
VW group with STD small, n = 163, f = 64%, m = 1168 kg
Seat Ibiza/Cordoba 99‐02Seat Ibiza 03‐Skoda Fabia 00‐VW Polo 02‐
VW group with STD medium, n = 440, f = 56%, m = 1314 kg
Audi A3 96‐03AUDI TT 98‐02Seat Toledo/Leon 99‐04Skoda Octavia 97‐04VW Bora 99‐04VW Golf 98‐04
VW group with STD large, n = 683, f = 47%, m = 1468 kg
Audi A4 95‐00Audi A6 95‐97Audi A6 98‐05Skoda Superb 02‐VW Passat 97‐05
VW group with RHR, n = 181,f = 58%, m = 1473 kg
Audi A3 03‐04Audi A3 05‐06Audi A4 01‐06Audi A6 05‐06Audi TT 03‐05Seat Altea 05‐Seat Toledo/Leon 05‐Skoda Octavia 05‐VW Touran 03‐VW Golf/Jetta 04‐VW Passat 05‐07
IRC-13-15 IRCOBI Conference 2013
- 66 -

In addition to an analysis of representative values, a median criteria/parameter value for each seat group
was also analyzed. The analysis using median values was carried out to study bias in the selection of the
representative tests (for each of the seat groups). Additional details for the calculation of median injury criteria
and parameter values can be seen in Appendix 3.
The sled acceleration chosen was the median risk and median frequency pulse [11‐12], with a velocity
change of 16 km/h, an average acceleration of 5.5 g, and a triangular shape with a 10 g peak.
The parameters measured and calculated were those previously suggested by SRA/Folksam and IIWPG
(Appendix I). In addition, head relative T1 displacement data, expressed in a coordinate system attached to the
T1 unit, were retrieved from film analyses.
TABLE 2 CAR MODEL, TYPE OF SEAT SYSTEM, YEAR THE SEAT WAS TESTED, TEST FACILITY, BIORID II VERSION, H‐POINT MACHINE, INITIAL
HORIZONTAL HEAD‐TO‐HEAD‐RESTRAINT DISTANCE (BACK SET). Groups Model Sales.
year WAD mitigation system1
Yeartested
Test Facility
BioRID II version
H‐point machine2
Back set (mm)
Hyundai Santa Fe 00‐05 None 2004 Thatcham G AA 61Ford Focus I 99‐06 None 2004 Autoliv E TS 55Mercedes C‐class 93‐01 None 2004 Thatcham G AA 55Opel Astra 98‐04 None 2004 Thatcham G AA 72Peugeot 206 98‐05 None 2004 Thatcham G AA 76SAAB 900 94‐98 None 2006* Autoliv G AA 30 9000 85‐97 None 2012* Thatcham G AA 48 9‐5 98‐09 SAHR 2004 Thatcham G AA 56Toyota Corolla 98‐02 None 2005* Autoliv E TS 65 Yaris 99‐05 WIL 2004 Thatcham G AA 66Volvo 700/900 82‐98 None 2012* Thatcham G AA 17 V70 97‐00 None 2006* Autoliv G AA 74 V/S70 00‐06 WHIPS 2004 Thatcham G AA 32VW small VW Polo 02‐ None 2004 Thatcham G AA 63VW medium Seat Altea 04‐ None 2004 Thatcham G AA 65VW large Skoda Superb 02‐ None 2004 Thatcham G AA 85VW RHR Audi A6 05‐06 RHR 2005 Autoliv E TS 551NONE NO SYSTEM ACTIVATED BEFORE OR DURINGY IMPACT 1RHR REACTIVE HEAD RESTRAINTS 1SAHR SAAB ACTIVE HEAD RESTRAINT, VERSION 1 AND 2 1WHIPS WHIPLASH PROTECTION SYSTEM
1WIL WHIPLASH INJURY LESSENING 2TS REFERS TO TECHNOSPORTS, INC., USA 2AA REFERS TO AUTOMOTIVE ACCESSORIES, LTD., UK *SEAT TESTED USED
Linear regression
A linear regression model was adopted to provide an idea of how parameters correlated with estimated
risks. To measure how well the model fit, a coefficient of determination, the r2 value, was calculated.
The regression line was determined by fitting a line to the data. Single outliers have a profound influence on
the slope of the regression line and the value of the correlation coefficient, r2. For this reason data were plotted
and outliers identified.
Estimation of sensitivity
A study of the sensitivity of inclusion or exclusion of some selected data points was carried out. Here, one of
the 17 datasets was removed and the correlation coefficient r2 value calculated. This was repeated for all
possible combinations for which each data point was excluded once. The maximum and minimum values
calculated are presented in the Results section as a measure of sensitivity for each data point in the analysis.
III. RESULTS
Linear regression for representative dummy test data and WAD risk were conducted for 35 parameters.
Those that had the best correlations (r2) between the peak value of the parameters and the two categories of
risks, symptoms and impairment are presented in Table 3‐5. In Table 3 representative data for males and
females combined are provided. In Table 4 representative data for females only are provided. In Table 5 median
IRC-13-15 IRCOBI Conference 2013
- 67 -
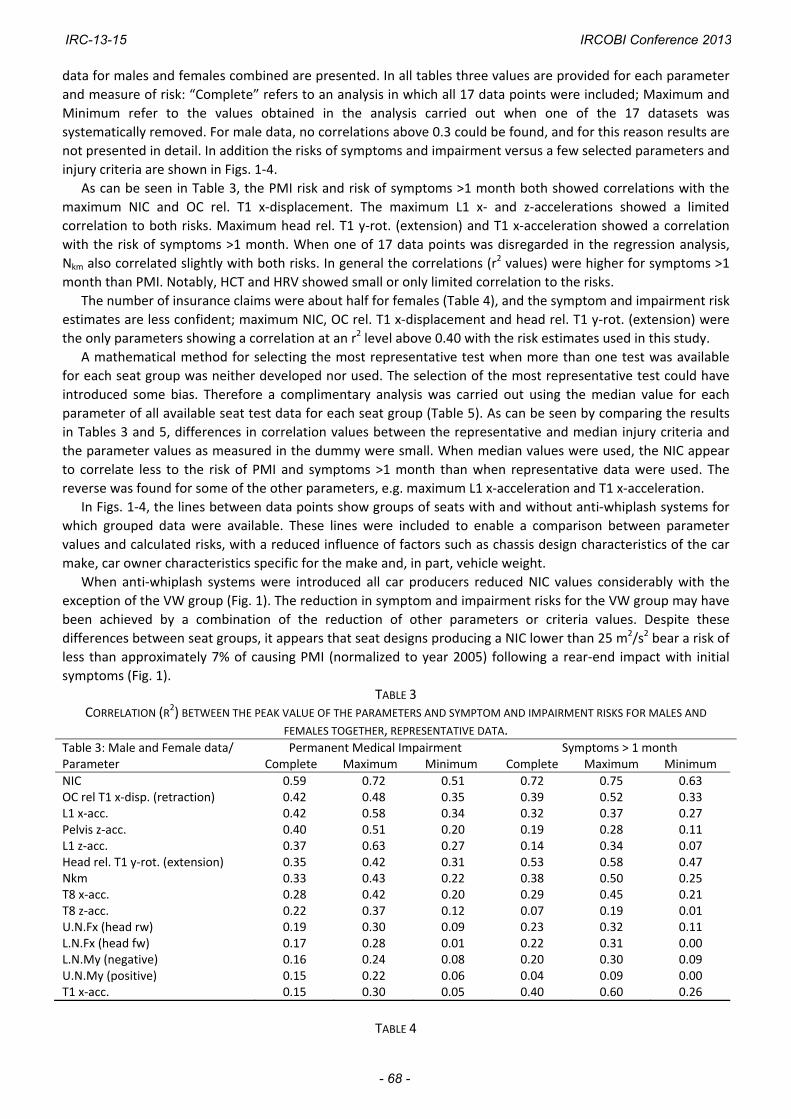
data for males and females combined are presented. In all tables three values are provided for each parameter
and measure of risk: “Complete” refers to an analysis in which all 17 data points were included; Maximum and
Minimum refer to the values obtained in the analysis carried out when one of the 17 datasets was
systematically removed. For male data, no correlations above 0.3 could be found, and for this reason results are
not presented in detail. In addition the risks of symptoms and impairment versus a few selected parameters and
injury criteria are shown in Figs. 1‐4.
As can be seen in Table 3, the PMI risk and risk of symptoms >1 month both showed correlations with the
maximum NIC and OC rel. T1 x‐displacement. The maximum L1 x‐ and z‐accelerations showed a limited
correlation to both risks. Maximum head rel. T1 y‐rot. (extension) and T1 x‐acceleration showed a correlation
with the risk of symptoms >1 month. When one of 17 data points was disregarded in the regression analysis,
Nkm also correlated slightly with both risks. In general the correlations (r2 values) were higher for symptoms >1
month than PMI. Notably, HCT and HRV showed small or only limited correlation to the risks.
The number of insurance claims were about half for females (Table 4), and the symptom and impairment risk
estimates are less confident; maximum NIC, OC rel. T1 x‐displacement and head rel. T1 y‐rot. (extension) were
the only parameters showing a correlation at an r2 level above 0.40 with the risk estimates used in this study.
A mathematical method for selecting the most representative test when more than one test was available
for each seat group was neither developed nor used. The selection of the most representative test could have
introduced some bias. Therefore a complimentary analysis was carried out using the median value for each
parameter of all available seat test data for each seat group (Table 5). As can be seen by comparing the results
in Tables 3 and 5, differences in correlation values between the representative and median injury criteria and
the parameter values as measured in the dummy were small. When median values were used, the NIC appear
to correlate less to the risk of PMI and symptoms >1 month than when representative data were used. The
reverse was found for some of the other parameters, e.g. maximum L1 x‐acceleration and T1 x‐acceleration.
In Figs. 1‐4, the lines between data points show groups of seats with and without anti‐whiplash systems for
which grouped data were available. These lines were included to enable a comparison between parameter
values and calculated risks, with a reduced influence of factors such as chassis design characteristics of the car
make, car owner characteristics specific for the make and, in part, vehicle weight.
When anti‐whiplash systems were introduced all car producers reduced NIC values considerably with the
exception of the VW group (Fig. 1). The reduction in symptom and impairment risks for the VW group may have
been achieved by a combination of the reduction of other parameters or criteria values. Despite these
differences between seat groups, it appears that seat designs producing a NIC lower than 25 m2/s2 bear a risk of
less than approximately 7% of causing PMI (normalized to year 2005) following a rear‐end impact with initial
symptoms (Fig. 1).
TABLE 3 CORRELATION (R2) BETWEEN THE PEAK VALUE OF THE PARAMETERS AND SYMPTOM AND IMPAIRMENT RISKS FOR MALES AND
FEMALES TOGETHER, REPRESENTATIVE DATA. Table 3: Male and Female data/ Permanent Medical Impairment Symptoms > 1 monthParameter Complete Maximum Minimum Complete Maximum Minimum
NIC 0.59 0.72 0.51 0.72 0.75 0.63OC rel T1 x‐disp. (retraction) 0.42 0.48 0.35 0.39 0.52 0.33L1 x‐acc. 0.42 0.58 0.34 0.32 0.37 0.27Pelvis z‐acc. 0.40 0.51 0.20 0.19 0.28 0.11L1 z‐acc. 0.37 0.63 0.27 0.14 0.34 0.07Head rel. T1 y‐rot. (extension) 0.35 0.42 0.31 0.53 0.58 0.47Nkm 0.33 0.43 0.22 0.38 0.50 0.25T8 x‐acc. 0.28 0.42 0.20 0.29 0.45 0.21T8 z‐acc. 0.22 0.37 0.12 0.07 0.19 0.01U.N.Fx (head rw) 0.19 0.30 0.09 0.23 0.32 0.11L.N.Fx (head fw) 0.17 0.28 0.01 0.22 0.31 0.00L.N.My (negative) 0.16 0.24 0.08 0.20 0.30 0.09U.N.My (positive) 0.15 0.22 0.06 0.04 0.09 0.00T1 x‐acc. 0.15 0.30 0.05 0.40 0.60 0.26
TABLE 4
IRC-13-15 IRCOBI Conference 2013
- 68 -

CORRELATION (R2) BETWEEN THE PEAK VALUE OF THE PARAMETERS AND SYMPTOM AND IMPAIRMENT RISKS FOR FEMALES ONLY, REPRESENTATIVE DATA.
Table 4: Female data/ Permanent Medical Impairment Symptoms > 1 monthParameter Complete Maximum Minimum Complete Maximum Minimum
NIC 0.34 0.44 0.21 0.69 0.75 0.59OC rel T1 x‐disp. (retraction) 0.31 0.46 0.22 0.20 0.24 0.14L1 x‐acc. 0.28 0.39 0.18 0.25 0.31 0.17Nkm 0.26 0.39 0.15 0.25 0.34 0.11T8 z‐acc. 0.25 0.33 0.15 0.22 0.34 0.13L.N.Fx (head fw) 0.20 0.32 0.01 0.27 0.36 0.02T1 y‐rot. (rearward) 0.19 0.29 0.08 0.20 0.33 0.10Pelvis z‐acc. 0.17 0.26 0.08 0.07 0.12 0.04Head rel. T1 y‐rot. (extension) 0.16 0.24 0.11 0.50 0.59 0.29L.N.Fz (tension) 0.15 0.38 0.08 0.00 0.05 0.00T8 x‐acc. 0.15 0.29 0.07 0.16 0.26 0.11
TABLE 5
CORRELATION (R2) BETWEEN THE PEAK VALUE OF THE PARAMETERS AND SYMPTOM AND IMPAIRMENT RISKS FOR MALES AND
FEMALES TOGETHER, MEDIAN DATA. Table 5: Male and Female data/ Permanent Medical Impairment Symptoms > 1 monthParameter Complete Maximum Minimum Complete Maximum Minimum
NIC 0.49 0.71 0.40 0.64 0.72 0.55L1 x‐acc. 0.43 0.57 0.39 0.45 0.51 0.40Pelvis z‐acc. 0.40 0.51 0.33 0.31 0.42 0.22OC rel T1 x‐disp. (retraction) 0.38 0.47 0.31 0.43 0.55 0.37Head rel. T1 y‐rot. (extension) 0.27 0.36 0.23 0.50 0.54 0.43T8 z‐acc. 0.23 0.45 0.16 0.05 0.19 0.00T1 y‐rot. (rearward) 0.23 0.33 0.18 0.09 0.17 0.03T1 x‐acc. 0.21 0.38 0.10 0.50 0.63 0.37L1 z‐acc. 0.20 0.43 0.15 0.16 0.47 0.07T8 x‐acc. 0.18 0.34 0.13 0.23 0.39 0.13Nkm 0.16 0.26 0.06 0.33 0.47 0.18Pelvis x‐acc. 0.16 0.25 0.05 0.11 0.18 0.01
Fig. 1. Risk of PMI and risk of symptoms >1 month versus maximum NIC for seventeen groups as defined in
Table 1 (average ± 1 SE). Representative dummy values were used for the two diagrams.
0.02
0.04
0.06
0.08
0.1
0.12
0.14
10 15 20 25 30 35 40
PMI versus NIC
Ris
k
NIC (m2/s2)
Ford
Hyundai
MercedesOpel
Peugeot
Saab STD older
Saab STD newer
Saab SAHR
Toyota STD
Toyota WIL
Volvo STD older
Volvo STD newer
Volvo WHIPS
VW STD small
VW STD medium
VW STD large VW RHR
0.06
0.08
0.1
0.12
0.14
0.16
0.18
10 15 20 25 30 35 40
Symptoms > 1 month versus NIC
Ris
k
NIC (m2/s2)
Ford
Hyundai
Mercedes Opel
PeugeotSaab STD older
Saab STD newer
Saab SAHR
Toyota STD
Toyota WIL
Volvo STD older
Volvo STD newer
Volvo WHIPS
VW STD small VW STD
medium
VW STD large
VW RHR
IRC-13-15 IRCOBI Conference 2013
- 69 -

Fig. 2. Risk of PMI versus maximum rearward Occipital Condyle rel. T1 x‐displacement (left) and maximum L1 x‐
acceleration (right) for seventeen groups as defined in Table 1 (average ± 1 SD). Representative dummy values
were used for the two diagrams.
A similar relationship also appears present for the maximum OC rel. T1 x‐displacement (Fig. 2) and maximum
L1 x‐acceleration (Fig. 3). For the former parameter it appears that approximately 20 mm retraction relative to
T1 as expressed in a rotating T1 coordinate system results in a risk of PMI of 7% or less when there are initial
symptoms. For the latter parameter it appears that L1 accelerations should be kept under about 11g to
maintain a risk of PMI below 7% in an occupant having had initial symptoms.
Correlation between the maximum T1 x‐acceleration and the risk of symptoms >1 month was increased
largely when one dataset was not used in the determination of correlation; maximum correlations (r2 values)
were then 0.60 and 0.63 (Tables 3 and 5). The low correlations obtained when all datasets were used were due
to relatively high T1 x‐accelerations measured in the Toyota seat with WIL (Fig. 3).
Fig. 3. Risk of symptoms >1 month versus maximum T1 x‐acceleration (left) and maximum upper neck shear
load (right) for seventeen groups (average ± 1 SE). Median dummy values were used.
Similar to the T1 x‐acceleration, the correlation between maximum upper neck shear load (U.N.Fx, head r.w.)
and the risk of symptoms >1 month improve when only 16 of the datasets were used in the analysis, although
not to the same extent (Tables 3 and 5). Fig. 3 indicates that the correlation improved significantly if two of the
datasets (Saab SAHR and Peugeot) were excluded from the analysis.
There seems to be no relationship between HCT and the risk of PMI or symptoms >1 month (Fig. 4) following
an accident causing initial symptoms. The diagrams, however, show that for all four car manufacturers, with
available data for both standard seats and seats with anti‐whiplash systems, the HCTs were lower for the seats
with the anti‐whiplash systems.
0.02
0.04
0.06
0.08
0.1
0.12
0.14
0 5 10 15 20 25 30 35 40
PMI versus OC rel. T1 x-disp.
Ris
k
OC rel. T1 x-disp. (retraction) (mm)
Ford
Hyundai
Mercedes
Opel
Peugeot
Saab STD older
Saab STD newer
Saab SAHR
Toyota STD
Toyota WIL
Volvo STD older
Volvo STD newer
Volvo WHIPS
VW STD small
VW STD medium
VW STD large
VW RHR
0.02
0.04
0.06
0.08
0.1
0.12
0.14
0 2 4 6 8 10 12 14 16
PMI versus L1 x-acc.
Ris
k
L1 x-acc. (g)
Ford
Hyundai
Mercedes
Opel
Peugeot
Saab STD older Saab STD
newer
Saab SAHR
Toyota STD
Toyota WIL
Volvo STD older Volvo STD
newer
Volvo WHIPS
VW STD small
VW STD medium
VW STD large VW RHR
0.06
0.08
0.1
0.12
0.14
0.16
0.18
8 10 12 14 16 18 20
Symptoms > 1 month versus T1 x-acc.
Ris
k
T1 x-acceleration (g)
Ford
Hyundai
MercedesOpel
Peugeot
Saab STD older
Saab STD newer
Saab SAHR Toyota
STD
Toyota WIL
Volvo STD older
Volvo STD newer
Volvo WHIPS
VW STD small VW STD
medium
VW STD large
VW RHR
0.06
0.08
0.1
0.12
0.14
0.16
0.18
0 50 100 150 200 250 300 350 400
Symptoms > 1 month versus U.N.Fx (head r.w.)
Ris
k
U.N.Fx (head r.w.) (N)
Ford
Hyundai
MercedesOpel
Peugeot
Saab STD older
Saab STD newer
Saab SAHR
Toyota STD
Toyota WIL
Volvo STD older
Volvo STD newer
Volvo WHIPS
VW STD smallVW STD
medium
VW STD large
VW RHR
IRC-13-15 IRCOBI Conference 2013
- 70 -

Fig. 4. Risk of PMI versus maximum head contact time for seventeen groups as defined in Table 1 (average ± 1
SE). Median dummy values were used. Linear regression line fitted.
IV. DISCUSSION
By grouping seat models with and without anti‐whiplash designs for each car manufacturer, a better
statistical analysis could be performed than if individual seat models were compared. To minimize any
influence of car mass or car body structure, vehicles with similar weight and vehicle body characteristics for
each car manufacturer were grouped. The anti‐whiplash designs included in the analysis were designed to
reduce head‐to‐head restraint distance, yield or absorb energy, or both, in a controlled manner. By using
insurance data, we can conclude that the anti‐whiplash seat designs reduce the risk of sustaining whiplash
injuries. Saab showed a reduction of 46%, Toyota a reduction of 26%, VW group (medium) a reduction of 27%
and Volvo a reduction of 59% of PMIs (Fig. 1). By analyzing results, one can make the following observations:
‐ Saab has managed to lower the value for all parameters measured by introducing SAHR except for
maximum rearward T1 angular displacement and lower neck load compression.
‐ Toyota managed to lower the values of all parameters measured except for some of the neck loads.
‐ Volvo reduced all parameters measured except for maximum compressive neck loads. The head contact
time (HCT) varied considerably between tests with Volvo WHIPSs seats.
‐ VW group RHR seats were found to have lower values for some of the parameters studied than VW
non‐reactive seats. An example of this is the criteria of lower neck loads (LNL).
The analysis of these four car groups indicates that, by a general reduction of dummy measurements, the
risk of WAD can be substantially reduced. Criteria that appear to better explain WAD‐risk were NIC and
maximum OC rel. T1 x‐displacement (Figs. 1 and 2).
For evaluation of the robustness of the analysis, other groups were included in the analysis. They consisted
of Hyundai, Ford, large and small VWs, Mercedes, Opel, Peugeot, and popular but older Saab and Volvo models.
The regression analysis including these seats (Table 5) indicated that NIC, L1 x‐acceleration and maximum OC
rel. T1 x‐displacement predicted the risk of PMI as well as the risk of symptoms >1 month following a rear‐end
impact.
These findings are in partial agreement with other studies on this matter [1, 4, 5, 8], which suggested that
the NIC is suitable for assessing seat performance in rear‐end impacts. Other parameters could predict the risk
of symptoms >1 month when suspected outliers were removed (Table 3 and Fig. 3). For T1 x‐acceleration the
correlation was 0.60 when the Toyota seat with a WIL dataset was disregarded in the analysis. Possibly the T1 x‐
acceleration can be used to predict risk of symptoms and impairments; this suggestion is in line with those put
forth by Linder et al. [1]. For Head rel. T1 y‐rot. (extension) the correlation was 0.58 when the Opel dataset was
disregarded.
Ono et al. [8] drew, with some exceptions, conclusions similar to those in this study; however, they used a
different approach. Ono and co‐authors reconstructed many rear‐end impacts using a detailed mathematical
human model. Their study suggested that the NIC and neck loads, especially upper neck shear load and moment
and lower neck axial load, should be used in the evaluation of seat performance in rear‐end impacts.
The findings of the present study were, however, not in line with the study by Zuby and Farmer [7], who
found no correlation between dummy measurements and claim rates. A few tentative explanations for these
0.02
0.04
0.06
0.08
0.1
0.12
0.14
60 65 70 75 80 85 90 95 100
PMI versus HCT
Ris
k
HCT (ms)
Ford
Hyundai
Mercedes
Opel
Peugeot
Saab STD older
Saab STD newer
Saab SAHR
Toyota STD
Toyota WIL
Volvo STD older
Volvo STD newer
Volvo WHIPS
VW STD small
VW STD medium
VW STD large
VW RHR
IRC-13-15 IRCOBI Conference 2013
- 71 -

differences have been found. First, in their study the number of insurance cases for most of the car models was
high. However, for some car models included in their analysis, only 30 cases of rear‐end impacts were available
in the insurance database. The estimated risks for these models were uncertain, since the outcome of a single
accident can greatly influence the estimated risks used in the correlation study. Second, there are probably
variations in the insurance data between the study by Zuby and Farmer and the present study. These variations
could be associated with differences in injury coding, such as in compensation for property damage,
compensation for injury claims, and the social welfare system. Third, in the present study representative sled
test datasets were used in the analysis for some of the groups included. However, this was done only when
there was more than one crash test dataset available for a particular vehicle model, or when the dataset first
selected provided results deemed an outlier in comparison with the median values of the datasets for the same
group. For most groups the selection of dataset used in the analysis was based on facts unrelated to parameter
values. Fourth, Zuby and Farmer used risk of symptoms in rear‐end impacts, whereas this study used risk of
persistent symptoms when occupants exhibited initial symptoms following rear‐end impacts. While these four
differences may be small, they can, in combination with methods used to assess correlations in these two
studies, both known to be very sensitive to outliers, provide a very different level of correlation, and as such,
explain the divergence between the two studies.
In general BioRID II datasets from Thatcham were given priority since they had access to an H‐point machine
with an HRMD very close in its dimensions to the standard tool used today. The Thatcham datasets thereby
enable the inclusion of tests carried out more recently. Two datasets were included in this analysis for which an
older and uncalibrated H‐point machine with HRMD was used (Table 2). When multiple tests from Thatcham
providing fair seat performance data were available for a group, the number of accidents with initial symptoms
was used to select the test to be used in further analyses. The test associated with the largest number of entries
in the insurance database for the group was used. Despite this selection process, a “representative” dataset for
some groups was chosen and used in the analysis of correlation. This occurred when more than one dataset was
available for a particular vehicle model from Thatcham, or when the dataset first selected provided results
deemed as outliers compared with the median values of the datasets for the same group. This selection
procedure could have contributed to the fact that we could identify correlations, whereas studies in the past
could not.
By introducing the fourth mentioned selection, we facilitated the inclusion of the more representative tests
in the correlation analysis. The differences between the seats within one single seat group could be due to
introductions of small changes in design over the time span. These differences could be due to foam thickness,
foam properties, fabric selection, etc. In addition to these reasons, other sources of variability were present
during the seat testing, which justify the seat dataset selection approach used here. The largest source was
most likely introduced by the lack of calibration routines for the H‐point machine and HRMD used at the time of
testing. The test data used in this study were generated by two H‐point machines which could probably explain
the differences in the head‐to‐head restraint distances measured. Another source was the use of two BioRID II
versions. The differences between the two build levels were mainly in the position of the spine in relation to the
flesh surface.
The sled test data used in this study were generated in different laboratories using almost identical test
conditions. In time, some dissimilarities in the test conditions have been identified, which could explain some of
the variability observed. This variability introduces errors in the estimates in the present study. It is assumed
that a better correlation would be obtained if all seat tests were carried out using the latest test protocol.
In a comparison of real life data and seat test data using individual car model data [10], it was clear that the
confidence interval sizes were large in comparison to the range of estimated risk. Hence, it was judged that an
analysis using individual car model data is not possible at present.
The main findings of this study are somewhat different from an earlier study using similar methods and data
[9]. There are several reasons for this. First, all injury claim data used in this study have been adjusted to the
classification of injuries used in 2005, whereas in [9] it was not. Second, there were seventeen groups in this
study as compared with twelve in [9]. The inclusion of test and insurance data from older vehicle models
introduces challenges; the parameter values were estimated using the BioRID II for seats with a broader
spectrum of performance in this study than in the previous studies. The findings in this study confirm those
found in [10].
IRC-13-15 IRCOBI Conference 2013
- 72 -
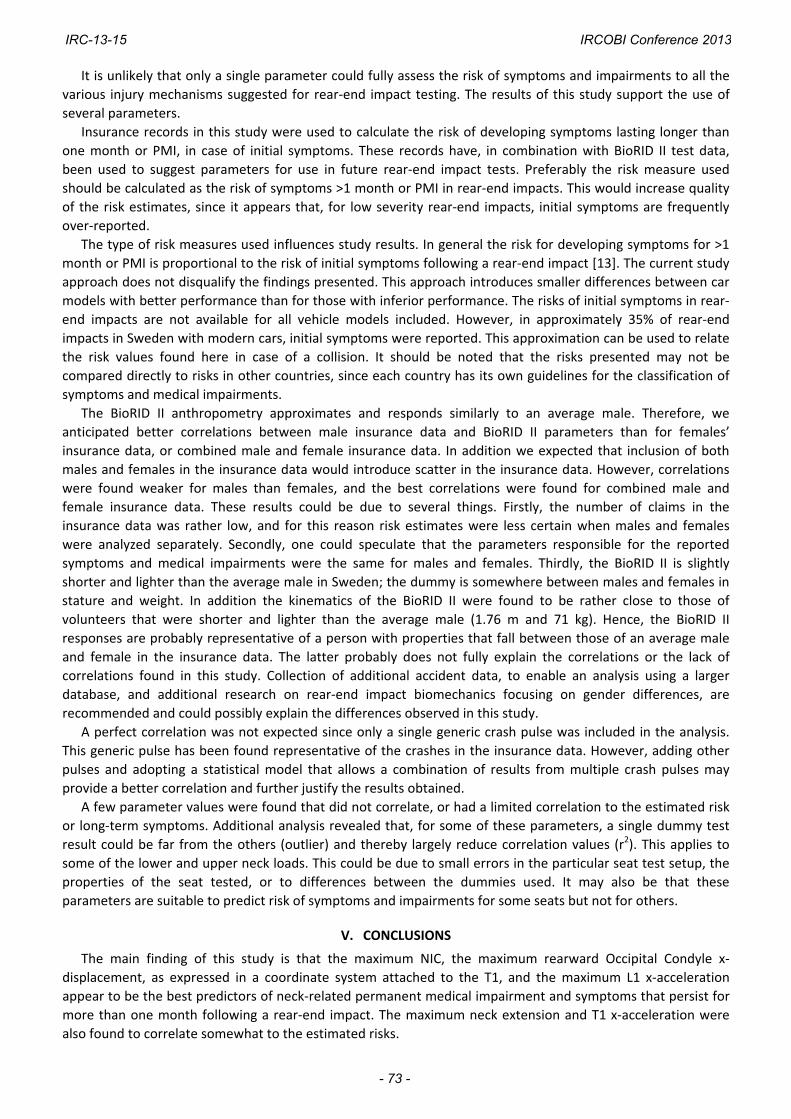
It is unlikely that only a single parameter could fully assess the risk of symptoms and impairments to all the
various injury mechanisms suggested for rear‐end impact testing. The results of this study support the use of
several parameters.
Insurance records in this study were used to calculate the risk of developing symptoms lasting longer than
one month or PMI, in case of initial symptoms. These records have, in combination with BioRID II test data,
been used to suggest parameters for use in future rear‐end impact tests. Preferably the risk measure used
should be calculated as the risk of symptoms >1 month or PMI in rear‐end impacts. This would increase quality
of the risk estimates, since it appears that, for low severity rear‐end impacts, initial symptoms are frequently
over‐reported.
The type of risk measures used influences study results. In general the risk for developing symptoms for >1
month or PMI is proportional to the risk of initial symptoms following a rear‐end impact [13]. The current study
approach does not disqualify the findings presented. This approach introduces smaller differences between car
models with better performance than for those with inferior performance. The risks of initial symptoms in rear‐
end impacts are not available for all vehicle models included. However, in approximately 35% of rear‐end
impacts in Sweden with modern cars, initial symptoms were reported. This approximation can be used to relate
the risk values found here in case of a collision. It should be noted that the risks presented may not be
compared directly to risks in other countries, since each country has its own guidelines for the classification of
symptoms and medical impairments.
The BioRID II anthropometry approximates and responds similarly to an average male. Therefore, we
anticipated better correlations between male insurance data and BioRID II parameters than for females’
insurance data, or combined male and female insurance data. In addition we expected that inclusion of both
males and females in the insurance data would introduce scatter in the insurance data. However, correlations
were found weaker for males than females, and the best correlations were found for combined male and
female insurance data. These results could be due to several things. Firstly, the number of claims in the
insurance data was rather low, and for this reason risk estimates were less certain when males and females
were analyzed separately. Secondly, one could speculate that the parameters responsible for the reported
symptoms and medical impairments were the same for males and females. Thirdly, the BioRID II is slightly
shorter and lighter than the average male in Sweden; the dummy is somewhere between males and females in
stature and weight. In addition the kinematics of the BioRID II were found to be rather close to those of
volunteers that were shorter and lighter than the average male (1.76 m and 71 kg). Hence, the BioRID II
responses are probably representative of a person with properties that fall between those of an average male
and female in the insurance data. The latter probably does not fully explain the correlations or the lack of
correlations found in this study. Collection of additional accident data, to enable an analysis using a larger
database, and additional research on rear‐end impact biomechanics focusing on gender differences, are
recommended and could possibly explain the differences observed in this study.
A perfect correlation was not expected since only a single generic crash pulse was included in the analysis.
This generic pulse has been found representative of the crashes in the insurance data. However, adding other
pulses and adopting a statistical model that allows a combination of results from multiple crash pulses may
provide a better correlation and further justify the results obtained.
A few parameter values were found that did not correlate, or had a limited correlation to the estimated risk
or long‐term symptoms. Additional analysis revealed that, for some of these parameters, a single dummy test
result could be far from the others (outlier) and thereby largely reduce correlation values (r2). This applies to
some of the lower and upper neck loads. This could be due to small errors in the particular seat test setup, the
properties of the seat tested, or to differences between the dummies used. It may also be that these
parameters are suitable to predict risk of symptoms and impairments for some seats but not for others.
V. CONCLUSIONS
The main finding of this study is that the maximum NIC, the maximum rearward Occipital Condyle x‐
displacement, as expressed in a coordinate system attached to the T1, and the maximum L1 x‐acceleration
appear to be the best predictors of neck‐related permanent medical impairment and symptoms that persist for
more than one month following a rear‐end impact. The maximum neck extension and T1 x‐acceleration were
also found to correlate somewhat to the estimated risks.
IRC-13-15 IRCOBI Conference 2013
- 73 -

Grouped insurance data, based on similarities in the seat system design, were useful since they allowed the
establishment of larger groups, which reduced uncertainties in the estimated risks.
The following limits are recommended for use in rear‐end impact seat tests with the BioRID II (version g) and
when the medium IIWPG crash pulse is used: NIC 25 m2/s2, maximum L1 x‐acceleration 120 m/s2 and maximum
Occipital Condyle x‐displacement 22 mm. The limits suggested are based on the performance of the groups of
seats included in this study. These limits would separate seat models with fair performance from those with
moderate to good performance. Other parameters are not ruled out; they may be found useful in seat
performance tests when a larger dataset becomes available and when new seat tests are carried out using the
latest test routines, a calibrated H‐point machine and the newest dummy version.
VI. ACKNOWLEDGEMENT
The authors wish to thank Thatcham and Autoliv for providing crash test data.
VII. REFERENCES
[1] Linder A, Avery M, Kullgren A, Kraft M, Real‐world rear impacts reconstructed in sled tests, Proceedings of IRCOBI Conference, Graz, Austria, pp. 233‐244, 2004.
[2] Boström O, Svensson M, et al, A new neck injury criterion candidate based on injury findings in the cervical spinal ganglia after experimental neck extension trauma, Proceedings of IRCOBI Conference, Dublin, Ireland, pp. 123‐136, 1996.
[3] Schmitt K‐U, Muser M, Walz F, Niederer P, Nkm — a proposal for a neck protection criterion for low speed rear‐end impacts, Traffic Injury Prevention, 3(2):117‐126, 2002.
[4] Cappon H, Hell W, Hoschopf H, Muser M, Wismans J, Correlation of accident statistics to whiplash performance parameters using the RID 3D and BioRID dummy, Proceedings of IRCOBI Conference, Prague, Czech Republic, pp. 229‐243, 2005.
[5] Boström O, Kullgren A, Characteristics of anti‐whiplash seat designs with good real‐life performance, Proceedings of IRCOBI Conference, Maastricht, Netherlands, pp. 219‐23, 2007.
[6] Farmer C M, Zuby D S, Wells J K, Hellinga L A, Relationship of dynamic seat ratings to real‐world neck injury rates, Traffic Injury Prevention, 9(6):561–567, 2008.
[7] Zuby D S, Farmer C M, Relationship between seat ratings test results and neck injury rates in rear crashes, Proceedings of Whiplash – Neck Pain in Car Crashes, Munich, Germany, pp. 1‐11, 2008. Internet: http://www.iihs.org/research/topics/pdf/mf1709.pdf, accessed May 30th 2013.
[8] Ono K, Ejima S, et al, Evaluation criteria for the reduction of minor neck injuries during rear‐end impacts based on human volunteer experiments and accident reconstruction using human FE model simulations, Proceedings of IRCOBI Conference, York, UK, pp. 381‐398, 2009.
[9] Davidsson J, Kullgren A, Evaluation of seat performance criteria for rear‐end impact testing, Proceedings of ESV Conference, Washington D.C., USA, Paper No. 11‐0373, 2011.
[10] Davidsson J, Kullgren A, EEVC WG12 final report: Evaluation of Seat Performance Criteria for Rear‐end Impact Testing; On behalf of the European Enhanced Vehicle‐safety Committee (EEVC), Working Group 12, 2013, In preparation for online publication.
[11] Krafft M, Kullgren A, Ydenius A, Tingvall C, Influence of crash pulse characteristics on whiplash associated disorders in rear impacts, Traffic Injury Prevention, 3(2):141‐149, 2002.
[12] Krafft M, Kullgren A, Malm S, Ydenius A, Influence of crash severity on various whiplash injury symptoms: A study based on real‐life rear‐end crashes with recorded crash pulses, Proceedings of ESV Conference, Washington D.C. No. 05‐0363, 2005.
[13] Kullgren A, Krafft M, Gender analysis on whiplash seat effectiveness: Results from real‐world crashes, Proceedings of IRCOBI Conference, Hannover, Germany, pp. 17‐28, 2010.
IRC-13-15 IRCOBI Conference 2013
- 74 -
VIII. APPENDIX
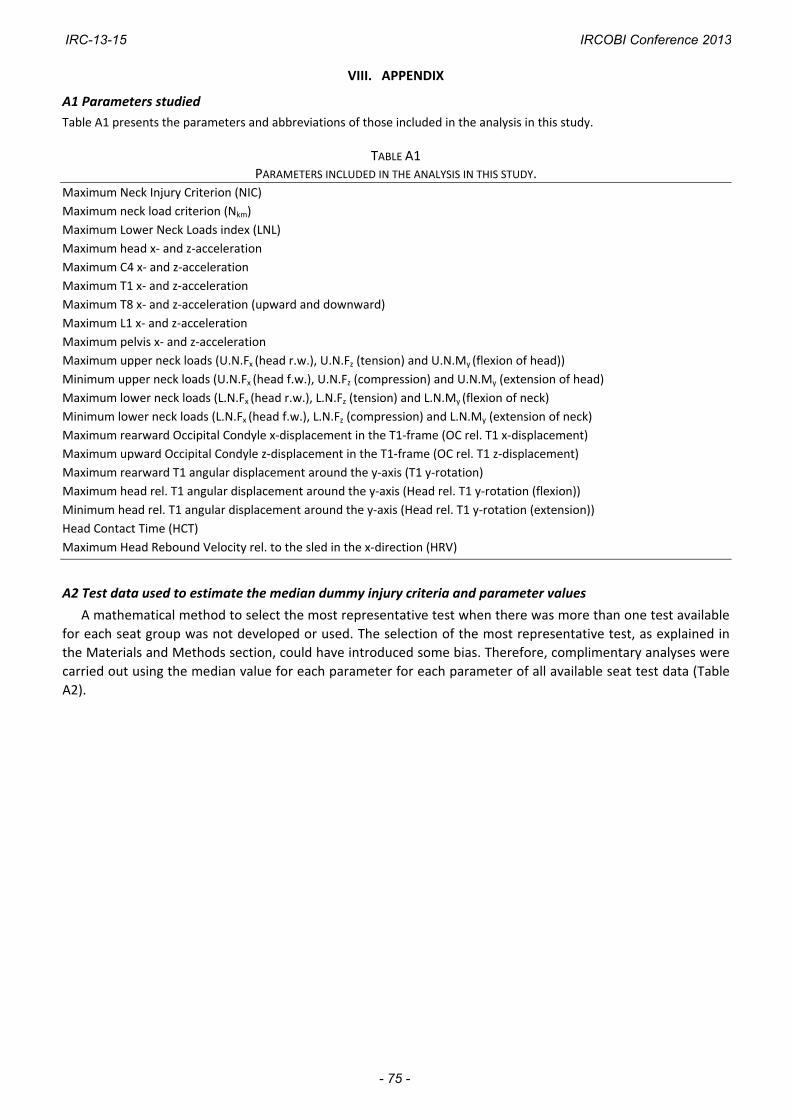
A1 Parameters studied
Table A1 presents the parameters and abbreviations of those included in the analysis in this study.
TABLE A1 PARAMETERS INCLUDED IN THE ANALYSIS IN THIS STUDY.
Maximum Neck Injury Criterion (NIC)
Maximum neck load criterion (Nkm)
Maximum Lower Neck Loads index (LNL)
Maximum head x‐ and z‐acceleration
Maximum C4 x‐ and z‐acceleration
Maximum T1 x‐ and z‐acceleration
Maximum T8 x‐ and z‐acceleration (upward and downward)
Maximum L1 x‐ and z‐acceleration
Maximum pelvis x‐ and z‐acceleration
Maximum upper neck loads (U.N.Fx (head r.w.), U.N.Fz (tension) and U.N.My (flexion of head))
Minimum upper neck loads (U.N.Fx (head f.w.), U.N.Fz (compression) and U.N.My (extension of head)
Maximum lower neck loads (L.N.Fx (head r.w.), L.N.Fz (tension) and L.N.My (flexion of neck)
Minimum lower neck loads (L.N.Fx (head f.w.), L.N.Fz (compression) and L.N.My (extension of neck)
Maximum rearward Occipital Condyle x‐displacement in the T1‐frame (OC rel. T1 x‐displacement)
Maximum upward Occipital Condyle z‐displacement in the T1‐frame (OC rel. T1 z‐displacement)
Maximum rearward T1 angular displacement around the y‐axis (T1 y‐rotation)
Maximum head rel. T1 angular displacement around the y‐axis (Head rel. T1 y‐rotation (flexion))
Minimum head rel. T1 angular displacement around the y‐axis (Head rel. T1 y‐rotation (extension))
Head Contact Time (HCT)
Maximum Head Rebound Velocity rel. to the sled in the x‐direction (HRV)
A2 Test data used to estimate the median dummy injury criteria and parameter values
A mathematical method to select the most representative test when there was more than one test available
for each seat group was not developed or used. The selection of the most representative test, as explained in
the Materials and Methods section, could have introduced some bias. Therefore, complimentary analyses were
carried out using the median value for each parameter for each parameter of all available seat test data (Table
A2).
IRC-13-15 IRCOBI Conference 2013
- 75 -
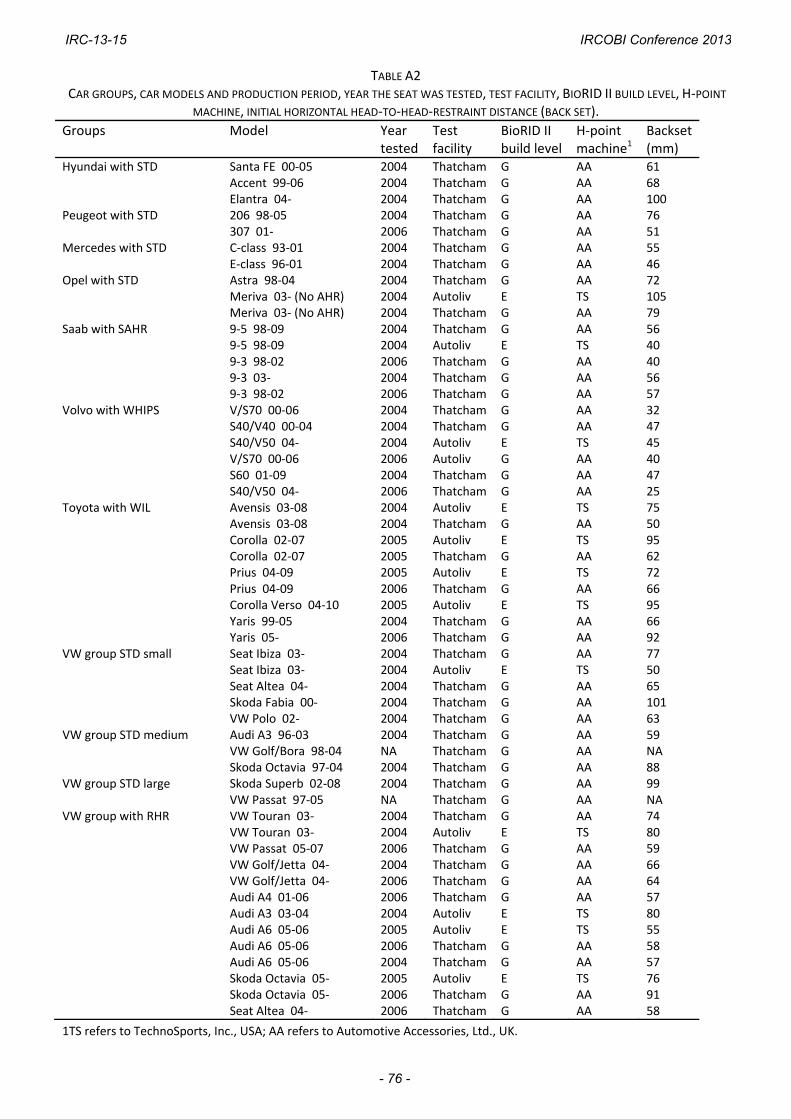
TABLE A2 CAR GROUPS, CAR MODELS AND PRODUCTION PERIOD, YEAR THE SEAT WAS TESTED, TEST FACILITY, BIORID II BUILD LEVEL, H‐POINT
MACHINE, INITIAL HORIZONTAL HEAD‐TO‐HEAD‐RESTRAINT DISTANCE (BACK SET).
Groups Model Year tested
Test facility
BioRID II build level
H‐point machine1
Backset (mm)
Hyundai with STD Santa FE 00‐05 2004 Thatcham G AA 61 Accent 99‐06 2004 Thatcham G AA 68 Elantra 04‐ 2004 Thatcham G AA 100Peugeot with STD 206 98‐05 2004 Thatcham G AA 76 307 01‐ 2006 Thatcham G AA 51Mercedes with STD C‐class 93‐01 2004 Thatcham G AA 55 E‐class 96‐01 2004 Thatcham G AA 46Opel with STD Astra 98‐04 2004 Thatcham G AA 72 Meriva 03‐ (No AHR) 2004 Autoliv E TS 105 Meriva 03‐ (No AHR) 2004 Thatcham G AA 79Saab with SAHR 9‐5 98‐09 2004 Thatcham G AA 56 9‐5 98‐09 2004 Autoliv E TS 40 9‐3 98‐02 2006 Thatcham G AA 40 9‐3 03‐ 2004 Thatcham G AA 56 9‐3 98‐02 2006 Thatcham G AA 57Volvo with WHIPS V/S70 00‐06 2004 Thatcham G AA 32 S40/V40 00‐04 2004 Thatcham G AA 47 S40/V50 04‐ 2004 Autoliv E TS 45 V/S70 00‐06 2006 Autoliv G AA 40 S60 01‐09 2004 Thatcham G AA 47 S40/V50 04‐ 2006 Thatcham G AA 25Toyota with WIL Avensis 03‐08 2004 Autoliv E TS 75 Avensis 03‐08 2004 Thatcham G AA 50 Corolla 02‐07 2005 Autoliv E TS 95 Corolla 02‐07 2005 Thatcham G AA 62 Prius 04‐09 2005 Autoliv E TS 72 Prius 04‐09 2006 Thatcham G AA 66 Corolla Verso 04‐10 2005 Autoliv E TS 95 Yaris 99‐05 2004 Thatcham G AA 66 Yaris 05‐ 2006 Thatcham G AA 92VW group STD small Seat Ibiza 03‐ 2004 Thatcham G AA 77 Seat Ibiza 03‐ 2004 Autoliv E TS 50 Seat Altea 04‐ 2004 Thatcham G AA 65 Skoda Fabia 00‐ 2004 Thatcham G AA 101 VW Polo 02‐ 2004 Thatcham G AA 63VW group STD medium Audi A3 96‐03 2004 Thatcham G AA 59 VW Golf/Bora 98‐04 NA Thatcham G AA NA Skoda Octavia 97‐04 2004 Thatcham G AA 88VW group STD large Skoda Superb 02‐08 2004 Thatcham G AA 99 VW Passat 97‐05 NA Thatcham G AA NAVW group with RHR VW Touran 03‐ 2004 Thatcham G AA 74 VW Touran 03‐ 2004 Autoliv E TS 80 VW Passat 05‐07 2006 Thatcham G AA 59 VW Golf/Jetta 04‐ 2004 Thatcham G AA 66 VW Golf/Jetta 04‐ 2006 Thatcham G AA 64 Audi A4 01‐06 2006 Thatcham G AA 57 Audi A3 03‐04 2004 Autoliv E TS 80 Audi A6 05‐06 2005 Autoliv E TS 55 Audi A6 05‐06 2006 Thatcham G AA 58 Audi A6 05‐06 2004 Thatcham G AA 57 Skoda Octavia 05‐ 2005 Autoliv E TS 76 Skoda Octavia 05‐ 2006 Thatcham G AA 91 Seat Altea 04‐ 2006 Thatcham G AA 58
1TS refers to TechnoSports, Inc., USA; AA refers to Automotive Accessories, Ltd., UK.
IRC-13-15 IRCOBI Conference 2013
- 76 -