Seasonal variation of nitrogen oxides in the central North Atlantic
15
Seasonal variation of nitrogen oxides in the central North Atlantic lower free troposphere M. Val Martin, 1,2 R. E. Honrath, 1 R. C. Owen, 1 and Q. B. Li 3 Received 7 December 2007; revised 14 May 2008; accepted 20 June 2008; published 6 September 2008. [1] Measurements of NO, NO 2 , and NO y (total reactive nitrogen oxides) made at the Pico Mountain station, 38.47°N, 28.40°W, 2.2 km above sea level, from July 2002 to August 2005 are used to characterize the seasonal and diurnal variations of nitrogen oxides in the background lower free troposphere (FT) over the central North Atlantic Ocean. These observations reveal a well-defined seasonal cycle of nitrogen oxides (NO x = NO + NO 2 and NO y ), with higher mixing ratios during the summertime. Observed NO x and NO y levels are consistent with long-range transport of emissions, with significant removal en route to the measurement site. Larger summertime nitrogen oxides levels are attributed to boreal wildfire emissions and more efficient export and transport of NO y from eastern North America during that season. In addition, measurements of NO x and NO y obtained during in-cloud and cloud-free conditions are used to estimate PAN and HNO 3 mixing ratios and examine the partitioning of the reactive nitrogen species. These estimates indicate that reactive nitrogen over the central North Atlantic lower FT largely exists in the form of PAN and HNO 3 (80–90% of NO y ) year-round. The composition of NO y shifts from dominance of PAN in winter-spring to dominance of HNO 3 in summer-fall, as a result of changes in temperature and photochemistry over the region. A further comparison of the nitrogen oxides measurements with results from the global chemical transport model GEOS-Chem finds that simulated nitrogen oxides are significantly larger than the observations. Citation: Val Martin, M., R. E. Honrath, R. C. Owen, and Q. B. Li (2008), Seasonal variation of nitrogen oxides in the central North Atlantic lower free troposphere, J. Geophys. Res., 113, D17307, doi:10.1029/2007JD009688. 1. Introduction [2] Reactive nitrogen species are critical to the chemistry of the atmosphere. Photochemical production of O 3 depends on the levels of NO x (NO + NO 2 ), which in turn, influences the concentration of tropospheric OH. Species that affect OH are important, as reaction with OH provides the dominant path for removal of a variety of atmospheric pollutants [Crutzen, 1979; Logan, 1983]. In addition, nitric acid, the primary end product of NO x oxidation, is one of the major components of acid deposition [Crutzen, 1979]. [3] Understanding the impact of NO x on tropospheric O 3 on a global scale is important for several reasons. Tropo- spheric ozone is considered the third most important anthropogenic greenhouse gas [Intergovernmental Panel on Climate Change, 2007]. In addition, slightly elevated levels of O 3 , at concentrations not far above current ambient levels in many regions, pose a serious concern because of their effects on the human respiratory system and ecosystems [Environmental Protection Agency (EPA), 2006]. In particular, there is an increasing concern regard- ing intercontinental transport of O 3 pollution since it appears to be changing the composition of the background troposphere [Simmonds et al., 2004; Jaffe et al., 2003] and making it more difficult for countries downwind to achieve their air quality standards [Li et al., 2002; Derwent et al., 2004]. [4] In the Northern Hemisphere, emissions of nitrogen oxides are dominated by anthropogenic sources in urban and industrial regions [e.g., Logan, 1983; Richter et al., 2005]. In addition, as a result of increased area burned and fire frequency over the boreal region [Kasischke and Turetsky, 2006], emissions from boreal wildfires have resulted in a significant source of NO x to the atmosphere during the summer season [Goode et al., 2000; Andreae and Merlet, 2001]. The impact of NO x emissions from these sources on global O 3 is limited as oxidation of NO x to HNO 3 , peroxyacetyl nitrate (PAN) and other minor com- pounds occurs in less than 1 day in the continental boundary layer (BL). However, the rates of O 3 production show a complex nonlinear dependence on NO x [Liu et al., 1987]. This means that the number of O 3 molecules produced per molecule of NO x consumed, known as the O 3 production efficiency, is greater for lower NO x levels. As a result, the export of only a small fraction of emitted NO x may lead to JOURNAL OF GEOPHYSICAL RESEARCH, VOL. 113, D17307, doi:10.1029/2007JD009688, 2008 Click Here for Full Articl e 1 Department of Civil and Environmental Engineering, Michigan Technological University, Houghton, Michigan, USA. 2 Now at School of Engineering and Applied Science, Harvard University, Cambridge, Massachusetts, USA. 3 Jet Propulsion Laboratory, California Institute of Technology, Pasadena, California, USA. Copyright 2008 by the American Geophysical Union. 0148-0227/08/2007JD009688$09.00 D17307 1 of 15
Transcript of Seasonal variation of nitrogen oxides in the central North Atlantic

Seasonal variation of nitrogen oxides in the central
North Atlantic lower free troposphere
M. Val Martin,1,2 R. E. Honrath,1 R. C. Owen,1 and Q. B. Li3
Received 7 December 2007; revised 14 May 2008; accepted 20 June 2008; published 6 September 2008.
[1] Measurements of NO, NO2, and NOy (total reactive nitrogen oxides) made at thePico Mountain station, 38.47�N, 28.40�W, 2.2 km above sea level, from July 2002 toAugust 2005 are used to characterize the seasonal and diurnal variations of nitrogen oxidesin the background lower free troposphere (FT) over the central North Atlantic Ocean.These observations reveal a well-defined seasonal cycle of nitrogen oxides (NOx = NO +NO2 and NOy), with higher mixing ratios during the summertime. Observed NOx and NOy
levels are consistent with long-range transport of emissions, with significant removalen route to the measurement site. Larger summertime nitrogen oxides levels are attributedto boreal wildfire emissions and more efficient export and transport of NOy from easternNorth America during that season. In addition, measurements of NOx and NOy obtainedduring in-cloud and cloud-free conditions are used to estimate PAN and HNO3 mixingratios and examine the partitioning of the reactive nitrogen species. These estimatesindicate that reactive nitrogen over the central North Atlantic lower FT largely exists in theform of PAN and HNO3 (�80–90% of NOy) year-round. The composition of NOy shiftsfrom dominance of PAN in winter-spring to dominance of HNO3 in summer-fall, as aresult of changes in temperature and photochemistry over the region. A further comparisonof the nitrogen oxides measurements with results from the global chemical transportmodel GEOS-Chem finds that simulated nitrogen oxides are significantly larger than theobservations.
Citation: Val Martin, M., R. E. Honrath, R. C. Owen, and Q. B. Li (2008), Seasonal variation of nitrogen oxides in the central North
Atlantic lower free troposphere, J. Geophys. Res., 113, D17307, doi:10.1029/2007JD009688.
1. Introduction
[2] Reactive nitrogen species are critical to the chemistryof the atmosphere. Photochemical production of O3 dependson the levels of NOx (NO + NO2), which in turn, influencesthe concentration of tropospheric OH. Species that affectOH are important, as reaction with OH provides thedominant path for removal of a variety of atmosphericpollutants [Crutzen, 1979; Logan, 1983]. In addition, nitricacid, the primary end product of NOx oxidation, is one ofthe major components of acid deposition [Crutzen, 1979].[3] Understanding the impact of NOx on tropospheric O3
on a global scale is important for several reasons. Tropo-spheric ozone is considered the third most importantanthropogenic greenhouse gas [Intergovernmental Panelon Climate Change, 2007]. In addition, slightly elevatedlevels of O3, at concentrations not far above currentambient levels in many regions, pose a serious concern
because of their effects on the human respiratory systemand ecosystems [Environmental Protection Agency (EPA),2006]. In particular, there is an increasing concern regard-ing intercontinental transport of O3 pollution since itappears to be changing the composition of the backgroundtroposphere [Simmonds et al., 2004; Jaffe et al., 2003] andmaking it more difficult for countries downwind to achievetheir air quality standards [Li et al., 2002; Derwent et al.,2004].[4] In the Northern Hemisphere, emissions of nitrogen
oxides are dominated by anthropogenic sources in urbanand industrial regions [e.g., Logan, 1983; Richter et al.,2005]. In addition, as a result of increased area burnedand fire frequency over the boreal region [Kasischke andTuretsky, 2006], emissions from boreal wildfires haveresulted in a significant source of NOx to the atmosphereduring the summer season [Goode et al., 2000; Andreae andMerlet, 2001]. The impact of NOx emissions from thesesources on global O3 is limited as oxidation of NOx toHNO3, peroxyacetyl nitrate (PAN) and other minor com-pounds occurs in less than 1 day in the continental boundarylayer (BL). However, the rates of O3 production show acomplex nonlinear dependence on NOx [Liu et al., 1987].This means that the number of O3 molecules produced permolecule of NOx consumed, known as the O3 productionefficiency, is greater for lower NOx levels. As a result, theexport of only a small fraction of emitted NOx may lead to
JOURNAL OF GEOPHYSICAL RESEARCH, VOL. 113, D17307, doi:10.1029/2007JD009688, 2008ClickHere
for
FullArticle
1Department of Civil and Environmental Engineering, MichiganTechnological University, Houghton, Michigan, USA.
2Now at School of Engineering and Applied Science, HarvardUniversity, Cambridge, Massachusetts, USA.
3Jet Propulsion Laboratory, California Institute of Technology,Pasadena, California, USA.
Copyright 2008 by the American Geophysical Union.0148-0227/08/2007JD009688$09.00
D17307 1 of 15

significant O3 production in the remote troposphere [Jacobet al., 1993]. The export of NOx away from source regionsis facilitated by the export of PAN, a thermally unstable,nearly insoluble species, out of the continental BL, followedby the transport of PAN on a global scale at cold temper-atures, and decomposition to NOx as the air masses becomewarmer [Moxim et al., 1996]. It has been suggested that,similar to PAN, the export of HNO3 followed by photolysis toNOx can be an important source of NOx even in the lowertroposphere [Neuman et al., 2006]. Thus, quantifying themagnitude of nitrogen oxides and their chemical evolution inthe remote troposphere is fundamental to understanding theimpact of anthropogenic emissions on the global O3 budget.[5] Field measurement campaigns have been conducted
in the last two decades to characterize the spatial andtemporal distribution of tropospheric NOx and to determinethe resulting effect of NOx emissions on the O3 budget.However, data composites of results from many of thesecampaigns show that the spatial and temporal coverage ofremote tropospheric NOx measurements is still quite sparseand reflects a strong seasonal and regional bias [e.g.,Emmons et al., 1997, 2000; Bradshaw et al., 2000;DiNunno et al., 2003].[6] In addition to measurement campaigns, global chem-
ical transport models (CTM) have been developed to derivethe global impact of anthropogenic and boreal wildfireemissions on the O3 budget. However, it is difficult toassess the uncertainty of the resulting estimates, in particularthose related to NOx sources and photochemical processes.The evaluation of CTMs with nitrogen oxides observationsin the free troposphere (FT) has been limited by a lack ofdata in remote regions [e.g., Thakur et al., 1999; Lawrenceand Crutzen, 1999].[7] Recently, satellite-derived data have been used to
derive global and regional NOx budgets [e.g., Leue et al.,2001; Martin et al., 2004; Jaegle et al., 2005; Richter et al.,2005] and detect intercontinental transport of nitrogenoxides plumes from boreal wildfires [Spichtinger et al.,2001] and anthropogenic sources [Wenig et al., 2003; Stohlet al., 2003]. More recently, satellite data have been used toevaluate CTMs [e.g., Liu et al., 2006; Chandra et al., 2004].However, limited measurements of nitrogen oxides in theremote lower FT make the evaluation of satellite-deriveddata difficult [Leue et al., 2001; Martin et al., 2004].[8] The data presented in this paper constitute a multiyear
record of NO, NOx, and NOy in the central North Atlanticlower FT determined at the Pico Mountain station. Thesedata are analyzed to characterize the seasonal and diurnalvariation of nitrogen oxides in the background lower FTover the central North Atlantic region. In addition, measure-ments of NOx and NOy made during in-cloud and cloud-freeconditions are used to estimate PAN and HNO3 levels andexamine the partitioning of the reactive nitrogen speciesover this region. Observations are also compared withsimulations from the CTM model GEOS-Chem to assessour current understanding of the fate and transport ofnitrogen oxides in the remote North Atlantic troposphere.Additional analyses are presented by Val Martin et al.[2008], in which we use these observations of nitrogenoxides in combination with simultaneous measurements ofCO and O3 to assess the degree to which transport ofanthropogenic and boreal wildfire emissions affect nitrogen
oxides levels and the resulting implications for the hemi-spheric NOx and O3 budgets.
2. Methodology
[9] Measurements of NO, NO2, NOy were made at thePico Mountain station during extensive periods of timefrom 20 July 2002 to 25 August 2005. We present heremeasurements of nitrogen oxides analyzed in combinationwith measurements of CO also made at the Pico Mountainstation. Because the Pico Mountain station and measure-ment details have already been described elsewhere[Honrath et al., 2004; Kleissl et al., 2007; Owen et al.,2006; Val Martin et al., 2006], only a brief summary of themost relevant experimental aspects is presented here.
2.1. Measurement Site
[10] The Pico Mountain station is located on the summitof Pico mountain (2.2 km above sea level) in the AzoresIslands, Portugal (38.47�N, 28.40�W). During all seasons,the station is well above the regional marine boundary layer,which is typically less than 1 km in height from May toSeptember and less than 1.4 km from October to April[Kleissl et al., 2007]. Upslope flow can bring air fromlower altitudes to the station, including occasionally fromthe marine BL. However, upslope flow affects the PicoMountain station much less than it does many othermountain observatories [Kleissl et al., 2007]. Impacts ofupslope flow on nitrogen oxides, CO and O3 are small[Kleissl et al., 2007], indicating that the air sampled at thesite is usually negligibly influenced by island pollution orthe marine BL. The results obtained in this study areconsistent with this expectation. For example, in periodswith potential mechanical and/or buoyant upslope flow,median NOx was 31 pptv, whereas it was 28 pptv duringnonupslope flow periods.
2.2. Measurements
[11] NO, NO2, and NOy were determined by an automatedNOx,y system, which used established techniques for highsensitivity detection: NO detection by O3 chemilumines-cence [Ridley and Grahek, 1990], NO2 by conversion toNO via ultraviolet photodissociation [Kley and McFarland,1980; Parrish et al., 1990], and NOy by Au-catalyzedreduction to NO in the presence of CO [Bollinger et al.,1983; Fahey et al., 1985]. A detailed description of the NOx,y
system including operation, sensitivities, conversion effi-ciencies, precision and artifacts can be found in the work ofVal Martin et al. [2006].[12] Measurements were recorded as 30-s averages (NO
and NO2) and 20-s averages (NOy) every 10 min, andfurther averaged to obtain the 30-min averages used in thiswork. The instrumental detection limit (2s) of the 30-minaverages is based on the artifact correction uncertainty andthe precision (2s) of the instrument. Detection limits werecalculated separately for each individual measurement, onthe basis of the standard deviation of 1-s photon counts.During the 3-year measurement campaign, the detectionlimit was 6.5 to 16 pptv for NO, 13 to 17 pptv for NO2, 14to 21 pptv for NOx and 7.5 to 21 pptv for NOy. (Reportedmedian and maximum detection limit values.) These valueswere not constant because of occasional changes to instru-
D17307 VAL MARTIN ET AL.: REMOTE NORTH ATLANTIC NITROGEN OXIDES
2 of 15
D17307

ment components and operation. Ninety percent of themeasurements had detection limits less than 6.5 pptv forNO, 16 pptv for NO2 and NOx, and 19 pptv for NOy.Measurement accuracy of NO and NO2 is estimated to be5% (20 July 2002 through 17 July 2003), 7% (17 July 2003through 1 May 2004) and 4% (1 May 2004 through25 August 2005) on the basis of total uncertainty of thesample and calibration mass flow controllers and the NOstandard calibration gas mixing ratio.[13] Accuracy of the NOy measurements depends on the
effective conversion of NOy compounds, the lack of signif-icant conversion of non-NOy compounds [Fahey et al.,1985; Kliner et al., 1997; Kondo et al., 1997] and theuncertainty in the determination of the NOy sensitivity, inaddition to the accurate determination of the resulting NO.On the basis of regular calibrations and standard additiontests with NO2, i-propyl nitrate and HNO3 in ambient air,measured conversion efficiencies were 80–100% for NO2
(typically >97%), with similar values expected for PAN[Fahey et al., 1985], 62–100% for HNO3 (typically >80%),and 61–100% for i-propyl nitrate (typically >80%).Because of occasional degradation of the NOy converter,measurements of NOy were corrected for nonunity NOy
conversion by using the NO2 conversion efficienciesmeasured at the system. In addition, NOy observationsin March–May 2003 and May–June 2004 presented anadditional uncertainty of 13% and 5% because of uncer-tainty in the NOy sensitivity determination, respectively. Amaximum correction of 20% was applied to a few of themeasurements made before March 2003 and a maximumcorrection of 8% was applied to measurements made frommid-July to mid-August 2004. No correction was made aftermid-August 2004 as the NO2 conversion efficiency wasconstant to the expected range of 97–100%.[14] On the basis of the NOy composition estimated at the
Pico Mountain station (section 3.3.1) and the uncertainty ofNO determination, total measured NOy uncertainty was]20% at NOy levels of 100 pptv and ]15% at NOy levelsof 500 pptv, with the exception of the period from March toMay 2003. During this period (less than 3% of the total dataset), total NOy uncertainty was estimated to be at worst�55% at NOy levels of 100 pptv, mainly because ofpotentially incomplete conversion to NO. These totalmeasured uncertainties were calculated using propagationof errors of all source of errors. Interference of non-NOy
species was not a problem in this study as inferred from thevery low conversion efficiencies (always less than 0.5%;typically 0.3%) during regular testing using standardaddition of CH3CN.[15] As discussed by Val Martin et al. [2006], unexpected
spikes were sometimes observed in ambient NOx and NOy,and were attributed to volcanic emanations. To avoidincluding these observations in our analysis, we usedmethods similar to but slightly more stringent than thoseused previously [Val Martin et al., 2006]. (Additionalinformation of the screening procedure and percentage ofthe data affected can be found in Val Martin et al. [2006]and Val Martin [2007].)[16] In remote regions without significant biogenic NOx
emissions, nighttime NO values are expected to be zerobecause of the rapid oxidation of NO by O3 and theexpected absence of local sources [Ridley et al., 1998;
Peterson et al., 1998]. This was true for all seasons, withthe exception of summer 2004, which presented a nighttimemedian of 3 pptv. It was not possible to conclusivelydetermine the reason for the generally nonzero nighttimeNO levels during summer 2004. However, the weather atPico that summer was unusual since it was dominated byhigh relative humidity (RH) and calm wind periods. Thismay have resulted in a very small but detectable flux ofNO from soil bacteria around the station. These nonzeronighttime NO observations could not be removed by anyscreening criterion attempted and systematically affected themeasurements during this season. These emissions wouldpresumably affect NO during the daytime and NOx both dayand night as well. However, the interference from thissource does not appear to significantly affect the results: ifwe exclude the 2004 NO summertime observations, thediurnal cycle and seasonal variation presented below do notsignificantly change. For example, summer daytime medianNO was 7.9 pptv in 2002–2005, whereas it was 7.7 pptvexcluding the summer 2004 data set.[17] Finally, during some sunny summer periods the
temperature of the NO2 converter system increased to theextent that PAN decomposition could have produced adetectable positive bias in the NO2 measurements. At themaximum temperature recorded in the NO2 convertersystem (39�C), up to about 2–4 pptv NO2 could have beenproduced during the �8 second residence time in the NO2
converter. This small interference may have contributed tothe apparent daytime NO2 source described below, at leastduring summer and early fall.[18] We also analyzed measurements of CO made from
July 2002 to August 2005. The CO measurement methodsare described in detail elsewhere [Owen et al., 2006;Honrath et al., 2004].
2.3. GEOS-Chem and FLEXPART Simulations
[19] Simulations of the global chemical transport modelGEOS-Chem were conducted for comparison with theobservations. GEOS-Chem version 7.01 was driven byassimilated meteorological fields from the Goddard EarthObserving System of NASA [Bey et al., 2001]. The spatialresolution of the model was 2� latitude by 2.5� longitudewith 26 levels between the surface to 0.1 hPa. Globalanthropogenic emissions were determined following theprocedure described by Bey et al. [2001]. Over the conti-nental United States and Europe, the anthropogenic emis-sions were based on the United States EnvironmentalProtection Agency (EPA) National Emission Inventory-97[EPA, 1997] and the European Monitoring and EvaluationProgram (EMEP) for European countries [EuropeanMonitoring and Evaluation Program, 1997]. Biomassburning emissions were obtained from Duncan et al. [2003]with monthly mean estimates relocated using Moderate-Resolution Imaging Spectroradiometer fire counts. Moreinformation on these emissions and additional sources (e.g.,lightning, stratospheric injection) is presented elsewhere [Beyet al., 2001].[20] To evaluate the sensitivity of our measurements to
stratospheric transport, we used the FLEXPART particledispersion model version 6.2 [Stohl, 1998; Stohl et al.,2005]. FLEXPARTwas driven with data from the EuropeanCenter for Medium-Range Weather Forecasts [2005] with a
D17307 VAL MARTIN ET AL.: REMOTE NORTH ATLANTIC NITROGEN OXIDES
3 of 15
D17307
1� � 1� horizontal resolution, 60 vertical levels and atemporal resolution of three hours, using meteorologicalanalyses at 0000, 0600, 1200, and 1800 UTC, and EuropeanCenter for Medium-Range Weather Forecasts (ECMWF)3-h forecasts at 0300, 0900, 1500, and 2100 UTC. We ranFLEXPART in its forward mode to simulate the transport of astratospheric O3 tracer. This was done by releasing particles,which represent infinitesimally small air parcels, in the lowerstratosphere. Each particle carried a mass of ozone deter-mined by the potential vorticity (PV) at the particles initiallocation and release time. Particles released where PV wasgreater than 2.0 pvu were given a specific mass according toMO3
= Mair � PV � C, where Mair was the mass of air
represented by a particle and C = 60 � 10�9 pvu�1 was theozone/PVrelationship [Stohl et al., 2000]. Particles were thenallowed to advect through the stratosphere and into thetroposphere according to the winds. At any one time,approximately 4 million particles were present in the modelfor these stratospheric tracer runs. Particles were carried inthe model for 20 days before being removed. This tracer isreferred to here as FLEXPART Strat-O3.
3. Results and Discussion
[21] Figure 1 presents an overview of the nitrogen oxidesmeasurements at the Pico Mountain station from July 2002
Figure 1. Time series of (top) daytime NO, (middle) NOx, and (bottom) NOy at the PicoMountain station.Daytime NO data are observed when the solar zenith angle was below 62� (see text for explanation). Eachdata point represents a 30-min average. Bar plots indicate the distribution of the data for each season andyear. The medians (red circles) and the means (black squares) are shown along with the central 67% (yellowbox) and the central 95% (thin black lines). The number of 30-min average measurements (black numbers)and the median (red numbers) included in each distribution are given above the plot for each bar.Distributions with fewer than 20 data points are not shown. Discontinuity on the data is due to PicoMountain station shutdowns and periods of maintenance and/or malfunctioning of the NOx,y system.
D17307 VAL MARTIN ET AL.: REMOTE NORTH ATLANTIC NITROGEN OXIDES
4 of 15
D17307

to August 2005. All 30-min averages of daytime NO, NOx,and NOy are shown as time series, and bar plots representthe distribution of the data by season and year.[22] Significant variability is apparent in the data at all
times of the year. A large number of factors contribute to themagnitude and the changes of the nitrogen oxides levels. Inthis section, three aspects of the data are analyzed: diurnalcycles, seasonal variation and partitioning of NOy. Theseaspects are not entirely independent but provide a structurefor discussion.
3.1. Diurnal Cycles
[23] Diurnal cycles of nitrogen oxides can be caused byphotochemical, transport and emission processes whosestrength vary between day and night. Table 1 summarizesthe statistical parameters of the diurnal cycles of NO, [NO]/[NO2], NO2, NOx, and NOy for each season. As an example,Figure 2 displays the diurnal variation for the springtimemeasurements of NO, [NO]/[NO2], NO2, and NOy. (Similarvariation was present in the other seasons.) Negative valuesare shown in Figures 2a and 2b to indicate the scatter of theindividual measurements, which is due to measurementimprecision; the true atmospheric mixing ratios are ofcourse never negative. For the [NO]/[NO2] analysis, valuesthat deviated from the mean by more than three times thestandard deviation were removed. This was done becauseNO2 and NO measurements are related as the calculation ofNO2 includes the NO mixing ratio. Hence, rare outliers inthe NO measurements may result in NO2 outliers, whichproduces unrealistic [NO]/[NO2] values that may signifi-cantly affect the mean [Yang et al., 2002].[24] To test for the existence of a consistent diurnal
variation, we examined both the median and the mean ofthe data in the nighttime and daytime subsets. Nighttime
Figure 2. Springtime diurnal cycles of (a) NO, (b) [NO]/[NO2], (c) NO2, and (d) NOy. All 30-min average data, withthe exception of [NO]/[NO2] (see text for explanation), areplotted at the nearest hour. A few data points outside theplot boundaries are not shown to make the cycle moreapparent (25 for NO and NO/NO2, 8 for NO2, and 1 forNOy). Bar plots indicate the distribution of the data in each2-h intervals. The medians (red circles) and the means(black squares) are shown along with the central 67%(yellow box) and the central 95% (thin black lines).
Table 1. Statistical Parameters of the Nitrogen Oxides Diurnal Cyclea
Seasond Data
Daytimeb Nighttimeb Amplitudec
Mean ± SD Median N Mean ± SD Median N DMean DMedian
Spring NO 9 ± 8 7 454 1 ± 3 0 889 8 ± 2 6Spring NO:NO2 0.4 ± 0.5 0.3 89 0.1 ± 0.4 0.0 277 0.3 ± 0.2 0.3Spring NO2 21 ± 11 21 148 19 ± 11 18 308 2 ± 4 3Spring NOx 29 ± 16 26 124 20 ± 11 18 322 9 ± 6 8Spring NOy 184 ± 123 178 704 184 ± 111 166 905 0 ± 24 12Summer NO 9 ± 5 8 369 2 ± 4 2 947 7 ± 1 6Summer NO:NO2 0.4 ± 0.3 0.3 236 0.1 ± 0.3 0.0 660 0.3 ± 0.1 0.3Summer NO2 25 ± 13 23 296 28 ± 16 25 740 �3 ± 4 �2Summer NOx 37 ± 18 33 323 31 ± 16 26 781 6 ± 5 7Summer NOy 222 ± 180 165 542 247 ± 208 201 1099 �25 ± 40 �36Fall NO 9 ± 5 8 387 1 ± 3 0 660 8 ± 1 8Fall NO:NO2 0.3 ± 0.2 0.3 265 0.0 ± 0.1 0.0 415 0.3 ± 0.1 0.3Fall NO2 28 ± 16 24 297 30 ± 17 26 452 �2 ± 5 �2Fall NOx 36 ± 20 31 294 31 ± 16 26 458 5 ± 6 5Fall NOy 160 ± 102 141 511 163 ± 108 134 738 �3 ± 24 7Winter NO 7 ± 6 5 64 0 ± 2 0 562 7 ± 3 5Winter NO:NO2 0.4 ± 0.3 0.4 40 0.0 ± 0.2 0.0 447 0.4 ± 0.2 0.4Winter NO2 24 ± 13 24 50 25 ± 16 23 462 �1 ± 8 1Winter NOx 26 ± 14 23 49 24 ± 14 22 441 2 ± 9 1Winter NOy 156 ± 79 145 76 152 ± 88 128 512 4 ± 39 17
aReported average, standard deviation (SD), median, and number (N) of the 30-min average observations in pptv for NO, NO2, NOx, and NOy.bDaytime values are observations when the solar zenith angle was <62� and nighttime values are observations between 2300–0500 UTC.cAmplitude is expressed as the difference between the means (DMean) and the medians (DMedian) of daytime and nighttime. Uncertainty (2s) is based
on propagation of errors.dSeasons are as follows: spring is March, April, and May; summer is June, July, and August; fall is September, October, and November; and winter is
December, January, and February.
D17307 VAL MARTIN ET AL.: REMOTE NORTH ATLANTIC NITROGEN OXIDES
5 of 15
D17307

values were observations made between 2300 and0500 UTC; daytime values were those made when the solarzenith angle was below 62�. These cutoffs were chosen toallow significant numbers of data points in both subsetswhile providing daylight and nighttime conditions in allseasons. As expected, Table 1 indicates that robust diurnalcycles exist for NO and [NO]/[NO2] ratios in all seasons,with median diurnal amplitudes of 5–8 pptv and 0.3–0.4,respectively. The phase of these cycles is consistent withphotochemical causes: the maximum occurs around the timeof maximum insolation at local solar noon (1400 UTC forspring; Figure 2), indicating a dominance of production ofNO from photolysis of NO2, whereas the minimum occursat nighttime, indicating dominance of NO destruction byreaction with O3.[25] Given the observed NO cycle amplitude, a negative
amplitude of similar magnitude should be present in theNO2 cycle as NO2 is photolyzed to NO during daytime.Figure 2c and Table 1 indicate that a very weak negativediurnal variation or no variation was present for NO2, withmedian diurnal amplitudes of �2 to 3 pptv. This smallnegative or nonexistent amplitude suggests the presence of asmall source of NO2 during daytime. As discussed insection 2, this may be partially the result of interferenceof PAN decomposition in the photolysis cell during summerand early fall. The absence of a negative or no diurnalvariation of NO2 results in the presence of a diurnal cyclefor NOx from spring to fall, with median amplitudes of 5 to8 pptv (Table 1).[26] Consistent with our expectation that diurnally
varying upslope flow does not affect the measurements[Kleissl et al., 2007], Figure 2d and Table 1 show that nosignificant diurnal variation was present for NOy, with theexception of the summer, which exhibited a negativemedian amplitude of 36 pptv. This may be due to rapidremoval of summertime NOy, which is primarily composedof HNO3, as estimated below in section 3.3.1. SummertimeRH measurements at the Pico Mountain station indicate thatthe percentage of NOy observations made in the presence ofclouds (RH above 96%, section 3.3.1) was larger during thedaytime (24%) than at nighttime (16%), which may result ina stronger wet removal of HNO3 during the day.[27] Comparisons of the diurnal variation observed at the
Pico Mountain station to those observed at other remotemarine FT stations are not straightforward. As opposed tothe Pico Mountain station, ground-based mountaintopstations (e.g., Mauna Loa Observatory (MLO) over theNorth Pacific Ocean and Izana over the eastern AtlanticOcean) are typically characterized by a diurnal downslope-upslope flow regime [Ridley et al., 1998; Fischer et al.,1998]. However, spring diurnal amplitudes of �8 pptv forNO and �0.4 for NO/NO2 were observed at MLO during arare event in which free tropospheric air was sampled allday [Ridley et al., 1998], similar to the spring amplitudeobserved at the Pico Mountain station for NO (8 ± 2 pptv)and for [NO]/[NO2] (0.3 ± 0.2).
3.2. Seasonal Variation
[28] In this section, we first determine the seasonalvariation of nitrogen oxides on a monthly basis. Second,we compare the mixing ratios of nitrogen oxides at the PicoMountain station with observations from previous studies.
3.2.1. Annual Cycle[29] Figures 3a–3c present the annual cycle of nitrogen
oxides at the Pico Mountain station. All years are included,and the monthly medians in each year (e.g., April 2002 andMarch 2003) are indicated with horizontal blue lines withineach bar and numerals to the right of each bar. NighttimeNO is not shown in Figure 3b since values are zero, asexplained above in section 2. For NOy, Figure 3c showsthe seasonal cycle determined when dry conditions werepresent (RH below 60%). (Lower NOy levels were observedwhen RH was high, because of removal into fog droplets atthe measurement site, as discussed further in section 3.3.1.Thus, NOy observations in dry conditions are a betterrepresentation of NOy levels in the North Atlantic lowerFT.) In Figure 3d, the annual cycle of CO is also shown forcomparison. The monthly statistics plotted in Figure 3 areavailable in the work of Val Martin [2007]. It is clear fromFigures 3a–3d that during some months the monthlymedians varied substantially from year to year. Largevariability of CO at hemispheric scales is known to occur,and has mainly been associated with variations in biomassburning emissions [e.g., Novelli et al., 2003; Edwards et al.,2004; Honrath et al., 2004]. Although interannual variabil-ity is also apparent for the nitrogen oxides, we find that insome cases this variability may be due to the limited numberof observations available and the fact that transport eventsresult in large standard deviations within each month. Forexample, median NOx in October 2002 was much higher(47 pptv) than in 2003 (27 pptv) and 2004 (25 pptv) becauseNOx observations were only available for about 10 daysin 2002, which happened to coincide with two NorthAmerican outflow events.[30] Figure 3d shows a sharp seasonal cycle for CO, with
a minimum median of 90 ppbv in July–August and amaximum median of 146 ppbv in March. CO is oxidizedby OH, and the annual variation of CO is driven to a largeextent by the annual cycle of OH, which is closely related tothe water vapor and the solar intensity cycle [Novelli et al.,1992]. In addition to photochemical processes, seasonalvariation in synoptic flow patterns, and the associatedchanges in source regions and transport times to themeasurement site can also affect background levels ofCO. On the basis of a clustering analysis of backwardtrajectories to the Pico Mountain station (J. Strane et al.,Major source regions to the Pico Mountain station:Transport, chemical observations, and interannual variability,manuscript in preparation, 2008), more frequent transportfrom the Atlantic basin and longer transit times from theNorth American continent in summer may also explain thelower observed summertime CO. The annual variation ofinferred OH concentrations and transport patterns was alsonoted to modulate the nonmethane hydrocarbons (NMHC)sampled at the Pico Mountain station [Helmig et al., 2008].[31] In contrast to CO, the seasonal variation of nitrogen
oxides is more complex. The variation of nitrogen oxides inthe troposphere remote from sources of NOx dependslargely on the partitioning of NOy [e.g., Atlas et al., 1992;Ridley et al., 1998], which in turn, is controlled to a largeextent by the rate of loss of the reservoir species and by therecycling of NOx from these reservoirs. Moreover, since theloss processes differ among compounds, each process mayresult in a different effect on NOy. For example, thermal
D17307 VAL MARTIN ET AL.: REMOTE NORTH ATLANTIC NITROGEN OXIDES
6 of 15
D17307

decomposition of PAN regenerates NO2, which changes thepartitioning of NOy but not total NOy, whereas wet and drydeposition of HNO3 results in a change in total NOy asnitrogen is removed from the atmosphere.[32] Figure 3a shows that NOx observations exhibited a
distinct seasonal cycle in the overall variability, with allpercentiles larger from July to October than in the othermonths. However, monthly medians did not reveal a clearpattern. Similar monthly medians were present all year-round (17–31 pptv). (To avoid the possible interferencefrom a small daytime bias in NO2 during some summerperiods (section 3.1), we also compared nighttime NOx
medians and found similar results: 16–28 pptv). Becausethe lifetime of NOx in the lower FT (on the order of ]1 day
[Liu et al., 1987]) is shorter than the transit time from NOx
source regions to the measurement site, it is clear that in situsources of NOx are required to provide these NOx levels allyear-round. This implies that PAN decomposition andpotentially photolysis of HNO3 in the air masses that reachthe Pico Mountain station provide a supply of NOx to thelower FT in this region, in particular during summerseasons.[33] Because of the rapidly increasing solar insolation and
decreasing O3 concentrations from spring to fall, one mayexpect a shift of NOx partition toward NO as photolysis ofNO2 increases and the rate of the reaction of NO with O3
decreases. However, the actual situation was different.Figure 3b shows that daytime NO mixing ratios exhibited
Figure 3. Seasonal cycle of (a) NOx, (b) daytime NO, and (c) NOy in dry conditions (see text forexplanation), and (d) CO. Bar plots indicate the distribution of the data for each month, independent ofthe year of measurement. The medians (red circles) and the means (black squares) are shown along withthe central 67% (yellow box) and the central 95% (thin black lines). Months with fewer than 20 datapoints are not shown. The median for all observations in each month and year are plotted by horizontalblue lines within each bar; numerals to the right of the bar plots indicate the year of each monthly median(where 2 is the year 2002, 3 is the year 2003, 4 is the year 2004, and 5 is the year 2005). Medians withfewer than 20 data points are not shown.
D17307 VAL MARTIN ET AL.: REMOTE NORTH ATLANTIC NITROGEN OXIDES
7 of 15
D17307

a small broad peak from July to September, with medians of9–12 pptv. The increase in NO during these months isconsistent with the increase in solar radiation and generallylower O3 mixing ratios observed at the Pico Mountainstation (not shown). However, a peak was also present inMarch, with a median of 11 pptv. The cause of this peak isnot understood.[34] As shown in Figure 3c, NOy observations exhibited a
well-defined seasonal cycle, with larger medians in June–September (296–338 pptv) than in November–March(125–212 pptv). There are several processes that maycontribute to this behavior.[35] First, as shown in a more detailed specific event-to-
event study, there appears to be a greater export andtransport of nitrogen oxides from the North American BLto the Pico Mountain site during the summer season [ValMartin et al., 2008]. Parrish et al. [2004] proposed thatshallow venting of the continental BL to the lower FT,driven by surface heating and associated with fair weathercumulus breaking through the afternoon BL, may providean important lofting mechanism for anthropogenic emis-sions over the eastern United States. This mechanism,which is expected to be most frequent in summer, mayresult in a significant export of nitrogen oxides to the NorthAtlantic region [Parrish et al., 2004; Li et al., 2004;Hudman et al., 2007].[36] Second, boreal wildfires have been recently recog-
nized to be a significant source of nitrogen oxides to theNorth Atlantic troposphere [Val Martin et al., 2006; Singh etal., 2007]. NOy means from July to September (typically theboreal fire season) exceeded the medians by 13–18%,showing extreme excursions from the median in the positivedirection. The higher variability of NOy in these monthsreflects the high but varying influence of boreal wildfireemissions [Val Martin et al., 2008]. Thus, summertimewildfire emissions result in higher levels of NOy.[37] Finally, variation in the input from stratospheric or
upper tropospheric sources could also contribute to changesin nitrogen oxides. NOx production by lightning variesseasonally, with the maximum production occurring in theNorthern Hemisphere during summer [Nesbitt et al., 2000].Stratospheric injection is found to be more important duringspringtime [e.g., Parrish and Fehsenfeld, 2000; Merrill andMoody, 1996], although injections are also frequent insummer [Thompson et al., 2007]. To assess the impact ofstratospheric and upper tropospheric transport to the PicoMountain station, we used FLEXPART Strat-O3 valuesfrom July 2002 to August 2005. This analysis indicatedthat stratospheric O3 occasionally impacts the measurementsite, but the overall impact is rather small: the average ±2standard deviation of all FLEXPART Strat-O3 values was7 ± 9 ppbv, without significant variation on a seasonal basis.On an event basis, we did not find any consistent correlationbetween nitrogen oxides levels and FLEXPART Strat-O3,i.e., enhancements of NOy were not correlated withincreases in the FLEXPART Strat-O3 values. We thusconclude that stratospheric air did not significantly contrib-ute to the changes in the nitrogen oxides observed at thePico Mountain station.3.2.2. Comparison to Previous Measurements[38] Table 2 compares the mixing ratios of nitrogen
oxides at the Pico Mountain station with observations from
previous aircraft studies in the North Atlantic troposphereand from two ground-based stations, MLO over the NorthPacific Ocean and Jungfraujoch (JFJ) station over centralEurope. Values are compiled by seasons. The majority ofthese studies were made during the summer season. Thus, wefocus here on summertime observations, unless indicatedotherwise.[39] It is evident that nitrogen oxides levels at the Pico
Mountain station (median 322 pptv for NOy and 29 pptv forNOx; Table 2 rows 2 and 14) are lower than those observedin other studies over the western North Atlantic at 0.5–6 kmaltitudes (652–1480 pptv for NOy and 40–55 pptv for NOx;Table 2 rows 5–8, 11, and 17–20). NOx and NOy typicallyexhibit a C-shaped profile above source regions, with highconcentrations near the surface decreasing through the FTand then rising sharply at altitudes generally above 6 km[e.g., Singh et al., 2007]. This is the result of the combina-tion of atmospheric oxidation with the location of theemissions (BL and upper troposphere) and convection.Lower NOy and NOx at the Pico Mountain station indicatethat removal of NOy and rapid oxidation of NOx in the airmasses may occur as a result of longer transport timesover the ocean. In addition, lower NOy and NOx levelsmay also indicate a smaller influence of stratospheric andupper tropospheric sources at the Pico Mountain site as airis sampled at lower altitudes than that in the aircraftcampaigns.[40] Nitrogen oxides levels observed at MLO (median
168–374 pptv for NOy and 25–36 pptv for NOx; Table 2rows 3 and 15) were similar to those observed at the PicoMountain station (147–322 pptv for NOy and 21–29 pptvfor NOx) all year round. Similar to the Pico Mountainstation, MLO is a remote marine observatory, in whichwell-aged air masses are sampled during downslope con-ditions [Ridley et al., 1998]. Thus, observed levels at MLOalso reflect the strong removal of NOy and rapid oxidationof NOx in the air masses during transport. In contrast, largerNOx and NOy medians present at the continental JFJobservatory (350–581 pptv for NOy and 87–133 pptv forNOx; Table 2 rows 4 and 16) suggest the input of relativelyfresh NOx emissions from the continental BL [Zellweger etal., 2003].
3.3. Average Partitioning of NOy
[41] To better understand the changes on the nitrogenoxides over the central North Atlantic lower FT, weexamined the partitioning of NOy into its three principalcomponents: NOx, HNO3, and PAN.3.3.1. Estimation of NOy Partitioning[42] NOy partitioning was estimated using the NOx and
NOy measurements in combination with station measure-ments of RH, taking advantage of the fact that HNO3
removal occurs in local, orographic clouds on Pico Moun-tain. Several studies have demonstrated the rapid andefficient scavenging of nitric acid within clouds [e.g.,Chameides, 1984; Peterson et al., 1998; Garrett et al.,2006]. For example, Chameides [1984] showed that HNO3
levels decreased by 2 orders of magnitude in less than 100seconds after marine cloud formation. Consistent with thosestudies, NOy levels at the Pico Mountain station werereduced in the presence of clouds as noted in section 3.2.1.Thus, measurements of NOy levels during in-cloud and out-
D17307 VAL MARTIN ET AL.: REMOTE NORTH ATLANTIC NITROGEN OXIDES
8 of 15
D17307
of-cloud periods can be used to estimate the mixing ratio ofcloud-scavenged NOy species, i.e., HNO3, by assuming thatHNO3 is scavenged into clouds droplets during in-cloudperiods [Peterson et al., 1998]. (Even for the smallestobserved orographic clouds (�1500 m radius) and typicalhigher wind speeds (�12 m s�1; 95th percentile of windspeed observations when NOy was available), there wasenough time (�125 s) for HNO3 to be scavenged into thecloud droplets before air reached the measurement site.) Forthis purpose, we subdivided the observations into periodsabove 96% RH and below 60% RH in order to identify in-cloud and out-of-cloud intervals at the site, respectively. TheRH cutoffs were selected so that both subsets containedsimilar numbers of data points and, at the same time, cloudand cloud-free periods were present at the measurement site.
Archived photos of the conditions at the station confirmedcloud and cloud-free periods under those cutoffs. MonthlyHNO3* values were determined by subtracting the monthlyaverages of NOy observed during ‘‘in-cloud’’ periods fromthose observed during ‘‘out-of-cloud’’ periods; PAN* wasdetermined by subtracting NOx from NOy in simultaneousobservations during in-cloud periods, and NOx and NOy
mixing ratios were determined using direct observationsmade during out-of-cloud periods. (The terms HNO3* andPAN* are used here to indicate estimated, not directlymeasured values of these species.) Table 3 summarizesthe NOy and NOx levels during in-cloud and out-of-cloudperiods, and the derived fraction of reactive nitrogenspecies on a seasonal basis, i.e., [HNO3*]/[NOy], [PAN*]/[NOy], and [NOx]/[NOy]. Figure 4a shows the monthly
Table 2. Observation of Nitrogen Oxides in the Lower Free Troposphere of Remote Regionsa
YearSamplingLocationb Altitude (km)
Spring Summer Fall Winter
SourcecMean ± SD Median Mean ± SD Median Mean ± SD Median Mean ± SD Median
NOy (pptv)2002–2005d C Atl 2.2 257 ± 115 229 358 ± 160 322 228 ± 121 195 165 ± 73 147 11991–1992 N Pac 3.4 368 ± 109 374 203 ± 99 188 177 ± 70 168 204 ± 82 187 21997–1999 W Eur 3.6 748 ± 614 581 653 ± 570 529 553 ± 477 422 501 ± 659 350 32004 W Atl 2–4 — — 809 ± 610 652 — — — — 41996–1997 W Atl 2–4 545 ± 74 550 — — 434 ± 267 377 — — 51988–1993 W Atl 0.5–3 — — 817 ± 104 850 — — 675 ± 248 675 61988–1993 W Atl 3–6 — — 969 ± 65 1000 — — 467 ± 76 450 61993 C Atl 1 — — 495 ± 214 480 — — — — 71993 E Atl 2.4 — — 390 ± 100 390 — — — — 81993 W Atl 0.8–6 — — 3520 ± 4990 1480 — — — — 72000 N Ame 2–3 — 275–450 — — — — — 275–300 9
NOx (pptv)2002–2005 C Atl 2.2 23 ± 14 21 32 ± 17 29 33 ± 19 28 27 ± 16 24 11991–1992 N Pac 3.4 39 ± 15 36 29 ± 12 28 26 ± 9 25 32 ± 11 31 21997–1999 W Eur 3.6 183 ± 289 98 191 ± 482 133 205 ± 355 115 203 ± 454 87 32004 W Atl 2–4 — — 64 ± 63 52 — — — — 41996–1997 W Atl 2–4 24 ± 20 23 — — 26 ± 22 20 — — 51988–1993 W Atl 0.5–3 — — 73 ± 67 40 — — — — 61988–1993 W Atl 3–6 — — 55 ± 21 55 — — — 30 61993 E Atl 2.4 — — 50 ± 20 50 — — — — 82000 N Ame 2–3 — 15–50 — — — — — 28 9
aDashes indicate that values are not reported.bN Pac, North Pacific Ocean; N Ame, North America; WAtl, western North Atlantic Ocean; C Atl, central North Atlantic Ocean; E Atl, eastern North
Atlantic Ocean; W Eur, western Europe.cSources are as follows: 1, Pico Mountain (this work); 2, MLO (B. Ridley, NCAR, United States, personal communication, 2007); 3, JFJ [Zellweger et
al., 2003]; 4, ICARTT [Singh et al., 2007]; 5, NARE96 and NARE97 (D. Parrish, NOAA, United States, personal communication, 2007); 6, Emmons et al.[1997]; 7, NARE93 (Peterson et al. [1998] in the central North Atlantic Ocean and Buhr et al. [1996] in the western North Atlantic Ocean); 8, Izana[Fischer et al., 1998]; 9, Tropospheric Ozone Production about the Spring Equinox [Wang et al., 2003]. Observations from Emmons et al. [1997] areaverage ± standard deviation of several field campaigns over the western Atlantic Ocean; observations at MLO and Izana are for downslope conditions, andobservations at JFJ are for undisturbed conditions. Observations from Peterson et al. [1998] are average ± standard deviation of two periods in the FT.
dNOy at the Pico Mountain station determined in dry conditions.
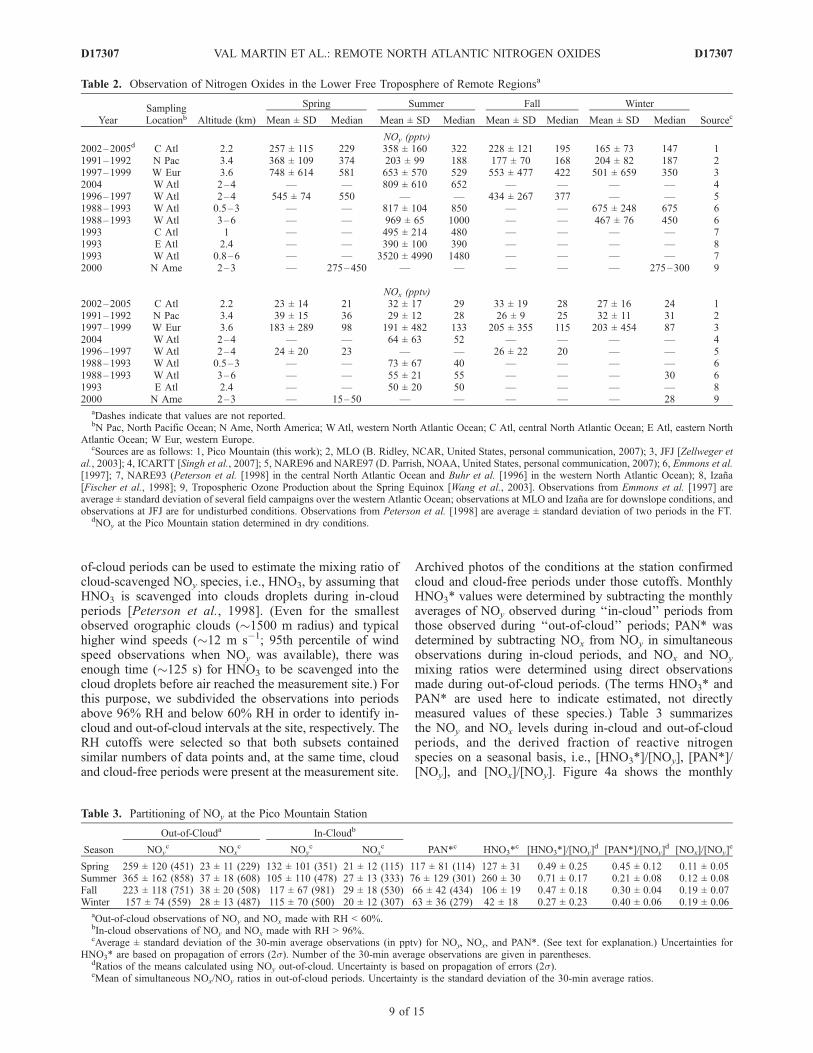
Table 3. Partitioning of NOy at the Pico Mountain Station
Season
Out-of-Clouda In-Cloudb
PAN*c HNO3*c [HNO3*]/[NOy]
d [PAN*]/[NOy]d [NOx]/[NOy]
eNOyc NOx
c NOyc NOx
c
Spring 259 ± 120 (451) 23 ± 11 (229) 132 ± 101 (351) 21 ± 12 (115) 117 ± 81 (114) 127 ± 31 0.49 ± 0.25 0.45 ± 0.12 0.11 ± 0.05Summer 365 ± 162 (858) 37 ± 18 (608) 105 ± 110 (478) 27 ± 13 (333) 76 ± 129 (301) 260 ± 30 0.71 ± 0.17 0.21 ± 0.08 0.12 ± 0.08Fall 223 ± 118 (751) 38 ± 20 (508) 117 ± 67 (981) 29 ± 18 (530) 66 ± 42 (434) 106 ± 19 0.47 ± 0.18 0.30 ± 0.04 0.19 ± 0.07Winter 157 ± 74 (559) 28 ± 13 (487) 115 ± 70 (500) 20 ± 12 (307) 63 ± 36 (279) 42 ± 18 0.27 ± 0.23 0.40 ± 0.06 0.19 ± 0.06
aOut-of-cloud observations of NOy and NOx made with RH < 60%.bIn-cloud observations of NOy and NOx made with RH > 96%.cAverage ± standard deviation of the 30-min average observations (in pptv) for NOy, NOx, and PAN*. (See text for explanation.) Uncertainties for
HNO3* are based on propagation of errors (2s). Number of the 30-min average observations are given in parentheses.dRatios of the means calculated using NOy out-of-cloud. Uncertainty is based on propagation of errors (2s).eMean of simultaneous NOx/NOy ratios in out-of-cloud periods. Uncertainty is the standard deviation of the 30-min average ratios.
D17307 VAL MARTIN ET AL.: REMOTE NORTH ATLANTIC NITROGEN OXIDES
9 of 15
D17307

variation of the [HNO3*]/[NOy], [PAN*]/[NOy], and [NOx]/[NOy].[43] A limited number of more direct estimates of
HNO3* were also made, using alternating measurementsof (NOy-HNO3) and NOy. Measurements of (NOy-HNO3)were made in August 2004 and 2005 by removing HNO3
from NOy before sampling using a nylon filter attached tothe NOy inlet [e.g., Parrish et al., 1986; Yamamoto et al.,2001]. HNO3 was determined by difference from NOy;PAN* was determined as (NOy-HNO3) minus NOx. Thesemeasurements provide an additional method to test theconsistency of our approach. The fraction of reactive nitrogenspecies estimated directly from these tests (53–62% HNO3,23–34% PAN* and 9–16% NOx) is similar to that deducedfor the summer (71 ± 9% HNO3*, 21 ± 8% PAN* and 12 ±8% NOx).[44] To confirm that the changes in RH used in this
analysis were independent of the origin and the chemicalhistory on the air masses, we inspected the variation ofCO in the in-cloud and out-of-cloud periods when NOy
measurements were available. As shown in Figure 4b, COdid not exhibit a clear relationship with RH, i.e., monthlyCO averages were variable all year-round, independent ofin-cloud and out-of-cloud conditions. However, significant
larger monthly CO means for the out-of-cloud periodsfrom July to September may indicate a dominance of fire-impacted boreal region outflow, which is characterized bylow RH and elevated CO levels [Val Martin et al., 2006].This influence of boreal emissions during out-of-cloudconditions may have resulted in an overestimation ofHNO3 and underestimation of PAN levels during summer,since NOy is enhanced during boreal wildfire events.Conversely, significant smaller monthly CO means for theout-of-cloud periods from November to January may haveresulted in an overestimation of HNO3 and underestimationof PAN levels.[45] In this analysis, we neglected the possible influence
of aerosol and alkyl nitrates. The NOx,y system inlet used atthe Pico Mountain station excludes large aerosol particles,but allowed sampling of the ]10 micron aerosol fraction[Hangal and Willeke, 1990; Peterson and Honrath, 1999].However, submicron size aerosol nitrates are not efficientlymeasured in our system as conversion efficiency for thesecompounds are low [Miyazaki et al., 2005]. The contribu-tion of alkyl nitrates to NOy in the remote marine tropo-sphere is very small [Singh et al., 2007; Reeves et al., 2007].For example, alkyl nitrates accounted for less than 2% ofthe tropospheric NOy in the lower FT over the NorthAtlantic Ocean during the International Consortium forAtmospheric Research on Transport and Transformation(ICARTT) study [Singh et al., 2007]. Thus, although thepresence of alkyl nitrates may introduce a bias in ourestimation of PAN, this bias is expected to be very small.3.3.2. Variation of NOy Partitioning[46] From Figure 4a, it is evident that although reactive
nitrogen is principally emitted as NO, it largely exists in itssecondary reservoir forms in the central North Atlanticlower FT all year-round. Low NOx/NOy ratios (11–19%;Table 3) are consistent with long-range transport andphotochemical processing times to the measurement site.Because of the relatively short lifetime of NOx compared toNOy, NOx/NOy is expected to decrease with increasing airmass age. In the remote lower FT, typical NOx/NOy valuesof 10–17% have been observed all year-round [Ridley etal., 1998; Atlas et al., 1992; Singh et al., 2007], consistentwith the values observed at the Pico Mountain station.[47] The shift from dominance of PAN in winter-spring to
dominance of HNO3 in summer-fall in Figure 4a is note-worthy. The small contribution of PAN during the summer(21 ± 8%; Table 3) is attributed to the strong thermaldecomposition of PAN to NOx in the North Atlantic lowerFT. Conversely, the large fraction of HNO3 (71 ± 9%;Table 3) is directly related to the efficient formation ofHNO3 from reaction of NOx with OH, as conversion of NOx
to HNO3 is 5 times faster during summer than winter[Logan, 1983]. Indirectly, the strong decomposition ofPAN during the summer may result in the formation ofHNO3 as NOx is ultimately converted to HNO3.[48] To evaluate the effect of temperature on PAN, we
examined the lifetime of PAN with respect to thermaldecomposition in the air masses during transit to the PicoMountain station. For this purpose, we extracted the averagetemperature from the HYSPLIT model output [Draxler andRolph, 2003] for the 10-day backward trajectories arrivingat the measurement site. More information on the HYSPLITbackward trajectories is presented elsewhere [Honrath et
Figure 4. Seasonal cycle of (a) partitioning of reactivenitrogen (HNO3*, PAN*, and NOx) and average lifetime ofPAN with respect to thermal decomposition in the airarriving at the Pico Mountain station and (b) CO in in-cloud(RH > 96%) and out-of-cloud (RH < 60%) periods. (Seetext for explanation.) Symbols represent monthly averagesfor HNO3* (green circles), PAN* (blue triangles), NOx (reddiamonds), CO RH > 96% (red squares) and CO RH < 60%(black circles), and average of the monthly means for PANlifetime (black squares). Vertical bars indicate the 2 standarderror of the mean for CO, NOx, and PAN*; the uncertainty(2s) based on propagation of errors for HNO3*; and theminimum and maximum estimated monthly PAN lifetime.
D17307 VAL MARTIN ET AL.: REMOTE NORTH ATLANTIC NITROGEN OXIDES
10 of 15
D17307

al., 2004; Val Martin et al., 2006]. We calculated theaverage temperature in the air masses from the measurementsite to 3 days upwind. This average temperature is thetypical temperature that the air masses encounter beforearriving at the Pico Mountain station. We then used thoseaverage values to calculate the lifetime of PAN. Figure 4ashows the lifetime of PAN in the air masses determinedfrom the monthly average upwind temperatures from July2002 to August 2005. The average lifetime of PAN underthose conditions ranged from 5 days in March (averagetemperature �4.4�C) to 0.5 days in August (averagetemperature 8.9�C). Therefore, the dominance of PAN inNOy in winter-early spring is consistent with the longerlifetime of PAN in the air masses, whereas the rapid decom-position of PAN in the air masses during the summer resultsin the lower PAN fraction observed during that season.Because of the rapid oxidation of NOx by OH in the summer(]1 day), PAN decomposition may result in the formation ofHNO3 before the air masses reach the Pico Mountain station.3.3.3. Comparison to Previous Observations[49] A comparison of the distribution of NOy species at
the Pico Mountain station to those collected over thewestern North Atlantic Ocean during the North AtlanticRegional Experiment (NARE) and ICARTT aircraftcampaigns from spring to fall [Parrish et al., 2004; Li etal., 2004; Singh et al., 2007; Hudman et al., 2007] allowsfor some speculation on the behavior of nitrogen oxidesacross the North Atlantic region. Table 4 compares thefractions of reactive nitrogen species measured during theICARTT and NARE campaigns with those estimated atthe Pico Mountain station.[50] Our spring-fall estimates of the fraction of NOx
(9–19%), PAN* (21–45%) and HNO3* (47–71%) aresimilar to those observed over the western Atlantic Ocean
in those other studies (5–13% for NOx, 21–47% for PANand 40–72% for HNO3; range of averages in 2–4 kmand 2.5–6.5 km altitudes from Table 4). However, asdiscussed in section 3.2.1, levels of NOy at the PicoMountain station are 2–3 times lower than those over thewestern Atlantic region, indicating the significant removalof HNO3 during transport to the measurement site. Theseresults suggest that to maintain the observed fractions ofNOx and HNO3* at the Pico Mountain station, decomposi-tion of PAN to NOx and further oxidation of NOx to HNO3
must occur in the air masses.3.3.4. Comparison to GEOS-Chem[51] Global chemical transport models have important
difficulties in simulating nitrogen oxides [e.g., Emmons etal., 1997; Thakur et al., 1999; Singh et al., 2007]. As a firstevaluation of a CTM in the lower FT over the central NorthAtlantic region using the Pico Mountain measurements, wecompare the Pico mountain observations to simulationsfrom the well-known CTM GEOS-Chem. Figures 5a–5ccompares the measurements with results obtained fromGEOS-Chem for NOy, HNO3*, PAN* and NOx. Addition-ally, the model-data comparison for CO is shown inFigure 5d. GEOS-Chem simulations were available fromJanuary to December 2005, whereas data from the PicoMountain station in 2005 were available only from Januaryto August. To be able to compare a full year cycle, wecompared GEOS-Chem simulations to all data in 2002–2005. To avoid potential biases resulting from interannualvariability, we also compared GEOS-Chem simulations tothe data available in 2005 only. The model-data comparisonfocuses mainly on the median since this value is lessaffected by the variability resulting from large episodicevents, with the exception of HNO3* and PAN*, whichare based on the estimated averages. Vertical bars reflect the
Table 4. Partitioning of NOy Estimates Reported From ICARTT, NARE, and Pico Mountain Studiesa
Study Altitude (km) Season [NOx]/[NOy]b [PAN]/[NOy]
a [HNO3]/[NOy]b Sourcec
Pico Mountain 2.2 Spring 11 45 49 1Pico Mountain 2.2 Summer 9–16 21–34 53–71Pico Mountain 2.2 Fall 19 29 47Pico Mountain 2.2 Winter 19 40 27NARE96 2–8 Spring 11 42 47 2NARE96 2–8 Spring 5 35 60 3NARE96 2–4d Spring 5 3NARE96 4–6d Spring 3 3NARE97 2–8 Fall 8 34 57 4NARE97 2–8 Fall 6 33 61 3NARE97 2–4 Fall 7 21 72 3NARE97 4–6 Fall 6 40 54 3ICARTT 2.5–6.5 Summer 13 47 40 5ICARTT 2.5–3.5 Summer — — 54ICARTT 3.5–6.5 Summer 14 53 33ICARTT 2–8 Summer 8 35 44 6ICARTT 2–4 Summer 8 26 60ICARTT 4–6 Summer 7 43 43
aNOy estimates given in percent. Dashes indicate that values are not reported.bNOy composition reported is as follows: for Pico Mountain, in spring, fall, and winter average percentages (Table 3) and in
summer minimum and maximum average percentages reported in Table 3 and estimated from alternating measurements of(NOy-HNO3) and NOy (see text for explanation) and for NARE and ICARTT, average percentages reported in North Americanoutflow [Parrish et al., 2004; Li et al., 2004; Hudman et al., 2007], percentages calculated using means reported every 2-kmaltitude bins [Singh et al., 2007], or average percentages calculated using 10-s average observations east of 60�W (D. Parrish,NOAA, United States, personal communication, 2007).
cSources are as follows: 1, This work; 2, Parrish et al. [2004]; 3, D. Parrish (NOAA, United States, personalcommunication, 2007); 4, Parrish et al. [2004] and Li et al. [2004]; 5, Hudman et al. [2007]; 6, Singh et al. [2007].
dAverages with fewer than 25 data points are not shown.
D17307 VAL MARTIN ET AL.: REMOTE NORTH ATLANTIC NITROGEN OXIDES
11 of 15
D17307

population variability, and not the uncertainty in themedians and means, which are much less since at least100 points were used in the calculation of each median andmean.[52] From Figure 5a, it is apparent that GEOS-Chem
reproduces the annual variation of NOy observed at thePico Mountain station. However, GEOS-Chem tends tooverestimate NOy. As shown in Figure 5b, this overestima-tion is mainly because of an excess of HNO3. For example,during summer, GEOS-Chem produces monthly HNO3
medians 50–150 pptv greater than the 2005 NOy mediansat the Pico Mountain station, and about a factor of twohigher than our estimated HNO3. This problem is known tooccur in multiple CTMs [e.g., Lawrence and Crutzen, 1998;Bey et al., 2001; Singh et al., 2007], and may be related toan overestimation of OH concentrations [Singh et al., 2007],to insufficient scavenging in the model [Bey et al., 2001] ora combination of these and other causes.[53] Because of the scavenging scheme used in
GEOS-Chem, it has been suggested that the model allowsfor significant escape of nitrogen oxides to the lower FT andreasonably accurate simulation of shallow convectionfrom the United States BL to the lower FT during summer[Li et al., 2004; Hudman et al., 2007]. The strong summerpeak in the GEOS-Chem NOy cycle indicates that
enhanced summertime export may be partially responsiblefor the increased summertime NOy levels over the centralNorth Atlantic lower FT, as suggested above. However,the larger summertime values produced by GEOS-Chemindicate an inability to capture the actual magnitude of NOy
over the North Atlantic lower FT.[54] Figure 5b shows the comparison between simulated
PAN levels and observations. The model produces anannual variation of PAN similar to that estimated at thePico Mountain station. However, GEOS-Chem tends tounderestimate PAN, in particular from July to September,when GEOS-Chem values are a factor of 6–7 times lowerthan the observations. This behavior may be related to anexcessive decomposition of PAN in the model resultingfrom inaccurate temperature parameters and/or location ofthe air masses, or underestimation of NOx and/or NMHCemissions. Finally, a removal efficiency for HNO3 less than100% within the clouds present at the Pico Mountain stationcould also contribute to this model-data difference, sincePAN* was calculated by assuming complete removal ofHNO3 in the presence of clouds at the station. Were this thecase, it would also reduce the HNO3 model-data differenceduring summer, but only by 20%, not changing the conclu-sion that HNO3 exceeds the simulated values.
Figure 5. Comparison of observations (a) NOy in dry conditions (see section 3.3.1 for explanation),(b) HNO3* and PAN*, (c) NOx, and (d) CO to GEOS-Chem simulations. Symbols represent monthlymedians in 2002–2005 (blue circles) and in 2005 (cyan squares) for NOy, NOx, and CO; monthlymedians in 2005 for GEOS-Chem NOy, NOx, and CO (blue squares); monthly averages in 2002–2005 forHNO3* (green circles) and PAN* (blue triangles) and in 2005 for GEOS-Chem HNO3 (open circles) andGEOS-Chem PAN (open triangles). Vertical bars indicate the 10th and 90th percentile for observed andsimulated NOy, NOx, and CO; the standard deviation of all estimates of PAN* and GEOS-Chemsimulations of HNO3 and PAN; and the standard deviation based on propagation of errors for HNO3*.
D17307 VAL MARTIN ET AL.: REMOTE NORTH ATLANTIC NITROGEN OXIDES
12 of 15
D17307

[55] A comparison of simulated and observed NOx
levels is shown in Figure 5c. Similar to our measurements,GEOS-Chem does not simulate a clear seasonal cycle forthe median NOx values. GEOS-Chem simulations producemonthly medians (21–35 pptv) similar to those observedat the Pico Mountain station (21–30 pptv in 2005 and 16–29 pptv in 2002–2005). However, the model does notcapture the very large variability in the NOx mixing ratios,particularly that associated with transport of boreal wildfiresin summer 2005. This is not unexpected, since the versionof GEOS-Chem used here did not incorporate interannualvariation in boreal fire activity.[56] Figure 5d shows observed and modeled CO values.
GEOS-Chem CO exhibits a seasonal variation similar tothat observed at the Pico Mountain station, but systemati-cally underestimates the CO observations in 2005 by 10 to25 ppbv. This behavior has been noted previously [Bey etal., 2001], and may be related to an excess of OH in themodel and/or to the underestimation of the CO emissions.During July–September, this difference is more apparent.GEOS-Chem simulates a sharp decrease of CO throughthese months, whereas the observed CO remain stable. Thismay be related to the strong impact of boreal wildfireemissions during these months in both 2004 and 2005,which it is not simulated by the fire emission inventory usedin this GEOS-Chem simulation.[57] This comparison shows that, although current
chemical transport models have become more sophisticated[Singh et al., 2007], uncertainties in simulating nitrogenoxides in the remote lower FT remain. These uncertaintiesare clearly related to errors in emission sources andlimitations in our understanding of the nitrogen oxideschemistry in the remote troposphere.
4. Summary and Conclusions
[58] Measurements of nitrogen oxides made at the PicoMountain station from July 2002 to August 2005 were usedto estimate the magnitude and seasonal variability of nitro-gen oxides over the central North Atlantic lower FT and todetermine the processes that contribute to this variability.[59] These measurements reveal the presence of a well-
defined seasonal cycle in the variability of nitrogen oxidesin the background central North Atlantic lower FT, withlarger mixing ratios during the summertime. We attributethe presence of larger summertime nitrogen oxides levels toimpacts of boreal wildfire emissions and a more efficientexport of NOy from eastern North America during thisseason. Median NOx (17–31 pptv) and NOy (125–338 pptv)observed at the Pico Mountain station were lower than thosepreviously observed over the western North Atlantic regionand similar to those observed at the remote marine NorthPacific MLO station. The observed NOx and NOy levels wereconsistent with long-range transport of emissions withsignificant removal upwind of the measurement site.[60] Observations of NOx and NOy and estimates of PAN
and HNO3 indicate that reactive nitrogen over the centralNorth Atlantic lower FT largely exists in the form of HNO3
and PAN, independent of the season. The shift fromdominance of PAN in winter-spring to dominance ofHNO3 in summer-fall is attributed to strong decompositionof PAN to NOx and efficient formation of HNO3 from rapid
reaction of NOx with OH during the summer and fallseasons.[61] Estimated HNO3 accounts for 53–71% of NOy
during the summer. Given the significant removal of NOy
during transport, this suggests that the oxidation of NOx
resulting from decomposition of PAN in the air massesduring subsidence, or advection over the ocean withminimal removal, results in a significant source of HNO3
to the central North Atlantic lower FT. The decompositionof PAN in the air masses has important implications for O3
formation, since released NOx is available to form O3 beforeoxidation to HNO3 during transport to the central NorthAtlantic lower FT.[62] A comparison of nitrogen oxides observations with
GEOS-Chem simulations indicates that GEOS-Chem repro-duces some of the seasonal variation of nitrogen oxidesover the central North Atlantic lower FT. However, it doesnot capture the magnitude of the cycles. Important differ-ences were found for PAN (a critical species in the globalformation of O3 via dispersal and release of NOx) andHNO3. This underscores the need for continuing evaluationof the accuracy of simulations of nitrogen oxides chemistryin highly aged pollution plumes.
[63] Acknowledgments. We thank many people involved in thedevelopment, installation, and maintenance of the Pico Mountain stationand the NOx,y system, in particular, M. Dziobak (Michigan Tech, UnitedStates), P. Fialho (Azores University, Portugal), D. Helmig (ColoradoUniversity, United States), and D. Tanner (Colorado University, UnitedStates). In addition, we thank J. Kleissl (University of California at SanDiego, United States) for providing the analysis of upslope flow periods,D. Parrish (NOAA, United States) for supplying the NARE96 and NARE97data set, B. Ridley (National Center for Atmospheric Research (NCAR),United States) for providing the MLOPEX data set, D. Henriques (Instituteof Meteorology, Portugal) for providing the ECMWF data used to run theFLEXPART simulations, and the NOAA Air Resources Laboratory forprovision of the HYSPLIT transport model. This work was supported byNOAA, Office of Global Programs grants NA16GP1658, NA86GP0325,and NA03OAR4310002; the National Science Foundation grants ATM-0215843, ATM-0535486, and INT-0110397; Azores Cooperative InitiativeProgram USDA grant 58-3625-5-127; Azores Regional Secretariat forScience and Technology (project M1.2.1/I/006/2005, project M1.2.1/I/001/2008, and project M1.2.1/I/002/2008); and Program INTER-REGIIIB, Azores, Madeira, and Canarias (project CLIMARCOST FEDER-INTERREG IIIB-05/MAC/2.3/A1). Q.B. Li’s research is performed at theJet Propulsion Laboratory, California Institute of Technology, undercontract with NASA and was supported in part by NASA’s AtmosphericComposition Program under P. DeCola.
ReferencesAndreae, M., and P. Merlet (2001), Emissions from trace gases and aerosolsfrom biomass burning, Global Biogeochem. Cycles, 15, 955–966.
Atlas, E. L., B. A. Ridley, G. Hubler, J. G. Walega, M. A. Carroll, D. D.Montzka, B. J. Huebert, R. B. Norton, F. E. Grahek, and S. Schauffler(1992), Partitioning and budget of NOy species during the MaunaLoa Observatory Photochemistry Experiment, J. Geophys. Res., 97,10,449–10,462.
Bey, I., et al. (2001), Global modeling of tropospheric chemistry withassimilated meteorology: Model description and evaluation, J. Geophys.Res., 106, 23,073–23,096.
Bollinger, M. J., R. E. Sievers, D. W. Fahey, and F. C. Fehsenfeld (1983),Conversion of nitrogen dioxide, nitric acid, and n-propyl nitrate to nitricoxide by gold-catalyzed reduction with carbon monoxide, Anal. Chem.,55, 1980–1986.
Bradshaw, J., D. Davis, G. Grodzinsky, R. Newell, S. Sandholm, and S. Liu(2000), Observed distributions of nitrogen oxides in the remote freetroposphere from NASA Global Tropospheric Experiment programs,Rev. Geophys., 38, 61–116.
Buhr, M. P., K. J. Hsu, C. M. Liu, R. Liu, L. Wei, Y. C. Liu, and Y. S. Kuo(1996), Trace gas measurements and air mass clasification from a groundstation in Taiwan during the PEM-West A experiment (1991), J. Geo-phys. Res., 101, 2025–2035.
D17307 VAL MARTIN ET AL.: REMOTE NORTH ATLANTIC NITROGEN OXIDES
13 of 15
D17307

Chameides, W. L. (1984), The photochemistry of a remote marine strati-form cloud, J. Geophys. Res., 89, 4739–4755.
Chandra, S., J. R. Ziemke, X. Tie, and G. Brasseur (2004), Elevatedozone in the troposphere over the Atlantic and Pacific oceans in theNorthern Hemisphere, Geophys. Res. Lett., 31, L23102, doi:10.1029/2004GL020821.
Crutzen, P. J. (1979), The role of NO and NO2, Ann. Revu. Earth Planet.Sci., 7, 443–472.
Derwent, R., D. Stevenson, W. Collins, and C. Johnson (2004), Interconti-nental transport and the origins of the ozone observed at surface sites inEurope, Atmos. Environ., 38, 1891–1901.
DiNunno, B., et al. (2003), Central/eastern North Pacific photochemicalprecursors distributions for fall/spring seasons as defined by airborne fieldstudies, J. Geophys. Res., 108(D2), 8240, doi:10.1029/2001JD001044.
Draxler, R., and G. Rolph (2003), HYSPLIT4 Model, http://www.arl.noaa.gov/ready/hysplit4.html, NOAA Air Resour. Lab., Silver Spring, Md.
Duncan, B., R. Martin, A. Staudt, R. Yevich, and J. Logan (2003), Inter-annual and seasonal variability of biomass burning emissions constrainedby satellite observations, J. Geophys. Res., 108(D2), 4100, doi:10.1029/2002JD002378.
Edwards, D. P., et al. (2004), Observations of carbon monoxide and aero-sols from the Terra satellite: Northern Hemisphere variability, J. Geophys.Res., 109, D24202, doi:10.1029/2004JD004727.
Emmons, L., et al. (1997), Climatologies of NOx and NOy: A comparison ofdata and models, Atmos. Environ., 31, 1851–1904.
Emmons, L. K., D. A. Hauglustaine, J.-J. Muller, M. A. Carroll, G. P.Brasseur, D. Brunner, J. Staehelin, V. Thouret, and A. Marenco (2000),Data composites of airborne observations of tropospheric ozone and itsprecursors, J. Geophys. Res., 105, 20,497–20,538.
Environmental Protection Agency (1997), National air pollutant emissiontrends, 1990–1997, Tech. Rep. EPA 454/R-97-011, Washington, D. C.
Environmental Protection Agency (2006), Air quality criteria for ozone andrelated photochemical oxidants, Tech. Rep. EPA 600/R-05/004aF-cF,Washington, D. C.
European Center for Medium-Range Weather Forecasts (2005), Usersguide to ECMWF products 4.0, Tech. Rep. Meteorol. Bull. M3.2,Reading, U. K.
European Monitoring and Evaluation Program (1997), Transboundary airpollution in Europe, part I, Emissions, dispersion and trends of acidifyingand eutrophying agents, Tech. Rep. EMEP/MSC-W Rep. 1/97, Norw.Meteorol. Inst., Oslo.
Fahey, D. W., C. S. Eubank, G. Hubler, and F. C. Fehsenfeld (1985),Evaluation of a catalytic reduction technique for the measurement oftotal reactive odd-nitrogen NOy in the atmosphere, J. Atmos. Chem., 3,435–468.
Fischer, H., et al. (1998), Trace gas measurements during the OxidizingCapacity of the Tropospheric Atmosphere campaign 1993 at Izana,J. Geophys. Res., 103, 13,505–13,518.
Garrett, T. J., L. Avey, P. I. Palmer, A. Stohl, J. A. Neuman, C. A. Brock,T. B. Ryerson, and J. S. Holloway (2006), Quantifying wet scavengingprocesses in aircraft observations of nitric acid and cloud condensationnuclei, J. Geophys. Res., 111, D23S51, doi:10.1029/2006JD007416.
Goode, J. G., R. J. Yokelson, D. E. Ward, R. A. Susott, R. E. Babbitt, M. A.Davies, and W. M. Hao (2000), Measurements of excess O3, CO, CO2,CH4, C2H6, C2H4, HCN, NO, NH3, HCOOH, CH3COOH, HCHO, andCH3OH in 1997 Alaskan biomass burning plumes by airborne Fouriertransform infrared spectroscopy (AFTIR), J. Geophys. Res., 105,22,147–22,166.
Hangal, S., and K. Willeke (1990), Overall efficiency of tubular inletssampling at 0–90 degrees from horizontal aerosol flows, Atmos. Environ.,Part A, 24, 2379–2386.
Helmig, D., D. M. Tanner, R. E. Honrath, R. C. Owen, and D. D. Parrish(2008), Non-methane hydrocarbons (NMHC) at Pico Mountain, Azores:1. Oxidation chemistry in the North Atlantic region, J. Geophys. Res.,doi:10.1029/2007JD008930, in press.
Honrath, R. E., R. C. Owen, M. Val Martin, J. S. Reid, K. Lapina, P. Fialho,M. P. Dziobak, J. Kleissl, and D. L. Westphal (2004), Regional andhemispheric impacts of anthropogenic and biomass burning emissionson summertime CO and O3 in the North Atlantic lower free troposphere,J. Geophys. Res., 109, D24310, doi:10.1029/2004JD005147.
Hudman, R. C., et al. (2007), Surface and lightning sources of nitrogenoxides over the United States: Magnitudes, chemical evolution, and out-flow, J. Geophys. Res., D12S05, doi:10.1029/2006JD007912.
Intergovernmental Panel on Climate Change (2007), Climate Change 2007:The Physical Science Basis. Contribution of Working Group I to theFourth Assessment Report of the Intergovernmental Panel on ClimateChange, edited by S. Solomon et al., Cambridge Univ. Press, Cambridge,UK and New York, USA.
Jacob, D. J., J. A. Logan, G. M. Gardner, R. M. Yevich, C. M. Spivakovsky,S. C. Wofsy, S. Sillman, and M. J. Prather (1993), Factors regulating
ozone over the United States and its export to the global atmosphere,J. Geophys. Res., 98(D8), 14,817–14,826, doi:10.1029/93JD01224.
Jaegle, L., L. Steinberger, R. V. Martin, and K. Chance (2005), Globalpartitioning of NOx sources using satellite observations: Relative rolesof fossil fuel combustion, biomass burning and soil emissions, FaradayDiscuss., 130, 407–423, doi:10.1039/b502128f.
Jaffe, D., H. Price, D. Parrish, A. Goldstein, and J. Harris (2003), Increasingbackground ozone during spring on the west coast of North America,Geophys. Res. Lett., 30(12), 1613, doi:10.1029/2003GL017024.
Kasischke, E. S., and M. R. Turetsky (2006), Recent changes in the fireregime across the North American boreal region: Spatial and temporalpatterns of burning across Canada and Alaska, Geophys. Res. Lett., 33,L09703, doi:10.1029/2006GL025677.
Kleissl, J., R. Honrath, M. Dziobak, D. Tanner, M. Val Martın, R. Owen, andD. Helmig (2007), The occurrence of upslope flows at the Pico mountain-top observatory: A case study of orographic flows on small, volcanicisland, J. Geophys. Res., 112, D10S35, doi:10.1029/2006JD007565.
Kley, D., and M. McFarland (1980), Chemiluminescence detector for NOand NO2, Atmos. Technol., 12, 63–69.
Kliner, D., B. Daube, J. Burley, and S. Wofsey (1997), Laboratory inves-tigation of the catalytic reduction technique for measurement of atmo-spheric NOy, J. Geophys. Res., 102, 10,759–10,776.
Kondo, Y., M. Koike, S. Kawakami, H. B. Singh, H. Nakajima, G. L.Gregory, D. R. Blake, G. W. Sachse, J. T. Merrill, and R. E. Newell(1997), Profiles and partitioning of reactive nitrogen over the PacificOcean in winter and early spring, J. Geophys. Res., 102, 28,405–28,424.
Lawrence, M. G., and P. J. Crutzen (1998), The impact of cloud particlegravitational settling on soluble trace gas distributions, Tellus, Ser. B, 50,263–289.
Lawrence, M. G., and P. J. Crutzen (1999), Influence of NOx emissionsfrom ships on tropospheric photochemistry and climate, Nature, 33,167–170.
Leue, C., M. Wenig, T. Wagner, O. Klimm, U. Platt, and B. Jahne (2001),Qualitative analysis of NOx emissions from Global Ozone MonitoringExperiment satellite image sequences, J. Geophys. Res., 106, 5493–5505.
Li, Q., et al. (2002), Transatlantic transport of pollution and its effects onsurface ozone in Europe and North America, J. Geophys. Res., 107(D13),4166, doi:10.1029/2001JD001422.
Li, Q., D. Jacob, J. Munger, R. Yantosca, and D. Parrish (2004), Export ofNOy from the North American boundary layer: Reconciling aircraftobservations and global model budgets, J. Geophys. Res., 109, D02313,doi:10.1029/2003JD004086.
Liu, S. C., M. Trainer, F. C. Fehsenfeld, D. D. Parrish, E. J. Williams, D. W.Fahey, G. Hubler, and P. C. Murphy (1987), Ozone production in therural troposphere and the implications for regional and global ozonedistributions, J. Geophys. Res., 92, 4191–4207.
Liu, X., et al. (2006), First directly retrieved global distribution of tropo-spheric column ozone from GOME: Comparison with the GEOS-Chemmodel, J. Geophys. Res., 111, D02308, doi:10.1029/2005JD006564.
Logan, J. A. (1983), Nitrogen oxides in the troposphere: Global and regio-nal budgets, J. Geophys. Res., 88, 10,785–10,807.
Martin, R. V., D. D. Parrish, T. B. Ryerson, D. K. Nicks Jr., K. Chance, T. P.Kurosu, D. J. Jacob, E. D. Sturges, A. Fried, and B. P. Wert (2004),Validation of GOME satellite measurements of tropospheric NO2 andHCHO using regional data from aircraft campaigns in the southeasternUnited States, J. Geophys. Res. , 109, D24307, doi:10.1029/2004JD004869.
Merrill, J. T., and J. L. Moody (1996), Synoptic meteorology and transportduring the North Atlantic Regional Experiment (NARE) intensive: Over-view, J. Geophys. Res., 101, 28,903–28,921.
Miyazaki, Y., et al. (2005), Contribution of particulate nitrate to airbornemeasurements of total reactive nitrogen, J. Geophys. Res., 110(D15),D15304, doi:10.1029/2004JD005502.
Moxim, W. J., H. Levy, and P. S. Kasibhatla (1996), Simulated globaltropospheric PAN: Its transport and impact, J. Geophys. Res., 101,12,621–12,638.
Nesbitt, S. W., R. Whang, and R. Orville (2000), Seasonal and global NOproduction by lightning estimated from the Optical Transient Detector(OTD), J. Geophys. Res., 52, 1206–1215.
Neuman, J. A., et al. (2006), Reactive nitrogen transport and photochem-istry in urban plumes over the North Atlantic Ocean, J. Geophys. Res.,111(D23), D23S54, doi:10.1029/2005JD007010.
Novelli, P. C., L. P. Steele, and P. P. Tans (1992), Mixing ratios of carbonmonoxide in the troposphere, J. Geophys. Res., 97, 20,731–20,750.
Novelli, P. C., K. A. Masarie, P. M. Lang, B. D. Hall, R. C. Myers, and J. W.Elkins (2003), Reanalysis of tropospheric CO trends: Effects of the1997–1998 wildfires, J. Geophys. Res., 108(D15), 4464, doi:10.1029/2002JD003031.
Owen, R. C., O. R. Cooper, A. Stohl, and R. E. Honrath (2006), Ananalysis of the mechanisms of North American pollutant transport to
D17307 VAL MARTIN ET AL.: REMOTE NORTH ATLANTIC NITROGEN OXIDES
14 of 15
D17307

the central North Atlantic lower free troposphere, J. Geophys. Res., 111,D23S58, doi:10.1029/2006JD007062.
Parrish, D. D., and F. C. Fehsenfeld (2000), Methods for gas-phasemeasurements of ozone, ozone precursors and aerosol precursors, Atmos.Environ., 34, 1921–1957.
Parrish, D. D., M. Trainer, E. J. Williams, D. W. Fahey, G. Hubler, C. S.Eubank, S. C. Liu, P. C. Murphy, D. L. Albritton, and F. C. Fehsenfeld(1986), Measurements of the NOx–O3 photostationary state at NiwotRidge, Colorado, J. Geophys. Res., 91, 5361–5370.
Parrish, D. D., et al. (1990), Systematic variations in the concentration ofNOx (NO plus NO2) at Niwot Ridge, Colorado, J. Geophys. Res., 95,1817–1836.
Parrish, D. D., et al. (2004), Fraction and composition of NOy transported inair masses lofted from the North American boundary layer, J. Geophys.Res., 109, D09302, doi:10.1029/2003JD004226.
Peterson, M. C., and R. E. Honrath (1999), NOx and NOy over the north-western North Atlantic: Measurements and measurement accuracy,J. Geophys. Res., 104, 11,695–11,707.
Peterson, M. C., R. E. Honrath, D. D. Parrish, and S. J. Oltmans (1998),Measurements of nitrogen oxides and a simple model of NOy fate in theremote North Atlantic marine atmosphere, J. Geophys. Res., 103,13,489–13,503.
Reeves, C. E., et al. (2007), Alkyl nitrates in outflow from North Americaover the North Atlantic during Intercontinental Transport of Ozone andPrecursors 2004, J. Geophys. Res., 112, D10S37, doi:10.1029/2006JD007567.
Richter, A., J. Burrows, H. Nub, C. Granier, and U. Niemeier (2005),Increase in tropospheric nitrogen dioxide over China observed fromspace, Nature, 437, 129–132, doi:10.1038/nature04092.
Ridley, B. A., and F. E. Grahek (1990), A small, low flow, high sensitivityreaction vessel for NO chemiluminescence detectors, J. Atmos. Technol.,7, 307–311.
Ridley, B., et al. (1998), Measurements of NOx and PAN and estimates ofO3 production over the seasons during Mauna Lao Observatory Photo-chemistry Experiment 2, J. Geophys. Res., 103, 8323–8339.
Simmonds, P. G., R. G. Derwent, A. L. Manning, and G. Spain (2004),Significant growth in surface ozone at Mace Head, Ireland, 1987–2003,Atmos. Environ., 38, 4769–4778, doi:10.1016/j.atmosenv.2004.04.036.
Singh, H. B., et al. (2007), Reactive nitrogen distribution and partitioning inthe North American troposphere and lowermost stratosphere, J. Geophys.Res., 112, D12S04, doi:10.1029/2006JD007664.
Spichtinger, N., M. Wenig, P. James, T. Wagner, U. Platt, and A. Stohl(2001), Satellite detection of a continental-scale plume of nitrogen oxidesfrom boreal forest fires, Geophys. Res. Lett., 28, 4579–4582.
Stohl, A. (1998), Computation, accuracy and applications of trajectories: Areview and bibliography, Atmos. Environ., 32, 947–966.
Stohl, A., et al. (2000), The influence of stratospheric intrusions on alpineozone concentrations, Atmos. Environ., 34, 1323–1354.
Stohl, A., et al. (2003), Rapid intercontinental air pollution transport asso-ciated with a meteorological bomb, Atmos. Chem. Phys. Discuss., 3,969–985.
Stohl, A., C. Forster, A. Frank, P. Seibert, and G. Wotawa (2005), TheLagrangian particle dispersion model FLEXPART version 6.2, Atmos.Chem. Phys. Discuss., 5, 2461–2474.
Thakur, A. N., H. B. Singh, P. Mariani, Y. Chen, Y. Wang, D. J. Jacob,G. Brasseur, J.-F. Muller, and M. Lawrence (1999), Distribution ofreactive nitrogen species in the remote free troposphere: Data andmodel comparisons, Atmos. Environ., 33, 1403–1422.
Thompson, A. M., et al. (2007), Intercontinental Chemical TransportExperiment Ozonesonde Network Study (IONS) 2004: 1. Summertimeupper troposphere/lower stratosphere ozone over northeastern NorthAmerica, J. Geophys. Res., 112, D12S12, doi:10.1029/2006JD007441.
Val Martin, M. (2007), Nitrogen oxides in the North Atlantic Troposphere:Impacts of boreal wildfire and anthropogenic emissions, Ph.D. thesis,Mich. Technol. Univer., Houghton.
Val Martin, M., R. Honrath, R. C. Owen, G. Pfister, P. Fialho, and F. Barata(2006), Significant enhancements of nitrogen oxides, ozone and aerosolblack carbon in the North Atlantic lower free troposphere resulting fromNorth American boreal wildfires, J. Geophys. Res., 111, D23S60,doi:10.1029/2006JD007530.
Val Martin, M., R. Honrath, R. C. Owen, and K. Lapina (2008), Large-scaleimpacts of anthropogenic pollution and boreal wildfires on the nitrogenoxides levels over the central North Atlantic region, J. Geophys. Res.,113, D17308, doi:10.1029/2007JD009689.
Wang, Y., et al. (2003), Springtime photochemistry at northern mid andhigh latitudes, J. Geophys. Res., 108(D4), 8358, doi:10.1029/2002JD002227.
Wenig, M., N. Spichtinger, A. Stohl, G. Held, S. Beirle, T. Wagner, B. Jahne,and U. Platt (2003), Intercontinental transport of nitrogen oxide pollutionplumes, Atmos. Chem. Phys. Discuss., 3, 387–393.
Yamamoto, M., M. Tamaki, H. Bandow, and Y. Maeda (2001), HNO3
analyzer by scrubber difference and the NO–O3 chemiluminescencemethod, Atmos. Environ., 35, 5339–5346.
Yang, J., et al. (2002), Impacts of snowpack emissions on deduced levels ofOH and peroxy radicals at Summit, Greenland, Atmos. Environ., 36,2523–2534.
Zellweger, C., J. Forrer, P. Hofer, S. Nyeki, B. Schwarzenbach, E.Weingartner,M. Ammann, and U. Baltensperger (2003), Partitioning of reactive nitrogen(NOy) and dependence on meteorological conditions in the lower free tropo-sphere, Atmos. Chem. Phys. Discuss., 3, 779–796.
�����������������������R. E. Honrath and R. C. Owen, Department of Civil and Environmental
Engineering, Michigan Technological University, 1400 Townsend Drive,Houghton, MI 49931, USA. ([email protected]; [email protected])Q. B. Li, Jet Propulsion Laboratory, California Institute of Technology,
4800 Oak Grove Drive, Pasadena, CA 91109, USA.M. Val Martin, School of Engineering and Applied Sciences, Harvard
University, Pierce 193, 29 Oxford Street, Cambridge, MA 02138, USA.([email protected])
D17307 VAL MARTIN ET AL.: REMOTE NORTH ATLANTIC NITROGEN OXIDES
15 of 15
D17307


![How to reduce emission of nitrogen oxides [NOx] from ...](https://static.fdocuments.net/doc/165x107/616a4dd111a7b741a35108dc/how-to-reduce-emission-of-nitrogen-oxides-nox-from-.jpg)