Seasonal Movement, Growth, And Mortality Of Brook Trout...
35
1 SEASONAL MOVEMENT, GROWTH, AND MORTALITY OF BROOK TROUT IN SYMPATRY WITH BROWN TROUT IN HEADWATER STREAMS IN SOUTHEAST MINNESOTA 1 . R. John H. Hoxmeier and Douglas J. Dieterman Minnesota Department of Natural Resources 1801 South Oak Street Lake City, Minnesota 55041 Abstract: Although laboratory studies have provided evidence for competition between brook trout and brown trout, it is unknown how this competition affects larger scale demographics in a natural setting. We examined seasonal demographics of Drift- less Area brook trout populations in the presence of high and low brown trout densities. Seasonal and spatial patterns in growth, recruitment, survival and movement of brook trout were monitored in two southeastern Minnesota streams divided into upper and lower reaches based on the abundance of brown trout. We estimated survival and movement while testing for effects of stream reach and season using a multistrata Cor- mack-Jolly-Seber model in Program MARK. Multistrata models were analyzed for three age groups (age-0, age-1, and age-2+) to estimate apparent survival, capture probabili- ty, and movement. Survival was dependent on season rather than study reach and was lower during flood events. Age-0 brook trout emigrated from upper reaches to lower reaches, whereas, adult brook trout emigrated out of the downstream brown trout domi- nated reaches. Growth in spring and summer did not differ across streams or treat- ments for the youngest age classes. For age-2+ brook trout, however, growth was higher in areas where brown trout were less abundant. Competition can be age or size dependent; our results show evidence for adult interactions, but not age-0. Our results suggest that brown trout may be influencing adult brook trout distribution through forced emigration. Also, decreased growth rates of adult brook trout in the presence of brown trout warrants further research on possible mechanisms. 1 This project was funded in part by the Federal Aid in Sport Fish Restoration (Dingell-Johnson) Program. Completion Report, Study 675, D-J Project F-26-R Minnesota.
Transcript of Seasonal Movement, Growth, And Mortality Of Brook Trout...
1
SEASONAL MOVEMENT, GROWTH, AND MORTALITY OF BROOK TROUT IN SYMPATRY WITH BROWN TROUT IN HEADWATER STREAMS
IN SOUTHEAST MINNESOTA1.
R. John H. Hoxmeier and Douglas J. Dieterman Minnesota Department of Natural Resources
1801 South Oak Street Lake City, Minnesota 55041
Abstract: Although laboratory studies have provided evidence for competition between brook trout and brown trout, it is unknown how this competition affects larger scale demographics in a natural setting. We examined seasonal demographics of Drift-less Area brook trout populations in the presence of high and low brown trout densities. Seasonal and spatial patterns in growth, recruitment, survival and movement of brook trout were monitored in two southeastern Minnesota streams divided into upper and lower reaches based on the abundance of brown trout. We estimated survival and movement while testing for effects of stream reach and season using a multistrata Cor-mack-Jolly-Seber model in Program MARK. Multistrata models were analyzed for three age groups (age-0, age-1, and age-2+) to estimate apparent survival, capture probabili-ty, and movement. Survival was dependent on season rather than study reach and was lower during flood events. Age-0 brook trout emigrated from upper reaches to lower reaches, whereas, adult brook trout emigrated out of the downstream brown trout domi-nated reaches. Growth in spring and summer did not differ across streams or treat-ments for the youngest age classes. For age-2+ brook trout, however, growth was higher in areas where brown trout were less abundant. Competition can be age or size dependent; our results show evidence for adult interactions, but not age-0. Our results suggest that brown trout may be influencing adult brook trout distribution through forced emigration. Also, decreased growth rates of adult brook trout in the presence of brown trout warrants further research on possible mechanisms.
1 This project was funded in part by the Federal Aid in Sport Fish Restoration (Dingell-Johnson) Program. Completion Report, Study 675, D-J Project F-26-R Minnesota.

2
Although competition among salmonids has been well studied in both laboratory and field studies (see review by Hearn 1987), it is still unclear where and when these interactions take place. Much attention in terms of replacement of native trout species is focused in the western US where native cutthroat trout (Oncorhynchus clarkii) have been re-placed by both brook trout (Salvelinus fontinalis) and brown trout (Salmo trut-ta). While it is understood that brook trout negatively affect cutthroat trout in their native range, it’s been only recent-ly that we’ve gained a better under-standing of when and where these inte-ractions take place (Dunham et al. 2002). For example, it appears that brown and brook trout have a competi-tive advantage over cutthroat trout at lower elevations in many mountainous streams (Budy et al. 2008). Competi-tion usually does not occur throughout the year, but rather during a critical time period, for example, when prey or spawning habitat is limiting. In addition to seasonal and reach effects, age groups can also be affected differently. Brook trout have the largest competitive advantage over cutthroat trout as juve-niles, whereas competition at the adult stage can be minimal (Peterson et al. 2004).
A paradox among salmonids is that while brook trout are considered in-vaders in Western US and in Europe, they have difficulty sustaining popula-tions in their native range due to compe-tition from non-native salmonids (Fausch 2008). Brook trout in Minneso-ta are at the western edge of their native range and therefore have added impor-tance in terms of conservation (Lesica and Allendorf 1995; Haak et al. 2010). In the Midwestern United States, native brook trout are typically found in lower abundance than introduced brown trout.
Much of this has to do with the success-ful management of brown trout by fishe-ries management agencies. Because of degraded stream conditions brown trout were favored over brook trout by fishe-ries agencies given their higher proba-bility for success. Recent improvements in watershed and riparian areas in many parts of the Midwest has made brook trout management a viable option once again, however, increasing numbers of brown trout have made this manage-ment strategy challenging. Similar to other invaded salmonid systems, brook trout in the Midwest are characterized by small populations confined to head-water reaches of streams with brown trout occupying middle and lower por-tions (Weigel and Sorensen 2001). Whether this is caused by competition or inherent longitudinal habitat differ-ences is unclear (Magoulick and Wilz-bach 1998b). Differences in trout dis-tribution have been attributed to water temperature, elevation, gradient, and stream size (Kozel and Hubert 1989; Taniguchi et al. 1998; Bozek and Hubert 1992). Water temperature may play a role in this distribution by mediating competition between creek chubs (Se-motilus atromaculatus) and trout, but it did not explain distribution patterns be-tween brook trout and brown trout (Ta-niguchi et al. 1998). However, brook trout were more aggressive than brown trout in colder water temperatures in a laboratory setting (Magoulick and Wilz-bach 1998a). Another potential reason brook trout do better in headwater areas is that their life history is suited to the stream conditions. Pools are generally smaller and water temperatures colder, which may benefit a species such as brook trout with limited growth potential and early maturation (Öhlund et al. 2008).

3
Streams located in the Driftless Area of Minnesota, Wisconsin, Iowa, and Illinois offer a unique setting to study salmonid interactions. The Drift-less area, so called because it was missed by the last Wisconsin glaciation period, is characterized by limestone karst topography that creates numerous sinkholes and groundwater springs. Coldwater trout streams either originate from these groundwater springs or are created as these springs provide input along the course of the stream. Stream water temperatures warm (summer) or cool (winter) as they become further away from spring inputs. These streams lack the drastic elevation changes of trout streams in the Appala-chians or Rocky mountains. These streams are also high in alkalinity and highly productive (Kwak and Waters 1997). In addition to brook trout, brown trout have naturally reproducing popula-tions in most coldwater streams in sou-theastern Minnesota. Rainbow trout (Oncorhynchus mykiss) are stocked in some southeast Minnesota streams, but do not naturally reproduce.
Evidence of interspecific competi-tion can be obtained in a field setting by examining measures of survival, re-cruitment, and growth between areas with different densities of a presumed competitor. While this approach lacks the control inherent in a laboratory set-ting, the technique provides a better de-scription of whole populations under natural conditions. It also allows for emigration of the subordinate species, a result often not obtainable in closed stu-dies. Gathering basic demography data on brook trout is also important because very little information of this type exists for the Driftless Area. In addition, better understanding competitive interactions, insight on seasonal recruitment, growth, movement, and mortality is the basis for
any type of conservation plan for native species.
The objectives of our study were to describe seasonal demographics of a unique brook trout population in the presence of high and low brown trout densities. Specifically, we quantified seasonal and spatial patterns in growth, recruitment, survival and movement of Driftless Area brook trout in two sou-theastern Minnesota streams divided into upper and lower reaches based on the abundance of brown trout.
Methods
Study Area
To examine spatial differences in growth, movement, and survival, we chose three interconnected coldwater streams in Southeast Minnesota (Figure 1). All three streams had naturally re-producing brook trout and brown trout present in varying densities. Brook trout populations in these three streams were genetically unique to southeastern Min-nesota (Hoxmeier et al., in prep). Hemmingway Creek is 2.9km in length and flows into Pine Creek, a larger 4th order stream that is 28km in length. Coolridge Creek is a small stream 1.7km in length that also flows into Pine Creek, 0.4km below the mouth of Hem-mingway Creek. Watersheds of these three streams are primarily a mix of hardwood forests, pasture, and row crop agriculture. To test for brown trout den-sity effects, we divided Hemmingway and Coolridge creeks into two reaches based on brown trout density. The downstream ends of both Hemmingway and Coolridge Creeks had brown trout densities 3 to 28 times higher than the upstream portions. Therefore we set up our treatments as upper Hemmingway (UH, 730m) and upper Coolridge (UC, 515m) as brook trout dominated with

4
low brown trout density, and lower Hemmingway (LH, 935m) and lower Coolridge (LC, 1085m) as few brook trout and high brown trout density (Fig-ure 1). We did not have landowner permission to access the middle portion of Hemmingway Creek. Pine Creek had very few brook trout and high brown trout density and served as a corridor for fish travel between Hemmingway and Coolridge. We did not find many brook trout from Coolridge or Hemmingway that moved and stayed in Pine Creek and therefore, we did not include Pine Creek in any analyses.
Fish sampling
Trout were collected by electro-fishing the entirety of each of the four stream segments beginning in Septem-ber 2006. Electrofishing gear was de-pendent on the size of the streams. For lower Hemmingway, we used a tow barge with three anodes. In lower and upper Coolridge, and upper Hemming-way, we used a backpack electrofisher with one anode and dipnet. Captured trout greater than 100mm total length were measured and tagged with a pas-sive integrated transponder (PIT) and given an adipose fin clip to monitor any tag loss in future sampling occasions. Tags were initially inserted into the body cavity, but after observing tag loss, we began inserting tags into the dorsal musculature (Dieterman and Hoxmeier 2009). After tagging, trout were re-leased back into the pool from which they were captured. Brook trout were marked on three occasions: September 2006, March 2007, and August 2007. Trout were resampled approximately every three months to calculate season-al survival, movement, and growth esti-mates: spring, summer, fall, and winter. We typically sampled in the months of March, May, August, and November.
To confirm brown trout density treatments and estimate brook trout re-cruitment, two pass depletion population estimates were conducted in randomly chosen pools in each stream reach in the spring and fall. We defined recruit-ment by abundance of age-0 fish col-lected in our fall sample.
Brook trout were divided into three age groups based on length fre-quency histograms and known age fish. Known age fish were those tagged at age-0 and followed though to older ages. Our age groups consisted of age-0, age-1, and age-2+ (those fish age-2 and older; Figure 2 and 3). These age groups were chosen based on ecologi-cally important life stages. Age-0 brook trout typically use different stream habi-tats than adult brook trout and are sex-ually immature until their first fall. Our age-1 group consisted of sexually ma-ture males and females, and a transition period in terms of habitat use. The age-2+ group is where most brook trout be-come vulnerable to angler harvest. Be-cause age-0 brook trout were not vul-nerable to our collection methods until fall, we could not calculate estimates of growth, survival, and movement for spring and summer.
Growth in length was calculated from recaptured fish and expressed as growth rate (mm/day). We only used fish captured in consecutive sampling occasions for measurements of season-al growth. Because we were interested in examining reach effects on growth, fish that moved throughout reaches be-tween sampling occasions were not in-cluded in growth analysis. Also, given that growth is size dependent, we used size groups of <150, 150-200, and >200mm for comparison across reach-es. These size groups correspond to age-0, age-1, and age-2+ in the fall, but

5
they do not correspond to these age groups throughout the year.
Survival and movement
We estimated survival and movement while testing for effects of stream reach and season using a multi-strata Cormack-Jolly-Seber model in Program MARK. Multistrata models were analyzed for each age group to estimate apparent survival (S), capture probability (p), and movement (Ψ). Ef-fects of season (t) and stream reach (r) were tested for each parameter. Before developing a candidate set of models, goodness of fit for the global model (S(r*t)p(r*t)Ψ(r*t)) was tested using a Jolly-Move (JMV) model structure in U-CARE (Choquet et al. 2009). A good fit to this model would mean that estimates of survival, movement, and capture proba-bility are not being influenced by certain groups of tagged fish behaving different-ly. For example, a group of tagged fish may be trap dependent in one reach but not the other, thus biasing survival esti-mates. We then proceeded to develop demographic models for brook trout fol-lowing the suggestions of Lebreton et al. (1992), in that we initially held both sur-vival and movement constant to find the best capture probability based on lowest bias-corrected Akaike’s Information Cri-teria scores (AICc). We then used this capture probability model while holding survival constant to find the best move-ment model. Finally, using this “best” model for capture probability and movement, we developed a candidate set of models for survival. Estimates of survival are considered apparent surviv-al because fish could have moved out of our study area. Our candidate set of models included 6 models: global model with all three parameters varying by reach and season, survival varying by season, by reach, reach and season,
constant, brown trout density, and brown trout density and season. Brown trout density (treatment) was tested for by grouping both upper stations (UH and UC) for a low brown trout density treatment, and both lower stations (LH and LC) representing high brown trout density using the Parameter Information Matrix (PIM) chart function in Program Mark. Models were ranked using AICc and were determined to be supported if they had a delta AIC (Δi) value less than two (Burnham and Anderson 2002). We also calculated Akaike weights (wi) to examine the relative likelihood of each model. If more than one model had support we used model averaging to es-timate parameter values. Because time between sampling was not exactly three months for all occasions, we scaled all estimates in program MARK to three month intervals.
Because tag retention for brook trout tagged in the body cavity was not 100%, we removed the appropriate number of fish never re-captured again to account for tag loss. We assumed tag loss was immediate, and therefore we randomly deleted 16% (based on tag loss estimates) of capture histories for fish that were tagged in the body cavity and never recaptured again. Habitat measurements
To help explain spatial patterns in brook trout demographics, we measured select habitat features in each reach. Habitat measurements were taken at the beginning and end of the study dur-ing baseflow conditions. Habitat mea-surements were taken at 2 locations in Pine Creek, seven locations in Hem-mingway Creek, and nine in Coolridge Creek. Wetted width measurements were taken at the mid-point of each pool and riffle and averaged for the entire reach. Depth measurements were tak-
6
en at the midpoint of each pool and riffle in the thalwag and at half the distance from the thalwag to shore (three mea-surements at each transect). Slope was measured from longitudinal elevation data collected using a laser transit. Streambed substrate was measured at 100 points along the stream reach and classified according to Rosgen (1996). The number of habitat sampling loca-tions was based on perceived changes in stream characteristics. Individual pools were numbered and marked the length of each stream. Cover for trout was defined as instream rock, instream vegetation, overhead bank, wood, and water depths greater than 1m. Each of these cover types were measured in terms of length and width. This was used along with wetted widths and stream length to get percent total cover. Discharge measurements were taken at baseflow with a Marsh-McBirney elec-tromagnetic flow meter. To get a re-gional daily discharge pattern, we used the closest monitoring gage in the wa-tershed, located 34km downstream in the Root River, a 6th order stream.
Because temperature could po-tentially affect movement and survival, continuous temperature loggers were placed in each stream segment and recorded water temperature every half hour. Also, because we had access to the entire reach of Coolridge Creek, we collected longitudinal temperature data with a handheld YSI temperature meter during July 2008 to characterize poten-tial temperature differences along the stream course.
Results
Fish sampling
Trout were sampled on 10 occa-sions from September 2006 thru Octo-ber 2008. In both Hemmingway and
Coolridge creeks, density of brown trout was higher in the lower portions of the streams and was reduced near the headwaters (Table 1). The headwaters portions of both streams typically had higher densities of brook trout than low-er reaches across all years (Table 1). This distributional pattern was also evi-dent during our single pass electrofish-ing collections in the spring summer and winter. Combining across all sampling occasions, the percent of trout com-prised of brook trout increased up-stream. Brook trout only represented 0-31% of the trout population in the lower pools whereas, in the uppermost pools, brook trout were the only trout sampled (Figure 4). Slimy sculpin (Cottus cogna-tus) and mottled sculpin (Cottus bairdi) were also present in all stream seg-ments. We marked 286 individual brook trout in September 2006, another 155 in March 2007, and an additional 168 in August 2007. Of the 609 brook trout marked, we recaptured 284 individuals at least once during subsequent sam-pling occasions. Eighty-five fish that were tagged and never recaptured were removed prior to MARK analyses to ac-count for tag loss (Table 2).
Age-0 brook trout recruitment was highest in 2006 followed by two rel-atively poor year-classes in 2007 and 2008 (Table 1). Age-0 brook trout ab-undance was highest in upper Coolridge in 2006 and 2007, but no other patterns were evident. Recruitment patterns for brown trout were similar to brook trout in that 2006 was a strong year-class and 2007 was poor. However, in 2008 brook trout did not produce a strong year-class, whereas brown trout recruitment was high. Growth
Seasonal growth patterns were apparent across all study reaches, with

7
fastest growth rates occurring in spring and summer (Figure 5). Growth in spring and summer did not differ across streams or treatments for the youngest age classes (Figure 6.). For age-2+ brook trout, however, growth was higher in upstream areas with low brown trout abundance. Stream differences were also apparent with Coolridge having higher growth rates than Hemmingway (Figure 5 and 6). Although some growth differences across reaches and streams were evident, differences in growth among individuals was large (Figure 7).
Survival and movement
Global models for all three age groups were a good fit to the data based on a JollyMove (JMV) model structure tested in U-CARE (P > 0.30 for all three models). Therefore, we proceeded to develop candidate sets of models de-scribed in the methods.
Our best model for age-0 brook trout was constant survival with capture probability and movement varying by reach (Table 3). However, a model with survival varying by treatment also de-served consideration. These two mod-els combined for 90% support related to model weights. We generated parame-ter estimates by model averaging these top two models. Survival estimates were similar between reaches with high brown trout density (69%) and low brown trout density (71%). These esti-mates apply equally to both fall and win-ter. We could not estimate annual sur-vival of age-0 because we did not have spring and summer estimates of surviv-al. Nor could we calculate any esti-mates in 2007, given poor recruitment in that year. Age-0 brook trout had higher emigration rates from upper reaches than from lower reaches in both streams (i.e., net downstream movement) (Table 4). Emigration rates were lower from
Hemmingway Creek than Coolridge Creek. There was also movement of brook trout out of lower Coolridge and into lower Hemmingway (Figure 8). Capture probabilities ranged from 0.35 to 0.64 for age-0 brook trout depending on reach of capture (Table 4). Lower Hemmingway had the poorest capture probability, which may have resulted from the large pool areas found in this reach.
The best model for age-1 had capture probability and survival both be-ing season dependent with movement dependent on reach (Table 3). This model had about 100% support based on wi. Three-month survival estimates ranged from 41 to 100%, with the lowest survival periods in winter 2006 (53%) and summer 2007 (41%; Figure 9). We could not generate estimates of move-ment and survival for age-1 brook trout in 2008 because there were too few in-dividual in this cohort. Seasonal surviv-al estimates were multiplied across one year (winter 2006 thru winter 2007) to generate an annual survival estimate of 9% for age-1 brook trout. Movement of age-1 brook trout showed the opposite trend of age-0, with a higher percentage moving upstream than downstream (Figure 8). Movement rates were lower in Hemmingway than Coolridge Creek. While movement of age-1 brook trout from Coolridge to Hemmingway was still recorded (1%), it was much less than that observed for age-0. Season af-fected capture probabilities for age-1 brook trout, with the most efficient cap-tures in both winter events (2006, 0.78; 2007, 0.72). We were least efficient at capturing age-1 brook trout in the fall (2006, 0.38; 2007, 0.55).
Age-2+ fish showed similar re-sults to age-1, in that survival was de-pendent on season and movement was dependent on reach (Table 3). This
8
model was strongly supported over the other candidate models (wi = 98%). Three-month survival estimates followed the same trend as age-1 estimates, with survival being lowest in winter 2006 (45%) and summer 2007 (51%; Figure 9). Survival for age-2+ brook trout was generally higher than for age-1 brook trout, but standard errors overlapped. Annual survival from winter 2006 thru winter 2007 was 13% for age-2+ brook trout. The only movement for age-2+ brook trout was between UC and LC, with a higher percentage of fish moving upstream in each season (Figure 8). Age-2+ capture probabilities were not affected by either season or stream reach, but remained constant at 60 per-cent.
Because movement was not de-pendent on season, we combined our 3-month emigration estimates into an an-nual estimate. While movement rates were low for an individual season, on an annual basis they become more sub-stantial. The most movement occurred within Coolridge Creek for all three age classes. Forty percent of age-2+ brook trout emigrated from LC to UC annually. In terms of monitoring site fidelity, of the 284 individuals recaptured at least once, 56% did not move. We considered a brook trout sedentary if it was captured within three pools of the original capture pool. Habitat
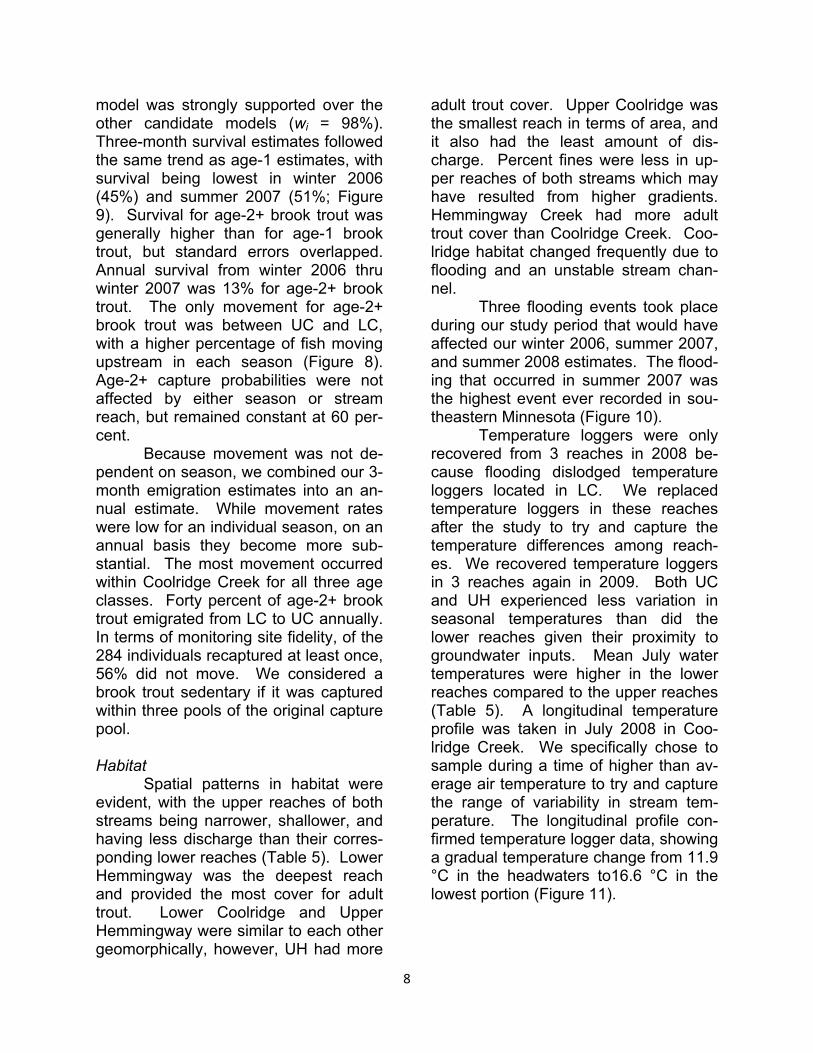
Spatial patterns in habitat were evident, with the upper reaches of both streams being narrower, shallower, and having less discharge than their corres-ponding lower reaches (Table 5). Lower Hemmingway was the deepest reach and provided the most cover for adult trout. Lower Coolridge and Upper Hemmingway were similar to each other geomorphically, however, UH had more
adult trout cover. Upper Coolridge was the smallest reach in terms of area, and it also had the least amount of dis-charge. Percent fines were less in up-per reaches of both streams which may have resulted from higher gradients. Hemmingway Creek had more adult trout cover than Coolridge Creek. Coo-lridge habitat changed frequently due to flooding and an unstable stream chan-nel.
Three flooding events took place during our study period that would have affected our winter 2006, summer 2007, and summer 2008 estimates. The flood-ing that occurred in summer 2007 was the highest event ever recorded in sou-theastern Minnesota (Figure 10).
Temperature loggers were only recovered from 3 reaches in 2008 be-cause flooding dislodged temperature loggers located in LC. We replaced temperature loggers in these reaches after the study to try and capture the temperature differences among reach-es. We recovered temperature loggers in 3 reaches again in 2009. Both UC and UH experienced less variation in seasonal temperatures than did the lower reaches given their proximity to groundwater inputs. Mean July water temperatures were higher in the lower reaches compared to the upper reaches (Table 5). A longitudinal temperature profile was taken in July 2008 in Coo-lridge Creek. We specifically chose to sample during a time of higher than av-erage air temperature to try and capture the range of variability in stream tem-perature. The longitudinal profile con-firmed temperature logger data, showing a gradual temperature change from 11.9 °C in the headwaters to16.6 °C in the lowest portion (Figure 11).
9
Discussion
Brook trout demographics dif-fered between study reaches with high and low brown trout density, especially in terms of growth and movement. While we did not see any evidence for competitive interactions in survival and recruitment, this may have been out-weighed by environmental factors. Old-er age classes appeared to have been affected more by abundant brown trout than age-0 brook trout. Juvenile brook trout (68 – 72.5 mm FL) were the domi-nant competitor over equal sized brown trout in a laboratory study (Fausch 1981), while larger brown trout (>150mm) excluded equal sized brook trout from resting positions but not feed-ing positions (Fausch and White 1981). Conversely, brook trout competed with cutthroat trout at age-0 and age-1, but older cutthroat trout were not affected (Peterson et al. 2004). In contrast to our field results, age-0 brown trout displaced age-0 brook trout into unfavorable areas of the water column in a lab setting (Blanchet et al. 2007).
Growth
Growth of native trout can be re-duced when in sympatry with a compet-ing salmonid (Seiler and Keeley 2009). For example, growth of cutthroat trout was reduced in the presence of brown trout in Utah (McHugh and Budy 2006). We found higher growth rates for age-2+ brook trout in the upper reaches of both streams, where brown trout density was low. Conversely, brown trout have been shown to grow faster than brook trout in sympatry during the spring (Carlson et al. 2007). In laboratory conditions, brook trout lost weight in the presence of brown trout (Dewald and Wilzbach 1992). We did not find differences in growth rates of age-0 trout. Similarly,
brown and brook trout had similar first year growth rates in Egypt Creek, Mich-igan (Fausch 1981).
Water temperatures and trout density could also play a role in brook trout growth observed in our study. Wa-ter temperatures were similar between UH and LC as were growth rates be-tween these two reaches. Growth was slowest in LH where water temperatures were warmest, especially for age-2+ trout. High summer water temperatures in a Michigan stream had negative ef-fects on brook trout growth for age -2 fish but not younger age classes (Drake and Taylor 1996). Whereas, faster growth was associated with warmer wa-ter temperatures and increased flows in the summer for brook trout in Massa-chusetts (Xu et al 2010a). Water tem-peratures in our study never reached a thermal maximum where brook trout would be stressed. Baldwin (1956) showed brook trout growth to be highest at 13 C with good growth occurring be-tween 9 and 17 C. Overall trout density was higher in the lower portions of the streams than in the upper portions and could also explain the slower growth. Brook trout can experience density de-pendent growth during stressful times when water temperatures are high (Utz and Hartman 2009; Xu et al. 2010a). Southeastern Minnesota streams are very productive given their high nutrient content and are usually not prey limited (Kwak and Waters 1997); hence we would not have expected to see density dependent growth for brook trout in this study. Instead it is more likely that growth differences we observed were caused by potential interference compe-tition from brown trout.
Brook trout grew fastest in spring and summer, as noted in previous stu-dies (Carlson et al. 2007; Utz and Hart-man 2009; Xu et al 2010a), and growth
10
was almost non-existent in winter (Cooper 1953). High flows coupled with low water temperatures produced slow growth rates of brook trout in Massa-chusetts (Xu et al. 2010b). While some growth was explained by reach and season, there was substantial individual variation, as seen previously with brook trout (Cooper 1953). Differences among individuals could be a result of some fish being able to select preferred feeding areas within their respective reaches. Another reason could be onset of matur-ity. Many of the brook trout in southeas-tern Minnesota sexually mature at age-0; however, a delay in maturation may allow those fish to experience higher growth rates (Hoxmeier et al., in prep). Sex differences may also lead to differ-ences in growth rates. We did not get enough sex and maturity data on our tagged fish to definitively assess these effects.
Recruitment
We expected brook trout recruit-ment to decrease as brown trout density increased across stream reaches. However, the effect of brown trout den-sity on brook trout recruitment was diffi-cult to assess because age-0 brook trout didn’t fully recruit to electrofishing gear until fall. Therefore we cannot say what reach they originated from. Be-cause we saw downstream movement of age-0 from fall thru spring, it is possi-ble this migration was taking place dur-ing their first spring and summer, there-by lessening the numbers of age-0 present in the headwater reaches by the time we sampled them in the fall. How-ever, Hudy et al. (2010) didn’t observe much dispersal of age-0 brook trout dur-ing the first 4 months of life. Nor did we identify any direct competition during spawning (see Grant et al. 2002). Re-cruitment for both species was less in all
reaches during 2007 and may have been due to the March flood. A similar result is reported in Waters (1999) where a March flood presumably re-duced that year-class of brook trout. Given the large range in recruitment of brook trout across three years, it is likely that recruitment is set by environmental factors that can outweigh competition with brown trout. However, brown trout recruitment was much higher on a streamwide basis than it was for brook trout. So although brook trout recruit-ment varied presumably by environmen-tal conditions, it still may have been dampened by presence of brown trout.
Movement
Reach was important for move-ment for all age classes of brook trout with age-0 moving downstream into lower reaches, but then emigrating out of these same reaches as adults. Age-0 brook trout move more extensively than adults and their dispersal rate increases with overall abundance (Hunt 1965). Brook trout in lower reaches were main-tained in low numbers by immigration of age-0 from upper reaches. Movement of adult brook trout out of brown trout reaches could be an indication of forced emigration. Alternatively, upstream movement of adult trout could have been related to avoiding warmer water temperatures in the summer or to find spawning areas in the fall. However, this is unlikely given that there was not a seasonal component to movement, wa-ter temperatures did not get above op-timal limits, and there was suitable spawning habitat in the lower reach. Emigration due to intraspecific competi-tion has been demonstrated for salmo-nids, but there is less evidence of forced emigration caused by interspecific com-petition. This may be because in stu-dies examining interspecific competition

11
in the laboratory, subordinate species are not allowed to emigrate (closed sys-tems). In field studies, emigration may not have been measured, but rather was incorporated into survival estimates. The fact that we did not see emigration of age-2+ brook trout in Hemmingway Creek is likely a function of study de-sign. Movement was less for all age groups in Hemmingway Creek versus Coolridge Creek which is likely an arti-fact of not being able to sample the middle portion of Hemmingway Creek.
We did not observe consistent seasonal movements as seen in some studies with stream salmonids. Trout often move in fall to suitable spawning areas near headwaters of streams or to avoid warmer water temperatures in the summer. The fact that we did not ob-serve seasonal movements, but rather consistent movements of adults up-stream, suggests that movement was not driven by changing abiotic factors. Rather, we think this movement represented forced emigration of brook trout out of the brown trout dominated reaches.
Over half of the brook trout in our study showed site fidelity. Strange et al. (2000) found that most brook trout and brown trout moved less than 75m in a Tennessee stream. Limited movement may be caused by the presence of a competing species. Whitworth and Strange (1983) found very little move-ment of brook trout in sympatry with rainbow trout. Likewise, brown trout were responsible for limited movement of cutthroat trout (McHugh and Budy 2006). Movement rates of both brown trout and brook trout were low (5%) in sympatric population in Massachusetts (Carlson and Letcher 2003). Krueger and Menzel (1979) found genetic differ-ences among brook trout populations in nearby streams suggesting only limited
movement of brook trout among streams. Although a large portion of our trout did not move, those that did moved across study reaches and streams. This could be important in terms of recolini-zation and genetic diversity.
Survival
Surprisingly, survival of brook trout did not differ between reaches with high and low brown trout densities. Si-milarly, survival rates for cutthroat trout were similar in an experimental study with high versus low brown trout density (McHugh and Budy 2006); but the au-thors of that study attributed this finding to not effectively sampling small trout or due to limited length of study period. In a field study however, cutthroat trout survival was higher in areas without brown trout than in areas with brown trout (Budy et al. 2007). The discrepan-cies across studies points out the need for further research in this area. Interes-tingly, conventional methods for estimat-ing survival likely would have shown lower survival in the brown trout reaches if we had not accounted for movement. While, predation on juvenile brook trout by large brown trout could be a mechan-ism where age-0 brook trout populations are reduced in sympatry with brown trout (Alexander 1977), survival esti-mates were similar in regards to brown trout presence for this age group in our study.
Survival of salmonids can often vary seasonally; however, there is little consensus as to what season is limiting, if any. For example, it has been sug-gested that winter can be a time of poor survival for salmonids (Brown et al. 2011). Whereas, Berger and Gresswell (2009) found that fall was the lowest pe-riod of survival for cutthroat trout. Simi-larly, survival varied by season for both brown trout and brook trout in a Massa-

12
chusetts stream, with the lowest survival in fall and summer (Carlson and Letcher 2003). Summer can be a limiting time of survival when water temperatures are high (Xu et al. 2010a). Our study in combination with previous work, sug-gests that there might not be a critical time period for trout survival, but rather dependent on conditions during each season. Seasonal survival appeared to be driven by flood events which is con-sistent with previous findings in Minne-sota and elsewhere (Waters 1999). High discharge can have negative ef-fects on trout survival (see Budy et al 2008, pg 563 for review). Waters (1999) noticed a brook trout population to de-cline after severe flooding.
Environmental factors could have limited interspecific competition during this study. Hearn (1987) suggests that field studies of competition during pe-riods of low trout density caused by en-vironmental extremes (flooding in this case) may not provide an accurate as-sessment of interspecific competition. Competition among salmonids can often times be regulated by abiotic conditions (Taniguchi et al. 1998; McHugh and Bu-dy 2005; Magoulick and Wilzbach 1998b). Conversely, when fish densities are high (increasing competition), biotic factors can outweigh abiotic factors in structuring trout populations (Quist and Hubert 2005). Given the myriad abiotic factors that can mediate competition among salmonids, it is important to gain a better understanding of these me-chanisms when developing conservation plans.
Our high annual mortality rates may have been due to the large flooding events throughout our study. However, these results were similar to those found in Appalachian streams in terms of both annual mortality rates and life expectan-cy (Petty et al. 2005; Whitworth and
Strange 1983). Likewise, few trout lived past three years given high mortality rates in Wisconsin (Brasch et al. 1973). However, in Colorado, where brook trout are considered an invasive species, they lived to as old as 14 years (Kenne-dy et al. 2003). Whether the mortality rates in our study are due solely to envi-ronmental conditions, or are being influ-enced by brown trout are not fully un-derstood.
Longitudinal patterns
We saw similar patterns of fish distribution as reported for other sys-tems, in that brook trout were primarily confined to headwater reaches and brown trout dominated the downstream reaches. Given the abundance of cover for adult trout and larger pool area found in the lower reaches, brook trout popula-tions should not have been limited by habitat. Brown trout, however, had higher densities in lower reaches, as one would expect. Patterns were the same for bull trout (Salvelinus confluen-tus) and non-native brook trout in Idaho streams (Rieman et al. 2006). While temperature mediated competition has often been suggested as a mechanism (see Taniguchi and Nakano 2000), re-cent evidence does not support this idea (McHugh and Budy 2005). Because water temperatures were similar be-tween upper Hemingway (brook trout dominated) and lower Coolridge (brown trout dominated), we would agree that temperature does not appear to be causing this distributional pattern. Al-though, laboratory studies show that brook trout are better competitors at lower water temperatures (Magoulick and Wilzbach 1998a). In a laboratory stream study, brook trout were located in upstream positions and chased brown trout downstream (Fausch 1981). It could be that brook trout are better

13
suited for headwater reaches given their life history characteristics (Öhlund et al 2008). However, Magoulick and Wilz-bach (1998b), found that brook trout were not better adapted to upstream reaches compared to middle and lower elevation reaches, but suggested that competition with rainbow trout in combi-nation with habitat differences likely ex-plained distributional patterns. Because brook trout are found in lower reaches to some extent, it is most likely that habitat is not limiting, but competition with brown trout is influencing brook trout abundance in Driftless area streams.
Conclusions
Competition can be age or size dependent; our results show evidence for adult interactions, but not age-0. Our results suggest that brown trout may be influencing adult brook trout distribution through forced emigration. Also, de-creased growth rates of adult brook trout in the presence of brown trout warrant further research investigating possible mechanisms for this result. Although water temperatures were similar in two reaches, with and without abundant brown trout, we still cannot eliminate po-tential habitat differences across the reaches. There is still a question as to whether brook trout are being replaced by brown trout given habitat preferences in the lower reaches or displaced due to competition. Therefore, this study should be followed up by manipulative experiments to separate out habitat ver-sus competition.
References
Alexander, G. R. 1977. Consumption of small trout by large predatory brown trout in the North Branch of the Au Sable River, Michigan. Michigan Department of Natural Resources, Fisheries Research Report 1855, Lansing.
Baldwin, N. S. 1956. Food consump-tion and growth of brook trout at different temperatures. Transac-tions of the American Fisheries Society 86:323-328.
Berger, A. M., and R. E. Gresswell. 2009. Factors influencing coastal cutthroat trout (Oncorynchus clarkii clarkii) seasonal survival rates: a spatially continuous ap-proach within stream networks. Canadian Journal of Fisheries and Aquatic Sciences 66:613-632.
Blanchet, S., G. Loot, G. Grenouillet, and S. Brosse. 2007. Competi-tive interactions between native and exotic salmonids: a com-bined field and laboratory dem-onstration. Ecology of Freshwa-ter Fish 16:133-143.
Bozek, M. A., and W. A. Hubert. 1992. Segregation of resident trout in streams as predicted by three habitat dimensions. Canadian Journal of Zoology 70:886-890.
Brown, R. S., W. A. Hubert, and S. F. Daly. 2011. A primer on winter, ice, and fish: what fisheries biolo-gists should know about winter ice processes and stream-dwelling fish. Fisheries 36:8-26.
Brasch, J., J. McFadden, and S. Kmio-tek. 1973. Brook trout: life histo-ry, ecology and management. Wisconsin Department of Natural Resources Publication 226, Mad-ison.

14
Budy, P., G. P. Thiede, and P. McHugh.
2007. Quantification of the vital rates, abundance, and status of a critical, endemic population of Bonneville cutthroat trout. North American Journal of Fisheries Management 27:593-604.
Budy, P., G. P. Thiede, P. McHugh, E. S. Hansen, and J. Wood. 2008. Exploring the relative influence of biotic interactions and environ-mental conditions on the abun-dance and distribution of exotic brown trout (Salmo trutta) in a high mountain stream. Ecology of Freshwater Fish 17:554-566.
Burnham, K. P., and D. R. Anderson. 2002. Model selection and mul-timodel inference, a practical in-formation-theoretic approach, 2nd edition. Springer-Verlag, New York, New York.
Carlson, S. M., and B. H. Letcher. 2003. Variation in brook trout and brown trout survival within and among seasons, species, and age classes. Journal of Fish Biology 63:780-794.
Carlson, S. M., A. P. Hendry, and B. H. Letcher. 2007. Growth rate dif-ferences between resident native brook trout and non-native brown trout. Journal of Fish Biology 71:1430-1447.
Choquet, R., J.-D., Lebreton, O., Gime-nez, A.-M., Reboulet, and R. Pradel. 2009. U-CARE: Utilities for performing goodness of fit tests and manipulating Capture-Recapture data. Ecography 32:1071-1074 (Version 2.3.2).
Cooper, E. L. 1953. Periodicity of growth and change of condition of brook trout (Salvelinus fontina-lis) in three Michigan trout streams. Copeia 1953:107-114.
DeWald, L., and M. A. Wilzbach. 1992. Interactions between native brook trout and hatchery brown trout: effects on habitat use, feeding, and growth. Transactions of the American Fisheries Society 121:287-296.
Dieterman, D. J., and R. J. H. Hoxmeier. 2009. Instream evaluation of passive integrated transponder retention in brook trout and brown trout: effects of season, anatomi-cal placement, and fish length. North American Journal of Fishe-ries Management 29:109-115.
Drake, M. T., and W. W. Taylor. 1996. Influence of spring and summer water temperature on brook charr, Salvelinus fontinalis, growth and age structure in the Ford River, Michigan. Environ-mental Biology of Fishes 45:41-51.
Dunham, J. B., S. B. Adams, R. E. Schroeter, and D. C. Novinger. 2002. Alien invasions in aquatic ecosystems: toward an under-standing of brook trout invasions and potential impacts on inland cutthroat trout in western North America. Reviews in Fish Biolo-gy and Fisheries. 12:373-391.
Fausch, K. D. 1981. Competition among juveniles of coho salmon, brook and brown trout for re-sources in streams. Ph.D. Disser-tation, Michigan State University, East Lansing.
Fausch, K. D. 2008. A paradox of trout invasions in North America. Bio-logical Invasions 10:685-701.
Fausch, K. D., and R. J. White. 1981. Competition between brook trout (Salvelinus fontinalis) and brown trout (Salmo trutta) for positions in a Michigan stream. Canadian Journal of Fisheries and Aquatic Sciences 38:1220-1227.

15
Grant, G. C., B. Vondracek, and P. W. Sorensen. 2002. Spawning inte-ractions between sympatric brown and brook trout may con-tribute to species replacement. Transactions of the American Fi-sheries Society 131:569-576.
Haak, A. L., J. E. Williams, H. M. Ne-ville, D. C. Dauwalter, and W. T. Colyer. 2010. Conserving peri-pheral trout populations: the val-ues and risks of life on the edge. Fisheries 35:530-549.
Hearn, W. E. 1987. Interspecific com-petition and habitat segregation among stream-dwelling trout and salmon: a review. Fisheries 12(5):24-31.
Hoxmeier, R. J. H., D. J. Dieterman, and L. M. Miller. Spatial distribution of apparent native brook trout populations and their characteris-tics in southeastern Minnesota streams. In prep.
Hudy, M., J. A. Coombs, K. H. Nislow, and B. H. Letcher. 2010. Dis-persal and within-stream spatial population structure of brook trout revealed by pedigree reconstruc-tion analysis. Transactions of the American Fisheries Society 139:1276-1287.
Hunt, R. L. 1965. Dispersal of wild brook trout during their first sum-mer of life. Transactions of the American Fisheries Society 94:186-188.
Kennedy, B. M., D. P. Peterson, and K. D. Fausch. 2003. Different life histories of brook trout popula-tions invading mid-elevation and high-elevation cutthroat trout streams in Colorado. Western North American Naturalist 63:215-223.
Kozel, S. J., and W. A. Hubert. 1989. Factors influencing the abun-
dance of brook trout (Salvelinus fontinalis) in forested mountain streams. Journal of Freshwater Ecology 5:113-122.
Krueger, C. C., and B. W. Menzel. 1979. Effects of stocking on ge-netics of wild brook trout popula-tions. Transactions of the Ameri-can Fisheries Society 108:277-287.
Kwak, T. J., and T. F. Waters. 1997. Trout production dynamics and water quality in Minnesota streams. Transactions of the American Fisheries Society 126:35-48.
Lebreton, J.-D, K. P. Burnham, J. Clo-bert, and D. R. Anderson. 1992. Modeling survival and testing bio-logical hypotheses using marked animals: a unified approach with case studies. Ecological Mono-graphs 62:67-118.
Lesica, P., and F. W. Allendorf. 1995. When are peripheral populations valuable for conservation? Con-servation Biology 9:753-760.
Magoulick, D. D., and M. A. Wilzbach. 1998a. Effect of temperature and macrohabitat on interspecific ag-gression, foraging success, and growth of brook trout and rainbow trout pairs in laboratory streams. Transactions of the American Fi-sheries Society 127:708-717.
Magoulick, D. D., and M. A. Wilzbach. 1998b. Are native brook charr and introduced rainbow trout dif-ferentially adapted to upstream and downstream reaches? Ecol-ogy of Freshwater Fish 7:167-175.
McHugh, P., and P. Budy. 2005. An experimental evaluation of com-petitive and thermal effects on brown trout (Salmo trutta) and Bonneville cutthroat trout (Oncor-hynchus clarkia utah) perfor-

16
mance along an altitudinal gra-dient. Canadian Journal of Fi-sheries and Aquatic Sciences 62:2784-2795.
McHugh, P., and P. Budy. 2006. Expe-rimental effects of nonnative brown trout on the individual- and population-level performance of native Bonneville cutthroat trout. Transactions of the American Fi-sheries Society 135:1441-1455.
Öhlund, G., F. Nordwall, E. Degerman, and T. Eriksson. 2008. Life his-tory and large-scale habitat use of brown trout (Salmo trutta) and brook trout (Salvelinus fontinalis) – implications for species re-placement patterns. Canadian Journal of Fisheries and Aquatic Sciences 65:633-644.
Peterson, D. P., K. D. Fausch, and G. C. White. 2004. Population ecology of an invasion: effects of brook trout on native cutthroat trout. Ecological Applications 14:754-772.
Petty, J. T., P. J. Lamothe, and P. M. Mazik. 2005. Spatial and sea-sonal dynamics of brook trout populations inhabiting a central Appalachian watershed. Trans-actions of the American Fisheries Society 134:572-587.
Quist, M. C., and W. A. Hubert. 2005. Relative effects of biotic and abi-otic processes: a test of the bio-tic-abiotic constraining hypothesis as applied to cutthroat trout. Transactions of the American Fi-sheries Society 134:6676-686.
Rieman, B. E., J. T. Peterson, and D. L. Meyers. 2006. Have brook trout (Salvelinus fontinalis) displaced bull trout (Salvelinus confluentus) along longitudinal gradients in central Idaho streams? Cana-
dian Journal of Fisheries and Aq-uatic Sciences 63:63-78.
Rosgen, D. 1996. Applied river mor-phology. Wildland Hydrology. Pagosa Springs, Colorado.
Seiler, S. M., and E. R. Keeley. 2009. Competition between native and introduced salmonid fishes: cutth-roat trout have lower growth rate in the presence of cutthroat-rainbow trout hybrids. Canadian Journal of Fisheries and Aquatic Sciences 66:133-141.
Strange, R. J., R. M. Phirman, and J. W. Habera. 2000. Movement, growth, and production of brown trout in sympatry with brook trout in a southern Appalachian stream. Proceedings of the Southeastern Association of Fish and Wildlife Agencies 54:146-156.
Taniguchi, Y., and S. Nakano. 2000. Condition-specific competition: implications for the altitudinal dis-tribution of stream fishes. Ecolo-gy 81:2027-2039.
Taniguchi, Y., F. J. Rahel, D. C. Novin-ger, and K. G. Gerow. 1998. Temperature mediation of com-petitive interactions among three fish species that replace each other along longitudinal stream gradients. Canadian Journal of Fisheries and Aquatic Sciences 55:1894-1901.
Utz, R. M., and K. J. Hartman. 2009. Density-dependent individual growth and size dynamics of cen-tral Appalachian brook trout (Sal-velinus fontinalis). Canadian Journal of Fisheries and Aquatic Sciences 66:1072-1080.
Waters, T. F. 1999. Long-term trout production dynamics in Valley Creek, Minnesota. Transactions of the American Fisheries Society 128:1151-1162.
17
Weigel, D. E., and P. W. Sorensen. 2001. The influence of habitat characteristics on the longitudinal distribution of brook, brown, and rainbow trout in a small Midwes-tern stream. Journal of Freshwa-ter Ecology 16:599-613.
Whitworth, W. E., and R. J. Strange. 1983. Growth and production of sympatric brook and rainbow trout in an Appalachian stream. Transactions of the American Fi-sheries Society 112:469-475.
Xu, C. L., B. H. Letcher, and K. H. Nis-low. 2010a. Size-dependent survival of brook trout Salvelinus
fontinalis in summer: effects of water temperature and stream flow. Journal of Fish Biology 76:2342-2369.
Xu, C., B. H. Letcher, and K. Nislow. 2010b. Context-specific influ-ence of water temperature on brook trout growth rates in the field. Freshwater Biology 55: 2253-2264.

Table 1. Fall population estimates, N/ha (SE) for brown trout and brook trout in four coldwater stream reaches in southeastern Minnesota. Streams reaches are upper (UH) and lower Hemmingway (LH), and upper (UC) and lower Coolridge (LC).
Brook trout Brown trout Stream reach Adult Age‐0 Adult Age‐0
2006 UH 78.9 (5.3) 561.8 (13.8) 19.3 (na) 528.8 (18.5) LH 99.2 (9.0) 378.0 (19.6) 1197.0 (42.6) 1122.8 (21.6) UC 306.5 (24.0) 753.7 (37.0) 198.2 (8.7) 525.4 (15.2) LC 89.9 (5.5) 192.3 (8.9) 727.4 (6.7) 2281.9 (56.5)
2007 UH 300.0 (73.6) 0 (0.0) 196.9 (37.9) 0 (0.0) LH 209.1 (288.0) 9.5 (na) 1283.4 (184.7) 146.3 (49.3) UC 521.3 (2.6) 141.8 (24.3) 382.7 (12.7) 90.4 (11.1) LC 178.6 (3.8) 32.4 (1.4) 717.3 (24.5) 657.2 (33.3)
2008 UH 171.8 (na) 73.6 (na) 98.2 (na) 0 (na) LH 134.2 (na) 109.8 (163.7) 1452.9 (36.6) 1321.1 (191.2) UC 272.6 (22.6) 65.4 (12.2) 110.4 (26.0) 264.9 (13.5) LC 88.0 (6.7) 114.9 (13.5) 633.3 (26.9) 2129.6 (53.9)
18
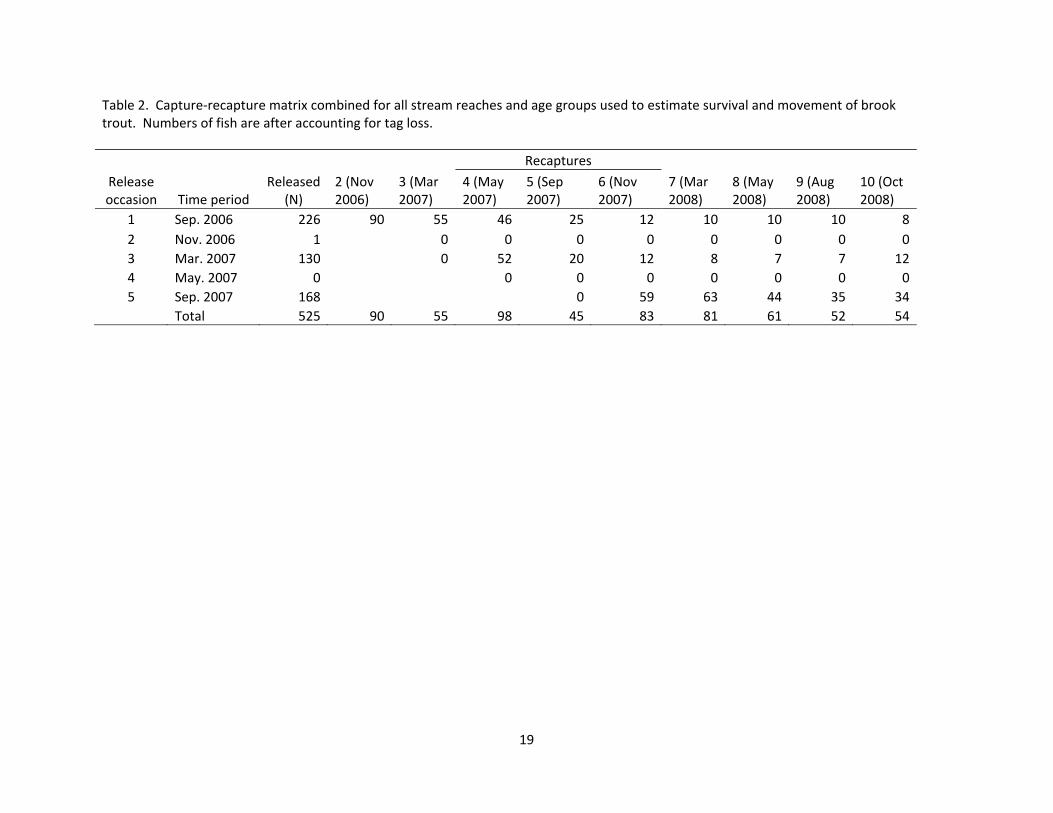
Table 2. Capture‐recapture matrix combined for all stream reaches and age groups used to estimate survival and movement of brook trout. Numbers of fish are after accounting for tag loss.
Recaptures
Release occasion Time period
Released (N)
2 (Nov 2006)
3 (Mar 2007)
4 (May 2007)
5 (Sep 2007)
6 (Nov 2007)
7 (Mar 2008)
8 (May 2008)
9 (Aug 2008)
10 (Oct 2008)
1 Sep. 2006 226 90 55 46 25 12 10 10 10 82 Nov. 2006 1 0 0 0 0 0 0 0 03 Mar. 2007 130 0 52 20 12 8 7 7 124 May. 2007 0 0 0 0 0 0 0 05 Sep. 2007 168 0 59 63 44 35 34
Total 525 90 55 98 45 83 81 61 52 54
19

Table 3. Ranking of multistrata Cormack‐Jolly‐Seber models estimating survival (S, where t denotes time, treat denotes treatment as BNT density), capture probability (p, where r denotes reach, t denotes season), and movement (Ψ, where subscripts are the same as for S and p) for three age groups of brook trout. Corrected Akaike’s Information Criterion (AICc), difference in AICc be‐tween the ith and the top‐ranked model (Δi), Akaike weights (wi ), number of parameters (K), and model deviance are given. The most supported models (Δi < 2) are highlighted in bold.
Model AICc Δ AICc wi K Deviance Age ‐0
S(.)p(r)Ψ(r) 803.23 0.00 0.62 17 129.77 S(treat)p(r)Ψ(r) 804.85 1.62 0.28 18 129.17 S(r)p(r)Ψ(r) 807.87 4.64 0.06 20 127.72 S(t)p(r)Ψ(r) 808.84 5.61 0.04 20 128.69 S(treat*t)p(r)Ψ(r) 812.42 9.19 0.01 24 123.16 S(r*t)p(r)Ψ(r) 819.72 16.49 0.00 32 111.55 S(r*t)p(r*t)Ψ(r*t) 916.52 113.29 0.00 77 81.96
Age‐1 S(t)p(t)Ψ(r) 1314.52 0.00 1.00 25 270.28 S(treat*t)p(t)Ψ(r) 1328.89 14.38 0.00 32 269.11 S(.)p(t)Ψ(r) 1331.64 17.12 0.00 20 298.26 S(treat)p(t)Ψ(r) 1333.00 18.49 0.00 21 297.47 S(r)p(t)Ψ(r) 1336.67 22.15 0.00 23 296.80 S(r*t)p(t)Ψ(r) 1350.59 36.08 0.00 46 258.47 S(r*t)p(r*t)Ψ(r*t) 1545.15 230.64 0.00 133 205.37
Age‐2+ S(t)p(.)Ψ(r) 862.46 0.00 0.98 22 321.65 S(treat*t)p(.)Ψ(r) 870.46 8.01 0.02 31 308.52 S(r)p(.)Ψ(r) 878.96 16.50 0.00 17 349.40 S(.)p(.)Ψ(r) 881.60 19.14 0.00 14 358.63 S(treat)p(.)Ψ(r) 883.36 20.90 0.00 15 358.20 S(r*t)p(.)Ψ(r) 886.57 24.11 0.00 49 278.57
S(r*t)p(r*t)Ψ(r*t) 1333.39 470.93 0.00 164 220.70
20
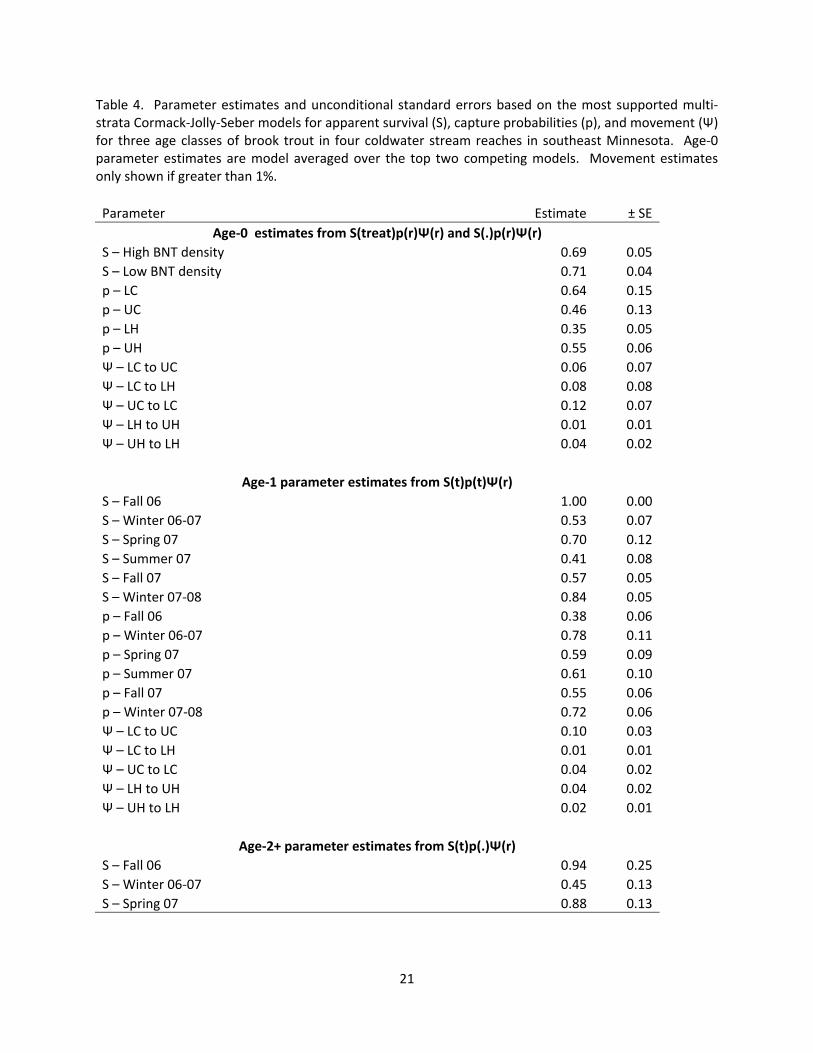
Table 4. Parameter estimates and unconditional standard errors based on the most supported multi‐strata Cormack‐Jolly‐Seber models for apparent survival (S), capture probabilities (p), and movement (Ψ) for three age classes of brook trout in four coldwater stream reaches in southeast Minnesota. Age‐0 parameter estimates are model averaged over the top two competing models. Movement estimates only shown if greater than 1%. Parameter Estimate ± SE
Age‐0 estimates from S(treat)p(r)Ψ(r) and S(.)p(r)Ψ(r) S – High BNT density 0.69 0.05 S – Low BNT density 0.71 0.04 p – LC 0.64 0.15 p – UC 0.46 0.13 p – LH 0.35 0.05 p – UH 0.55 0.06 Ψ – LC to UC 0.06 0.07 Ψ – LC to LH 0.08 0.08 Ψ – UC to LC 0.12 0.07 Ψ – LH to UH 0.01 0.01 Ψ – UH to LH 0.04 0.02
Age‐1 parameter estimates from S(t)p(t)Ψ(r) S – Fall 06 1.00 0.00 S – Winter 06‐07 0.53 0.07 S – Spring 07 0.70 0.12 S – Summer 07 0.41 0.08 S – Fall 07 0.57 0.05 S – Winter 07‐08 0.84 0.05 p – Fall 06 0.38 0.06 p – Winter 06‐07 0.78 0.11 p – Spring 07 0.59 0.09 p – Summer 07 0.61 0.10 p – Fall 07 0.55 0.06 p – Winter 07‐08 0.72 0.06 Ψ – LC to UC 0.10 0.03 Ψ – LC to LH 0.01 0.01 Ψ – UC to LC 0.04 0.02 Ψ – LH to UH 0.04 0.02 Ψ – UH to LH 0.02 0.01
Age‐2+ parameter estimates from S(t)p(.)Ψ(r) S – Fall 06 0.94 0.25 S – Winter 06‐07 0.45 0.13 S – Spring 07 0.88 0.13
21

22
Table 4 continued…
S – Summer 07 0.51 0.09 S – Fall 07 0.63 0.08 S – Winter 07‐08 1.00 0.00 S – Spring 08 0.88 0.06 S – Summer 08 0.89 0.06 p 0.60 0.03 Ψ – LC to UC 0.12 0.04 Ψ – UC to LC 0.07 0.03
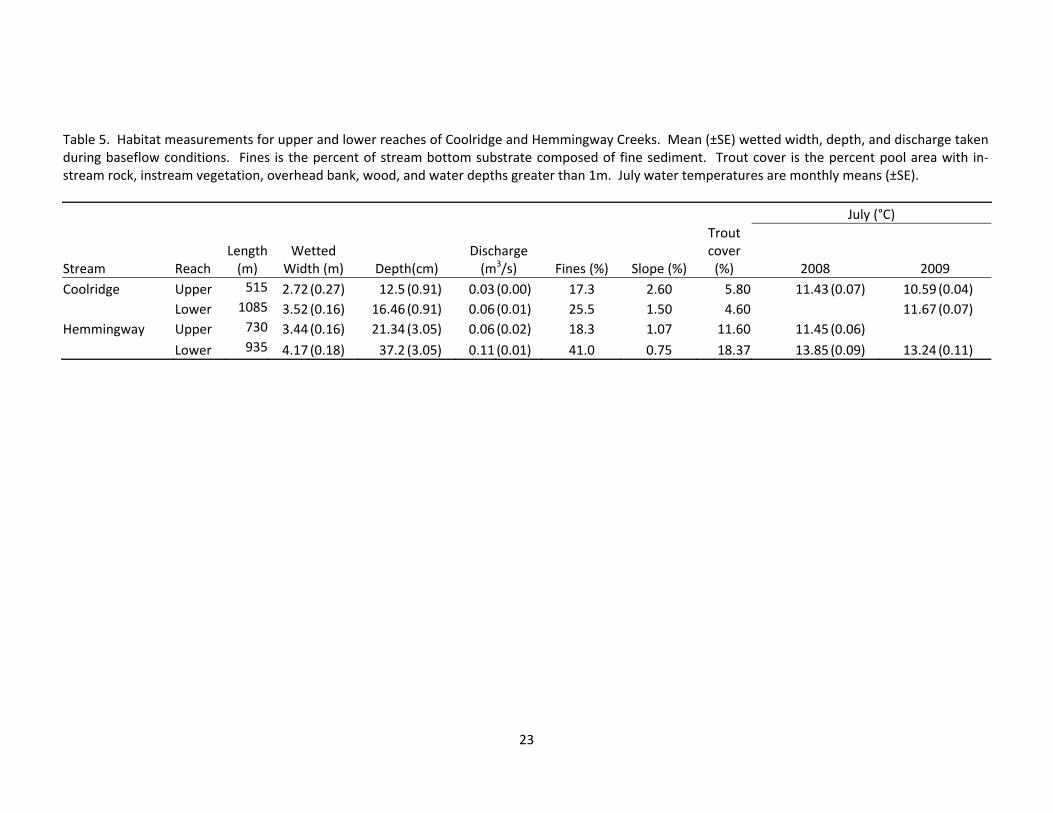
Table 5. Habitat measurements for upper and lower reaches of Coolridge and Hemmingway Creeks. Mean (±SE) wetted width, depth, and discharge taken during baseflow conditions. Fines is the percent of stream bottom substrate composed of fine sediment. Trout cover is the percent pool area with in‐stream rock, instream vegetation, overhead bank, wood, and water depths greater than 1m. July water temperatures are monthly means (±SE).
July (°C)
Stream Reach Length (m)
Wetted Width (m) Depth(cm)
Discharge (m3/s) Fines (%) Slope (%)
Trout cover (%) 2008 2009
Coolridge Upper 515 2.72 (0.27) 12.5 (0.91) 0.03 (0.00) 17.3 2.60 5.80 11.43 (0.07) 10.59 (0.04) Lower 1085 3.52 (0.16) 16.46 (0.91) 0.06 (0.01) 25.5 1.50 4.60 11.67 (0.07)
Hemmingway Upper 730 3.44 (0.16) 21.34 (3.05) 0.06 (0.02) 18.3 1.07 11.60 11.45 (0.06)
Lower 935 4.17 (0.18) 37.2 (3.05) 0.11 (0.01) 41.0 0.75 18.37 13.85 (0.09) 13.24 (0.11)
23
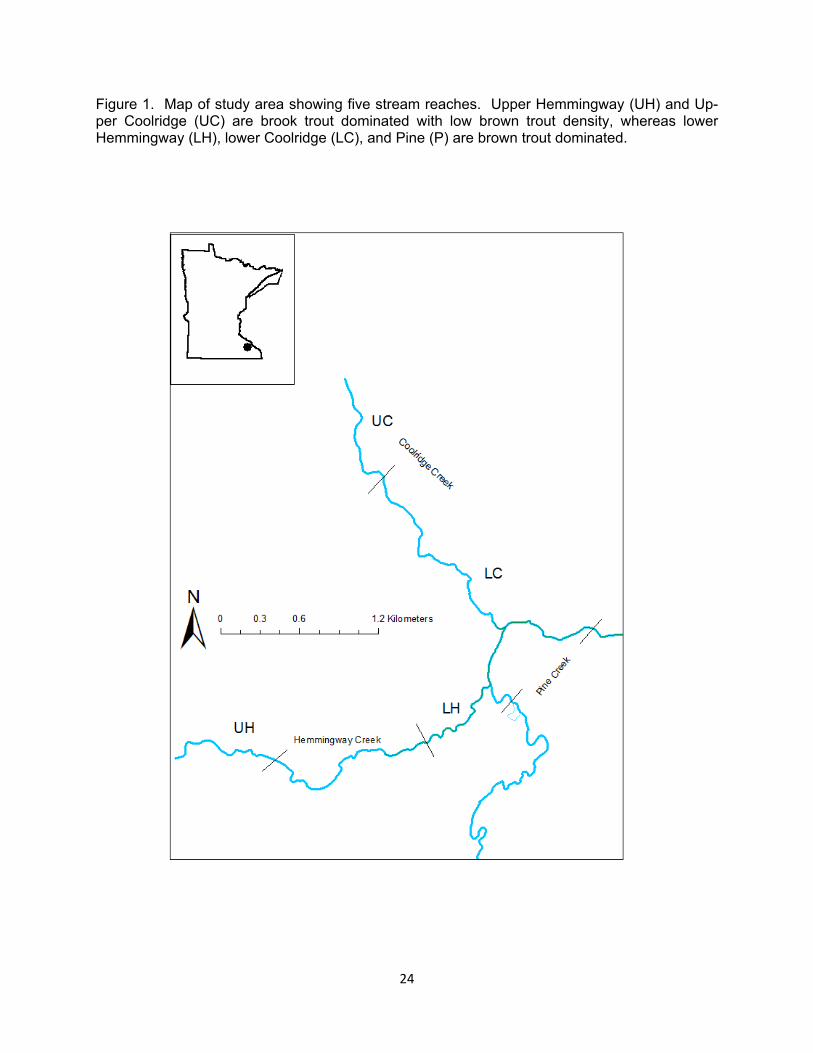
Figure 1. Map of study area showing five stream reaches. Upper Hemmingway (UH) and Up-per Coolridge (UC) are brook trout dominated with low brown trout density, whereas lower Hemmingway (LH), lower Coolridge (LC), and Pine (P) are brown trout dominated.
24

Figure 2. Length frequency histograms of sampled brook trout used to assign age groups for three marking occasions for Coolridge Creek.
50 60 70 80 90 100
110
120
130
140
150
160
170
180
190
200
210
220
230
240
250
260
270
Freq
uenc
y (n
)
20
40
6050 60 70 80 90 100
110
120
130
140
150
160
170
180
190
200
210
220
230
240
250
260
270
20
40
60
Total length (mm)
40 50 60 70 80 90 100
110
120
130
140
150
160
170
180
190
200
210
220
230
240
250
260
270
280
20
40
60
September 2006
March 2007
August 2007
Age-0
Age-1
Age-2+
Age-0
Age-1
Age-1
Age-2+
Age-2+
25
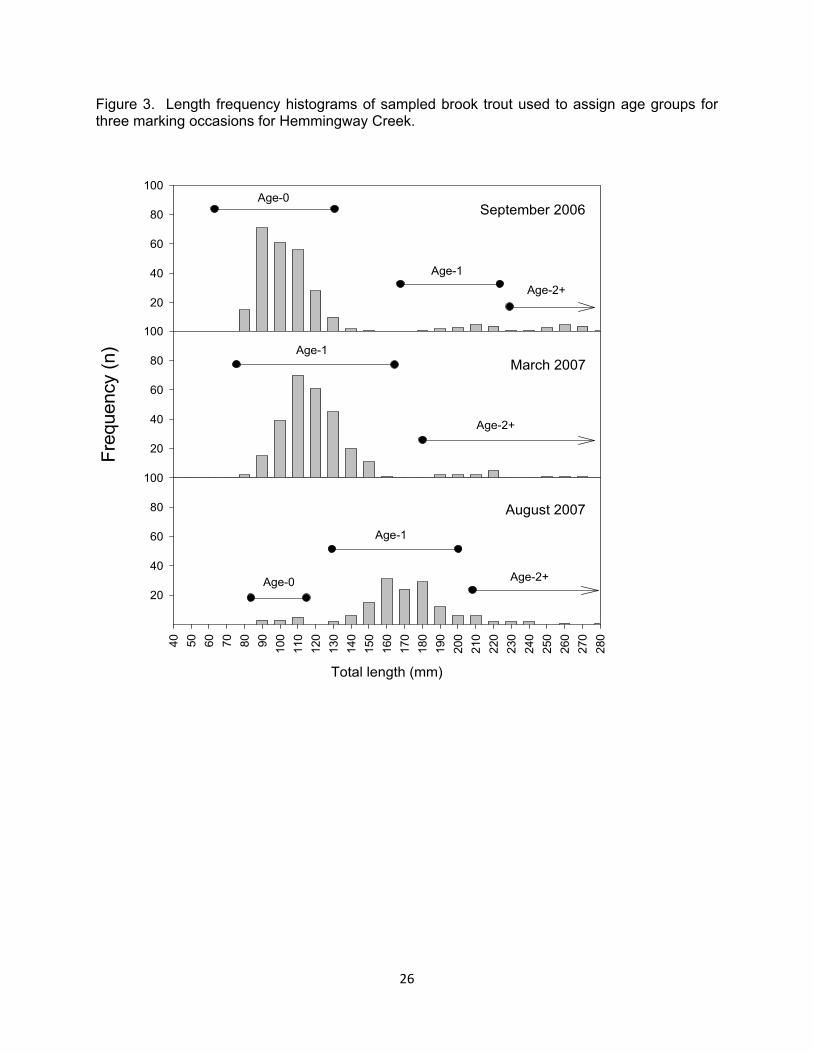
Figure 3. Length frequency histograms of sampled brook trout used to assign age groups for three marking occasions for Hemmingway Creek.
50 60 70 80 90 100
110
120
130
140
150
160
170
180
190
200
210
220
230
240
250
260
270
Freq
uenc
y (n
)
20
40
60
80
10050 60 70 80 90 100
110
120
130
140
150
160
170
180
190
200
210
220
230
240
250
260
270
20
40
60
80
100
Total length (mm)
40 50 60 70 80 90 100
110
120
130
140
150
160
170
180
190
200
210
220
230
240
250
260
270
280
20
40
60
80
100
September 2006
March 2007
August 2007
Age-0
Age-1Age-2+
Age-2+
Age-2+
Age-1
Age-1
Age-0
26
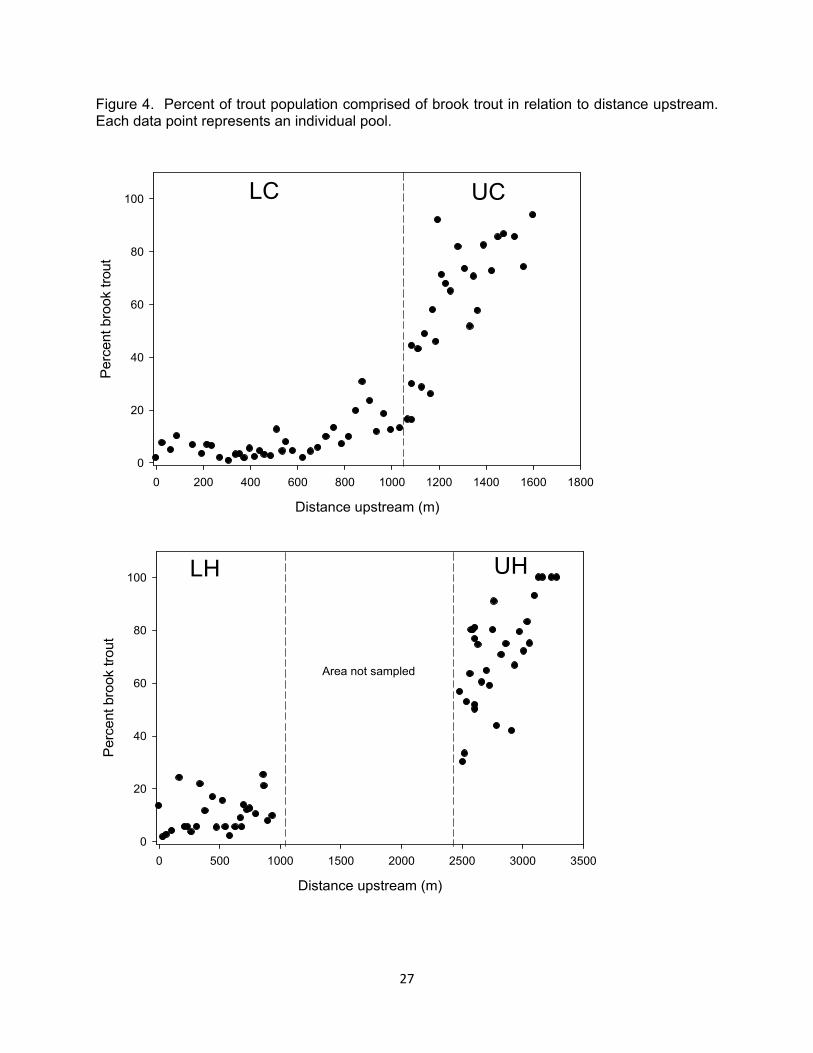
Figure 4. Percent of trout population comprised of brook trout in relation to distance upstream. Each data point represents an individual pool.
Distance upstream (m)
0 500 1000 1500 2000 2500 3000 3500
Per
cent
bro
ok tr
out
0
20
40
60
80
100
Distance upstream (m)
0 200 400 600 800 1000 1200 1400 1600 1800
Per
cent
bro
ok tr
out
0
20
40
60
80
100 LC UC
LH UH
Area not sampled
27
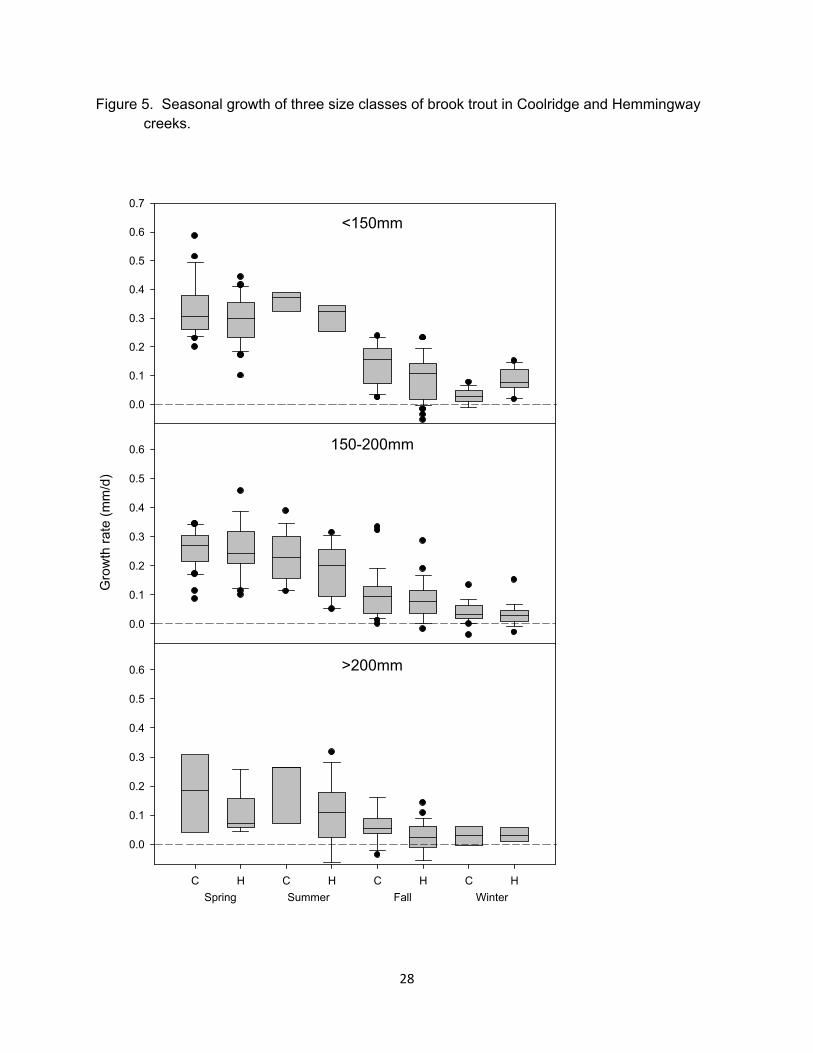
Figure 5. Seasonal growth of three size classes of brook trout in Coolridge and Hemmingway creeks.
<150mm
1 2 3 4 5 6 7 8
0.0
0.1
0.2
0.3
0.4
0.5
0.6
0.7
150-200mm
1 2 3 4 5 6 7 8
Gro
wth
rate
(mm
/d)
0.0
0.1
0.2
0.3
0.4
0.5
0.6
>200mm
C H C H C H C H
0.0
0.1
0.2
0.3
0.4
0.5
0.6
Spring Summer Fall Winter
28

Figure 6. Growth rates (spring and summer combined) of three size classes of brook trout col-lected in stream reaches with high (LH, LC) or low (UH, UC) brown trout densities.
Size groups
Gro
wth
rate
(mm
/day
)
0.0
0.1
0.2
0.3
0.4
0.5
UC LC UH LH
< 150mm 150-200mm > 200mm
29

Figure 7. Observed growth of 2006 year-class of brook trout in Coolridge and Hemmingway creeks.
Time Period
All
Sep
06
Tag
Sep
06
Nov
06
Mar
07
May
07
Aug
07
Nov
07
Mar
08
May
08
Aug
08
Oct
08
May
09
Oct
09
Tota
l len
gth
(mm
)
0
50
100
150
200
250
300
Coolridge Hemmingway
Age 0 Age 1 Age 2 Age 3
30

Figure 8. Seasonal movement rates of three age classes of brook trout between reaches with high (LH, LC) or low (UH, UC) brown trout densities. Only movement rates greater than 0.5% are shown (thick arrows represent rates over or equal to 10%).
31

Figure 9. Survival estimates and standard error bars generated from Program MARK for three age classes of brook trout across all reaches.
Surv
ival
(%)
0.0
0.2
0.4
0.6
0.8
1.0
Age 0 - High BNTAge 0 - Low BNTAge 1Age 2+
Fall 06 Win 06 Spr 07 Sum 07 Fall 07 Win 07 Spr 08 Sum 08
32

Figure 10. Regional discharge data (m3/s) gathered from the closest monitoring gage in the wa-tershed, located 34km downstream in the Root River, a 6th order stream.
Sep-06 Jan-07 May-07 Sep-07 Jan-08 May-08 Sep-08
Dis
char
ge (m
3 /s)
0
200
400
600
800
1000
33
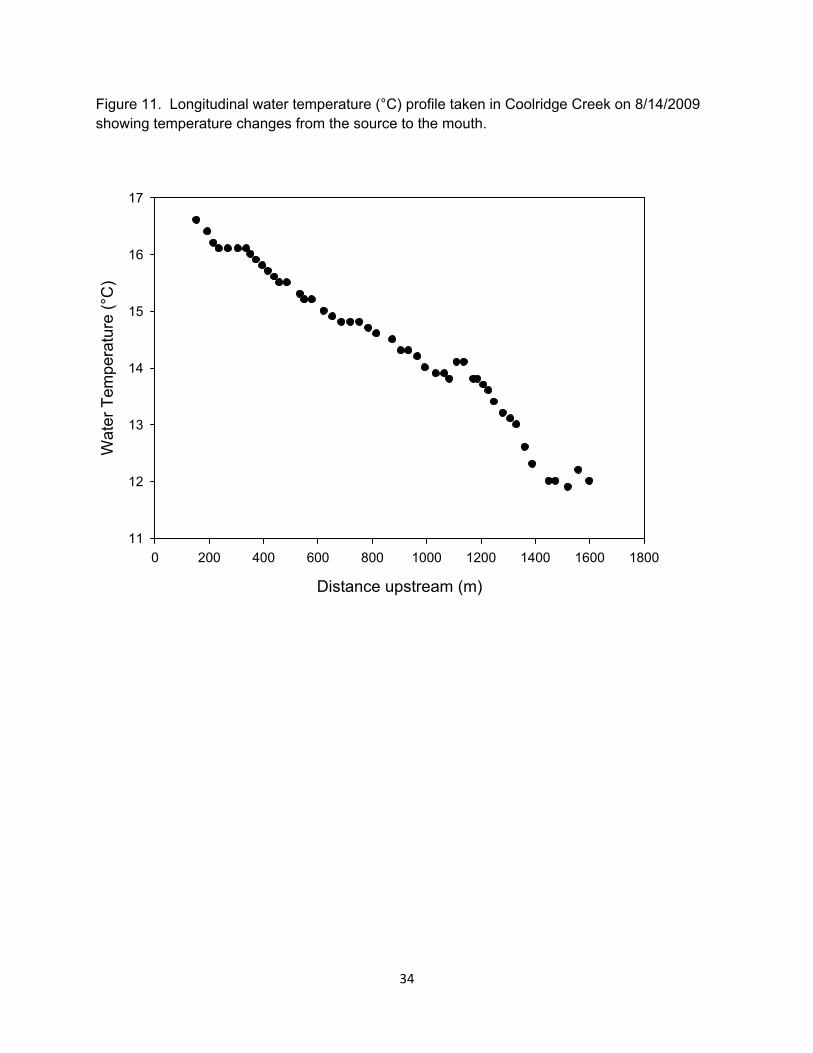
Figure 11. Longitudinal water temperature (°C) profile taken in Coolridge Creek on 8/14/2009 showing temperature changes from the source to the mouth.
Distance upstream (m)
0 200 400 600 800 1000 1200 1400 1600 1800
Wat
er T
empe
ratu
re (°
C)
11
12
13
14
15
16
17
34

Acknowledgments
We would like to thank R. Bearbower, D. Casper, S. Erickson, S. Klotz, M. Konsti, B. Lee, J. Magee, J. Melander, J. Roloff, J. Schulz, V. Snook, and J. Weiss for their help in the field. C. Anderson and D. Pereira provided helpful reviews of this manuscript. This project was funded in part by the Federal Aid in Sport Fish Restoration Program (Project F-26-R).
35