Seasonal horticulture labour demand and workforce study
51
The better the question. The better the answer. The better the world works. September 2020 Seasonal horticulture labour demand and workforce study Public report
Transcript of Seasonal horticulture labour demand and workforce study
The better the question. The better the answer.The better the world works.
September 2020
Seasonal horticulture labour demand and workforce studyPublic report
EY | 2Copyright © 2020 Ernst & Young, Australia. Liability limited by a scheme approved under Professional Standards Legislation.
Release notice
Ernst & Young ("EY") was engaged on the instructions of Horticulture Innovation Australia ("Client") to conduct a study to build a foundational understanding of the “casual labour” requirements in the horticulture sector for the period between July 2020 and December 2021 ("Project"), in accordance with the engagement agreement dated 02 July 2020 (“the Engagement Agreement”).
The results of EY’s work, including the assumptions and qualifications made in preparing the report, are set out in EY's report dated September 2020 ("Report"). You should read the Report in its entirety including any disclaimers and attachments. A reference to the Report includes any part of the Report. No further work has been undertaken by EY since the date of the Report to update it.
Unless otherwise agreed in writing with EY, any party accessing the Report or obtaining a copy of the Report (“Recipient”) agrees that its access to the Report is provided by EY subject to the following terms:
1. The Report cannot be altered.
2. The Recipient acknowledges that the Report has been prepared for the Client and may not be disclosed to any other party or used by any other party or relied upon by any other party without the prior written consent of EY.
3. EY disclaims all liability in relation to any party other than the Client who seeks to rely upon the Report or any of its contents.
4. EY has acted in accordance with the instructions of the Client in conducting its work and preparing the Report, and, in doing so, has prepared the Report for the benefit of the Client, and has considered only the interests of the Client. EY has not been engaged to act, and has not acted, as advisor to any other party. Accordingly, EY makes no representations as to the appropriateness, accuracy or completeness of the Report for any other party's purposes.
5. No reliance may be placed upon the Report or any of its contents by any party other than the Client. A Recipient must make and rely on their own enquiries in relation to the issues to which the Report relates, the contents of the Report and all matters arising from or relating to or in any way connected with the Report or its contents.
6. EY have consented to the Report being shared with a selected group of stakeholders for informational purposes only. EY have not consented to distribution or disclosure of the Report beyond this.
7. No duty of care is owed by EY to any Recipient in respect of any use that the Recipient may make of the Report.
8. EY disclaims all liability, and takes no responsibility, for any document issued by any other party in connection with the Project.
9. A Recipient must not name EY in any report or document which will be publicly available or lodged or filed with any regulator without EY’s prior written consent, which may be granted at EY’s absolute discretion.
10. A Recipient:
a) may not make any claim or demand or bring any action or proceedings against EY or any of its partners, principals, directors, officers or employees or any other Ernst & Young firm which is a member of the global network of Ernst & Young firms or any of their partners, principals, directors, officers or employees (“EY Parties”) arising from or connected with the contents of the Report or the provision of the Report to the recipient; and
b) must release and forever discharge the EY Parties from any such claim, demand, action or proceedings.
11. If a Recipient discloses the Report to a third party in breach of this notice, it will be liable for all claims, demands, actions, proceedings, costs, expenses, loss, damage and liability made or brought against or incurred by the EY Parties, arising from or connected with such disclosure.
12. If a Recipient wishes to rely upon the Report that party must inform EY and, if EY agrees, sign and return to EY a standard form of EY’s reliance letter. A copy of the reliance letter can be obtained from EY. The Recipient’s reliance upon the Report will be governed by the terms of that reliance letter.
Ernst & Young’s liability is limited by a scheme approved under Professional Standards Legislation.
EY | 3Copyright © 2020 Ernst & Young, Australia. Liability limited by a scheme approved under Professional Standards Legislation.
Table of contents
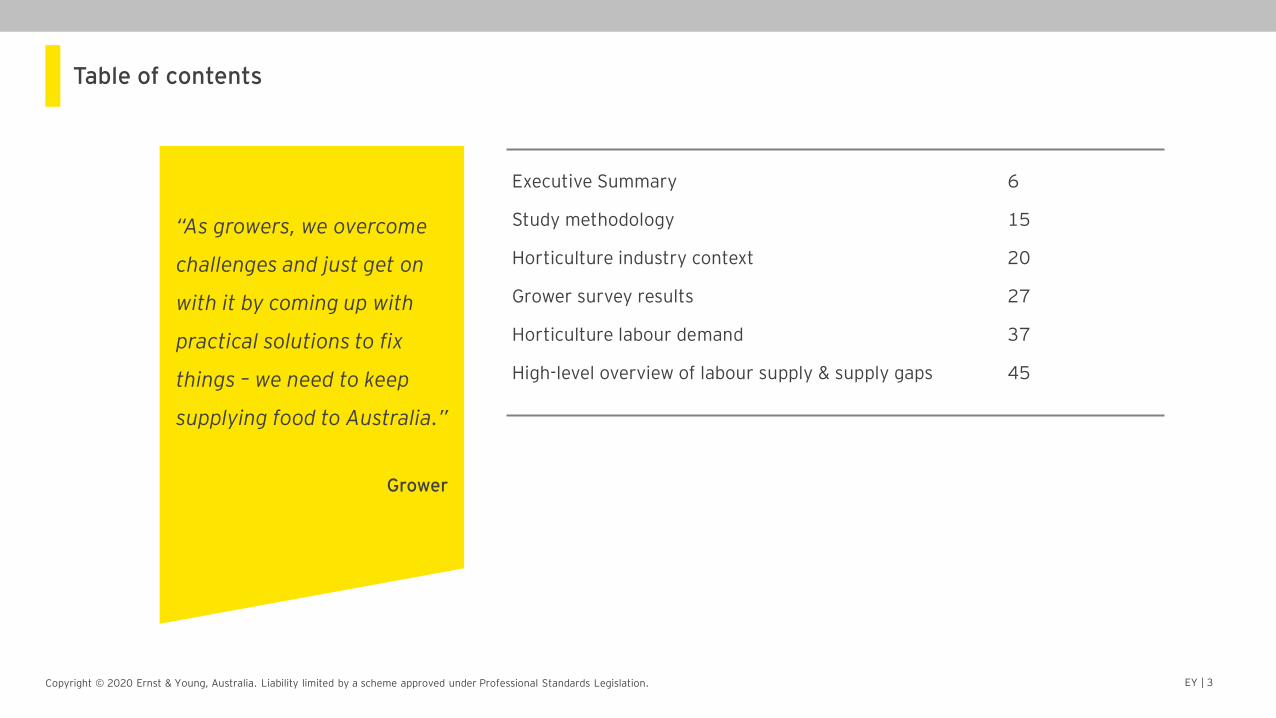
Executive Summary 6
Study methodology 15
Horticulture industry context 20
Grower survey results 27
Horticulture labour demand 37
High-level overview of labour supply & supply gaps 45
“As growers, we overcome
challenges and just get on
with it by coming up with
practical solutions to fix
things – we need to keep
supplying food to Australia.”
Grower
EY | 4Copyright © 2020 Ernst & Young, Australia. Liability limited by a scheme approved under Professional Standards Legislation.
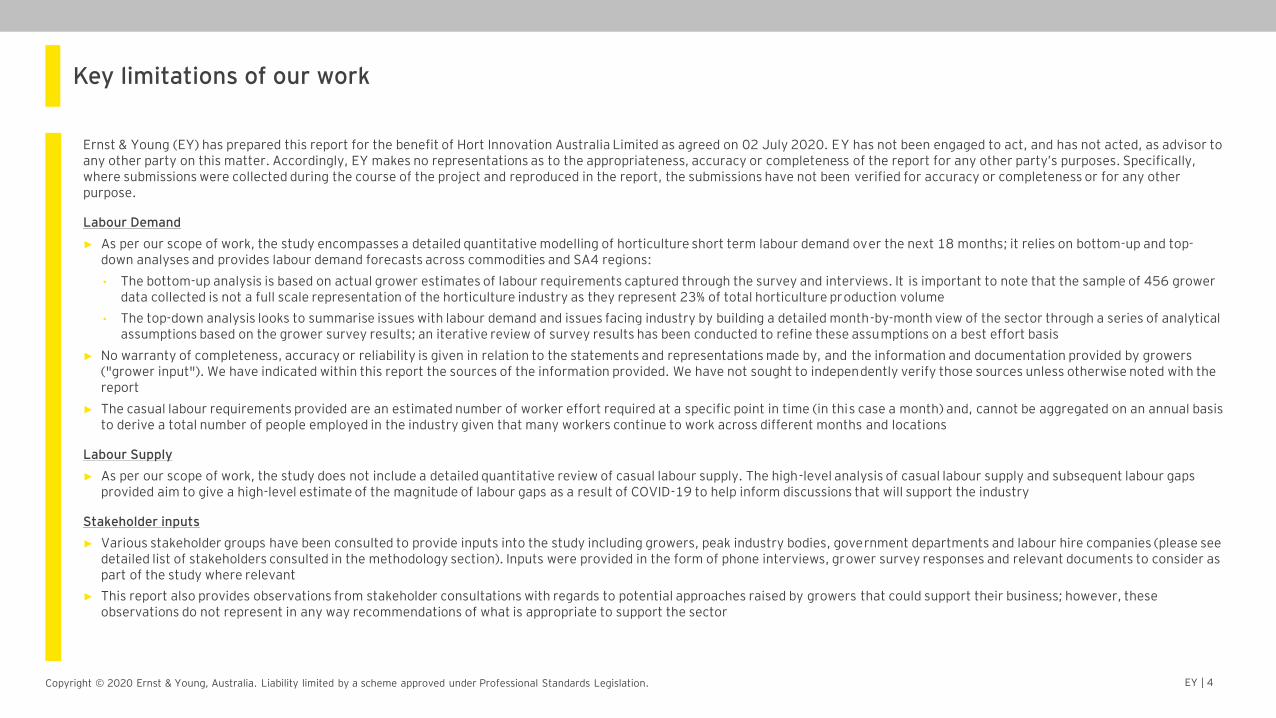
Key limitations of our work
Ernst & Young (EY) has prepared this report for the benefit of Hort Innovation Australia Limited as agreed on 02 July 2020. EY has not been engaged to act, and has not acted, as advisor to any other party on this matter. Accordingly, EY makes no representations as to the appropriateness, accuracy or completeness of the report for any other party’s purposes. Specifically, where submissions were collected during the course of the project and reproduced in the report, the submissions have not been verified for accuracy or completeness or for any other purpose.
Labour Demand
► As per our scope of work, the study encompasses a detailed quantitative modelling of horticulture short term labour demand over the next 18 months; it relies on bottom-up and top-down analyses and provides labour demand forecasts across commodities and SA4 regions:
• The bottom-up analysis is based on actual grower estimates of labour requirements captured through the survey and interviews. It is important to note that the sample of 456 grower data collected is not a full scale representation of the horticulture industry as they represent 23% of total horticulture production volume
• The top-down analysis looks to summarise issues with labour demand and issues facing industry by building a detailed month-by-month view of the sector through a series of analytical assumptions based on the grower survey results; an iterative review of survey results has been conducted to refine these assumptions on a best effort basis
► No warranty of completeness, accuracy or reliability is given in relation to the statements and representations made by, and the information and documentation provided by growers ("grower input"). We have indicated within this report the sources of the information provided. We have not sought to independently verify those sources unless otherwise noted with the report
► The casual labour requirements provided are an estimated number of worker effort required at a specific point in time (in this case a month) and, cannot be aggregated on an annual basis to derive a total number of people employed in the industry given that many workers continue to work across different months and locations
Labour Supply
► As per our scope of work, the study does not include a detailed quantitative review of casual labour supply. The high-level analysis of casual labour supply and subsequent labour gaps provided aim to give a high-level estimate of the magnitude of labour gaps as a result of COVID-19 to help inform discussions that will support the industry
Stakeholder inputs
► Various stakeholder groups have been consulted to provide inputs into the study including growers, peak industry bodies, government departments and labour hire companies (please see detailed list of stakeholders consulted in the methodology section). Inputs were provided in the form of phone interviews, grower survey responses and relevant documents to consider as part of the study where relevant
► This report also provides observations from stakeholder consultations with regards to potential approaches raised by growers that could support their business; however, these observations do not represent in any way recommendations of what is appropriate to support the sector
EY | 5Copyright © 2020 Ernst & Young, Australia. Liability limited by a scheme approved under Professional Standards Legislation.
Scope and definition of key terms used in the study
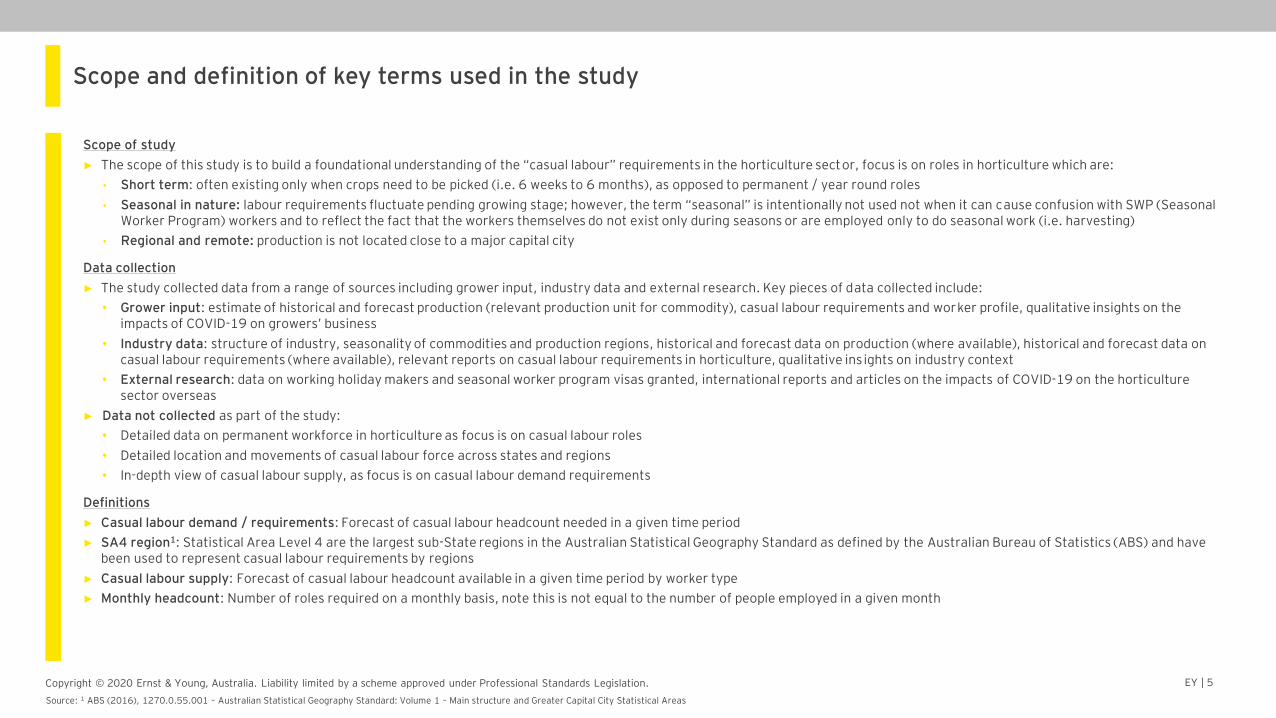
Scope of study
► The scope of this study is to build a foundational understanding of the “casual labour” requirements in the horticulture sector, focus is on roles in horticulture which are:
• Short term: often existing only when crops need to be picked (i.e. 6 weeks to 6 months), as opposed to permanent / year round roles
• Seasonal in nature: labour requirements fluctuate pending growing stage; however, the term “seasonal” is intentionally not used not when it can cause confusion with SWP (Seasonal Worker Program) workers and to reflect the fact that the workers themselves do not exist only during seasons or are employed only to do seasonal work (i.e. harvesting)
• Regional and remote: production is not located close to a major capital city
Data collection
► The study collected data from a range of sources including grower input, industry data and external research. Key pieces of data collected include:
• Grower input: estimate of historical and forecast production (relevant production unit for commodity), casual labour requirements and worker profile, qualitative insights on the impacts of COVID-19 on growers’ business
• Industry data: structure of industry, seasonality of commodities and production regions, historical and forecast data on production (where available), historical and forecast data on casual labour requirements (where available), relevant reports on casual labour requirements in horticulture, qualitative insights on industry context
• External research: data on working holiday makers and seasonal worker program visas granted, international reports and articles on the impacts of COVID-19 on the horticulture sector overseas
► Data not collected as part of the study:
• Detailed data on permanent workforce in horticulture as focus is on casual labour roles
• Detailed location and movements of casual labour force across states and regions
• In-depth view of casual labour supply, as focus is on casual labour demand requirements
Definitions
► Casual labour demand / requirements: Forecast of casual labour headcount needed in a given time period
► SA4 region1: Statistical Area Level 4 are the largest sub-State regions in the Australian Statistical Geography Standard as defined by the Australian Bureau of Statistics (ABS) and have been used to represent casual labour requirements by regions
► Casual labour supply: Forecast of casual labour headcount available in a given time period by worker type
► Monthly headcount: Number of roles required on a monthly basis, note this is not equal to the number of people employed in a given month
Source: 1 ABS (2016), 1270.0.55.001 – Australian Statistical Geography Standard: Volume 1 – Main structure and Greater Capital City Statistical Areas
Executive Summary
EY | 7Copyright © 2020 Ernst & Young, Australia. Liability limited by a scheme approved under Professional Standards Legislation.
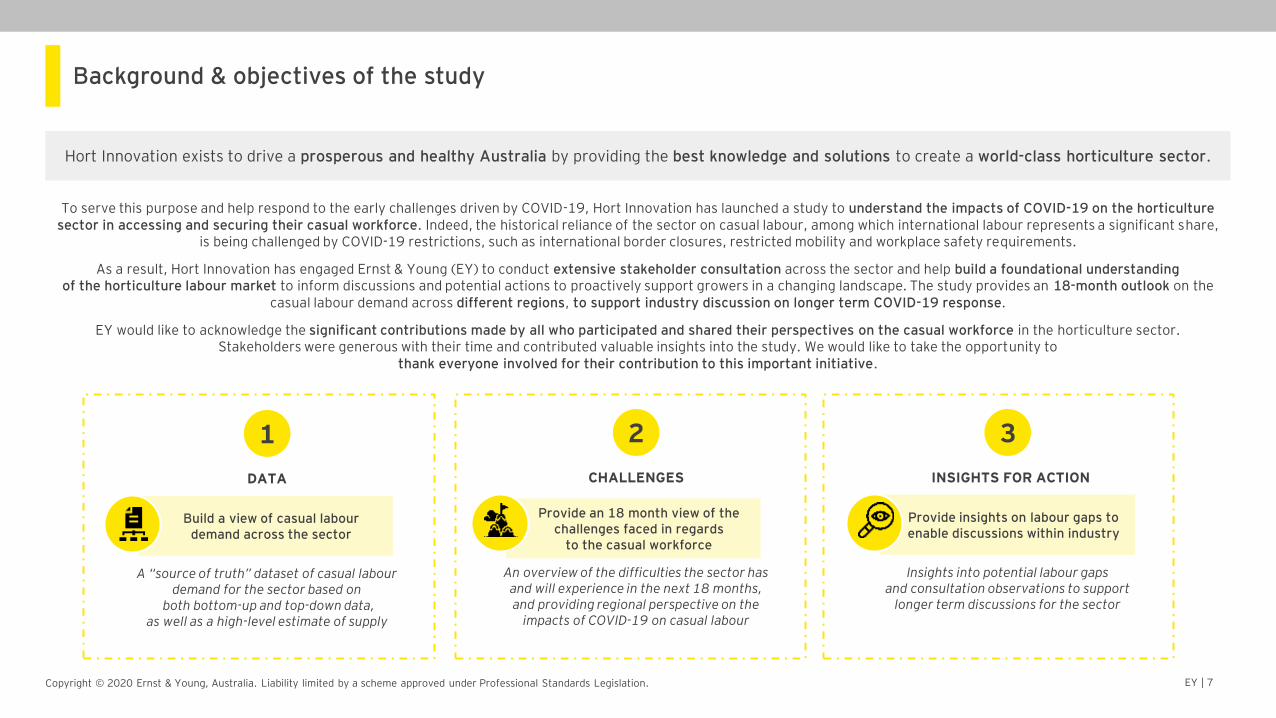
Hort Innovation exists to drive a prosperous and healthy Australia by providing the best knowledge and solutions to create a world-class horticulture sector.
Background & objectives of the study
To serve this purpose and help respond to the early challenges driven by COVID-19, Hort Innovation has launched a study to understand the impacts of COVID-19 on the horticulture sector in accessing and securing their casual workforce. Indeed, the historical reliance of the sector on casual labour, among which international labour represents a significant share,
is being challenged by COVID-19 restrictions, such as international border closures, restricted mobility and workplace safety requirements.
As a result, Hort Innovation has engaged Ernst & Young (EY) to conduct extensive stakeholder consultation across the sector and help build a foundational understanding of the horticulture labour market to inform discussions and potential actions to proactively support growers in a changing landscape. The study provides an 18-month outlook on the
casual labour demand across different regions, to support industry discussion on longer term COVID-19 response.
EY would like to acknowledge the significant contributions made by all who participated and shared their perspectives on the casual workforce in the horticulture sector. Stakeholders were generous with their time and contributed valuable insights into the study. We would like to take the opportunity to
thank everyone involved for their contribution to this important initiative.
31 2
An overview of the difficulties the sector has and will experience in the next 18 months, and providing regional perspective on the
impacts of COVID-19 on casual labour
Provide an 18 month view of the challenges faced in regards
to the casual workforce
Provide insights on labour gaps to enable discussions within industry
Insights into potential labour gaps and consultation observations to support
longer term discussions for the sector
Build a view of casual labour demand across the sector
A “source of truth” dataset of casual labour demand for the sector based on
both bottom-up and top-down data, as well as a high-level estimate of supply
CHALLENGESDATA INSIGHTS FOR ACTION
EY | 8Copyright © 2020 Ernst & Young, Australia. Liability limited by a scheme approved under Professional Standards Legislation.
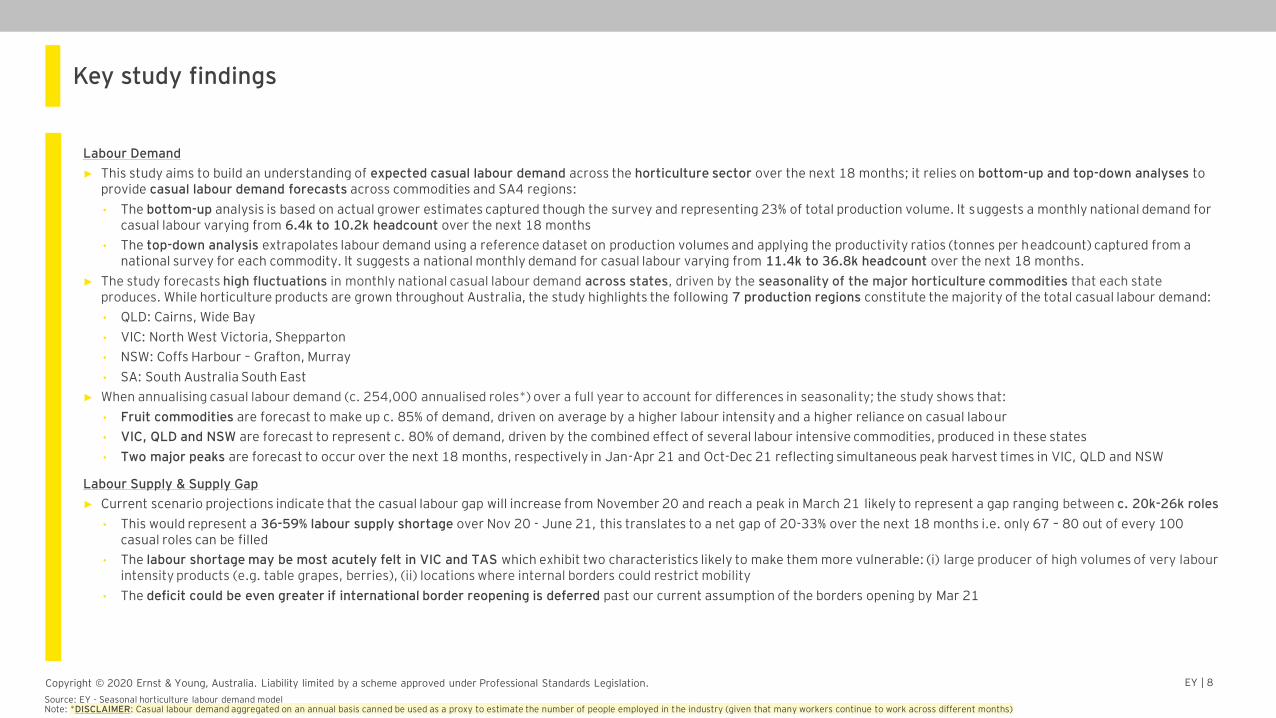
Key study findings
Labour Demand
► This study aims to build an understanding of expected casual labour demand across the horticulture sector over the next 18 months; it relies on bottom-up and top-down analyses to provide casual labour demand forecasts across commodities and SA4 regions:
• The bottom-up analysis is based on actual grower estimates captured though the survey and representing 23% of total production volume. It suggests a monthly national demand for casual labour varying from 6.4k to 10.2k headcount over the next 18 months
• The top-down analysis extrapolates labour demand using a reference dataset on production volumes and applying the productivity ratios (tonnes per headcount) captured from a national survey for each commodity. It suggests a national monthly demand for casual labour varying from 11.4k to 36.8k headcount over the next 18 months.
► The study forecasts high fluctuations in monthly national casual labour demand across states, driven by the seasonality of the major horticulture commodities that each state produces. While horticulture products are grown throughout Australia, the study highlights the following 7 production regions constitute the majority of the total casual labour demand:
• QLD: Cairns, Wide Bay
• VIC: North West Victoria, Shepparton
• NSW: Coffs Harbour – Grafton, Murray
• SA: South Australia South East
► When annualising casual labour demand (c. 254,000 annualised roles*) over a full year to account for differences in seasonality; the study shows that:
• Fruit commodities are forecast to make up c. 85% of demand, driven on average by a higher labour intensity and a higher reliance on casual labour
• VIC, QLD and NSW are forecast to represent c. 80% of demand, driven by the combined effect of several labour intensive commodities, produced in these states
• Two major peaks are forecast to occur over the next 18 months, respectively in Jan-Apr 21 and Oct-Dec 21 reflecting simultaneous peak harvest times in VIC, QLD and NSW
Labour Supply & Supply Gap
► Current scenario projections indicate that the casual labour gap will increase from November 20 and reach a peak in March 21 likely to represent a gap ranging between c. 20k-26k roles
• This would represent a 36-59% labour supply shortage over Nov 20 - June 21, this translates to a net gap of 20-33% over the next 18 months i.e. only 67 – 80 out of every 100 casual roles can be filled
• The labour shortage may be most acutely felt in VIC and TAS which exhibit two characteristics likely to make them more vulnerable: (i) large producer of high volumes of very labour intensity products (e.g. table grapes, berries), (ii) locations where internal borders could restrict mobility
• The deficit could be even greater if international border reopening is deferred past our current assumption of the borders opening by Mar 21
Source: EY - Seasonal horticulture labour demand modelNote: *DISCLAIMER: Casual labour demand aggregated on an annual basis canned be used as a proxy to estimate the number of people employed in the industry (given that many workers continue to work across different months)
EY | 9Copyright © 2020 Ernst & Young, Australia. Liability limited by a scheme approved under Professional Standards Legislation.
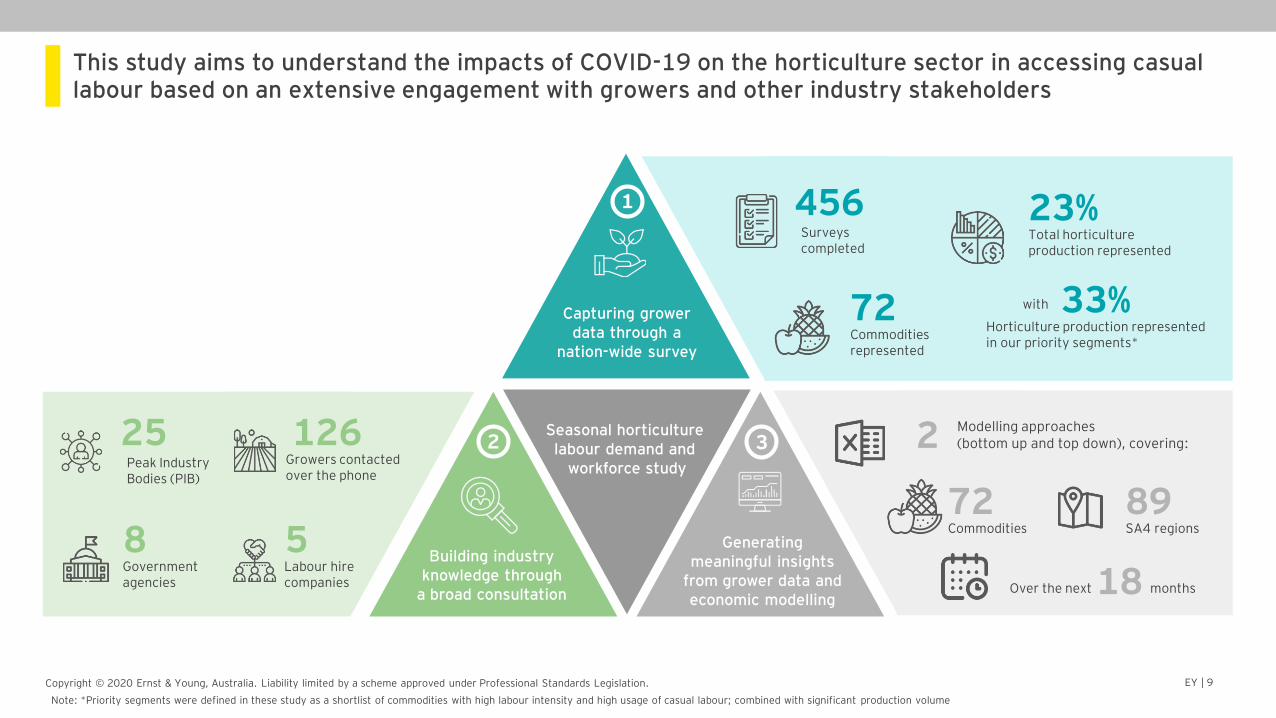
This study aims to understand the impacts of COVID-19 on the horticulture sector in accessing casual labour based on an extensive engagement with growers and other industry stakeholders
Note: *Priority segments were defined in these study as a shortlist of commodities with high labour intensity and high usage of casual labour; combined with significant production volume
Seasonal horticulture labour demand and
workforce study
Capturing grower data through a
nation-wide survey
1
2
Building industry knowledge through
a broad consultation
3
Generating meaningful insights
from grower data and economic modelling
25Peak Industry Bodies (PIB)
8Government agencies
126Growers contacted over the phone
5Labour hire companies
2 Modelling approaches (bottom up and top down), covering:
89SA4 regions
72Commodities
18 monthsOver the next
456Surveys completed
72Commodities represented
23%Total horticulture production represented
with 33%Horticulture production represented in our priority segments*
EY | 10Copyright © 2020 Ernst & Young, Australia. Liability limited by a scheme approved under Professional Standards Legislation.
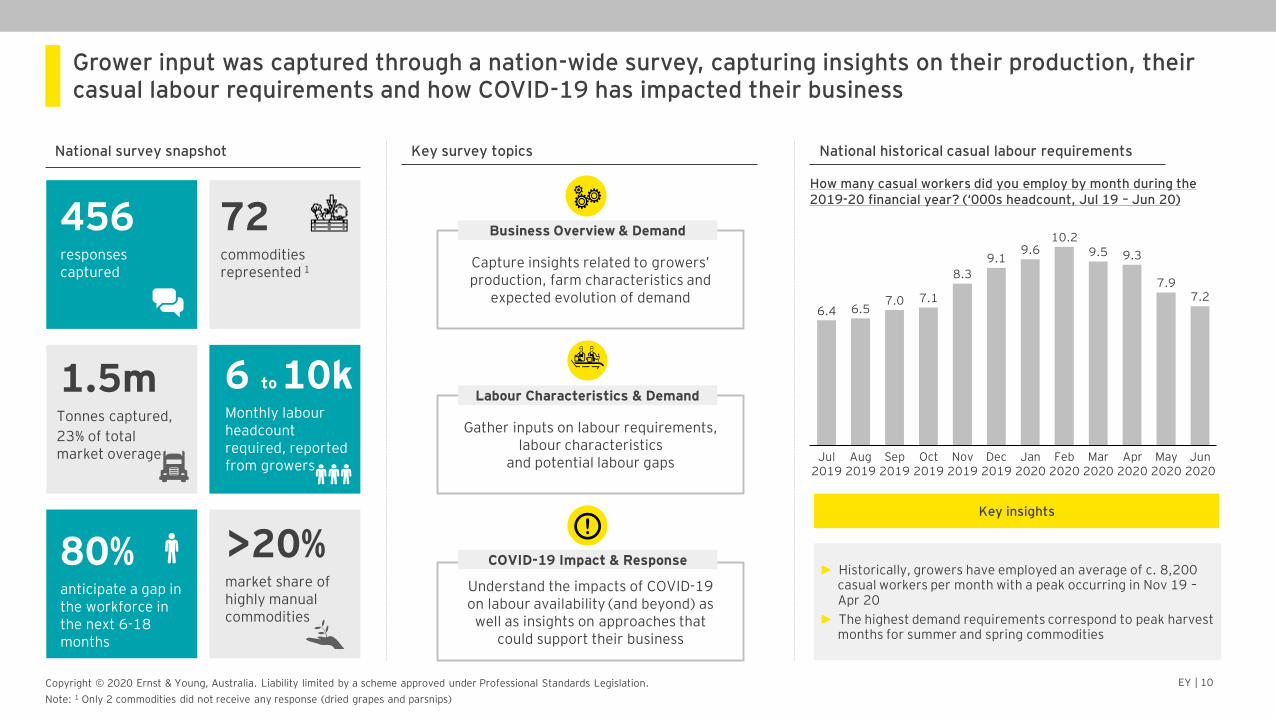
Grower input was captured through a nation-wide survey, capturing insights on their production, their casual labour requirements and how COVID-19 has impacted their business
National survey snapshot
456responsescaptured
72commodities represented 1
1.5mTonnes captured,
23% of total market overage
>20%80%anticipate a gap in the workforce in the next 6-18 months
Monthly labour headcount required, reported from growers
market share of highly manual commodities
Key survey topics
Capture insights related to growers’ production, farm characteristics and
expected evolution of demand
Business Overview & Demand
Gather inputs on labour requirements, labour characteristics
and potential labour gaps
Labour Characteristics & Demand
Understand the impacts of COVID-19 on labour availability (and beyond) as
well as insights on approaches that could support their business
COVID-19 Impact & Response
National historical casual labour requirements
How many casual workers did you employ by month during the 2019-20 financial year? (‘000s headcount, Jul 19 – Jun 20)
Aug 2019
Jan 2020
Nov 2019
Jul 2019
6.4
May 2020
Sep 2019
Feb 2020
9.5
Oct 2019
Dec 2019
Mar 2020
9.1
Apr 2020
10.2
Jun 2020
6.5
9.3
7.0 7.1
8.3
9.6
7.97.2
► Historically, growers have employed an average of c. 8,200 casual workers per month with a peak occurring in Nov 19 –Apr 20
► The highest demand requirements correspond to peak harvest months for summer and spring commodities
Key insights
6 to 10k
Note: 1 Only 2 commodities did not receive any response (dried grapes and parsnips)
EY | 11Copyright © 2020 Ernst & Young, Australia. Liability limited by a scheme approved under Professional Standards Legislation.
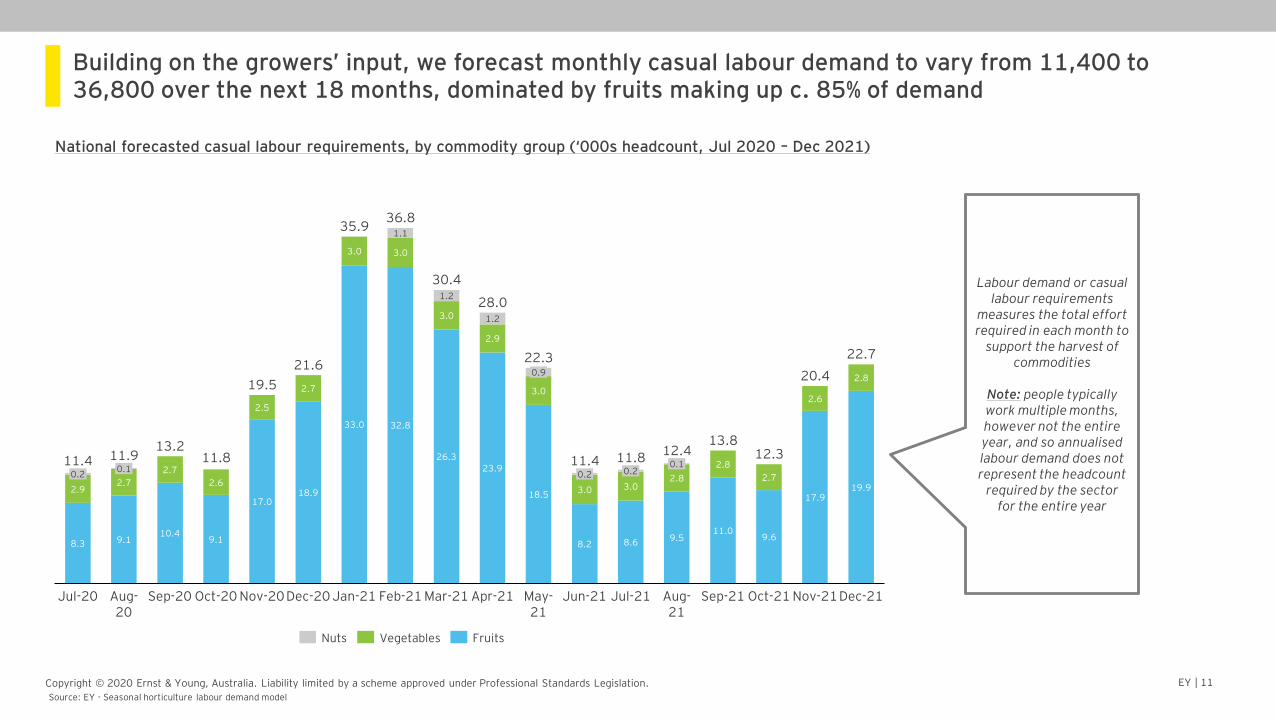
Building on the growers’ input, we forecast monthly casual labour demand to vary from 11,400 to 36,800 over the next 18 months, dominated by fruits making up c. 85% of demand
National forecasted casual labour requirements, by commodity group (‘000s headcount, Jul 2020 – Dec 2021)
2.5
Aug-20
Jan-21
9.18.3
1.2
Feb-21
2.7
0.1
2.9
11.0
2.8
3.0
0.2
Jul-20
3.0
10.4
Mar-21
2.7
May-21
18.9
Sep-20
9.1
2.6
Oct-20
17.0
11.4
Nov-20
2.7
Dec-20
33.0
9.6
3.0
32.8
1.2
17.9
1.1
Sep-21
0.9
26.3
3.0
23.9
3.0
Apr-21
2.9
18.5
8.2
0.2
Jun-21
2.8
Oct-21
8.6
Dec-21
0.2
Jul-21
9.5
2.72.8
35.9
0.1
3.0
2.6
Nov-21
19.9
11.913.2
11.8
19.5
21.6
36.8
Aug-21
28.0
22.3
11.4 11.812.4
13.812.3
20.4
22.7
30.4
Nuts Vegetables Fruits
Source: EY - Seasonal horticulture labour demand model
Labour demand or casual labour requirements
measures the total effort required in each month to
support the harvest of commodities
Note: people typically work multiple months, however not the entire year, and so annualised labour demand does not represent the headcount
required by the sector for the entire year
EY | 12Copyright © 2020 Ernst & Young, Australia. Liability limited by a scheme approved under Professional Standards Legislation.
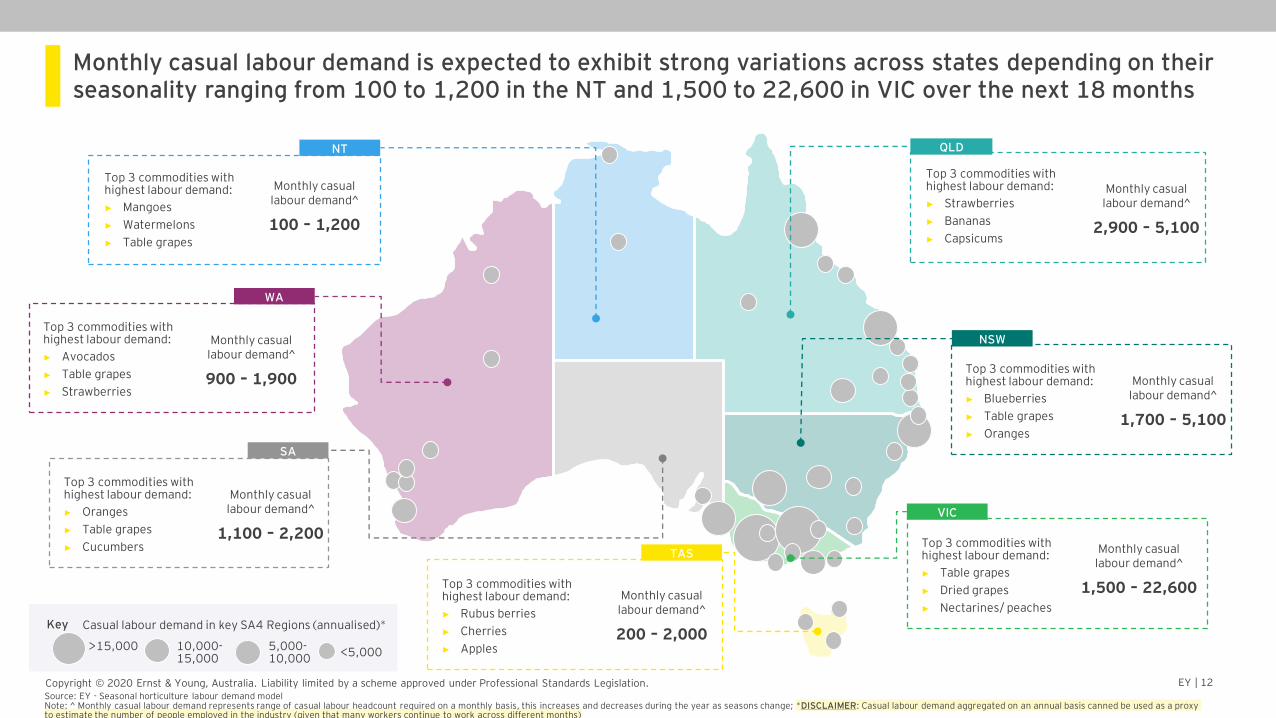
Monthly casual labour demand is expected to exhibit strong variations across states depending on their seasonality ranging from 100 to 1,200 in the NT and 1,500 to 22,600 in VIC over the next 18 months
Top 3 commodities with highest labour demand:
► Mangoes
► Watermelons
► Table grapes
NT
Top 3 commodities with highest labour demand:
► Avocados
► Table grapes
► Strawberries
WA
QLD
Top 3 commodities with highest labour demand:
► Strawberries
► Bananas
► Capsicums
NSW
Top 3 commodities with highest labour demand:
► Blueberries
► Table grapes
► Oranges
Top 3 commodities with highest labour demand:
► Table grapes
► Dried grapes
► Nectarines/ peaches
VIC
Top 3 commodities with highest labour demand:
► Rubus berries
► Cherries
► Apples
TAS
Top 3 commodities with highest labour demand:
► Oranges
► Table grapes
► Cucumbers
SA
Monthly casual labour demand^
100 – 1,200
Monthly casual labour demand^
900 – 1,900
Monthly casual labour demand^
1,100 – 2,200
Monthly casual labour demand^
200 – 2,000
Monthly casual labour demand^
1,500 – 22,600
Monthly casual labour demand^
1,700 – 5,100
Monthly casual labour demand^
2,900 – 5,100
Key
>15,000 10,000-15,000
5,000-10,000
Casual labour demand in key SA4 Regions (annualised)*
<5,000
Source: EY - Seasonal horticulture labour demand modelNote: ^ Monthly casual labour demand represents range of casual labour headcount required on a monthly basis, this increases and decreases during the year as seasons change; *DISCLAIMER: Casual labour demand aggregated on an annual basis canned be used as a proxy to estimate the number of people employed in the industry (given that many workers continue to work across different months)

EY | 13Copyright © 2020 Ernst & Young, Australia. Liability limited by a scheme approved under Professional Standards Legislation.
Seven production regions stand out with forecasted annualised casual labour demand over 10,000 headcount, among which 2 are in VIC, 2 in QLD, 2 in NSW, 1 in SA
Total forecasted casual labour requirements, by SA4 (‘000s headcount, Jul 20 – Jun 21)*
Riverina
Coffs Harbour - Grafton
Murray
North West
Melbourne – Outer East
Wide Bay
Cairns
Darling Downs - Maranoa
Bunbury
Western Australia –Wheat Belt
Western Australia –Outback (South)
South Australia –South East
Adelaide – Central and Hills
West and North West
Launceston and North East
South East
Darwin
Northern Territory - Outback
Capital Region
Central West
Mid North Coast
Mornington Peninsula
Central Queensland
Ipswich
Mackay Isaac Whitsunday
Bendigo
Moreton Bay North
Queensland Outback
Sunshine CoastToowoomba
Townsville
Perth – South EastPerth –South West
Shepparton
Hume
Latrobe -Gippsland
Source: EY - Seasonal horticulture labour demand modelNote: *DISCLAIMER: Casual labour demand aggregated on an annual basis canned be used as a proxy to estimate the number of people employed in the industry (given that many workers continue to work across different months)
Melbourne - West
Richmond - Tweed
Western Australia –Outback (North)
Perth – North East
Apples
Avocados
Bananas
Blueberries
Cucumbers
Dried Grapes
Lemons/limes
Mandarins
Nectarines/Peaches
Oranges
Pears
Papaya/Pawpaw
Table Grapes
Commodity
>15,000
10,000-15,000
5,000-10,000
1,000-5,000
Key
EY | 14Copyright © 2020 Ernst & Young, Australia. Liability limited by a scheme approved under Professional Standards Legislation.
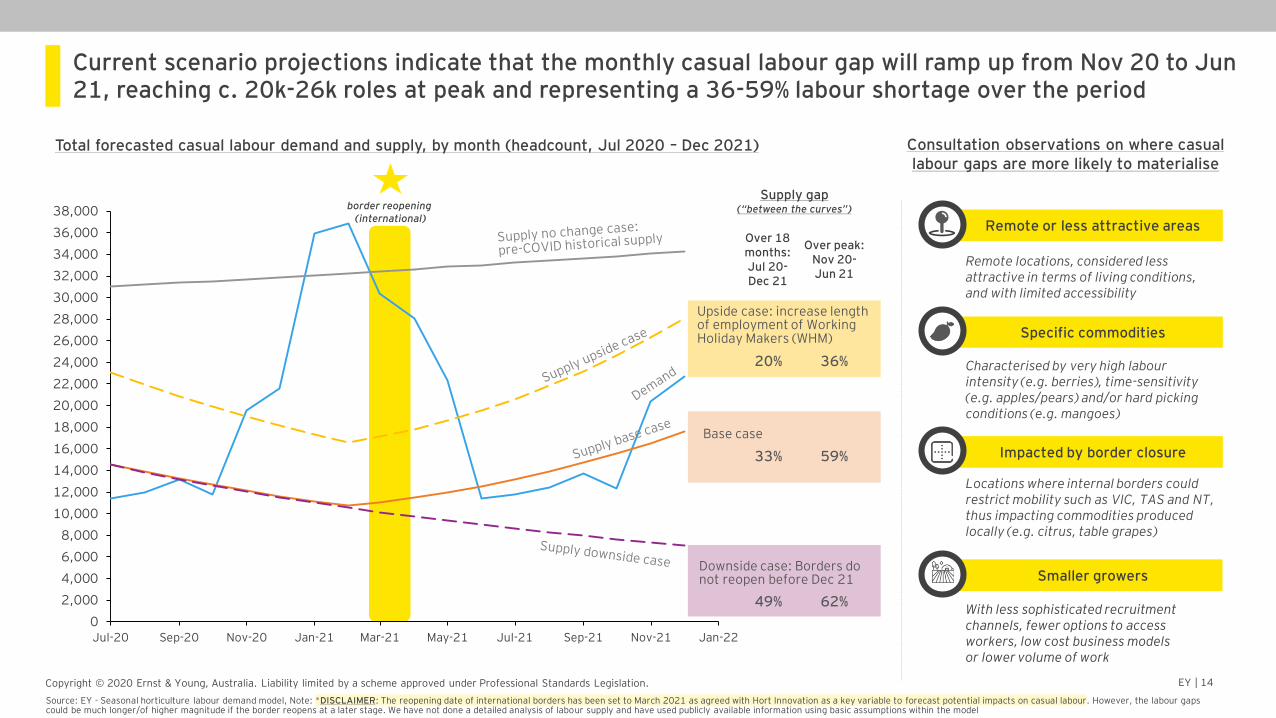
Current scenario projections indicate that the monthly casual labour gap will ramp up from Nov 20 to Jun 21, reaching c. 20k-26k roles at peak and representing a 36-59% labour shortage over the period
Source: EY - Seasonal horticulture labour demand model, Note: *DISCLAIMER: The reopening date of international borders has been set to March 2021 as agreed with Hort Innovation as a key variable to forecast potential impacts on casual labour. However, the labour gaps could be much longer/of higher magnitude if the border reopens at a later stage. We have not done a detailed analysis of labour supply and have used publicly available information using basic assumptions within the model
Total forecasted casual labour demand and supply, by month (headcount, Jul 2020 – Dec 2021)
Upside case: increase length of employment of Working Holiday Makers (WHM)
Downside case: Borders do not reopen before Dec 21
Base case
Consultation observations on where casual labour gaps are more likely to materialise
Characterised by very high labour intensity (e.g. berries), time-sensitivity (e.g. apples/pears) and/or hard picking conditions (e.g. mangoes)
Specific commodities
Locations where internal borders could restrict mobility such as VIC, TAS and NT, thus impacting commodities produced locally (e.g. citrus, table grapes)
Impacted by border closure
Remote locations, considered less attractive in terms of living conditions, and with limited accessibility
Remote or less attractive areas
With less sophisticated recruitment channels, fewer options to access workers, low cost business models or lower volume of work
Smaller growers
Supply gap (“between the curves”)
Over peak:Nov 20-Jun 21
Over 18 months:Jul 20-Dec 21
36%20%
59%33%
62%49%
border reopening (international)
0
2,000
4,000
6,000
8,000
10,000
12,000
14,000
16,000
18,000
20,000
22,000
24,000
26,000
28,000
30,000
32,000
34,000
36,000
38,000
Nov-21Jul-20 Sep-20 Nov-20 Jan-21 Mar-21 May-21 Jul-21 Sep-21 Jan-22
Study Methodology
EY | 16Copyright © 2020 Ernst & Young, Australia. Liability limited by a scheme approved under Professional Standards Legislation.
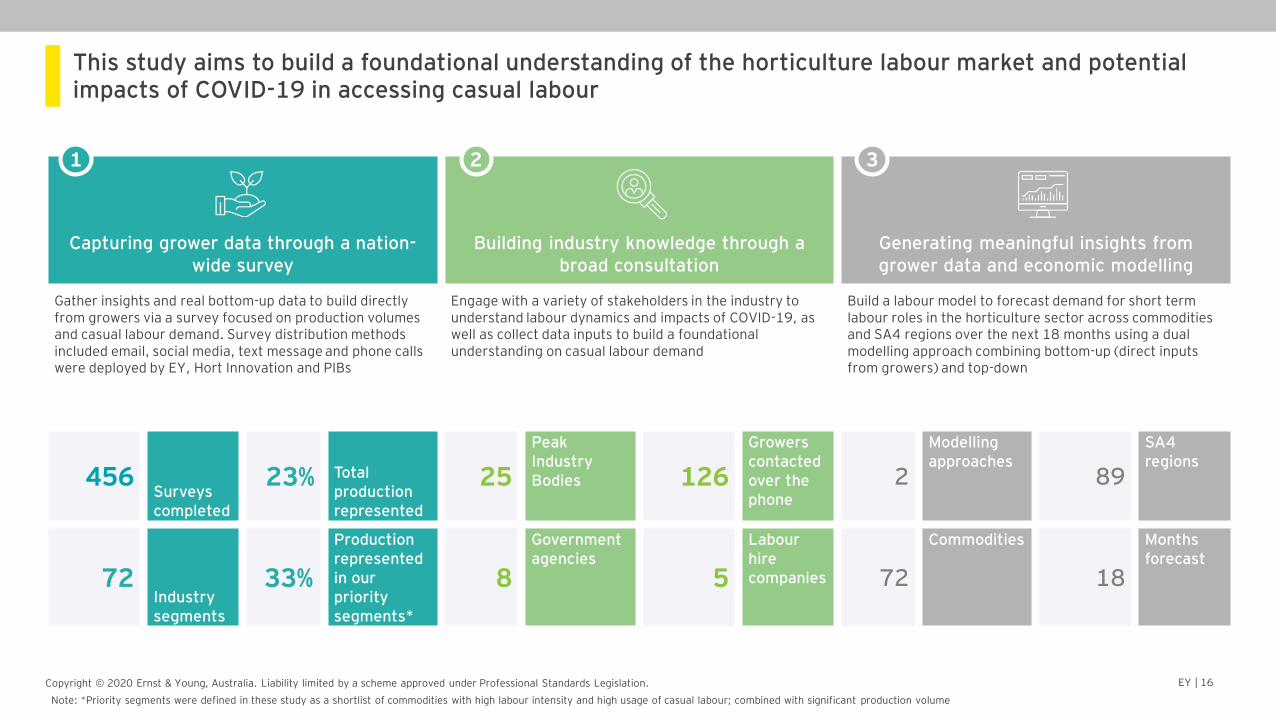
This study aims to build a foundational understanding of the horticulture labour market and potential impacts of COVID-19 in accessing casual labour
Capturing grower data through a nation-wide survey
Building industry knowledge through a broad consultation
Generating meaningful insights from grower data and economic modelling
Gather insights and real bottom-up data to build directly from growers via a survey focused on production volumes and casual labour demand. Survey distribution methods included email, social media, text message and phone calls were deployed by EY, Hort Innovation and PIBs
Engage with a variety of stakeholders in the industry to understand labour dynamics and impacts of COVID-19, as well as collect data inputs to build a foundational understanding on casual labour demand
Build a labour model to forecast demand for short term labour roles in the horticulture sector across commodities and SA4 regions over the next 18 months using a dual modelling approach combining bottom-up (direct inputs from growers) and top-down
456Surveys completed
23% Total production represented
25
Peak Industry Bodies 126
Growers contacted over the phone
2
Modelling approaches
89
SA4 regions
72Industry segments
33%
Production represented in our priority segments*
8
Government agencies
5
Labour hire companies 72
Commodities
18
Months forecast
1 2 3
Note: *Priority segments were defined in these study as a shortlist of commodities with high labour intensity and high usage of casual labour; combined with significant production volume
EY | 17Copyright © 2020 Ernst & Young, Australia. Liability limited by a scheme approved under Professional Standards Legislation.
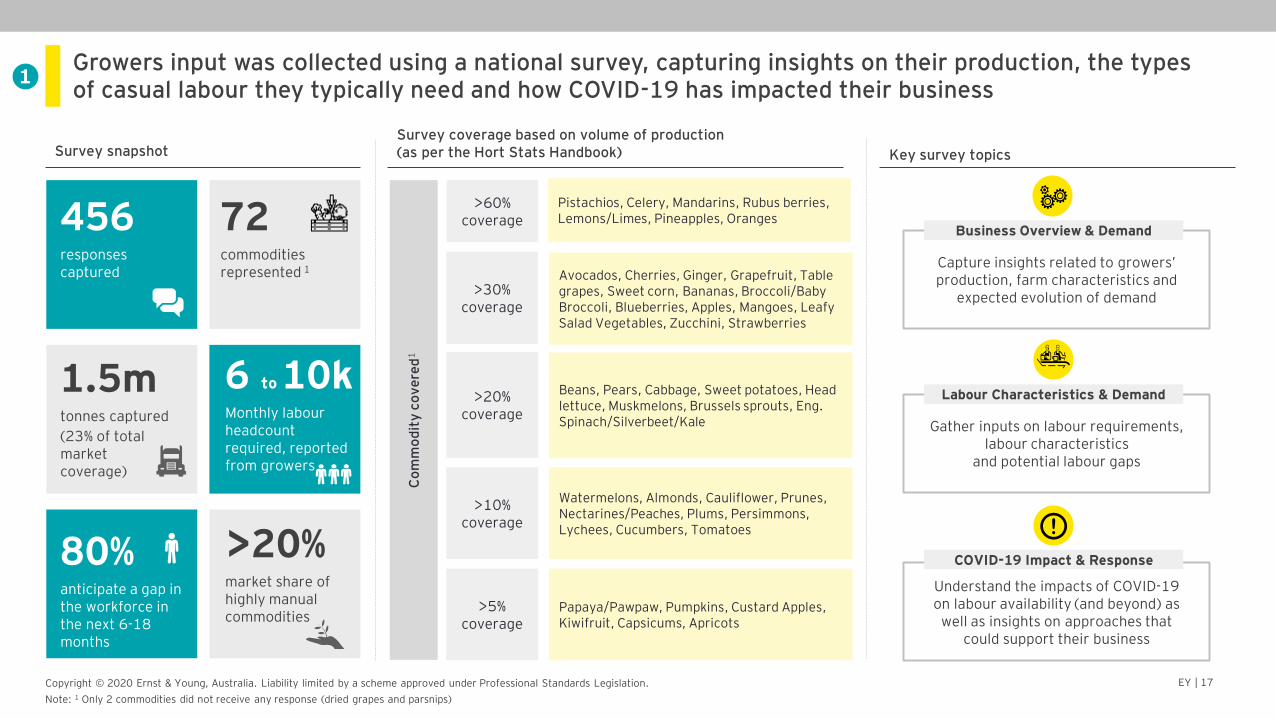
Growers input was collected using a national survey, capturing insights on their production, the types of casual labour they typically need and how COVID-19 has impacted their business
Survey snapshot
456responsescaptured
72commodities represented 1
1.5mtonnes captured
(23% of total market coverage)
>20%80%anticipate a gap in the workforce in the next 6-18 months
6 to 10kMonthly labour headcount required, reported from growers
market share of highly manual commodities
Key survey topics
Co
mm
od
ity
co
ve
red
1
Survey coverage based on volume of production (as per the Hort Stats Handbook)
Capture insights related to growers’ production, farm characteristics and
expected evolution of demand
Business Overview & Demand
Gather inputs on labour requirements, labour characteristics
and potential labour gaps
Labour Characteristics & Demand
Understand the impacts of COVID-19 on labour availability (and beyond) as
well as insights on approaches that could support their business
COVID-19 Impact & Response
Note: 1 Only 2 commodities did not receive any response (dried grapes and parsnips)
1
>60% coverage
Pistachios, Celery, Mandarins, Rubus berries, Lemons/Limes, Pineapples, Oranges
Avocados, Cherries, Ginger, Grapefruit, Table grapes, Sweet corn, Bananas, Broccoli/Baby Broccoli, Blueberries, Apples, Mangoes, Leafy Salad Vegetables, Zucchini, Strawberries
>30% coverage
>10% coverage
Watermelons, Almonds, Cauliflower, Prunes, Nectarines/Peaches, Plums, Persimmons, Lychees, Cucumbers, Tomatoes
>20% coverage
Beans, Pears, Cabbage, Sweet potatoes, Head lettuce, Muskmelons, Brussels sprouts, Eng. Spinach/Silverbeet/Kale
>5% coverage
Papaya/Pawpaw, Pumpkins, Custard Apples, Kiwifruit, Capsicums, Apricots
EY | 18Copyright © 2020 Ernst & Young, Australia. Liability limited by a scheme approved under Professional Standards Legislation.
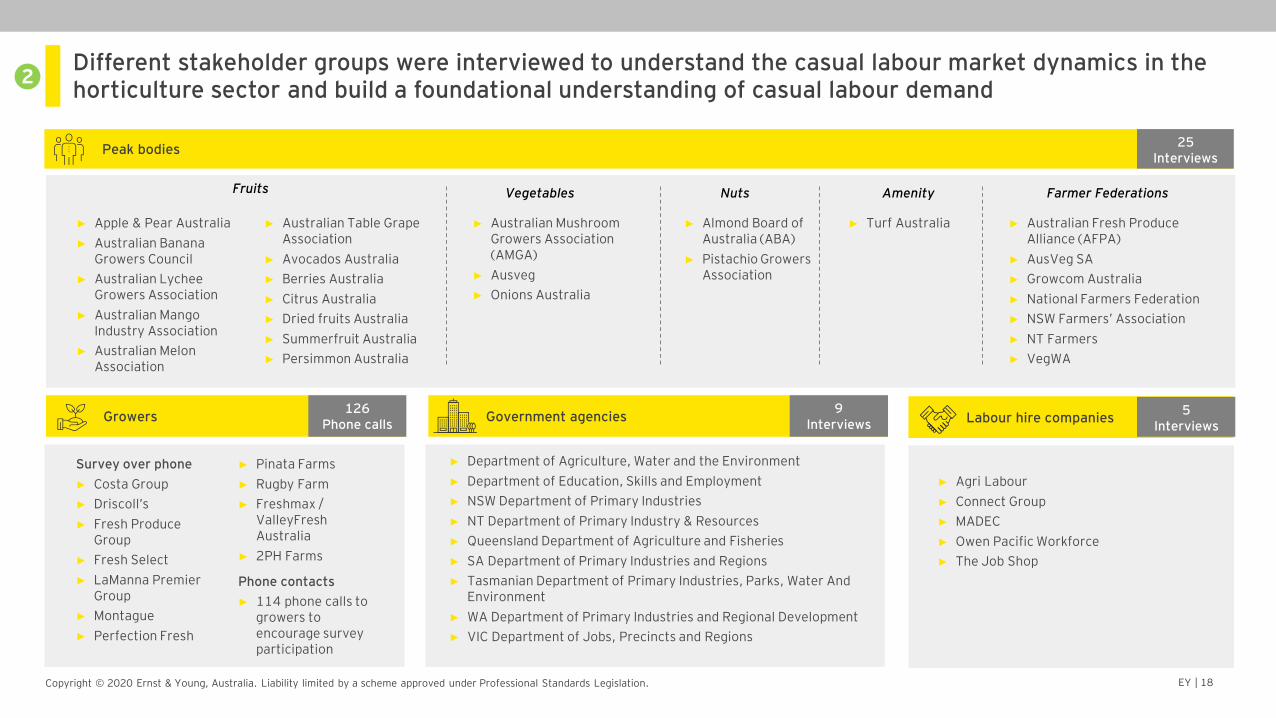
Different stakeholder groups were interviewed to understand the casual labour market dynamics in the horticulture sector and build a foundational understanding of casual labour demand
Peak bodies
Farmer Federations
► Apple & Pear Australia
► Australian Banana Growers Council
► Australian Lychee Growers Association
► Australian Mango Industry Association
► Australian Melon Association
► Australian Fresh Produce Alliance (AFPA)
► AusVeg SA
► Growcom Australia
► National Farmers Federation
► NSW Farmers’ Association
► NT Farmers
► VegWA
► Australian Table Grape Association
► Avocados Australia
► Berries Australia
► Citrus Australia
► Dried fruits Australia
► Summerfruit Australia
► Persimmon Australia
► Australian Mushroom Growers Association (AMGA)
► Ausveg
► Onions Australia
VegetablesFruits AmenityNuts
► Almond Board of Australia (ABA)
► Pistachio Growers Association
► Turf Australia
Growers Government agencies Labour hire companies
► Pinata Farms
► Rugby Farm
► Freshmax / ValleyFresh Australia
► 2PH Farms
Phone contacts
► 114 phone calls to growers to encourage survey participation
Survey over phone
► Costa Group
► Driscoll’s
► Fresh Produce Group
► Fresh Select
► LaManna Premier Group
► Montague
► Perfection Fresh
► Department of Agriculture, Water and the Environment
► Department of Education, Skills and Employment
► NSW Department of Primary Industries
► NT Department of Primary Industry & Resources
► Queensland Department of Agriculture and Fisheries
► SA Department of Primary Industries and Regions
► Tasmanian Department of Primary Industries, Parks, Water And Environment
► WA Department of Primary Industries and Regional Development
► VIC Department of Jobs, Precincts and Regions
► Agri Labour
► Connect Group
► MADEC
► Owen Pacific Workforce
► The Job Shop
25 Interviews
126Phone calls
9Interviews
5Interviews
2
EY | 19Copyright © 2020 Ernst & Young, Australia. Liability limited by a scheme approved under Professional Standards Legislation.
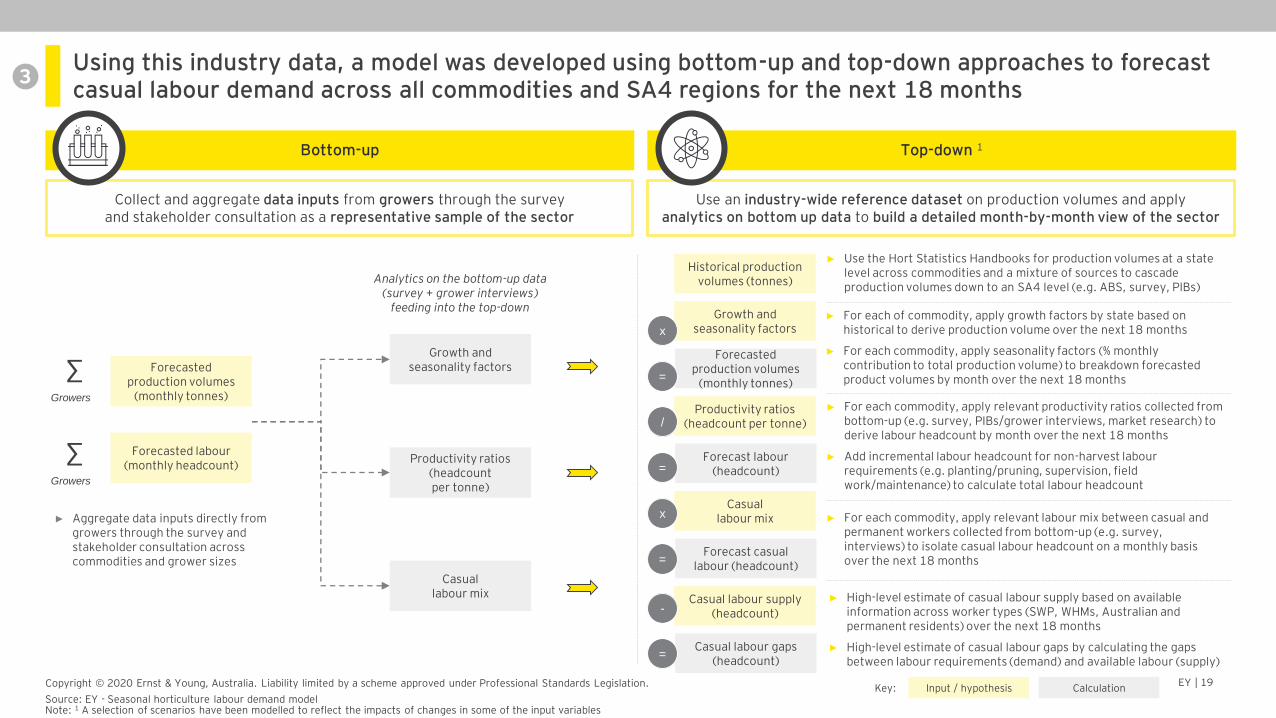
Using this industry data, a model was developed using bottom-up and top-down approaches to forecast casual labour demand across all commodities and SA4 regions for the next 18 months
Use an industry-wide reference dataset on production volumes and apply analytics on bottom up data to build a detailed month-by-month view of the sector
Collect and aggregate data inputs from growers through the survey and stakeholder consultation as a representative sample of the sector
Bottom-up Top-down 1
► Use the Hort Statistics Handbooks for production volumes at a state level across commodities and a mixture of sources to cascade production volumes down to an SA4 level (e.g. ABS, survey, PIBs)
Historical production volumes (tonnes)
Growth and seasonality factorsx
Forecasted production volumes
(monthly tonnes)
Productivity ratios (headcount per tonne)/
Forecast labour(headcount)
Casual labour mix
Forecast casual labour (headcount)
x
=
=
Input / hypothesis CalculationKey:
=
► For each of commodity, apply growth factors by state based on historical to derive production volume over the next 18 months
► For each commodity, apply seasonality factors (% monthly contribution to total production volume) to breakdown forecasted product volumes by month over the next 18 months
► For each commodity, apply relevant productivity ratios collected from bottom-up (e.g. survey, PIBs/grower interviews, market research) to derive labour headcount by month over the next 18 months
► Add incremental labour headcount for non-harvest labour requirements (e.g. planting/pruning, supervision, field work/maintenance) to calculate total labour headcount
► For each commodity, apply relevant labour mix between casual and permanent workers collected from bottom-up (e.g. survey, interviews) to isolate casual labour headcount on a monthly basis over the next 18 months
Analytics on the bottom-up data (survey + grower interviews)
feeding into the top-down
∑Growers
Forecasted production volumes
(monthly tonnes)
Productivity ratios (headcount per tonne)
Forecasted labour(monthly headcount)
∑Growers
Growth and seasonality factors
Casual labour mix
► Aggregate data inputs directly from growers through the survey and stakeholder consultation across commodities and grower sizes
Casual labour supply (headcount)
Casual labour gaps (headcount)
-
=
► High-level estimate of casual labour supply based on available information across worker types (SWP, WHMs, Australian and permanent residents) over the next 18 months
► High-level estimate of casual labour gaps by calculating the gaps between labour requirements (demand) and available labour (supply)
Source: EY - Seasonal horticulture labour demand model Note: 1 A selection of scenarios have been modelled to reflect the impacts of changes in some of the input variables
3

Horticulture industry context
EY | 21Copyright © 2020 Ernst & Young, Australia. Liability limited by a scheme approved under Professional Standards Legislation.
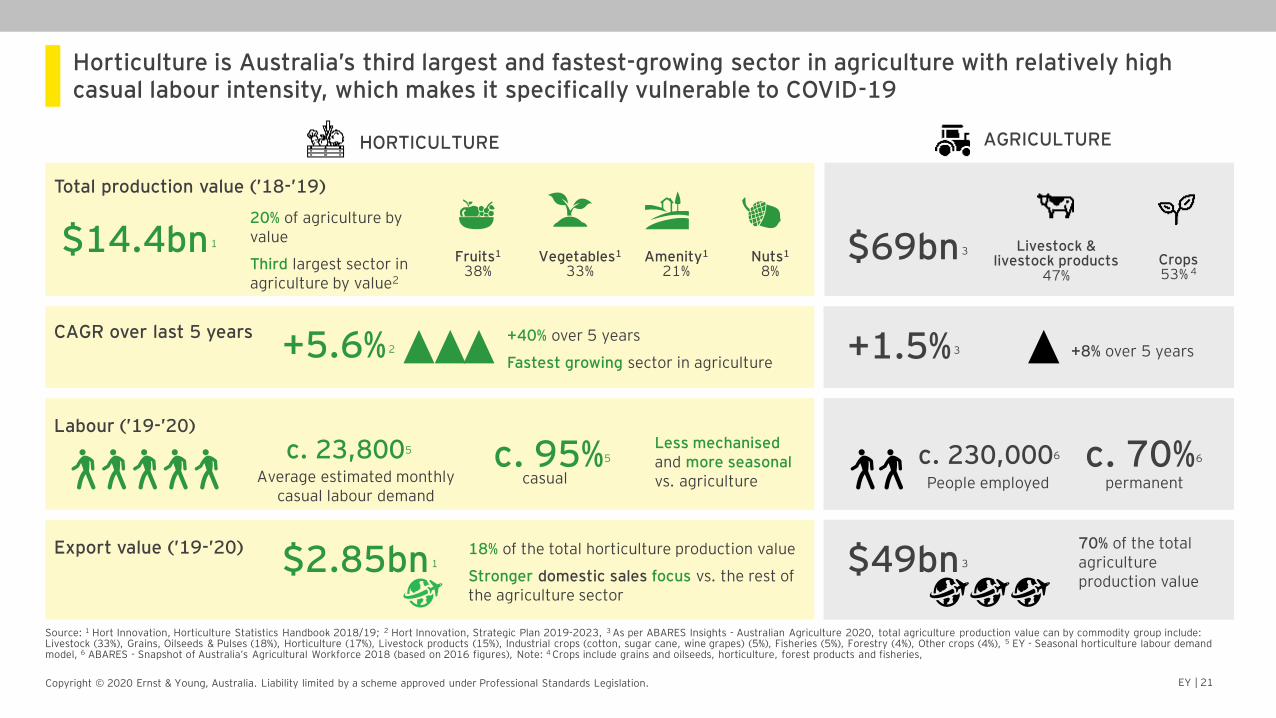
Horticulture is Australia’s third largest and fastest-growing sector in agriculture with relatively high casual labour intensity, which makes it specifically vulnerable to COVID-19
Total production value (’18-’19)
$14.4bn 1
HORTICULTURE AGRICULTURE
Fruits1
38%Vegetables1
33%Amenity1
21%Nuts1
8%$69bn 3
Source: 1 Hort Innovation, Horticulture Statistics Handbook 2018/19; 2 Hort Innovation, Strategic Plan 2019-2023, 3 As per ABARES Insights - Australian Agriculture 2020, total agriculture production value can by commodity group include: Livestock (33%), Grains, Oilseeds & Pulses (18%), Horticulture (17%), Livestock products (15%), Industrial crops (cotton, sugar cane, wine grapes) (5%), Fisheries (5%), Forestry (4%), Other crops (4%), 5 EY - Seasonal horticulture labour demand model, 6 ABARES - Snapshot of Australia’s Agricultural Workforce 2018 (based on 2016 figures), Note: 4 Crops include grains and oilseeds, horticulture, forest products and fisheries,
Livestock & livestock products
47%Crops 53% 4
CAGR over last 5 years+5.6% 2 +1.5% 3
20% of agriculture by value
Third largest sector in agriculture by value2
+40% over 5 years
Fastest growing sector in agriculture
Export value (’19-’20) $2.85bn 1
+8% over 5 years
18% of the total horticulture production value
Stronger domestic sales focus vs. the rest of the agriculture sector
70% of the total agriculture production value
$49bn 3
Labour (’19-’20)
c. 23,8005 c. 230,0006Less mechanised and more seasonalvs. agriculture permanentcasual People employedAverage estimated monthly
casual labour demand
c. 70%6c. 95%5
EY | 22Copyright © 2020 Ernst & Young, Australia. Liability limited by a scheme approved under Professional Standards Legislation.
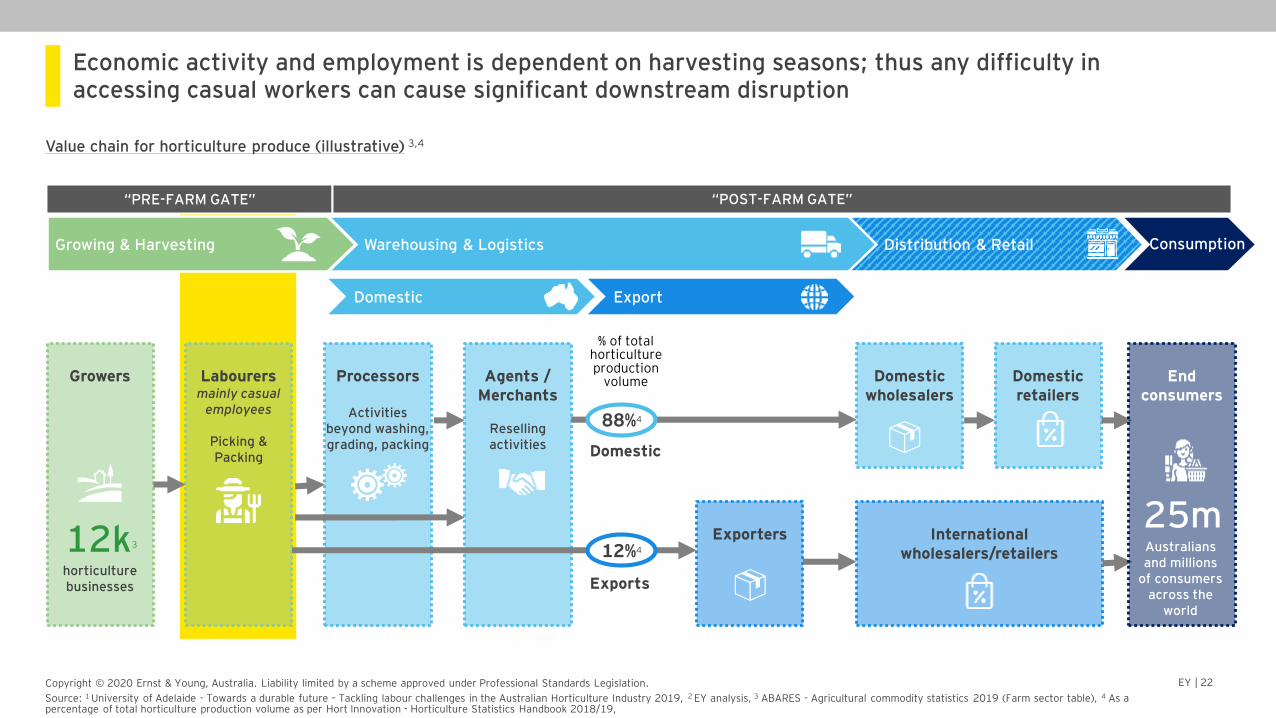
Economic activity and employment is dependent on harvesting seasons; thus any difficulty in accessing casual workers can cause significant downstream disruption
Value chain for horticulture produce (illustrative) 3,4
Growing & Harvesting Warehousing & Logistics Distribution & Retail
“PRE-FARM GATE” “POST-FARM GATE”
Source: 1 University of Adelaide - Towards a durable future – Tackling labour challenges in the Australian Horticulture Industry 2019, 2 EY analysis, 3 ABARES - Agricultural commodity statistics 2019 (Farm sector table), 4 As a percentage of total horticulture production volume as per Hort Innovation - Horticulture Statistics Handbook 2018/19,
Domestic Export
Growers Labourers mainly casual
employees
Picking & Packing
Agents / Merchants
Reselling activities
Domestic wholesalers
Domestic retailers
Processors
Activities beyond washing, grading, packing
Exporters International wholesalers/retailers12k3
horticulture businesses
12%4
88%4
Domestic
Exports
End consumers
25m Australians and millions
of consumers across the
world
% of total horticulture production
volume
Consumption
EY | 23Copyright © 2020 Ernst & Young, Australia. Liability limited by a scheme approved under Professional Standards Legislation.
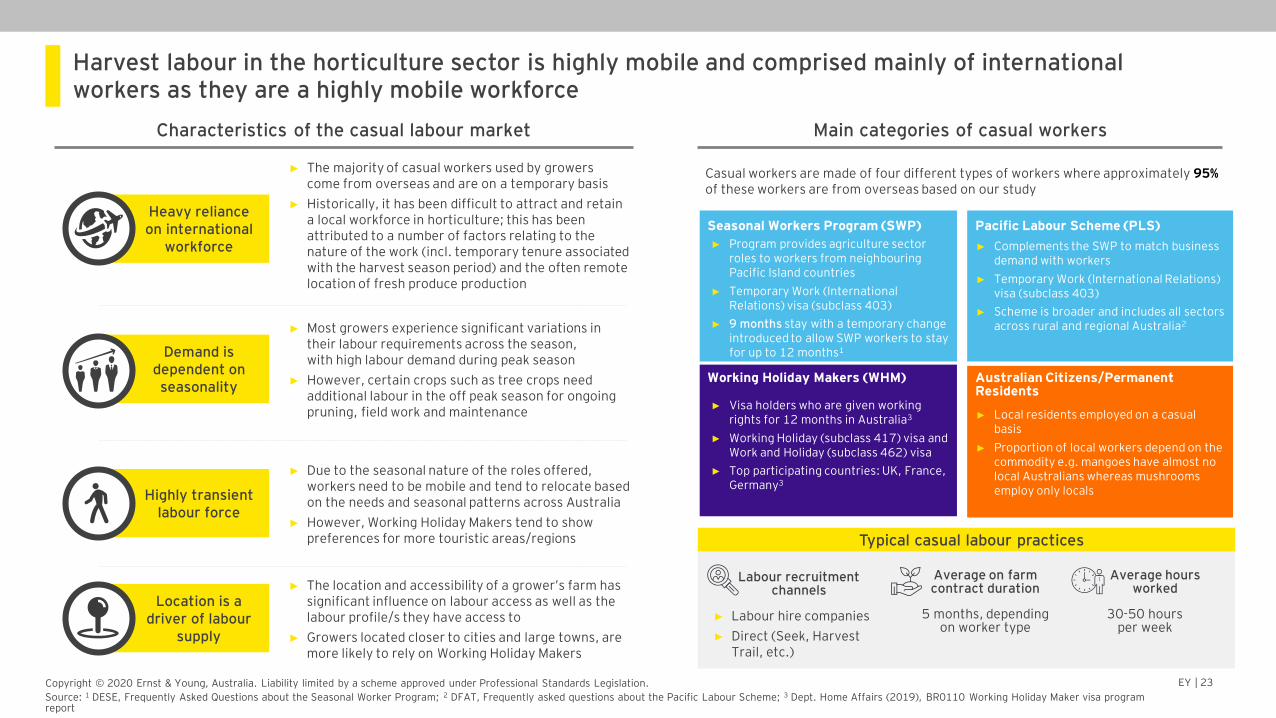
Harvest labour in the horticulture sector is highly mobile and comprised mainly of international workers as they are a highly mobile workforce
Main categories of casual workersCharacteristics of the casual labour market
Source: 1 DESE, Frequently Asked Questions about the Seasonal Worker Program; 2 DFAT, Frequently asked questions about the Pacific Labour Scheme; 3 Dept. Home Affairs (2019), BR0110 Working Holiday Maker visa program report
► Most growers experience significant variations in their labour requirements across the season, with high labour demand during peak season
► However, certain crops such as tree crops need additional labour in the off peak season for ongoing pruning, field work and maintenance
Demand is dependent on seasonality
► Due to the seasonal nature of the roles offered, workers need to be mobile and tend to relocate based on the needs and seasonal patterns across Australia
► However, Working Holiday Makers tend to show preferences for more touristic areas/regions
Highly transient labour force
► The majority of casual workers used by growers come from overseas and are on a temporary basis
► Historically, it has been difficult to attract and retain a local workforce in horticulture; this has been attributed to a number of factors relating to the nature of the work (incl. temporary tenure associated with the harvest season period) and the often remote location of fresh produce production
Heavy reliance on international
workforce
► The location and accessibility of a grower’s farm has significant influence on labour access as well as the labour profile/s they have access to
► Growers located closer to cities and large towns, are more likely to rely on Working Holiday Makers
Location is a driver of labour
supply
Average on farm contract duration
5 months, depending on worker type
Average hours worked
30-50 hours per week
Typical casual labour practices
Labour recruitment channels
► Labour hire companies
► Direct (Seek, Harvest Trail, etc.)
Seasonal Workers Program (SWP)
Casual workers are made of four different types of workers where approximately 95%of these workers are from overseas based on our study
► Program provides agriculture sector roles to workers from neighbouring Pacific Island countries
► Temporary Work (International Relations) visa (subclass 403)
► 9 months stay with a temporary change introduced to allow SWP workers to stay for up to 12 months1
Pacific Labour Scheme (PLS)
► Complements the SWP to match business demand with workers
► Temporary Work (International Relations) visa (subclass 403)
► Scheme is broader and includes all sectors across rural and regional Australia2
Working Holiday Makers (WHM)
► Visa holders who are given working rights for 12 months in Australia3
► Working Holiday (subclass 417) visa and Work and Holiday (subclass 462) visa
► Top participating countries: UK, France, Germany3
Australian Citizens/Permanent Residents
► Local residents employed on a casual basis
► Proportion of local workers depend on the commodity e.g. mangoes have almost no local Australians whereas mushrooms employ only locals
EY | 24Copyright © 2020 Ernst & Young, Australia. Liability limited by a scheme approved under Professional Standards Legislation.
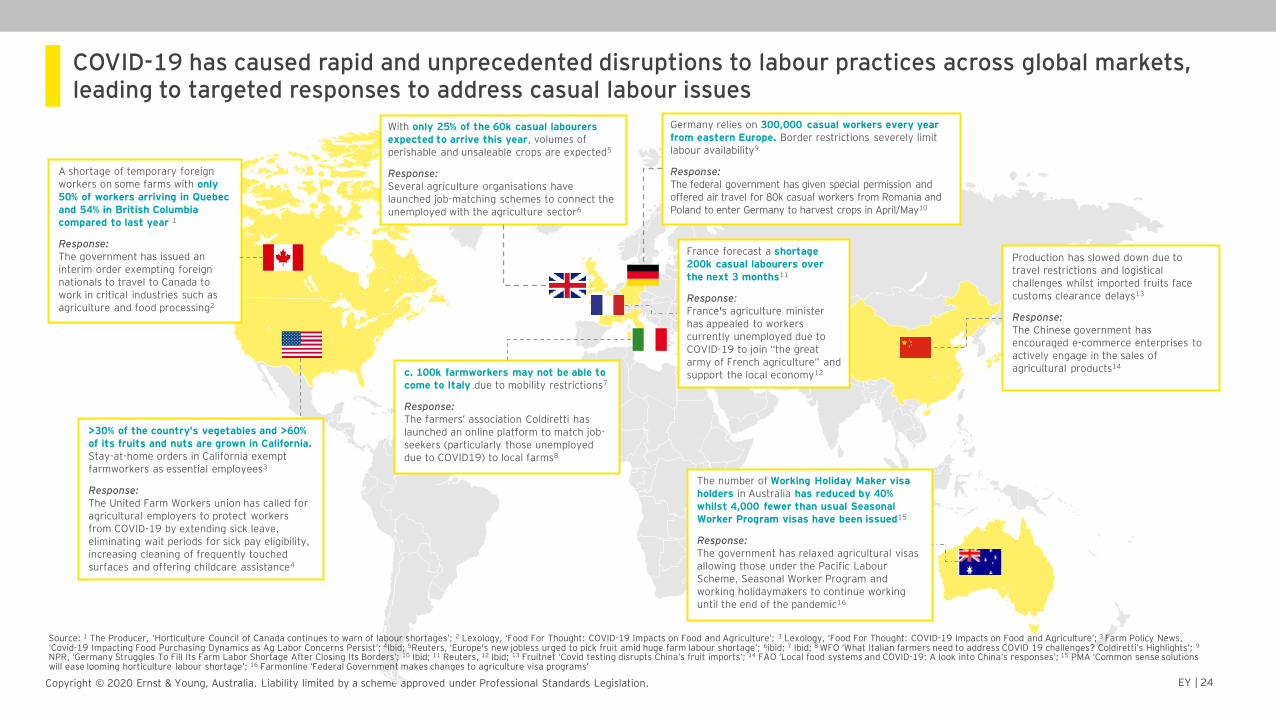
COVID-19 has caused rapid and unprecedented disruptions to labour practices across global markets, leading to targeted responses to address casual labour issues
The number of Working Holiday Maker visa holders in Australia has reduced by 40% whilst 4,000 fewer than usual Seasonal Worker Program visas have been issued15
Response:The government has relaxed agricultural visas allowing those under the Pacific Labour Scheme, Seasonal Worker Program and working holidaymakers to continue working until the end of the pandemic16
>30% of the country’s vegetables and >60% of its fruits and nuts are grown in California. Stay-at-home orders in California exempt farmworkers as essential employees3
Response:The United Farm Workers union has called for agricultural employers to protect workers from COVID-19 by extending sick leave, eliminating wait periods for sick pay eligibility, increasing cleaning of frequently touched surfaces and offering childcare assistance4
Germany relies on 300,000 casual workers every year from eastern Europe. Border restrictions severely limit labour availability9
Response:The federal government has given special permission and offered air travel for 80k casual workers from Romania and Poland to enter Germany to harvest crops in April/May10
France forecast a shortage 200k casual labourers over the next 3 months11
Response:France's agriculture minister has appealed to workers currently unemployed due to COVID-19 to join “the great army of French agriculture” and support the local economy12
With only 25% of the 60k casual labourers expected to arrive this year, volumes of perishable and unsaleable crops are expected5
Response:Several agriculture organisations have launched job-matching schemes to connect the unemployed with the agriculture sector6
A shortage of temporary foreign workers on some farms with only 50% of workers arriving in Quebec and 54% in British Columbia compared to last year 1
Response:The government has issued an interim order exempting foreign nationals to travel to Canada to work in critical industries such as agriculture and food processing2
c. 100k farmworkers may not be able to come to Italy due to mobility restrictions7
Response: The farmers’ association Coldiretti has launched an online platform to match job-seekers (particularly those unemployed due to COVID19) to local farms8
Production has slowed down due to travel restrictions and logistical challenges whilst imported fruits face customs clearance delays13
Response:The Chinese government has encouraged e-commerce enterprises to actively engage in the sales of agricultural products14
Source: 1 The Producer, ‘Horticulture Council of Canada continues to warn of labour shortages’; 2 Lexology, ‘Food For Thought: COVID-19 Impacts on Food and Agriculture’; 3 Lexology, ‘Food For Thought: COVID-19 Impacts on Food and Agriculture’; 3 Farm Policy News, ‘Covid-19 Impacting Food Purchasing Dynamics as Ag Labor Concerns Persist’; 4Ibid; 5Reuters, ‘Europe's new jobless urged to pick fruit amid huge farm labour shortage’; 6ibid; 7 Ibid; 8 WFO ‘What Italian farmers need to address COVID 19 challenges? Coldiretti’s Highlights’; 9
NPR, ‘Germany Struggles To Fill Its Farm Labor Shortage After Closing Its Borders’; 10 Ibid; 11 Reuters, 12 Ibid; 13 Fruitnet ‘Covid testing disrupts China’s fruit imports’; 14 FAO ‘Local food systems and COVID-19: A look into China’s responses’; 15 PMA ‘Common sense solutions will ease looming horticulture labour shortage’; 16 Farmonline ‘Federal Government makes changes to agriculture visa programs’
EY | 25Copyright © 2020 Ernst & Young, Australia. Liability limited by a scheme approved under Professional Standards Legislation.
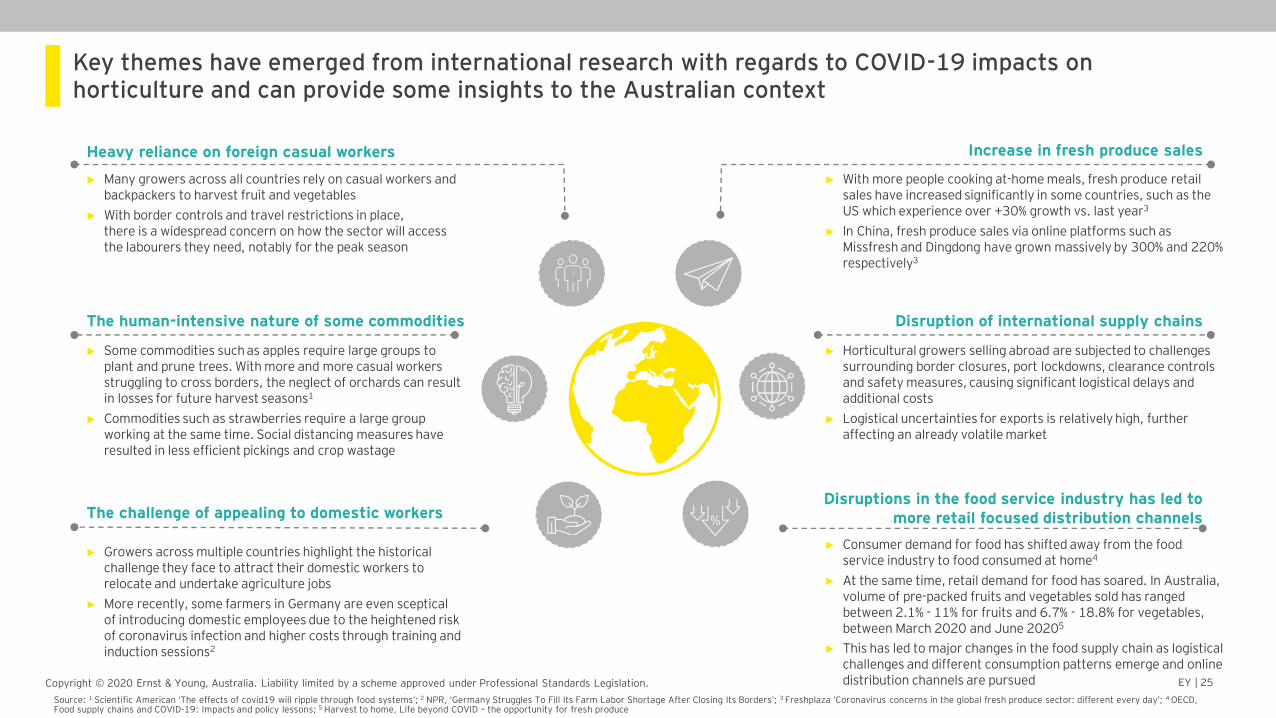
Key themes have emerged from international research with regards to COVID-19 impacts on horticulture and can provide some insights to the Australian context
► Supply chain (SC) resilience
► Third-party service providers
► Business interruption
► Supply chain claims
► Event cancellation
Heavy reliance on foreign casual workers
► Many growers across all countries rely on casual workers and backpackers to harvest fruit and vegetables
► With border controls and travel restrictions in place, there is a widespread concern on how the sector will access the labourers they need, notably for the peak season
The challenge of appealing to domestic workers
Increase in fresh produce sales
Disruptions in the food service industry has led to more retail focused distribution channels
Disruption of international supply chains The human-intensive nature of some commodities
► Consumer demand for food has shifted away from the food service industry to food consumed at home4
► At the same time, retail demand for food has soared. In Australia, volume of pre-packed fruits and vegetables sold has ranged between 2.1% - 11% for fruits and 6.7% - 18.8% for vegetables, between March 2020 and June 20205
► This has led to major changes in the food supply chain as logistical challenges and different consumption patterns emerge and online distribution channels are pursued
► Some commodities such as apples require large groups to plant and prune trees. With more and more casual workers struggling to cross borders, the neglect of orchards can result in losses for future harvest seasons1
► Commodities such as strawberries require a large group working at the same time. Social distancing measures have resulted in less efficient pickings and crop wastage
► Growers across multiple countries highlight the historical challenge they face to attract their domestic workers to relocate and undertake agriculture jobs
► More recently, some farmers in Germany are even sceptical of introducing domestic employees due to the heightened risk of coronavirus infection and higher costs through training and induction sessions2
► With more people cooking at-home meals, fresh produce retail sales have increased significantly in some countries, such as the US which experience over +30% growth vs. last year3
► In China, fresh produce sales via online platforms such as Missfresh and Dingdong have grown massively by 300% and 220% respectively3
► Horticultural growers selling abroad are subjected to challenges surrounding border closures, port lockdowns, clearance controls and safety measures, causing significant logistical delays and additional costs
► Logistical uncertainties for exports is relatively high, further affecting an already volatile market
xx xxx
xxx
Source: 1 Scientific American ‘The effects of covid19 will ripple through food systems’; 2 NPR, ‘Germany Struggles To Fill Its Farm Labor Shortage After Closing Its Borders’; 3 Freshplaza ‘Coronavirus concerns in the global fresh produce sector: different every day’; 4 OECD, Food supply chains and COVID-19: Impacts and policy lessons; 5 Harvest to home, Life beyond COVID – the opportunity for fresh produce
EY | 26Copyright © 2020 Ernst & Young, Australia. Liability limited by a scheme approved under Professional Standards Legislation.
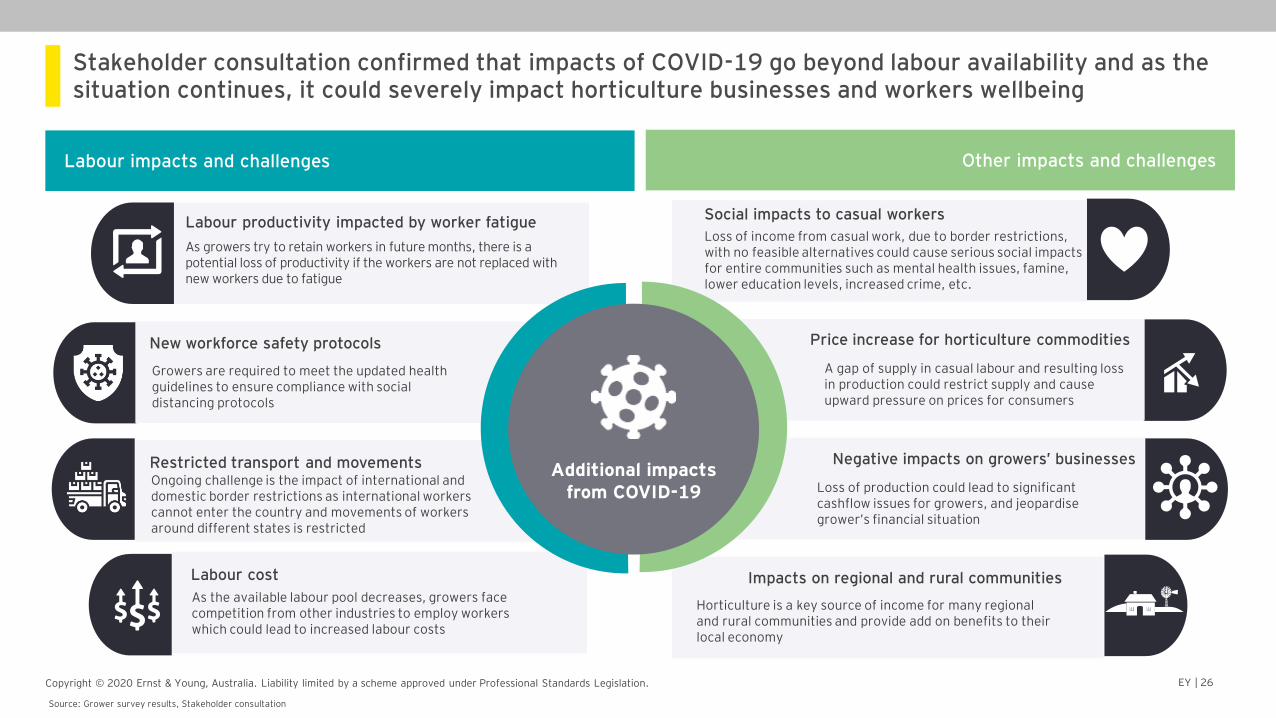
Stakeholder consultation confirmed that impacts of COVID-19 go beyond labour availability and as the situation continues, it could severely impact horticulture businesses and workers wellbeing
Labour impacts and challenges
Social impacts to casual workers
Loss of income from casual work, due to border restrictions, with no feasible alternatives could cause serious social impacts for entire communities such as mental health issues, famine, lower education levels, increased crime, etc.
Price increase for horticulture commodities
A gap of supply in casual labour and resulting loss in production could restrict supply and cause upward pressure on prices for consumers
Negative impacts on growers’ businesses
Loss of production could lead to significant cashflow issues for growers, and jeopardise grower’s financial situation
Labour productivity impacted by worker fatigue
As growers try to retain workers in future months, there is a potential loss of productivity if the workers are not replaced with new workers due to fatigue
New workforce safety protocols
Growers are required to meet the updated health guidelines to ensure compliance with social distancing protocols
Restricted transport and movementsOngoing challenge is the impact of international and domestic border restrictions as international workers cannot enter the country and movements of workers around different states is restricted
Labour cost
As the available labour pool decreases, growers face competition from other industries to employ workers which could lead to increased labour costs
Impacts on regional and rural communities
Horticulture is a key source of income for many regional and rural communities and provide add on benefits to their local economy
Additional impacts from COVID-19
Other impacts and challenges
Source: Grower survey results, Stakeholder consultation

Grower survey results
EY | 28Copyright © 2020 Ernst & Young, Australia. Liability limited by a scheme approved under Professional Standards Legislation.
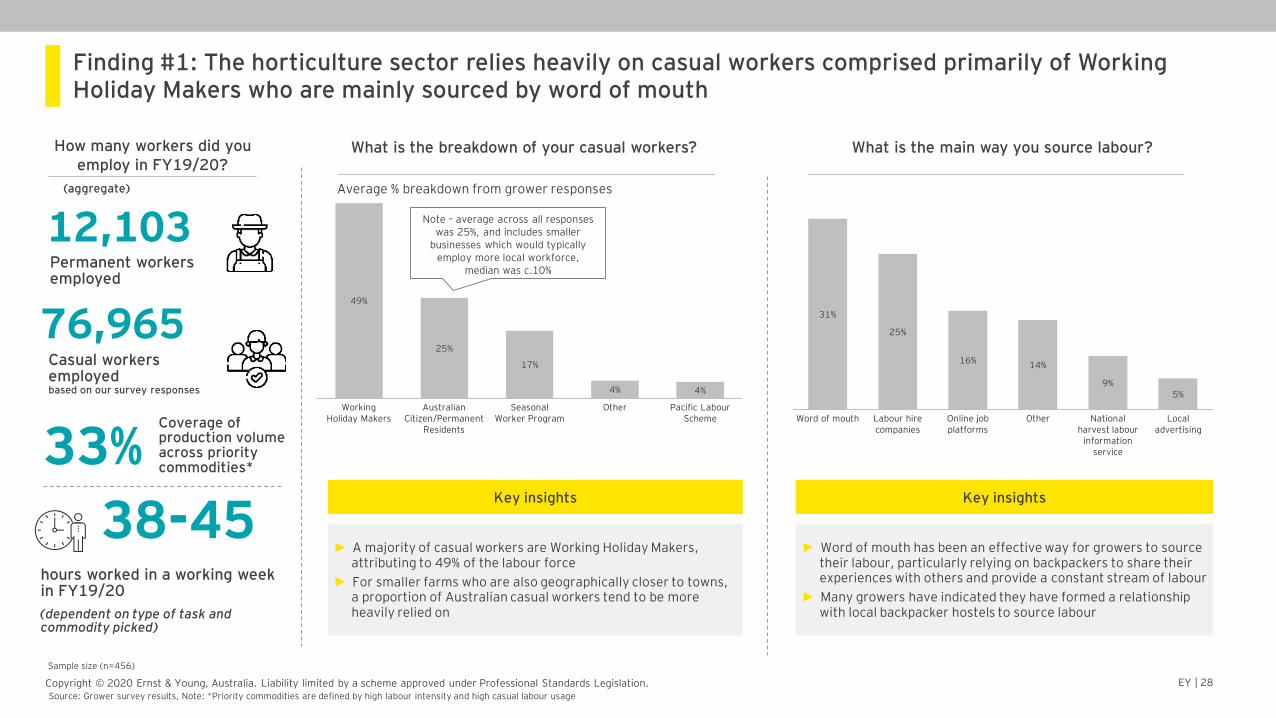
Finding #1: The horticulture sector relies heavily on casual workers comprised primarily of Working Holiday Makers who are mainly sourced by word of mouth
What is the breakdown of your casual workers?
► A majority of casual workers are Working Holiday Makers, attributing to 49% of the labour force
► For smaller farms who are also geographically closer to towns, a proportion of Australian casual workers tend to be more heavily relied on
Key insights
Word of mouth Other
31%
25%
14%
Labour hire companies
16%
Online job platforms
9%
National harvest labour
information service
5%
Local advertising
49%
25%
17%
4% 4%
Seasonal Worker Program
Working Holiday Makers
Australian Citizen/Permanent
Residents
Other Pacific Labour Scheme
► Word of mouth has been an effective way for growers to source their labour, particularly relying on backpackers to share their experiences with others and provide a constant stream of labour
► Many growers have indicated they have formed a relationship with local backpacker hostels to source labour
Key insights
What is the main way you source labour?
Permanent workers employed
Casual workers employedbased on our survey responses
12,103
76,965
hours worked in a working week in FY19/20
(dependent on type of task and commodity picked)
38-45
Sample size (n=456)
How many workers did you employ in FY19/20?
(aggregate)
Source: Grower survey results, Note: *Priority commodities are defined by high labour intensity and high casual labour usage
33%Coverage of production volume across priority commodities*
Average % breakdown from grower responses
Note – average across all responses was 25%, and includes smaller
businesses which would typically employ more local workforce,
median was c.10%
EY | 29Copyright © 2020 Ernst & Young, Australia. Liability limited by a scheme approved under Professional Standards Legislation.
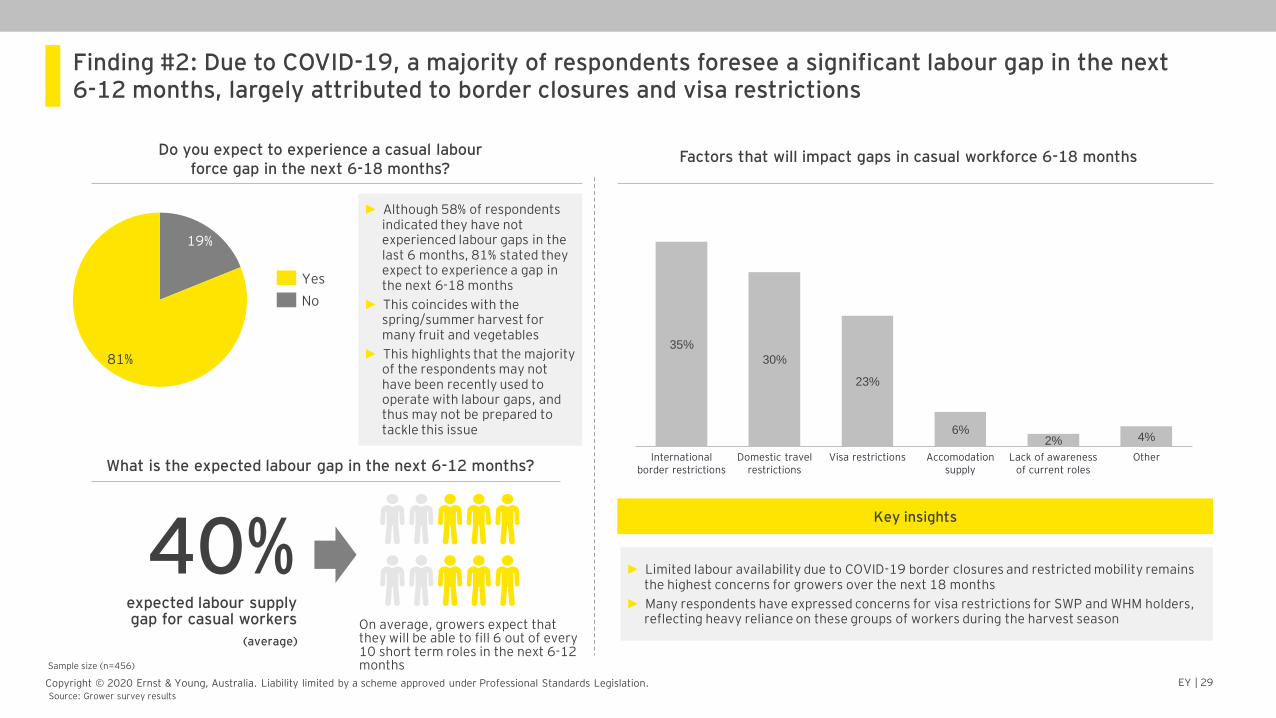
Finding #2: Due to COVID-19, a majority of respondents foresee a significant labour gap in the next 6-12 months, largely attributed to border closures and visa restrictions
40%expected labour supply gap for casual workers
(average)
19%
81%
Yes
No
► Although 58% of respondents indicated they have not experienced labour gaps in the last 6 months, 81% stated they expect to experience a gap in the next 6-18 months
► This coincides with the spring/summer harvest for many fruit and vegetables
► This highlights that the majority of the respondents may not have been recently used to operate with labour gaps, and thus may not be prepared to tackle this issue
Do you expect to experience a casual labour force gap in the next 6-18 months?
35%
Domestic travel restrictions
International border restrictions
30%
23%
Visa restrictions
6%
Accomodation supply
2%
Lack of awareness of current roles
4%
Other
Sample size (n=456)
Factors that will impact gaps in casual workforce 6-18 months
What is the expected labour gap in the next 6-12 months?
► Limited labour availability due to COVID-19 border closures and restricted mobility remains the highest concerns for growers over the next 18 months
► Many respondents have expressed concerns for visa restrictions for SWP and WHM holders, reflecting heavy reliance on these groups of workers during the harvest season
Key insights
Source: Grower survey results
On average, growers expect that they will be able to fill 6 out of every 10 short term roles in the next 6-12 months
EY | 30Copyright © 2020 Ernst & Young, Australia. Liability limited by a scheme approved under Professional Standards Legislation.
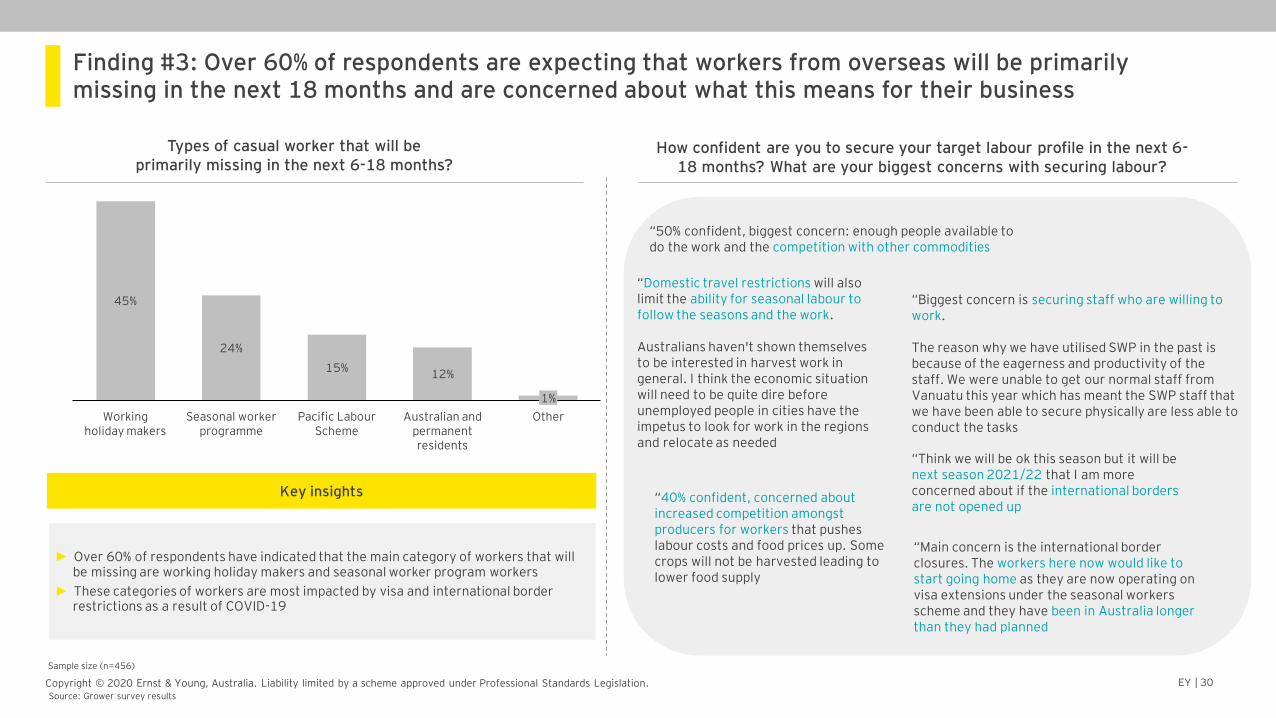
Finding #3: Over 60% of respondents are expecting that workers from overseas will be primarily missing in the next 18 months and are concerned about what this means for their business
Types of casual worker that will be primarily missing in the next 6-18 months?
How confident are you to secure your target labour profile in the next 6-18 months? What are your biggest concerns with securing labour?
► Over 60% of respondents have indicated that the main category of workers that will be missing are working holiday makers and seasonal worker program workers
► These categories of workers are most impacted by visa and international border restrictions as a result of COVID-19
Key insights
12%
Seasonal worker programme
45%
15%
Working holiday makers
24%
Pacific Labour Scheme
Australian and permanent residents
1%
Other
“50% confident, biggest concern: enough people available to do the work and the competition with other commodities
“Biggest concern is securing staff who are willing to work.
The reason why we have utilised SWP in the past is because of the eagerness and productivity of the staff. We were unable to get our normal staff from Vanuatu this year which has meant the SWP staff that we have been able to secure physically are less able to conduct the tasks
“Domestic travel restrictions will also limit the ability for seasonal labour to follow the seasons and the work.
Australians haven't shown themselves to be interested in harvest work in general. I think the economic situation will need to be quite dire before unemployed people in cities have the impetus to look for work in the regions and relocate as needed
“40% confident, concerned about increased competition amongst producers for workers that pushes labour costs and food prices up. Some crops will not be harvested leading to lower food supply
“Think we will be ok this season but it will be next season 2021/22 that I am more concerned about if the international borders are not opened up
“Main concern is the international border closures. The workers here now would like to start going home as they are now operating on visa extensions under the seasonal workers scheme and they have been in Australia longer than they had planned
Sample size (n=456)
Source: Grower survey results
EY | 31Copyright © 2020 Ernst & Young, Australia. Liability limited by a scheme approved under Professional Standards Legislation.
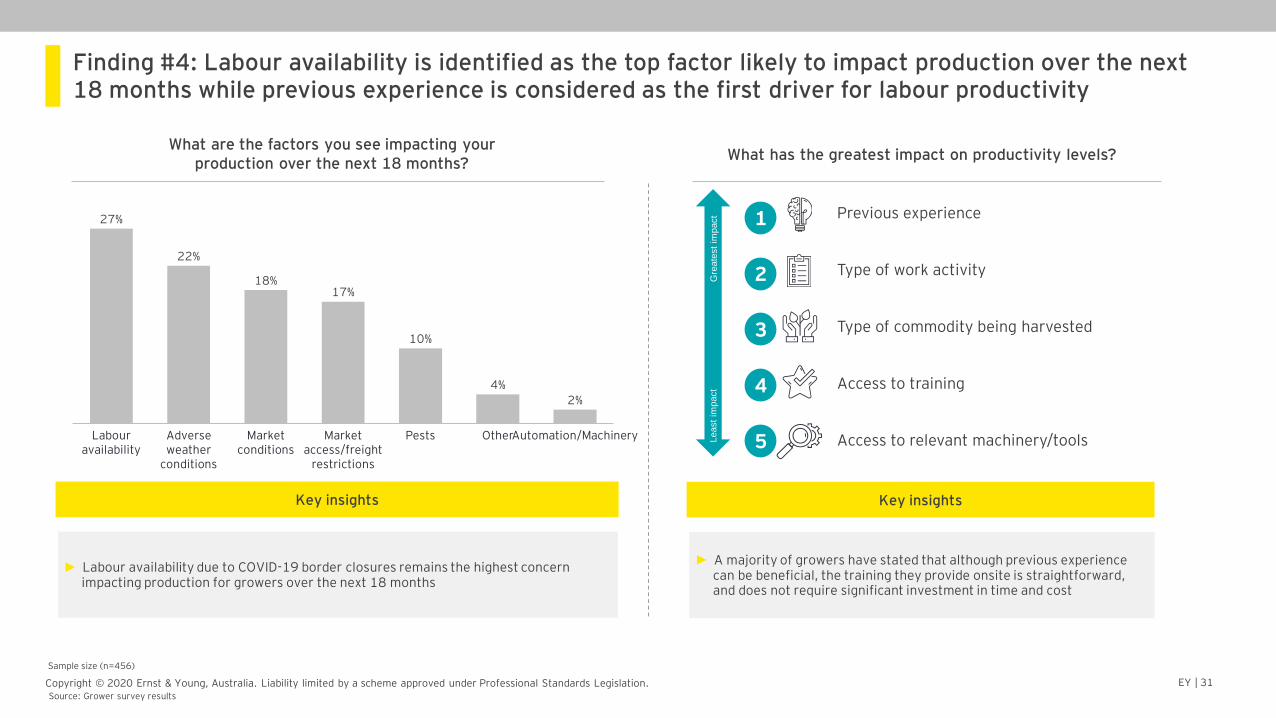
Finding #4: Labour availability is identified as the top factor likely to impact production over the next 18 months while previous experience is considered as the first driver for labour productivity
PestsAdverse weather
conditions
Labour availability
Market access/freight
restrictions
Market conditions
OtherAutomation/Machinery
27%
22%
18%17%
10%
4%
2%
What are the factors you see impacting your production over the next 18 months?
► Labour availability due to COVID-19 border closures remains the highest concern impacting production for growers over the next 18 months
Key insights
Sample size (n=456)
What has the greatest impact on productivity levels?
► A majority of growers have stated that although previous experience can be beneficial, the training they provide onsite is straightforward, and does not require significant investment in time and cost
Key insights
Previous experience
Type of work activity
Type of commodity being harvested
Access to training
Access to relevant machinery/tools
Gre
ate
st
impact
Least
impact
1
2
3
4
5
Source: Grower survey results
EY | 32Copyright © 2020 Ernst & Young, Australia. Liability limited by a scheme approved under Professional Standards Legislation.
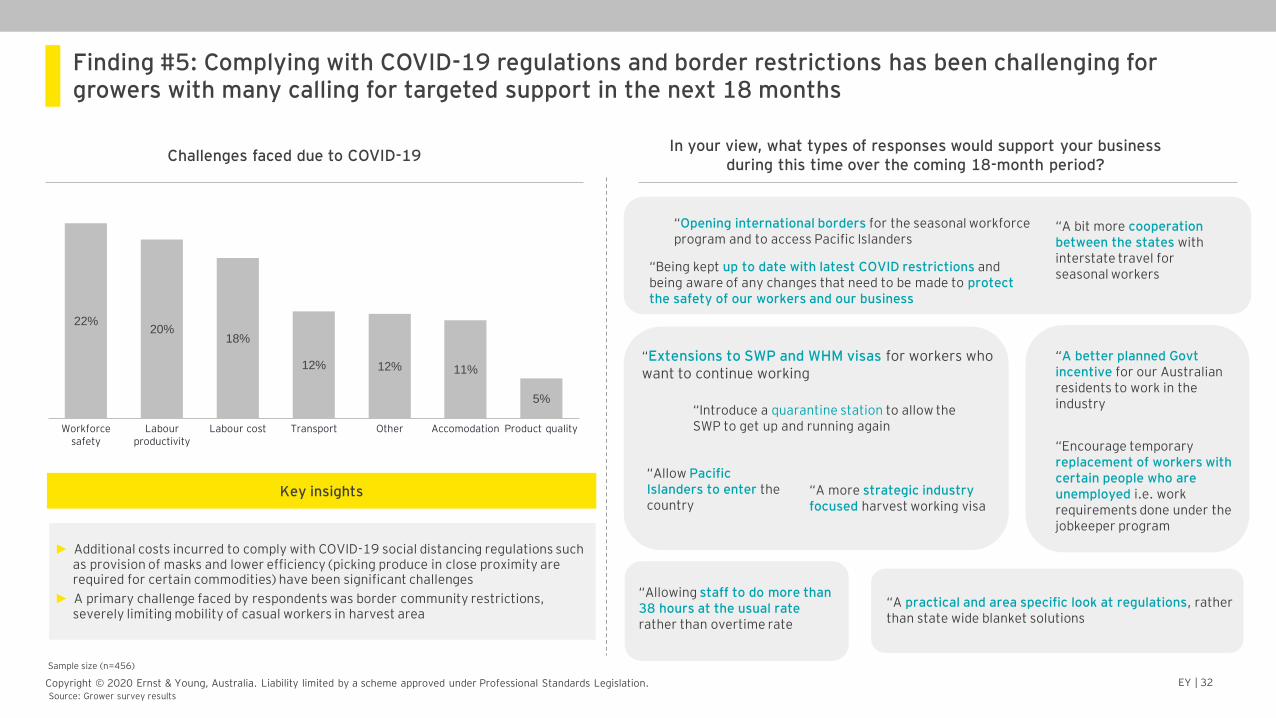
Finding #5: Complying with COVID-19 regulations and border restrictions has been challenging for growers with many calling for targeted support in the next 18 months
Challenges faced due to COVID-19 In your view, what types of responses would support your business
during this time over the coming 18-month period?
“Opening international borders for the seasonal workforce program and to access Pacific Islanders
“A better planned Govt incentive for our Australian residents to work in the industry
“Being kept up to date with latest COVID restrictions and being aware of any changes that need to be made to protect the safety of our workers and our business
“Allowing staff to do more than 38 hours at the usual raterather than overtime rate
“A practical and area specific look at regulations, rather than state wide blanket solutions
“Introduce a quarantine station to allow the SWP to get up and running again
“Extensions to SWP and WHM visas for workers who want to continue working
Sample size (n=456)
Product qualityTransportLabour productivity
Workforce safety
Labour cost Other Accomodation
22%20%
18%
12% 12% 11%
5%
► Additional costs incurred to comply with COVID-19 social distancing regulations such as provision of masks and lower efficiency (picking produce in close proximity are required for certain commodities) have been significant challenges
► A primary challenge faced by respondents was border community restrictions, severely limiting mobility of casual workers in harvest area
Key insights
“Allow Pacific Islanders to enter the country
“Encourage temporary replacement of workers with certain people who are unemployed i.e. work requirements done under the jobkeeper program
“A bit more cooperation between the states with interstate travel for seasonal workers
“A more strategic industry focused harvest working visa
Source: Grower survey results
EY | 33Copyright © 2020 Ernst & Young, Australia. Liability limited by a scheme approved under Professional Standards Legislation.
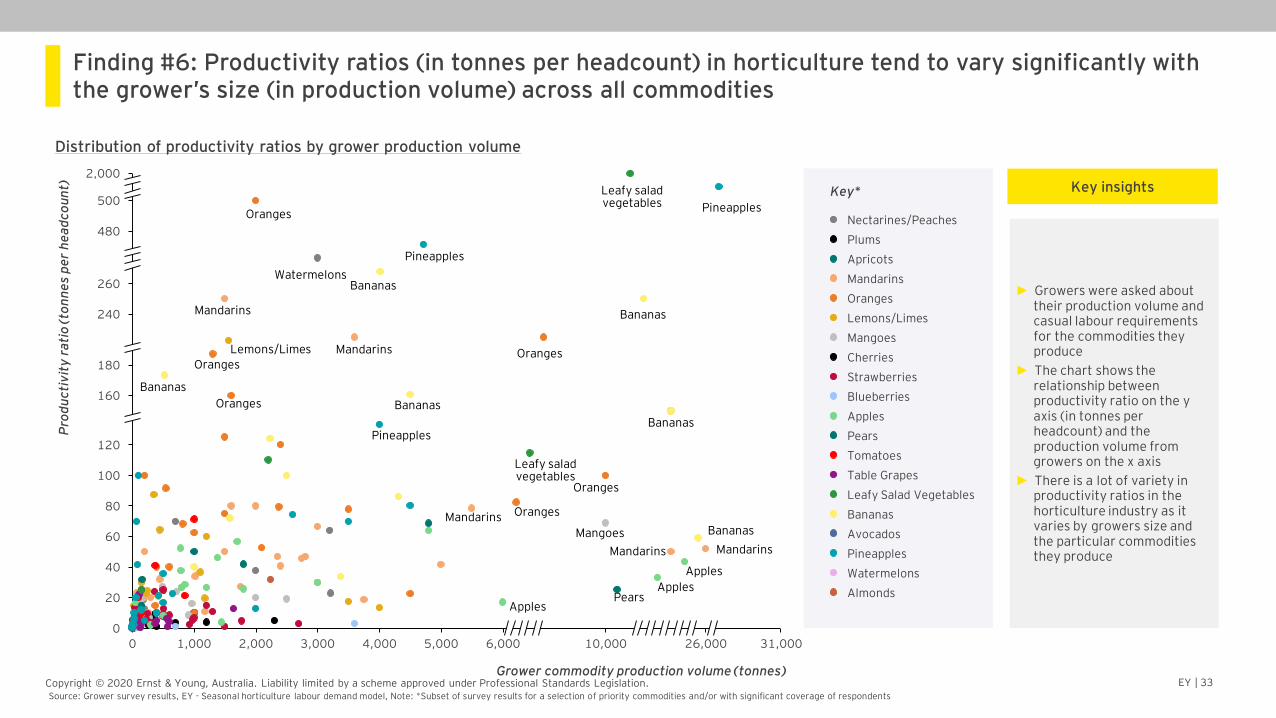
Finding #6: Productivity ratios (in tonnes per headcount) in horticulture tend to vary significantly with the grower’s size (in production volume) across all commodities
1,000 4,000
2,000
6,000 26,0005,0003,0000 31,00010,0002,0000
40
20
60
80
120
160
180
240
260
480
100
500
Cherries
Oranges
Avocados
Strawberries
Nectarines/Peaches
Plums
Apricots
Pears
Pineapples
Apples
Tomatoes
Table Grapes
Leafy Salad Vegetables
Mandarins
Bananas
Blueberries
Lemons/Limes
Watermelons
Mangoes
Almonds
Source: Grower survey results, EY - Seasonal horticulture labour demand model, Note: *Subset of survey results for a selection of priority commodities and/or with significant coverage of respondents
Distribution of productivity ratios by grower production volume
Grower commodity production volume (tonnes)
Pro
du
cti
vit
y r
ati
o (
ton
ne
s p
er
he
ad
co
un
t) Key*Leafy salad vegetables Pineapples
Bananas
Oranges
Bananas
Pineapples
Oranges
WatermelonsBananas
Leafy salad vegetables
Bananas
Mandarins
Mandarins
Oranges
MandarinsMandarins
Mangoes Bananas
Apples
ApplesPears
Apples
Oranges
Oranges
Oranges
Lemons/Limes
Bananas
Pineapples
Mandarins
► Growers were asked about their production volume and casual labour requirements for the commodities they produce
► The chart shows the relationship between productivity ratio on the y axis (in tonnes per headcount) and the production volume from growers on the x axis
► There is a lot of variety in productivity ratios in the horticulture industry as it varies by growers size and the particular commodities they produce
Key insights
EY | 34Copyright © 2020 Ernst & Young, Australia. Liability limited by a scheme approved under Professional Standards Legislation.
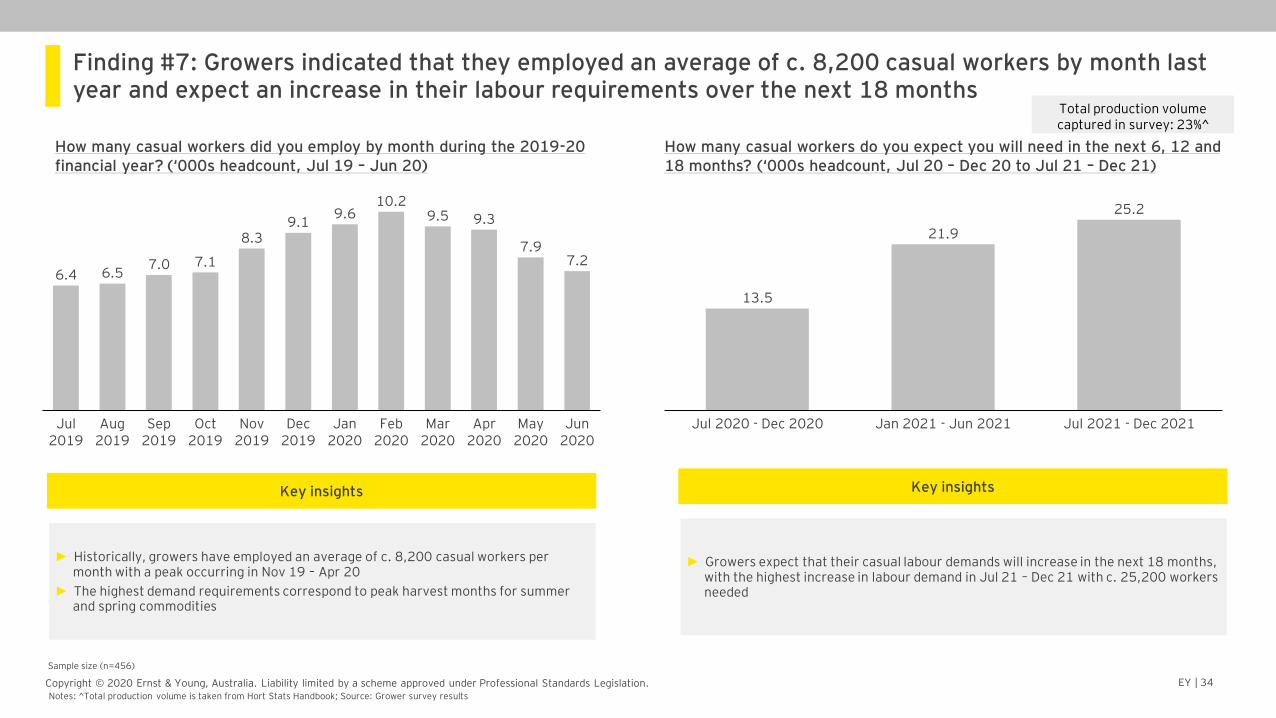
Finding #7: Growers indicated that they employed an average of c. 8,200 casual workers by month last year and expect an increase in their labour requirements over the next 18 months
How many casual workers did you employ by month during the 2019-20 financial year? (‘000s headcount, Jul 19 – Jun 20)
How many casual workers do you expect you will need in the next 6, 12 and 18 months? (‘000s headcount, Jul 20 – Dec 20 to Jul 21 – Dec 21)
Sep 2019
7.2
Jul 2019
Feb 2020
Aug 2019
9.6
Dec 2019
Oct 2019
Nov 2019
Jan 2020
Mar 2020
Apr 2020
May 2020
Jun 2020
9.5
6.4 6.57.0 7.1
8.39.1
10.2
9.3
7.9
25.2
Jul 2020 - Dec 2020 Jul 2021 - Dec 2021Jan 2021 - Jun 2021
13.5
21.9
Sample size (n=456)
Notes: ^Total production volume is taken from Hort Stats Handbook; Source: Grower survey results
► Historically, growers have employed an average of c. 8,200 casual workers per month with a peak occurring in Nov 19 – Apr 20
► The highest demand requirements correspond to peak harvest months for summer and spring commodities
Key insights
► Growers expect that their casual labour demands will increase in the next 18 months, with the highest increase in labour demand in Jul 21 – Dec 21 with c. 25,200 workers needed
Key insights
Total production volume captured in survey: 23%^
EY | 35Copyright © 2020 Ernst & Young, Australia. Liability limited by a scheme approved under Professional Standards Legislation.
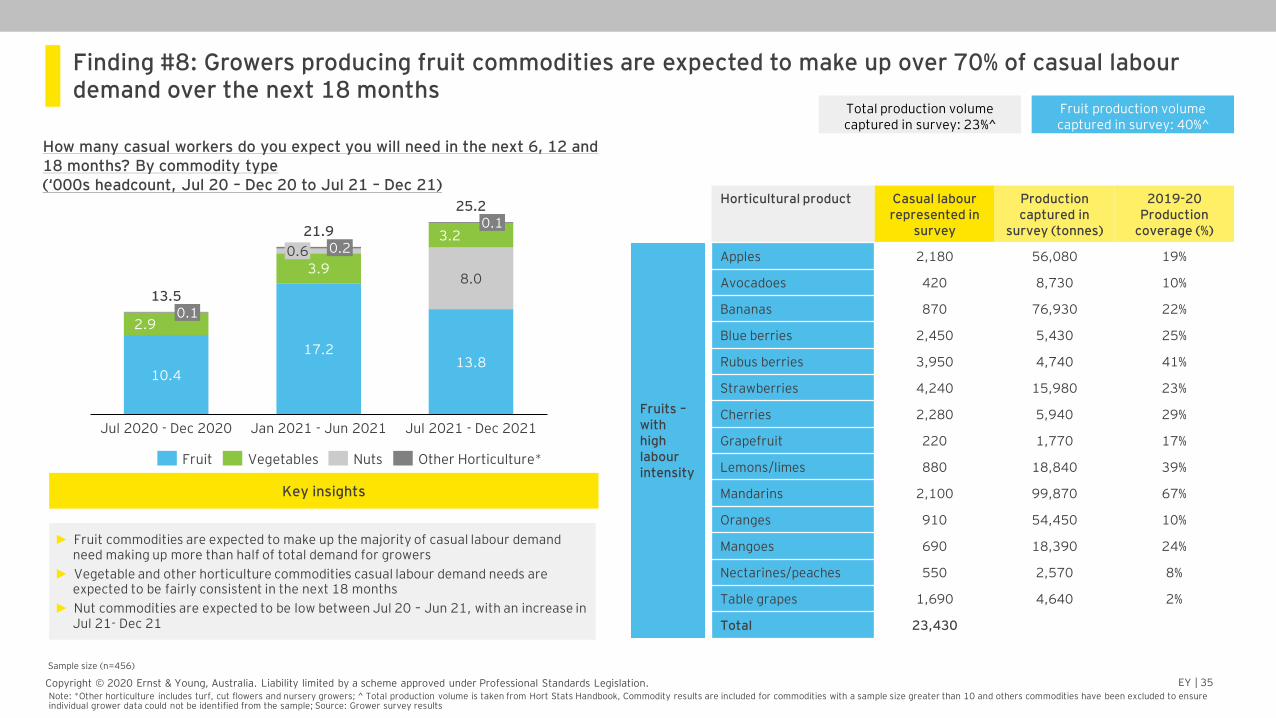
Finding #8: Growers producing fruit commodities are expected to make up over 70% of casual labour demand over the next 18 months
How many casual workers do you expect you will need in the next 6, 12 and 18 months? By commodity type(‘000s headcount, Jul 20 – Dec 20 to Jul 21 – Dec 21)
25.2
Jul 2020 - Dec 2020
10.4
8.0
2.90.1
3.20.2
3.9
17.2
0.6
Jan 2021 - Jun 2021
13.8
0.1
13.5
Jul 2021 - Dec 2021
21.9
Fruit Vegetables Nuts Other Horticulture*
Sample size (n=456)
► Fruit commodities are expected to make up the majority of casual labour demand need making up more than half of total demand for growers
► Vegetable and other horticulture commodities casual labour demand needs are expected to be fairly consistent in the next 18 months
► Nut commodities are expected to be low between Jul 20 – Jun 21, with an increase in Jul 21- Dec 21
Key insights
Horticultural product Casual labour represented in
survey
Production captured in
survey (tonnes)
2019-20 Production
coverage (%)
Apples 2,180 56,080 19%
Avocadoes 420 8,730 10%
Bananas 870 76,930 22%
Blue berries 2,450 5,430 25%
Rubus berries 3,950 4,740 41%
Strawberries 4,240 15,980 23%
Cherries 2,280 5,940 29%
Grapefruit 220 1,770 17%
Lemons/limes 880 18,840 39%
Mandarins 2,100 99,870 67%
Oranges 910 54,450 10%
Mangoes 690 18,390 24%
Nectarines/peaches 550 2,570 8%
Table grapes 1,690 4,640 2%
Total 23,430
Fruits –with high labour intensity
Fruit production volume captured in survey: 40%^
Total production volume captured in survey: 23%^
Note: *Other horticulture includes turf, cut flowers and nursery growers; ^ Total production volume is taken from Hort Stats Handbook, Commodity results are included for commodities with a sample size greater than 10 and others commodities have been excluded to ensure individual grower data could not be identified from the sample; Source: Grower survey results
EY | 36Copyright © 2020 Ernst & Young, Australia. Liability limited by a scheme approved under Professional Standards Legislation.
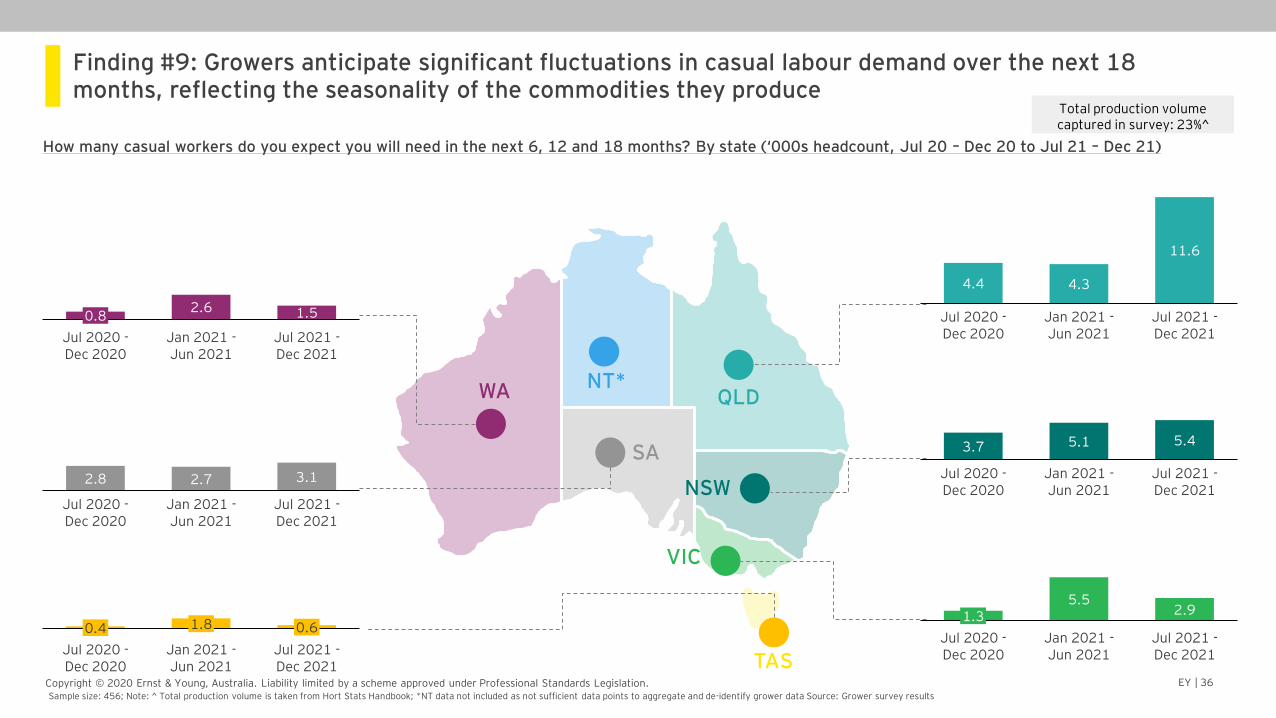
Finding #9: Growers anticipate significant fluctuations in casual labour demand over the next 18 months, reflecting the seasonality of the commodities they produce
How many casual workers do you expect you will need in the next 6, 12 and 18 months? By state (‘000s headcount, Jul 20 – Dec 20 to Jul 21 – Dec 21)
NT*QLD
NSW
VIC
TAS
WA
SA5.13.7
Jul 2020 -Dec 2020
5.4
Jan 2021 -Jun 2021
Jul 2021 -Dec 2021
Jul 2020 -Dec 2020
1.35.5
Jul 2021 -Dec 2021
2.9
Jan 2021 -Jun 2021
11.6
4.34.4
Jan 2021 -Jun 2021
Jul 2020 -Dec 2020
Jul 2021 -Dec 2021
0.60.4
Jul 2020 -Dec 2020
1.8
Jul 2021 -Dec 2021
Jan 2021 -Jun 2021
Jan 2021 -Jun 2021
2.72.8
Jul 2020 -Dec 2020
Jul 2021 -Dec 2021
3.1
Jul 2021 -Dec 2021
0.8
Jul 2020 -Dec 2020
2.6
Jan 2021 -Jun 2021
1.5
Sample size: 456; Note: ^ Total production volume is taken from Hort Stats Handbook; *NT data not included as not sufficient data points to aggregate and de-identify grower data Source: Grower survey results
Total production volume captured in survey: 23%^
Horticulture labour demand
EY | 38Copyright © 2020 Ernst & Young, Australia. Liability limited by a scheme approved under Professional Standards Legislation.
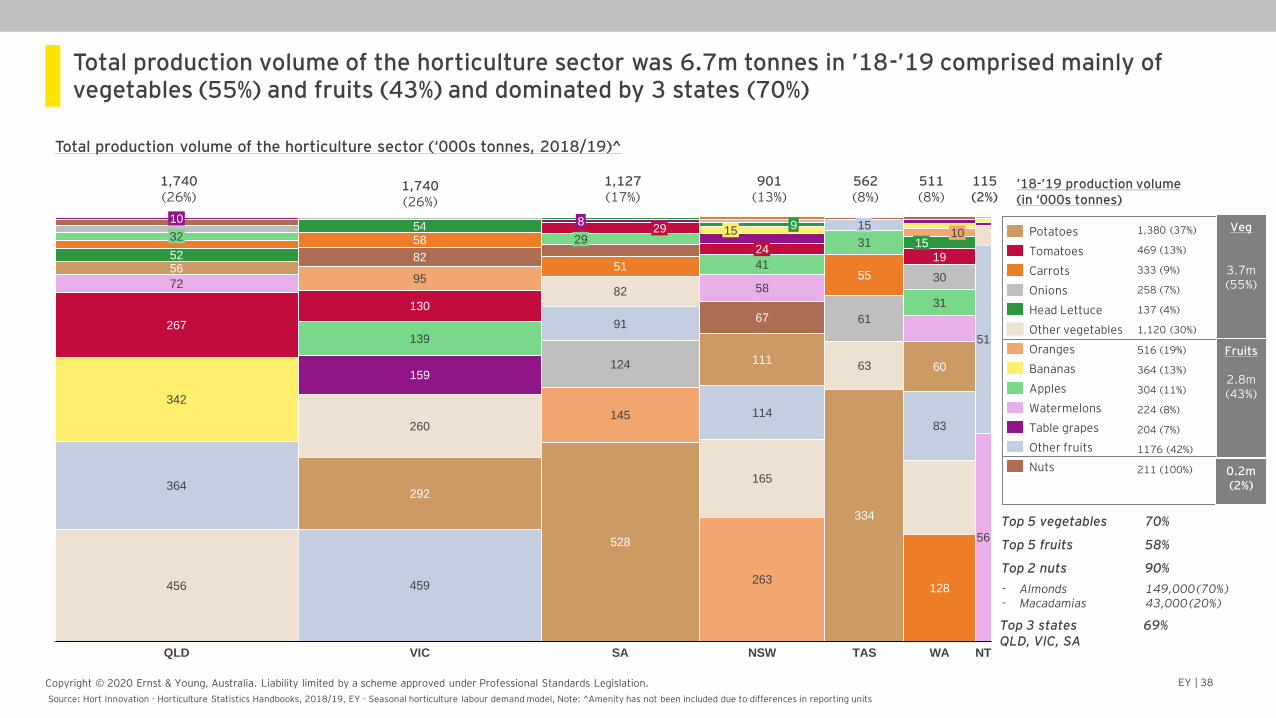
Total production volume of the horticulture sector was 6.7m tonnes in ’18-’19 comprised mainly of vegetables (55%) and fruits (43%) and dominated by 3 states (70%)
Total production volume of the horticulture sector (‘000s tonnes, 2018/19)^
82
459
9
165
8
263
139
15
VIC
41
130
292
58
QLD
58
114
95
364
67
NSW
124
334
10
5572
56
342
63
456
31
WA
19
15
TAS
52
60
54
267
128
32
30
83260
82
SA
31
51
111
29
61
24
56
1029
91
145
51
NT
15
528
159
Head Lettuce
Potatoes
Oranges
Tomatoes
Carrots
Onions
Apples
Other vegetables
Bananas
Watermelons
Table grapes
Other fruits
Nuts
901 (13%)
1,740 (26%)
1,740 (26%)
511 (8%)
1,127 (17%)
562 (8%)
115(2%)
1,380 (37%)
469 (13%)
333 (9%)
258 (7%)
137 (4%)
1,120 (30%)
516 (19%)
364 (13%)
304 (11%)
224 (8%)
204 (7%)
1176 (42%)
211 (100%)
Veg
3.7m (55%)
Fruits
2.8m (43%)
0.2m (2%)
Source: Hort Innovation - Horticulture Statistics Handbooks, 2018/19, EY - Seasonal horticulture labour demand model, Note: ^Amenity has not been included due to differences in reporting units
Top 5 vegetables 70%
Top 5 fruits 58%
Top 2 nuts 90%
Top 3 states 69%QLD, VIC, SA
’18-’19 production volume (in ‘000s tonnes)
- Almonds 149,000 (70%)- Macadamias 43,000 (20%)
EY | 39Copyright © 2020 Ernst & Young, Australia. Liability limited by a scheme approved under Professional Standards Legislation.
Note: * Does not include ‘amenity’ horticulture due to differences in measurement for these commodities Source: 1 Hort Innovation, Horticulture Statistics Handbook 2018/19, EY analysis
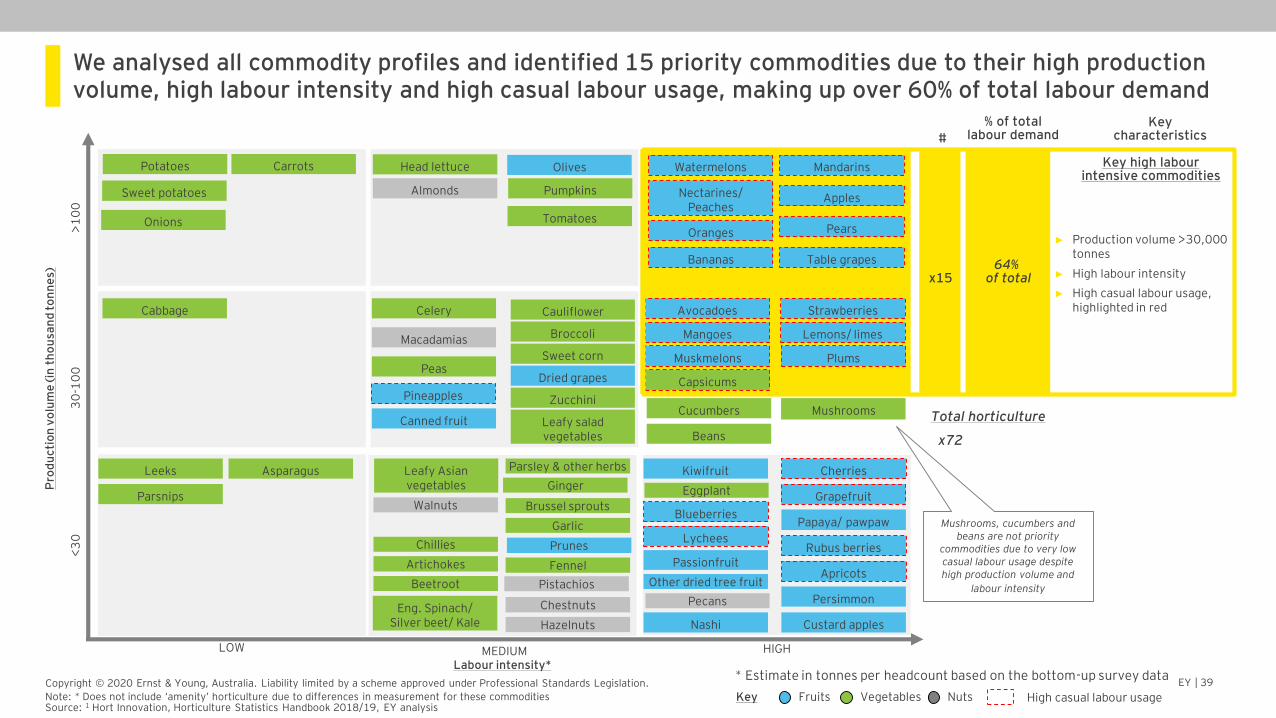
We analysed all commodity profiles and identified 15 priority commodities due to their high production volume, high labour intensity and high casual labour usage, making up over 60% of total labour demand
High casual labour usageFruits Vegetables NutsKey
Pro
du
cti
on
vo
lum
e (in
th
ou
san
d t
on
ne
s)
<3
0
Labour intensity*
LOW MEDIUM HIGH
30
-10
0>
10
0
Potatoes
Oranges
Bananas
Carrots
Apples
Onions
Watermelons
Table grapes
Mandarins
Almonds
Head lettuce Olives
Nectarines/ Peaches
Pumpkins
Pears
Sweet potatoes
Cucumbers
AvocadoesCabbage
Capsicums
Strawberries
Broccoli
Cauliflower
Mangoes
Mushrooms
Sweet corn
Pineapples
Dried grapes
Zucchini
Leafy salad vegetables
Muskmelons
Celery
Canned fruit
Lemons/ limesMacadamias
Beans
PeasPlums
Leafy Asian vegetables
Cherries
BlueberriesPapaya/ pawpaw
Beetroot
WalnutsGrapefruit
Leeks Parsley & other herbsAsparagus
Eggplant
Rubus berries
Apricots
Kiwifruit
Eng. Spinach/ Silver beet/ Kale
Ginger
Prunes
Brussel sprouts
Passionfruit
Parsnips
Pecans
GarlicLychees
Persimmon
Chillies
Pistachios
Custard apples
FennelArtichokes
Other dried tree fruit
Nashi
Chestnuts
Hazelnuts
Key high labour intensive commodities
x1564%
of total
#
% of total labour demand
Key characteristics
x72
Total horticulture
► Production volume >30,000 tonnes
► High labour intensity
► High casual labour usage, highlighted in red
Mushrooms, cucumbers and beans are not priority
commodities due to very low casual labour usage despite high production volume and
labour intensity
Tomatoes
* Estimate in tonnes per headcount based on the bottom-up survey data
EY | 40Copyright © 2020 Ernst & Young, Australia. Liability limited by a scheme approved under Professional Standards Legislation.
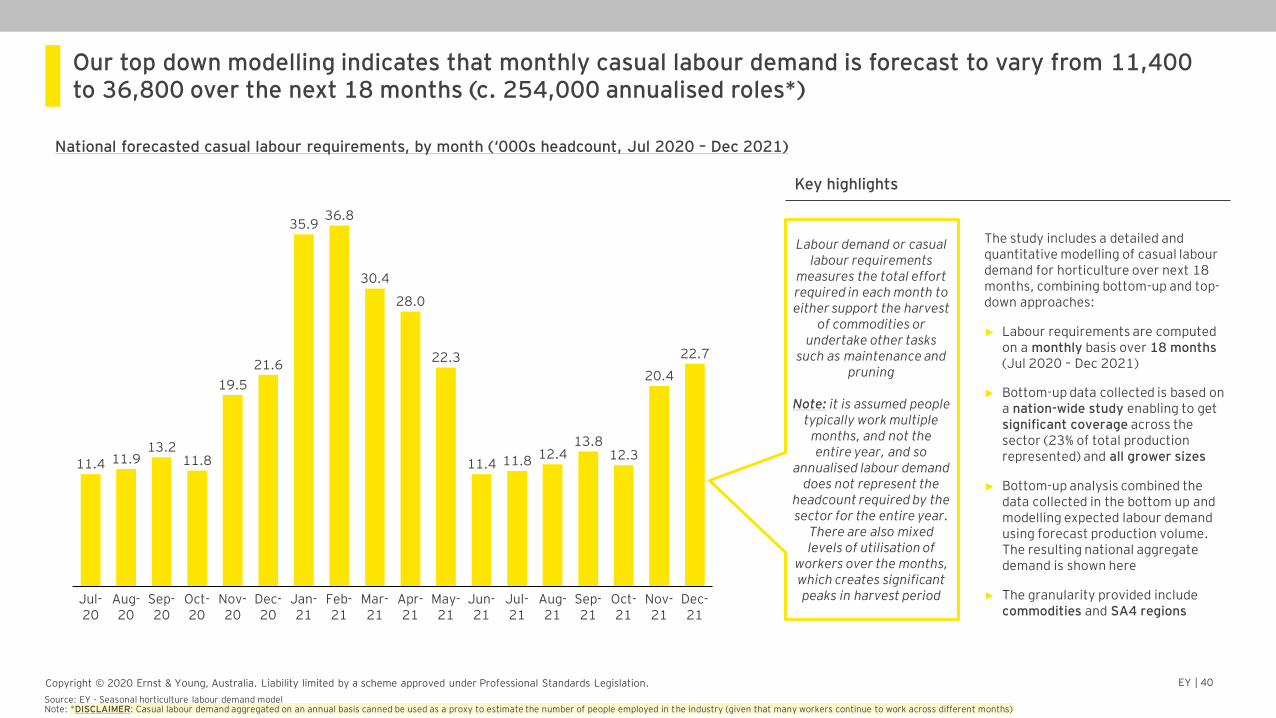
Our top down modelling indicates that monthly casual labour demand is forecast to vary from 11,400 to 36,800 over the next 18 months (c. 254,000 annualised roles*)
Aug-20
Nov-20
Sep-20
12.3
Dec-21
Oct-20
Feb-21
21.6
Jan-21
Dec-20
13.2
Mar-21
Apr-21
May-21
Jun-21
Jul-21
Aug-21
Jul-20
Sep-21
Oct-21
35.9
Nov-21
11.411.4 11.9 11.8 11.8
19.5
36.8
30.4
28.0
22.3
12.4
20.4
22.7
13.8
National forecasted casual labour requirements, by month (‘000s headcount, Jul 2020 – Dec 2021)
Key highlights
The study includes a detailed and quantitative modelling of casual labour demand for horticulture over next 18 months, combining bottom-up and top-down approaches:
► Labour requirements are computed on a monthly basis over 18 months (Jul 2020 – Dec 2021)
► Bottom-up data collected is based on a nation-wide study enabling to get significant coverage across the sector (23% of total production represented) and all grower sizes
► Bottom-up analysis combined the data collected in the bottom up and modelling expected labour demand using forecast production volume. The resulting national aggregate demand is shown here
► The granularity provided include commodities and SA4 regions
Labour demand or casual labour requirements
measures the total effort required in each month to either support the harvest
of commodities or undertake other tasks
such as maintenance and pruning
Note: it is assumed people typically work multiple
months, and not the entire year, and so
annualised labour demand does not represent the
headcount required by the sector for the entire year.
There are also mixed levels of utilisation of
workers over the months, which creates significant peaks in harvest period
Source: EY - Seasonal horticulture labour demand modelNote: *DISCLAIMER: Casual labour demand aggregated on an annual basis canned be used as a proxy to estimate the number of people employed in the industry (given that many workers continue to work across different months)
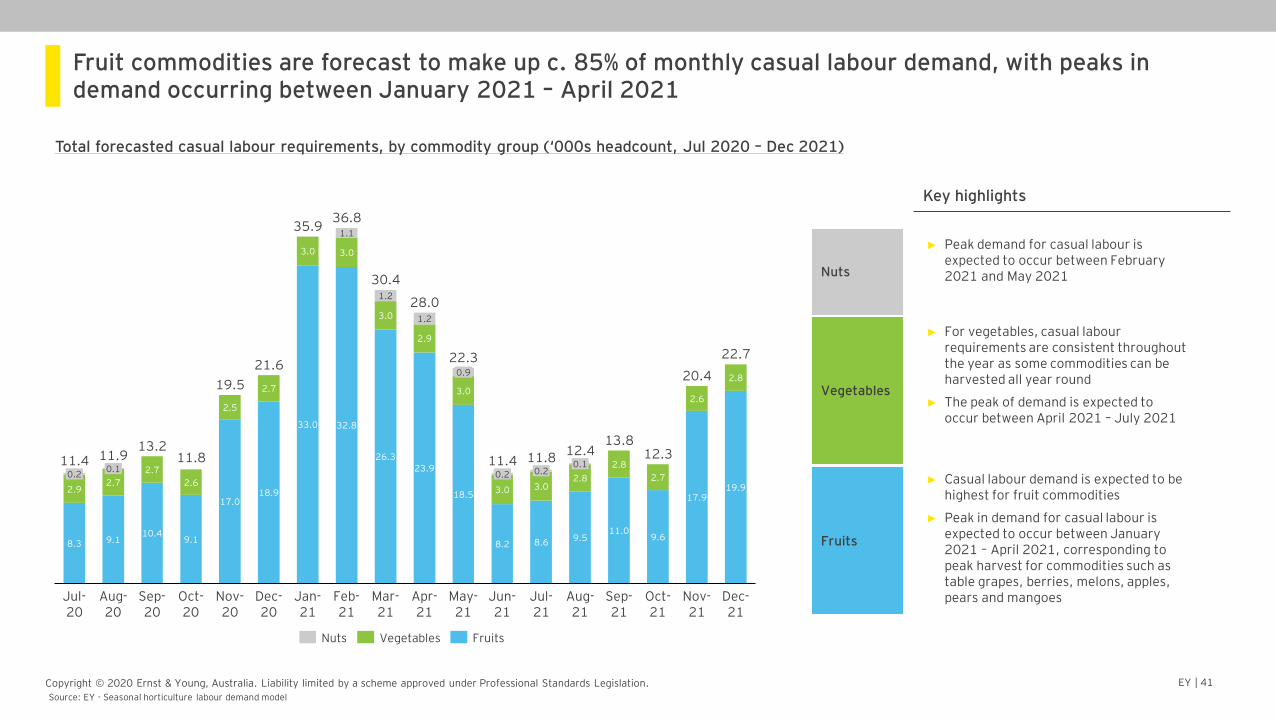
EY | 41Copyright © 2020 Ernst & Young, Australia. Liability limited by a scheme approved under Professional Standards Legislation.
Fruit commodities are forecast to make up c. 85% of monthly casual labour demand, with peaks in demand occurring between January 2021 – April 2021
Total forecasted casual labour requirements, by commodity group (‘000s headcount, Jul 2020 – Dec 2021)
0.1
Jul-20
Dec-21
2.9
Aug-21
9.5
3.0
8.3
2.5
Aug-20
32.8
0.2
Apr-21
9.1
Oct-21
2.7
10.4
2.7
2.6
23.9
Sep-20
9.1
0.22.6
May-21
Oct-20
17.0
Mar-21
Nov-20
Nov-21
18.9
11.4
2.7
Dec-20
33.0
3.0
19.93.0
Jan-21
Sep-21
3.0
Feb-21
1.1
26.3
2.9
3.0
1.2
1.2
18.5
3.0
0.2
0.9
8.2
2.8
Jun-21
8.6
11.8
2.8
0.1
9.6
Jul-21
2.7
17.9
2.8
11.913.2
11.8
19.5
21.6
35.9
11.0
30.4
28.0
22.3
11.412.4
13.812.3
20.4
22.7
36.8
FruitsNuts Vegetables
Vegetables
Fruits
Nuts
Source: EY - Seasonal horticulture labour demand model
Key highlights
► Peak demand for casual labour is expected to occur between February 2021 and May 2021
► For vegetables, casual labour requirements are consistent throughout the year as some commodities can be harvested all year round
► The peak of demand is expected to occur between April 2021 – July 2021
► Casual labour demand is expected to be highest for fruit commodities
► Peak in demand for casual labour is expected to occur between January 2021 – April 2021, corresponding to peak harvest for commodities such as table grapes, berries, melons, apples, pears and mangoes
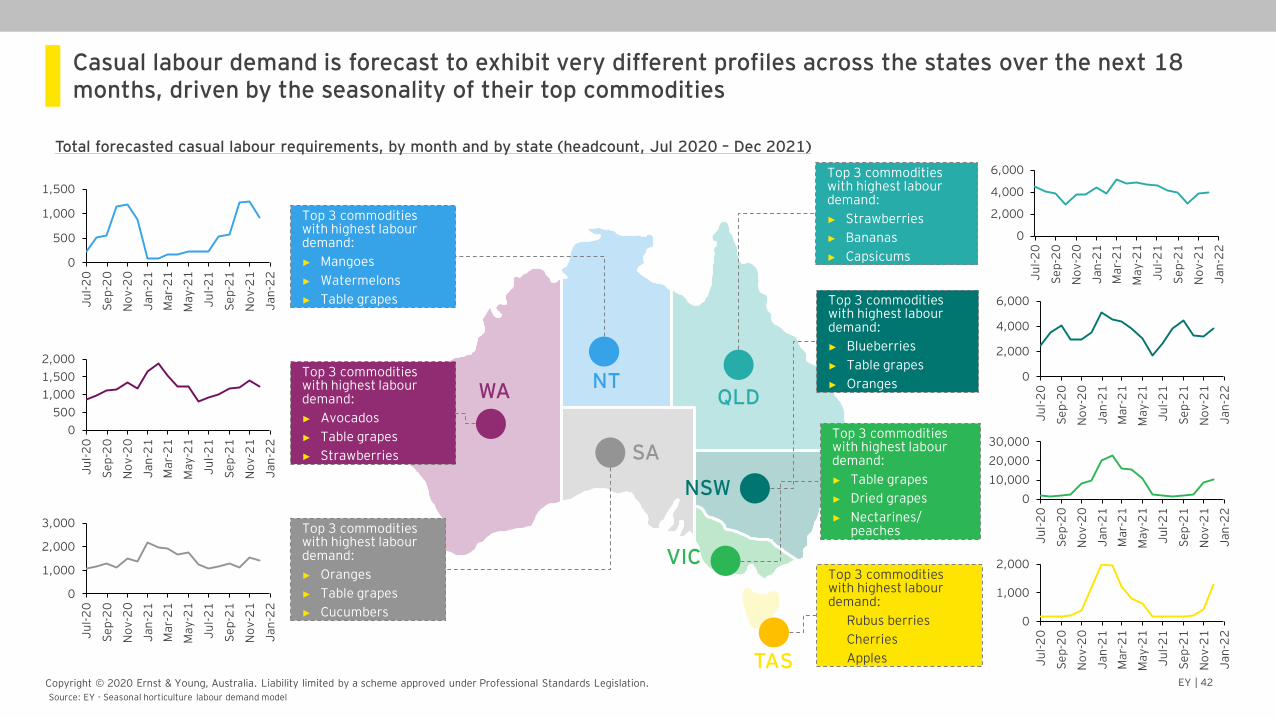
EY | 42Copyright © 2020 Ernst & Young, Australia. Liability limited by a scheme approved under Professional Standards Legislation.
Casual labour demand is forecast to exhibit very different profiles across the states over the next 18 months, driven by the seasonality of their top commodities
Total forecasted casual labour requirements, by month and by state (headcount, Jul 2020 – Dec 2021)
NTTop 3 commodities with highest labour demand:
► Mangoes
► Watermelons
► Table grapes
WA
Top 3 commodities with highest labour demand:
► Avocados
► Table grapes
► Strawberries
Top 3 commodities with highest labour demand:
► Oranges
► Table grapes
► Cucumbers
SA
QLD
Top 3 commodities with highest labour demand:
► Strawberries
► Bananas
► Capsicums
NSWTop 3 commodities with highest labour demand:
► Blueberries
► Table grapes
► Oranges
VIC
Top 3 commodities with highest labour demand:
► Table grapes
► Dried grapes
► Nectarines/peaches
TAS
Top 3 commodities with highest labour demand:
► Rubus berries
► Cherries
► Apples
0
500
1,000
1,500
Ja
n-2
1
Ju
l-2
0
Se
p-2
0
No
v-2
0
Ma
r-2
1
Ma
y-2
1
Ju
l-2
1
Se
p-2
1
No
v-2
1
Ja
n-2
2
0
500
1,000
1,500
2,000
Ju
l-2
0
Ma
r-2
1
Ja
n-2
1
Se
p-2
0
No
v-2
0
Ma
y-2
1
Ju
l-2
1
Se
p-2
1
No
v-2
1
Ja
n-2
2
0
1,000
2,000
3,000
Se
p-2
0
Ja
n-2
1
Ju
l-2
0
No
v-2
0
Ma
r-2
1
Ma
y-2
1
Ju
l-2
1
Se
p-2
1
No
v-2
1
Ja
n-2
2
0
2,000
4,000
6,000
Se
p-2
0
No
v-2
0
Ju
l-2
0
Ja
n-2
1
Ma
r-2
1
Ma
y-2
1
Ju
l-2
1
Se
p-2
1
No
v-2
1
Ja
n-2
2
0
2,000
4,000
6,000
Se
p-2
0
Ju
l-2
0
No
v-2
1
No
v-2
0
Ja
n-2
1
Ma
r-2
1
Ma
y-2
1
Ju
l-2
1
Se
p-2
1
Ja
n-2
2
0
10,000
20,000
30,000
Se
p-2
1
No
v-2
1
Ju
l-2
0
Se
p-2
0
No
v-2
0
Ja
n-2
1
Ma
r-2
1
Ju
l-2
1
Ma
y-2
1
Ja
n-2
2
0
1,000
2,000
Ju
l-2
0
No
v-2
0
Ja
n-2
1
Se
p-2
0
Ma
r-2
1
Ma
y-2
1
Ju
l-2
1
Se
p-2
1
No
v-2
1
Ja
n-2
2
NTQLD
NSW
VIC
TAS
WA
SA
Source: EY - Seasonal horticulture labour demand model
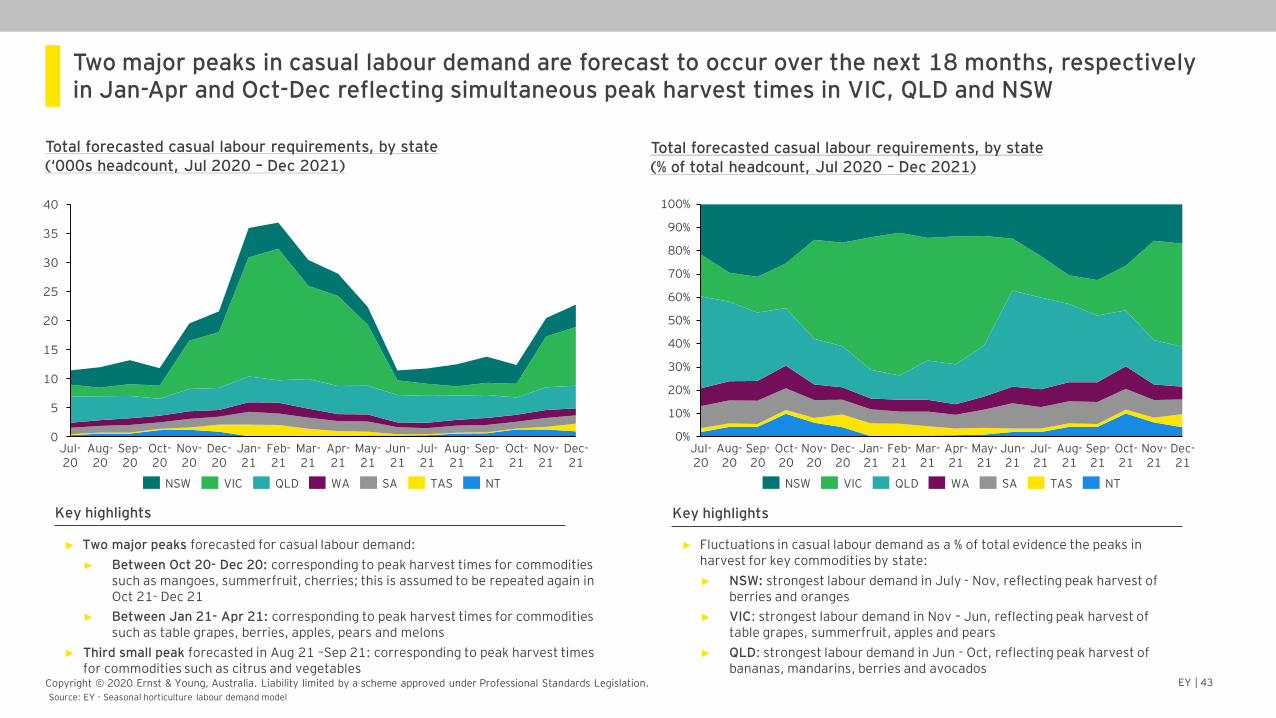
EY | 43Copyright © 2020 Ernst & Young, Australia. Liability limited by a scheme approved under Professional Standards Legislation.
Two major peaks in casual labour demand are forecast to occur over the next 18 months, respectively in Jan-Apr and Oct-Dec reflecting simultaneous peak harvest times in VIC, QLD and NSW
Total forecasted casual labour requirements, by state (‘000s headcount, Jul 2020 – Dec 2021)
Key highlights
► Two major peaks forecasted for casual labour demand:
► Between Oct 20- Dec 20: corresponding to peak harvest times for commodities such as mangoes, summerfruit, cherries; this is assumed to be repeated again in Oct 21- Dec 21
► Between Jan 21- Apr 21: corresponding to peak harvest times for commodities such as table grapes, berries, apples, pears and melons
► Third small peak forecasted in Aug 21 –Sep 21: corresponding to peak harvest times for commodities such as citrus and vegetables
Total forecasted casual labour requirements, by state (% of total headcount, Jul 2020 – Dec 2021)
25
0
35
20
5
15
10
30
40
Jun-21
Dec-20
Jul-20
Aug-20
Sep-20
Oct-20
Nov-20
Jan-21
Feb-21
Mar-21
Apr-21
May-21
Jul-21
Aug-21
Sep-21
Oct-21
Nov-21
Dec-21
VICNSW SAWAQLD TAS NT
Key highlights
► Fluctuations in casual labour demand as a % of total evidence the peaks in harvest for key commodities by state:
► NSW: strongest labour demand in July - Nov, reflecting peak harvest of berries and oranges
► VIC: strongest labour demand in Nov – Jun, reflecting peak harvest of table grapes, summerfruit, apples and pears
► QLD: strongest labour demand in Jun - Oct, reflecting peak harvest of bananas, mandarins, berries and avocados
0%
10%
20%
30%
40%
50%
60%
70%
80%
90%
100%
Nov-21
Dec-21
Dec-20
Jul-20
Sep-20
Aug-20
Nov-20
Oct-20
Jan-21
Feb-21
Mar-21
Apr-21
May-21
Jun-21
Oct-21
Aug-21
Jul-21
Sep-21
VICNSW QLD WA SA TAS NT
Source: EY - Seasonal horticulture labour demand model
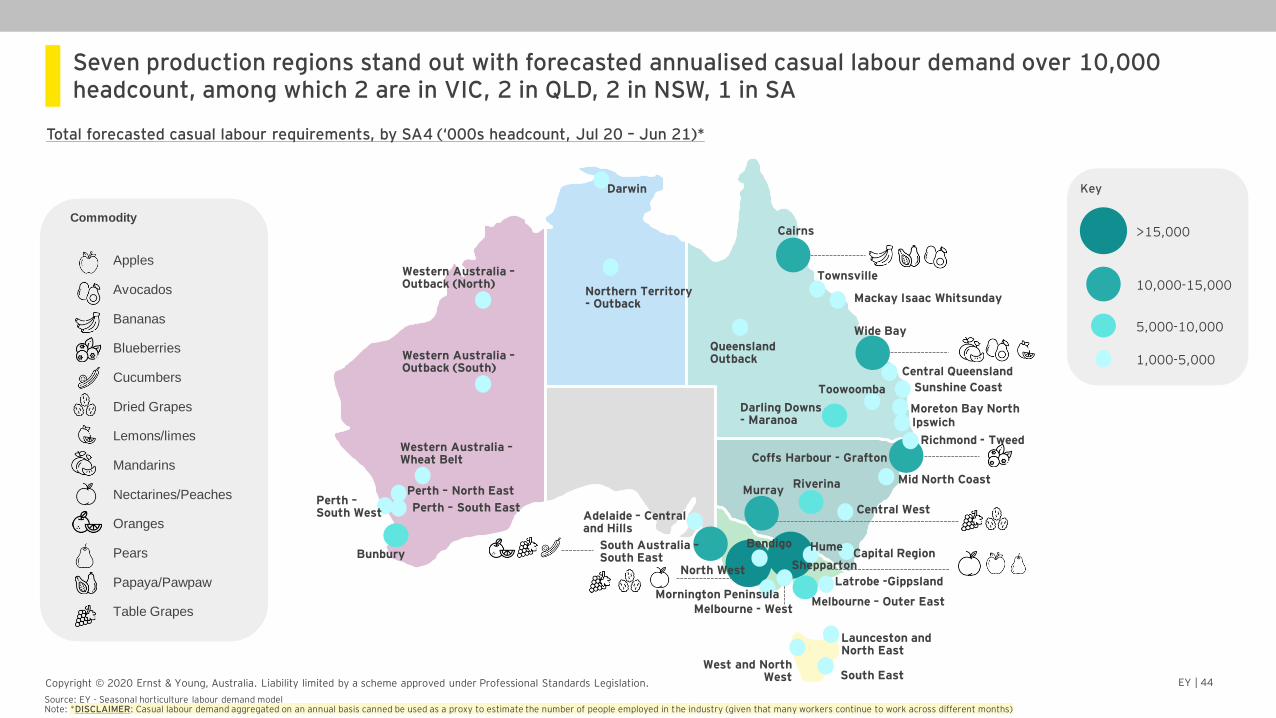
EY | 44Copyright © 2020 Ernst & Young, Australia. Liability limited by a scheme approved under Professional Standards Legislation.
Seven production regions stand out with forecasted annualised casual labour demand over 10,000 headcount, among which 2 are in VIC, 2 in QLD, 2 in NSW, 1 in SA
Total forecasted casual labour requirements, by SA4 (‘000s headcount, Jul 20 – Jun 21)*
Riverina
Coffs Harbour - Grafton
Murray
North West
Melbourne – Outer East
Wide Bay
Cairns
Darling Downs - Maranoa
Bunbury
Western Australia –Wheat Belt
Western Australia –Outback (South)
South Australia –South East
Adelaide – Central and Hills
West and North West
Launceston and North East
South East
Darwin
Northern Territory - Outback
Capital Region
Central West
Mid North Coast
Mornington Peninsula
Central Queensland
Ipswich
Mackay Isaac Whitsunday
Bendigo
Moreton Bay North
Queensland Outback
Sunshine CoastToowoomba
Townsville
Perth – South EastPerth –South West
Shepparton
Hume
Latrobe -Gippsland
Source: EY - Seasonal horticulture labour demand modelNote: *DISCLAIMER: Casual labour demand aggregated on an annual basis canned be used as a proxy to estimate the number of people employed in the industry (given that many workers continue to work across different months)
Melbourne - West
Richmond - Tweed
Western Australia –Outback (North)
Perth – North East
Apples
Avocados
Bananas
Blueberries
Cucumbers
Dried Grapes
Lemons/limes
Mandarins
Nectarines/Peaches
Oranges
Pears
Papaya/Pawpaw
Table Grapes
Commodity
>15,000
10,000-15,000
5,000-10,000
1,000-5,000
Key

High-level overview of labour supply & supply gaps
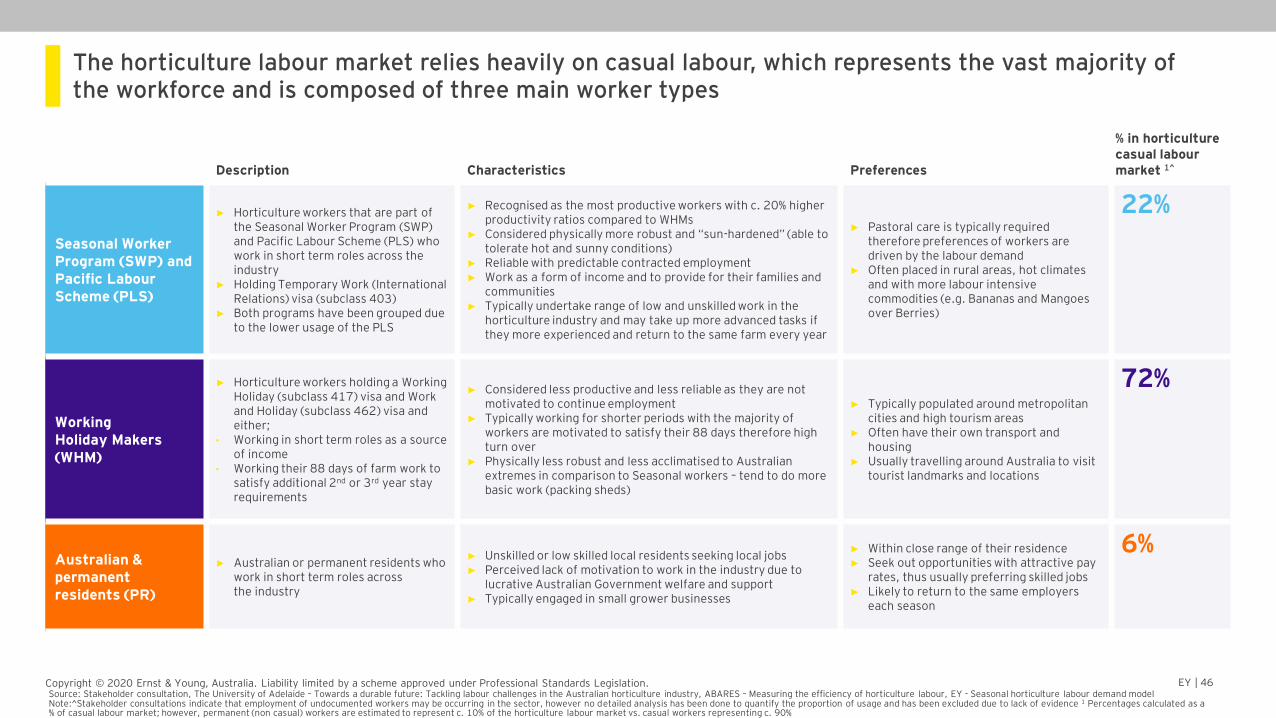
EY | 46Copyright © 2020 Ernst & Young, Australia. Liability limited by a scheme approved under Professional Standards Legislation.
The horticulture labour market relies heavily on casual labour, which represents the vast majority of the workforce and is composed of three main worker types
Description Characteristics Preferences
% in horticulture casual labour market 1^
Seasonal Worker Program (SWP) and Pacific Labour Scheme (PLS)
► Horticulture workers that are part of the Seasonal Worker Program (SWP) and Pacific Labour Scheme (PLS) who work in short term roles across the industry
► Holding Temporary Work (International Relations) visa (subclass 403)
► Both programs have been grouped due to the lower usage of the PLS
► Recognised as the most productive workers with c. 20% higher productivity ratios compared to WHMs
► Considered physically more robust and “sun-hardened” (able to tolerate hot and sunny conditions)
► Reliable with predictable contracted employment► Work as a form of income and to provide for their families and
communities ► Typically undertake range of low and unskilled work in the
horticulture industry and may take up more advanced tasks if they more experienced and return to the same farm every year
► Pastoral care is typically required therefore preferences of workers are driven by the labour demand
► Often placed in rural areas, hot climates and with more labour intensive commodities (e.g. Bananas and Mangoes over Berries)
22%
Working Holiday Makers (WHM)
► Horticulture workers holding a Working Holiday (subclass 417) visa and Work and Holiday (subclass 462) visa and either;
• Working in short term roles as a source of income
• Working their 88 days of farm work to satisfy additional 2nd or 3rd year stay requirements
► Considered less productive and less reliable as they are not motivated to continue employment
► Typically working for shorter periods with the majority of workers are motivated to satisfy their 88 days therefore high turn over
► Physically less robust and less acclimatised to Australian extremes in comparison to Seasonal workers – tend to do more basic work (packing sheds)
► Typically populated around metropolitan cities and high tourism areas
► Often have their own transport and housing
► Usually travelling around Australia to visit tourist landmarks and locations
72%
Australian & permanent residents (PR)
► Australian or permanent residents who work in short term roles across the industry
► Unskilled or low skilled local residents seeking local jobs► Perceived lack of motivation to work in the industry due to
lucrative Australian Government welfare and support► Typically engaged in small grower businesses
► Within close range of their residence► Seek out opportunities with attractive pay
rates, thus usually preferring skilled jobs► Likely to return to the same employers
each season
6%
Source: Stakeholder consultation, The University of Adelaide – Towards a durable future: Tackling labour challenges in the Australian horticulture industry, ABARES – Measuring the efficiency of horticulture labour, EY - Seasonal horticulture labour demand modelNote:^Stakeholder consultations indicate that employment of undocumented workers may be occurring in the sector, however no detailed analysis has been done to quantify the proportion of usage and has been excluded due to lack of evidence 1 Percentages calculated as a % of casual labour market; however, permanent (non casual) workers are estimated to represent c. 10% of the horticulture labour market vs. casual workers representing c. 90%
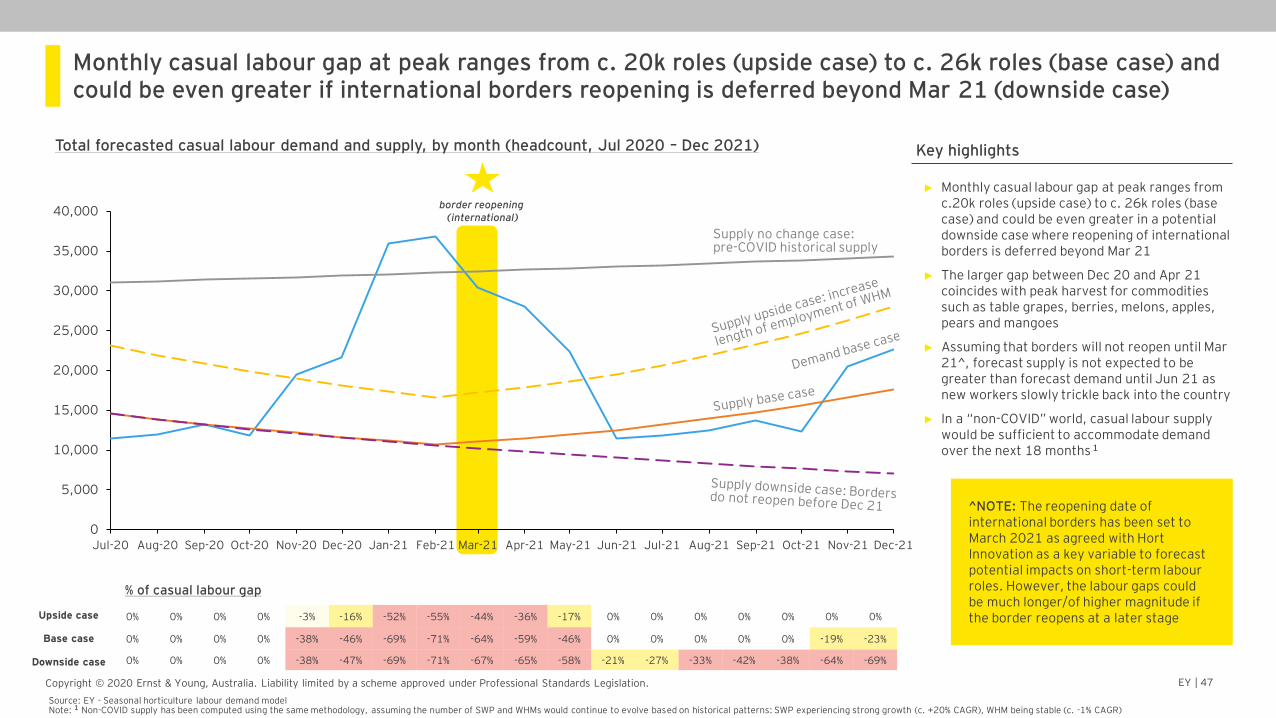
EY | 47Copyright © 2020 Ernst & Young, Australia. Liability limited by a scheme approved under Professional Standards Legislation.
border reopening (international)
Monthly casual labour gap at peak ranges from c. 20k roles (upside case) to c. 26k roles (base case) and could be even greater if international borders reopening is deferred beyond Mar 21 (downside case)
0
5,000
10,000
15,000
20,000
25,000
30,000
35,000
40,000
Mar-21Jan-21 Apr-21Dec-20 May-21Nov-20 Jun-21 Dec-21Oct-20 Jul-21 Nov-21Aug-21 Oct-21Sep-20 Sep-21Jul-20 Feb-21Aug-20
Key highlights
► Monthly casual labour gap at peak ranges from c.20k roles (upside case) to c. 26k roles (base case) and could be even greater in a potential downside case where reopening of international borders is deferred beyond Mar 21
► The larger gap between Dec 20 and Apr 21 coincides with peak harvest for commodities such as table grapes, berries, melons, apples, pears and mangoes
► Assuming that borders will not reopen until Mar 21^, forecast supply is not expected to be greater than forecast demand until Jun 21 as new workers slowly trickle back into the country
► In a “non-COVID” world, casual labour supply would be sufficient to accommodate demand over the next 18 months 1
^NOTE: The reopening date of international borders has been set to March 2021 as agreed with Hort Innovation as a key variable to forecast potential impacts on short-term labour roles. However, the labour gaps could be much longer/of higher magnitude if the border reopens at a later stage
Source: EY - Seasonal horticulture labour demand modelNote: 1 Non-COVID supply has been computed using the same methodology, assuming the number of SWP and WHMs would continue to evolve based on historical patterns: SWP experiencing strong growth (c. +20% CAGR), WHM being stable (c. -1% CAGR)
Total forecasted casual labour demand and supply, by month (headcount, Jul 2020 – Dec 2021)
% of casual labour gap
Base case
Upside case
Downside case
0% 0% 0% 0% -3% -16% -52% -55% -44% -36% -17% 0% 0% 0% 0% 0% 0% 0%
0% 0% 0% 0% -38% -46% -69% -71% -64% -59% -46% 0% 0% 0% 0% 0% -19% -23%
0% 0% 0% 0% -38% -47% -69% -71% -67% -65% -58% -21% -27% -33% -42% -38% -64% -69%
Supply no change case: pre-COVID historical supply
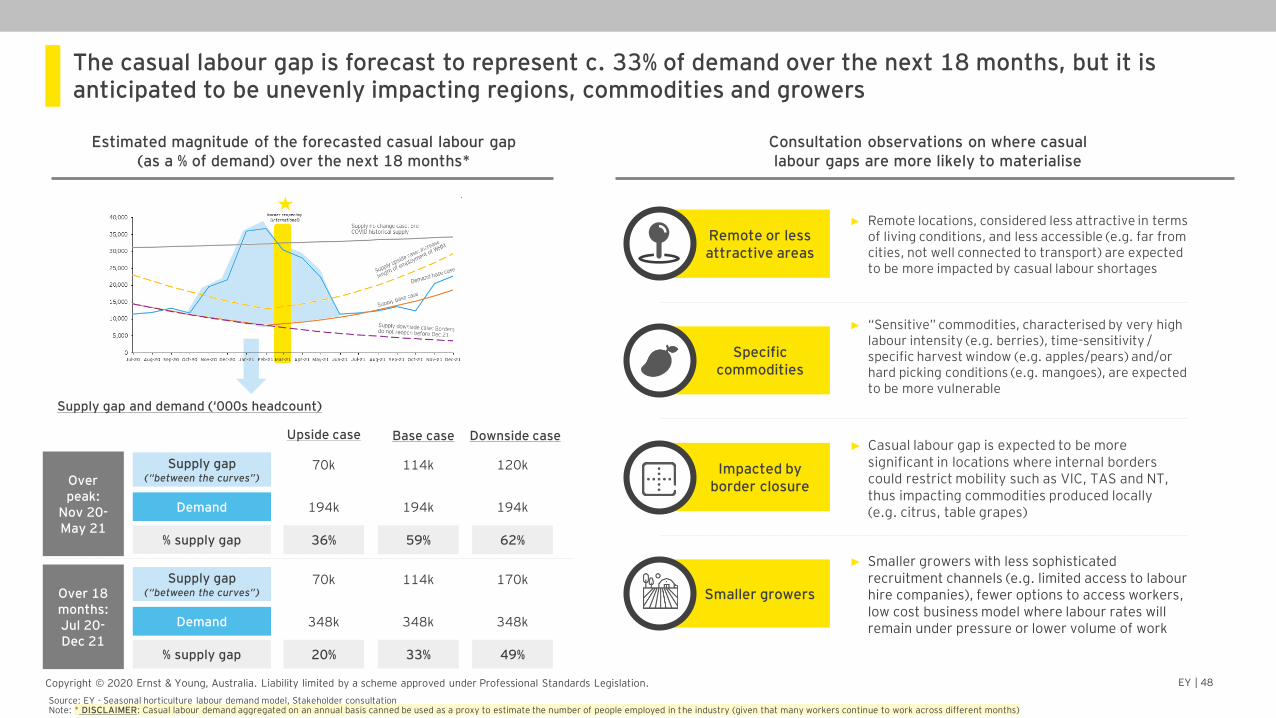
EY | 48Copyright © 2020 Ernst & Young, Australia. Liability limited by a scheme approved under Professional Standards Legislation.
The casual labour gap is forecast to represent c. 33% of demand over the next 18 months, but it is anticipated to be unevenly impacting regions, commodities and growers
Consultation observations on where casuallabour gaps are more likely to materialise
► “Sensitive” commodities, characterised by very high labour intensity (e.g. berries), time-sensitivity / specific harvest window (e.g. apples/pears) and/or hard picking conditions (e.g. mangoes), are expected to be more vulnerable
Specific commodities
► Casual labour gap is expected to be more significant in locations where internal borders could restrict mobility such as VIC, TAS and NT, thus impacting commodities produced locally (e.g. citrus, table grapes)
Impacted by border closure
► Remote locations, considered less attractive in terms of living conditions, and less accessible (e.g. far from cities, not well connected to transport) are expected to be more impacted by casual labour shortages
Remote or less attractive areas
► Smaller growers with less sophisticated recruitment channels (e.g. limited access to labour hire companies), fewer options to access workers, low cost business model where labour rates will remain under pressure or lower volume of work
Smaller growers
Source: EY - Seasonal horticulture labour demand model, Stakeholder consultationNote: * DISCLAIMER: Casual labour demand aggregated on an annual basis canned be used as a proxy to estimate the number of people employed in the industry (given that many workers continue to work across different months)
Estimated magnitude of the forecasted casual labour gap (as a % of demand) over the next 18 months*
Upside case Base case Downside case
Demand
Supply gap (“between the curves”)
70k
194k
% supply gap 36%
114k
194k
59%
120k
194k
62%
Supply gap and demand (‘000s headcount)
Over peak:
Nov 20-May 21
Over 18 months:Jul 20-Dec 21
Demand
Supply gap (“between the curves”)
70k
348k
% supply gap 20%
114k
348k
33%
170k
348k
49%
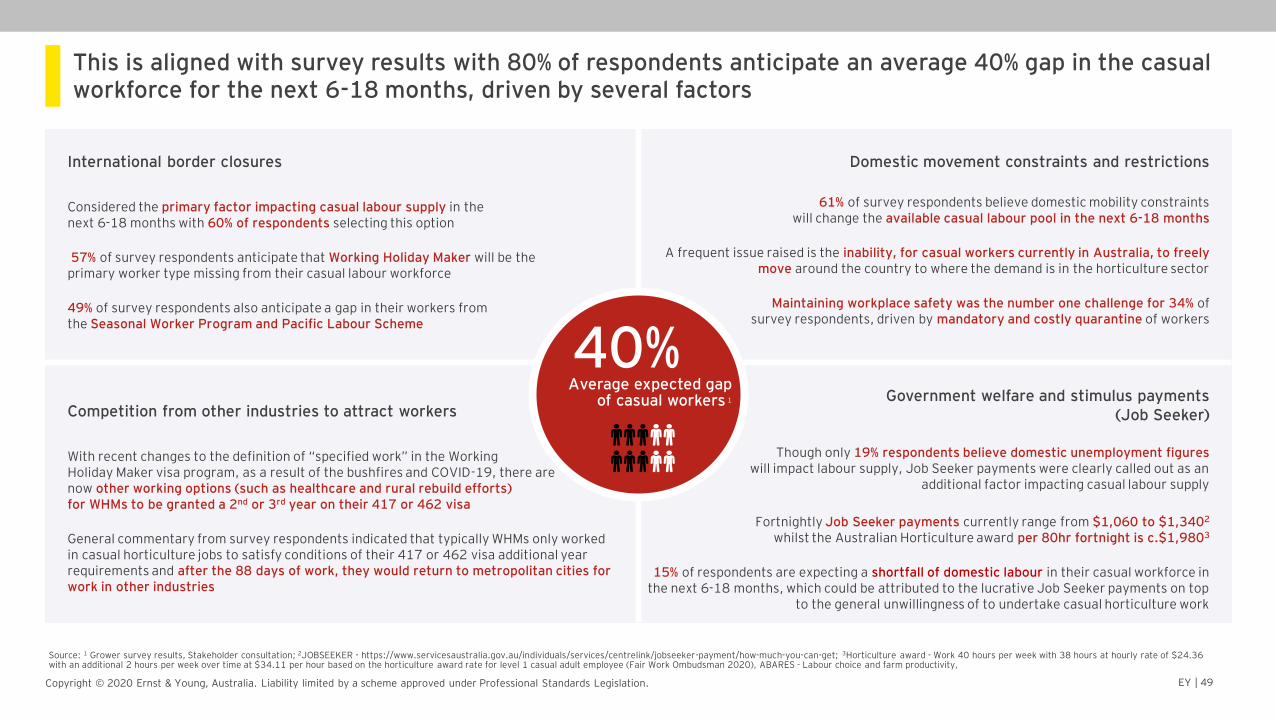
EY | 49Copyright © 2020 Ernst & Young, Australia. Liability limited by a scheme approved under Professional Standards Legislation.
International border closures
Considered the primary factor impacting casual labour supply in the next 6-18 months with 60% of respondents selecting this option
57% of survey respondents anticipate that Working Holiday Maker will be the primary worker type missing from their casual labour workforce
49% of survey respondents also anticipate a gap in their workers from the Seasonal Worker Program and Pacific Labour Scheme
Domestic movement constraints and restrictions
61% of survey respondents believe domestic mobility constraints will change the available casual labour pool in the next 6-18 months
A frequent issue raised is the inability, for casual workers currently in Australia, to freely move around the country to where the demand is in the horticulture sector
Maintaining workplace safety was the number one challenge for 34% of survey respondents, driven by mandatory and costly quarantine of workers
Competition from other industries to attract workers
With recent changes to the definition of “specified work” in the Working Holiday Maker visa program, as a result of the bushfires and COVID-19, there are now other working options (such as healthcare and rural rebuild efforts) for WHMs to be granted a 2nd or 3rd year on their 417 or 462 visa
General commentary from survey respondents indicated that typically WHMs only worked in casual horticulture jobs to satisfy conditions of their 417 or 462 visa additional year requirements and after the 88 days of work, they would return to metropolitan cities for work in other industries
Government welfare and stimulus payments (Job Seeker)
Though only 19% respondents believe domestic unemployment figureswill impact labour supply, Job Seeker payments were clearly called out as an
additional factor impacting casual labour supply
Fortnightly Job Seeker payments currently range from $1,060 to $1,3402
whilst the Australian Horticulture award per 80hr fortnight is c.$1,9803
15% of respondents are expecting a shortfall of domestic labour in their casual workforce in the next 6-18 months, which could be attributed to the lucrative Job Seeker payments on top
to the general unwillingness of to undertake casual horticulture work
This is aligned with survey results with 80% of respondents anticipate an average 40% gap in the casual workforce for the next 6-18 months, driven by several factors
Source: 1 Grower survey results, Stakeholder consultation; 2JOBSEEKER - https://www.servicesaustralia.gov.au/individuals/services/centrelink/jobseeker-payment/how-much-you-can-get; 3Horticulture award - Work 40 hours per week with 38 hours at hourly rate of $24.36 with an additional 2 hours per week over time at $34.11 per hour based on the horticulture award rate for level 1 casual adult employee (Fair Work Ombudsman 2020), ABARES - Labour choice and farm productivity,
40%Average expected gap
of casual workers 1
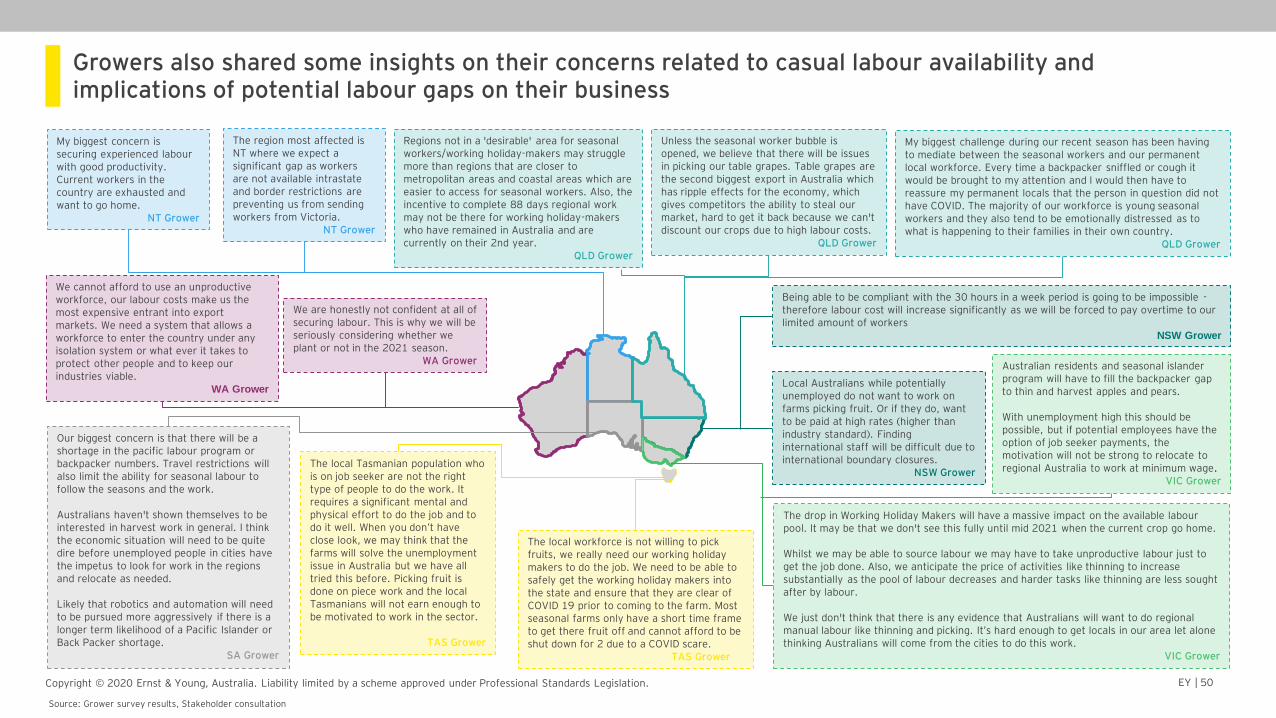
EY | 50Copyright © 2020 Ernst & Young, Australia. Liability limited by a scheme approved under Professional Standards Legislation.
Growers also shared some insights on their concerns related to casual labour availability and implications of potential labour gaps on their business
Regions not in a 'desirable' area for seasonal workers/working holiday-makers may struggle more than regions that are closer to metropolitan areas and coastal areas which are easier to access for seasonal workers. Also, the incentive to complete 88 days regional work may not be there for working holiday-makers who have remained in Australia and are currently on their 2nd year.
QLD Grower
Unless the seasonal worker bubble is opened, we believe that there will be issues in picking our table grapes. Table grapes are the second biggest export in Australia which has ripple effects for the economy, which gives competitors the ability to steal our market, hard to get it back because we can't discount our crops due to high labour costs.
QLD Grower
My biggest challenge during our recent season has been having to mediate between the seasonal workers and our permanent local workforce. Every time a backpacker sniffled or cough it would be brought to my attention and I would then have to reassure my permanent locals that the person in question did not have COVID. The majority of our workforce is young seasonal workers and they also tend to be emotionally distressed as to what is happening to their families in their own country.
QLD Grower
Australian residents and seasonal islander program will have to fill the backpacker gap to thin and harvest apples and pears.
With unemployment high this should be possible, but if potential employees have the option of job seeker payments, the motivation will not be strong to relocate to regional Australia to work at minimum wage.
VIC Grower
The local workforce is not willing to pick fruits, we really need our working holiday makers to do the job. We need to be able to safely get the working holiday makers into the state and ensure that they are clear of COVID 19 prior to coming to the farm. Most seasonal farms only have a short time frame to get there fruit off and cannot afford to be shut down for 2 due to a COVID scare.
TAS Grower
The drop in Working Holiday Makers will have a massive impact on the available labour pool. It may be that we don't see this fully until mid 2021 when the current crop go home.
Whilst we may be able to source labour we may have to take unproductive labour just to get the job done. Also, we anticipate the price of activities like thinning to increase substantially as the pool of labour decreases and harder tasks like thinning are less sought after by labour.
We just don't think that there is any evidence that Australians will want to do regional manual labour like thinning and picking. It’s hard enough to get locals in our area let alone thinking Australians will come from the cities to do this work.
VIC Grower
The local Tasmanian population who is on job seeker are not the right type of people to do the work. It requires a significant mental and physical effort to do the job and to do it well. When you don’t have close look, we may think that the farms will solve the unemployment issue in Australia but we have all tried this before. Picking fruit is done on piece work and the local Tasmanians will not earn enough to be motivated to work in the sector.
TAS Grower
Our biggest concern is that there will be a shortage in the pacific labour program or backpacker numbers. Travel restrictions will also limit the ability for seasonal labour to follow the seasons and the work.
Australians haven't shown themselves to be interested in harvest work in general. I think the economic situation will need to be quite dire before unemployed people in cities have the impetus to look for work in the regions and relocate as needed.
Likely that robotics and automation will need to be pursued more aggressively if there is a longer term likelihood of a Pacific Islander or Back Packer shortage.
SA Grower
We cannot afford to use an unproductive workforce, our labour costs make us the most expensive entrant into export markets. We need a system that allows a workforce to enter the country under any isolation system or what ever it takes to protect other people and to keep our industries viable.
WA Grower
We are honestly not confident at all of securing labour. This is why we will be seriously considering whether we plant or not in the 2021 season.
WA Grower
Local Australians while potentially unemployed do not want to work on farms picking fruit. Or if they do, want to be paid at high rates (higher than industry standard). Finding international staff will be difficult due to international boundary closures.
NSW Grower
My biggest concern is securing experienced labour with good productivity. Current workers in the country are exhausted and want to go home.
NT Grower
The region most affected is NT where we expect a significant gap as workers are not available intrastate and border restrictions are preventing us from sending workers from Victoria.
NT Grower
Being able to be compliant with the 30 hours in a week period is going to be impossible -therefore labour cost will increase significantly as we will be forced to pay overtime to our limited amount of workers
NSW Grower
Source: Grower survey results, Stakeholder consultation
EY | Assurance | Tax | Strategy and Transactions | Consulting
About EYEY is a global leader in assurance, tax, strategy, transaction and consulting services. The insights and quality services we deliver help build trust and confidence in the capital markets and in economies the world over. We develop outstanding leaders who team to deliver on our promises to all of our stakeholders. In so doing, we play a critical role in building a better working world for our people, for our clients and for our communities.
EY refers to the global organization, and may refer to one or more, of the member firms of Ernst & Young Global Limited, each of which is a separate legal entity. Ernst & Young Global Limited, a UK company limited by guarantee, does not provide services to clients. Information about how EY collects and uses personal data and a description of the rights individuals have under data protection legislation is available via ey.com/privacy. For more information about our organization, please visit ey.com.
© 2020 Ernst & Young, Australia.All Rights Reserved.
Liability limited by a scheme approved under Professional Standards Legislation.
In line with EY’s commitment to minimise its impact on the environment, this document has been printed on paper with a high recycled content.
ey.com