Seasonal and successional streamflow response to forest ... · 1 Seasonal and successional...
19
1 Seasonal and successional streamflow response to forest cutting 2 and regrowth in the northwest and eastern United States 3 Julia A. Jones and David A. Post 1 4 Department of Geosciences, Oregon State University, Corvallis, Oregon, USA 5 Received 12 December 2003; revised 15 January 2004; accepted 16 February 2004; published XX Month 2004. 6 [1] This study examined daily streamflow response over up to four decades in northwest 7 conifer forest and eastern deciduous forest sites in the United States. We used novel 8 methods to analyze daily observations of climate and streamflow spanning more than 9 900 basin years of record at 14 treated/control basin pairs where forest removal and 10 regrowth experiments were underway in the period 1930–2002. In the 1 to 5-year period 11 after forest removal, maximum daily increases ranged from 2 to 3 mm at deciduous forest 12 sites, to 6 to 8 mm at conifer forest sites. Significant spring surpluses persisted for up 13 to 35 years in conifer forest basins, but winter and spring streamflow deficits appeared 14 after 10 to 15 years of forest regrowth in eastern deciduous forest basins. In all 5-yr 15 posttreatment periods, absolute changes in daily streamflow were significantly more likely 16 during moist, warm seasons, or during snowmelt seasons, but relative changes were more 17 likely during warm seasons irrespective of moisture status. Both relative and absolute 18 streamflow changes in the 1 to 5 and 15 to 25-year periods after forest removal were 19 significantly positively related to the age of the forest at the time it was cut. Eastern 20 deciduous forests had been disturbed by logging or hurricane 12 to 56 years prior to forest 21 removal, while Pacific Northwest conifer forests had been not experienced logging or 22 wildfire for 90 to 450 years. Paired basin experiments provide a continuous, and 23 continuously changing, record of vegetation structure, composition, and climate, and their 24 effects on streamflow. INDEX TERMS: 1860 Hydrology: Runoff and streamflow; 1803 Hydrology: 25 Anthropogenic effects; 1863 Hydrology: Snow and ice (1827); KEYWORDS: Caspar Creek experimental forest, 26 Coweeta experimental forest, Coyote Creek, Fernow experimental forest, H. J. Andrews Forest, Hubbard 27 Brook experimental forest, paired-basin experiments. 29 Citation: Jones, J. A., and D. A. Post (2004), Seasonal and successional streamflow response to forest cutting and regrowth in the 30 northwest and eastern United States, Water Resour. Res., 40, XXXXXX, doi:10.1029/2003WR002952. 32 1. Introduction 33 [2] Paired-basin forestry experiments are a major source 34 of data on climate, streamflow, and vegetation for testing of 35 theoretical propositions in hydrology. Yet to date, the 36 hydrologic implications of paired basin experiments have 37 been largely examined for individual experiments, or in 38 reviews or meta-analyses [e.g., Bosch and Hewlett, 1982; 39 Robinson et al., 2003] combining results from studies using 40 disparate methods. Hydrologic modeling efforts frequently 41 employ paired-basin data, but inferences are limited by 42 uncertainty about many parameters, including vegetation- 43 climate-soil interactions [Beven, 2002]. 44 [ 3] Studies of eco-physiology, global change, and 45 stream ecology are providing hydrologists with challenging 46 hypotheses about vegetation and climate coupling to 47 hydrology. Eco-physiology studies argue that forest struc- 48 ture and composition develop during succession to reduce 49 stress on plants and optimally use resources, including 50 moisture [Eagleson, 2002]. Studies of global change, 51 including climate change, indicate that streamflow responds 52 to changes in temperature and rainfall [Hodgekins et al., 53 2003] with concurrent changes in vegetation cover and 54 species composition [e.g., Shafer et al., 2001]. Stream 55 ecologists advocate restoration policies based on streamflow 56 variability [Poff et al., 1997], as well as habitat structure. 57 Results from paired-basin experiments can contribute to 58 these issues, by revealing the coupling among vegetation, 59 atmosphere, soil, and streamflow at spatial and temporal 60 scales intermediate between plot- and reach-scale studies 61 characteristic of eco-physiology and stream ecology, and the 62 coarse scales of climate and land use change modeling. 63 [4] In paired basin experiments, both increases and 64 decreases in streamflow may occur in both relative and 65 absolute terms at different seasons or time periods after 66 treatment, providing clues about causal mechanisms, and 67 geomorphic and ecological consequences, of vegetation 68 change. In published studies, the largest relative changes 69 in streamflow occurred in summer months after removal of 70 eastern deciduous forest [Douglass and Swank, 1972, 1975; 71 Swank et al., 2001; Hornbeck et al., 1997; Martin et al., 72 2000] and western conifer forest [Rothacher, 1975; Harr et 73 al., 1979, 1982]. However, in conifer sites, the largest 74 absolute streamflow increases occurred during wet winter 75 months [Rothacher, 1970; Lewis et al., 2001]. Lags of 1 Now at CSIRO Land and Water, Aitkenvale, Queensland, Australia. Copyright 2004 by the American Geophysical Union. 0043-1397/04/2003WR002952$09.00 XXXXXX WATER RESOURCES RESEARCH, VOL. 40, XXXXXX, doi:10.1029/2003WR002952, 2004 1 of 19
Transcript of Seasonal and successional streamflow response to forest ... · 1 Seasonal and successional...
1 Seasonal and successional streamflow response to forest cutting
2 and regrowth in the northwest and eastern United States
3 Julia A. Jones and David A. Post1
4 Department of Geosciences, Oregon State University, Corvallis, Oregon, USA
5 Received 12 December 2003; revised 15 January 2004; accepted 16 February 2004; published XX Month 2004.
6 [1] This study examined daily streamflow response over up to four decades in northwest7 conifer forest and eastern deciduous forest sites in the United States. We used novel8 methods to analyze daily observations of climate and streamflow spanning more than9 900 basin years of record at 14 treated/control basin pairs where forest removal and10 regrowth experiments were underway in the period 1930–2002. In the 1 to 5-year period11 after forest removal, maximum daily increases ranged from 2 to 3 mm at deciduous forest12 sites, to 6 to 8 mm at conifer forest sites. Significant spring surpluses persisted for up13 to 35 years in conifer forest basins, but winter and spring streamflow deficits appeared14 after 10 to 15 years of forest regrowth in eastern deciduous forest basins. In all 5-yr15 posttreatment periods, absolute changes in daily streamflow were significantly more likely16 during moist, warm seasons, or during snowmelt seasons, but relative changes were more17 likely during warm seasons irrespective of moisture status. Both relative and absolute18 streamflow changes in the 1 to 5 and 15 to 25-year periods after forest removal were19 significantly positively related to the age of the forest at the time it was cut. Eastern20 deciduous forests had been disturbed by logging or hurricane 12 to 56 years prior to forest21 removal, while Pacific Northwest conifer forests had been not experienced logging or22 wildfire for 90 to 450 years. Paired basin experiments provide a continuous, and23 continuously changing, record of vegetation structure, composition, and climate, and their24 effects on streamflow. INDEX TERMS: 1860 Hydrology: Runoff and streamflow; 1803 Hydrology:
25 Anthropogenic effects; 1863 Hydrology: Snow and ice (1827); KEYWORDS: Caspar Creek experimental forest,
26 Coweeta experimental forest, Coyote Creek, Fernow experimental forest, H. J. Andrews Forest, Hubbard
27 Brook experimental forest, paired-basin experiments.
29 Citation: Jones, J. A., and D. A. Post (2004), Seasonal and successional streamflow response to forest cutting and regrowth in the
30 northwest and eastern United States, Water Resour. Res., 40, XXXXXX, doi:10.1029/2003WR002952.
32 1. Introduction
33 [2] Paired-basin forestry experiments are a major source34 of data on climate, streamflow, and vegetation for testing of35 theoretical propositions in hydrology. Yet to date, the36 hydrologic implications of paired basin experiments have37 been largely examined for individual experiments, or in38 reviews or meta-analyses [e.g., Bosch and Hewlett, 1982;39 Robinson et al., 2003] combining results from studies using40 disparate methods. Hydrologic modeling efforts frequently41 employ paired-basin data, but inferences are limited by42 uncertainty about many parameters, including vegetation-43 climate-soil interactions [Beven, 2002].44 [3] Studies of eco-physiology, global change, and45 stream ecology are providing hydrologists with challenging46 hypotheses about vegetation and climate coupling to47 hydrology. Eco-physiology studies argue that forest struc-48 ture and composition develop during succession to reduce49 stress on plants and optimally use resources, including50 moisture [Eagleson, 2002]. Studies of global change,
51including climate change, indicate that streamflow responds52to changes in temperature and rainfall [Hodgekins et al.,532003] with concurrent changes in vegetation cover and54species composition [e.g., Shafer et al., 2001]. Stream55ecologists advocate restoration policies based on streamflow56variability [Poff et al., 1997], as well as habitat structure.57Results from paired-basin experiments can contribute to58these issues, by revealing the coupling among vegetation,59atmosphere, soil, and streamflow at spatial and temporal60scales intermediate between plot- and reach-scale studies61characteristic of eco-physiology and stream ecology, and the62coarse scales of climate and land use change modeling.63[4] In paired basin experiments, both increases and64decreases in streamflow may occur in both relative and65absolute terms at different seasons or time periods after66treatment, providing clues about causal mechanisms, and67geomorphic and ecological consequences, of vegetation68change. In published studies, the largest relative changes69in streamflow occurred in summer months after removal of70eastern deciduous forest [Douglass and Swank, 1972, 1975;71Swank et al., 2001; Hornbeck et al., 1997; Martin et al.,722000] and western conifer forest [Rothacher, 1975; Harr et73al., 1979, 1982]. However, in conifer sites, the largest74absolute streamflow increases occurred during wet winter75months [Rothacher, 1970; Lewis et al., 2001]. Lags of
1Now at CSIRO Land and Water, Aitkenvale, Queensland, Australia.
Copyright 2004 by the American Geophysical Union.0043-1397/04/2003WR002952$09.00
XXXXXX
WATER RESOURCES RESEARCH, VOL. 40, XXXXXX, doi:10.1029/2003WR002952, 2004
1 of 19
76 several months between periods of vegetation water use and77 streamflow responses have been reported from southeastern78 deciduous forest sites [Swank et al., 1988].79 [5] Both hydrologic and ecological causal mechanisms80 have been invoked to explain varied streamflow responses81 in paired basin experiments. In the northwestern United82 States, conifer forest removal may modify cloudwater83 interception [Harr, 1982] as well as snowpack dynamics84 [Harr, 1981; Berris and Harr, 1987] during wet (winter)85 seasons. In the eastern United States, vegetation species in86 early succession may be higher water users per unit leaf area87 than the species removed, reducing summer streamflows88 [Hornbeck et al., 1997; Swank et al., 2001]. Also, conifers89 may use more water over greater periods of the year than90 deciduous forests, reducing fall, winter, or spring flows91 [Swank and Douglass, 1974; Swank et al., 1988].92 [6] Differences among basins where forest removal93 experiments have been conducted lend themselves to testing94 the generality of hypotheses about causes and consequences95 of vegetation change for streamflow. The eastern US has a
96mesic climate with wet summers whereas the northwestern97US has a xeric climate with dry summers. Northern and98high-elevation basins have seasonal snow, but basins at99lower latitudes or elevations have transient snowpacks or no100snow. Basins in the eastern US have deciduous forests101mostly regenerating from logging or other disturbances in102the early 20th century, whereas basins in the northwestern103US have conifer forests that have been protected from104logging and wildfire since at least 1900. Thus season, forest105type, and forest age, both time since treatment and age of106the forest when it was removed, all may influence stream-107flow response to forest removal.108[7] Technological developments also lend themselves to a109broad analysis of paired-basin forest removal experiments110[Jones and Swanson, 2001]. Records of up to sixty years of111continuous streamflow and associated measurements now112are available from many sites [Post et al., 1998]. Many of113these records are available through online data harvesters114(e.g., hydro-DB [Baker et al., 2000]). New methods are115being developed for testing hypotheses with long-term116streamflow data sets [e.g., Jones and Grant, 1996; Jones,1172000; Post and Jones, 2001]. Finally, increased computer118power and growth of the Internet now permit data sets from119many sites to be readily compiled and analyzed in one120location.
1212. Conceptual Model
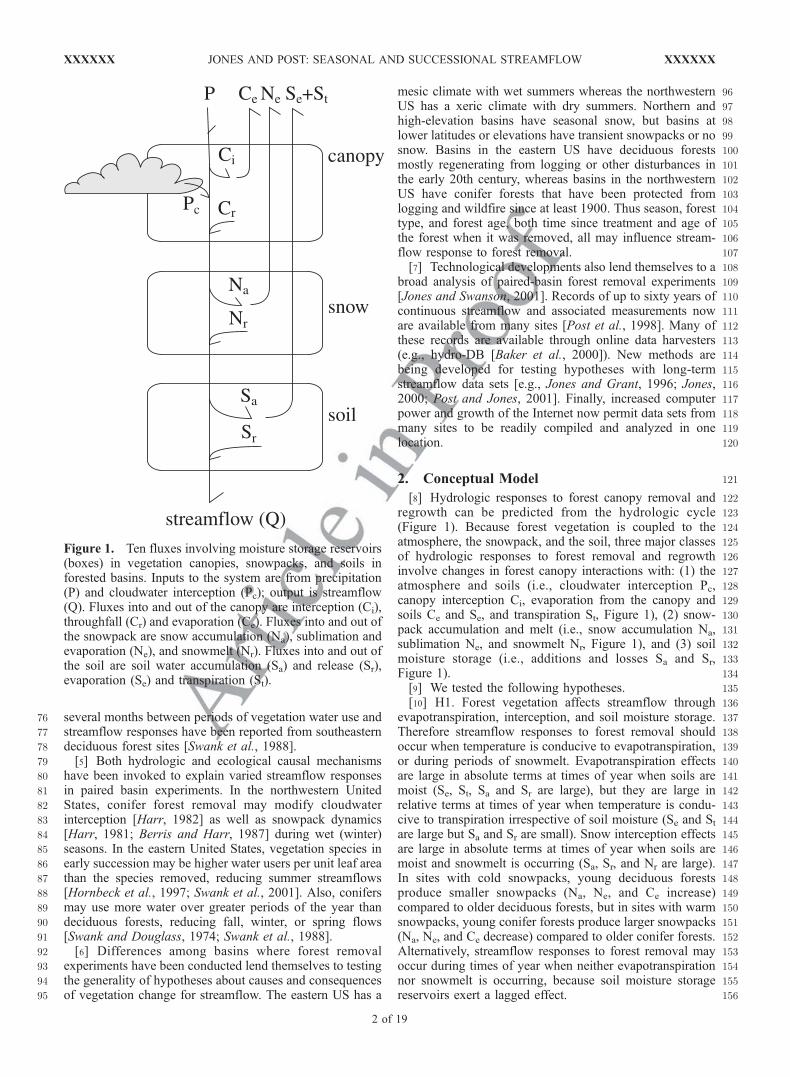
122[8] Hydrologic responses to forest canopy removal and123regrowth can be predicted from the hydrologic cycle124(Figure 1). Because forest vegetation is coupled to the125atmosphere, the snowpack, and the soil, three major classes126of hydrologic responses to forest removal and regrowth127involve changes in forest canopy interactions with: (1) the128atmosphere and soils (i.e., cloudwater interception Pc,129canopy interception Ci, evaporation from the canopy and130soils Ce and Se, and transpiration St, Figure 1), (2) snow-131pack accumulation and melt (i.e., snow accumulation Na,132sublimation Ne, and snowmelt Nr, Figure 1), and (3) soil133moisture storage (i.e., additions and losses Sa and Sr,134Figure 1).135[9] We tested the following hypotheses.136[10] H1. Forest vegetation affects streamflow through137evapotranspiration, interception, and soil moisture storage.138Therefore streamflow responses to forest removal should139occur when temperature is conducive to evapotranspiration,140or during periods of snowmelt. Evapotranspiration effects141are large in absolute terms at times of year when soils are142moist (Se, St, Sa and Sr are large), but they are large in143relative terms at times of year when temperature is condu-144cive to transpiration irrespective of soil moisture (Se and St145are large but Sa and Sr are small). Snow interception effects146are large in absolute terms at times of year when soils are147moist and snowmelt is occurring (Sa, Sr, and Nr are large).148In sites with cold snowpacks, young deciduous forests149produce smaller snowpacks (Na, Ne, and Ce increase)150compared to older deciduous forests, but in sites with warm151snowpacks, young conifer forests produce larger snowpacks152(Na, Ne, and Ce decrease) compared to older conifer forests.153Alternatively, streamflow responses to forest removal may154occur during times of year when neither evapotranspiration155nor snowmelt is occurring, because soil moisture storage156reservoirs exert a lagged effect.
Figure 1. Ten fluxes involving moisture storage reservoirs(boxes) in vegetation canopies, snowpacks, and soils inforested basins. Inputs to the system are from precipitation(P) and cloudwater interception (Pc); output is streamflow(Q). Fluxes into and out of the canopy are interception (Ci),throughfall (Cr) and evaporation (Ce). Fluxes into and out ofthe snowpack are snow accumulation (Na), sublimation andevaporation (Ne), and snowmelt (Nr). Fluxes into and out ofthe soil are soil water accumulation (Sa) and release (Sr),evaporation (Se) and transpiration (St).
2 of 19
XXXXXX JONES AND POST: SEASONAL AND SUCCESSIONAL STREAMFLOW XXXXXX
157 [11] H2: The forest vegetation effect on streamflow158 depends upon forest structure and composition, which vary159 with the age of vegetation. Two measures of forest age are160 relevant: the age of the forest in the treated basin (time since161 treatment) and the difference in ages of the forests between162 the treated and control basins (which is equivalent to the163 time since most recent pre-treatment forest disturbance).164 Young forests use more water than older forests at times of165 year when temperature is conducive to transpiration, irre-166 spective of soil moisture (Se and St are larger relative to Sa167 and Sr for young than older forests). Therefore streamflow168 response will decline rapidly in the first few decades of169 forest regrowth, and forests aged 10 to 30 years will170 produce summer streamflow deficits relative to older for-171 ests. However, as forests age, structure and composition172 change so as to better utilize water available at times of year173 when transpiration is temperature- or moisture-limited.174 Therefore streamflow responses will be positively related175 to the difference in forest age between the treated and176 control basins.
177 3. Study Sites
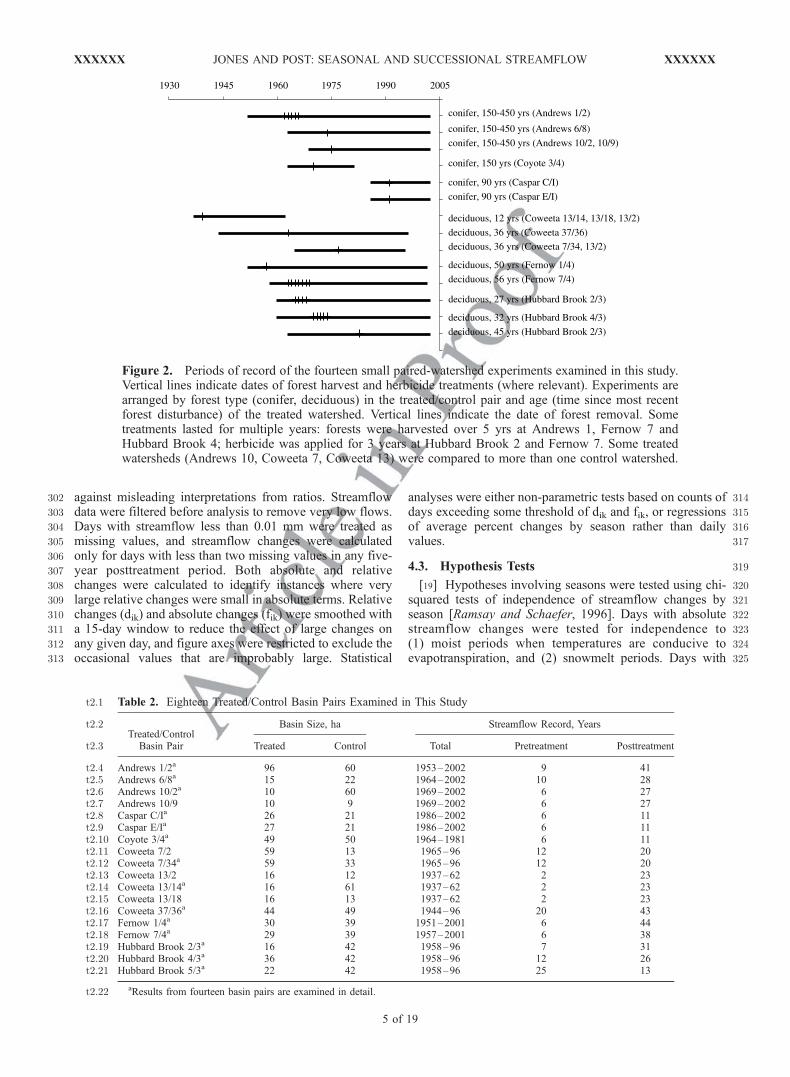
178 [12] Study sites were located in six experimental forests,179 three in the Pacific Northwest of the United States, and three180 in the eastern United States (Table 1). As of 2002, Pacific181 Northwest sites (the Andrews, Coyote Creek, and Caspar182 Creek Experimental Forests) had conifer forests up to183 500-yrs old and dry summers. Eastern sites (the Hubbard184 Brook, Fernow, and Coweeta Experimental Forests) had185 <100 yr old deciduous forests and wet summers. The north-186 ernmost sites (Andrews, Hubbard Brook) had seasonal snow-187 packs. Mean annual precipitation ranged from 1000 mm to188 over 2000 mm at both conifer and deciduous sites (Table 1).189 [13] Forest age was determined as the time since the most190 recent severe disturbance documented at that site (Table 1).191 Themost recent disturbances includedwildfire and logging in192 conifer forests, and hurricane and logging in deciduous forest193 (Table 1). Conifer forest types included western hemlock194 (Andrews), mixed-conifer (Coyote Creek) and redwood for-195 ests (Caspar Creek). Deciduous forest types included north-196 ern hardwoods (Hubbard Brook) and oak-hickory forests197 (Fernow, Coweeta) (Table 1).198 [14] Each site consisted of one or more paired-watershed199 experiments in which 100% of forest cover had been200 harvested and an unharvested control basin exists (Table 1).201 Forest harvest treatments at the fourteen treated basins202 occurred over more than half a century, from the 1930s to203 1990 (Figure 2). In ten of these cases forest harvest occurred204 in a single year, but in four cases harvest occurred over205 several years (Table 1, Figure 2). Treatment involved206 logging (removal of wood products) in ten treated water-207 sheds. In four cases wood products were not removed, and in208 two of these four cases herbicide was applied for several209 years after logging (Table 1). Because of differing distur-210 bance histories, 90 to 450 yr-old forests were removed in the211 conifer sites, but 12 to 56 yr-old forests were removed in the212 deciduous forest sites (Table 1).213 [15] Long-term records of streamflow and climate have214 been collected at 26 basins (14 treated, 12 control) from the215 six study sites. Basin size ranged from 9 to 96 hectares, and216 streamflow and climate records span periods ranging from217 17 years to 63 years (Figure 2). Pre-treatment records were
2186 or more years in length in all but one treated basin, and219posttreatment records ranged from 11 to over 40 years220(Figure 2). Most of the basins ranged in size from 20 to22150 ha, and the ages of most harvested forest ranged from 30222to 125 years.
2234. Methods
2244.1. Datasets and Data Collection
225[16] Mean daily streamflow, precipitation, minimum and226maximum temperature, and snowpack data from five of the227six sites are publicly available on the worldwide web and228were collected electronically through Hydro-DB, an auto-229mated data harvester http://www.fsl.orst.edu/hydrodb/).230Data from the sixth site (Coweeta Experimental Forest)231are not publicly available, but they were provided by U.S.232Forest Service scientists (L. Swift and W. Swank) for233periods of record through 1995. The resulting primary data234set consisted of over 750,000 observations spanning more235than 900 watershed-years of streamflow records. Original236streamflow data in units of L/s were converted to mm/day237(unit area discharge):
mm
day¼ 8:64 � L
s� A
239where A is basin area in hectares. We used a water year240from 1 October to 30 September. For Caspar Creek all241values from late April to early November were missing242values.243[17] The initial data set comprised records from 26 basins244(14 treated, 12 control). We present results from 14 treated/245control pairs (Table 2). In 11 of these 14 pairs we used the246treated/control pairs established by the original researchers.247In three cases, we used an alternative to the original control248basin (Table 2). In these three cases, Coweeta 7/34 (7/2),249Coweeta 13/14 (13/18), and Andrews 10/2 (10/9), the250original control basins (in parentheses) were less than25115 ha in size. The average standard deviation of daily flow252at control basins in mm (y) was significantly negatively253related to basin size in hectares (x) (y = 2.29 exp(�0.034x);254r2 = 0.84; n = 12). Therefore streamflow changes were not255detectable using the original (<15 ha) basins, but they were256detectable when the same treated basins were compared to257larger, nearby control basins. Moreover, in one case258(Andrews 10/9) the original treated/control relationship259was suspect because a flume change 15 months prior to260the treatment produced significant changes in streamflow at261the control basin (Andrews 9).
2634.2. Calculating Streamflow Responses to Forest264Removal and Regrowth
265[18] The change in streamflow in the treated basin rela-266tive to the pretreatment treated/control relationship was267calculated by day of year and averaged for 5-yr periods268after forest removal, following Jones and Grant [1996] and269Jones [2000]. The treated/control relationship was
cij ¼ lnbij� �aij� �
" #
271where cij = the (ln-transformed) ratio of streamflow at the272treated and control basins, day i, year j; aij and bij = unit area
XXXXXX JONES AND POST: SEASONAL AND SUCCESSIONAL STREAMFLOW
3 of 19
XXXXXX
273 streamflow (mm) at the control basin and the treated basin,274 respectively, on day i, year j. The period of record was275 divided into periods k = 1, 2,. . .n, such that the pretreatment276 period was noted 1, and 5-year posttreatment periods were277 noted 2 and higher. The average treated/control relationship278 was
cik ¼ cij
279 for years j in period k = 1, 2, .n. The percent change in the281 treated/control relationship in a given posttreatment period282 relative to the treated/control relationship in the pretreat-283 ment period, for each period k, was
dik ¼ exp cik�ci1ð Þ �1� �
� 100
285 for periods k = 2,. . .n and where dik = percent change on286 day i, years j in period k, cik = treated/control relationship287 on day i, years j in 5-yr posttreatment period k, ci1 = treated/
288control relationship on day i, years j in the pretreatment289period. The mean of (log-transformed) daily flow at the290control basin on day i for period k was:
eik ¼Xj2k
ln aij� �
=nk
292where nk = number of years in period k. The absolute change293in streamflow (back-transformed to units of mm/day) in294the treated basin relative to the control basin on day i of2955-yr posttreatment period k was:
fik ¼ dik � exp eikð Þ
297The detection of change in paired-based experiments298depends fundamentally upon ratios, whose interpretation299can be problematic when the denominator (flow at the300control basin) is a small number. Several measures were301taken in the analysis and presentation of results to protect
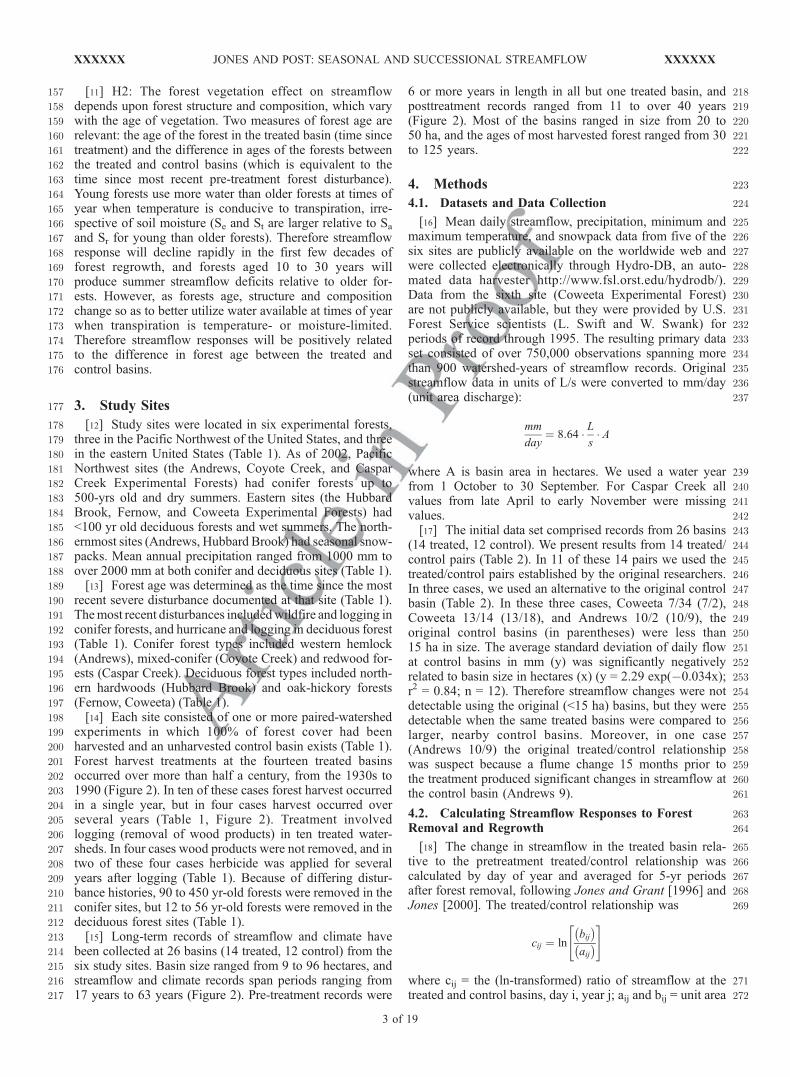
t1.1 Table 1. Vegetation Cover, Disturbance History, Treatments, and Ages of Forest in Fourteen Treated/Control Basin Pairs in This Study
Basin Pair Disturbance
t1.2 Treatment Agea
MAP,a mmType Date Treatedb Controlct1.3
Western Hemlockdt1.4Andrews 1/2 severe wildfire in 1500s 100% clearcut, logged, burn 1962–66 450 500 2270t1.5Andrews 6/8 wildfire in 1500s, 1850s 100% clearcut, logged, road 1974 125 150 2178t1.6Andrews 10/2 " 100% clearcut, logged 1975 125 500 2282t1.7
Mixed Coniferet1.9Coyote 3/4 wildfire in 1500s, 1850s 100% clearcut, logged 1970 120 145 984t1.10
Redwoodft1.12Caspar C/I clearcut, logged 1860–1904 96% clearcut, logged 1991 90 100 1190t1.13Caspar E/I " 100% clearcut, logged 1991 90 100 1190t1.14
Northern Hardwood gt1.16Hubbard Brook 2/3 logged 1800s–1910,
hurricane/salvage 1938100% clearcut, herbicide 1965 27 64 1312t1.17
Hubbard Brook 4/3 " 100% clearcut, logged 1970–74 32 64 1312t1.18Hubbard Brook 5/3 " 100% clearcut, logged 1983 45 64 1312t1.19
Oak-Hickoryht1.21Fernow 1/4 logged 1905–1910 100% clearcut, logged 1957 50 95 1438t1.22Fernow 7/4 " 100% clearcut, herbicide 1963 56 95 1450t1.23
Oak-Hickoryit1.25Coweeta 7/34 grazing, burning 1840–1906;
logged 1919–27100% clearcut, logged 1977 50 75 1962t1.26
Coweeta 13/14 " 100% clearcut 1939 12 75 1934t1.27Coweeta 37/36 " 100% clearcut 1963 35 75 2191t1.28
aAge of forest (time since last forest disturbance) and mean annual precipitation (mm) at the control basin for the period of record used in the analysis.Forest ages are based on Weisberg and Swanson [2003] (Andrews), Lewis et al. [2001] (Caspar Creek), Douglass and Hoover [1988] (Coweeta), Harr etal., [1979] (Coyote), Fernow Experimental Forest website (Fernow), Schwarz et al. [2001] (Hubbard Brook). Ages of 500-year old forest have errormargins of ±25 years due to uncertainty in dating prehistorical events. Forest ages were log-transformed in analyses in part to account for increasinguncertainty of dates with forest age.t1.29
bAge (time since last forest disturbance) of forest in treated basin at time of treatment.t1.30cAge (time since last forest disturbance) of forest in control basins in 2002.t1.31dForests dominated by Douglas-fir (Pseudotsuga menziesii) with western hemlock (Tsuga heterophylla) and red cedar (Thuja plicata) [Rothacher et al.,
1967].t1.32eForests dominated by Douglas-fir (Pseudotsuga menziesii), ponderosa pine (Pinus ponderosa), and sugar pine (Pinus lambertiana) [Harr et al., 1979].t1.33fForests dominated by coast redwood (Sequoia sempervirens), Douglas-fir (Pseudotsuga menziesii), grand fir (Abies grandis) and western hemlock
(Tsuga heterophylla) [Lewis et al., 2001].t1.34gForests dominated by American beech (Fagus grandifolia), sugar maple (Acer saccharum), and yellow birch (Betula alleghaniensis) [Schwarz et al.,
2001].t1.35hForests dominated by northern red oak (Quercus rubra), sugar maple (Acer saccharum), and tulip poplar (Liriodendron tulipifera) (Fernow web site).t1.36iForests dominated by chestnut oak (Quercus prinus), scarlet oak (Quercus coccinea), northern red oak (Quercus rubra), red maple (Acer rubrum), and
tulip poplar (Liriodendron tulipifera) with abundant rhodedendron (Rhodedendron maximum) [Day et al., 1988].t1.37
4 of 19
XXXXXX JONES AND POST: SEASONAL AND SUCCESSIONAL STREAMFLOW XXXXXX
302 against misleading interpretations from ratios. Streamflow303 data were filtered before analysis to remove very low flows.304 Days with streamflow less than 0.01 mm were treated as305 missing values, and streamflow changes were calculated306 only for days with less than two missing values in any five-307 year posttreatment period. Both absolute and relative308 changes were calculated to identify instances where very309 large relative changes were small in absolute terms. Relative310 changes (dik) and absolute changes (fik) were smoothed with311 a 15-day window to reduce the effect of large changes on312 any given day, and figure axes were restricted to exclude the313 occasional values that are improbably large. Statistical
314analyses were either non-parametric tests based on counts of315days exceeding some threshold of dik and fik, or regressions316of average percent changes by season rather than daily317values.
3194.3. Hypothesis Tests
320[19] Hypotheses involving seasons were tested using chi-321squared tests of independence of streamflow changes by322season [Ramsay and Schaefer, 1996]. Days with absolute323streamflow changes were tested for independence to324(1) moist periods when temperatures are conducive to325evapotranspiration, and (2) snowmelt periods. Days with
Figure 2. Periods of record of the fourteen small paired-watershed experiments examined in this study.Vertical lines indicate dates of forest harvest and herbicide treatments (where relevant). Experiments arearranged by forest type (conifer, deciduous) in the treated/control pair and age (time since most recentforest disturbance) of the treated watershed. Vertical lines indicate the date of forest removal. Sometreatments lasted for multiple years: forests were harvested over 5 yrs at Andrews 1, Fernow 7 andHubbard Brook 4; herbicide was applied for 3 years at Hubbard Brook 2 and Fernow 7. Some treatedwatersheds (Andrews 10, Coweeta 7, Coweeta 13) were compared to more than one control watershed.
t2.1 Table 2. Eighteen Treated/Control Basin Pairs Examined in This Study
Treated/ControlBasin Pair
Basin Size, ha Streamflow Record, Yearst2.2
Treated Control Total Pretreatment Posttreatmentt2.3
Andrews 1/2a 96 60 1953–2002 9 41t2.4Andrews 6/8a 15 22 1964–2002 10 28t2.5Andrews 10/2a 10 60 1969–2002 6 27t2.6Andrews 10/9 10 9 1969–2002 6 27t2.7Caspar C/Ia 26 21 1986–2002 6 11t2.8Caspar E/Ia 27 21 1986–2002 6 11t2.9Coyote 3/4a 49 50 1964–1981 6 11t2.10Coweeta 7/2 59 13 1965–96 12 20t2.11Coweeta 7/34a 59 33 1965–96 12 20t2.12Coweeta 13/2 16 12 1937–62 2 23t2.13Coweeta 13/14a 16 61 1937–62 2 23t2.14Coweeta 13/18 16 13 1937–62 2 23t2.15Coweeta 37/36a 44 49 1944–96 20 43t2.16Fernow 1/4a 30 39 1951–2001 6 44t2.17Fernow 7/4a 29 39 1957–2001 6 38t2.18Hubbard Brook 2/3a 16 42 1958–96 7 31t2.19Hubbard Brook 4/3a 36 42 1958–96 12 26t2.20Hubbard Brook 5/3a 22 42 1958–96 25 13t2.21
aResults from fourteen basin pairs are examined in detail.t2.22
XXXXXX JONES AND POST: SEASONAL AND SUCCESSIONAL STREAMFLOW
5 of 19
XXXXXX
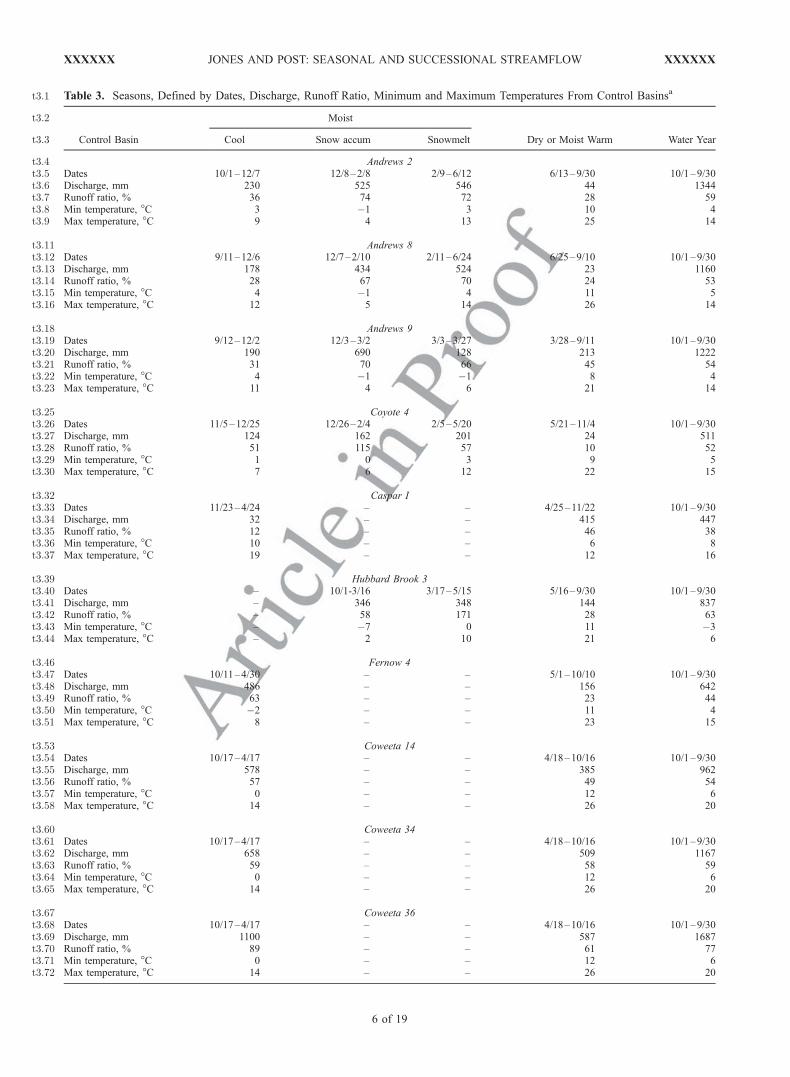
t3.1 Table 3. Seasons, Defined by Dates, Discharge, Runoff Ratio, Minimum and Maximum Temperatures From Control Basinsa
Control Basin
t3.2 Moist
Dry or Moist Warm Water YearCool Snow accum Snowmeltt3.3
Andrews 2t3.4Dates 10/1–12/7 12/8–2/8 2/9–6/12 6/13–9/30 10/1–9/30t3.5Discharge, mm 230 525 546 44 1344t3.6Runoff ratio, % 36 74 72 28 59t3.7Min temperature, �C 3 �1 3 10 4t3.8Max temperature, �C 9 4 13 25 14t3.9
Andrews 8t3.11Dates 9/11–12/6 12/7–2/10 2/11–6/24 6/25–9/10 10/1–9/30t3.12Discharge, mm 178 434 524 23 1160t3.13Runoff ratio, % 28 67 70 24 53t3.14Min temperature, �C 4 �1 4 11 5t3.15Max temperature, �C 12 5 14 26 14t3.16
Andrews 9t3.18Dates 9/12–12/2 12/3–3/2 3/3–3/27 3/28–9/11 10/1–9/30t3.19Discharge, mm 190 690 128 213 1222t3.20Runoff ratio, % 31 70 66 45 54t3.21Min temperature, �C 4 �1 �1 8 4t3.22Max temperature, �C 11 4 6 21 14t3.23
Coyote 4t3.25Dates 11/5–12/25 12/26–2/4 2/5–5/20 5/21–11/4 10/1–9/30t3.26Discharge, mm 124 162 201 24 511t3.27Runoff ratio, % 51 115 57 10 52t3.28Min temperature, �C 1 0 3 9 5t3.29Max temperature, �C 7 6 12 22 15t3.30
Caspar It3.32Dates 11/23–4/24 – – 4/25–11/22 10/1–9/30t3.33Discharge, mm 32 – – 415 447t3.34Runoff ratio, % 12 – – 46 38t3.35Min temperature, �C 10 – – 6 8t3.36Max temperature, �C 19 – – 12 16t3.37
Hubbard Brook 3t3.39Dates – 10/1-3/16 3/17–5/15 5/16–9/30 10/1–9/30t3.40Discharge, mm – 346 348 144 837t3.41Runoff ratio, % – 58 171 28 63t3.42Min temperature, �C – �7 0 11 �3t3.43Max temperature, �C – 2 10 21 6t3.44
Fernow 4t3.46Dates 10/11–4/30 – – 5/1–10/10 10/1–9/30t3.47Discharge, mm 486 – – 156 642t3.48Runoff ratio, % 63 – – 23 44t3.49Min temperature, �C �2 – – 11 4t3.50Max temperature, �C 8 – – 23 15t3.51
Coweeta 14t3.53Dates 10/17–4/17 – – 4/18–10/16 10/1–9/30t3.54Discharge, mm 578 – – 385 962t3.55Runoff ratio, % 57 – – 49 54t3.56Min temperature, �C 0 – – 12 6t3.57Max temperature, �C 14 – – 26 20t3.58
Coweeta 34t3.60Dates 10/17–4/17 – – 4/18–10/16 10/1–9/30t3.61Discharge, mm 658 – – 509 1167t3.62Runoff ratio, % 59 – – 58 59t3.63Min temperature, �C 0 – – 12 6t3.64Max temperature, �C 14 – – 26 20t3.65
Coweeta 36t3.67Dates 10/17–4/17 – – 4/18–10/16 10/1–9/30t3.68Discharge, mm 1100 – – 587 1687t3.69Runoff ratio, % 89 – – 61 77t3.70Min temperature, �C 0 – – 12 6t3.71Max temperature, �C 14 – – 26 20t3.72
6 of 19
XXXXXX JONES AND POST: SEASONAL AND SUCCESSIONAL STREAMFLOW XXXXXX
326 relative streamflow changes were tested for independence to327 warm periods. For each period k, absolute streamflow328 changes were defined as all days i for which the 15-day329 smoothed values of
fik > s ln aij� ��
331 where s[ln(aij)] was the back-transformed, smoothed332 standard deviation of aij for all years j in the period of333 record. Thus nabs,k is the count of days i in the water year for334 which fik, the absolute change in the treated/control335 relationship days in period k, exceeds the variation in the336 entire record of streamflow on that day at the control337 watershed. Relative streamflow changes were defined as all338 days i for which the 15-day smoothed values of
dik > 25
339 Thus nrel,k is a count of days i in the water year on which the341 treated/control relationship in streamflow in period k342 changed by more than 25%.343 [20] Counts of days with absolute and relative changes344 (nabs,k, nrel,k) were subdivided by season. Every day of the345 water year at each control basin was classified into one of346 four seasons based on soil moisture, temperature, and347 snowmelt (Table 3). Two seasons occurred at basins lacking348 snowpacks: (1) warm (and dry at conifer basins, moist at349 deciduous basins), and (2) moist, cool. Basins with snow-350 packs had two additional seasons: (3) moist, snow accumu-351 lation and (4) moist, snowmelt. Seasons were defined based352 on mean values over the entire period of record at each353 control basin for each day i of minimum and maximum354 temperatures (Tmin,i, Tmax,i), precipitation (Pi), streamflow355 (Qi), and snow water equivalent (Si). Warm, moist periods356 were defined as all days i for which Tmin,i > T*min, Pi > P*,357 and Qi > Q*, where T*min is a temperature threshold of 5�C358 for deciduous forests and 0.1�C for conifer forests, and P*
359and Q* are moisture thresholds of 2 mm and 0.5 mm,360respectively. Warm periods were defined as all days i for361which Tmin,i > T*min, and (for warm, dry periods at conifer362basins) Pi < P* and Qi < Q*. Periods in which snowpacks363were present were divided into days for which Si > Si-1364(accumulation) or Si < Si-1 (melt).365[21] Hypotheses involving succession were tested by366linear regression [Ramsay and Schaefer, 1996]. Response367variables were the sum of daily streamflow changes fik by368season and for the whole water year, and these sums as369percents of seasonal or annual streamflow (Table 3). The370independent variable was the difference in age between the371control and treated basin (Table 1). Data points in regres-372sions were coded by basin types: (1) conifer, seasonal snow;373(2) conifer, transient or no snow; (3) deciduous, seasonal374snow; (4) deciduous, transient or no snow (Table 4).
3765. Results
3775.1. Summer Precipitaton and Snowmelt Effects on378Daily Streamflow
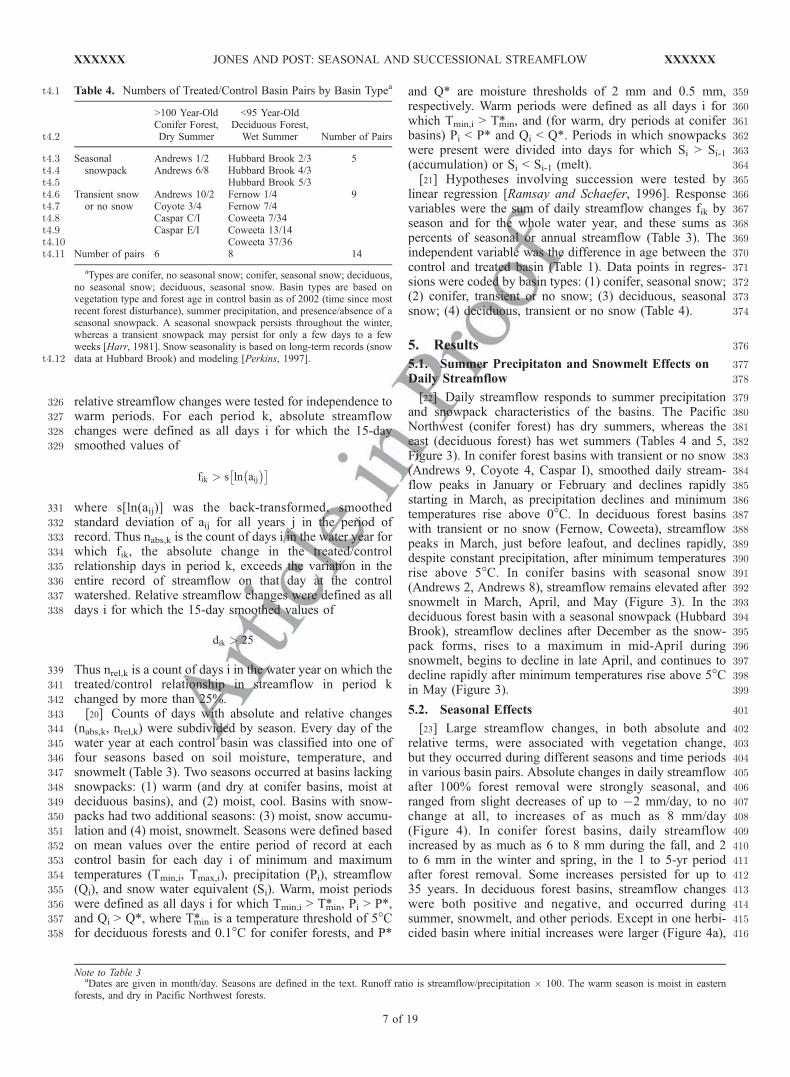
379[22] Daily streamflow responds to summer precipitation380and snowpack characteristics of the basins. The Pacific381Northwest (conifer forest) has dry summers, whereas the382east (deciduous forest) has wet summers (Tables 4 and 5,383Figure 3). In conifer forest basins with transient or no snow384(Andrews 9, Coyote 4, Caspar I), smoothed daily stream-385flow peaks in January or February and declines rapidly386starting in March, as precipitation declines and minimum387temperatures rise above 0�C. In deciduous forest basins388with transient or no snow (Fernow, Coweeta), streamflow389peaks in March, just before leafout, and declines rapidly,390despite constant precipitation, after minimum temperatures391rise above 5�C. In conifer basins with seasonal snow392(Andrews 2, Andrews 8), streamflow remains elevated after393snowmelt in March, April, and May (Figure 3). In the394deciduous forest basin with a seasonal snowpack (Hubbard395Brook), streamflow declines after December as the snow-396pack forms, rises to a maximum in mid-April during397snowmelt, begins to decline in late April, and continues to398decline rapidly after minimum temperatures rise above 5�C399in May (Figure 3).
4015.2. Seasonal Effects
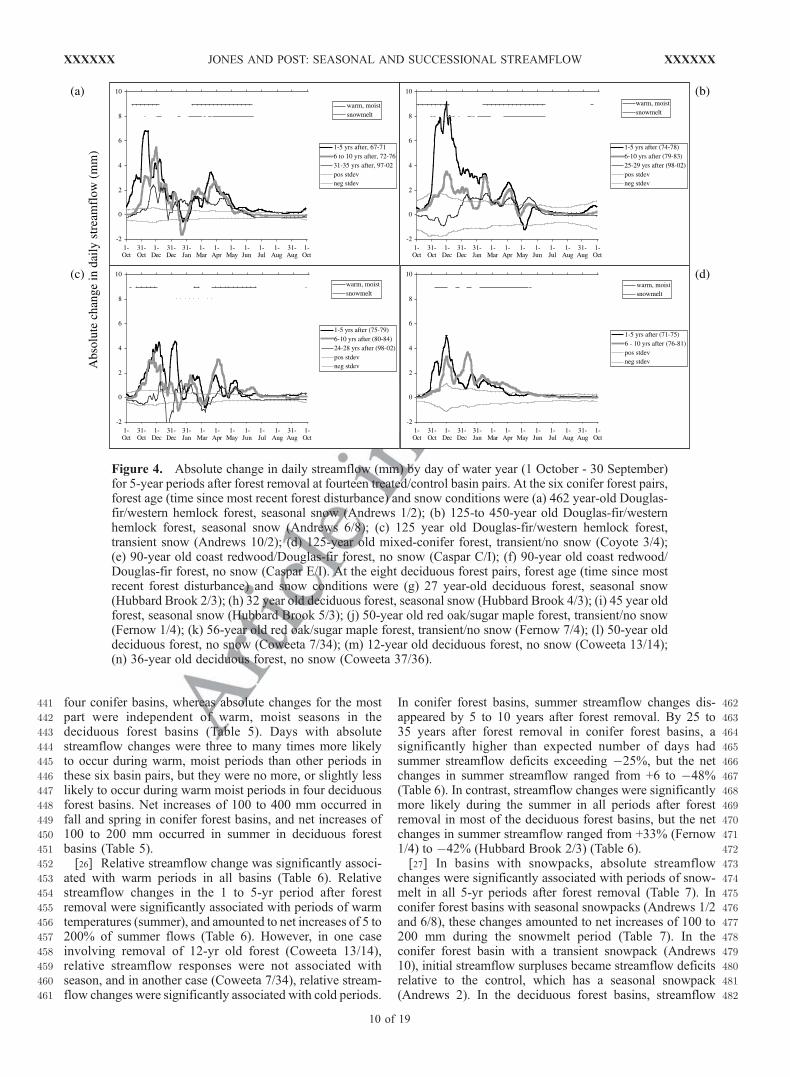
402[23] Large streamflow changes, in both absolute and403relative terms, were associated with vegetation change,404but they occurred during different seasons and time periods405in various basin pairs. Absolute changes in daily streamflow406after 100% forest removal were strongly seasonal, and407ranged from slight decreases of up to �2 mm/day, to no408change at all, to increases of as much as 8 mm/day409(Figure 4). In conifer forest basins, daily streamflow410increased by as much as 6 to 8 mm during the fall, and 2411to 6 mm in the winter and spring, in the 1 to 5-yr period412after forest removal. Some increases persisted for up to41335 years. In deciduous forest basins, streamflow changes414were both positive and negative, and occurred during415summer, snowmelt, and other periods. Except in one herbi-416cided basin where initial increases were larger (Figure 4a),
Note to Table 3aDates are given in month/day. Seasons are defined in the text. Runoff ratio is streamflow/precipitation � 100. The warm season is moist in eastern
forests, and dry in Pacific Northwest forests.
t4.1 Table 4. Numbers of Treated/Control Basin Pairs by Basin Typea
>100 Year-OldConifer Forest,Dry Summer
<95 Year-OldDeciduous Forest,
Wet Summer Number of Pairst4.2
Seasonalsnowpack
Andrews 1/2 Hubbard Brook 2/3 5t4.3Andrews 6/8 Hubbard Brook 4/3t4.4
Hubbard Brook 5/3t4.5Transient snowor no snow
Andrews 10/2 Fernow 1/4 9t4.6Coyote 3/4 Fernow 7/4t4.7Caspar C/I Coweeta 7/34t4.8Caspar E/I Coweeta 13/14t4.9
Coweeta 37/36t4.10Number of pairs 6 8 14t4.11
aTypes are conifer, no seasonal snow; conifer, seasonal snow; deciduous,no seasonal snow; deciduous, seasonal snow. Basin types are based onvegetation type and forest age in control basin as of 2002 (time since mostrecent forest disturbance), summer precipitation, and presence/absence of aseasonal snowpack. A seasonal snowpack persists throughout the winter,whereas a transient snowpack may persist for only a few days to a fewweeks [Harr, 1981]. Snow seasonality is based on long-term records (snowdata at Hubbard Brook) and modeling [Perkins, 1997].t4.12
XXXXXX JONES AND POST: SEASONAL AND SUCCESSIONAL STREAMFLOW
7 of 19
XXXXXX
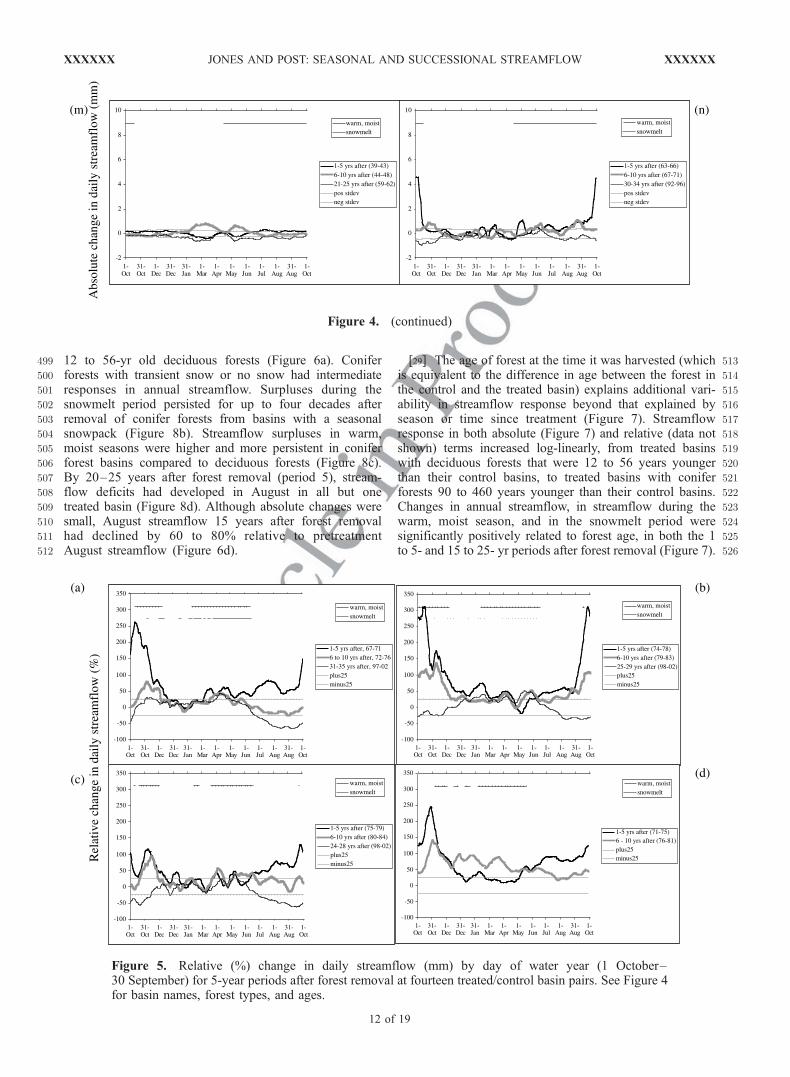
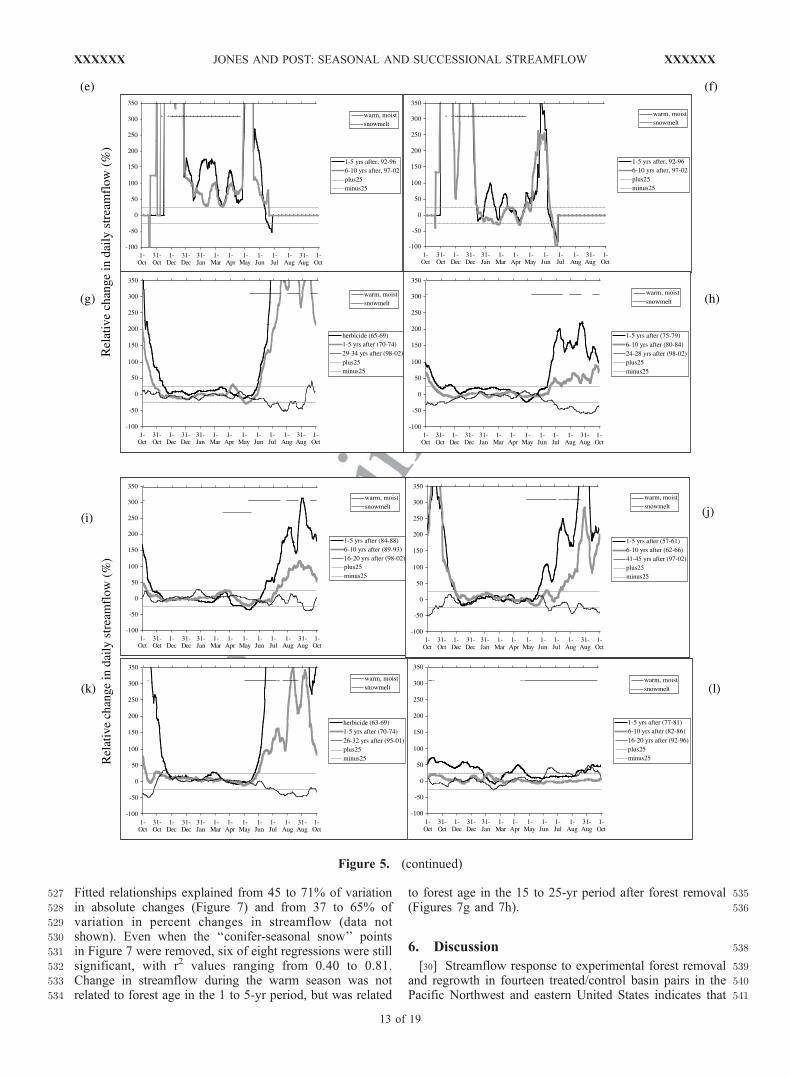
417 daily streamflow in deciduous basins increased by no more418 than 2 to 3 mm in the 1 to 5-yr period after forest removal.419 After a decade of forest regrowth, streamflow surpluses420 became deficits in several deciduous basins.421 [24] Relative changes in daily streamflow after 100%422 forest removal also were strongly seasonal, and ranged423 from initial increases of a few tens to hundreds of percent424 (Figure 5). In conifer forest basins, daily streamflow in-425 creased by several hundred percent during the late summer/426 early fall (and late spring, at Caspar Creek, but results are427 affected by missing data) in the 1 to 5-yr period after forest428 removal. By 25 to 35 years after forest removal, maximum
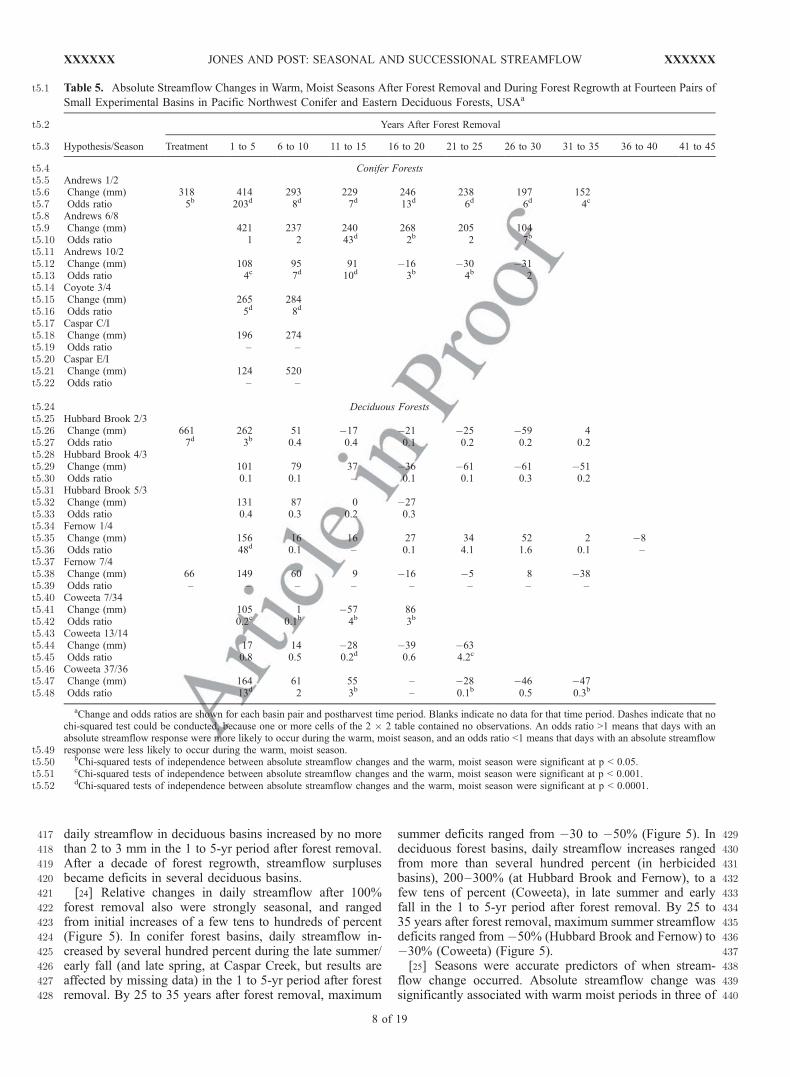
429summer deficits ranged from �30 to �50% (Figure 5). In430deciduous forest basins, daily streamflow increases ranged431from more than several hundred percent (in herbicided432basins), 200–300% (at Hubbard Brook and Fernow), to a433few tens of percent (Coweeta), in late summer and early434fall in the 1 to 5-yr period after forest removal. By 25 to43535 years after forest removal, maximum summer streamflow436deficits ranged from �50% (Hubbard Brook and Fernow) to437�30% (Coweeta) (Figure 5).438[25] Seasons were accurate predictors of when stream-439flow change occurred. Absolute streamflow change was440significantly associated with warm moist periods in three of
t5.1 Table 5. Absolute Streamflow Changes in Warm, Moist Seasons After Forest Removal and During Forest Regrowth at Fourteen Pairs of
Small Experimental Basins in Pacific Northwest Conifer and Eastern Deciduous Forests, USAa
Hypothesis/Season
Years After Forest Removalt5.2
Treatment 1 to 5 6 to 10 11 to 15 16 to 20 21 to 25 26 to 30 31 to 35 36 to 40 41 to 45t5.3
Conifer Forestst5.4Andrews 1/2t5.5Change (mm) 318 414 293 229 246 238 197 152t5.6Odds ratio 5b 203d 8d 7d 13d 6d 6d 4ct5.7Andrews 6/8t5.8Change (mm) 421 237 240 268 205 104t5.9Odds ratio 1 2 43d 2b 2 7bt5.10Andrews 10/2t5.11Change (mm) 108 95 91 �16 �30 �31t5.12Odds ratio 4c 7d 10d 3b 4b 2t5.13Coyote 3/4t5.14Change (mm) 265 284t5.15Odds ratio 5d 8dt5.16Caspar C/It5.17Change (mm) 196 274t5.18Odds ratio – –t5.19Caspar E/It5.20Change (mm) 124 520t5.21Odds ratio – –t5.22
Deciduous Forestst5.24Hubbard Brook 2/3t5.25Change (mm) 661 262 51 �17 �21 �25 �59 4t5.26Odds ratio 7d 3b 0.4 0.4 0.1 0.2 0.2 0.2t5.27Hubbard Brook 4/3t5.28Change (mm) 101 79 37 �36 �61 �61 �51t5.29Odds ratio 0.1 0.1 – 0.1 0.1 0.3 0.2t5.30Hubbard Brook 5/3t5.31Change (mm) 131 87 0 �27t5.32Odds ratio 0.4 0.3 0.2 0.3t5.33Fernow 1/4t5.34Change (mm) 156 16 16 27 34 52 2 �8t5.35Odds ratio 48d 0.1 – 0.1 4.1 1.6 0.1 –t5.36Fernow 7/4t5.37Change (mm) 66 149 60 9 �16 �5 8 �38t5.38Odds ratio – – – – – – – –t5.39Coweeta 7/34t5.40Change (mm) 105 1 �57 86t5.41Odds ratio 0.2c 0.1b 4b 3bt5.42Coweeta 13/14t5.43Change (mm) 17 14 �28 �39 �63t5.44Odds ratio 0.8 0.5 0.2d 0.6 4.2ct5.45Coweeta 37/36t5.46Change (mm) 164 61 55 – �28 �46 �47t5.47Odds ratio 13d 2 3b – 0.1b 0.5 0.3bt5.48
aChange and odds ratios are shown for each basin pair and postharvest time period. Blanks indicate no data for that time period. Dashes indicate that nochi-squared test could be conducted, because one or more cells of the 2 � 2 table contained no observations. An odds ratio >1 means that days with anabsolute streamflow response were more likely to occur during the warm, moist season, and an odds ratio <1 means that days with an absolute streamflowresponse were less likely to occur during the warm, moist season.t5.49
bChi-squared tests of independence between absolute streamflow changes and the warm, moist season were significant at p < 0.05.t5.50cChi-squared tests of independence between absolute streamflow changes and the warm, moist season were significant at p < 0.001.t5.51dChi-squared tests of independence between absolute streamflow changes and the warm, moist season were significant at p < 0.0001.t5.52
8 of 19
XXXXXX JONES AND POST: SEASONAL AND SUCCESSIONAL STREAMFLOW XXXXXX
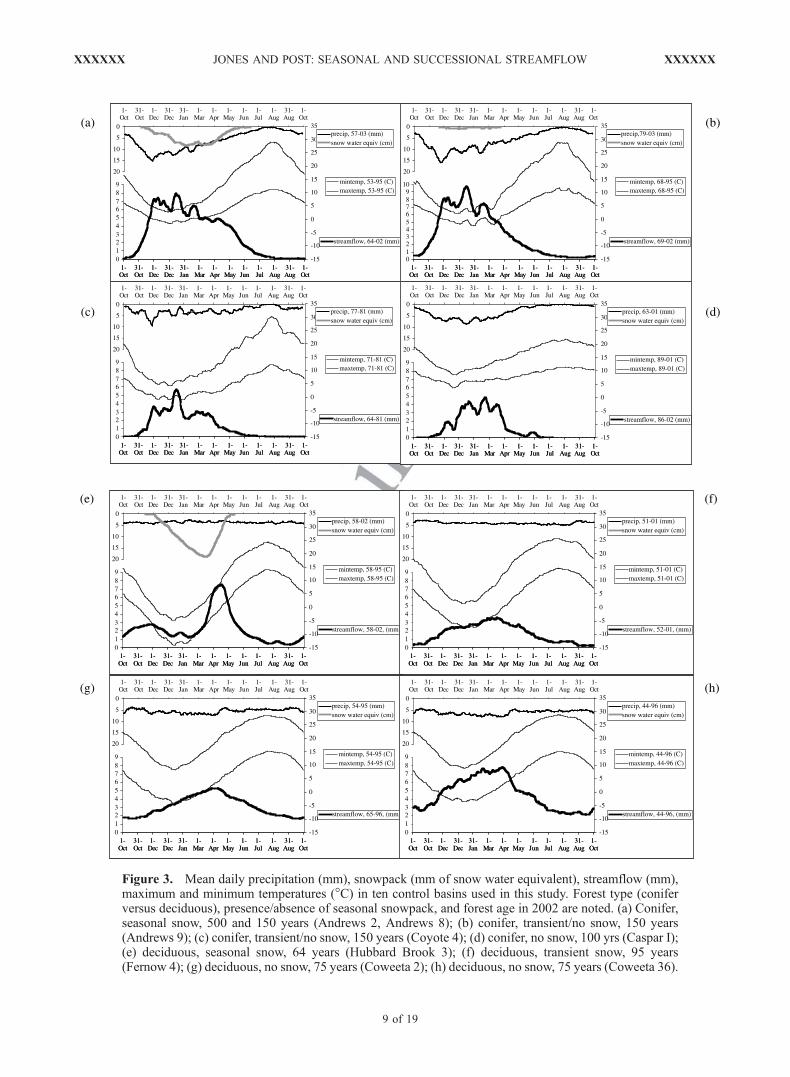
Figure 3. Mean daily precipitation (mm), snowpack (mm of snow water equivalent), streamflow (mm),maximum and minimum temperatures (�C) in ten control basins used in this study. Forest type (coniferversus deciduous), presence/absence of seasonal snowpack, and forest age in 2002 are noted. (a) Conifer,seasonal snow, 500 and 150 years (Andrews 2, Andrews 8); (b) conifer, transient/no snow, 150 years(Andrews 9); (c) conifer, transient/no snow, 150 years (Coyote 4); (d) conifer, no snow, 100 yrs (Caspar I);(e) deciduous, seasonal snow, 64 years (Hubbard Brook 3); (f) deciduous, transient snow, 95 years(Fernow 4); (g) deciduous, no snow, 75 years (Coweeta 2); (h) deciduous, no snow, 75 years (Coweeta 36).
XXXXXX JONES AND POST: SEASONAL AND SUCCESSIONAL STREAMFLOW
9 of 19
XXXXXX
441 four conifer basins, whereas absolute changes for the most442 part were independent of warm, moist seasons in the443 deciduous forest basins (Table 5). Days with absolute444 streamflow changes were three to many times more likely445 to occur during warm, moist periods than other periods in446 these six basin pairs, but they were no more, or slightly less447 likely to occur during warm moist periods in four deciduous448 forest basins. Net increases of 100 to 400 mm occurred in449 fall and spring in conifer forest basins, and net increases of450 100 to 200 mm occurred in summer in deciduous forest451 basins (Table 5).452 [26] Relative streamflow change was significantly associ-453 ated with warm periods in all basins (Table 6). Relative454 streamflow changes in the 1 to 5-yr period after forest455 removal were significantly associated with periods of warm456 temperatures (summer), and amounted to net increases of 5 to457 200% of summer flows (Table 6). However, in one case458 involving removal of 12-yr old forest (Coweeta 13/14),459 relative streamflow responses were not associated with460 season, and in another case (Coweeta 7/34), relative stream-461 flow changes were significantly associated with cold periods.
462In conifer forest basins, summer streamflow changes dis-463appeared by 5 to 10 years after forest removal. By 25 to46435 years after forest removal in conifer forest basins, a465significantly higher than expected number of days had466summer streamflow deficits exceeding �25%, but the net467changes in summer streamflow ranged from +6 to �48%468(Table 6). In contrast, streamflow changes were significantly469more likely during the summer in all periods after forest470removal in most of the deciduous forest basins, but the net471changes in summer streamflow ranged from +33% (Fernow4721/4) to �42% (Hubbard Brook 2/3) (Table 6).473[27] In basins with snowpacks, absolute streamflow474changes were significantly associated with periods of snow-475melt in all 5-yr periods after forest removal (Table 7). In476conifer forest basins with seasonal snowpacks (Andrews 1/2477and 6/8), these changes amounted to net increases of 100 to478200 mm during the snowmelt period (Table 7). In the479conifer forest basin with a transient snowpack (Andrews48010), initial streamflow surpluses became streamflow deficits481relative to the control, which has a seasonal snowpack482(Andrews 2). In the deciduous forest basins, streamflow
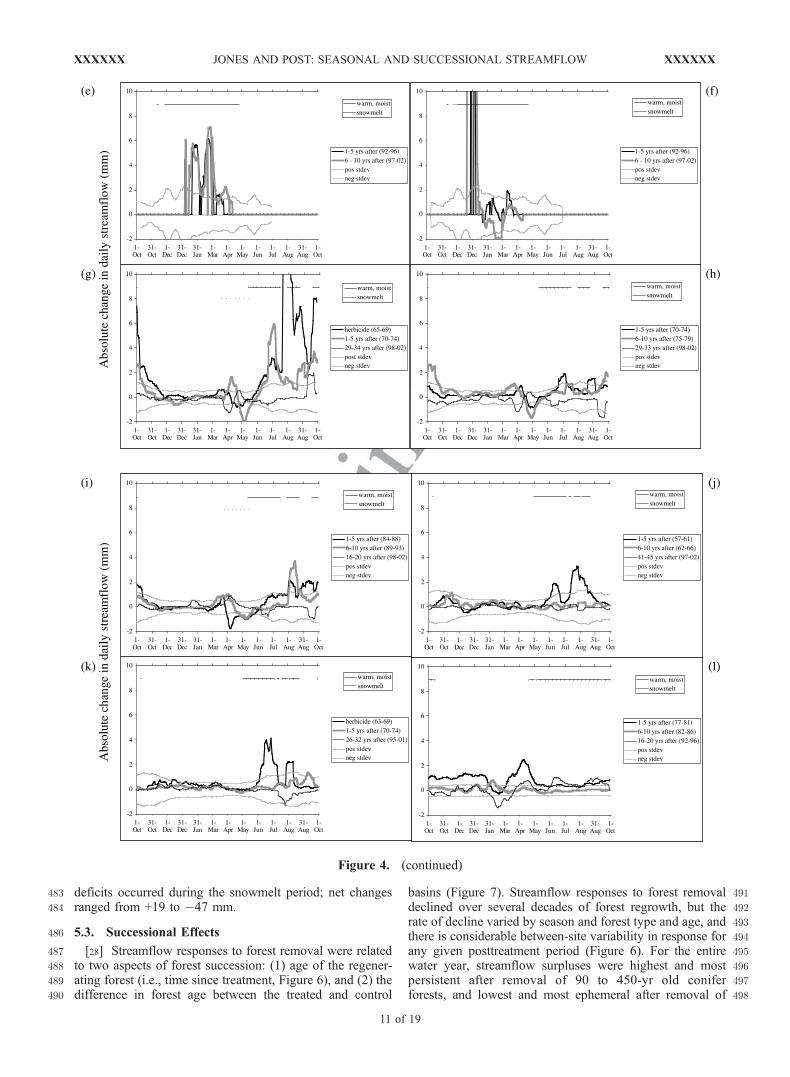
Figure 4. Absolute change in daily streamflow (mm) by day of water year (1 October - 30 September)for 5-year periods after forest removal at fourteen treated/control basin pairs. At the six conifer forest pairs,forest age (time since most recent forest disturbance) and snow conditions were (a) 462 year-old Douglas-fir/western hemlock forest, seasonal snow (Andrews 1/2); (b) 125-to 450-year old Douglas-fir/westernhemlock forest, seasonal snow (Andrews 6/8); (c) 125 year old Douglas-fir/western hemlock forest,transient snow (Andrews 10/2); (d) 125-year old mixed-conifer forest, transient/no snow (Coyote 3/4);(e) 90-year old coast redwood/Douglas-fir forest, no snow (Caspar C/I); (f) 90-year old coast redwood/Douglas-fir forest, no snow (Caspar E/I). At the eight deciduous forest pairs, forest age (time since mostrecent forest disturbance) and snow conditions were (g) 27 year-old deciduous forest, seasonal snow(Hubbard Brook 2/3); (h) 32 year old deciduous forest, seasonal snow (Hubbard Brook 4/3); (i) 45 year oldforest, seasonal snow (Hubbard Brook 5/3); (j) 50-year old red oak/sugar maple forest, transient/no snow(Fernow 1/4); (k) 56-year old red oak/sugar maple forest, transient/no snow (Fernow 7/4); (l) 50-year olddeciduous forest, no snow (Coweeta 7/34); (m) 12-year old deciduous forest, no snow (Coweeta 13/14);(n) 36-year old deciduous forest, no snow (Coweeta 37/36).
10 of 19
XXXXXX JONES AND POST: SEASONAL AND SUCCESSIONAL STREAMFLOW XXXXXX
483 deficits occurred during the snowmelt period; net changes484 ranged from +19 to �47 mm.
486 5.3. Successional Effects
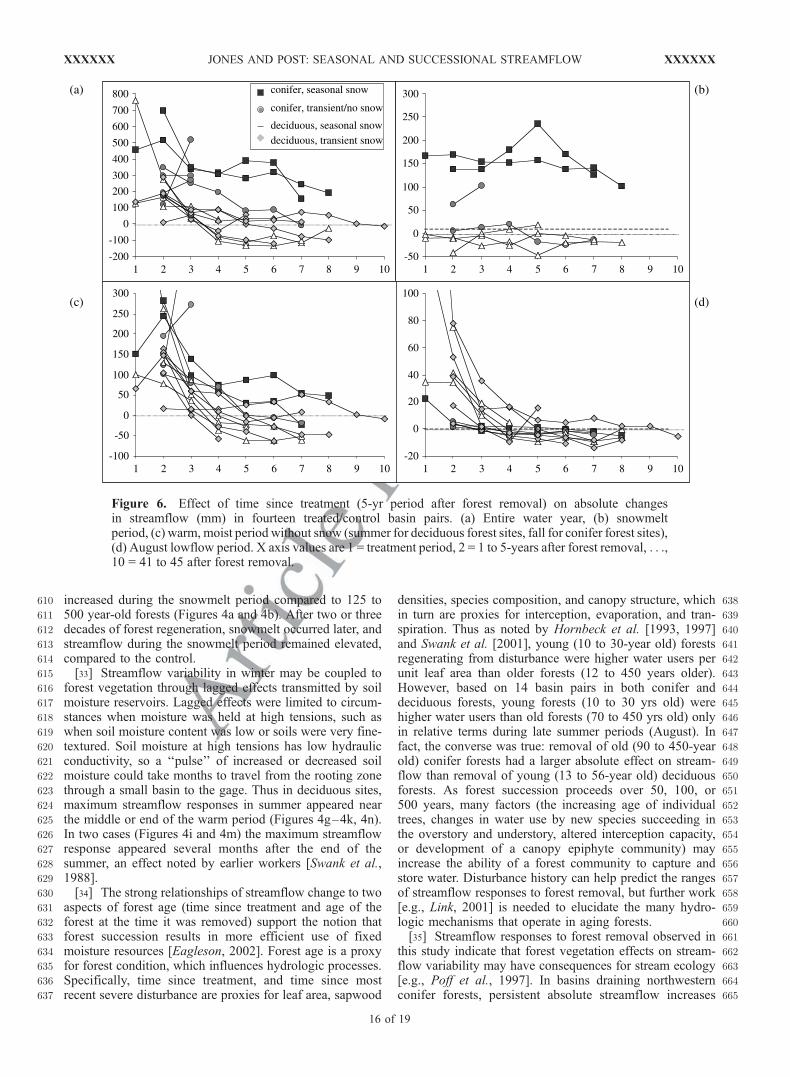
487 [28] Streamflow responses to forest removal were related488 to two aspects of forest succession: (1) age of the regener-489 ating forest (i.e., time since treatment, Figure 6), and (2) the490 difference in forest age between the treated and control
491basins (Figure 7). Streamflow responses to forest removal492declined over several decades of forest regrowth, but the493rate of decline varied by season and forest type and age, and494there is considerable between-site variability in response for495any given posttreatment period (Figure 6). For the entire496water year, streamflow surpluses were highest and most497persistent after removal of 90 to 450-yr old conifer498forests, and lowest and most ephemeral after removal of
Figure 4. (continued)
XXXXXX JONES AND POST: SEASONAL AND SUCCESSIONAL STREAMFLOW
11 of 19
XXXXXX
499 12 to 56-yr old deciduous forests (Figure 6a). Conifer500 forests with transient snow or no snow had intermediate501 responses in annual streamflow. Surpluses during the502 snowmelt period persisted for up to four decades after503 removal of conifer forests from basins with a seasonal504 snowpack (Figure 8b). Streamflow surpluses in warm,505 moist seasons were higher and more persistent in conifer506 forest basins compared to deciduous forests (Figure 8c).507 By 20–25 years after forest removal (period 5), stream-508 flow deficits had developed in August in all but one509 treated basin (Figure 8d). Although absolute changes were510 small, August streamflow 15 years after forest removal511 had declined by 60 to 80% relative to pretreatment512 August streamflow (Figure 6d).
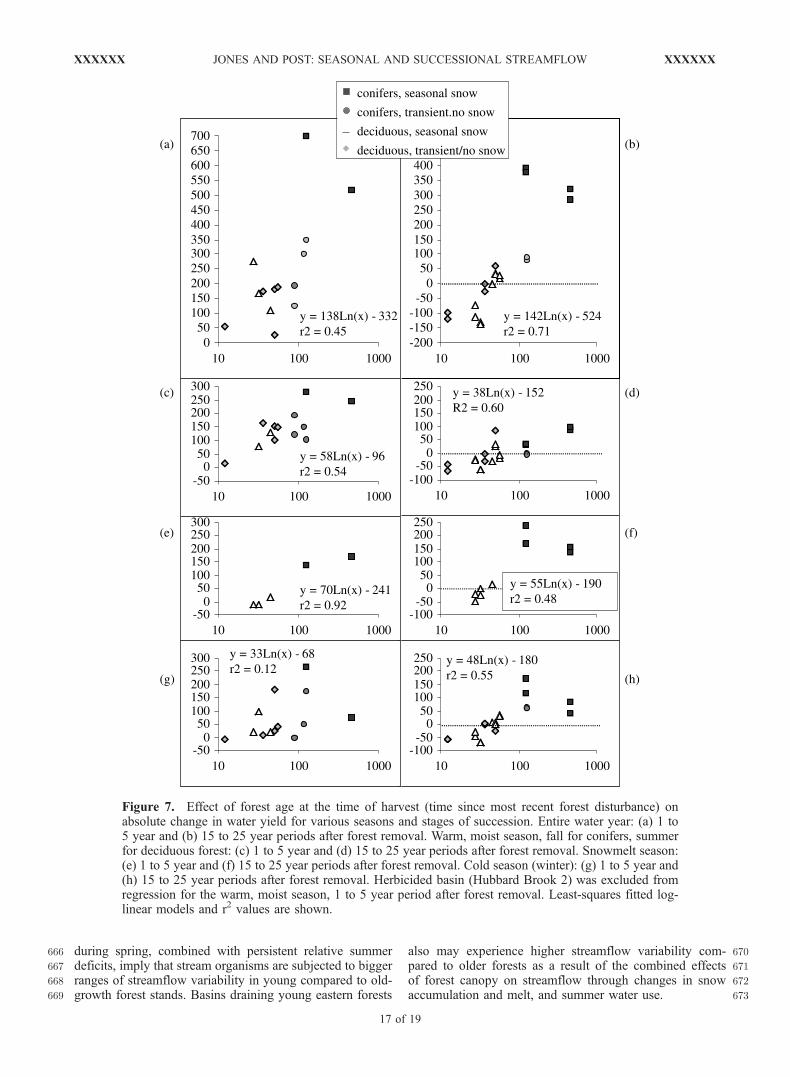
513[29] The age of forest at the time it was harvested (which514is equivalent to the difference in age between the forest in515the control and the treated basin) explains additional vari-516ability in streamflow response beyond that explained by517season or time since treatment (Figure 7). Streamflow518response in both absolute (Figure 7) and relative (data not519shown) terms increased log-linearly, from treated basins520with deciduous forests that were 12 to 56 years younger521than their control basins, to treated basins with conifer522forests 90 to 460 years younger than their control basins.523Changes in annual streamflow, in streamflow during the524warm, moist season, and in the snowmelt period were525significantly positively related to forest age, in both the 1526to 5- and 15 to 25- yr periods after forest removal (Figure 7).
Figure 4. (continued)
Figure 5. Relative (%) change in daily streamflow (mm) by day of water year (1 October–30 September) for 5-year periods after forest removal at fourteen treated/control basin pairs. See Figure 4for basin names, forest types, and ages.
12 of 19
XXXXXX JONES AND POST: SEASONAL AND SUCCESSIONAL STREAMFLOW XXXXXX
527 Fitted relationships explained from 45 to 71% of variation528 in absolute changes (Figure 7) and from 37 to 65% of529 variation in percent changes in streamflow (data not530 shown). Even when the ‘‘conifer-seasonal snow’’ points531 in Figure 7 were removed, six of eight regressions were still532 significant, with r2 values ranging from 0.40 to 0.81.533 Change in streamflow during the warm season was not534 related to forest age in the 1 to 5-yr period, but was related
535to forest age in the 15 to 25-yr period after forest removal536(Figures 7g and 7h).
5386. Discussion
539[30] Streamflow response to experimental forest removal540and regrowth in fourteen treated/control basin pairs in the541Pacific Northwest and eastern United States indicates that
Figure 5. (continued)
XXXXXX JONES AND POST: SEASONAL AND SUCCESSIONAL STREAMFLOW
13 of 19
XXXXXX
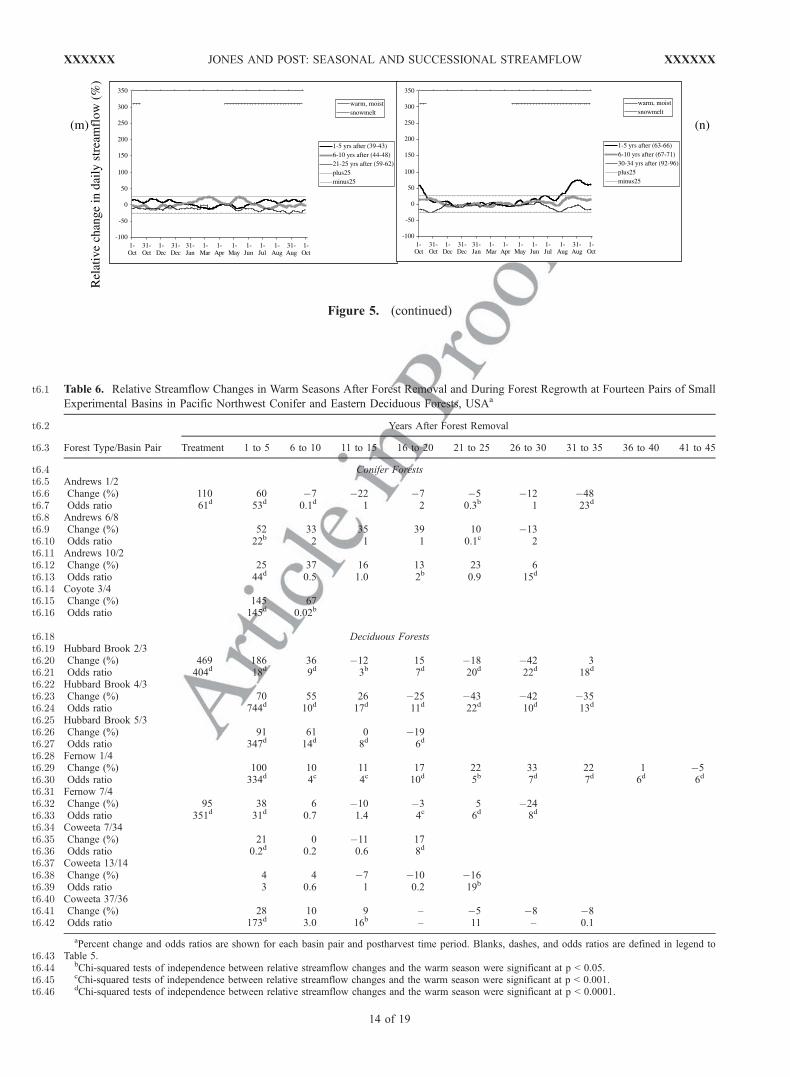
Figure 5. (continued)
t6.1 Table 6. Relative Streamflow Changes in Warm Seasons After Forest Removal and During Forest Regrowth at Fourteen Pairs of Small
Experimental Basins in Pacific Northwest Conifer and Eastern Deciduous Forests, USAa
Forest Type/Basin Pair
Years After Forest Removalt6.2
Treatment 1 to 5 6 to 10 11 to 15 16 to 20 21 to 25 26 to 30 31 to 35 36 to 40 41 to 45t6.3
Conifer Forestst6.4Andrews 1/2t6.5Change (%) 110 60 �7 �22 �7 �5 �12 �48t6.6Odds ratio 61d 53d 0.1d 1 2 0.3b 1 23dt6.7Andrews 6/8t6.8Change (%) 52 33 35 39 10 �13t6.9Odds ratio 22b 2 1 1 0.1c 2t6.10Andrews 10/2t6.11Change (%) 25 37 16 13 23 6t6.12Odds ratio 44d 0.5 1.0 2b 0.9 15dt6.13Coyote 3/4t6.14Change (%) 145 67t6.15Odds ratio 145d 0.02bt6.16
Deciduous Forestst6.18Hubbard Brook 2/3t6.19Change (%) 469 186 36 �12 15 �18 �42 3t6.20Odds ratio 404d 18d 9d 3b 7d 20d 22d 18dt6.21Hubbard Brook 4/3t6.22Change (%) 70 55 26 �25 �43 �42 �35t6.23Odds ratio 744d 10d 17d 11d 22d 10d 13dt6.24Hubbard Brook 5/3t6.25Change (%) 91 61 0 �19t6.26Odds ratio 347d 14d 8d 6dt6.27Fernow 1/4t6.28Change (%) 100 10 11 17 22 33 22 1 �5t6.29Odds ratio 334d 4c 4c 10d 5b 7d 7d 6d 6dt6.30Fernow 7/4t6.31Change (%) 95 38 6 �10 �3 5 �24t6.32Odds ratio 351d 31d 0.7 1.4 4c 6d 8dt6.33Coweeta 7/34t6.34Change (%) 21 0 �11 17t6.35Odds ratio 0.2d 0.2 0.6 8dt6.36Coweeta 13/14t6.37Change (%) 4 4 �7 �10 �16t6.38Odds ratio 3 0.6 1 0.2 19bt6.39Coweeta 37/36t6.40Change (%) 28 10 9 – �5 �8 �8t6.41Odds ratio 173d 3.0 16b – 11 – 0.1t6.42
aPercent change and odds ratios are shown for each basin pair and postharvest time period. Blanks, dashes, and odds ratios are defined in legend toTable 5.t6.43
bChi-squared tests of independence between relative streamflow changes and the warm season were significant at p < 0.05.t6.44cChi-squared tests of independence between relative streamflow changes and the warm season were significant at p < 0.001.t6.45dChi-squared tests of independence between relative streamflow changes and the warm season were significant at p < 0.0001.t6.46
14 of 19
XXXXXX JONES AND POST: SEASONAL AND SUCCESSIONAL STREAMFLOW XXXXXX
542 forest effects on streamflow are strongly seasonal, and543 depend upon the age or successional stage of the forest.544 The analysis involved a complete re-analysis of primary545 data using a novel approach to paired-basin analysis, rather546 than relying upon reviews or meta-analyses of published547 studies as in Bosch and Hewlett [1982] or Robinson et al.548 [2003]. Our findings may differ slightly from published549 values for specific sites [Rothacher, 1970, 1975; Douglass550 and Swank, 1972; Harr et al., 1979, 1982; Swift and Swank,551 1981; Hornbeck et al., 1993, 1997; Martin et al., 2000;552 Lewis et al., 2001; Swank et al., 2001] because of differ-553 ences in watershed pairing, use of daily average flows, and554 log-transformation of data. The results are relevant to eco-555 physiology, global change modeling, and stream ecology as556 well as hydrology, and they highlight the future potential for557 paired basin experiments.558 [31] Atmospheric stresses (i.e., temperature, vapor pres-559 sure) and soil moisture stresses imposed on individual560 plants [e.g., Eagleson, 2002] scale up to influence stream-561 flow at the small watershed scale, producing streamflow562 responses to forest removal and regrowth that were con-563 centrated during seasons when moisture and temperature are564 conducive to evapotranspiration. Evapotranspiration565 depends upon (among other things) soil moisture, net566 interception, and evaporation from the canopy (Figure 1).567 Streamflow responses were larger in absolute terms after568 removal of conifer compared to deciduous forests, for569 basins with similar mean annual precipitation, confirming570 the site-specific work of Swank and Douglass [1974].571 Conifers are adapted to use water throughout the year, as572 long as soil moisture and temperatures are not limiting,573 whereas transpiration in deciduous trees is limited to periods574 when leaves are present. Plant-level differences between575 conifer and deciduous forests were accentuated at the basin
576scale in this study, because coniferous forests were older577than deciduous forests, and evapotranspiration from decid-578uous understory and early successional components of the579regenerating conifer stands was limited by dry summers580typical of these western sites.581[32] Changes in forest canopy interactions with the snow-582pack over the course of succession provide a possible583alternative mechanism for documented long-term changes584in snowmelt runoff [Hodgekins et al., 2003]. Seasonal585snowpack volume, and hence the snow water equivalent586available to melt in the spring, depends upon the balance of587additions and losses to sublimation and melt (Figure 1).588Removal of deciduous forest canopies increases the expo-589sure of cold snowpacks to winter sunlight in climates of590eastern forests, and characteristically dense regenerating591stands (e.g., of pin cherry [Marks, 1974] may intercept592more snow, enhancing sublimation and reducing snowpack593volume. Therefore in the first decade after removal of594deciduous forest canopies, snowmelt occurred earlier and595streamflow was reduced during the snowmelt period com-596pared to 40 to 60 yr-old forests (Figures 4g–4i). This effect597was reversed after two or three decades of forest regener-598ation, and snowmelt occurred later, but streamflow599remained reduced during the snowmelt period compared600to the control. In contrast, removal of conifer forest cano-601pies decreases interception and increases the exposure of602warm snowpacks to radiative heat losses, cooling mixed603rain/snow to snow, in climates of Pacific Northwest604forests [Harr, 1981]. Moreover, sparse regenerating stands605[Halpern, 1989; Acker et al., 2002] may intercept less snow.606All these factors enhance snow accumulation and increase607snowpack volume [Marks et al., 1998; Storck et al., 2002].608Therefore in the first decade after removal of conifer forest609canopies, snowmelt occurred earlier and streamflow was
t7.1 Table 7. Absolute Streamflow Changes in Snowmelt Periods After Forest Removal and During Forest Regrowth at Fourteen Pairs of
Small Experimental Basins in Pacific Northwest Conifer and Eastern Deciduous Forests, USAa
Forest Type/Basin Pair
Years After Forest Removalt7.2
Treatment 1 to 5 6 to 10 11 to 15 16 to 20 21 to 25 26 to 30 31 to 35 36 to 40 41 to 45t7.3
Conifer Forestst7.4Andrews 1/2t7.5Change (mm) 167 170 154 153 159 139 141 103t7.6Odds ratio 7b 11d 5d 8d 6d 4c 8d 7dt7.7Andrews 6/8t7.8Change (mm) 139 139 180 237 171 126t7.9Odds ratio 4c 4c 8d 9d 6d 12dt7.10Andrews 10/2t7.11Change (mm) 6 14 21 �17 �24 �14t7.12Odds ratio 4c 11d 4c 5d 9d 6dt7.13
Deciduous Forestst7.15Hubbard Brook 2/3t7.16Change (mm) �10 �8 �27 �17 �47 �19 �17 �18t7.17Odds ratio 0.7 12d 160d 91d 185d 60d 100d 75dt7.18Hubbard Brook 4/3t7.19Change (mm) �1 �12 �5 �25 1 �4 �13t7.20Odds ratio 172d 227d – 118d 73d 40d 60dt7.21Hubbard Brook 5/3t7.22Change (mm) �41 0 10 19t7.23Odds ratio 372d 384d 75d 40dt7.24
aChange and odds ratios are shown for each basin pair and postharvest time period. Blanks, dashes, and odds ratios are defined in legend to Table 5.t7.25bChi-squared tests of independence between absolute streamflow changes and the snowmelt season were significant at p < 0.05.t7.26cChi-squared tests of independence between absolute streamflow changes and the snowmelt season were significant at p < 0.001.t7.27dChi-squared tests of independence between absolute streamflow changes and the snowmelt season were significant at p < 0.0001.t7.28
XXXXXX JONES AND POST: SEASONAL AND SUCCESSIONAL STREAMFLOW
15 of 19
XXXXXX
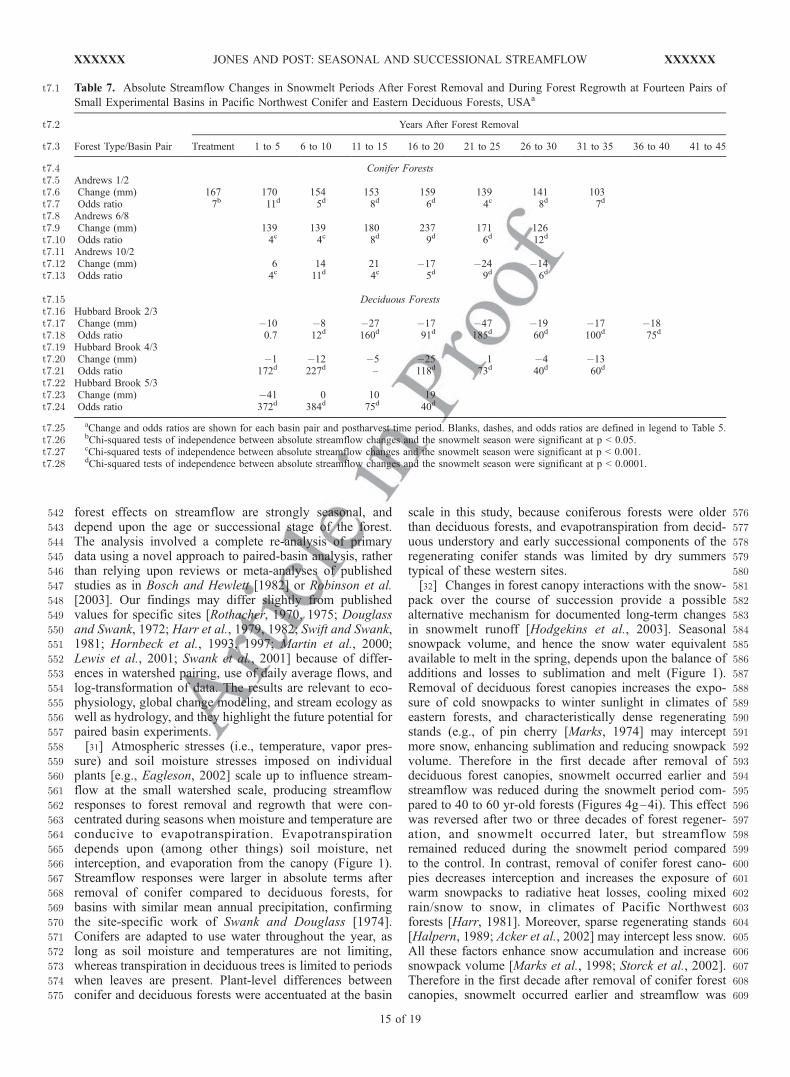
610 increased during the snowmelt period compared to 125 to611 500 year-old forests (Figures 4a and 4b). After two or three612 decades of forest regeneration, snowmelt occurred later, and613 streamflow during the snowmelt period remained elevated,614 compared to the control.615 [33] Streamflow variability in winter may be coupled to616 forest vegetation through lagged effects transmitted by soil617 moisture reservoirs. Lagged effects were limited to circum-618 stances when moisture was held at high tensions, such as619 when soil moisture content was low or soils were very fine-620 textured. Soil moisture at high tensions has low hydraulic621 conductivity, so a ‘‘pulse’’ of increased or decreased soil622 moisture could take months to travel from the rooting zone623 through a small basin to the gage. Thus in deciduous sites,624 maximum streamflow responses in summer appeared near625 the middle or end of the warm period (Figures 4g–4k, 4n).626 In two cases (Figures 4i and 4m) the maximum streamflow627 response appeared several months after the end of the628 summer, an effect noted by earlier workers [Swank et al.,629 1988].630 [34] The strong relationships of streamflow change to two631 aspects of forest age (time since treatment and age of the632 forest at the time it was removed) support the notion that633 forest succession results in more efficient use of fixed634 moisture resources [Eagleson, 2002]. Forest age is a proxy635 for forest condition, which influences hydrologic processes.636 Specifically, time since treatment, and time since most637 recent severe disturbance are proxies for leaf area, sapwood
638densities, species composition, and canopy structure, which639in turn are proxies for interception, evaporation, and tran-640spiration. Thus as noted by Hornbeck et al. [1993, 1997]641and Swank et al. [2001], young (10 to 30-year old) forests642regenerating from disturbance were higher water users per643unit leaf area than older forests (12 to 450 years older).644However, based on 14 basin pairs in both conifer and645deciduous forests, young forests (10 to 30 yrs old) were646higher water users than old forests (70 to 450 yrs old) only647in relative terms during late summer periods (August). In648fact, the converse was true: removal of old (90 to 450-year649old) conifer forests had a larger absolute effect on stream-650flow than removal of young (13 to 56-year old) deciduous651forests. As forest succession proceeds over 50, 100, or652500 years, many factors (the increasing age of individual653trees, changes in water use by new species succeeding in654the overstory and understory, altered interception capacity,655or development of a canopy epiphyte community) may656increase the ability of a forest community to capture and657store water. Disturbance history can help predict the ranges658of streamflow responses to forest removal, but further work659[e.g., Link, 2001] is needed to elucidate the many hydro-660logic mechanisms that operate in aging forests.661[35] Streamflow responses to forest removal observed in662this study indicate that forest vegetation effects on stream-663flow variability may have consequences for stream ecology664[e.g., Poff et al., 1997]. In basins draining northwestern665conifer forests, persistent absolute streamflow increases
Figure 6. Effect of time since treatment (5-yr period after forest removal) on absolute changesin streamflow (mm) in fourteen treated/control basin pairs. (a) Entire water year, (b) snowmeltperiod, (c) warm, moist period without snow (summer for deciduous forest sites, fall for conifer forest sites),(d) August lowflow period. X axis values are 1 = treatment period, 2 = 1 to 5-years after forest removal, . . .,10 = 41 to 45 after forest removal.
16 of 19
XXXXXX JONES AND POST: SEASONAL AND SUCCESSIONAL STREAMFLOW XXXXXX
666 during spring, combined with persistent relative summer667 deficits, imply that stream organisms are subjected to bigger668 ranges of streamflow variability in young compared to old-669 growth forest stands. Basins draining young eastern forests
670also may experience higher streamflow variability com-671pared to older forests as a result of the combined effects672of forest canopy on streamflow through changes in snow673accumulation and melt, and summer water use.
Figure 7. Effect of forest age at the time of harvest (time since most recent forest disturbance) onabsolute change in water yield for various seasons and stages of succession. Entire water year: (a) 1 to5 year and (b) 15 to 25 year periods after forest removal. Warm, moist season, fall for conifers, summerfor deciduous forest: (c) 1 to 5 year and (d) 15 to 25 year periods after forest removal. Snowmelt season:(e) 1 to 5 year and (f) 15 to 25 year periods after forest removal. Cold season (winter): (g) 1 to 5 year and(h) 15 to 25 year periods after forest removal. Herbicided basin (Hubbard Brook 2) was excluded fromregression for the warm, moist season, 1 to 5 year period after forest removal. Least-squares fitted log-linear models and r2 values are shown.
XXXXXX JONES AND POST: SEASONAL AND SUCCESSIONAL STREAMFLOW
17 of 19
XXXXXX
674 [36] The methods used in this study represent a departure675 from prior work, and indicate the potential for continued676 analyses of paired-basin experiments.677 [37] 1. The treated/control relationship in paired-basin678 experiments, rather than a black and white one, can be679 viewed as a function of continuous, and continuously680 changing, differences between basins in vegetation struc-681 ture, composition, and climate. Thus multiple basins may be682 used as controls for a given treated basin, and the responses683 may be compared.684 [38] 2. Paired-basin records provide the opportunity to685 quantify and compare streamflow responses at multiple686 temporal scales, including storm events, seasons, succes-687 sional periods, and decadal climate change. Work is needed688 to examine how streamflow responses at seasonal and689 successional timescales, addressed in this study, interact690 with streamflow responses at the storm event scale [e.g.,691 Jones, 2000; Lewis et al., 2001], and at the scale of decadal692 climate change [e.g., Greenland et al., 2003].693 [39] 3. Small paired-basin experiments permit compari-694 son of streamflow responses across vegetation types and695 treatments, climates, and basin scales. This analysis, which696 was restricted to <100-ha, mountainous, temperate decidu-697 ous and conifer forest basins, could be extended with698 additional replicates of these basin types, or records from699 other climates, other treatments (e.g., fire), or other vegeta-700 tion types. The very high streamflow variability at basins of701 <20 ha may obscure some important streamflow changes, so702 records from larger basin scales should be included in703 analyses. Relevant data are available through Hydro-DB704 [Baker et al., 2000].705 [40] Prediction of streamflow from ungaged basins is a706 major ongiong challenge for hydrologists (see e.g., the PUB707 initiative, http://iahs.info). This study indicates that to some708 extent streamflow can be predicted from climate, forest type,709 and disturbance history effects on hydrologic processes. The710 approaches presented in this paper provide useful advances711 for understanding and prediction of hydrologic response.
712 [41] Acknowledgments. This research was supported by National713 Science Foundation grants DEB-95-26987 (LTER Intersite Hydrology),714 DEB-80-12162, BSR-85-14325, BSR-90-11663, and DEB-96-32921 (H. J.715 Andrews Long-term Ecological Research (LTER)); by NSF grants to the716 Coweeta and Hubbard Brook LTERs. The USDA Forest Service largely717 supports long-term streamflow and climate monitoring at the following718 sites: Andrews (Pacific Northwest Research Station), Caspar Creek (Pacific719 Southwest Research Station), Coweeta (Southern Research Station),720 Fernow, and Hubbard Brook (Northeastern Forest Experiment Station).721 The USDA Forest Service Washington office (D. Ryan) provided funding722 for the development of hydro-DB. Data and expertise were provided by723 the following USDA Forest Service personnel: C. Creel, G. Downing,724 R. Fredriksen, D. Henshaw, A. Levno, G. Lienkaemper, J. Moreau,725 S. Remillard, (Andrews); J. Lewis (Caspar); N. Gardiner, W. Swank,726 L. Swift (Coweeta); M. B. Adams (Fernow); and J. Campbell, J. Hornbeck,727 W. Martin (Hubbard Brook). We would like to thank J. J. Major and728 F. J. Swanson for helpful discussions. J. Hornbeck, J. Lewis, J. McDonnell,729 L. Reid, W. Swank, and two anonymous reviewers provided helpful730 comments on the manuscript.
731 References732 Acker, S. A., C. B. Halpern, M. E. Harmon, and C. T. Dyrness (2002),733 Trends in bole biomass accumulation, net primary production, and734 tree mortality in Pseudotsuga menziesii forests of contrasting age, Tree735 Physiol., 22, 213–217.736 Baker, K. S., B. J. Benson, D. L. Henshaw, D. Blodgett, J. H. Porter, and737 S. G. Stafford (2000), Evolution of a multisite network information738 system: The LTER information management paradigm, BioScience,739 50(11), 963–978.
740Berris, S. N., and R. D. Harr (1987), Comparative snow accumulation741and melt during rainfall in forested and clear-cut plots in the western742Cascades of Oregon, Water Resour. Res., 23(1), 135–142.743Beven, K. (2002), Toward an alternative blueprint for a physically based744digitally simulated hydrologic response modelling system, Hydrol. Pro-745cesses, 16, 189–206.746Bosch, J. M., and J. D. Hewlett (1982), A review of catchment experiments747to determine the effect of vegetation changes on water yield and evapo-748transpiration, J. Hydrol., 55, 3–23.749Day, F. P., Jr., D. L. Phillips, and C. D. Monk (1988), Forest communities750and patterns, in Forest hydrology and ecology at Coweeta, edited by751W. T. Swank and D. A. Crossley, pp. 141 –149, Springer-Verlag,752New York.753Douglass, J. E., and W. T. Swank (1972), Streamflow modification through754management of eastern forests, Res. Pap. SE-94, U.S. Dep. Agric. For.755Serv. Southeastern Exp. Stn., Asheville, N. C.756Douglass, J. E., and W. T. Swank (1975), Effects of management practices757on water quality and quantity: Coweeta Hydrologic Laboratory, North758Carolina, General Tech. Rep. NE-13, U.S. Dep. Agric. For. Serv. North-759east For. Exp. Stn., Asheville, N. C.760Douglass, J. E., and M. D. Hoover (1988), History of Coweeta, in Forest761hydrology and ecology at Coweeta, edited by W. T. Swank and D. A.762Crossley, pp. 17–31, Springer-Verlag, New York.763Eagleson, P. S. (2002), Ecohydrology: Darwinian expression of vegetation764form and function, Cambridge Univ. Press, New York.765Greenland, D., D. G. Goodin, and R. C. Smith (2003), Climate variability766and ecosystem response at long-term ecological research sites, Oxford767Univ. Press, New York.768Halpern, C. B. (1989), Early successional patterns of forest species: Inter-769actions of life history traits and disturbance, Ecology, 70, 704–720.770Harr, R. D. (1981), Some characteristics and consequences of snowmelt771during rainfall in western Oregon, J. Hydrol., 53, 277–304.772Harr, R. D. (1982), Fog drip in the Bull Run municipal watershed, Oregon,773Water Resour. Bull., 18(5), 785–789.774Harr, R. D., R. L. Fredriksen, and J. Rothacher (1979), Changes in stream-775flow following timber harvest in southwestern Oregon, Res. Pap. PNW-776249, U.S. For. Serv. Pacific Northwest Res. Stn., Corvallis, Oreg.777Harr, R. D., A. Levno, and R. Mersereau (1982), Streamflow changes after778logging 130-yr-old Douglas fir in two small watersheds, Water Resour.779Res., 18(3), 637–644.780Hodgekins, G. A., R. W. Dudley, and T. G. Huntington (2003), Changes in781the timing of high river flows in New England over the 20th century,782J. Hydrol., 278, 244–252.783Hornbeck, J. W., M. B. Adams, E. S. Corbett, E. S. Verry, and J. A. Lynch784(1993), Long-term impacts of forest treatments on water yield: A sum-785mary for northeastern USA, J. Hydrol., 150, 323–344.786Hornbeck, J. W., C. W. Martin, and C. Eagar (1997), Summary of water787yield experiments at Hubbard Brook Experimental Forest, New Hamp-788shire, Can. J. For. Res., 27, 2043–2052.789Jones, J. A. (2000), Hydrologic processes and peak discharge response to790forest removal, regrowth, and roads in 10 small experimental basins,791western Cascades, Oregon, Water Resour. Res., 36(9), 2621–2642.792Jones, J. A., and G. E. Grant (1996), Peak flow responses to clear-cutting793and roads in small and large basins, western Cascades, Oregon, Water794Resour. Res., 32(4), 959–974.795Jones, J. A., and F. J. Swanson (2001), Hydrologic inferences from com-796parisons among small basin experiments, Hydrol. Processes, 15, 2363–7972366.798Lewis, J., S. R. Mori, E. T. Keppeler, and R. R. Ziemer (2001), Impacts of799logging on storm peak flows, flow volumes, and suspended sediment800loads in Caspar Creek, California, in Land Use and Watersheds: Human801Influence on Hydrology and Geomorphology in Urban and Forest Areas,802Water Sci. and Appl. Ser., vol. 2, edited by M. S. Wigmosta and S. J.803Burges, pp 85–125, AGU, Washington, D. C.804Link, T. E. (2001), The water and energy dynamics of an old-growth805seasonal temperate rainforest, Ph.D. dissertation, Environ. Sci. Graduate806Program, Oreg. State Univ., Corvallis.807Marks, P. L. (1974), The role of pin cherry in the maintenance of stability in808northern hardwood ecosystems, Ecol. Monogr., 44, 73–88.809Marks, D., J. Kimball, D. Tingey, and T. Link (1998), The sensitivity of810snowmelt processes to climate conditions and forest cover during rain-811on-snow: A case study of the 1996 Pacific Northwest flood, Hydrol.812Processes, 12, 1569–1587.813Martin, C. W., J. W. Hornbeck, G. E. Likens, and D. C. Buso (2000),814Impacts of intensive harvesting on hydrology and nutrient dynamics of815northern hardwood forests, Can. J. For. Res., 57(Suppl. 2), 19–29.
18 of 19
XXXXXX JONES AND POST: SEASONAL AND SUCCESSIONAL STREAMFLOW XXXXXX
816 Perkins, R. M. (1997), Climate and physiographic controls on peakflow817 generation in the western Cascades, Oregon, Ph.D. dissertation, Dept. of818 Forest Science, Oreg. State Univ., Corvallis.819 Poff, N. L., J. D. Allan, M. B. Bain, J. R. Karr, K. L. Prestegaard, B. D.820 Richter, R. E. Sparks, and J. C. Stromberg (1997), The natural flow821 regime: A paradigm for river conservation and restoration, BioScience,822 47, 769–784.823 Post, D. A., and J. A. Jones (2001), Hydrologic regimes at four long-term824 ecological research sites in New Hampshire, North Carolina, Oregon, and825 Puerto Rico, Adv. Water Resour., 24, 1195–1210.826 Post, D. A., G. E. Grant, and J. A. Jones (1998), Ecological hydrology:827 Expanding opportunities in hydrologic sciences, Eos Trans. AGU,828 79(43), 517.829 Ramsay, F. L., and D. W. Schaefer (1996), The Statistical Sleuth, 742 pp.,830 Duxbury, Boston, Mass.831 Robinson, M., et al. (2003), Studies of the impact of forests on peak flows832 and baseflows: A European perspective, For. Ecol. Manage., 1186, 85–833 97.834 Rothacher, J. (1970), Increases in water yield following clear-cut logging in835 the Pacific Northwest, Water Resour. Res., 6(2), 653–658.836 Rothacher, J. (1975), Regimes of streamflow and their modification by837 logging, in Forest Land Uses and Environment, edited by J. T. Krygier838 and J. D. Hall, pp. 40–54, Oreg. State Univ. Press, Corvallis.839 Rothacher, J., C. T. Dyrness, and R. L. Fredriksen (1967), Hydrologic and840 related characteristics of three small watersheds in the Oregon Cascades,841 54 pp., U.S. Dep. Agric. For. Serv., Pacific Northwest For. and Range842 Exp. Stn., Ashville, N. C.843 Schwarz, P. A., T. J. Fahey, C. W. Martin, T. G. Siccama, and A. Bailey844 (2001), Structure and composition of three northern hardwood-conifer845 forests with different disturbance histories, For. Ecol. Manage., 144,846 201–212.
847Shafer, S. L., P. J. Bartlein, and R. S. Thompson (2001), Potential changes848in the distributions of Western North America tree and shrub taxa under849future climate scenarios, Ecosystems, 4, 200–215.850Storck, P., D. P. Lettenmaier, and S. M. Bolton (2002), Measurement of851snow interception and canopy effects on snow accumulation and melt in852a mountainous maritime climate, Oregon, United States, Water Resour.853Res., 38(11), 1223, doi:10.1029/2002WR001281.854Swank, W. T., and J. E. Douglass (1974), Streamflow greatly reduced by855converting deciduous hardwood stands to white pine, Science, 185, 857–856859.857Swank, W. T., L. W. Swift Jr., and J. E. Douglass (1988), Streamflow858changes associated with forest cutting, species conversions, and natural859disturbances, in Forest Hydrology and Ecology at Coweeta, edited by860W. T. Swank and D. A. Crossley, pp. 297–312, Springer-Verlag, New861York.862Swank, W. T., J. M. Vose, and K. J. Elliott (2001), Long-term hydrologic863and water quality responses following commercial clearcutting of mixed864hardwoods on a southern Appalachian catchment, For. Ecol. Manage.,865143, 163–178.866Swift, L. W., and W. T. Swank (1981), Long-term responses of streamflow867following clearcutting and regrowth, Hydrol. Sci. Bull., 26, 245–256.868Weisberg, P. J., and F. J. Swanson (2003), Regional synchroneity in wildfire869regimes of western Oregon and Washington, USA, For. Ecol. Manage.,870172, 17–28.
����������������������������872J. A. Jones, Department of Geosciences, Oregon State University,873Corvallis, OR 97331, USA. ([email protected])
874D. A. Post, CSIRO Land and Water, PMB PO Aitkenvale, Queensland8754814, Australia. ([email protected])
XXXXXX JONES AND POST: SEASONAL AND SUCCESSIONAL STREAMFLOW
19 of 19
XXXXXX