Spatial and seasonal shifts in bloomforming cyanobacteria ...
Upload
hoangkhuongCategory
view
217download
0
ARTICLE IN PRESS
0967-0645/$ - se
doi:10.1016/j.ds
�Correspondifax: 1 441 297 81
E-mail addre
Deep-Sea Research II 52 (2005) 3324–3343
www.elsevier.com/locate/dsr2
Seasonal and spatial distribution of particulate organic matter(POM) in the Chukchi and Beaufort Seas
Nicholas R. Batesa,�, Dennis A. Hansellb, S. Bradley Moranc, Louis A. Codispotid
aBermuda Biological Station for Research, Inc., 17 Biological Station Lane, Ferry Reach, Bermuda GE01, USAbRosenstiel School of Marine and Atmospheric Science, University of Miami, Miami, FL 33149, USAcGraduate School of Oceanography, University of Rhode Island, Narragansett, RI 02882-1197, USA
dUMCES, Horn Point Laboratory, 2020 Horns Point Road, P.O. Box 775, Cambridge, MD 21613, USA
Received 1 March 2005; accepted 9 June 2005
Abstract
As part of the Western Arctic Shelf–Basin Interactions (SBI) project, the production and fate of organic carbon and
nitrogen from the Chukchi and Beaufort Sea shelves were investigated during spring (5 May–15 June) and summer (15
July–25 August) cruises in 2002. Seasonal observations of suspended particulate organic carbon (POC) and nitrogen
(PON) and large-particle (453mm) size class suggest that there was a large accumulation of carbon (C) and nitrogen (N)
between spring and summer in the surface mixed layer due to high phytoplankton productivity. Considerable organic
matter appeared to be transported from the shelf into the Arctic Ocean basin in an elevated POC and PON layer at the top
of the upper halocline. Seasonal changes in the molar carbon:nitrogen (C:N) ratio of the suspended particulate organic
matter (POM) pool reflect a change in the quality of the organic material that was present and presumably being exported
to the sediment and to Arctic Ocean waters adjacent to the Chukchi and Beaufort Sea shelves. In spring, low particulate
C:N ratios (o6; i.e., N rich) were observed in nitrate-replete surface waters. By the summer, localized high particulate C:N
ratios (49; i.e., N-poor) were observed in nitrate-depleted surface waters. Low POC and inorganic nutrient concentrations
observed in the surface layer suggest that rates of primary, new and export production are low in the Canada Basin region
of the Arctic Ocean.
r 2005 Elsevier Ltd. All rights reserved.
Keywords: Ocean carbon cycle; Particulate matter; C:N stoichiometry; Chukchi Sea; Arctic Ocean
1. Introduction
The Arctic Ocean marine system has an impor-tant influence on global climate via its influenceon global ocean thermohaline (overturning) circula-tion (Aagaard and Carmack, 1989; Walsh and
e front matter r 2005 Elsevier Ltd. All rights reserved
r2.2005.10.003
ng author. Tel.: 1 441 236 5022;
43.
ss: [email protected] (N.R. Bates).
Chapman, 1990; Mysak et al., 1990; Hakkinen,1993). In addition, the sea-ice-albedo mechanismenhances the influence of the Arctic on globalclimate, making the Arctic particularly sensitive toglobal warming and to ecosystem changes asso-ciated with warming (Walsh et al., 1990; Moritz andPerovich, 1996; Grebmeier and Whitledge, 1996;Manabe and Stouffer, 2000).
The Arctic Ocean continental shelves are impor-tant as sites of biological primary productivity that
.
ARTICLE IN PRESSN.R. Bates et al. / Deep-Sea Research II 52 (2005) 3324–3343 3325
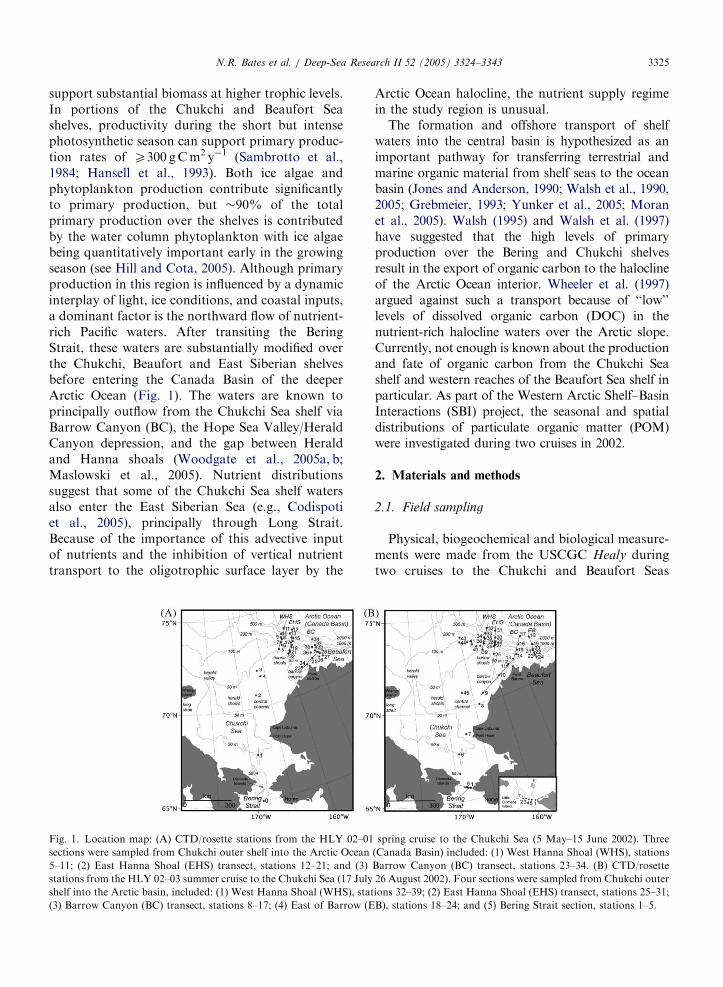
support substantial biomass at higher trophic levels.In portions of the Chukchi and Beaufort Seashelves, productivity during the short but intensephotosynthetic season can support primary produc-tion rates of X300 gCm2 y�1 (Sambrotto et al.,1984; Hansell et al., 1993). Both ice algae andphytoplankton production contribute significantlyto primary production, but �90% of the totalprimary production over the shelves is contributedby the water column phytoplankton with ice algaebeing quantitatively important early in the growingseason (see Hill and Cota, 2005). Although primaryproduction in this region is influenced by a dynamicinterplay of light, ice conditions, and coastal inputs,a dominant factor is the northward flow of nutrient-rich Pacific waters. After transiting the BeringStrait, these waters are substantially modified overthe Chukchi, Beaufort and East Siberian shelvesbefore entering the Canada Basin of the deeperArctic Ocean (Fig. 1). The waters are known toprincipally outflow from the Chukchi Sea shelf viaBarrow Canyon (BC), the Hope Sea Valley/HeraldCanyon depression, and the gap between Heraldand Hanna shoals (Woodgate et al., 2005a, b;Maslowski et al., 2005). Nutrient distributionssuggest that some of the Chukchi Sea shelf watersalso enter the East Siberian Sea (e.g., Codispotiet al., 2005), principally through Long Strait.Because of the importance of this advective inputof nutrients and the inhibition of vertical nutrienttransport to the oligotrophic surface layer by the
Fig. 1. Location map: (A) CTD/rosette stations from the HLY 02–01
sections were sampled from Chukchi outer shelf into the Arctic Ocean
5–11; (2) East Hanna Shoal (EHS) transect, stations 12–21; and (3)
stations from the HLY 02–03 summer cruise to the Chukchi Sea (17 July
shelf into the Arctic basin, included: (1) West Hanna Shoal (WHS), stat
(3) Barrow Canyon (BC) transect, stations 8–17; (4) East of Barrow (E
Arctic Ocean halocline, the nutrient supply regimein the study region is unusual.
The formation and offshore transport of shelfwaters into the central basin is hypothesized as animportant pathway for transferring terrestrial andmarine organic material from shelf seas to the oceanbasin (Jones and Anderson, 1990; Walsh et al., 1990,2005; Grebmeier, 1993; Yunker et al., 2005; Moranet al., 2005). Walsh (1995) and Walsh et al. (1997)have suggested that the high levels of primaryproduction over the Bering and Chukchi shelvesresult in the export of organic carbon to the haloclineof the Arctic Ocean interior. Wheeler et al. (1997)argued against such a transport because of ‘‘low’’levels of dissolved organic carbon (DOC) in thenutrient-rich halocline waters over the Arctic slope.Currently, not enough is known about the productionand fate of organic carbon from the Chukchi Seashelf and western reaches of the Beaufort Sea shelf inparticular. As part of the Western Arctic Shelf–BasinInteractions (SBI) project, the seasonal and spatialdistributions of particulate organic matter (POM)were investigated during two cruises in 2002.
2. Materials and methods
2.1. Field sampling
Physical, biogeochemical and biological measure-ments were made from the USCGC Healy duringtwo cruises to the Chukchi and Beaufort Seas
spring cruise to the Chukchi Sea (5 May–15 June 2002). Three
(Canada Basin) included: (1) West Hanna Shoal (WHS), stations
Barrow Canyon (BC) transect, stations 23–34. (B) CTD/rosette
26 August 2002). Four sections were sampled from Chukchi outer
ions 32–39; (2) East Hanna Shoal (EHS) transect, stations 25–31;
B), stations 18–24; and (5) Bering Strait section, stations 1–5.

ARTICLE IN PRESS
Fig. 2. Sea-ice distributions in the Chukchi Sea: (A) spring cruise
(HLY 02-01; 5 May–15 June 2002) and (B) summer cruise (HLY
02-03; 17 July 26 August 2002). Sea-ice cover was determined
from individual station logs, as well as remotely sensed sea-ice
products (http://www.joss.ucar.edu/sbi). Although the contours
are arbitrary, they are provided to give a general sense of spatial
distributions of sea ice.
N.R. Bates et al. / Deep-Sea Research II 52 (2005) 3324–33433326
as part of the 2002 field phase of the SBI project.CTD/rosette stations were sampled for salinity,dissolved oxygen, primary production, chlorophyllcontent, inorganic nutrients (ammonium, nitrate,nitrite; phosphate, reactive silicon, and urea),suspended particulate organic matter (POM), dis-solved inorganic carbon (DIC), biomarkers, micro-zooplankton, radioisotopes, and several othervariables, for example. Methods used to collectand analyze water samples for salinity, dissolvedoxygen, and inorganic nutrients were similar tothose used in the World Ocean Circulation Experi-ment (WOCE) and Joint Global Ocean FluxStudy (JGOFS) programs. Analytical details aremaintained by the WOCE project office (http://whpo.ucsd.edu) and on the SBI web site (http://www.joss.ucar.edu/sbi/; maintained by the JointOffice for Science Support, JOSS). Continuousvertical profiles of temperature, salinity, dissolvedoxygen, fluorometric ‘‘chlorophyll’’, light transmis-sion, Haardt fluorescence (an index of coloredorganic matter), and photosynthetically availableradiation (PAR) also were collected at each station.CTD, bottle and rate measurement data areavailable at the SBI website, and archived at theNational Snow and Ice Data Center (NSIDC;http://nsidc.org/).
During the spring cruise (5 May–15 June 2002), atotal of 40 stations were occupied on the Bering,Chukchi and Beaufort Sea shelves and into theArctic Ocean basin (Fig. 1). Three sectionswere sampled from the Chukchi and Beaufort Seashelves into the Arctic Ocean basin, including:(1) West Hanna Shoal (WHS); (2) East HannaShoal (EHS); and (3) Barrow Canyon (BC). Inaddition, stations were occupied near Pt. Barrow,over the inner shelf of the Chukchi Sea and justsouth of the Bering Strait. With the exception of theBering Strait, ice cover in spring was generallygreater than 75%. Heavy sea ice limited sampling inthe northwest region of the Chukchi Sea andalong the easternmost (BC) line in the BeaufortSea (Fig. 2).
During the summer cruise (17 July–26 August2002), a total of 45 CTD/rosette stations wereoccupied in the region (Fig. 1). The three sectionssampled in spring were re-occupied (i.e., WHS,EHS, and BC). In addition, a fourth section, East ofBarrow (EB), was conducted. A five CTD/rosettestation section extending from the Alaskan sideof the Bering Strait to the Diomede Islands alsowas taken. As on the spring cruise, a few more
stations were occupied over the inner shelf of theChukchi Sea and near Pt. Barrow. During thesummer cruise, ice-free conditions were observedfrom Bering Strait to �701N in the Chukchi Sea(Fig. 2B). Minimal ice conditions (i.e., o25%) wereobserved in the BC region and west to HannaShoals. Heavy ice conditions (i.e., 475%) werepresent offshore and eastward of Point Barrow intothe Beaufort Sea.
2.2. Particulate organic carbon and nitrogen analysis
For determination of particulate organic carbon(POC) and nitrogen (PON), seawater was drawnfrom 30 l Niskin samplers at pre-determined depthsinto Nalgene bottles. Known volumes (1–4 l) of

ARTICLE IN PRESSN.R. Bates et al. / Deep-Sea Research II 52 (2005) 3324–3343 3327
seawater were vacuum filtered through a funnelarray onto pre-combusted GF/F filters (25-mmWhatman, 0.7-mm pore size). Filters were thenfolded, placed into acid-washed pre-combustedscintillation vials, and stored until analysis.After acidification with HCl to remove inorganiccarbon, filters were dried and samples analyzedfor carbon and nitrogen using a Control EquipmentCorporation (CEC) 240-XA Elemental Analyzerat the Bermuda Biological Station For Research,Inc. (Knap et al., 1997). Filter blanks represent thetotal blank associated with the precombustedGF/F filter and any DOC adsorption fromambient seawater. Filter blanks for suspendedPOM samples from SBI were �0.4–0.6 mmoles kg�1
for POC and �0.08–0.1 mmoles kg�1 for PON.Suspended POM samples drained from the spigotof the Niskin sampler can underestimate totalsuspended POM due to sinking of larger particleswithin the sampler (Gardner, 1977). Gundersenet al. (2001) observed, over a couple of years at theBermuda Atlantic Time-series Study (BATS) site inthe North Atlantic Ocean, a mean 26% under-estimate when comparing suspended POC drainedfrom a Niskin spigot compared to an entire sampler.Here, the suspended POM data are not correctedsince similar studies were not conducted during theSBI program.
2.3. Large POC and PON sampling and analysis
Large-volume water samples (�200–1000 l) fordetermination of POC and PON were collectedseparately from the suspended POC and PONsamples using battery powered in situ pumps(Challenger Oceanic Systems and Services, UK).Seawater was pumped at a flow rate of �2–3 l min�1
through a 142-mm diameter, 53-mm pore-size Nitexscreen. The Nitex screens were then immersedonboard in GF/F filtered seawater in an ultrasoni-cator for �2–5min to resuspend particulate matter.The large-particle–seawater suspensions were im-mediately filtered through precombusted 25-mmGF/F filters and stored frozen in petri dishes forsubsequent POC and PON analysis.
In the shore-based lab at University of RhodeIsland, the 25mm GF/F filters containing particu-late matter from the 53-mm Nitex screens werethawed, acidified in a desiccator using fumingconcentrated HCl for 24 h to remove particulateinorganic carbon, and then dried in a 60 1Coven. Subsamples were cut from the 25-mm
filters using nickel-plated scissors to a size appro-priate for CHN analysis, approximately 15–20% byweight of the total filter. Organic carbon andnitrogen on the filters was quantified using aCarlo-Erba CHN Analyzer (Pike and Moran,1997). The total mass of carbon and nitrogenper filter was corrected for the filter blank,converted to molar units, and divided by the samplevolume filtered. Filter blanks for large-particlesamples were prepared by filtering 100–200ml ofGF/F prefiltered seawater and therefore representthe total blank associated with the precombustedGF/F filter and any DOC adsorption from ambientseawater (Moran et al., 1999). For the spring cruise,GF/F filter blanks (N ¼ 5) were 6.6171.69 mmolesC and 1.1170.66 mmoles N/25-mm filter. Forthe summer cruise, filter blanks (N ¼ 6) were4.4673.94 mmoles C and 1.0970.74 mmoles N/25-mm filter. The �4–6 mmol C/25-mm GF/F filter isconsistent with previously reported filter blanksthat include the contribution from DOC adsorp-tion, which was determined empirically by succes-sive filtration of varying volumes of seawaterand extrapolation to zero water filtered (Moranet al., 1999).
Density (e.g., salinity and temperature) was notmonitored during the pumping for large-fractionPOM samples, and the data cannot be appropriatelyconverted to mmoles kg�1 from mmoles l�1. Thusboth suspended POM and large fraction POMdata are reported here as mmoles l�1, rather thanmmoles kg�1.
2.4. Identification of water masses
The upper several hundred meters of the ArcticOcean and adjacent seas are strongly stratified (e.g.,Kinney et al., 1970; Aagaard et al., 1985; Jonesand Anderson, 1986; Anderson et al., 1988, 1989,1994a, b; Aagaard and Carmack, 1994; Schlosseret al., 1995; Codispoti et al., 2005). Surface layer,halocline, and deeper water masses on the Chukchiand Beaufort Sea shelves and adjacent Arctic Oceanbasin can be identified by characteristic tempera-ture, salinity (Aagaard et al., 1981), nutrient, oxygendistributions and stoichiometry (Wallace et al.,1987; Salmon and McRoy, 1994; Jones et al.,1991), and alkalinity (Anderson, 1995) properties.
Surface waters (or Polar Mixed Layer (PML);upper 25–50m) in the Chukchi Sea are derived fromlocal ice melt, fresh-water inputs into the ArcticOcean (Aagaard, 1989; Schlosser et al., 1995), and
ARTICLE IN PRESS
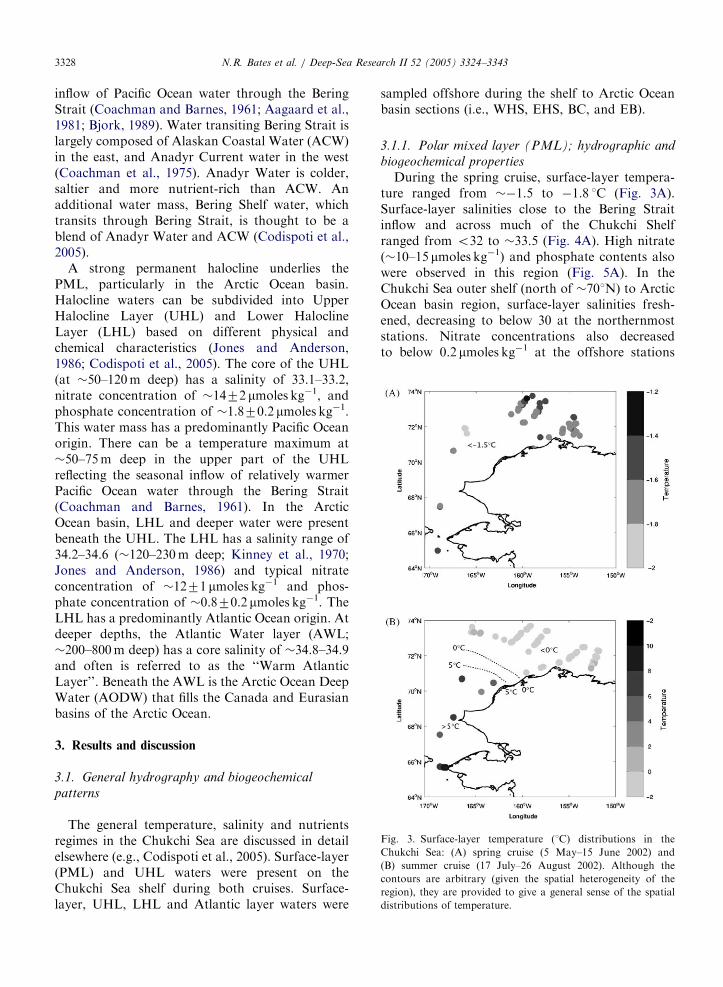
Fig. 3. Surface-layer temperature (1C) distributions in the
Chukchi Sea: (A) spring cruise (5 May–15 June 2002) and
(B) summer cruise (17 July–26 August 2002). Although the
contours are arbitrary (given the spatial heterogeneity of the
region), they are provided to give a general sense of the spatial
distributions of temperature.
N.R. Bates et al. / Deep-Sea Research II 52 (2005) 3324–33433328
inflow of Pacific Ocean water through the BeringStrait (Coachman and Barnes, 1961; Aagaard et al.,1981; Bjork, 1989). Water transiting Bering Strait islargely composed of Alaskan Coastal Water (ACW)in the east, and Anadyr Current water in the west(Coachman et al., 1975). Anadyr Water is colder,saltier and more nutrient-rich than ACW. Anadditional water mass, Bering Shelf water, whichtransits through Bering Strait, is thought to be ablend of Anadyr Water and ACW (Codispoti et al.,2005).
A strong permanent halocline underlies thePML, particularly in the Arctic Ocean basin.Halocline waters can be subdivided into UpperHalocline Layer (UHL) and Lower HaloclineLayer (LHL) based on different physical andchemical characteristics (Jones and Anderson,1986; Codispoti et al., 2005). The core of the UHL(at �50–120m deep) has a salinity of 33.1–33.2,nitrate concentration of �1472 mmoles kg�1, andphosphate concentration of �1.870.2 mmoles kg�1.This water mass has a predominantly Pacific Oceanorigin. There can be a temperature maximum at�50–75m deep in the upper part of the UHLreflecting the seasonal inflow of relatively warmerPacific Ocean water through the Bering Strait(Coachman and Barnes, 1961). In the ArcticOcean basin, LHL and deeper water were presentbeneath the UHL. The LHL has a salinity range of34.2–34.6 (�120–230m deep; Kinney et al., 1970;Jones and Anderson, 1986) and typical nitrateconcentration of �1271 mmoles kg�1 and phos-phate concentration of �0.870.2 mmoles kg�1. TheLHL has a predominantly Atlantic Ocean origin. Atdeeper depths, the Atlantic Water layer (AWL;�200–800m deep) has a core salinity of �34.8–34.9and often is referred to as the ‘‘Warm AtlanticLayer’’. Beneath the AWL is the Arctic Ocean DeepWater (AODW) that fills the Canada and Eurasianbasins of the Arctic Ocean.
3. Results and discussion
3.1. General hydrography and biogeochemical
patterns
The general temperature, salinity and nutrientsregimes in the Chukchi Sea are discussed in detailelsewhere (e.g., Codispoti et al., 2005). Surface-layer(PML) and UHL waters were present on theChukchi Sea shelf during both cruises. Surface-layer, UHL, LHL and Atlantic layer waters were
sampled offshore during the shelf to Arctic Oceanbasin sections (i.e., WHS, EHS, BC, and EB).
3.1.1. Polar mixed layer (PML); hydrographic and
biogeochemical properties
During the spring cruise, surface-layer tempera-ture ranged from ��1.5 to �1.8 1C (Fig. 3A).Surface-layer salinities close to the Bering Straitinflow and across much of the Chukchi Shelfranged from o32 to �33.5 (Fig. 4A). High nitrate(�10–15 mmoles kg�1) and phosphate contents alsowere observed in this region (Fig. 5A). In theChukchi Sea outer shelf (north of �701N) to ArcticOcean basin region, surface-layer salinities fresh-ened, decreasing to below 30 at the northernmoststations. Nitrate concentrations also decreasedto below 0.2 mmoles kg�1 at the offshore stations

ARTICLE IN PRESS
Fig. 4. Surface-layer salinity distributions in the Chukchi Sea:
(A) spring cruise (5 May–15 June 2002) and (B) summer cruise
(17 July–26 August 2002). Although the contours are arbitrary
(given the spatial heterogeneity of the region), they give a general
sense of the spatial distributions of salinity.
Fig. 5. Surface-layer nitrate (mmoles kg�1) distributions in the
Chukchi Sea: (A) spring cruise (5 May–15 June 2002) and (B)
summer cruise (17 July–26 August 2002). Although the contours
are arbitrary (given the spatial heterogeneity of the region), they
give a general sense of the spatial distributions of nitrate.
N.R. Bates et al. / Deep-Sea Research II 52 (2005) 3324–3343 3329
(particularly on the WHS and EHS transects).With the exception of Bering Strait (station 0;�1–2 mg l�1), chlorophyll biomass across the Chuk-chi Sea shelf, slope and Arctic Ocean basin regionwas generally low (o0.8 mg l�1; Hill and Cota, 2005)and restricted to the PML. The slope and basinstations located along the WHS and EHS transectshad the lowest chlorophyll biomass (o0.2 mg l�1;Hill and Cota, 2005).
Two months later, seasonal warming of the surfacelayer was evident from the Bering Strait and acrossthe Chukchi Sea shelf (to �711N) (Fig. 3B). Surface-layer salinities ranged from o10 to 32, with lowersalinity water evident in the ACW at Bering Strait(Fig. 4B). North of this region, surface-layer tempera-tures remained near freezing. A freshened mixed layerwas also evident (salinities of 27–28; Fig. 4B) in theouter Chukchi Sea shelf–Arctic Ocean basin transi-
tion. Inorganic nutrient contents were low across theregions with surface nitrate less than 0.2mmoles kg�1
at all stations (Fig. 5B). During the summer, relativelylow rates of primary productivity were observed atthe shelf (�340mgCm2d�1) and slope stations(�404mgCm2d�1; Hill and Cota, 2005). Rates ofnet community production (NCP) determined by DICchanges between the spring and summer period werehighly variable, ranging from 15 over the CanadaBasin of the Arctic Ocean to42800mgCm2d�1 overthe shelf (Bates et al., 2005). The highest NCP rates(�1000–2800mgCm2d�1) were observed in the shelfregion of Barrow Canyon and east of Point Barrow(Bates et al., 2005; Walsh et al., 2005). The highestconcentrations of particles (e.g., Ashjian et al., 2005)and chlorophyll biomass (42–25mg l�1; Hill andCota, 2005) also was observed in the Barrow Canyonregion, with a pronounced subsurface maximum at
ARTICLE IN PRESSN.R. Bates et al. / Deep-Sea Research II 52 (2005) 3324–33433330
�25–35m. The highest vertical export of organiccarbon also occurred in this region (Moran et al.,2005; Grebmeier et al., 2004). Lower rates of NCP(Bates et al., 2005; Walsh et al., 2005), particleconcentration (Ashjian et al., 2005), chlorophyll a
biomass (Hill and Cota, 2005), and export production(Moran et al., 2005) was observed in the slope andbasin regions, particularly at WHS and EHS on theChukchi Sea shelf.
3.1.2. Halocline and deeper waters: hydrographic
and biogeochemical properties
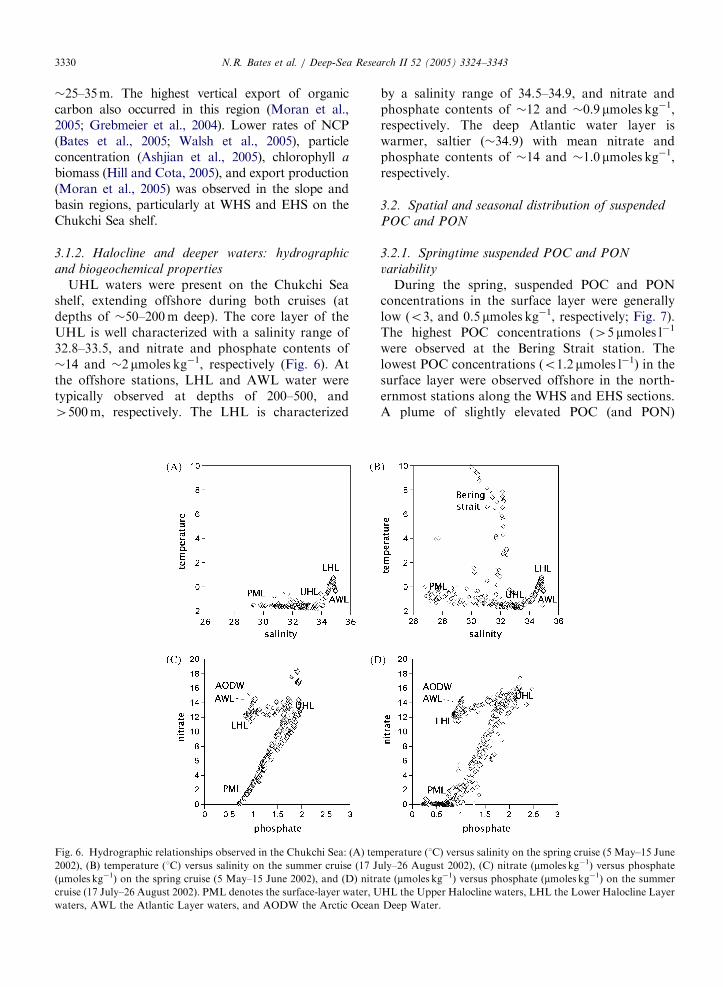
UHL waters were present on the Chukchi Seashelf, extending offshore during both cruises (atdepths of �50–200m deep). The core layer of theUHL is well characterized with a salinity range of32.8–33.5, and nitrate and phosphate contents of�14 and �2 mmoles kg�1, respectively (Fig. 6). Atthe offshore stations, LHL and AWL water weretypically observed at depths of 200–500, and4500m, respectively. The LHL is characterized
Fig. 6. Hydrographic relationships observed in the Chukchi Sea: (A) tem
2002), (B) temperature (1C) versus salinity on the summer cruise (17 J
(mmoles kg�1) on the spring cruise (5 May–15 June 2002), and (D) nitr
cruise (17 July–26 August 2002). PML denotes the surface-layer water, U
waters, AWL the Atlantic Layer waters, and AODW the Arctic Ocean
by a salinity range of 34.5–34.9, and nitrate andphosphate contents of �12 and �0.9 mmoles kg�1,respectively. The deep Atlantic water layer iswarmer, saltier (�34.9) with mean nitrate andphosphate contents of �14 and �1.0 mmoles kg�1,respectively.
3.2. Spatial and seasonal distribution of suspended
POC and PON
3.2.1. Springtime suspended POC and PON
variability
During the spring, suspended POC and PONconcentrations in the surface layer were generallylow (o3, and 0.5 mmoles kg�1, respectively; Fig. 7).The highest POC concentrations (45 mmoles l�1
were observed at the Bering Strait station. Thelowest POC concentrations (o1.2 mmoles l�1) in thesurface layer were observed offshore in the north-ernmost stations along the WHS and EHS sections.A plume of slightly elevated POC (and PON)
perature (1C) versus salinity on the spring cruise (5 May–15 June
uly–26 August 2002), (C) nitrate (mmoles kg�1) versus phosphate
ate (mmoles kg�1) versus phosphate (mmoles kg�1) on the summer
HL the Upper Halocline waters, LHL the Lower Halocline Layer
Deep Water.

ARTICLE IN PRESS
Fig. 7. Surface-layer particulate organic carbon (POC) and nitrogen (PON) (mmoles l�1) distributions in the Chukchi Sea: (A) spring
cruise (5 May–15 June 2002), and (B) summer cruise (17 July–26 August 2002); and (C) Spring cruise (5 May–15 June 2002), and (D)
summer cruise (17 July–26 August 2002). Although the contours are arbitrary (given the spatial heterogeneity of the region), they are
provided to give a general sense of the spatial distributions of PON.
N.R. Bates et al. / Deep-Sea Research II 52 (2005) 3324–3343 3331
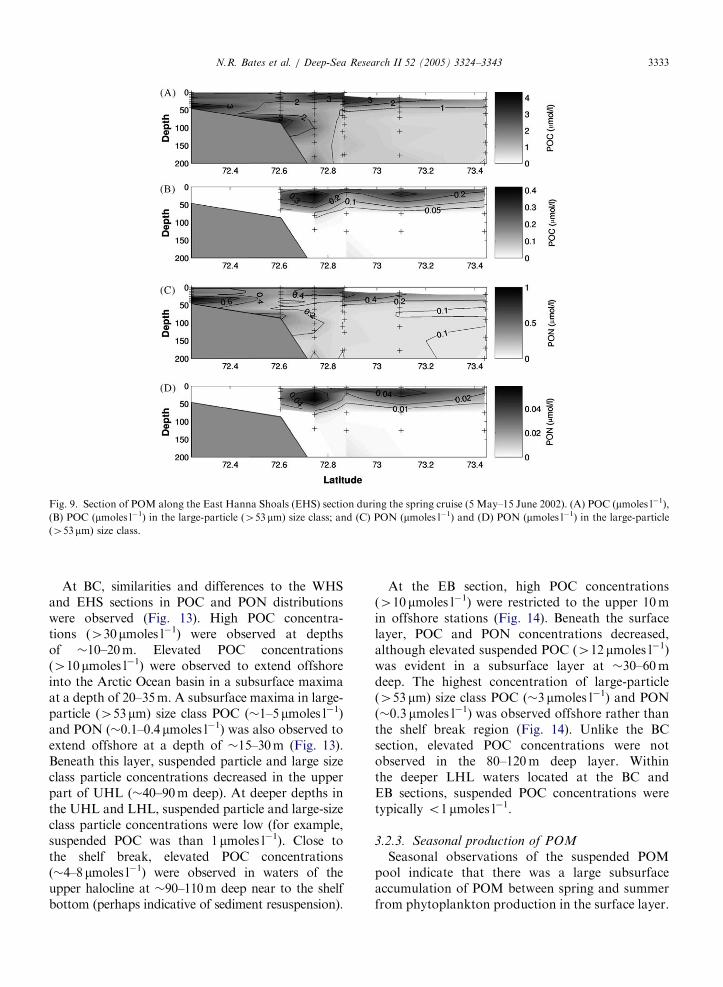
extended out from the shelf and shelf break into theCanada Basin at a depth of �20m at both the WHSand EHS sections (Figs. 8 and 9). A similar featurewas observed in the BC section (Fig. 10). Chlor-ophyll biomass (�0.1–0.4 mg l�1) was typicallyrestricted to shallower depths (�0–20m) than thesubsurface suspended POM maxima. On the shelf,in halocline waters, relatively high POC concentra-tions (43 mmoles l�1), similar in magnitude to thenear surface maxima, were observed in bottomwaters (�40–50m depth) at the shelf break (stations5, 22 and 37). Offshore, beyond the shelf break, thenear-surface suspended POC maxima decreasedhorizontally. At depth, suspended POC concentra-tions were less than 1 mmoles l�1 in UHL and LHLwaters.
Distributions of large-particle (453 mm) size classPOC and PON were generally similar to that
observed for the suspended particulate size class,although the concentrations were approximately10-fold lower, ranging from �0.05–0.4 mmoles l�1
for 453-mm POC and �0.01–0.03 mmoles l�1 for453 mm PON (Figs. 8–10). A subsurface maxima inlarge-particle (453 mm) size class was observed at adepth of �15–30m deep (at each section WHS,EHS, and BC) extending out from the shelf breakinto the basin. Due to limited sampling, it could notbe ascertained whether there was a higher concen-trations of large-particle (453 mm) size class POCand PON associated with the near-bottom sus-pended POM observed over the shelf.
3.2.2. Summertime suspended POC and PON
variability
Six weeks later, suspended POC and PONconcentrations were generally much higher across

ARTICLE IN PRESS
Fig. 8. Section of POM along the West Hanna Shoals (WHS) section during the spring cruise (5 May–15 June 2002). (A) POC (mmoles l�1)
and (B) POC (mmoles l�1) in the large-particle (453mm) size class; and (C) PON (mmoles l�1) and (D) PON (mmoles l�1) in the large-
particle (453 mm) size class.
N.R. Bates et al. / Deep-Sea Research II 52 (2005) 3324–33433332
the region (Fig. 7). In the Bering Strait, elevatedPOC (415 mmoles l�1) and PON was observedat the westernmost station (station 2) where theinfluence of Anadyr and Bering Shelf water islikely to be the strongest. To the east, lower POC(�5 mmoles l�1) was observed in the ACW, perhapsextending into the Chukchi Sea (stations 7 and 8).In the surface layer of the Chukchi Sea shelf, thehighest POC concentrations (420 mmoles l�1) wereobserved near BC and EB into the Beaufort Sea.POC concentrations higher than �4 mmoles l�1 weregenerally restricted to the Chukchi Shelf except eastof Pt. Barrow where elevated POC extended off-shore in the surface layer. To the west, POCconcentrations decreased offshore to o2 mmoles l�1
at the northernmost stations in the Arctic Oceanbasin.
There were considerable vertical and spatialdifferences in the suspended POC and PONconcentrations within halocline waters. To the west,at the WHS and EHS sections, high POC concen-
trations (410 mmoles l�1) were observed at the shelfbreak (Figs. 11 and 12) at depths of �20–40m.Although POC concentrations decreased north-wards into the Arctic Ocean basin, elevated POCconcentrations (46 mmoles l�1) extended offshore ata subsurface depth range of �20–35m (in transi-tional waters between the surface layer and UHL).Similar to spring conditions, POC concentrations inoffshore waters below �40m decreased vertically.Within the LHL, suspended POC concentrationswere typically o1 mmoles�1. Summertime distribu-tions of large-particle suspended POC and PONare generally similar to that observed for thesuspended particulate size class, although theconcentrations were approximately 10-fold lower,ranging from �o0.05–6 mmoles l�1 for 453 mmPOC and �0.02–0.2 mmoles l�1 for 453 mm PON.Similar to springtime conditions, a subsurfacemaxima in large-particle (453 mm) size class wasobserved at a depth of �15–30m deep extending outfrom the shelf break into the basin.
ARTICLE IN PRESS
Fig. 9. Section of POM along the East Hanna Shoals (EHS) section during the spring cruise (5 May–15 June 2002). (A) POC (mmoles l�1),
(B) POC (mmoles l�1) in the large-particle (453 mm) size class; and (C) PON (mmoles l�1) and (D) PON (mmoles l�1) in the large-particle
(453mm) size class.
N.R. Bates et al. / Deep-Sea Research II 52 (2005) 3324–3343 3333
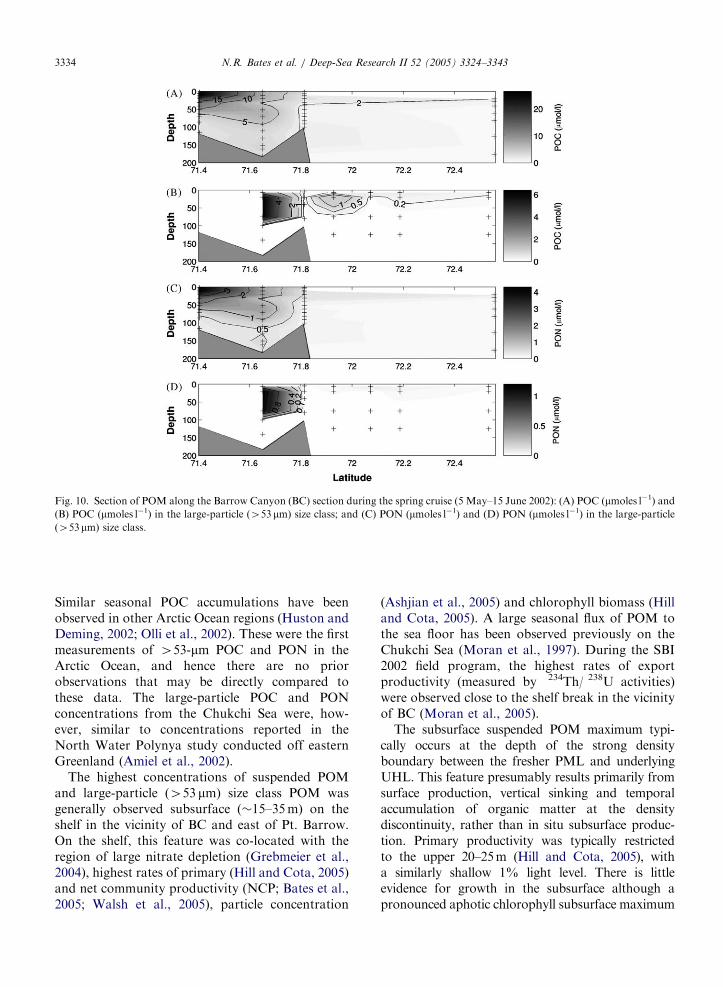
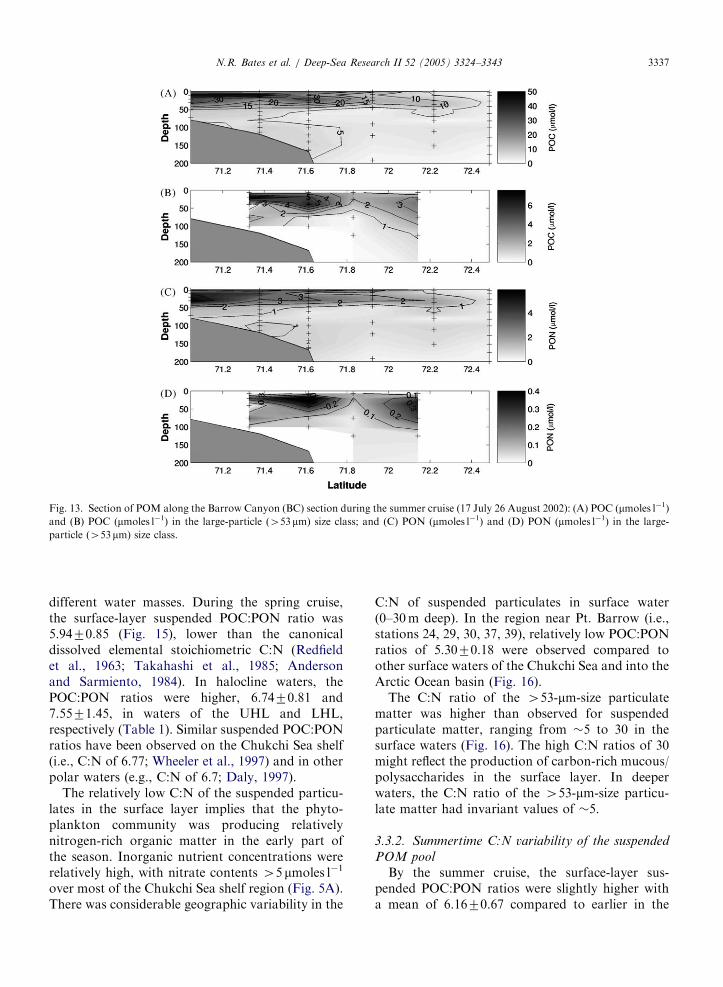
At BC, similarities and differences to the WHSand EHS sections in POC and PON distributionswere observed (Fig. 13). High POC concentra-tions (430mmoles l�1) were observed at depthsof �10–20m. Elevated POC concentrations(410mmoles l�1) were observed to extend offshoreinto the Arctic Ocean basin in a subsurface maximaat a depth of 20–35m. A subsurface maxima in large-particle (453mm) size class POC (�1–5mmoles l�1)and PON (�0.1–0.4mmoles l�1) was also observed toextend offshore at a depth of �15–30m (Fig. 13).Beneath this layer, suspended particle and large sizeclass particle concentrations decreased in the upperpart of UHL (�40–90m deep). At deeper depths inthe UHL and LHL, suspended particle and large-sizeclass particle concentrations were low (for example,suspended POC was than 1mmoles l�1). Close tothe shelf break, elevated POC concentrations(�4–8mmoles l�1) were observed in waters of theupper halocline at �90–110m deep near to the shelfbottom (perhaps indicative of sediment resuspension).
At the EB section, high POC concentrations(410 mmoles l�1) were restricted to the upper 10min offshore stations (Fig. 14). Beneath the surfacelayer, POC and PON concentrations decreased,although elevated suspended POC (412 mmoles l�1)was evident in a subsurface layer at �30–60mdeep. The highest concentration of large-particle(453 mm) size class POC (�3 mmoles l�1) and PON(�0.3 mmoles l�1) was observed offshore rather thanthe shelf break region (Fig. 14). Unlike the BCsection, elevated POC concentrations were notobserved in the 80–120m deep layer. Withinthe deeper LHL waters located at the BC andEB sections, suspended POC concentrations weretypically o1 mmoles l�1.
3.2.3. Seasonal production of POM
Seasonal observations of the suspended POMpool indicate that there was a large subsurfaceaccumulation of POM between spring and summerfrom phytoplankton production in the surface layer.
ARTICLE IN PRESS
Fig. 10. Section of POM along the Barrow Canyon (BC) section during the spring cruise (5 May–15 June 2002): (A) POC (mmoles l�1) and
(B) POC (mmoles l�1) in the large-particle (453 mm) size class; and (C) PON (mmoles l�1) and (D) PON (mmoles l�1) in the large-particle
(453mm) size class.
N.R. Bates et al. / Deep-Sea Research II 52 (2005) 3324–33433334
Similar seasonal POC accumulations have beenobserved in other Arctic Ocean regions (Huston andDeming, 2002; Olli et al., 2002). These were the firstmeasurements of 453-mm POC and PON in theArctic Ocean, and hence there are no priorobservations that may be directly compared tothese data. The large-particle POC and PONconcentrations from the Chukchi Sea were, how-ever, similar to concentrations reported in theNorth Water Polynya study conducted off easternGreenland (Amiel et al., 2002).
The highest concentrations of suspended POMand large-particle (453 mm) size class POM wasgenerally observed subsurface (�15–35m) on theshelf in the vicinity of BC and east of Pt. Barrow.On the shelf, this feature was co-located with theregion of large nitrate depletion (Grebmeier et al.,2004), highest rates of primary (Hill and Cota, 2005)and net community productivity (NCP; Bates et al.,2005; Walsh et al., 2005), particle concentration
(Ashjian et al., 2005) and chlorophyll biomass (Hilland Cota, 2005). A large seasonal flux of POM tothe sea floor has been observed previously on theChukchi Sea (Moran et al., 1997). During the SBI2002 field program, the highest rates of exportproductivity (measured by 234Th/ 238U activities)were observed close to the shelf break in the vicinityof BC (Moran et al., 2005).
The subsurface suspended POM maximum typi-cally occurs at the depth of the strong densityboundary between the fresher PML and underlyingUHL. This feature presumably results primarily fromsurface production, vertical sinking and temporalaccumulation of organic matter at the densitydiscontinuity, rather than in situ subsurface produc-tion. Primary productivity was typically restrictedto the upper 20–25m (Hill and Cota, 2005), witha similarly shallow 1% light level. There is littleevidence for growth in the subsurface although apronounced aphotic chlorophyll subsurface maximum
ARTICLE IN PRESS
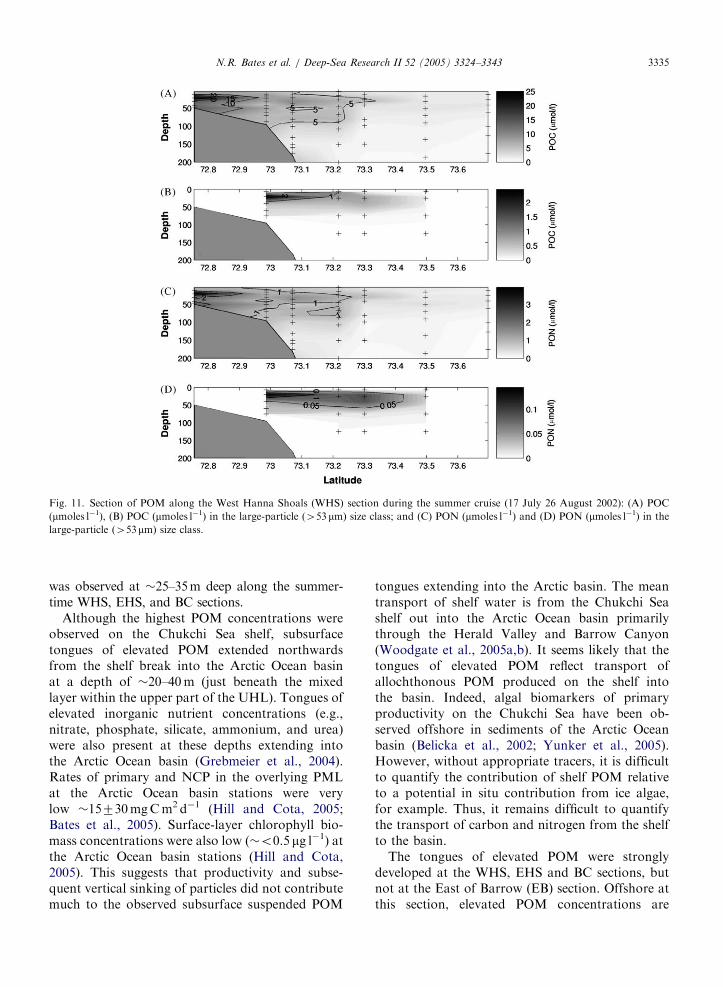
Fig. 11. Section of POM along the West Hanna Shoals (WHS) section during the summer cruise (17 July 26 August 2002): (A) POC
(mmoles l�1), (B) POC (mmoles l�1) in the large-particle (453 mm) size class; and (C) PON (mmoles l�1) and (D) PON (mmoles l�1) in the
large-particle (453mm) size class.
N.R. Bates et al. / Deep-Sea Research II 52 (2005) 3324–3343 3335
was observed at �25–35m deep along the summer-time WHS, EHS, and BC sections.
Although the highest POM concentrations wereobserved on the Chukchi Sea shelf, subsurfacetongues of elevated POM extended northwardsfrom the shelf break into the Arctic Ocean basinat a depth of �20–40m (just beneath the mixedlayer within the upper part of the UHL). Tongues ofelevated inorganic nutrient concentrations (e.g.,nitrate, phosphate, silicate, ammonium, and urea)were also present at these depths extending intothe Arctic Ocean basin (Grebmeier et al., 2004).Rates of primary and NCP in the overlying PMLat the Arctic Ocean basin stations were verylow �15730mgCm2 d�1 (Hill and Cota, 2005;Bates et al., 2005). Surface-layer chlorophyll bio-mass concentrations were also low (�o0.5 mg l�1) atthe Arctic Ocean basin stations (Hill and Cota,2005). This suggests that productivity and subse-quent vertical sinking of particles did not contributemuch to the observed subsurface suspended POM
tongues extending into the Arctic basin. The meantransport of shelf water is from the Chukchi Seashelf out into the Arctic Ocean basin primarilythrough the Herald Valley and Barrow Canyon(Woodgate et al., 2005a,b). It seems likely that thetongues of elevated POM reflect transport ofallochthonous POM produced on the shelf intothe basin. Indeed, algal biomarkers of primaryproductivity on the Chukchi Sea have been ob-served offshore in sediments of the Arctic Oceanbasin (Belicka et al., 2002; Yunker et al., 2005).However, without appropriate tracers, it is difficultto quantify the contribution of shelf POM relativeto a potential in situ contribution from ice algae,for example. Thus, it remains difficult to quantifythe transport of carbon and nitrogen from the shelfto the basin.
The tongues of elevated POM were stronglydeveloped at the WHS, EHS and BC sections, butnot at the East of Barrow (EB) section. Offshore atthis section, elevated POM concentrations are

ARTICLE IN PRESS
Fig. 12. Section of POM along the East Hanna Shoals (EHS) section during the summer cruise (17 July 26 August 2002): (A) POC
(mmoles l�1) and (B) POC (mmoles l�1) in the large-particle (453mm) size class; and (C) PON (mmoles l�1) and (D) PON (mmoles l�1) in the
large-particle (453mm) size class.
N.R. Bates et al. / Deep-Sea Research II 52 (2005) 3324–33433336
limited to the upper 10–15m. Further to the east inthe Beaufort Sea, Mackenzie River runoff cancontribute as much as an 8-m inventory of meteoricwater to the �40-m mixed layer (Macdonald et al.,2002). Although terrestrial sources of POM fromthe Mackenzie River could contribute to thesuspended POM pool in EB region of the BeaufortSea shelf, this region is �200 km away from theMackenzie River outflow. Furthermore, the car-bon:nitrogen (C:N) ratio of the suspended POMobserved in both spring and summer was low (o6)compared to typical C:N ratios of POM in arcticrivers (e.g., 7.6–13.2; Lobbes et al., 2000) implying amarine source for POM rather than a terrestrialsource.
In the Arctic Ocean basin stations, low(o1–2 mmoles l�1) POC concentrations were ob-served in waters of the surface layer (PML) andLHL during both spring and summer cruises. Inprevious studies, Wheeler et al. (1997) reportedrelatively high suspended POC values for the
surface layer across the Canada Basin, with noPOC values lower than �2 mmoles l�1. Such biomassaccumulation requires significant rates of primaryand importantly, new and export production inthe Arctic Ocean basin, a region believed to beoligotrophic. However, the low suspended POC andinorganic nutrient concentrations observed duringthe SBI cruises, suggest that rates of primary, newand export production are indeed low in the CanadaBasin region of the Arctic Ocean. Rates of netcommunity production estimated from changes inDIC distributions during SBI cruises were low(o15–25mgCm�2 d�1 (Bates et al., 2005).
3.3. Seasonal changes in the C:N of suspended and
large-particle POM
3.3.1. Springtime C:N variability of the suspended
POM pool
The C:N ratio of suspended particulate mattervaried seasonally, geographically and between
ARTICLE IN PRESS
Fig. 13. Section of POM along the Barrow Canyon (BC) section during the summer cruise (17 July 26 August 2002): (A) POC (mmoles l�1)
and (B) POC (mmoles l�1) in the large-particle (453mm) size class; and (C) PON (mmoles l�1) and (D) PON (mmoles l�1) in the large-
particle (453mm) size class.
N.R. Bates et al. / Deep-Sea Research II 52 (2005) 3324–3343 3337
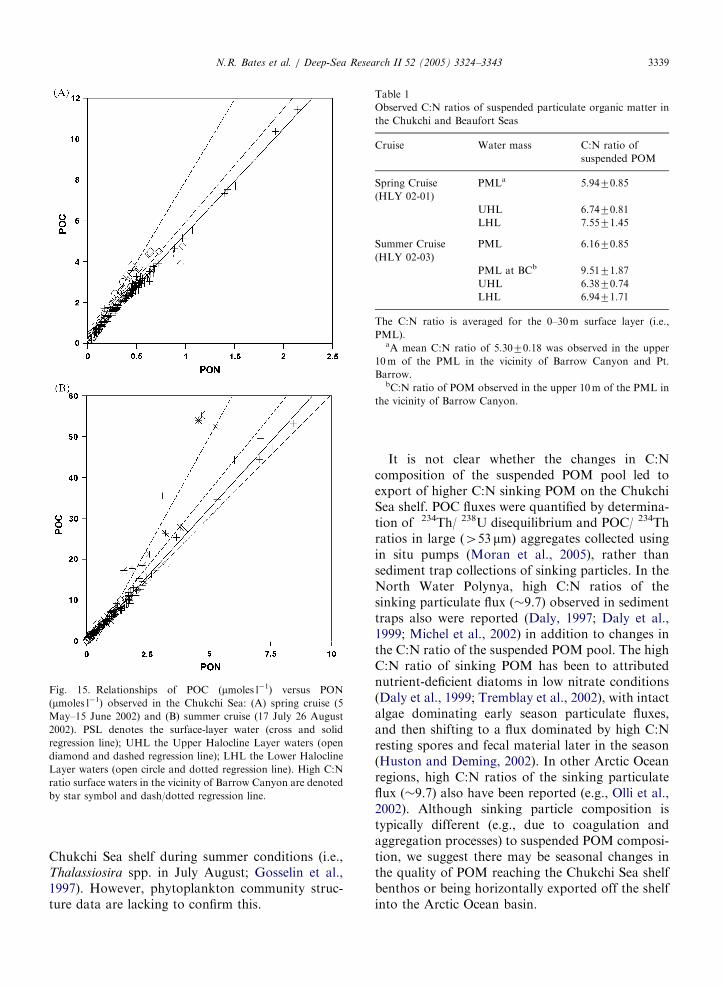
different water masses. During the spring cruise,the surface-layer suspended POC:PON ratio was5.9470.85 (Fig. 15), lower than the canonicaldissolved elemental stoichiometric C:N (Redfieldet al., 1963; Takahashi et al., 1985; Andersonand Sarmiento, 1984). In halocline waters, thePOC:PON ratios were higher, 6.7470.81 and7.5571.45, in waters of the UHL and LHL,respectively (Table 1). Similar suspended POC:PONratios have been observed on the Chukchi Sea shelf(i.e., C:N of 6.77; Wheeler et al., 1997) and in otherpolar waters (e.g., C:N of 6.7; Daly, 1997).
The relatively low C:N of the suspended particu-lates in the surface layer implies that the phyto-plankton community was producing relativelynitrogen-rich organic matter in the early part ofthe season. Inorganic nutrient concentrations wererelatively high, with nitrate contents 45 mmoles l�1
over most of the Chukchi Sea shelf region (Fig. 5A).There was considerable geographic variability in the
C:N of suspended particulates in surface water(0–30m deep). In the region near Pt. Barrow (i.e.,stations 24, 29, 30, 37, 39), relatively low POC:PONratios of 5.3070.18 were observed compared toother surface waters of the Chukchi Sea and into theArctic Ocean basin (Fig. 16).
The C:N ratio of the 453-mm-size particulatematter was higher than observed for suspendedparticulate matter, ranging from �5 to 30 in thesurface waters (Fig. 16). The high C:N ratios of 30might reflect the production of carbon-rich mucous/polysaccharides in the surface layer. In deeperwaters, the C:N ratio of the 453-mm-size particu-late matter had invariant values of �5.
3.3.2. Summertime C:N variability of the suspended
POM pool
By the summer cruise, the surface-layer sus-pended POC:PON ratios were slightly higher witha mean of 6.1670.67 compared to earlier in the

ARTICLE IN PRESS
Fig. 14. Section of POM along the East of Barrow (EB) section during the summer cruise (17 July 26 August 2002): (A) POC (mmoles l�1)
and (B) POC (mmoles l�1) in the large-particle (453mm) size class; and (C) PON (mmoles l�1) and (D) PON (mmoles l�1) in the large-
particle (453 mm) size class.
N.R. Bates et al. / Deep-Sea Research II 52 (2005) 3324–33433338
season. In halocline waters, the POC:PON ratioswere slightly lower than spring values at 6.3870.74and 6.9471.71 in UHL and LHL, respectively(Fig. 15, Table 1). There was much greatervariability of surface-layer C:N ratios (Fig. 16) inthe summer compared to the spring cruise. In theHanna Shoals region, the highest C:N ratios(5.8–6.2) were observed close to the ice marginand on the shelf but immediately offshore was aregion of relatively low C:N (o6; Fig. 16). Thelargest variability was observed in the vicinity of BCand off Pt. Barrow. High C:N ratios (mean of9.5171.87) were observed at stations 10, 12, 13, and31. The C:N ratio of the 453-mm-size particulatematter was higher than observed for suspendedparticulate matter, ranging from �8 to 60 in thesurface waters (Fig. 16).
Similar seasonal changes in C:N ratios of thesuspended particulate pool have been observedelsewhere in subpolar regions. In the North Water
Polynya, Huston and Deming (2002) observed thatmean suspended particulate C:N increased from5.47 (May) to 7.04 (July).
The seasonal changes in the C:N of the suspendedPOM pool observed on the Chukchi Sea shelfpresumably reflects a significant change in thequality of material being produced and/or changesin the relative contributions of autotrophs, hetero-trophs, bacteria and detritus. Thomas et al. (1999)have proposed that seasonal changes in C:N ratiosof POM also may reflect changing physiologicalconditions of phytoplankton in the presence ofdecreasing nitrate availability. In the Chukchi Sea,it is evident that in localized areas, there is a shiftfrom N-rich POM production in nitrate-repletewaters to N-poor POM production in nitrate-deplete waters. This might result from seasonalshifts to a diatom-dominated phytoplankton com-munity since centric diatoms have been observed todominate the phytoplankton community of the
ARTICLE IN PRESS
Fig. 15. Relationships of POC (mmoles l�1) versus PON
(mmoles l�1) observed in the Chukchi Sea: (A) spring cruise (5
May–15 June 2002) and (B) summer cruise (17 July 26 August
2002). PSL denotes the surface-layer water (cross and solid
regression line); UHL the Upper Halocline Layer waters (open
diamond and dashed regression line); LHL the Lower Halocline
Layer waters (open circle and dotted regression line). High C:N
ratio surface waters in the vicinity of Barrow Canyon are denoted
by star symbol and dash/dotted regression line.
Table 1
Observed C:N ratios of suspended particulate organic matter in
the Chukchi and Beaufort Seas
Cruise Water mass C:N ratio of
suspended POM
Spring Cruise
(HLY 02-01)
PMLa 5.9470.85
UHL 6.7470.81
LHL 7.5571.45
Summer Cruise
(HLY 02-03)
PML 6.1670.85
PML at BCb 9.5171.87
UHL 6.3870.74
LHL 6.9471.71
The C:N ratio is averaged for the 0–30m surface layer (i.e.,
PML).aA mean C:N ratio of 5.3070.18 was observed in the upper
10m of the PML in the vicinity of Barrow Canyon and Pt.
Barrow.bC:N ratio of POM observed in the upper 10m of the PML in
the vicinity of Barrow Canyon.
N.R. Bates et al. / Deep-Sea Research II 52 (2005) 3324–3343 3339
Chukchi Sea shelf during summer conditions (i.e.,Thalassiosira spp. in July August; Gosselin et al.,1997). However, phytoplankton community struc-ture data are lacking to confirm this.
It is not clear whether the changes in C:Ncomposition of the suspended POM pool led toexport of higher C:N sinking POM on the ChukchiSea shelf. POC fluxes were quantified by determina-tion of 234Th/ 238U disequilibrium and POC/ 234Thratios in large (453 mm) aggregates collected usingin situ pumps (Moran et al., 2005), rather thansediment trap collections of sinking particles. In theNorth Water Polynya, high C:N ratios of thesinking particulate flux (�9.7) observed in sedimenttraps also were reported (Daly, 1997; Daly et al.,1999; Michel et al., 2002) in addition to changes inthe C:N ratio of the suspended POM pool. The highC:N ratio of sinking POM has been to attributednutrient-deficient diatoms in low nitrate conditions(Daly et al., 1999; Tremblay et al., 2002), with intactalgae dominating early season particulate fluxes,and then shifting to a flux dominated by high C:Nresting spores and fecal material later in the season(Huston and Deming, 2002). In other Arctic Oceanregions, high C:N ratios of the sinking particulateflux (�9.7) also have been reported (e.g., Olli et al.,2002). Although sinking particle composition istypically different (e.g., due to coagulation andaggregation processes) to suspended POM composi-tion, we suggest there may be seasonal changes inthe quality of POM reaching the Chukchi Sea shelfbenthos or being horizontally exported off the shelfinto the Arctic Ocean basin.

ARTICLE IN PRESS
Fig. 16. Average C:N ratio of suspended particulate organic matter (total) and large-particle (453mm) size class POM in the upper
0–30m at each station in the Chukchi Sea: (A) spring cruise (5 May–15 June 2002), (B) summer cruise (17 July–26 August 2002), (C) large-
particle (453 mm) size class POM on the spring cruise (5 May–15 June 2002), and (D) summer cruise (17 July 26 August 2002).
N.R. Bates et al. / Deep-Sea Research II 52 (2005) 3324–33433340
Acknowledgements
Jackie Grebmeier and Lee Cooper are thankedfor their overarching contributions to the SBIprogram. We also thank the captain, crew and allscientific participants on the two 2002 Healy cruises.Jim Swift and the service team are thanked for theirdedicated efforts in providing CTD and hydro-graphic data to the project. Our thanks to CharlieFarmer (RSMAS), Cindy Moore (RSMAS), Chris-tine Pequignet (BBSR) and Paul Lethaby (BBSR)for their participation in the field activities of SBI.Christine Pequignet and Julian Mitchell (BBSR) arethanked for their organization of pre-cruise andpost-cruise logistics. Keven Neely is thanked forconducting CHN analyses at BBSR. Pat Kelly and
Rick Nelson are thanked for sample collection andanalysis. Wolfgang Koeve and an anonymousreviewer are thanked for their detailed and helpfulreviews. NSF supported this research through grantOPP-0124868.
References
Aagaard, K., 1989. A synthesis of the Arctic Ocean circulation.
Rapporteur Par-Volume Reun. Conseilles Internationale
Exploration de la Mer 188, 11–22.
Aagaard, K., Carmack, E.C., 1989. The role of sea ice and other
fresh water in the Arctic circulation. Journal of Geophysical
Research 94, 14485–14498.
Aagaard, K., Carmack, E.C., 1994. The Arctic Ocean and
Climate: A perspective. In: Johannessen, O.M., Muench,
R.D., Overland, J.E. (Eds.), The Polar Oceans and Their Role

ARTICLE IN PRESSN.R. Bates et al. / Deep-Sea Research II 52 (2005) 3324–3343 3341
in Shaping the Global Environment. American Geophysical
Union, Geophysical Monograph, vol. 85, pp. 5–20.
Aagaard, K., Coachman, L.K., Carmack, E.C., 1981. On the
halocline of the Arctic Ocean. Deep-Sea Research 28,
529–545.
Aagaard, K., Swift, J.H., Carmack, E.C., 1985. Thermohaline
circulation in the Arctic Mediterranean Sea. Journal of
Geophysical Research 95, 18163–18175.
Amiel, D., Cochran, J.K., Hirschberg, D.J., 2002. 234Th/238U
disequilibrium as an indicator of the seasonal export flux of
particulate organic carbon in the North Water Polynya.
Deep-Sea Research II 49, 5191–5209.
Anderson, L.G., 1995. Chemical oceanography of the Arctic and
its shelf sea. In: Smith Jr, W.O., Grebmeier, J.M. (Eds.),
Arctic Oceanography: Marginal Ice Zones and Continental
Shelves. Coastal and Estuarine Studies, vol. 49. American
Geophysical Union, Washington, DC.
Anderson, L.G., Jones, E.P., Lindegren, R., Rudels, B.,
Sehlstedt, P.I., 1988. Nutrient regeneration in cold, high
salinity bottom water of the Arctic shelves. Continental Shelf
Research 8, 1345–1355.
Anderson, L.G., Jones, E.P., Koltermann, K.P., Schlosser, P.,
Swift, J.H., Wallace, D.W.R., 1989. The 1st Oceanographic
section across the Nansen Basin in the Arctic Ocean. Deep-
Sea Research 36 (3), 475–482.
Anderson, L.G., Olsson, K., Skoog, A., 1994a. Distribution
of dissolved inorganic and organic carbon in the
Eurasian basin of the Arctic Ocean, in Polar Oceans
and Their Role in Shaping the Global Environment.
American Geophysical Unions, Geophysical Monograph 85,
255–262.
Anderson, L.G., Bjork, G., Holby, O., Jones, E.P., Kattner, G.,
Koltermann, K.P., Liljeblad, B., Lindegren, R., Rudels, B.,
Swift, J.H., 1994b. Water masses and circulation in the
Eurasian basin: Results from the Oden 91 Expedition. Journal
of Geophysical Research 99, 3273–3283.
Anderson, L.A., Sarmiento, J.L., 1994. Redfield ratios of
remineralization determined by nutrient data analysis. Global
Biogeochemical Cycles 8 (1), 65–80.
Ashjian, C.J., Gallager, S.M., Plourde, S., 2005. Transport of
plankton and particles between the Chukchi and Beaufort
Sea. Deep-Sea Research II, this issue, doi:10.1016/
j.dsr2.2005.10.012.
Bates, N.R., Best, H.P., Hansell, D.A., 2005. Spatio-temporal
distribution of dissolved inorganic carbon and net community
production in the Chukchi and Beaufort Sea. Deep-Sea
Research II, this issue, doi:10.1016/j.dsr2.2005.10.005.
Belicka, L.L., Macdonald, R.W., Harvey, R.H., 2002. Sources
and transport of organic carbon to shelf, slope, and basin
surface sediments of the Arctic Ocean. Deep-Sea Research I
49, 1463–1483.
Bjork, G., 1989. A one-dimensional time-dependent model of the
vertical stratification of the upper Arctic Ocean. Journal of
Physical Oceanography 19, 52–67.
Coachman, L.K., Barnes, C.A., 1961. The contribution of Bering
Sea water to the Arctic Ocean. Arctic 14, 147–161.
Coachman, L.K., Aagaard, K., Tripp, R.B., 1975. Bering Strait:
the Regional Physical Oceanography. University of Washing-
ton Press, Seattle, WA (172pp).
Codispoti, L. Flagg, C., Kelly, V., 2005. Hydrographic conditions
during the 2002 SBI process experiments. Deep-Sea Research
II, this issue, doi:10.1016/j.dsr2.2005.10.007.
Daly, K.L., 1997. Flux of particulate matter through copepods in
the northeast Water Polynya. Journal of Marine Systems 10,
319–342.
Daly, K.L., Wallace, D.W.R., Smith, W.O., Skoog, A., Lara, R.,
Gosselin, M., Falck, E., Yager, P.L., 1999. Non-Redfield
carbon and nitrogen cycling in the Arctic: effects of ecosystem
structure and dynamics. Journal of Geophysical Research
101, 3185–3199.
Gardner, W.D., 1977. Incomplete extraction of rapidly settling
particles from water samplers. Limnology and Oceanography
22, 764–768.
Gosselin, M., Levasseur, M., Wheeler, P.A., Horner, R.A.,
Booth, B.C., 1997. New measurements of phytoplankton and
ice algal production in the Arctic Ocean. Deep-Sea Research
II 44, 1623–1644.
Grebmeier, J.M., 1993. Studies of pelagic-benthic coupling
extended onto the Russian continental shelf in the
Bering and Chukchi Seas. Continental Shelf Research 13,
653–668.
Grebmeier, J.M., Whitledge, T.E., 1996. Arctic System Science
Ocean–Atmosphere–Ice Interactions Biological Initiative in
the Arctic: Shelf–Basin Interactions Workshop, ARCSS/
OAII Report No. 4. University of Washington, Seattle
(39pp).
Grebmeier, J.M., Cooper, L.W., Codispoti, L.A., Benner, R.,
2004. Benthic carbon cycling and nutrient exchange in the
Arctic Shelf–Basin interactions ASBU study area. Session
SSI.01. Abstract ID 774. ASLO/TOS SBI Special Session,
Honolulu, Hawaii, 15–19 February 2004.
Gundersen, K., Orcutt, K.M., Purdie, D.A., Michaels, A.F.,
Knap, A.H., 2001. Particulate organic carbon mass distribu-
tion at the Bermuda Atlantic Time-series Study (BATS) site.
Deep-Sea Research II 48, 1697–1718.
Hakkinen, S., 1993. An Arctic source for the Great Salinity
Anomaly: a simulation of the Arctic ice-ocean system for
1955–1975. Journal of Geophysical Research 98,
16397–16410.
Hansell, D.A., Whitledge, T.E., Goering, J.J., 1993. Patterns of
nitrate utilization and new production over the Bering-
Chukchi shelf. Continental Shelf Research 13, 601–628.
Hill, V.J., Cota, G.F., 2005. Spatial patterns of primary
production in the Chukchi Sea in the spring and summer of
2002. Deep-Sea Research II, this issue, doi:10.1016/
j.dsr2.2005.10.001.
Huston, A.L., Deming, J.W., 2002. Relationships between
microbial extracellular enzymatic activity and suspended
and sinking particulate organic matter: seasonal transforma-
tions in the North Water. Deep-Sea Research II 49,
5211–5225.
Jones, E.P., Anderson, L.G., 1986. On the origin of chemical
properties of the Arctic Ocean halocline. Journal of Geophy-
sical Research 91, 10,759–10,767.
Jones, E.P., Anderson, L.G., 1990. On the origin of the properties
of the Arctic Ocean halocline north of Ellesmere Island:
results from the Canadian Ice Island. Continental Shelf
Research 10, 485–498.
Jones, E.P., Anderson, L.G., Wallace, D.W.R., 1991. Tracers of
near-surface, halocline and deep waters in the Arctic Ocean:
implications for circulation. Journal of Marine Systems 2,
241–255.
Kinney, P., Arhelger, M.E., Burrell, D.C., 1970. Chemical
characteristics of water masses in the Amerasian Basin of
ARTICLE IN PRESSN.R. Bates et al. / Deep-Sea Research II 52 (2005) 3324–33433342
the Arctic Ocean. Journal of Geophysical Research 75,
4097–4104.
Knap, A.H., Michaels, A.F., Dow, R.L., Johnson, R.J.,
Gundersen, K., Sorensen, J.C., Close, A., Howse, F.,
Hammer, M., Bates, N., Doyle, A., Waterhouse, T., 1997.
BATS Methods Manual. US JGOFS Planning and Coordina-
tion Office, Woods Hole.
Lobbes, J.M., Fitznar, H.P., Kattner, G., 2000. Biogeochemical
characteristics of dissolved and particulate organic matter in
Russian rivers entering the Arctic Ocean. Geochimica et
Cosmochimica Acta 64, 2973–2983.
Macdonald, R.W., McLaughlin, F.A., Carmack, E.C., 2002.
Fresh water and its sources during the SHEBA drift in the
Canada Basin of the Arctic Ocean. Deep-Sea Research I 49,
1769–1785.
Manabe, S., Stouffer, RE.J., 2000. Study of abrupt climate
change by a coupled ocean-atmosphere model. Quaternary
Science Reviews 19, 285–299.
Michel, C., Gosselin, M., Nozais, C., 2002. Preferential sinking
export of biogenic silica during the spring and summer in the
North Water Polynya (northern Baffin Bay): Temperature or
biological control. Journal of Geophysical Research 107 (C7)
1-1–1-13.
Moran, S.B., Ellis, K.M., Smith, J.N., 1997. Th-234/U-238
disequilibrium in the central Arctic Ocean: implications for
particulate organic carbon export. Deep-Sea Research I 44
(8), 1593–1606.
Moran, S.B., Charette, M.A., Pike, S.M., Wicklund, C.A., 1999.
Differences in seawater particulate organic carbon concentra-
tion in samples collected using small-and large-volume
methods: the importance of DOC adsorption to the filter
blank. Marine Chemistry 67, 33–42.
Moran, S.B, Kelly, R., Hagstrom, K., Smith, J., Grebmeier, J.,
Cooper, L. Cota, G.F., Walsh, J.J. Bates, N.R., Hansell,
D.A., Maslowski, W., 2005. Seasonal changes in POC export
flux in the Chukchi Sea and implications for water
column–benthic coupling in Arctic Shelves. Deep-Sea Re-
search II, this issue, doi:10.1016/j.dsr2.2005.09.011.
Moritz, R.E., Perovich, D.K., 1996. Arctic System
science ocean–atmosphere–ice interactions. SHEBA.
surface heat budget of the Arctic Ocean science plan.
ARCSS/OAII Report No. 5. University of Washington,
Seattle (60pp).
Mysak, L.A., Manak, D.K., Marsden, R.F., 1990. Sea ice
anomalies in the Greenland and Labrador Seas during
1901–1984 and their relation to an interdecadal Arctic climate
cycle. Climate Dynamics 5, 111–133.
Olli, K., Wexels Riser, C., Wassmann, P., Ratkova, T.,
Arashkevich, E., Pasternak, A., 2002. Seasonal variation in
vertical flux of biogenic matter in the marginal ice zone and
the central Barents Sea. Journal of Marine Systems 38,
189–204.
Pike, S.M., Moran, S.B., 1997. Use of Poretics 0.7mm glass
fiber filters for determination of particulate organic carbon
and nitrogen in aquatic systems. Marine Chemistry 57,
355–360.
Redfield, A.C., Ketchum, B.H., Richard, F.A., 1963.
The influence of organisms on the composition of sea-
water. In: Hill, M.N. (Ed.), The Sea. Wiley, New York,
pp. 27–77.
Salmon, D.K., McRoy, C.P., 1994. Nutrient-based tracers in the
Western Arctic: A new lower halocline water defined. In:
Johannessen, O.M., Muench, R.D., Overland, J.E. (Eds.),
The Polar Oceans and Their Role in Shaping the Global
Environment. American Geophysical Union, Geophysical
Monograph, vol. 85, pp. 47–61.
Sambrotto, R.N., Goering, J.J., McRoy, C.P., 1984. Large yearly
production of phytoplankton in the western Bering Sea.
Science 225, 1147–1155.
Schlosser, P., Swift, J.H., Lewis, D., Pfirman, S., 1995.
The role of the large-scale Arctic Ocean circulation in the
transport of contaminants. Deep-Sea Research II 42,
1341–1368.
Takahashi, Broecker, W.S., lLanger, S., 1985. Radfield ratio
based on chemical data from isopycnal surfaces. Journal of
Geophysical Research 90 (NC4), 6907–6924.
Thomas, H., Ittekkot, V., Osterroht, C., Schneider, B., 1999.
Preferential recycling of nutrients—the ocean’s way to
increase new production and to pass nutrient limitation?
Limnology and Oceanography 44 (8), 1999–2004.
Tremblay, J.E., Gratton, Y., Fauchot, J., Price, N.M., 2002.
Climatic and oceanic forcing of new, net and diatom
production in the North Water. Deep-Sea Research II 49,
4927–4946.
Wallace, D.W.R., Moore, R.M., Jones, E.P., 1987. Ventilation of
the Arctic Ocean cold halocline: rates of diapycnal and
isopycnal transport, oxygen utilization and primary produc-
tion inferred using chlorofluoromethane distributions. Deep-
Sea Research 34, 1957–1979.
Walsh, J.J., 1995. DOC storage in the Arctic sea: the role
of continental shelves. In: Smith, Jr, W.O., Grebmeier,
J.M. (Eds.), Arctic Oceanography: Marginal Ice Zones
and Continental Shelves, Coastal and Estuarine Studies,
vol. 49. American Geophysical Union, Washington, DC,
pp. 203–230.
Walsh, J.E., Chapman, W.L., 1990. Arctic contribution to upper
ocean variability in the North Atlantic. Journal of Climate 3,
1462–1473.
Walsh, J.J., Bryan, F., Cattle, H., Dickinson, R., Moritz, R.E.,
Mysak, L., 1990. Global-Arctic interactions. In: Moritz, R.E.,
Aagaard, K., Baker, D.J., Codispoti, L.A., Smith, S.L.,
Smith, W.O., Tipper, R.C., Walsh, J.J. (Eds.), Arctic
System Science: Ocean–Atmosphere–Ice Interactions.
Joint Oceanographic Institutions, Washington, DC, pp.
75–111.
Walsh, J.J., Dieterle, D.A., Muller Karger, F.E., Aagaard, K.,
Roach, A.T., Whitledge, T.E., Stockwell, D., 1997. CO2
cycling in the coastal ocean 2. Seasonal organic loading of the
Arctic Ocean from source waters in the Bering Sea.
Continental Shelf Research 17 (1), 1–36.
Walsh, J.J., Dieterle, D.A., Maslowski, W., Grebmeier,
J.M., Whitledge, T.E., Flint, M., Sukhanova, I.N.,
Bates, N.R., Cota, G.F., Stockwell, D., Moran, S.B.,
Hansell, D.A., McRoy, C.P., 2005. A numerical model of
seasonal primary production within the Chukchi/Beaufort
Seas. Deep-Sea Research II, this issue, doi:10.1016/
j.dsr2.2005.09.009.
Wheeler, P.A., Watkins, J.M., Hansing, R.L., 1997. Nutrients,
organic carbon and organic nitrogen in the upper water
column of the Arctic Ocean: implications for sources of
dissolved organic carbon. Deep-Sea Research II 44,
1571–1592.
Woodgate, R.A, Aagaard, K., Weingartner, T., 2005a. A year in
the physical oceanography of the Chukchi Sea—moored
ARTICLE IN PRESSN.R. Bates et al. / Deep-Sea Research II 52 (2005) 3324–3343 3343
measurements 1990–1991. Deep-Sea Research II, this issue,
doi:10.1016/j.dsr2.2005.10.016.
Woodgate, R.A., Aagaard, K., Weingartner, T., 2005b. Monthly
temperature, salinity and transport variability of the Bering
Strait throughflow. Geophysical Research Letters 32, L04601.
Yunker, M., Belicka, L., Harvey, R., Macdonald, R.E., 2005.
Tracing the inputs and fate of marine and terrigenous organic
matter in Arctic Ocean sediments: a multivariate analysis
of lipid biomarkers. Deep-Sea Research II, this issue,
doi:10.1016/j.dsr2.2005.09.008.