SEAMAP Atlas 2008 - Gulf States Marine Fisheries Commission Number 191.pdf · seamap number 191...
65
gulf states marine fisheries commission number 191 june 2011 seamap environmental and biological atlas of the gulf of mexico 2008
Transcript of SEAMAP Atlas 2008 - Gulf States Marine Fisheries Commission Number 191.pdf · seamap number 191...
gulf states marine fisheries commission
number 191 june 2011seam
ap
environmental and
biological atlas of
the gulf of mexico
2008

SEAMAP ENVIRONMENTAL AND BIOLOGICALATLAS OF THE GULF OF MEXICO, 2008
Edited by
Manuscript Design and Layout
Cheryl R. NobleGulf States Marine Fisheries Commission
GULF STATES MARINE FISHERIES COMMISSIONJune 2011
Number 191
This project was supported in part by the National Oceanic andAtmospheric Administration, National Marine Fisheries Service,under State/Federal Project Number NA06NMF4350007.
Jeffrey K. ResterGulf States Marine Fisheries Commission

GULF STATES MARINE FISHERIES COMMISSION COMMISSIONERS
ALABAMA N. Gunter Guy, Jr. Alabama Department of Conservation and Natural Resources 64 North Union Street Montgomery, AL 36130-1901 TBA Chris Nelson Bon Secour Fisheries, Inc. P.O. Box 60 Bon Secour, AL 36511 FLORIDA Nick Wiley, Executive Director FL Fish and Wildlife Conservation Commission 620 South Meridian Street Tallahassee, FL 32399-1600 Senator Thad Altman State Senator, District 24 6767 North Wickham Road, Suite 211 Melbourne, FL 32940 Stephen M. Greep, Jr. 2725 NE 26th Terrace Fort Lauderdale, Florida 33306 LOUISIANA Robert Barham, Secretary LA Department of Wildlife and Fisheries P.O. Box 98000 Baton Rouge, LA 70898-9000
Senator Butch Gautreaux 714 2nd Street Morgan City, LA 70380 Campo Matens 4554 Emory Avenue Baton Rouge, LA 70808 MISSISSIPPI William Walker, Executive Director Mississippi Department of Marine Resources 1141 Bayview Avenue Biloxi, MS 39530 Senator Tommy Gollott 235 Bayview Avenue Biloxi, MS 39530
Joe Gill, Jr. Joe Gill Consulting, LLC 910 Desoto Street Ocean Springs, MS 39566-0535 TEXAS Carter Smith, Executive Director Texas Parks and Wildlife Department 4200 Smith School Road Austin, TX 78744 Senator Mike Jackson Texas Senate P.O. Box 12068 Austin, TX 78711 Troy B. Williamson, II 111 Causeway Portland, TX 78374
STAFF Larry B. Simpson Executive Director
David M. Donaldson V.K. “Ginny” Herring Nancy K. Marcellus Cheryl R. Noble Steven J. VanderKooy Jeffrey K. Rester Gregory S. Bray
Joseph P. Ferrer, III Douglas J. Snyder Deanna L. Valentine Donna B. Bellais Wendy L. Garner Robert W. Harris Ralph E. Hode
James R. Ballard Alexander L. Miller Lloyd W. Kirk Debora K. McIntyre Alyce R. Catchot Angela R. Rabideau

SEAMAP SUBCOMMITTEE
Mr. Read Hendon, Chairman Gulf Coast Research Laboratory
Mr. Myron Fischer Louisiana Department of Wildlife and Fisheries Mr. John Mareska Alabama Department of Conservation and Natural Resources Mr. Fernando Martinez-Andrade Texas Parks and Wildlife Department
Mr. Butch Pellegrin
National Marine Fisheries Service Pascagoula Laboratory
Mr. Bob McMichael
Florida Fish and Wildlife Conservation Commission
Florida Fish and Wildlife Research Institute
Mr. John Froeschke Gulf of Mexico Fishery Management Council
Mr. Jeffrey K. Rester SEAMAP Coordinator
Gulf States Marine Fisheries Commission
DATA COORDINATING WORK GROUP
Mr. Lloyd W. Kirk, Leader
Gulf States Marine Fisheries Commission
Mr. Butch Pellegrin National Marine Fisheries Service Pascagoula Laboratory Dr. Joanne Shultz National Marine Fisheries Service Pascagoula Laboratory
Mr. John Anderson
Gulf Coast Research Laboratory
Mr. Michael Murphy Florida Fish and Wildlife
Conservation Commission Florida Fish and Wildlife Research Institute

INTRODUCTION The Southeast Area Monitoring and Assessment Program (SEAMAP) is a State/Federal/university program for the collection, management, and dissemination of fishery-independent data (information collected without direct reliance on statistics reported by commercial or recreational fishermen) in United States waters of the Gulf of Mexico (Eldridge 1988). A major SEAMAP objective is to provide a large, standardized database needed by management agencies, industry, and scientists to wisely manage and develop fishery resources for the least possible cost. To accomplish this goal, survey data must be disseminated in a useful format to SEAMAP participants, cooperators, and other interested organizations.
The SEAMAP Program began in March 1981 when the National Marine Fisheries Service (NMFS), Southeast Fisheries Science Center (SEFSC), presented a SEAMAP Strategic Plan (1981) to the Gulf States Marine Fisheries Commission (GSMFC). This strategic plan outlined the proposed program organization (goals, objectives, procedures, resource requirements, etc.). A SEAMAP Subcommittee was then formed within the existing framework of the GSMFC. The Subcommittee consists of one representative from each state fishery management agency [Florida Fish and Wildlife Conservation Commission (FWC); Alabama Department of Conservation and Natural Resources (ADCNR); Mississippi Department of Marine Resources (MDMR) represented by the University of Southern Mississippi, Gulf Coast Research Laboratory (USM/GCRL); Louisiana Department of Wildlife and Fisheries (LDWF); and Texas Parks and Wildlife Department (TPWD)], one from NMFS SEFSC and a non-voting member representing the Gulf of Mexico Fishery Management Council (GMFMC). The Subcommittee has organized and successfully coordinated numerous resource surveys from 1982 through 2008 (Table 1). The resultant data are published in atlases for the surveys in 1982 (Stuntz et al. 1985); 1983 (Thompson and Bane 1986a); 1984 (Thompson and Bane 1986b); 1985 (Thompson et al. 1988); 1986 (Sanders et al. 1990a); 1987 (Sanders et al. 1990b); 1988 (Sanders et al. 1991a); 1989 (Sanders et al. 1991b); 1990 (Sanders et al. 1992); 1991 (Donaldson et al. 1993); 1992 (Donaldson et al. 1994); 1993 (Donaldson et al. 1996); 1994 (Donaldson et al. 1997a); 1995 (Donaldson et al. 1997b); 1996 (Donaldson et al. 1998); 1997 (Rester et al. 1999); 1998 (Rester et al. 2000); 1999 (Rester et al. 2001); 2000 (Rester et al. 2002); 2001 (Rester et al. 2004); 2002 (Rester et al. 2008); 2003 (Rester et al. 2009); 2004 (Rester 2009); 2005 (Rester 2010); 2006 (Rester 2010); and 2007 (Rester). Environmental assessment activities occurred with each of the surveys found in Table 1. All data are available to researchers or interested individuals. Details about how to obtain SEAMAP data can be found in the Data Request section of this document. In March 2008, the SEAMAP Subcommittee identified and began to plan the year's SEAMAP survey activities for the Gulf of Mexico. In keeping with the program goal of establishing a coordinated long-term resource database, it was decided to continue the same types of survey activities conducted in 1982 through 2007. Overall survey objectives in 1982 to 2008 were to assess the distribution and abundance of recreational and commercial organisms collected by plankton, trap/video, bottom longlines, and trawl gears and document environmental factors that might affect their distribution and abundance. Data from plankton surveys are used for detection and assessment of fishery resources; in the determination of spawning seasons and areas; in investigations of early survival and recruitment mechanisms; and in estimation of the abundance of a stock based on its spawning production (Sherman et al. 1983). Assessment of the Texas Closure (Nichols 1982, 1984; Nichols and Poffenberger 1987) was the rationale for the establishment of the trawl surveys and to establish a seasonal database to assess the abundance and distribution of the shrimp and groundfish stocks across the northern Gulf of Mexico. The Reef Fish Survey is designed to determine the relative abundance

of reef fish populations and habitat using a fish trap/video recording system (Russell, unpublished report). A major purpose of SEAMAP is to provide resource survey data to State and Federal management agencies and universities participating in SEAMAP activities. This twenty-sixth in a series of SEAMAP environmental and biological atlases presents such data, in a summarized form, collected during the 2008 SEAMAP surveys.
MATERIALS AND METHODS Methodology for the 2008 SEAMAP surveys is similar to that of the 1982 through 2007 surveys. Sampling was conducted within the U.S. Exclusive Economic Zone (EEZ) and state territorial waters. The NOAA Ship OREGON II collected plankton and environmental data during the Winter Plankton Survey from February 7 to March 15. The NOAA Ship GORDON GUNTER collected plankton and environmental data during the Spring Plankton Survey from April 20 to May 30, while the USM/GCRL vessel TOMMY MUNRO collected data from June 20 to June 21. Vessels that participated in collecting plankton and environmental data during the Fall Plankton Survey included the NOAA Ship GORDON GUNTER (September 5 – September 30), USM/GCRL vessel TOMMY MUNRO (September 27-29) and the Alabama vessel A.E. VERRILL (September 17). The Louisiana vessel PELICAN sampled waters off Louisiana from April 1-4 during the Spring Shrimp/Groundfish Survey. Vessels that participated in the Summer Shrimp/Groundfish Survey and concurrently sampled plankton and environmental data included the USM/GCRL vessel TOMMY MUNRO (May 31 – June 3), the Louisiana vessel PELICAN (June 23-26), and the NOAA Ship OREGON II (June 11 – July 16). The A.E. VERRILL (June 2-16) and the TPWD vessels TRINITY BAY, SAN JACINTO, SABINE, MATAGORDA BAY, and NUECES (June 2-24) did not sample plankton in conjunction with the summer survey. For the first time, Florida participated in the Summer Shrimp/Groundfish Survey using the TOMMY MUNRO to sample on the west Florida shelf from August 1-10. Florida also did not sample plankton. The NOAA Ship CARETTA participated in the Reef Fish Survey from February 2 – March 12. The NOAA Ship OREGON II participated in the Reef Fish Survey from April 13 – May 21, while the NOAA Ship GANDY participated in the Reef Fish Survey from June 12 – August 10. Vessels that participated in the Fall Shrimp/Groundfish Survey and concurrently sampled plankton and environmental data included the NOAA Ships OREGON II (October 10 – November 18); the USM/GCRL vessel TOMMY MUNRO (November 19); and the Louisiana vessel PELICAN (September 23-26). The Alabama vessel A.E. VERRILL (November 7-17), Florida using the TOMMY MUNRO (October 15-22), and TPWD vessels TRINITY BAY, SAN JACINTO, SABINE, MATAGORDA BAY, and NUECES (November 3–20) did not sample plankton in conjunction with the fall survey. Mississippi began an Inshore Bottom Longline Survey that compliments an existing NMFS offshore bottom longline survey. Mississippi conducted bottom longline sampling monthly from March 12 to October 16.

PLANKTON SURVEYS Since 1982, SEAMAP resource surveys have been conducted by the National Marine Fisheries Service in cooperation with the states of Florida, Alabama, Mississippi, Louisiana, and Texas. Plankton sampling is carried out during these surveys at predetermined SEAMAP stations arranged in a fixed, systematic grid pattern across the entire Gulf of Mexico. Most but not all SEAMAP stations (designated by a unique SEAMAP number) are located at ~56 km or ½-degree intervals along this grid. Some SEAMAP stations are located at < 56 km intervals especially along the continental shelf edge, while others have been moved to avoid obstructions, navigational hazards, or shallow water. Most SEAMAP plankton samples are taken during either dedicated plankton or shrimp/bottomfish (trawl) surveys, but over the years additional samples were taken using SEAMAP gear and collection methods at locations other than designated SEAMAP stations and/or outside established SEAMAP surveys, e.g. during Louisiana seasonal trawl surveys, SEAMAP Squid/Butterfish survey; and other serendipitous or special projects. The sampling gear and methodology used to collect SEAMAP plankton samples are similar to those recommended by Kramer et al. (1972), Smith and Richardson (1977) and Posgay and Marak (1980). A 61 cm bongo net fitted with 0.333 (0.335)1 mm mesh netting is fished in an oblique tow path from a maximum depth of 200 m or to 2-5 m off the bottom at depths less than 200 m. A mechanical flowmeter is mounted off-center in the mouth of each bongo net to record the volume of water filtered. Volume filtered ranges from ~20 to 600 m3, but is typically 30 to 40 m3 at the shallowest stations and 300 to 400 m3 at the deepest stations. A single or double 2x1 m pipe frame neuston net fitted with 0.947 (0.950)1 mm mesh netting is towed at the surface with the frame half-submerged for 10 minutes. Samples are taken upon arrival on station regardless of time of day. At each station either a bongo and/or neuston tow are made depending on the specific survey. Samples are routinely preserved in 5 to 10 % formalin and later transferred after 48 hours to 95 % ethanol for long-term storage. During some surveys, selected samples are preserved initially in 95 % ethanol and later transferred to fresh ethanol. Initial processing of one bongo sample and one neuston sample (except those collected by Louisiana vessels) from each SEAMAP station was accomplished at the Sea Fisheries Institute, Plankton Sorting and Identification Center (ZSIOP), in Szczecin, Poland, under a Joint Studies Agreement with NMFS. Plankton samples collected by Louisiana vessels were retained by LDWF for sorting and identification at their facilities using the same protocols used at ZSIOP. Wet plankton volumes of bongo net samples were measured by displacement to estimate net-caught zooplankton biomass (Smith and Richardson 1977). Fish eggs and larvae were removed from bongo net samples, and fish larvae only from neuston net samples. Fish eggs were not identified further, but larvae were identified to the lowest possible taxon (to family in most cases). Body length (either notochord or standard length) was measured. Sorted ichthyoplankton specimens from ZSIOP and LDWF were sent to the SEAMAP Archiving Center, managed in conjunction with the FWC, for long-term storage under museum conditions. Sorted ichthyoplankton samples from 1982 through 2008 are available for loan to researchers throughout the country. The alternate bongo and neuston samples from each station are retained at USM/GCRL as a backup for those samples transshipped to ZSIOP in case of loss or damage during transit. These backup unsorted plankton samples are curated and housed at the SEAMAP
1 Mesh size change in database does not represent an actual change in gear but only a change in the accuracy at which plankton mesh aperture size can be measured by the manufacturer.

Invertebrate Plankton Archiving Center, managed in conjunction with USM/GCRL, and are available for use by researchers. See the SEAMAP Operations Manual for a more detailed description of sampling methods and protocols. Refer to the NOAA vessel cruise reports for more specific information on the individual SEAMAP Plankton Surveys conducted during 2008. ENVIRONMENTAL DATA Standardized methodology was used although the actual parameters measured varied among vessels participating in each survey. These parameters were measured based on equipment availability. The following parameters were recorded: Vessel: Vessel code for each vessel. Station: Station identifiers varied by state and vessel. Cruise: Cruise numbers varied by state and vessels. Date: Month/Day/Year. Time: Local time and time zone, recorded at the start of sampling. Latitude/longitude: Recorded to seconds. Barometric pressure: Recorded in millibars. Wave height: Estimated visually in meters. Wind speed and direction: Recorded in knots with direction recorded in compass degrees from which the wind was blowing. Air temperature: Recorded in Centigrade. Cloud cover: Estimated visually in percent cloud cover. Secchi depth: Secchi depth in meters, estimated at each daylight station. Standard oceanographic 30-cm white discs were lowered until no longer visible, and then raised until visible. If different depths were recorded, an average was used. Water Color: Forel-Ule data was recorded. The following parameters were measured at the surface, mid-depth, and bottom; for bottom depths greater than 200 m, samples were taken at surface, 100 m and 200 m: Water temperature: Temperatures were measured by a hand-held thermometer or by in situ
electronic sensors onboard ship. No attempt was made to intercalibrate the various instruments used on individual vessels although several vessels did sample together to calibrate other sampling gear. Some error can be expected.
Salinity: Salinity samples were collected by Niskin bottles and stored for laboratory analysis with a salinometer. Conductivity probes or refractometers were used on some vessels. Salinity samples were also measured with in situ electronic sensors.
Chlorophyll: Chlorophyll samples were collected and frozen for later laboratory analysis. The general procedure for shipboard collection of chlorophyll was to collect more than 9 liters of water from the surface. This was kept stirred by bubbling air through it while filtration was being done. Three samples, to each of which a 1 ml, 1% (W/V), suspension of MgCO3 was added, of up to 3 liters of water from the 9 liter sample were filtered through GF/C filters. The three filters were placed individually in Petri dishes, wrapped in opaque material and frozen until analysis. Each of the three samples was analyzed separately in the laboratory. Values in the tables that follow are the mean of the three samples.

Laboratory analyses for chlorophyll a and phaeophytin a (chlorophyll degradation product) were conducted by fluorometry and spectrophotometry. The general extraction procedures prior to measurement were similar. Samples analyzed by spectrophotometer included other chlorophyllous products, but these have not been included as data in this report. The methodology used is described in Strickland and Parsons (1972) and Jeffrey and Humphrey (1975). Some of the values have been deleted from the database because of analytical errors. In addition, chlorophyll samples data were also collected using a CTD. This method only obtains measures of chlorophyll a and is a measure of fluorescence (FL) and appears in the Tables as such.
Dissolved oxygen: Dissolved oxygen values were measured by electronic probes or by the Winkler titration method. No attempts were made to intercalibrate the methods. When oxygen was measured in samples collected from a Niskin sampler, the oxygen bottles were allowed to overflow a minimum of 10 seconds to eliminate oxygen contamination. The tubing which delivered the water sample was inserted to the bottom of the bottle and withdrawn while the sample was still flowing. The oxygen bottles were sealed with a ground-glass stopper and analyzed onboard the vessels.
Turbidity: Turbidity values were measured by electronic probes when equipment was available. TRAWL SURVEYS Summer Shrimp/Groundfish Survey The sampling strategy and a description of the statistical rationale for the sampling design as described by Nichols in the 1982 SEAMAP Atlas (Stuntz et al. 1985) have been modified. Since 1987, the strategy has been that day/night sampling sites were chosen randomly in areas stratified by depth and statistical area. These areas are shrimp statistical zones 4 through 22 (Figure 1). Trawl stations sampled by NMFS, Florida, Alabama, Mississippi, and Louisiana are made with a standard SEAMAP 40-ft net, and Texas sampled with a 20-ft net. Depth strata consisted of 1 fm intervals from 5 to 20 fm, a 2 fm interval from 20 to 22 fm, a 3 fm interval from 22 to 25 fm, 5 fm intervals from 25 to 50 fm and a 10 fm interval from 50 to 60 fm. Trawls were towed perpendicularly to the depth contours and covered the entire depth stratum on each station. Single tows were for a maximum of 55 minutes; for certain stations, a series of consecutive trawl tows was necessary to cover a given depth stratum, with a minimum individual tow across each stratum of 10 minutes and a maximum tow of 55 minutes. The Texas vessels towed 10 minutes parallel to the depth stratum. The Louisiana samples did not cover a complete depth stratum on several stations because of the distance between depth contours. All Litopenaeus setiferus, Farfantepenaeus aztecus, and Farfantepenaeus duorarum were separated from the trawl catch at each station. Total count and weight by species were recorded for each station. A sample of up to 200 shrimp of each species from every trawl was sexed and measured to obtain length-frequency information. Estimated total numbers were derived from the total weights of those processed. Other species of fishes and invertebrates were identified, enumerated, and weighed. Weights and individual measurements on selected species, other than commercial shrimp, were also recorded. Fall Shrimp/Groundfish Survey The design of the Fall Survey was similar to the Summer Shrimp/Groundfish Survey. During the Fall Survey trawl stations were made with the standard 40-ft and 20-ft SEAMAP nets and covered NMFS

shrimp statistical zones 4 through 22 (Figure 1). Catch rates on all the vessels sampling were treated in the same manner as the Summer Shrimp/Groundfish Survey, with the exception to shrimp catches, where only 20 shrimp of each species from every trawl were measured, although Louisiana measures a minimum of 50 shrimp. Spring Shrimp/Groundfish Survey The design of the Spring Survey was similar to the other Shrimp/Groundfish Surveys. During the Spring Survey, Louisiana completed trawl stations off the coast of Louisiana in NMFS shrimp statistical zones 13 through 15 (Figure 1). Catch rates were treated in the same manner as the other Shrimp/Groundfish Survey, with the exception to shrimp catches, where Louisiana measures a minimum of 50 shrimp. REEF FISH SURVEY The primary purpose of this survey is to assess relative abundance and compute population estimates of reef fishes found on natural reef fish habitat in the Gulf of Mexico. Two types of gear are used to deploy video cameras: 1) a single-funnel fish trap (2.13 m long by 0.76 m square) with the camera mounted at a height of 25 cm above the bottom of the trap; or 2) a 4 camera array with 4 cameras mounted orthogonal to each other at a height of 25 cm above the bottom. Both gears are baited with squid before deployment. The resultant video recordings (typically of one-hour duration) are processed back at the laboratory where fishes are identified and counted independently by two tape readers. Final counts are entered into the SEAMAP reef fish database along with additional observations on habitat and fish activity. The hardbottom database from which sampling sites for this survey are chosen was developed in the following manner. Areas of natural reef habitat from Brownsville, Texas to the southern tip of Florida (at 81E00' W longitude and 24E02' N latitude) and between 9 and 110 m water depth were first inscribed on navigation charts, then divided into 10 by 10 nautical mile blocks (primary sample units). Each block was subdivided into 100-m2, secondary sample units that were numbered and initially classified as being “reef” or “nonreef” and then entered into a database. Prior to the survey, blocks are selected from this database in the eastern and western Gulf with probability proportional to the number of “reef” sample units within a block. Within each selected block, 100 sample sites are randomly selected. During the survey each selected block is occupied for one 24-h period, where night hours are devoted to ship’s echo sounder surveys of up to 100 sites and daytime hours to trap/video sampling. Each potential sample site surveyed at night is given a final determination as being either a reef site or not based on echo patterns, vertical relief and other characteristics. Up to 8 actual “reef” sites are then randomly selected for sampling during that day (Russell, unpublished report). Trap/video sampling begins one hour after sunrise and ends one hour before sunset. Trap soak time is one hour. Associated environmental data collected at each site usually includes profiles of salinity, temperature, and surface chlorophyll; and may include profiles of dissolved oxygen, light transmittance, and fluorescence. Additional environmental and meteorological observations taken on stations follow standard SEAMAP methodology. During the NMFS component of the Reef Fish Survey, fish abundance is also measured with a fisheries acoustic device.

INSHORE BOTTOM LONGLINE SURVEY This near shore survey complements an existing long-term fisheries independent survey currently being conducted by NMFS offshore, by targeting shark and finfish species within the shallow waters of the north central Gulf of Mexico. The objectives of the survey are to collect information on coastal shark and finfish abundances and distribution with a 1-mile longline and to collect environmental data. During the 2008 Inshore Bottom Longline Survey, the survey design included three Gulf of Mexico sampling regions: Mississippi Sound, South of the Mississippi Barrier Islands, and Northern Chandeleur Sound. Stations were chosen randomly within each area and were stratified by depth (0-5m, 5-10m, and 10-20m). The stations were sampled over a four-day period between the hours of 7:30 a.m. and 7:30 p.m. each month. The sampling protocol follows the procedures established by the NMFS bottom longline survey. All equipment used in this inshore shark survey is identical to the equipment used by NMFS. The longline gear consisted of a 1.6 km (426 kg test monofilament) mainline with 100 gangions (3.66 m, 332 kg test monofilament) containing #15/0 circle hooks (0 offset) and baited with Atlantic mackerel, Scomber scomber. The mainline was weighted down with a midpoint and endpoint weights. Radar high-flyers with strobe bullet buoys were used to mark the longline locations. A hydraulic longline reel was used for setting and retrieving the mainline. The longline was fished for 1-hr and then retrieved. This research is conducted on the USM/GCRL vessel TOM MCILWAIN.
RESULTS PLANKTON SURVEYS The SEAMAP Archiving Center received 26,136 identified ichthyoplankton lots in 2008. Most of these samples have been accessioned into the SEAMAP Archiving Center computer systems and the remaining samples are being prepared for accession. Plankton stations for the Winter Plankton Survey in conjunction with environmental are shown in Figure 2. Plankton stations for the Spring Plankton Survey in conjunction with environmental are shown in Figure 3. Plankton stations for the Spring Shrimp/Groundfish Survey are shown in Figure 4. The plankton stations for the Summer Shrimp/Groundfish Survey are shown in Figure 5. Plankton stations for the Fall Plankton Survey in conjunction with environmental are shown in Figure 6. Plankton stations for the Fall Shrimp/Groundfish Survey are shown in Figure 7. TRAWL SURVEYS Spring Shrimp/Groundfish Survey Louisiana completed the Spring Shrimp/Groundfish Survey in April. It has always been a goal of SEAMAP to conduct seasonal trawl surveys, but funding limitations have prevented all SEAMAP partners from participating. A plot of station locations is presented in Figure 8 with a plot of the trawl locations in Figure 9.

Summer Shrimp/Groundfish Survey Shrimp and groundfish sampling was conducted during May through August from off Tampa, Florida to Brownsville, Texas. Figure 10 shows station locations and Figure 11 shows trawl locations. The Summer Shrimp/Groundfish Survey consisted primarily of biological trawl data and concomitant environmental and plankton data. A species composition listing from the 40-ft and 20-ft trawls is presented in Table 2, ranked in order of abundance, within the categories of finfish, crustaceans, and other invertebrates. Fall Shrimp/Groundfish Survey Shrimp and groundfish sampling was conducted from September through November from off Tampa, Florida to Brownsville, Texas. Figure 12 shows the station locations and Figure 13 shows trawl locations. The Fall Shrimp/Groundfish Survey consisted of biological trawl data, concomitant environmental, and plankton data. A species composition listing from the 40-ft and 20-ft trawls is presented in Table 3, ranked in order of abundance, within the categories of finfish, crustaceans, and other invertebrates. REAL-TIME DATA MANAGEMENT The SEAMAP Subcommittee agreed it was imperative to the success of the SEAMAP Program to distribute data on a near real-time basis to the fishing industry and others interested in SEAMAP. Summarized data were distributed weekly to approximately 200 individuals during the Summer Shrimp/Groundfish Survey. The summarized data in the form of computer plots and data listings were sent to management agencies and industry members. These plots showed station locations, catches of brown, pink, and white shrimp in lb/hr and count/lb, and total finfish catch in lb/hr. REEF FISH SURVEY Primary data collection and sampling for reef fish assessment were conducted during February through August by NMFS personnel. Station locations are plotted in Figure 14. A species composition listing from the traps is presented in Table 4. The species list for Table 3 is ranked in order of abundance. Video tapes from all sources were analyzed using NMFS standardized protocols. INSHORE BOTTOM LONGLINE SURVEY Station locations for the Inshore Bottom Longline Survey are plotted in Figure 15. A species composition list is presented in Table 5. The species list is ranked in order of abundance.
DISCUSSION
The quasisynoptic SEAMAP sampling program and the intended long-term nature of the sampling programs have been designed to provide the baseline data set needed for fishery management and conservation. In 1985, the SEAMAP long-term baseline data was disrupted by the loss of the Spring Gulf-wide plankton and Fall Mackerel Survey. In 1986, the SEAMAP Subcommittee renewed its commitment for the collection of baseline plankton data. These ichthyoplankton samples are and will continue to be used by researchers studying taxonomy, age and growth, bioenergetics, and other life

history aspects, as well as spawning biomass and recruitment. Information on species’ relative distributions within the Gulf of Mexico can be analyzed with respect to environmental data to assess population abundance as a function of environmental change. Similar analyses and investigations are being undertaken with Summer and Fall Shrimp/Groundfish Survey data. These data sets are being utilized in resource management decisions, and because of the program’s ability to process data quickly, the capability exists to optimize some fisheries on a real-time basis. The long-term data set on all of the species collected, not just those of commercial and recreational importance, offers an opportunity to examine ecological relationships, with the eventual goal of developing management models that take into account the multi-species nature of most Gulf fisheries. The value of the SEAMAP program lies in its use for both immediate and long-range management goals. Much use has already been made of SEAMAP data. For example, during the past SEAMAP surveys an area of very low dissolved bottom oxygen was found off Louisiana in the summers of 1982, 1985-2007. The presence of this phenomenon and some of the related conditions and biological effects were reported by Leming and Stuntz (1984) and Hanifen et al. (1995), and during such occurrences, SEAMAP has distributed special environmental bulletins and news releases to management agencies and the shrimp industry. In addition, SEAMAP data were used to assist in the identification of the minimum 1997 reduction in red snapper shrimp trawl bycatch mortality rate that would enable the red snapper fishery to still recover to the 20% spawning potential ratio (SPR) by the year 2019 (Goodyear 1997). This analysis was requested and supported by the Gulf of Mexico Fishery Management Council to address the issue of red snapper bycatch. SEAMAP data were also used by some coastal states to determine the status of shrimp stocks and their movements just as the shrimping seasons were to be opened and SEAMAP data were used to develop a guide to the grouper species of the western North Atlantic Ocean (Grace et al. 1994). The primary purpose of the guide is for species identification with projects that deploy underwater video camera systems. Since SEAMAP=s inception in 1982, the goal of plankton activities in the Gulf of Mexico has been to collect data on the early life stages of fishes and invertebrates that will complement and enhance the fishery-independent data gathered on the adult life-stage (Lyczkowski-Shultz and Brasher 1996). An annual larval index for the Atlantic bluefin tuna is generated each year from the Spring Plankton Survey and is used by the International Commission for the Conservation of Atlantic Bluefin Tunas to estimate stock size (Scott et al. 1993). Larval indices generated from the Summer Shrimp/Groundfish and Fall Plankton Surveys have now become an integral part of the king mackerel assessment in the Gulf (Gledhill and Lyczkowski-Shultz 2000). Larvae from SEAMAP collections have formed the basis for formal descriptions of larval development for fishes such as the snappers, cobia, tripletail, and dolphin (Drass et al. 2000; Ditty and Shaw 1992; Ditty and Shaw 1993; Ditty et al. 1994). Data on distribution and relative abundance of larvae of all Gulf fishes captured during SEAMAP surveys have been summarized by Richards et al. 1984, Kelley et al. 1985, Kelley et al. 1990, and Kelley et al. 1993. The SEAMAP data collected during the Summer Shrimp/Groundfish Survey continues to be used extensively for fishery management purposes. In 1981, the Gulf of Mexico Fishery Management Council's plan for shrimp was implemented (Center for Wetland Resources 1980), with one management measure calling for the temporary closure to shrimping in the EEZ off Texas. This closure complements the traditional closure of the Texas territorial sea, normally May 15 through early July of each year. The GMFMC determined that this type of closure would allow small brown

shrimp to be protected from harvest, but would still allow the taking of larger brown shrimp by fishermen in deeper waters. The National Marine Fisheries Service was charged with evaluating the effects of the Texas Closure and submitted a report to the GMFMC in January 2008. This report contained the results and an overview of the effect of the 2007 Texas Closure. After review of these data and other information, the GMFMC voted to continue the Texas Closure for 2008. DATA REQUESTS It is the policy of the SEAMAP Subcommittee that all verified non-confidential SEAMAP data, collected specimens, and samples shall be available to all SEAMAP participants, other fishery researchers, and management organizations approved by the Subcommittee. This atlas presents, to those individuals interested in the data or specimens, a chance to review the data in a summary form. Data and specimen requests from SEAMAP participants, cooperators and others will normally be handled on a first-come, first-served, and time-available basis. Because of personnel and funding limitations, however, certain priorities must be assigned to the data and specimen requests. These priorities are reviewed by the SEAMAP Subcommittee. For further information on SEAMAP data management, see the Southeast Area Monitoring and Assessment Program (SEAMAP) Management Plan: 2006-2010 (ASMFC 2006). Data requests and inquiries, as well as requests for plankton samples, can be made by contacting Jeff Rester, the SEAMAP Coordinator, Gulf States Marine Fisheries Commission, 2404 Government Street, Ocean Springs, MS 39564; (228) 875-5912 or via e-mail at [email protected].
LITERATURE CITED
Atlantic States Marine Fisheries Commission. 2006. SEAMAP Management Plan: 2006-2010.
Washington, DC: ASMFC. Center for Wetland Resources. 1980. Management plan and final environmental impact statement
for the shrimp fishery of the Gulf of Mexico, United States waters. Louisiana State Univ., Baton Rouge, Louisiana. 185 p.
Ditty, J.G. and R.F. Shaw. 1992. Larval development, distribution, and ecology of cobia
Rachycentron canadum (Family: Rachycentridae), in the northern Gulf of Mexico. Fishery Bulletin. Vol. 90:668-677.
Ditty, J.G. and R.F. Shaw. 1993. Larval development of tripletail, Lobotes surinamensis (Pisces:
Lobotidae), and their spatial and temporal distribution in the northern Gulf of Mexico. Fishery Bulletin. Vol. 92:33-45.
Ditty, J.G., R.F. Shaw, C.B. Grimes, and J.S. Cope. 1994. Larval development, distribution, and
abundance of common dolphin, Coryphaena hippurus, and pompano dolphin, C. equiselis (Family: Coryphaenidae), in the northern Gulf of Mexico. Fishery Bulletin. Vol. 94:275-291.

Donaldson, D.M., N.J. Sanders, and P.A. Thompson. 1993. SEAMAP environmental and biological atlas of the Gulf of Mexico, 1991. Gulf States Marine Fisheries Commission. No. 29. 321 p.
Donaldson, D.M., N.J. Sanders, and P.A. Thompson. 1994. SEAMAP environmental and biological
atlas of the Gulf of Mexico, 1992. Gulf States Marine Fisheries Commission. No. 30. 293 p. Donaldson, D.M., N.J. Sanders, P.A. Thompson and R. Minkler. 1996. SEAMAP environmental
and biological atlas of the Gulf of Mexico, 1993. Gulf States Marine Fisheries Commission. No. 34. 284 p.
Donaldson, D.M., N.J. Sanders, P.A. Thompson and R. Minkler. 1997a. SEAMAP environmental
and biological atlas of the Gulf of Mexico, 1994. Gulf States Marine Fisheries Commission. No. 40. 277 p.
Donaldson, D.M., N.J. Sanders, P.A. Thompson and R. Minkler. 1997b. SEAMAP environmental
and biological atlas of the Gulf of Mexico, 1995. Gulf States Marine Fisheries Commission. No. 41. 280 p.
Donaldson, D.M., N.J. Sanders, P.A. Thompson and D. Hanisko. 1998. SEAMAP environmental
and biological atlas of the Gulf of Mexico, 1996. Gulf States Marine Fisheries Commission. No. 52. 263 p.
Drass, D.M., K.L. Bootes, J. Lyczkowski-Shultz, B.H. Comyns, G.J. Holt, C.M. Riley, and R.P.
Phelps. 2000. Larval development of red snapper, Lutjanus campechanus, with comparisons to co-occurring snapper species. Fishery Bulletin. Vol. 98(3):507-527.
Eldridge, P.J. 1988. The Southeast Area Monitoring and Assessment Program (SEAMAP): A state-
federal-university program for collection, management and dissemination of fishery-independent data and information in the southeast United States. Mar. Fish. Rev. 50(2): 29-39.
Gledhill, C.T. and J. Lyczkowski-Shultz. 2000. Indices of larval king mackerel, Scomberomorus
cavalla, for use in population assessment in the Gulf of Mexico. Fishery Bulletin. Vol. 98(4):684-691.
Goodyear, C.P. 1997. An evaluation of the minimum reduction in the 1997 red snapper shrimp
bycatch mortality rate consistent with the 2019 recovery target. GMFMC. 14 p. + appendix. Grace, M., K.R. Rademacher and M. Russell. 1994. Pictorial guide to the groupers (Teleostei:
Serrenidae) of the western North Atlantic. NOAA Tech. Report. NMFS 118. 46 p. Hanifen, J.G., W.S. Perret, R.P. Allemand and T.L. Romaire. 1995. Potential impacts of hypoxia on
fisheries: Louisiana=s fishery-independent data. In Proceedings of Gulf of Mexico Program=s Hypoxia Conference. November 1995, New Orleans, LA.
Jeffrey, S.W. and G.F. Humphrey. 1975. New spectrophotometric equations for determining
chlorophylls a, b, c1 and c2 in higher plants, algae and natural phytoplankton. Biochem. Physiol. Pflanzer Bpp. 167: 191-194.

Kelley, S., T. Potthoff, W.J. Richards, L. Ejsymont and J.V. Gartner. 1985. SEAMAP 1983 - Ichthyoplankton. Larval distribution and abundance of Engraulididae, Carangidae, Clupeidae, Lutjanidae, Serranidae, Sciaenidae, Coryphaenidae, Istiophoridae, Xiphiidae and Scombridae in the Gulf of Mexico. NOAA Tech. Mem., NMFS-SEFC -167.
Kelley, S., J.V. Gartner, Jr., W.J. Richards and L. Ejsymont. 1990. SEAMAP 1984 & 1985 -
Ichthyoplankton. Larval distribution and abundance of Carangidae, Clupeidae, Coryphaenidae, Engraulididae, Gobiidae, Istiophoridae, Lutjanidae, Scombridae, Serranidae, and Xiphiidae in the Gulf of Mexico. NOAA Tech. Mem., NMFS-SESC-317.
Kelley, S., J.V. Gartner, Jr., W.J. Richards and L. Ejsymont. 1993. SEAMAP 1986 -
Ichthyoplankton. Larval distribution and abundance of Engraulididae, Carangidae, Clupeidae, Gobiidae, Lutjanidae, Serranidae, Coryphaenidae, Istiophoridae and Scombridae in the Gulf of Mexico. NOAA Tech. Mem., NMFS-SESC-245.
Kramer, D., M.J. Kalin, E.G. Stevens, J.R. Thrailkill and J.R. Zweifel. 1972. Collecting and
processing data on fish eggs and larvae in the California Current region. NOAA Technical Report. NMFS Circular 370. 38 p.
Leming, T.D. and W.E. Stuntz. 1984. Zones of coastal hypoxia revealed by satellite scanning have
implications for strategic fishing. Nature. 310 (5973): 131-138. Lyczkowski-Shultz, J. and R. Brasher. 1996. Ichthyoplankton data summaries from SEAMAP
Summer Shrimp/Groundfish Surveys. Pages 27-42 in Uses of Fishery-Independent Data. General Session Proceedings, Gulf States Marine Fisheries Commission. No. 35.
Nichols, S. 1982. Impacts of the 1981 and 1982 Texas closure on brown shrimp yields. NOAA,
NMFS-SEFC. 44 p. Nichols, S. 1984. Impacts of the 1982 and 1983 closure of the Texas FCZ on brown shrimp yields.
Report to the Gulf of Mexico Fishery Management Council. Nichols, S. and J.R. Poffenberger. 1987. Analysis of alternative closures for improving brown
shrimp yield in the Gulf of Mexico. Report to the Gulf of Mexico Fishery Management Council. Posgay, J.A. and R.R. Marak. 1980. The MARMAP bongo zooplankton samplers. J. Northw. Atl.
Fish. Sci. 1: 9-99. Rester, J.K. 2009. SEAMAP environmental and biological atlas of the Gulf of Mexico, 2004. Gulf
States Marine Fisheries Commission. No. 173. Rester, J.K. 2010. SEAMAP environmental and biological atlas of the Gulf of Mexico, 2005. Gulf
States Marine Fisheries Commission. No. 175. Rester, J.K. 2010. SEAMAP environmental and biological atlas of the Gulf of Mexico, 2006. Gulf
States Marine Fisheries Commission. No. 179. Rester, J.K. 2010. SEAMAP environmental and biological atlas of the Gulf of Mexico, 2006. Gulf
States Marine Fisheries Commission. No. 180.

Rester, J.K., N.J. Sanders, P.A. Thompson and D. Hanisko. 1999. SEAMAP environmental and biological atlas of the Gulf of Mexico, 1997. Gulf States Marine Fisheries Commission. No. 63. 254 p.
Rester, J.K., N.J. Sanders, G. Pellegrin, Jr. and D. Hanisko. 2000. SEAMAP environmental and
biological atlas of the Gulf of Mexico, 1998. Gulf States Marine Fisheries Commission. No. 75. 243 p.
Rester, J.K., N.J. Sanders, G. Pellegrin, Jr. and D. Hanisko. 2001. SEAMAP environmental and
biological atlas of the Gulf of Mexico, 1999. Gulf States Marine Fisheries Commission. No. 82. 247 p.
Rester, J.K., N.J. Sanders, G. Pellegrin, Jr. and D. Hanisko. 2002. SEAMAP environmental and
biological atlas of the Gulf of Mexico, 2000. Gulf States Marine Fisheries Commission. No. 101. Available on CD-ROM only.
Rester, J.K., N.J. Sanders, G. Pellegrin, Jr., and D. Hanisko. 2004. SEAMAP environmental and
biological atlas of the Gulf of Mexico, 2001. Gulf States Marine Fisheries Commission. No. 118. Available on CD-ROM only.
Rester, J.K., N.J. Sanders, and G. Pellegrin, Jr. 2008. SEAMAP environmental and biological atlas
of the Gulf of Mexico, 2002. Gulf States Marine Fisheries Commission. No. 156. Rester, J.K., N.J. Sanders, and G. Pellegrin, Jr. 2009. SEAMAP environmental and biological atlas
of the Gulf of Mexico, 2003. Gulf States Marine Fisheries Commission. No. 172. Richards, W.J., T. Potthoff, S. Kelley, M.F. McGowan, L. Ejsymont, J.H. Power and R.M. Olvera L.
1984. SEAMAP 1982 - Ichthyoplankton. Larval distribution and abundance of Engraulididae, Carangidae, Clupeidae, Lutjanidae, Serranidae, Sciaenidae, Coryphaenidae, Istiophoridae, Xiphiidae and Scombridae in the Gulf of Mexico. NOAA Tech. Mem., NMFS-SEFC-167.
Russell, G.M. Unpublished report. Reef fish assessment methodology for SEAMAP surveys of
hardbottom areas. National Marine Fisheries Service. 25 p. Sanders, N.J., P.A. Thompson and T. Van Devender. 1990a. SEAMAP environmental and
biological atlas of the Gulf of Mexico, 1986. Gulf States Marine Fisheries Commission. No. 20. 328 p.
Sanders, N.J., P.A. Thompson and D.M. Donaldson. 1990b. SEAMAP environmental and biological
atlas of the Gulf of Mexico, 1987. Gulf States Marine Fisheries Commission. No. 22. 337 p. Sanders, N.J., D.M. Donaldson and P.A. Thompson. 1991a. SEAMAP environmental and biological
atlas of the Gulf of Mexico, 1988. Gulf States Marine Fisheries Commission. No. 23. 320 p. Sanders, N.J., D.M. Donaldson and P.A. Thompson. 1991b. SEAMAP environmental and biological
atlas of the Gulf of Mexico, 1989. Gulf States Marine Fisheries Commission. No. 25. 318 p. Sanders, N.J., D.M. Donaldson and P.A. Thompson. 1992. SEAMAP environmental and biological
atlas of the Gulf of Mexico, 1990. Gulf States Marine Fisheries Commission. No. 27. 311 p.

Scott, G.P., S.C. Turner, C.B. Grimes, W.J. Richards, and E.B. Brothers. 1993. Indices of larval bluefin tuna, Thunnus thynnus, abundance in the Gulf of Mexico: modeling variability in growth, mortality, and gear selectivity. Bulletin of Marine Science. Vol. 53(2):912-929.
Sherman, K., R. Lasker, W. Richards and A.W. Kendall, Jr. 1983. Ichthyoplankton and fish
recruitment studies in large marine ecosystems. Mar. Fish. Rev. 45 (10, 11, 12): 1-25. Smith, P.E. and S.L. Richardson, eds. 1977. Standard techniques for pelagic fish egg and larva
surveys. FAO Fish. Tech. Paper 175. 100 p. Southeast Area Monitoring and Assessment Program (SEAMAP) Strategic Plan. 1981. Report to
the Gulf States Marine Fisheries Commission. 50 p. Strickland, J.D.H. and T.R. Parsons. 1972. A practical handbook of seawater analysis. Ottawa:
Fish. Res. Bd. Can. 310 p. Stuntz, W.E., C.E. Bryan, K. Savastano, R.S. Waller and P.A. Thompson. 1985. SEAMAP
environmental and biological atlas of the Gulf of Mexico, 1982. Gulf States Marine Fisheries Commission. 145 p.
Thompson, P.A. and N. Bane. 1986a. SEAMAP environmental and biological atlas of the Gulf of
Mexico, 1983. Gulf States Marine Fisheries Commission. No. 13. 179 p. Thompson, P.A. and N. Bane. 1986b. SEAMAP environmental and biological atlas of the Gulf of
Mexico, 1984. Gulf States Marine Fisheries Commission. No. 15. 171 p. Thompson, P.A., T. Van Devender and N.J. Sanders, Jr. 1988. SEAMAP environmental and
biological atlas of the Gulf of Mexico, 1985. Gulf States Marine Fisheries Commission. No. 17. 338 p.

SPRING SUMMER FALL FALL WINTER INSHORE BOTTOM REEF
YEAR PLANKTON SHRIMP/GROUNDFISH BUTTERFISH PLANKTON SHRIMP/GROUNDFISH PLANKTON LONGLINE FISH
1982 APRIL-MAY JUNE-JULY -- -- -- -- -- --
1983 APRIL-MAY JUNE-JULY -- -- -- DECEMBER -- --
1984 APRIL-MAY JUNE-JULY -- AUGUST -- DECEMBER -- --
1985 -- JUNE-JULY JULY-AUGUST SEPTEMBER SEPTEMBER-DECEMBER -- -- --
1986 APRIL-MAY JUNE-JULY MAY-JUNE SEPTEMBER OCTOBER-DECEMBER -- -- --
1987 APRIL-MAY JUNE-JULY -- SEPTEMBER SEPTEMBER-DECEMBER -- -- --
1988 MARCH-MAY JUNE-JULY -- SEPTEMBER-OCTOBER OCTOBER-DECEMBER -- -- --
1989 APRIL-MAY JUNE-JULY -- SEPTEMBER-OCTOBER OCTOBER-DECEMBER -- -- --
1990 APRIL-MAY JUNE-JULY -- SEPTEMBER-OCTOBER OCTOBER-DECEMBER -- -- --
1991 APRIL-MAY JUNE-JULY -- AUGUST-SEPTEMBER SEPTEMBER-DECEMBER -- -- --
1992 APRIL-MAY JUNE-JULY -- AUGUST-OCTOBER OCTOBER-DECEMBER -- -- MAY-JUNE
1993 APRIL-MAY JUNE-JULY -- SEPTEMBER-OCTOBER OCTOBER-DECEMBER JAN.-FEB. -- MAY-JULY, SEPT., NOV.
1994 APRIL-MAY JUNE-JULY -- SEPTEMBER-OCTOBER OCTOBER-NOVEMBER -- -- MAY-JULY, AUG.-OCT., DEC.
1995 APRIL-JUNE JUNE-JULY -- SEPTEMBER OCTOBER-DECEMBER -- -- JAN., JUNE-AUG., DEC.
1996 APRIL-JUNE JUNE-JULY -- SEPTEMBER-OCTOBER OCTOBER-DECEMBER DECEMBER -- JULY, AUGUST, NOVEMBER
1997 APRIL-JUNE JUNE-JULY -- SEPTEMBER-OCTOBER OCTOBER-DECEMBER -- -- JUNE, JULY, AUG., NOV.
1998 APRIL-JUNE JUNE-JULY -- SEPTEMBER-OCTOBER OCTOBER-NOVEMBER -- -- MAY, JULY, AUGUST
1999 APRIL-MAY JUNE-JULY -- SEPTEMBER-OCTOBER OCTOBER-NOVEMBER -- -- JAN., AUG., OCT., DEC.
2000 APRIL-MAY JUNE-JULY -- SEPTEMBER-OCTOBER OCTOBER-DECEMBER -- -- OCTOBER, NOVEMBER
2001 APRIL-MAY JUNE-JULY -- AUGUST-OCTOBER OCTOBER-DECEMBER -- -- MAY, JUNE, OCTOBER
2002 APRIL-MAY JUNE-JULY -- AUGUST-OCTOBER OCTOBER-DECEMBER -- -- FEBRUARY-MAY, OCTOBER
2003 MAY JUNE-JULY -- AUGUST-OCTOBER OCTOBER-DECEMBER -- -- OCTOBER-NOVEMBER
2004 APRIL-JUNE JUNE-JULY -- SEPTEMBER OCTOBER-DECEMBER JANUARY -- FEBRUARY-MARCH
2005 APRIL-MAY JUNE-AUGUST -- -- OCTOBER-NOVEMBER -- -- FEBRUARY-JULY, OCTOBER
2006 APRIL-MAY JUNE-JULY -- AUGUST-SEPTEMBER OCTOBER-DECEMBER -- -- FEBRUARY-AUGUST
2007 MARCH-JUNE JUNE-AUGUST -- AUGUST-SEPTEMBER OCTOBER-DECEMBER -- -- FEBRUARY-MAY
2008 APRIL-JUNE JUNE-AUGUST -- SEPTEMBER SEPTEMBER-NOVEMBER FEB.-MAR. MARCH-OCTOBER FEBRUARY-AUGUST
SEAMAP SURVEY ACTIVITIES
Table 1. List of SEAMAP survey activities from 1982 to 2008.

Table 2. 2008 Summer Shrimp/Groundfish Survey species composition list, 447 trawl stations, for those vessels that used either a 40-ft or 20-ft trawl.
Species with a total weight of less than 0.0227 kg (0.05 lb) are indicated on the table as 0.0 kg.
NUMBER OF
TOTAL NUMBER TOTAL WEIGHT TOWS WHERE % FREQUENCY
GENUS/SPECIES COMMON NAME CAUGHT CAUGHT (KG) CAUGHT OCCURRENCE
Finfishes
Micropogonias undulatus Atlantic croaker 167006 5874.2 247 55.3
Stenotomus caprinus longspine porgy 39960 1406.9 241 53.9
Peprilus burti Gulf butterfish 32181 1173.2 199 44.5
Prionotus longispinosus bigeye searobin 14459 170.2 172 38.5
Trichiurus lepturus Atlantic cutlassfish 7849 267.0 158 35.3
Leiostomus xanthurus spot 7707 678.1 129 28.9
Trachurus lathami rough scad 7584 185.1 132 29.5
Cynoscion nothus silver seatrout 7255 380.4 131 29.3
Chloroscombrus chrysurus Atlantic bumper 6876 267.2 85 19.0
Cynoscion arenarius sand seatrout 5874 528.1 129 28.9
Decapterus punctatus round scad 5111 64.8 26 5.8
Harengula jaguana scaled herring 4809 150.1 47 10.5
Stellifer lanceolatus star drum 3841 28.4 45 10.1
Lagodon rhomboides pinfish 3728 229.4 192 43.0
Synodus foetens inshore lizardfish 3570 441.5 240 53.7
Centropristis philadelphica Rock Sea bass 3518 113.9 156 34.9
Larimus fasciatus banded drum 3503 143.3 74 16.6
Saurida brasiliensis largescale lizardfish 2987 16.0 128 28.6
Anchoa hepsetus striped anchovy 2517 43.7 64 14.3
Upeneus parvus dwarf goatfish 2207 65.0 127 28.4
Halieutichthys aculeatus pancake batfish 2072 13.1 99 22.1
Pristipomoides aquilonaris wenchman 2014 110.9 97 21.7
Syacium papillosum dusky flounder 1938 123.2 61 13.6
Serranus atrobranchus blackear bass 1924 17.8 100 22.4
Syacium gunteri shoal flounder 1740 51.4 118 26.4
Selene setapinnis Atlantic moonfish 1636 98.2 133 29.8
Prionotus stearnsi shortwing searobin 1474 15.6 76 17.0

Table 2. Species composition list (continued)
NUMBER OF
TOTAL NUMBER TOTAL WEIGHT TOWS WHERE % FREQUENCY
GENUS/SPECIES COMMON NAME CAUGHT CAUGHT (KG) CAUGHT OCCURRENCE
Lutjanus campechanus red snapper 1347 196.0 150 33.6
Steindachneria argentea luminous hake 986 3.4 5 1.1
Eucinostomus gula silver jenny 938 38.5 43 9.6
Peprilus paru harvestfish 906 11.2 45 10.1
Prionotus paralatus Mexican searobin 901 28.0 52 11.6
Trichopsetta ventralis sash flounder 891 21.3 46 10.3
Lepophidium brevibarbe blackedge cusk-eel 754 25.4 77 17.2
Haemulon aurolineatum tomtate 753 41.4 35 7.8
Diplectrum bivittatum dwarf sand perch 711 16.3 52 11.6
Prionotus rubio blackfin searobin 708 62.4 54 12.1
Mullus auratus red goatfish 701 50.7 29 6.5
Cynoscion spp. seatrouts 681 3.5 20 4.5
Stephanolepis hispida planehead filefish 675 12.6 70 15.7
Synodus intermedius sand diver 673 40.4 36 8.1
Sphoeroides parvus least puffer 586 2.7 35 7.8
Opisthonema oglinum Atlantic thread herring 571 45.8 26 5.8
Lutjanus synagris lane snapper 558 69.4 56 12.5
Bellator militaris horned searobin 525 10.2 29 6.5
Saurida normani shortjaw lizardfish 496 46.4 17 3.8
Trachinocephalus myops snakefish 484 36.5 37 8.3
Polydactylus octonemus Atlantic threadfin 436 12.1 28 6.3
Porichthys plectrodon Atlantic midshipman 412 9.4 68 15.2
Sardinella aurita Spanish sardine 383 7.3 24 5.4
Scorpaena brasiliensis barbfish 382 16.6 34 7.6
Prionotus martis barred searobin 371 7.8 15 3.4
Lagocephalus laevigatus smooth puffer 362 10.9 86 19.2
Urophycis floridana southern hake 350 27.9 61 13.6
Cyclopsetta chittendeni Mexican flounder 344 49.5 53 11.9
Orthopristis chrysoptera pigfish 340 29.0 26 5.8
Diplectrum formosum sand perch 327 34.2 44 9.8

Table 2. Species composition list (continued)
NUMBER OF
TOTAL NUMBER TOTAL WEIGHT TOWS WHERE % FREQUENCY
GENUS/SPECIES COMMON NAME CAUGHT CAUGHT (KG) CAUGHT OCCURRENCE
Symphurus plagiusa blackcheek tonguefish 306 5.7 43 9.6
Menticirrhus americanus southern kingfish 302 43.5 28 6.3
Prionotus tribulus bighead searobin 289 15.2 32 7.2
Anchoa nasus longnose anchovy 285 5.5 6 1.3
Oligoplites saurus leatherjack 255 5.6 2 0.4
Ophidion holbrookii bank cusk-eel 235 18.4 16 3.6
Prionotus roseus bluespotted searobin 217 11.3 24 5.4
Etropus crossotus fringed flounder 215 3.7 38 8.5
Scorpaena calcarata smoothhead scorpionfish 210 2.5 18 4.0
Calamus proridens littlehead porgy 202 35.5 10 2.2
Sphyraena guachancho guaguanche 202 40.2 43 9.6
Rhomboplites aurorubens vermilion snapper 194 22.1 29 6.5
Ophidion josephi crested cusk-eel 182 5.7 13 2.9
Ogcocephalus declivirostris slantbrow batfish 177 11.9 34 7.6
Mustelus canis smooth dogfish 172 70.2 7 1.6
Sphoeroides dorsalis marbled puffer 157 9.1 23 5.1
Synodus poeyi offshore lizardfish 155 1.3 38 8.5
Symphurus civitatium offshore tonguefish 150 14.0 5 1.1
Citharichthys spilopterus bay whiff 138 2.1 26 5.8
Lepophidium jeannae mottled cusk-eel 136 7.8 15 3.4
Bregmaceros atlanticus antenna codlet 134 0.1 18 4.0
Monacanthus ciliatus fringed filefish 132 3.5 23 5.1
Urophycis cirrata gulf hake 131 2.7 24 5.4
Serranus notospilus saddle bass 130 7.7 7 1.6
Ariopsis felis hardhead catfish 125 20.6 28 6.3
Prionotus alatus spiny searobin 125 3.0 19 4.3
Haemulon plumierii white grunt 122 27.6 8 1.8
Ogcocephalus parvus roughback batfish 119 1.4 21 4.7
Aluterus schoepfii orange filefish 116 39.1 23 5.1
Ancylopsetta dilecta three-eye flounder 110 5.4 29 6.5
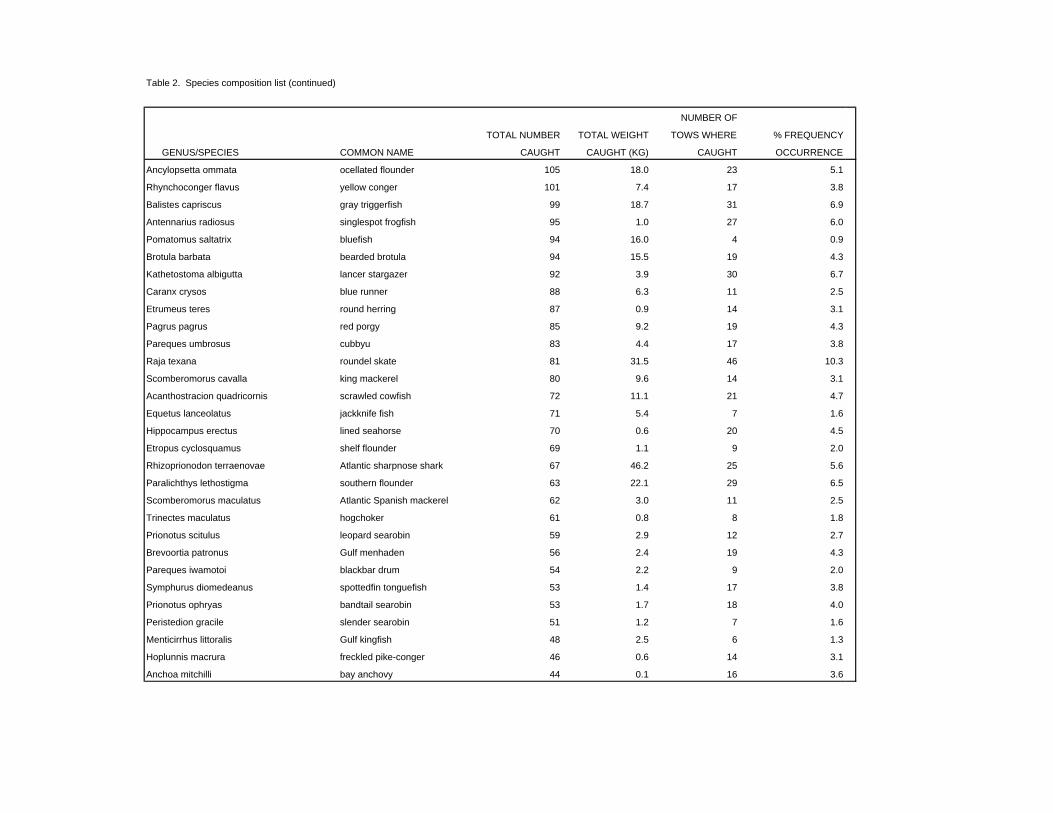
Table 2. Species composition list (continued)
NUMBER OF
TOTAL NUMBER TOTAL WEIGHT TOWS WHERE % FREQUENCY
GENUS/SPECIES COMMON NAME CAUGHT CAUGHT (KG) CAUGHT OCCURRENCE
Ancylopsetta ommata ocellated flounder 105 18.0 23 5.1
Rhynchoconger flavus yellow conger 101 7.4 17 3.8
Balistes capriscus gray triggerfish 99 18.7 31 6.9
Antennarius radiosus singlespot frogfish 95 1.0 27 6.0
Pomatomus saltatrix bluefish 94 16.0 4 0.9
Brotula barbata bearded brotula 94 15.5 19 4.3
Kathetostoma albigutta lancer stargazer 92 3.9 30 6.7
Caranx crysos blue runner 88 6.3 11 2.5
Etrumeus teres round herring 87 0.9 14 3.1
Pagrus pagrus red porgy 85 9.2 19 4.3
Pareques umbrosus cubbyu 83 4.4 17 3.8
Raja texana roundel skate 81 31.5 46 10.3
Scomberomorus cavalla king mackerel 80 9.6 14 3.1
Acanthostracion quadricornis scrawled cowfish 72 11.1 21 4.7
Equetus lanceolatus jackknife fish 71 5.4 7 1.6
Hippocampus erectus lined seahorse 70 0.6 20 4.5
Etropus cyclosquamus shelf flounder 69 1.1 9 2.0
Rhizoprionodon terraenovae Atlantic sharpnose shark 67 46.2 25 5.6
Paralichthys lethostigma southern flounder 63 22.1 29 6.5
Scomberomorus maculatus Atlantic Spanish mackerel 62 3.0 11 2.5
Trinectes maculatus hogchoker 61 0.8 8 1.8
Prionotus scitulus leopard searobin 59 2.9 12 2.7
Brevoortia patronus Gulf menhaden 56 2.4 19 4.3
Pareques iwamotoi blackbar drum 54 2.2 9 2.0
Symphurus diomedeanus spottedfin tonguefish 53 1.4 17 3.8
Prionotus ophryas bandtail searobin 53 1.7 18 4.0
Peristedion gracile slender searobin 51 1.2 7 1.6
Menticirrhus littoralis Gulf kingfish 48 2.5 6 1.3
Hoplunnis macrura freckled pike-conger 46 0.6 14 3.1
Anchoa mitchilli bay anchovy 44 0.1 16 3.6

Table 2. Species composition list (continued)
NUMBER OF
TOTAL NUMBER TOTAL WEIGHT TOWS WHERE % FREQUENCY
GENUS/SPECIES COMMON NAME CAUGHT CAUGHT (KG) CAUGHT OCCURRENCE
Bothus robinsi twospot flounder 43 1.6 10 2.2
Prognathodes aya bank butterflyfish 41 0.9 3 0.7
Caulolatilus intermedius anchor tilefish 39 3.2 17 3.8
Conodon nobilis barred grunt 38 0.6 4 0.9
Selene vomer lookdown 37 0.4 18 4.0
Aluterus scriptus scrawled filefish 37 0.5 4 0.9
Scorpaena agassizii longfin scorpionfish 34 1.4 3 0.7
Scorpaena dispar hunchback scorpionfish 33 1.2 3 0.7
Pontinus longispinis longspine scorpionfish 31 0.3 8 1.8
Neomerinthe hemingwayi spinycheek scorpionfish 30 3.6 12 2.7
Selar crumenophthalmus bigeye scad 30 4.1 8 1.8
Chilomycterus schoepfii striped burrfish 29 8.1 15 3.4
Coryphopterus punctipectophor spotted goby 27 0.0 2 0.4
Prionotus searobins 26 0.0 1 0.2
Citharichthys macrops spotted whiff 25 0.7 6 1.3
Priacanthus arenatus bigeye 25 4.2 8 1.8
Chaetodipterus faber Atlantic spadefish 24 1.1 10 2.2
Ophidion grayi blotched cusk-eel 23 1.3 4 0.9
Bollmannia communis ragged goby 22 0.1 11 2.5
Squatina dumeril Atlantic angel shark 22 33.4 12 2.7
Saurida caribbaea smallscale lizardfish 22 0.1 5 1.1
Paraconger caudilimbatus margintail conger 22 0.8 9 2.0
Ophidion cusk-eels 20 1.4 11 2.5
Calamus penna sheepshead porgy 20 5.3 3 0.7
Calamus nodosus knobbed porgy 20 4.6 2 0.4
Echeneis neucratoides whitefin sharksucker 19 5.8 2 0.4
Gymnachirus texae fringed sole 19 0.5 6 1.3
Neobythites gilli cusk-eel 18 0.1 4 0.9
Epinephelus morio red grouper 18 6.3 8 1.8
Serraniculus pumilio pygmy sea bass 16 0.1 3 0.7

Table 2. Species composition list (continued)
NUMBER OF
TOTAL NUMBER TOTAL WEIGHT TOWS WHERE % FREQUENCY
GENUS/SPECIES COMMON NAME CAUGHT CAUGHT (KG) CAUGHT OCCURRENCE
Lonchopisthus micrognathus swordtail jawfish 16 0.1 5 1.1
Ogcocephalus corniger longnose batfish 15 0.3 6 1.3
Sphoeroides spengleri bandtail puffer 15 0.4 5 1.1
Prionotus carolinus common searobin 15 0.3 1 0.2
Cyclopsetta fimbriata spotfin flounder 14 1.4 8 1.8
Calamus arctifrons grass porgy 14 2.8 3 0.7
Gastropsetta frontalis shrimp flounder 14 1.1 7 1.6
Opsanus beta Gulf toadfish 13 1.8 4 0.9
Holocentrus adscensionis squirrelfish 13 0.5 3 0.7
Lachnolaimus maximus hogfish 13 6.0 4 0.9
Bairdiella chrysoura silver perch 13 0.1 6 1.3
Hemicaranx amblyrhynchus bluntnose jack 13 1.5 5 1.1
Centropristis ocyurus bank sea bass 12 0.5 6 1.3
Decodon puellaris red hogfish 12 0.4 4 0.9
Gobionellus oceanicus highfin goby 12 0.0 2 0.4
Rachycentron canadum cobia 12 60.5 3 0.7
Raja eglanteria clearnose skate 12 5.4 7 1.6
Paralichthys southern flounders 12 1.8 6 1.3
Hemipteronotus novacula pearly razorfish 11 0.6 6 1.3
Chaetodon sedentarius reef butterflyfish 10 0.4 3 0.7
Centropristis striatus black sea bass 10 1.6 3 0.7
Synagrops bellus blackmouth bass 10 0.1 3 0.7
Eucinostomus mojarras 9 0.6 6 1.3
Mustelus sinusmexicanus Gulf smoothhound 9 8.3 7 1.6
Calamus bajonado jolthead porgy 9 3.5 5 1.1
Seriola dumerili greater amberjack 9 1.4 6 1.3
Ophichthus gomesii shrimp eel 9 0.9 6 1.3
Engyophrys senta spiny flounder 9 0.0 3 0.7
Paralichthys albigutta Gulf flounder 9 3.2 3 0.7
Sphyrna tiburo bonnethead 9 29.8 5 1.1

Table 2. Species composition list (continued)
NUMBER OF
TOTAL NUMBER TOTAL WEIGHT TOWS WHERE % FREQUENCY
GENUS/SPECIES COMMON NAME CAUGHT CAUGHT (KG) CAUGHT OCCURRENCE
Physiculus fulvus metallic codling 9 0.1 3 0.7
Rypticus maculatus whitespotted soapfish 8 0.4 8 1.8
Antennarius ocellatus ocellated frogfish 8 0.2 4 0.9
Hoplunnis tenuis spotted pike-conger 8 0.1 2 0.4
Pristigenys alta short bigeye 8 0.5 6 1.3
Urophycis regia spotted hake 8 0.5 3 0.7
Diplectrum perch 7 0.0 1 0.2
Peprilus triacanthus butterfish 7 0.1 1 0.2
Narcine brasiliensis lesser electric ray 7 2.3 2 0.4
Epinephelus flavolimbatus yellowedge grouper 7 0.8 6 1.3
Opsanus pardus leopard toadfish 7 0.3 4 0.9
Aluterus heudelotii dotterel filefish 6 1.6 5 1.1
Engraulis eurystole silver anchovy 6 0.0 1 0.2
Bagre marinus gafftopsail catfish 6 0.7 4 0.9
Caranx bartholomaei yellow jack 6 1.3 2 0.4
Hippocampus reidi longsnout seahorse 5 0.0 1 0.2
Peprilus paru harvestfish 5 0.0 2 0.4
Hemanthias vivanus red barbier 5 0.0 1 0.2
Nicholsina usta emerald parrotfish 5 0.5 4 0.9
Gymnothorax nigromarginatus blackedge moray 5 0.7 3 0.7
Dasyatis americana southern stingray 5 4.4 4 0.9
Rypticus bistrispinus freckled soapfish 5 0.1 4 0.9
Paralichthys squamilentus broad flounder 5 2.0 4 0.9
Carcharhinus acronotus blacknose shark 5 4.3 5 1.1
Rhinoptera brasiliensis Brazilian cow-nosed ray 5 40.2 3 0.7
Hemanthias aureorubens streamer bass 4 0.0 2 0.4
Sphoeroides nephelus southern puffer 4 0.7 2 0.4
Gobionellus hastatus darter gobies 4 0.0 2 0.4
Apogon pseudomaculatus twospot cardinalfish 4 0.0 3 0.7
Ariomma bondi silver-rag 4 0.1 3 0.7

Table 2. Species composition list (continued)
NUMBER OF
TOTAL NUMBER TOTAL WEIGHT TOWS WHERE % FREQUENCY
GENUS/SPECIES COMMON NAME CAUGHT CAUGHT (KG) CAUGHT OCCURRENCE
Echeneis naucrates sharksucker 4 1.1 4 0.9
Calamus leucosteus whitebone porgy 4 1.5 1 0.2
Antennarius striatus striated frogfish 4 0.1 3 0.7
Apogon affinis bigtooth cardinalfish 4 0.1 2 0.4
Parexocoetus brachypterus sailfin flyingfish 4 0.1 3 0.7
Gymnothorax saxicola honeycomb moray 4 0.5 4 0.9
Peristedion greyae alligator searobin 4 0.0 1 0.2
Sphyraena borealis northern sennet 4 0.5 2 0.4
Lutjanus griseus gray snapper 4 1.4 2 0.4
Gymnachirus melas naked sole 4 0.1 2 0.4
Otophidium omostigmum polka-dot cusk-eel 4 0.1 2 0.4
Citharichthys cornutus horned whiff 4 0.0 3 0.7
Gobiesox strumosus skilletfish 4 0.0 1 0.2
Fistularia petimba Pacific cornetfish 3 0.6 3 0.7
Echiophis intertinctus spotted spoon-nose eel 3 1.1 3 0.7
Ogcocephalus pantostictus spotted batfish 3 1.4 3 0.7
Seriola fasciata lesser amberjack 3 0.7 2 0.4
Bathyanthias mexicanus yellowtail bass 3 0.0 2 0.4
Epinephelus niveatus snowy grouper 3 0.7 3 0.7
Dorosoma petenense threadfin shad 3 0.0 1 0.2
Parablennius marmoreus seaweed blenny 3 0.0 2 0.4
Chromis enchrysura yellowtail reeffish 3 0.1 1 0.2
Holacanthus bermudensis blue angelfish 3 1.3 3 0.7
Myliobatis freminvillii bullnose ray 2 5.4 2 0.4
Hemanthias leptus longtail bass 2 0.0 1 0.2
Hirundichthys rondeletii blackwing flyingfish 2 0.0 2 0.4
Trichiuridae cutlassfishes 2 0.1 1 0.2
Lophius americanus goosefish 2 0.7 1 0.2
Heteropriacanthus cruentatus glasseye snapper 2 0.7 1 0.2
Hoplunnis diomedianus blacktail pike-conger 2 0.0 1 0.2

Table 2. Species composition list (continued)
NUMBER OF
TOTAL NUMBER TOTAL WEIGHT TOWS WHERE % FREQUENCY
GENUS/SPECIES COMMON NAME CAUGHT CAUGHT (KG) CAUGHT OCCURRENCE
Apogon aurolineatus bridle cardinalfish 2 0.0 1 0.2
Echiophis punctifer snapper eel 2 0.4 2 0.4
Serranus phoebe tattler 2 0.1 1 0.2
Haemulon striatum striped grunt 2 0.1 2 0.4
Rhinoptera bonasus cownose ray 2 22.6 2 0.4
Foetorepus goodenbeani palefin dragonet 2 0.0 2 0.4
Mycteroperca microlepis gag 2 3.6 1 0.2
Elops saurus ladyfish 2 0.3 1 0.2
Pseudupeneus maculatus spotted goatfish 2 0.0 1 0.2
Ophichthus puncticeps palespotted eel 2 0.4 2 0.4
Menticirrhus saxatilis northern kingfish 2 0.2 2 0.4
Ophidion selenops mooneye cusk-eel 2 0.2 2 0.4
Lophiodes reticulatus reticulate goosefish 2 0.2 1 0.2
Echiodon dawsoni chain pearlfish 1 0.0 1 0.2
Pomacentrus variabilis cocoa damselfish 1 0.0 1 0.2
Ophichthus rex king snake eel 1 0.4 1 0.2
Hypoplectrus 1 0.0 1 0.2
Rypticus arenatus 1 0.1 1 0.2
Mycteroperca phenax scamp 1 1.2 1 0.2
Blenniidae blennies 1 0.0 1 0.2
Gymnothorax kolpos blacktail moray 1 0.6 1 0.2
Histrio histrio sargassum frogfish 1 0.0 1 0.2
Carcharhinus limbatus blacktip shark 1 0.0 1 0.2
Achirus lineatus lined sole 1 0.0 1 0.2
Symphurus urospilus spottail tonguefish 1 0.0 1 0.2
Galeocerdo cuvieri tiger shark 1 20.2 1 0.2
Eucinostomus harengulus tidewater mojarra 1 0.0 1 0.2
Dasyatis centroura clam cracker 1 86.7 1 0.2
Saurenchelys 1 0.0 1 0.2
Sphyraena barracuda great barracuda 1 0.0 1 0.2

Table 2. Species composition list (continued)
NUMBER OF
TOTAL NUMBER TOTAL WEIGHT TOWS WHERE % FREQUENCY
GENUS/SPECIES COMMON NAME CAUGHT CAUGHT (KG) CAUGHT OCCURRENCE
Gymnothorax spp. morays 1 0.3 1 0.2
Parahollardia lineata jambeau 1 0.0 1 0.2
Halichoeres bivittatus slippery dick 1 0.1 1 0.2
Sphyrna lewini scalloped hammerhead 1 0.5 1 0.2
Scorpaena spp. scorpionfishes 1 0.0 1 0.2
Chaetodon ocellatus spotfin butterflyfish 1 0.1 1 0.2
Bothus ocellatus eyed flounder 1 0.0 1 0.2
Ariomma regulus spotted driftfish 1 0.0 1 0.2
Umbrina coroides sand drum 1 0.2 1 0.2
Syngnathus louisianae chain pipefish 1 0.0 1 0.2
Remora remora remora 1 0.3 1 0.2
Crustaceans
Farfantepenaeus aztecus brown shrimp 59269 854.2 292 65.3
Callinectes similis lesser blue crab 16357 194.2 245 54.8
Portunus spinicarpus longspine swimming crab 9675 49.9 97 21.7
Rimapenaeus similis roughback shrimp 9261 25.8 81 18.1
Squilla empusa mantis shrimp 9135 81.7 136 30.4
Sicyonia brevirostris brown rock shrimp 6384 78.9 100 22.4
Litopenaeus setiferus white shrimp 4056 189.9 94 21.0
Farfantepenaeus duorarum pink shrimp 3466 78.6 90 20.1
Rimapenaeus constrictus roughneck shrimp 2322 11.2 51 11.4
Sicyonia dorsalis lesser rock shrimp 1802 4.2 56 12.5
Solenocera vioscai humpback shrimp 1560 6.9 47 10.5
Portunus gibbesii iridescent swimming crab 1472 7.7 92 20.6
Squilla chydaea mantis shrimp 749 4.3 85 19.0
Xiphopenaeus kroyeri seabob 412 0.4 29 6.5
Callinectes sapidus blue crab 381 62.9 53 11.9
Calappa sulcata yellow box crab 369 59.7 75 16.8

Table 2. Species composition list (continued)
NUMBER OF
TOTAL NUMBER TOTAL WEIGHT TOWS WHERE % FREQUENCY
GENUS/SPECIES COMMON NAME CAUGHT CAUGHT (KG) CAUGHT OCCURRENCE
Parapenaeus politus deepwater rose shrimp 369 0.6 15 3.4
Anasimus latus stilt spider crab 331 2.2 52 11.6
Scyllarides nodifer ridged slipper lobster 174 3.7 22 4.9
Stenorhynchus seticornis yellowline arrow crab 137 0.4 35 7.8
Portunus spinimanus blotched swimming crab 129 3.9 44 9.8
Solenocera atlantidis dwarf humpback shrimp 124 0.2 12 2.7
Leiolambrus nitidus white elbow crab 97 0.2 22 4.9
Raninoides louisianensis Gulf frog crab 88 0.6 22 4.9
Sicyonia parri rock shrimps 75 0.9 3 0.7
Pseudorhombila quadridentata flecked squareback crab 69 1.1 9 2.0
Munida irrasa 60 0.0 1 0.2
Arenaeus cribrarius speckled swimming crab 57 1.1 13 2.9
Hepatus epheliticus calico crab 48 1.9 21 4.7
Ovalipes floridanus Florida lady crab 46 0.8 22 4.9
Gibbesia neglecta mantis shrimp 40 0.4 9 2.0
Mesopenaeus tropicalis salmon shrimp 35 0.1 1 0.2
Portunus sayi sargassum swimming crab 34 1.9 14 3.1
Sicyonia laevigata rock shrimp 32 0.7 4 0.9
Libinia dubia longnose spider crab 28 0.0 15 3.4
Myropsis quinquespinosa fivespine purse crab 28 0.1 8 1.8
Paguristes sericeus blue-eye hermit 27 0.1 8 1.8
Sicyonia burkenroadi spiny rock shrimp 26 0.0 8 1.8
Libinia emarginata portly spider crab 25 4.0 4 0.9
Persephona crinita pink purse crab 25 0.0 15 3.4
Petrochirus diogenes giant hermit crab 24 1.5 6 1.3
Calappa flammea flame box crab 21 4.2 12 2.7
Plesionika longicauda pandalid shrimp 21 0.1 3 0.7
Euphrosynoplax clausa craggy bathyal crab 20 0.1 10 2.2
Pagurus bullisi hermit crab 20 0.1 7 1.6
Persephona mediterranea mottled purse crab 19 0.0 10 2.2

Table 2. Species composition list (continued)
NUMBER OF
TOTAL NUMBER TOTAL WEIGHT TOWS WHERE % FREQUENCY
GENUS/SPECIES COMMON NAME CAUGHT CAUGHT (KG) CAUGHT OCCURRENCE
Podochela sidneyi shortfinger neck crab 18 0.0 9 2.0
Platylambrus granulata bladetooth elbow crab 18 0.1 12 2.7
Acanthocarpus alexandri gladiator box crab 15 0.1 2 0.4
Sicyonia spp. rock shrimps 13 0.0 2 0.4
Collodes robustus spider crab 12 0.0 6 1.3
Mithrax pleuracanthus shaggy clinging crab 12 0.1 6 1.3
Solenocera spp. humpback shrimps 11 0.0 1 0.2
Paguristes triangulatus hermit crab 11 0.0 2 0.4
Macrocoeloma trispinosum spongy decorator crab 10 0.1 3 0.7
Stenocionops furcatus furcatus furcate crab 10 0.2 7 1.6
Cryptodromiopsis antillensis hairy sponge crab 8 0.1 3 0.7
Pagurus pollicaris flatclaw hermit crab 7 0.0 5 1.1
Dardanus insignis red brocade hermit 7 0.0 2 0.4
Acanthilia intermedia granulose purse crab 7 0.0 2 0.4
Gonodactylus bredini 6 0.0 3 0.7
Speocarcinus lobatus Gulf squareback crab 6 0.0 2 0.4
Trachypenaeus spp. roughneck shrimps 6 0.0 1 0.2
Parasquilla coccinea mantis shrimp 6 0.1 3 0.7
Metapenaeopsis goodei Caribbean velvet shrimp 6 0.0 2 0.4
Paguristes tortugae bandeye hermit 6 0.0 1 0.2
Podochela riisei longfinger neck crab 5 0.0 1 0.2
Parthenope agonus 5 0.0 3 0.7
Munida pusilla 4 0.0 1 0.2
Nephropsis aculeata Florida lobsterette 4 0.0 1 0.2
Menippe adina Gulf stone crab 4 0.0 1 0.2
Munida forceps squat lobster 4 0.0 3 0.7
Stenocionops furcatus coelatus spider crab 3 0.2 2 0.4
Squilla deceptrix 3 0.0 2 0.4
Stenopus scutellatus golden coral shrimp 3 0.0 2 0.4
Penaeopsis serrata megalops shrimp 3 0.0 1 0.2

Table 2. Species composition list (continued)
NUMBER OF
TOTAL NUMBER TOTAL WEIGHT TOWS WHERE % FREQUENCY
GENUS/SPECIES COMMON NAME CAUGHT CAUGHT (KG) CAUGHT OCCURRENCE
Libinia spider crabs 3 0.3 1 0.2
Metoporhaphis calcarata false arrow crab 3 0.0 3 0.7
Axiopsis hirsutimana lobster shrimps 2 0.0 1 0.2
Porcellana sayana spotted porcelain crab 2 0.0 1 0.2
Porcellana sigsbeiana striped porcelain crab 2 0.0 1 0.2
Scyllarus depressus scaled slipper lobster 2 0.0 2 0.4
Iliacantha liodactylus purse crab 2 0.0 2 0.4
Pseudomedaeus agassizii rough rubble crab 2 0.0 2 0.4
Portunus ordwayii 2 0.0 1 0.2
Plesionika edwardsii soldier striped shrimp 2 0.0 1 0.2
Euryalidae 2 0.0 2 0.4
Iliacantha subglobosa longfinger purse crab 2 0.0 1 0.2
Pilumnus sayi spineback hairy crab 2 0.0 2 0.4
Galathea rostrata 2 0.0 1 0.2
Stenocionops spinimanus prickly spider crab 2 0.0 2 0.4
Podochela lamelligera neck crab 2 0.0 1 0.2
Munida 2 0.0 1 0.2
Metapenaeopsis velvet shrimps 2 0.0 1 0.2
Mithrax forceps red-ridged clinging crab 2 0.0 1 0.2
Paguristes lymani 2 0.0 1 0.2
Lysiosquilla scabricauda mantis shrimp 1 0.1 1 0.2
Panopeus simpsoni oystershell mud crab 1 0.0 1 0.2
Livoneca redmanii isopod 1 0.0 1 0.2
Danielum ixbauchac red sea crab 1 0.0 1 0.2
Parapenaeus spp. penaeid shrimps 1 0.0 1 0.2
Parthenope elbow crabs 1 0.0 1 0.2
Xanthidae mud crabs 1 0.0 1 0.2
Ovalipes lady crabs 1 0.0 1 0.2
Axiidae lobster shrimps 1 0.0 1 0.2
Bathynectes longispina bathyal swimming crab 1 0.0 1 0.2

Table 2. Species composition list (continued)
NUMBER OF
TOTAL NUMBER TOTAL WEIGHT TOWS WHERE % FREQUENCY
GENUS/SPECIES COMMON NAME CAUGHT CAUGHT (KG) CAUGHT OCCURRENCE
Panulirus argus Caribbean spiny lobster 1 1.4 1 0.2
Macrocoeloma 1 0.0 1 0.2
Hypoconcha 1 0.0 1 0.2
Glyptoxanthus erosus eroded mud crab 1 0.0 1 0.2
Pyromaia cuspidata dartnose pear crab 1 0.0 1 0.2
Lobopilumnus agassizii areolated hairy crab 1 0.0 1 0.2
Podochela gracilipes unicorn neck crab 1 0.0 1 0.2
Pachycheles rugimanus sculptured porcelain crab 1 0.0 1 0.2
Lysmata 1 0.0 1 0.2
Pinnixa 1 0.0 1 0.2
Others
Argopecten gibbus calico scallop 60021 74.6 10 2.2
Loligo pealeii longfin squid 9965 163.5 139 31.1
Loligo plei arrow squid 9599 149.0 109 24.4
Amusium papyraceum paper scallop 5938 57.7 78 17.4
Lolliguncula brevis Atlantic brief squid 2973 22.2 136 30.4
Loligo spp. squids 540 4.6 14 3.1
Pitar cordatus Schwengel's pitar 213 4.2 25 5.6
Lirophora clenchi Clench venus 122 1.4 8 1.8
Polystira albida white giant turris 85 0.6 15 3.4
Polystira tellea delicate giant turret 37 0.2 4 0.9
Aplysiidae opisthobranchs 34 0.7 1 0.2
Anadara baughmani Baughman's ark 33 0.4 13 2.9
Octopus vulgaris common Atlantic octopus 29 4.3 15 3.4
Evola bivalves 28 0.1 6 1.3
Sconsia striata royal bonnet 27 0.4 9 2.0
Distorsio clathrata Atlantic distorsio 22 0.2 3 0.7
Macoma brevifrons short macoma 21 0.1 4 0.9

Table 2. Species composition list (continued)
NUMBER OF
TOTAL NUMBER TOTAL WEIGHT TOWS WHERE % FREQUENCY
GENUS/SPECIES COMMON NAME CAUGHT CAUGHT (KG) CAUGHT OCCURRENCE
Pteria colymbus Atlantic wing-oyster 19 0.3 6 1.3
Tonna galea giant tun 14 0.8 5 1.1
Aequipecten muscosus rough scallop 10 0.1 4 0.9
Mollusca molluscs 9 0.1 3 0.7
Macoma pulleyi delta macoma 8 0.1 3 0.7
Cantharus cancellarius cancellate cantharus 8 0.0 5 1.1
Narcissia trigonaria 7 0.3 5 1.1
Aplysia morio sooty seahare 7 0.7 2 0.4
Neverita duplicata shark eye 6 0.0 3 0.7
Aplysia brasiliana mottled seahare 5 0.2 4 0.9
Cypraeidae 5 0.0 2 0.4
Laevicardium laevigatum egg cockle 5 0.2 1 0.2
Conus austini cone shell 5 0.1 2 0.4
Anadara ovalis blood ark 5 0.0 3 0.7
Euvola raveneli Ravenel's scallop 3 0.0 2 0.4
Pleurobranchus slugs 3 0.1 2 0.4
Muricidae 3 0.0 2 0.4
Busycon sinistrum lightning whelk 2 0.0 2 0.4
Noetia ponderosa ponderous ark 2 0.0 1 0.2
Fasciolaria lilium banded tulip 2 0.2 1 0.2
Busycon perversum whelk 2 0.1 1 0.2
Semirossia equalis greater shining bobtail 2 0.0 2 0.4
Scaphella dubia dubious volute 2 0.2 1 0.2
Atrina rigida stiff penshell 2 0.1 2 0.4
Arca zebra turkey wing 2 0.1 2 0.4
Latirus infundibulum brown-line latirus 1 0.0 1 0.2
Laevicardium mortoni yellow eggcockle 1 0.1 1 0.2
Murex 1 0.0 1 0.2
Mercenaria campechiensis southern quahog 1 0.0 1 0.2
Strombus alatus Florida fighting conch 1 0.0 1 0.2

Table 2. Species composition list (continued)
NUMBER OF
TOTAL NUMBER TOTAL WEIGHT TOWS WHERE % FREQUENCY
GENUS/SPECIES COMMON NAME CAUGHT CAUGHT (KG) CAUGHT OCCURRENCE
Umbraculum plicatulum 1 0.0 1 0.2
Ficus communis Atlantic figsnail 1 0.0 1 0.2
Anaspidea 1 0.0 1 0.2
Gastropoda snails 1 0.0 1 0.2
Chicoreus florifer-dilectus 1 0.0 1 0.2
Pinctada 1 0.0 1 0.2
Diodora cayenensis Cayenne keyhole limpet 1 0.0 1 0.2
Pleuroploca gigantea horse conch 1 0.0 1 0.2
Eucrassatella speciosa beautiful crassatella 1 0.0 1 0.2

Table 3. 2008 Fall Shrimp/Groundfish Survey species composition list, 449 trawl stations, for those vessels that used either a 40-ft or 20-ft trawl.
Species with a total weight of less than 0.0227 kg (0.05 lb) are indicated on the table as 0.0 kg.
NUMBER OF
TOTAL NUMBER TOTAL WEIGHT TOWS WHERE % FREQUENCY
GENUS/SPECIES COMMON NAME CAUGHT CAUGHT (KG) CAUGHT OCCURRENCE
Finfishes
Micropogonias undulatus Atlantic croaker 214094 10072.6 342 76.2
Stenotomus caprinus longspine porgy 41867 1901.4 267 59.5
Chloroscombrus chrysurus Atlantic bumper 25612 539.5 211 47.0
Leiostomus xanthurus spot 17482 1647.6 223 49.7
Peprilus burti Gulf butterfish 10975 696.1 218 48.6
Cynoscion nothus silver seatrout 10691 590.3 238 53.0
Trachurus lathami rough scad 6802 317.9 108 24.1
Prionotus longispinosus bigeye searobin 6222 226.4 254 56.6
Trichiurus lepturus Atlantic cutlassfish 6081 294.3 162 36.1
Cynoscion arenarius sand seatrout 5061 605.0 225 50.1
Lagodon rhomboides pinfish 3580 274.3 201 44.8
Larimus fasciatus banded drum 3336 223.2 122 27.2
Synodus foetens inshore lizardfish 3312 462.4 275 61.2
Serranus atrobranchus blackear bass 2598 24.0 92 20.5
Syacium gunteri shoal flounder 2585 57.1 186 41.4
Centropristis philadelphica Rock Sea bass 2493 141.4 201 44.8
Harengula jaguana scaled sardine 2320 125.8 84 18.7
Selene setapinnis Atlantic moonfish 1730 52.4 153 34.1
Halieutichthys aculeatus pancake batfish 1722 11.2 122 27.2
Stephanolepis hispida planehead filefish 1518 33.5 51 11.4
Upeneus parvus dwarf goatfish 1466 72.9 101 22.5
Anchoa hepsetus striped anchovy 1451 20.2 91 20.3
Stellifer lanceolatus star drum 1291 20.1 64 14.3
Ariopsis felis hardhead catfish 1269 239.1 100 22.3
Lutjanus campechanus red snapper 1265 145.5 210 46.8
Mullus auratus red goatfish 1177 72.6 54 12.0

Table 3. Species composition list (continued)
NUMBER OF
TOTAL NUMBER TOTAL WEIGHT TOWS WHERE % FREQUENCY
GENUS/SPECIES COMMON NAME CAUGHT CAUGHT (KG) CAUGHT OCCURRENCE
Opisthonema oglinum Atlantic thread herring 1101 55.8 70 15.6
Haemulon aurolineatum tomtate 1025 84.2 35 7.8
Rhomboplites aurorubens vermilion snapper 936 60.1 28 6.2
Pristipomoides aquilonaris wenchman 930 65.5 56 12.5
Cyclopsetta chittendeni Mexican flounder 910 91.2 162 36.1
Chaetodipterus faber Atlantic spadefish 865 59.0 141 31.4
Eucinostomus gula silver jenny 855 30.4 72 16.0
Bagre marinus gafftopsail catfish 776 144.9 51 11.4
Orthopristis chrysoptera pigfish 769 45.5 41 9.1
Lepophidium brevibarbe blackedge cusk-eel 742 28.5 83 18.5
Trichopsetta ventralis sash flounder 740 19.7 34 7.6
Cynoscion spp. seatrouts 640 4.3 24 5.3
Prionotus paralatus Mexican searobin 609 27.9 32 7.1
Lutjanus synagris lane snapper 579 91.4 103 22.9
Caranx crysos blue runner 578 41.0 84 18.7
Syacium papillosum dusky flounder 571 26.0 46 10.2
Diplectrum bivittatum dwarf sand perch 439 7.4 47 10.5
Sphoeroides parvus least puffer 406 2.5 44 9.8
Decapterus punctatus round scad 404 8.1 24 5.3
Peprilus paru harvestfish 402 21.5 95 21.2
Etropus crossotus fringed flounder 365 6.4 75 16.7
Balistes capriscus gray triggerfish 342 27.4 138 30.7
Saurida brasiliensis largescale lizardfish 334 1.1 58 12.9
Saurida normani shortjaw lizardfish 314 21.7 4 0.9
Citharichthys spilopterus bay whiff 298 4.0 60 13.4
Porichthys plectrodon Atlantic midshipman 285 5.8 72 16.0
Diplectrum formosum sand perch 266 28.8 38 8.5
Prionotus rubio blackwing searobin 265 15.5 32 7.1
Centropristis ocyurus bank sea bass 256 13.8 22 4.9
Menticirrhus americanus southern kingfish 244 24.8 36 8.0

Table 3. Species composition list (continued)
NUMBER OF
TOTAL NUMBER TOTAL WEIGHT TOWS WHERE % FREQUENCY
GENUS/SPECIES COMMON NAME CAUGHT CAUGHT (KG) CAUGHT OCCURRENCE
Sardinella aurita Spanish sardine 207 8.0 12 2.7
Calamus proridens littlehead porgy 207 40.9 20 4.5
Lagocephalus laevigatus smooth puffer 206 27.9 69 15.4
Scorpaena calcarata smoothhead scorpionfish 187 4.2 33 7.3
Synodus intermedius sand diver 144 8.4 25 5.6
Prionotus stearnsi shortwing searobin 141 1.3 16 3.6
Ogcocephalus declivirostris slantbrow batfish 130 2.7 29 6.5
Sphyraena guachancho guaguanche 129 24.3 41 9.1
Selene vomer lookdown 129 3.6 49 10.9
Anchoa mitchilli bay anchovy 126 0.1 23 5.1
Pareques umbrosus cubbyu 124 4.4 20 4.5
Ophidion holbrookii bank cusk-eel 121 8.8 16 3.6
Symphurus plagiusa blackcheek tonguefish 117 2.4 37 8.2
Ophidion josephi crested cusk-eel 117 4.5 23 5.1
Aluterus schoepfii orange filefish 117 48.7 13 2.9
Ancylopsetta ommata ocellated flounder 116 16.2 35 7.8
Trachinocephalus myops snakefish 113 7.4 25 5.6
Prionotus roseus bluespotted searobin 107 4.3 26 5.8
Bellator militaris horned searobin 92 1.5 8 1.8
Prionotus scitulus leopard searobin 91 2.1 6 1.3
Prionotus martis barred searobin 91 3.7 7 1.6
Ariomma regulus spotted driftfish 84 2.9 19 4.2
Scomberomorus maculatus Spanish mackerel 80 15.4 14 3.1
Brotula barbata bearded brotula 80 7.5 30 6.7
Lepophidium jeannae mottled cusk-eel 76 3.8 14 3.1
Prionotus tribulus bighead searobin 74 7.4 22 4.9
Pagrus pagrus red porgy 73 18.5 17 3.8
Eucinostomus argenteus spotfin mojarra 72 1.0 3 0.7
Kathetostoma albigutta lancer stargazer 72 2.5 20 4.5
Pareques iwamotoi blackbar drum 71 6.1 14 3.1

Table 3. Species composition list (continued)
NUMBER OF
TOTAL NUMBER TOTAL WEIGHT TOWS WHERE % FREQUENCY
GENUS/SPECIES COMMON NAME CAUGHT CAUGHT (KG) CAUGHT OCCURRENCE
Symphurus diomedeanus spottedfin tonguefish 70 1.8 24 5.3
Rhynchoconger flavus yellow conger 70 5.0 18 4.0
Brevoortia patronus Gulf menhaden 63 6.5 23 5.1
Acanthostracion quadricornis scrawled cowfish 60 10.3 17 3.8
Calamus arctifrons grass porgy 56 8.7 5 1.1
Paralichthys lethostigma southern flounder 52 16.9 19 4.2
Hoplunnis macrura freckled pike-conger 51 0.3 12 2.7
Rhizoprionodon terraenovae Atlantic sharpnose shark 51 60.7 25 5.6
Hemicaranx amblyrhynchus bluntnose jack 51 2.0 22 4.9
Prionotus ophryas bandtail searobin 48 1.0 12 2.7
Raja texana roundel skate 47 18.3 37 8.2
Peprilus paru harvestfish 46 2.8 5 1.1
Selar crumenophthalmus bigeye scad 46 5.3 16 3.6
Citharichthys macrops spotted whiff 41 1.0 12 2.7
Anchoa nasus longnose anchovy 41 0.0 3 0.7
Conodon nobilis barred grunt 39 1.1 4 0.9
Anchoa lyolepis dusky anchovy 39 0.0 6 1.3
Urophycis regia spotted hake 39 3.1 2 0.4
Sphoeroides dorsalis marbled puffer 35 1.7 9 2.0
Synodus poeyi offshore lizardfish 33 0.2 12 2.7
Sphyrna tiburo bonnethead 33 38.2 24 5.3
Estropus microstomus smallmouth flounder 32 0.4 4 0.9
Mustelus canis smooth dogfish 30 22.4 18 4.0
Haemulon plumierii white grunt 30 8.4 9 2.0
Symphurus urospilus spottail tonguefish 28 0.6 3 0.7
Gymnachirus texae fringed sole 27 0.5 15 3.3
Engyophrys senta spiny flounder 27 0.1 13 2.9
Echeneis neucratoides whitefin sharksucker 24 6.1 10 2.2
Steindachneria argentea luminous hake 24 0.1 3 0.7
Calamus 22 3.4 2 0.4

Table 3. Species composition list (continued)
NUMBER OF
TOTAL NUMBER TOTAL WEIGHT TOWS WHERE % FREQUENCY
GENUS/SPECIES COMMON NAME CAUGHT CAUGHT (KG) CAUGHT OCCURRENCE
Urophycis floridana southern hake 21 3.2 3 0.7
Dasyatis americana southern stingray 19 115.1 15 3.3
Caulolatilus intermedius anchor tilefish 19 2.6 5 1.1
Caranx hippos crevalle jack 18 1.4 7 1.6
Neomerinthe hemingwayi spinycheek scorpionfish 18 4.0 6 1.3
Calamus leucosteus whitebone porgy 18 6.0 7 1.6
Bollmannia communis ragged goby 17 0.0 8 1.8
Prionotus alatus spiny searobin 17 0.6 6 1.3
Calamus nodosus knobbed porgy 17 5.0 4 0.9
Ophidion grayi blotched cusk-eel 16 0.9 3 0.7
Epinephelus morio red grouper 16 10.3 7 1.6
Bothus robinsi twospot flounder 16 0.4 6 1.3
Pomatomus saltatrix bluefish 16 5.7 9 2.0
Paralichthys squamilentus broad flounder 15 6.0 11 2.4
Ogcocephalus pantostictus spotted batfish 14 6.3 11 2.4
Carcharhinus acronotus blacknose shark 14 22.2 6 1.3
Serranus phoebe tattler 14 0.6 5 1.1
Lachnolaimus maximus hogfish 13 5.1 5 1.1
Polydactylus octonemus Atlantic threadfin 12 0.8 3 0.7
Scomberomorus cavalla king mackerel 12 2.3 4 0.9
Dorosoma petenense threadfin shad 12 0.1 9 2.0
Rachycentron canadum cobia 11 13.9 8 1.8
Equetus lanceolatus jackknife fish 11 0.9 5 1.1
Decodon puellaris red hogfish 11 0.8 4 0.9
Alectis ciliaris African pompano 11 0.3 5 1.1
Rypticus maculatus whitespotted soapfish 10 0.3 8 1.8
Trachinotus carolinus Florida pompano 10 2.5 7 1.6
Priacanthus arenatus bigeye 10 0.8 3 0.7
Apogon affinis bigtooth cardinalfish 9 0.0 3 0.7
Chaetodon ocellatus spotfin butterflyfish 9 0.7 7 1.6

Table 3. Species composition list (continued)
NUMBER OF
TOTAL NUMBER TOTAL WEIGHT TOWS WHERE % FREQUENCY
GENUS/SPECIES COMMON NAME CAUGHT CAUGHT (KG) CAUGHT OCCURRENCE
Apogon pseudomaculatus twospot cardinalfish 9 0.1 3 0.7
Scorpaena agassizii longfin scorpionfish 9 0.1 2 0.4
Monacanthus ciliatus fringed filefish 9 0.2 7 1.6
Ophidion beani longnose cusk-eel 8 0.4 4 0.9
Opsanus beta Gulf toadfish 8 0.7 4 0.9
Etrumeus teres round herring 8 0.3 4 0.9
Ancylopsetta dilecta three-eye flounder 8 1.2 2 0.4
Echeneis naucrates sharksucker 8 4.3 8 1.8
Seriola dumerili greater amberjack 7 2.0 5 1.1
Epinephelus flavolimbatus yellowedge grouper 7 0.6 5 1.1
Sphoeroides spengleri bandtail puffer 7 0.3 6 1.3
Sphoeroides nephelus southern puffer 7 0.1 4 0.9
Phaeoptyx pigmentaria dusky cardinalfish 7 0.0 3 0.7
Mugil cephalus black mullet 6 0.2 1 0.2
Rhinoptera brasiliensis Brazilian cow-nosed ray 6 57.2 1 0.2
Gymnothorax saxicola honeycomb moray 6 0.6 5 1.1
Antennarius radiosus singlespot frogfish 6 0.1 3 0.7
Hippocampus erectus lined seahorse 6 0.2 6 1.3
Equetus punctatus spotted drum 6 0.3 2 0.4
Apogon quadrisquamatus sawcheek cardinalfish 5 0.0 3 0.7
Ogcocephalus parvus roughback batfish 5 0.0 4 0.9
Narcine brasiliensis lesser electric ray 5 2.6 5 1.1
Rhinoptera bonasus cownose ray 4 6.2 2 0.4
Eucinostomus mojarras 4 0.2 4 0.9
Mycteroperca phenax scamp 4 1.3 4 0.9
Cyclopsetta fimbriata spotfin flounder 4 0.9 3 0.7
Ophidion selenops mooneye cusk-eel 4 0.0 2 0.4
Scorpaena brasiliensis barbfish 4 0.1 2 0.4
Syngnathus seahorses and pipefishes 4 0.0 1 0.2
Chaetodon sedentarius reef butterflyfish 4 0.2 2 0.4

Table 3. Species composition list (continued)
NUMBER OF
TOTAL NUMBER TOTAL WEIGHT TOWS WHERE % FREQUENCY
GENUS/SPECIES COMMON NAME CAUGHT CAUGHT (KG) CAUGHT OCCURRENCE
Lutjanus griseus grey snapper 4 2.7 2 0.4
Gymnura micrura smooth butterfly ray 3 2.0 2 0.4
Aluterus scriptus scrawled filefish 3 0.4 3 0.7
Chilomycterus schoepfii striped burrfish 3 0.6 2 0.4
Sphyraena borealis northern sennet 3 0.5 2 0.4
Paralichthys albigutta Gulf flounder 3 1.5 3 0.7
Caulolatilus cyanops blackline tilefish 3 0.4 1 0.2
Nicholsina usta emerald parrotfish 3 0.3 2 0.4
Serranus notospilus saddle bass 3 0.1 3 0.7
Peprilus triacanthus butterfish 3 0.0 1 0.2
Serraniculus pumilio pygmy sea bass 3 0.0 1 0.2
Astrapogon alutus bronze cardinalfish 3 0.0 2 0.4
Ophichthus gomesii shrimp eel 3 0.3 3 0.7
Saurida caribbaea smallscale lizardfish 3 0.0 1 0.2
Gymnachirus melas naked sole 2 0.1 2 0.4
Holacanthus bermudensis blue angelfish 2 0.5 1 0.2
Aluterus monoceros unicorn filefish 2 0.8 1 0.2
Ogcocephalus cubifrons polka-dot batfish 2 0.3 2 0.4
Otophidium omostigmum polka-dot cusk-eel 2 0.0 1 0.2
Carcharhinus falciformis silky shark 2 56.4 1 0.2
Apogon spp. cardinalfishes 2 0.0 1 0.2
Bathyanthias mexicanus yellowtail bass 2 0.0 1 0.2
Hippocampus reidi longsnout seahorse 2 0.0 2 0.4
Peristedion gracile slender searobin 2 0.1 1 0.2
Remora remora remora 2 1.8 2 0.4
Raja eglanteria clearnose skate 2 1.5 2 0.4
Mycteroperca microlepis gag 2 1.4 2 0.4
Anguilliformes eels 2 0.0 1 0.2
Gymnothorax nigromarginatus blackedge moray 2 0.2 1 0.2
Unid.fish fishes 2 0.0 1 0.2

Table 3. Species composition list (continued)
NUMBER OF
TOTAL NUMBER TOTAL WEIGHT TOWS WHERE % FREQUENCY
GENUS/SPECIES COMMON NAME CAUGHT CAUGHT (KG) CAUGHT OCCURRENCE
Urophycis cirrata gulf hake 2 0.0 1 0.2
Elops saurus ladyfish 2 0.1 1 0.2
Scorpaena plumieri spotted scorpionfish 2 0.3 2 0.4
Carangidae jacks 2 0.0 1 0.2
Bregmaceros atlanticus antenna codlet 2 0.0 1 0.2
Anchoa common anchovies 2 0.0 1 0.2
`lactophrys triqueter smooth trunkfish 2 0.2 1 0.2
Pogonias cromis black drum 2 6.5 2 0.4
Gymnura altavela spiny butterfly ray 1 1.6 1 0.2
Pomacanthus arcuatus gray angelfish 1 0.7 1 0.2
Gnathophis bracheatopos longeye conger 1 0.0 1 0.2
Epinephelus niveatus snowy grouper 1 0.1 1 0.2
Hoplunnis diomedianus blacktail pike-conger 1 0.0 1 0.2
Bairdiella chrysoura silver perch 1 0.0 1 0.2
Centropristis striatus black sea bass 1 0.2 1 0.2
Achirus lineatus lined sole 1 0.0 1 0.2
Engraulidae anchovies 1 0.0 1 0.2
Sphyraena barracuda great barracuda 1 0.0 1 0.2
Dasyatis sabina Atlantic stingray 1 0.0 1 0.2
Lobotes surinamensis Atlantic tripletail 1 0.1 1 0.2
Microdesmidae dartfishes 1 0.0 1 0.2
Pristigenys alta short bigeye 1 0.2 1 0.2
Trinectes maculatus hogchoker 1 0.0 1 0.2
Lactophrys trigonus trunkfish 1 0.0 1 0.2
Hemipteronotus novacula pearly razorfish 1 0.0 1 0.2
Menticirrhus saxatilis northern kingfish 1 0.1 1 0.2
Astroscopus y-graecum southern stargazer 1 0.1 1 0.2
Gastropsetta frontalis shrimp flounder 1 0.1 1 0.2
Albula vulpes bonefish 1 0.1 1 0.2
Symphurus civitatium offshore tonguefish 1 0.0 1 0.2

Table 3. Species composition list (continued)
NUMBER OF
TOTAL NUMBER TOTAL WEIGHT TOWS WHERE % FREQUENCY
GENUS/SPECIES COMMON NAME CAUGHT CAUGHT (KG) CAUGHT OCCURRENCE
Sciaenops ocellatus red drum 1 5.2 1 0.2
Myliobatis freminvillii bullnose ray 1 1.0 1 0.2
Gymnothorax kolpos blacktail moray 1 0.5 1 0.2
Echiophis punctifer snapper eel 1 0.2 1 0.2
Uraspis secunda cottonmouth jack 1 0.3 1 0.2
Seriola rivoliana almaco jack 1 0.2 1 0.2
Prognathodes aya bank butterflyfish 1 0.0 1 0.2
Holocentrus adscensionis squirrelfish 1 0.2 1 0.2
Mustelus smooth hound sharks 1 0.8 1 0.2
Pomadasys crocro burro grunt 1 0.3 1 0.2
Ogcocephalus corniger longnose batfish 1 0.0 1 0.2
Apogon aurolineatus bridle cardinalfish 1 0.0 1 0.2
Crustaceans
Farfantepenaeus aztecus brown shrimp 29927 652.2 301 67.0
Callinectes similis lesser blue crab 6057 125.6 234 52.1
Litopenaeus setiferus white shrimp 3324 110.5 151 33.6
Rimapenaeus similis Roughback shrimp 1943 6.1 112 24.9
Squilla empusa Mantis shrimp 1859 27.6 128 28.5
Portunus spinicarpus longspine swimming crab 1603 13.8 46 10.2
Sicyonia brevirostris brown rock shrimp 1041 17.2 85 18.9
Farfantepenaeus duorarum pink shrimp 1005 27.9 73 16.3
Sicyonia dorsalis lesser rock shrimp 562 1.9 39 8.7
Portunus gibbesii iridescent swimming crab 530 6.5 77 17.1
Solenocera vioscai humpback shrimp 480 1.9 31 6.9
Squilla chydaea mantis shrimp 325 1.9 48 10.7
Xiphopenaeus kroyeri seabob 268 0.0 18 4.0
Calappa sulcata yellow box crab 265 56.0 81 18.0
Callinectes sapidus blue crab 245 40.6 61 13.6

Table 3. Species composition list (continued)
NUMBER OF
TOTAL NUMBER TOTAL WEIGHT TOWS WHERE % FREQUENCY
GENUS/SPECIES COMMON NAME CAUGHT CAUGHT (KG) CAUGHT OCCURRENCE
Portunus spinimanus blotched swimming crab 213 8.6 48 10.7
Anasimus latus stilt spider crab 187 1.4 23 5.1
Rimapenaeus constrictus roughneck shrimp 91 0.3 26 5.8
Raninoides louisianensis Gulf frog crab 55 0.6 19 4.2
Solenocera atlantidis dwarf humpback shrimp 33 0.0 9 2.0
Metapenaeopsis goodei Caribbean velvet shrimp 23 0.0 7 1.6
Pseudorhombila quadridentata flecked squareback crab 18 0.2 5 1.1
Podochela sidneyi shortfinger neck crab 18 0.1 7 1.6
Plesionika longicauda pandalid shrimp 18 0.0 3 0.7
Scyllarides nodifer ridged slipper lobster 17 4.5 8 1.8
Paguristes triangulatus hermit crab 14 0.0 3 0.7
Stenorhynchus seticornis yellowline arrow crab 13 0.1 7 1.6
Dardanus insignis red brocade hermit 13 0.0 3 0.7
Pagurus impressus dimpled hermit 12 0.0 2 0.4
Porcellana sayana spotted porcelain crab 11 0.0 1 0.2
Parapenaeus politus deepwater rose shrimp 9 0.0 3 0.7
Mithrax forceps red-ridged clinging crab 8 0.0 3 0.7
Petrochirus diogenes giant hermit crab 8 0.8 5 1.1
Arenaeus cribrarius speckled swimming crab 8 0.4 6 1.3
Ovalipes floridanus Florida lady crab 8 0.3 4 0.9
Libinia dubia longnose spider crab 8 0.0 8 1.8
Portunus sayi sargassum swimming crab 7 0.0 3 0.7
Dardanus fucosus bareye hermit 7 0.0 4 0.9
Hepatus epheliticus calico crab 7 0.3 5 1.1
Cryptodromiopsis antillensis hairy sponge crab 7 0.1 5 1.1
Persephona crinita pink purse crab 7 0.0 6 1.3
Euphrosynoplax clausa craggy bathyal crab 6 0.0 4 0.9
Scyllarus chacei Chace slipper lobster 6 0.0 4 0.9
Portunus ordwayii 6 0.0 3 0.7
Leiolambrus nitidus white elbow crab 5 0.0 3 0.7
Myropsis quinquespinosa fivespine purse crab 5 0.0 2 0.4
Acanthocarpus alexandri gladiator box crab 4 0.0 2 0.4

Table 3. Species composition list (continued)
NUMBER OF
TOTAL NUMBER TOTAL WEIGHT TOWS WHERE % FREQUENCY
GENUS/SPECIES COMMON NAME CAUGHT CAUGHT (KG) CAUGHT OCCURRENCE
Sicyonia parri rock shrimps 4 0.1 1 0.2
Mithrax pleuracanthus shaggy clinging crab 4 0.0 3 0.7
Stenocionops furcatus coelatus spider crab 4 0.0 2 0.4
Calappa flammea flame box crab 3 0.6 2 0.4
Stenocionops furcatus furcatus furcate crab 3 0.2 2 0.4
Scyllarus depressus scaled slipper lobster 3 0.1 1 0.2
Platylambrus granulata bladetooth elbow crab 3 0.0 2 0.4
Libinia emarginata portly spider crab 3 0.6 3 0.7
Petrolisthes 2 0.0 1 0.2
Paguristes spp. hermit crabs 2 0.0 2 0.4
Pilumnus dasypodus shortspine hairy crab 2 0.0 2 0.4
Pagurus bullisi hermit crab 2 0.0 1 0.2
Mesopenaeus tropicalis salmon shrimp 2 0.0 2 0.4
Pilumnus floridanus plumed hairy crab 2 0.0 1 0.2
Diogenidae left-handed hermit crabs 1 0.0 1 0.2
Eriphia 1 0.0 1 0.2
Pilumnus sayi spineback hairy crab 1 0.0 1 0.2
Paguridae right-handed hermit crabs 1 0.0 1 0.2
Nerocila 1 0.0 1 0.2
Tyche emarginata fourhorn crab 1 0.0 1 0.2
Synalpheus 1 0.0 1 0.2
Pagurus pollicaris flatclaw hermit crab 1 0.0 1 0.2
Paguristes sericeus blue-eyed hermit 1 0.0 1 0.2
Stenocionops spinimanus prickly spider crab 1 0.3 1 0.2
Danielum ixbauchac red sea crab 1 0.0 1 0.2
Xanthidae mud crabs 1 0.0 1 0.2
Livoneca redmanii isopod 1 0.0 1 0.2
Parthenope agonus 1 0.0 1 0.2
Sicyonia spp. rock shrimps 1 0.0 1 0.2
Unid crusta 1 0.5 1 0.2

Table 3. Species composition list (continued)
NUMBER OF
TOTAL NUMBER TOTAL WEIGHT TOWS WHERE % FREQUENCY
GENUS/SPECIES COMMON NAME CAUGHT CAUGHT (KG) CAUGHT OCCURRENCE
Crustaceans Unidentified crustacean 1 0.2 1 0.2
Iliacantha liodactylus purse crab 1 0.0 1 0.2
Macrocoeloma trispinosum spongy decorator crab 1 0.0 1 0.2
Others
Amusium papyraceum paper scallop 2173 19.2 53 11.8
Loligo plei arrow squid 1094 22.7 108 24.1
Lolliguncula brevis Atlantic brief squid 933 3.3 118 26.3
Loligo pealeii longfin squid 637 20.5 70 15.6
Loligo spp. squids 348 5.1 11 2.4
Anadara baughmani Baughman's ark 114 1.7 11 2.4
Pitar cordatus Schwengel's pitar 65 1.3 20 4.5
Polystira albida white giant turris 60 0.4 11 2.4
Mollusca molluscs 40 8.9 13 2.9
Lirophora clenchi Clench venus 19 0.2 4 0.9
Unid other 12 56.6 6 1.3
Conus austini cone shell 10 0.1 3 0.7
Euvola raveneli Ravenel's scallop 9 0.0 5 1.1
Unid other 8 89.9 6 1.3
Eucrassatella speciosa beautiful crassatella 7 0.1 1 0.2
Cantharus cancellarius cancellate cantharus 6 0.0 3 0.7
Pteria colymbus Atlantic wing-oyster 6 0.1 3 0.7
Anadara transversa transverse ark 5 0.1 1 0.2
Distorsio clathrata Atlantic distorsio 4 0.0 2 0.4
Neverita duplicata shark eye 4 0.0 4 0.9
Tonna galea giant tun 4 0.4 3 0.7
Dendostrea 2 0.0 2 0.4
Murex cabritti 2 0.0 1 0.2
Pinctada 2 0.0 1 0.2

Table 3. Species composition list (continued)
NUMBER OF
TOTAL NUMBER TOTAL WEIGHT TOWS WHERE % FREQUENCY
GENUS/SPECIES COMMON NAME CAUGHT CAUGHT (KG) CAUGHT OCCURRENCE
Stramonita haemastoma rocksnail 2 0.0 2 0.4
Chicoreus florifer-dilectus 2 0.0 2 0.4
Latirus infundibulum brown-line latirus 2 0.0 1 0.2
Argopecten gibbus calico scallop 2 0.0 2 0.4
Pleuroploca gigantea horse conch 1 0.0 1 0.2
Sinum perspectivum white baby-ear 1 0.0 1 0.2
Nodipecten 1 0.0 1 0.2
Scyllaea pelagica sargassum nudibranch 1 0.0 1 0.2
Calliostoma jujubinum mottled topsnail 1 0.0 1 0.2
Laevicardium laevigatum eggcockle 1 0.1 1 0.2
Macoma pulleyi delta macoma 1 0.0 1 0.2
Octopus burryi brownstripe octopus 1 0.1 1 0.2
Octopus vulgaris common Atlantic octopus 1 0.3 1 0.2
Sconsia striata royal bonnet 1 0.0 1 0.2
Busycon sinistrum lightning whelk 1 0.0 1 0.2
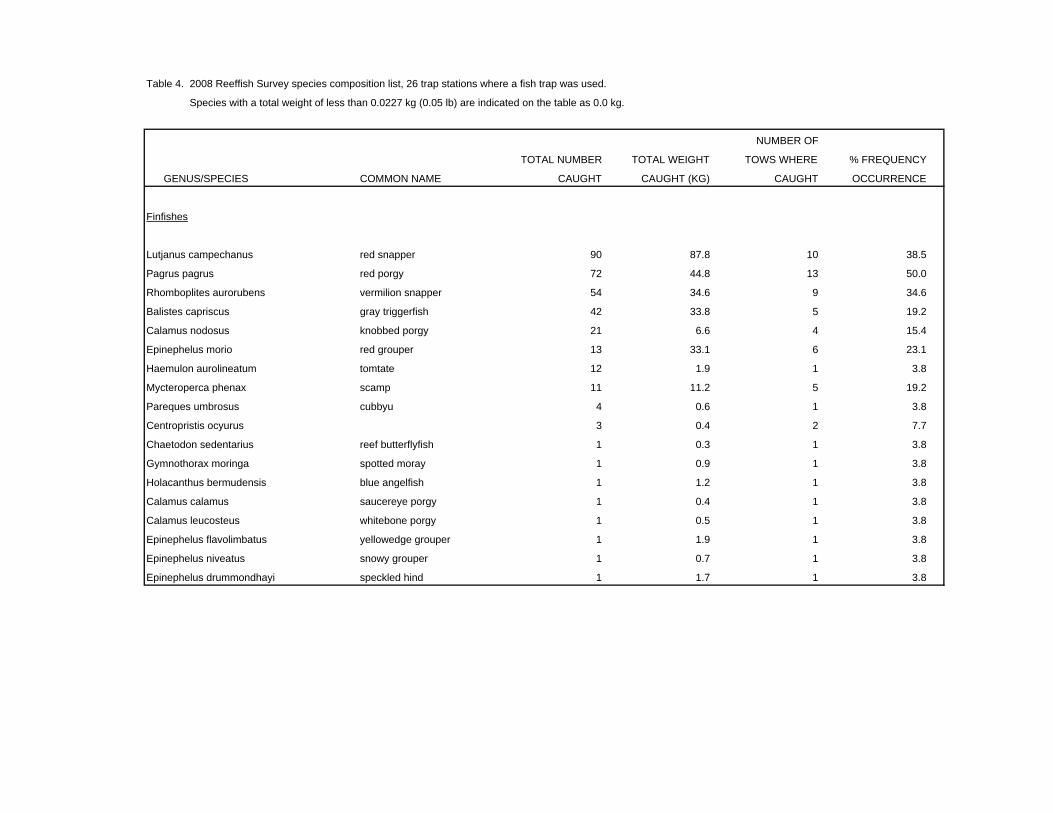
Table 4. 2008 Reeffish Survey species composition list, 26 trap stations where a fish trap was used.
Species with a total weight of less than 0.0227 kg (0.05 lb) are indicated on the table as 0.0 kg.
NUMBER OF
TOTAL NUMBER TOTAL WEIGHT TOWS WHERE % FREQUENCY
GENUS/SPECIES COMMON NAME CAUGHT CAUGHT (KG) CAUGHT OCCURRENCE
Finfishes
Lutjanus campechanus red snapper 90 87.8 10 38.5
Pagrus pagrus red porgy 72 44.8 13 50.0
Rhomboplites aurorubens vermilion snapper 54 34.6 9 34.6
Balistes capriscus gray triggerfish 42 33.8 5 19.2
Calamus nodosus knobbed porgy 21 6.6 4 15.4
Epinephelus morio red grouper 13 33.1 6 23.1
Haemulon aurolineatum tomtate 12 1.9 1 3.8
Mycteroperca phenax scamp 11 11.2 5 19.2
Pareques umbrosus cubbyu 4 0.6 1 3.8
Centropristis ocyurus 3 0.4 2 7.7
Chaetodon sedentarius reef butterflyfish 1 0.3 1 3.8
Gymnothorax moringa spotted moray 1 0.9 1 3.8
Holacanthus bermudensis blue angelfish 1 1.2 1 3.8
Calamus calamus saucereye porgy 1 0.4 1 3.8
Calamus leucosteus whitebone porgy 1 0.5 1 3.8
Epinephelus flavolimbatus yellowedge grouper 1 1.9 1 3.8
Epinephelus niveatus snowy grouper 1 0.7 1 3.8
Epinephelus drummondhayi speckled hind 1 1.7 1 3.8

Table 5. 2008 Bottom Longline Survey species composition list. Species with no weight recorded were too large to measure.
TOTAL NUMBER TOTAL WEIGHT
GENUS/SPECIES COMMON NAME CAUGHT CAUGHT (KG)
Finfishes
Rhizoprionodon terraenovae Atlantic sharpnose shark 407 793.39
Carcharhinus limbatus blacktip shark 145 545.90
Bagre marinus gafftopsail catfish 88 120.65
Sciaenops ocellatus red drum 73 563.00
Carcharhinus leucas bull shark 36 1.00
Carcharhinus isodon finetooth shark 17 69.25
Dasyatis americana southern stingray 16 73.50
Galeocerdo cuvier tiger shark 13 9.00
Arius felis hardhead catfish 11 6.25
Carcharhinus acronotus blacknose shark 8 52.25
Rhinoptera bonasus cownose ray 6 9.00
Pomatomus saltatrix bluefish 6 2.85
Carcharhinus brevipinna spinner shark 4 13.25
Sphyrna mokarran great hammerhead 3
Pogonias cromis black drum 1 13.70
Rachycentron canadum cobia 1 8.00
Carcharhinus plumbeus sandbar shark 1
Lepidochelys kempii Kemp's ridley 1
Carcharhinidae requiem sharks 1
Dasyatis say bluntnose stingray 1
Caretta caretta Loggerhead 1

Figure 1. Statistical zones for shrimp in the Gulf of Mexico.

Figure 2. Locations of plankton stations during the 2008 Winter Plankton Survey.

Figure 3. Locations of plankton and environmental stations during the 2008 Spring Plankton Survey.

Figure 4. Locations of plankton stations during the 2008 Spring Shrimp/Groundfish Survey.

Figure 5. Locations of plankton stations during the 2008 Summer Shrimp/Groundfish Survey.

Figure 6. Locations of plankton and environmental stations during the 2008 Fall Plankton Survey.

Figure 7. Locations of plankton stations during the 2008 Fall Shrimp/Groundfish Survey.

Figure 8. Locations of environmental stations during the 2008 Spring Shrimp/Groundfish Survey.

Figure 9. Locations of trawl stations during the 2008 Spring Shrimp/Groundfish Survey.

Figure 10. Locations of environmental stations during the 2008 Summer Shrimp/Groundfish Survey.

Figure 11. Locations of trawl stations during the 2008 Summer Shrimp/Groundfish Survey.

Figure 12. Locations of environmental stations during the 2008 Fall Shrimp/Groundfish Survey.

Figure 13. Locations of trawl stations during the 2008 Fall Shrimp/Groundfish Survey.

Figure 14. Locations of stations during the 2008 Reeffish Survey.

Figure 15. Locations of stations during the 2008 Inshore Bottom Longline Survey.