
SEA OIL SPILL OBSERVATION BY MEANS OF ANALYSIS...
21
SEA OIL SPILL OBSERVATION BY MEANS OF ANALYSIS OF SPATIAL STATISTICS IN POLARIMETRIC SAR DATA USING WAVELET SIGNATURES Attilio Gambardella (1) , Gianfranco De Grandi (2) , Tom Ainsworth (3) , and Maurizio Migliaccio (1) (1) Università degli Studi di Napoli Parthenope, Napoli, Italy. (2) European Commission, DG Joint Research Centre, Ispra (VA), Italy. (3) Naval Research Laboratory, Washington, DC.
Transcript of SEA OIL SPILL OBSERVATION BY MEANS OF ANALYSIS...

SEA OIL SPILL OBSERVATION BY MEANS OF ANALYSIS OF SPATIAL STATISTICS IN
POLARIMETRIC SAR DATA USING WAVELET SIGNATURES
Attilio Gambardella(1), Gianfranco De Grandi(2),Tom Ainsworth(3), and Maurizio Migliaccio(1)
(1) Università degli Studi di Napoli Parthenope, Napoli, Italy.(2) European Commission, DG Joint Research Centre, Ispra (VA), Italy.
(3) Naval Research Laboratory, Washington, DC.

Summary
• Introduction• Wavelet Polarization Signature• Experiments• Conclusions

Introduction
• Oil spill detection by means of SAR images is possible because of the damping effect of the short wind waves caused by the presence of oil on the sea surface.
• An oil spill is physically a low backscatter area and appears as a dark area in SAR images.
• Other physical phenomena may generate dark areas (look-alikes).

Introduction
• Spatial variations of SAR backscatter bear information on structural and geometric properties of natural targets.
• Variations and their relationships are visually perceived as image texture.

IntroductionHypothesis• Combined use of texture statistical analysis and
radar polarimetry can provide additional information to SAR oil spill observation.
The Approach• A multi-resolution analysis of polarimetric SAR
data by means of wavelet frames is performed to characterize dark areas in marine scenes.
Wavelet Polarization Signature
• The adopted analytical tool is the recently developed Wavelet Polarimetric Signature (WASP) tool*.
• Central to WASP analysis is the dependency of texture measures, afforded by a wavelet frame representation, on the antenna polarization state and the scale of observation.
* G. De Grandi, J.-S. Lee, and D. Schuler, “Target detection and texture segmentation in polarimetric SAR images using a wavelet frame: Theoretical Aspects,” IEEE Trans. on Geosci. and Remote Sensing, vol. 45, no.11, pp.3437-3453, Nov. 2007.

Wavelet Polarization Signature
• A vector of covariance matrix elements is extracted from the polarimetric data set along a linear transect of the SAR image.
• A discrete wavelet transform is applied to each of these vectors, and the variance of the wavelet coefficients computed at a number of dyadic scales.

Wavelet Polarization Signature• Power is synthesized in the cross-polarized
linear configuration at a number of orientation angles ranging from 0 to 180 degrees.
• The signature consists of a family of graphs, each mapping the normalized wavelet variance against the orientation angle at a given dyadic scale.

Wavelet Polarization Signature
• The used Wavelet-Frame acts as a differential operator.
• Synthesis is performed in a linear cross-polarized configuration and varying the orientation angle.

Wavelet Polarization Signature
• Speckle is taken into account by a normalization of the wavelet coefficients.
• The wavelet variance approximates locally a two point statistics known as structure function.
Experiments• WASP analysis is applied to characterize the
spatial statistics of dark areas over marine scenes.
• The data set (C-band multi-look complex) was acquired during the SRL-2 SIR-C/X-SAR mission.
• The images include features related to oil spills, biogenic look-alikes and low wind areas*.
*data set courtesy of Joint Research Centre - European Microwave Signature Laboratory and United States Geological Services.

Experiments
• SAR data acquired on October 11, 1994 over the German Bight of the North Sea (processing number 40386). The experiment site wascharacterized by high wind conditions.

Experiments
IFO180 SEA1 OLA
SEA2 OLME TOLG

Experiments
• SAR data acquired on October 1, 1994 over the Pacific Ocean nearJapan (processing number 41370). The experiment site was characterized by low wind conditions.

Experiments
SEA1 OLA SEA2

Experiments
• SAR data acquired on September 30, 1994 near the Sarobetsu , Japan (processing number 44307). The experiment site was characterized by very low wind conditions.

Experiments
LW SEA CUR
Experiments
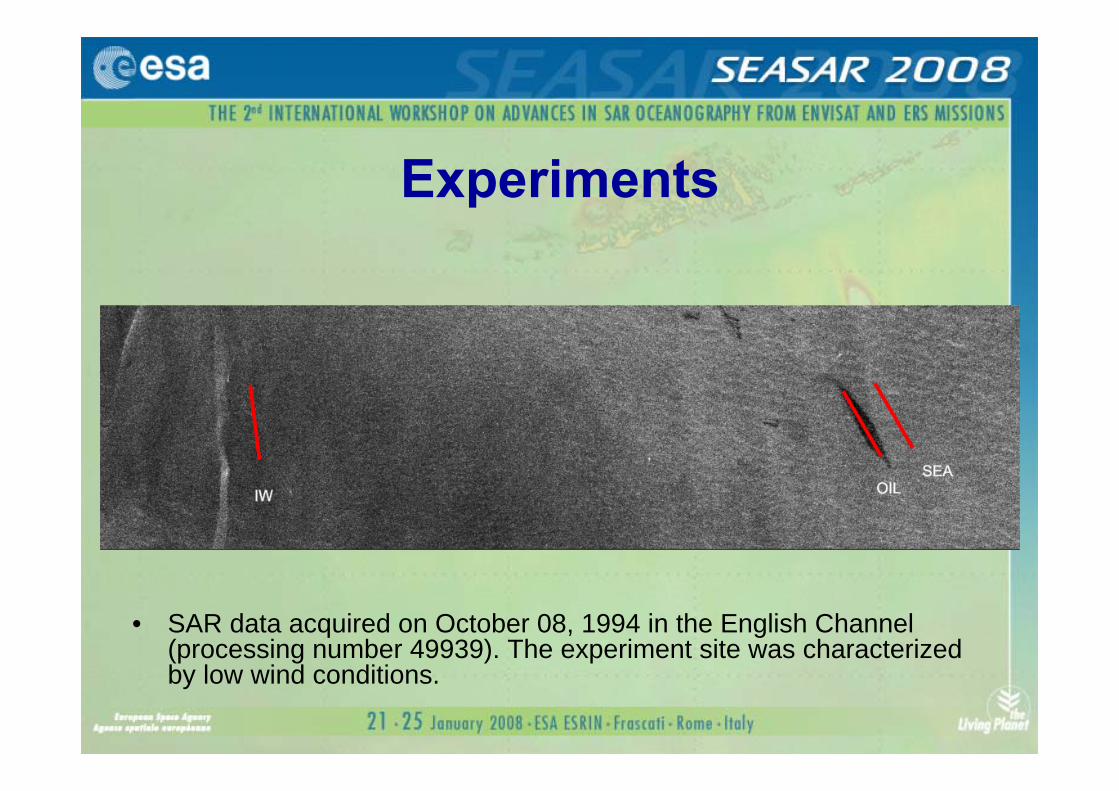
• SAR data acquired on October 08, 1994 in the English Channel (processing number 49939). The experiment site was characterizedby low wind conditions.

Experiments
OIL SEA IW

Conclusions
• Texture measures, based on wavelet frames, can effectively characterize the spatial statistics of SAR observations in the combined space-scale-polarization domain.
• WASP analysis can help in discriminating oil spills from look-alikes.
• Wind speed, affect the sensitivity to polarization dependency.

Thank YouThank You