
SDC/BIDC Annual Conference Austin May 22, 2013 Pia Orrenius Federal Reserve Bank of Dallas...
31
SDC/BIDC Annual Conference Austin May 22, 2013 Pia Orrenius Federal Reserve Bank of Dallas Disclaimer: The views expressed herein are those of the presenter; they do not necessarily reflect the views of the Federal Reserve Bank of Dallas or the Federal Reserve System. From Brawn to Brains: Immigrants in the U.S. and Texas Labor Markets
-
Upload
shonda-boone -
Category
Documents
-
view
215 -
download
0
Transcript of SDC/BIDC Annual Conference Austin May 22, 2013 Pia Orrenius Federal Reserve Bank of Dallas...

SDC/BIDC Annual Conference Austin
May 22, 2013
Pia OrreniusFederal Reserve Bank of Dallas
Disclaimer: The views expressed herein are those of the presenter; they do not necessarily reflect the views of the Federal Reserve Bank of Dallas or the Federal Reserve System.
From Brawn to Brains:Immigrants in the U.S.
and Texas Labor Markets
Road map
Recent trends in immigrationCharacteristics of immigrants in U.S., TexasEffects of immigration on economic activityLabor market and fiscal effectsPolicy implications

VOLUME AND CHARACTERISTICS
Recent Trends in Immigration

Immigrants account for over half of recent labor force growth
SOURCE: Bureau of Labor Statistics.
1996 1997 1998 1999 2000 2001 2002 2003 2004 2005 2006 2007 2008 2009 2010 20110
5,000
10,000
15,000
20,000
25,000
30,000
0
2
4
6
8
10
12
14
16
18Number of Foreign Born Workers
Percent of Labor Force Foreign Born
Thousands of Workers Percent

Rising influx of foreign-born,low-skilled workers
1960 1970 1980 1990 2000 20110
1,000,000
2,000,000
3,000,000
4,000,000
5,000,000
6,000,000
7,000,000
0
10
20
30
40
50
60Millions Per-
cent
Foreign-born, low-skilled workers
Foreign born share of low-skilled labor force
NOTE: Number of foreign-born workers with less than a high school education aged 25 and older.Source: Census; 2011 American Community Survey

Age Profile of Immigrants vs. Natives in Texas
Under 4
5 to 9
10 to 14
15 to 19
20 to 24
25 to 29
30 to 34
35 to 39
40 to 44
45 to 49
50 to 54
55 to 59
60 to 64
65 to 69
70 to 74
75 to 79
Over 80Natives ImmigrantsAge
Percent1515 10 1055 0

Migration DecisionPull factors Host country economic growth, migrant networks
Push factors Home country conditions
Costs/Barriers Geographic proximity Current policy
Restricts high-skilled immigration; work-based immigrationEncourages family reunification; unauthorized immigration
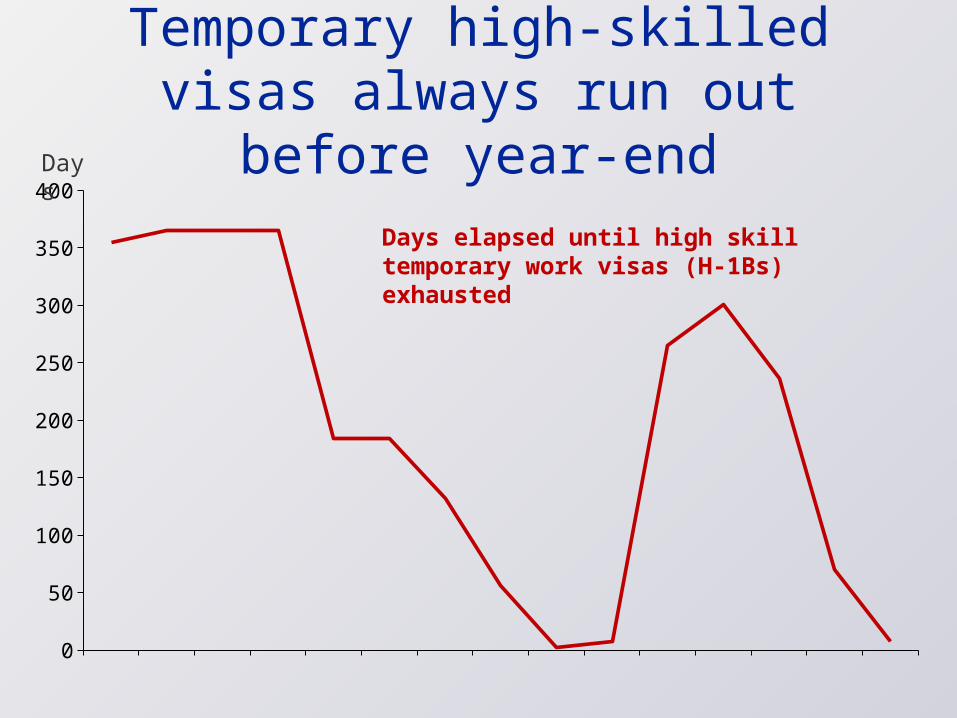
Temporary high-skilled visas always run out before year-end
2000 2002 2004 2006 2008 2010 2012 20140
50
100
150
200
250
300
350
400Days
Days elapsed until high skill temporary work visas (H-1Bs) exhausted

Unauthorized immigrant flows
SOURCE: Warren, R., Warren, J.R., 2013, IMR.
-400
-200
0
200
400
600
800
1,000
1,200Thou-sands
Net change in unau-thorized population
NOTE: Shaded bars represent U.S. recessions.

0
5
10
15
20
25
30
35
40
Percent
SOURCE: 2011 American Community Survey.
Foreign born Native
Nearly one-third of the foreignborn lack a high school degree
Education Distribution by Nativity

Foreign Born Worker Concentration by State
Migrant workers concentrated in a few states

IMMIGRANTSTO TEXAS

Native-born in Texas, U.S. similar in education
0
5
10
15
20
25
30
35
Texas Native BornU.S. Native Born
Percent

Foreign-born in Texas have much lower education
0
5
10
15
20
25
30
35
40
45
50
Texas Immigrants U.S. Immigrants
Per-cent
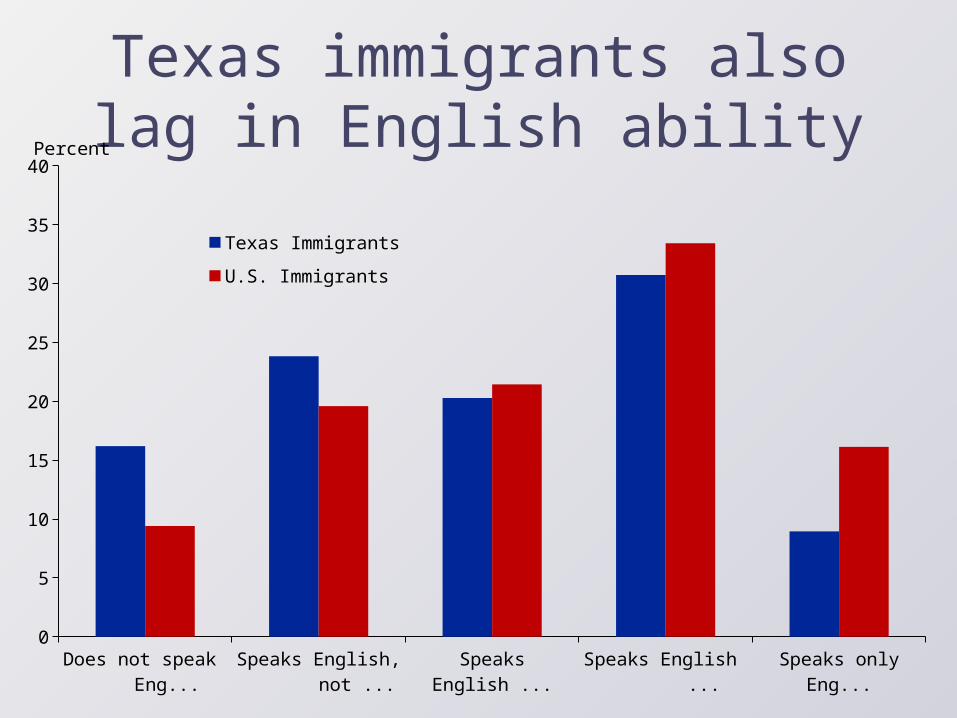
Texas immigrants also lag in English ability
0
5
10
15
20
25
30
35
40
Texas Immigrants
U.S. Immigrants
Percent

Texas immigrants 60% from Mexico
59.8
11.4
1.3
3.2
18.6
5.7
Texas
Mexico Latin America Caribbean Africa Asia Europe, Canada, Oceania

Texans, foreign and native, have higher employment rates
2000 2001 2002 2003 2004 2005 2006 2007 2008 2009 2010 2011 201252
54
56
58
60
62
64
66
68
70
Texas Foreign Born Texas NativeU.S. Foreign Born U.S. Native
Percent

And lower unemployment rates
2000 2001 2002 2003 2004 2005 2006 2007 2008 2009 2010 2011 20120
2
4
6
8
10
12
Texas Foreign Born Texas NativeU.S. Foreign Born U.S. Native
Percent

Still Texan immigrants earn less
2000 2001 2002 2003 2004 2005 2006 2007 2008 2009 2010 2011 2012300
350
400
450
500
550
600
650
700
750
Texas Foreign BornTexas Native
Real $

Except for low-skilled, who earn the same as in the rest of the U.S.
2000 2001 2002 2003 2004 2005 2006 2007 2008 2009 2010 2011 2012300
350
400
450
500
550
Texas Foreign Born
Real $

EFFECT ON ECONOMIC ACTIVITY

Economic BenefitsImmigrants benefit from higher wagesNatives also benefit More workers, lower prices Higher productivity through specialization;
efficiency through mobility Higher return to capital boosts investment Immigration surplus $38-$75 billion per year
Complementary immigration, bigger boost

Immigration and Economic Growth
Faster growth relies on productivity growthInnovation High-skilled immigrants, particularly in STEM fields
Highly educated immigrants receive patents at more than twice the rate of natives
Entrepreneurship 25 percent of high-tech startups between 1995
and 2005 founded by immigrants Immigrants 30 percent more likely to start a
business

Lawyers/Judges
Veterinarians
Actors, directors, producers
Chief executives and public administrators
Managers and administrators
Economists, market researchers, survey researchers
Chemical engineers
Registered nurses
Biological scientists
Architects
Dentists
Mechanical engineers
Pharmacists
High school and college instructors
Computer systems analysts and computer scientists
Mathematicians
Physicians
Chemists
Computer software developers
Medical scientists
0 20 40 60 80 100 120
PercentNote: Percent of workers age 25 and over, with bachelor's degree or higher who are foreign born for se-lected occupations.Source: 2011 American Community Survey
Foreign-born as a percent-age of college graduate la-bor force
16.4
STEM, health care occupations rely on high-skilled foreign workers

LABOR MARKET AND FISCAL IMPACTS
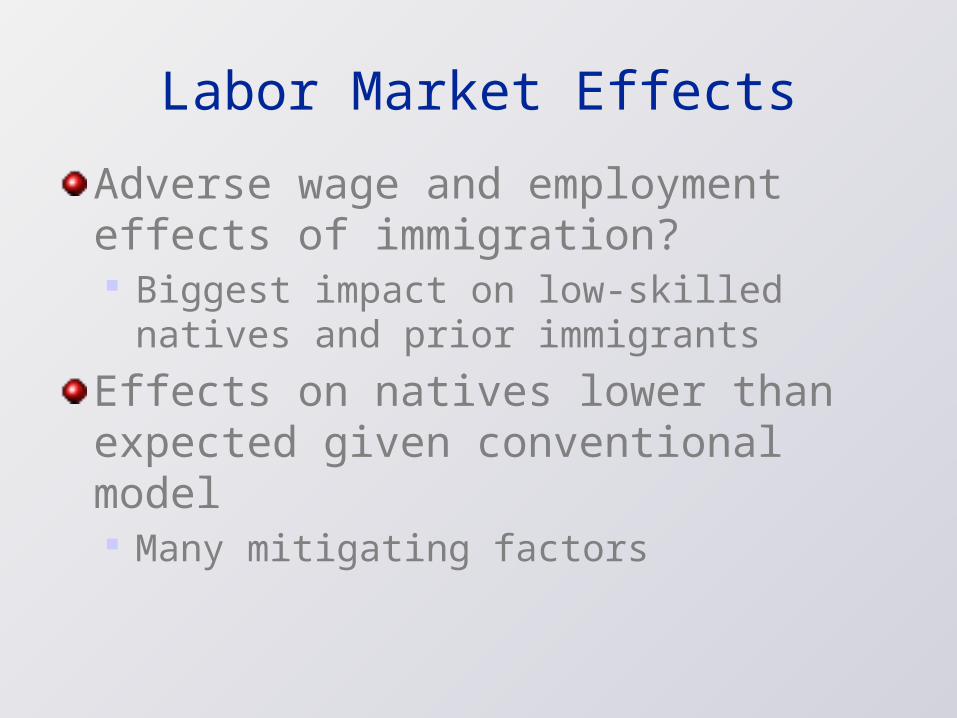
Labor Market Effects
Adverse wage and employment effects of immigration? Biggest impact on low-skilled natives and prior
immigrants
Effects on natives lower than expected given conventional model Many mitigating factors
Fiscal Impact
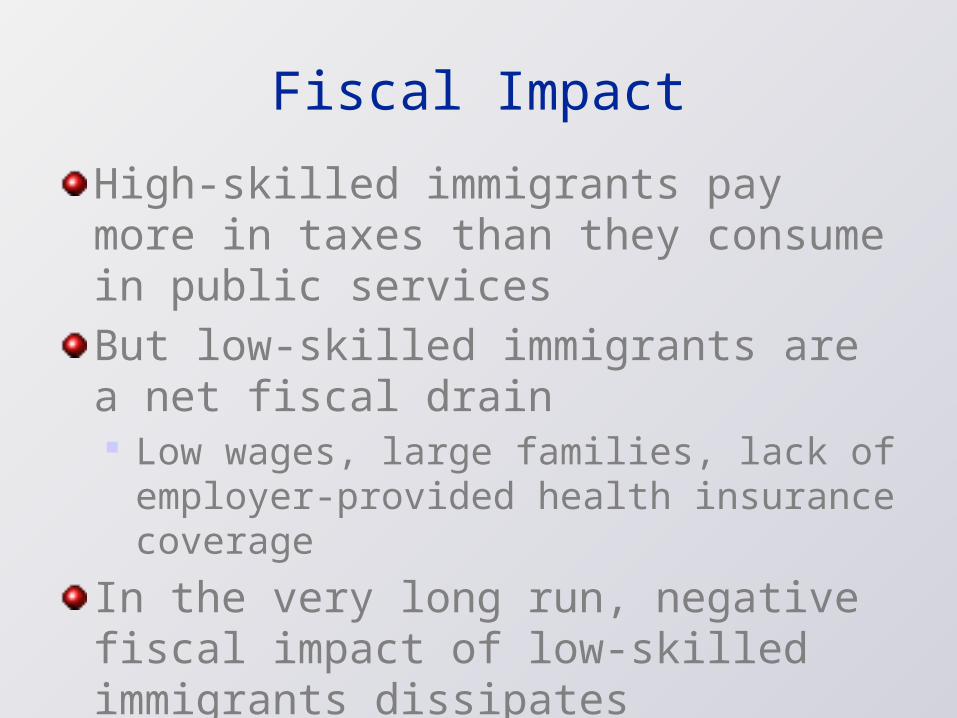
High-skilled immigrants pay more in taxes than they consume in public servicesBut low-skilled immigrants are a net fiscal drain Low wages, large families, lack of employer-
provided health insurance coverage
In the very long run, negative fiscal impact of low-skilled immigrants dissipates

POLICY IMPLICATIONS

Economics of Immigration & PolicyExpand high-skilled employment-based immigration 86% of green cards go to family & humanitarian Only 7% of green cards to principal workers Resolve LPR backlogs
Provide low-skilled employment-based visasImplement legalization program Speed integration; improve outcomes Restore circularity Bring workers onto books; employers compliant

Summary
Immigration has transformed the U.S., Texas workforce
Flows have been skewed toward low-skill Texas more than most other states
Macro economy has benefited But fiscal impact detracts
Reform should give economics of immigration a bigger role in policy


![SDC-12/SDC-15 · 2018-01-14 · Introduction 6 SDC-12/SDC-151080pD-ILA3D Front Projector2013 User’s Manual AdditionalOptionalAccessories Replacementlamps: •FormodelsSDC-12andSDC-15[2013productionandbeyond]orderlampWC-LPU230](https://static.fdocuments.net/doc/165x107/5f30eb9530d2254a2869f490/sdc-12sdc-15-2018-01-14-introduction-6-sdc-12sdc-151080pd-ila3d-front-projector2013.jpg)
