SDC Sustainable Neighbourhood Infrastructure: evidence base … · 2018-04-12 · Buro Happold SDC...
60
SDC Sustainable Neighbourhood Infrastructure: evidence base July 2010
Transcript of SDC Sustainable Neighbourhood Infrastructure: evidence base … · 2018-04-12 · Buro Happold SDC...

SDC Sustainable Neighbourhood Infrastructure: evidence base
July 2010


3
Buro Happold
SDC
Sust
aina
ble
Nei
ghbo
urho
od In
fras
truc
ture
: evi
denc
e ba
se
©Buro Happold
Every aspect of our lives depends on infrastructure. To live more sustainably we need to configure infrastructure to help us. We need buses to run on time, space to segregate our waste, safe and pleasant foot paths, clean water from sustainable sources and low carbon energy supplies. Many of these goals can be achieved by rethinking what we currently have, recognising linkages between different systems and the need for new or different service provision.
This report was commissioned by the Sustainable Development Commission to address these issues at community scale. By mapping infrastructure in three typical but differing urban areas, the study highlights a number of factors that need to be addressed to promote and enable more sustainable infrastructure provision.
There are many technological solutions available that improve infrastructure. The list of measures compiled for this study does not contain many surprises in technological terms. What was emphasised instead was that the compartmentalised nature of delivery means that natural linkages between infrastructure types - such as waste and energy or green space and food provision - are not being fully exploited. Thus it was found that technology per se is not a major barrier to delivering sustainable infrastructure. Issues that need to be addressed relate more to organisation, governance, finance and behaviour as outlined below.
LOCAL CAPACITY BUILDING AND AN AGENT FOR CHANGE
There is a need for a local integrator to coordinate change
A key requirement identified is for a local integrator to act as a ‘face’ for a community and to bring together the different and complex infrastructure systems. The delivery of the different types of infrastructure, utilities in particular, is segregated both physically and in regulatory terms. There are clear benefits to this due to economies of scale and efficiency but it presents significant difficulties when trying to deliver integrated projects at community scale. These projects may cross the boundaries between one form of infrastructure and another and hence require a ‘champion’ or ‘integrator’ to bring the different elements together. The value brought by such an integrator is significant and although rarely seen in the analysis of (capital) costs and revenues it is instrumental to change. Clear and funded support is required at this level to ensure retrofit measures are appropriate and efficiently planned for the community as a whole.
The application of different sustainability measures will be affected by the capacity and stage of development of neighbourhood organisations. Communities are dynamic and individuals can effect change with the right support. The process of developing sustainable infrastructure can be described in a set of steps. Understanding both short and long term actions to be taken to support the community to a more sustainable way of life is a necessary part of defining the opportunities that may exist.
Executive Summary
A positive relationship between Local Authority and Community Groups is important
Linked to this is the need for an active and positive relationship between the Local Authority and community leaders. Local Authorities act at a wider scale than the community group and cannot be expected to understand or be aware of all local issues within a particular community. Equally, a community group cannot be expected to deliver change without institutional support from the Local Authority. A constructive and mutually supportive relationship is therefore essential to delivery of sustainable infrastructure.
CELEBRATION OF UNIQUENESS
Every area is different
The nature and variety of infrastructure retrofit measures that could be applied are informed by many local factors. These factors go beyond geography and building density and take into account levels of community and Local Authority engagement, as well as social demographics. Holistic planning of infrastructure improvement needs to take all these factors into account and hence the solutions arrived at will differ from place to place.
Infrastructure retrofit as a dynamic process
Solutions will also differ over time with the retrofit process necessarily being a dynamic one. A neighbourhood will change because of the people in it, the age of its assets and what is going on around it. Climate change could also have an impact. Reconfiguring infrastructure is therefore an ongoing process rather than a one-off upgrade.
FINANCING
Some of the most life enhancing infrastructure is not ‘valued’ by the market
Funding of retrofit measures will depend largely on the nature of any associated outputs. If these have value in the market such as electricity, private finance can be leveraged and businesses and / or social enterprises set up. However there are a number of other outputs – such as increased biodiversity – which have no such market value and hence need to be funded by alternative mechanisms with public sector support where this is available.
BEHAVIOUR
It is important for infrastructure planners to understand behaviour and motivation for change
Infrastructure design has a clear influence on behaviour. Many aspects of increased sustainability require behaviour change and it is important that any retrofit measures undertaken support this in an effective way.
SDC - EXECUTIVE SUMMARY DIAGRAM
BUILDINGS
UTILITIESTRANSPORT
WASTE
GREEN SPACE& PUBLIC REALM
BLUE SPACE
COMMUNITY
INFRASTRUCTURE STREAMS
LOCALAUTHORITY
1 Local integrator to coordinate change2 Positive relationship between community leaders and local authority3 Every community is di�erent4 Infrastructure retro�t is an ongoing process5 Not all infrastructure is “valued” by the market6 Behaviour change is required
1
2
COMMUNITY LEADERS

4
SDC
Sust
aina
ble
Nei
ghbo
urho
od In
fras
truc
ture
: evi
denc
e ba
se
©Buro Happold
Contents
01 Introduction 5
1 Introduction 5
2 What is a sustainable outcome? 5
3 Analytical frameworks 6
4 Infrastructure and society 6
02 Opportunities 8
1 Approach 8
2 Opportunities 8
3 Issues arising 10
03 Cost 13
1 Approach 13
2 Findings 13
04 Reconfiguration of study areas 15
1 Approach 15
2 Overview of study areas 15
3 Blacon, Chester 16
4 Southville, Bristol 20
5 Armley, Leeds 24
05 Conclusions 28
1 Conclusions 28
2 Suggestions for further work 28
Appendix A – Measures table with cost / benefit analysis 29
Appendix B – Methodology 47
Appendix C – Maps of existing infrastructure 48
Appendix D - Infrastructure ownership and operational structures 49

5
Buro Happold
SDC
Sust
aina
ble
Nei
ghbo
urho
od In
fras
truc
ture
: evi
denc
e ba
se
©Buro Happold
01 Introduction
Sustainable outcomes
Living within environmental limits
• Minimised resource use (water, energy, waste etc)
• Land, buildings and all neighbourhood assets (money, waste, heat, sunlight etc) made to work more efficiently to deliver economic, social and environmental benefits
• Maximised linkages between resources to deliver economic, social and environmental benefits and mechanisms to ensure these are fed back to the community
• Improved resilience to the impacts of climate change
• Enhanced and preserved biodiversity
• Improved air and water quality
• Sustainable transport options being people’s preferred choice
Ensuring a strong, just and healthy society
• Improved quality of place and services
• Enhanced health and well being for residents
• Improved community cohesion, interaction and civic pride
• Access to clear information and resources made easy to enable sustainable behaviour change
Achieving a sustainable economy
• Buildings that cost less to run and where fuel poverty has been eliminated
• Support for local employment
• Delivery and governance structures that enable community ownership of assets where this delivers social, economic and environmental benefits
Promoting good governance
• Delivery and governance structures which are flexible enough to support local action on sustainability
The mapping highlighted how resources flowing into a community, such as goods or potable water, result in a net outflow, such as waste or foul water. It is infrastructure that enables this flow. There is much opportunity for infrastructure to make this flow more sustainable, through minimising usage, enabling reuse, facilitating recovery and recycling, or improving efficiency.
This Stage 2 report builds on the mapping work of Stage 1 by exploring these opportunities in each of the three study areas.
Section 2 outlines a range of measures, or opportunities, that could be considered for sustainable infrastructure retrofit at community scale. These are assessed in terms of their environmental, social and economic costs and benefits.
In Section 3 we take an overview of the financial costs of investment and potential for revenue generation as a means to explore potential funding mechanisms.
And finally, in Section 4 we select the ‘Top 10’ measures that might be applied in each of the three case study areas given their unique characteristics and taking into account the socio-economic and financial analyses outlined above.
Section 5 presents the conclusions.
A full methodology of the study is given in Appendix B.
1.2 What is a sustainable outcome?
Before exploring potential retrofit measures, an understanding of ‘sustainable outcomes’ in this context is required: how does a sustainable neighbourhood look and feel?
Participants at a workshop held by the SDC on 7 December 2009 were asked to identify outcomes they would want to see delivered from a sustainable, retrofitted neighbourhood. The key outcomes are grouped in Box 2 under the headings taken from the principles of Sustainable Development (as set out in the Government’s Sustainable Development Strategy[1]) and are used as the guiding principles for the study.
1 See www.defra.gov.uk/sustainable/government
1.1 Introduction
Infrastructure
As defined by the Oxford English Dictionary:
noun - the basic physical and organisational structures (e.g. buildings, roads, power supplies) needed for the operation of a society or enterprise.
As interpreted in this report:
• Buildings
• Utilities: electricity, gas, water, telecommunications
• Transport
• Waste
• Green space and the public realm
• Blue space
This report completes the second and final stage of an evidence based study that identifies appropriate measures for making the infrastructure of existing communities more sustainable.
Stage 1 of the project undertook a sequence of mapping exercises for three urban communities: Blacon in Chester; Southwood in Bristol; and Armley in Leeds. The three areas were selected as being representative of a range of communities across the UK, each of them with a different housing density. The mapping exercise provided detailed evidence of both the current physical infrastructure serving these neighbourhoods and the institutional and ownership structures supporting it. The key findings of this exercise were that:
• For the utilities - electricity, gas, water, telecoms – the regulatory frameworks and the consistency of consumer needs means that their mode of delivery and physical infrastructure are much the same in each location.
• For transport, waste, green and blue space infrastructure, historical factors, geography, spatial planning practices adopted by local authorities, links to other adjacent areas, and social demographics have a significant impact on infrastructure provision. The level and nature of this provision differed widely in each of the three case study areas.

6
Introduction
SDC
Sust
aina
ble
Nei
ghbo
urho
od In
fras
truc
ture
: evi
denc
e ba
se
©Buro Happold
Social capital indicators
Civic engagement
• Feels well informed about local affairs, feels that can influence decisions in the local area, feels that people in their neighbourhood can influence decisions that affect the neighbourhood.
Neighbourliness
• Feels that neighbours look out for each other, giving and receiving favours.
Social Networks
• Saw and spoke to friends, weekly; close friends live nearby.
Social Support
• Have at least three sources of support for three different scenarios.
Perceptions of local area
• Facilities, problems; joy of living there or fear of crime.
Economic capital
• Increase individual (or household) income
• Increase individual (or household) savings
• Decrease financial exclusion
• Increase resources in the local economy
• The amount spent on supplies (good and services) in the local area.
Others
• Individual skills and personal improvement
• Increase peoples skill/competence in social interaction
• Increase personal effectiveness and aptitude and life skills
• Increase basic work skills and attributes
There are many opportunities for sustainable infrastructure to support increased social and economic capital with the approach taken to development having a significant impact on the potential benefits that can be derived.
1.4 Infrastructure and society
The contribution of sustainable infrastructure measures to society needs to be assessed against local values. In developing appropriate indicators of these values - social, environmental and economic it is critical to success that these are derived by local groups and networks. Although this report does not address social infrastructure per se, it is important to recognise that changes of the physical and institutional infrastructure can support an increase in social capital and health. These issues are expanded on below and were taken into account during the study.
Social Capital
The opportunity for an infrastructure retrofit project to support more sustainable outcomes can be increased by considering three types of social capital:
• Bonding social capital – describes closer connections between people and is characterised by strong bonds e.g. among family members or among members of the same ethnic group; it is good for ‘getting by’ in life.
• Bridging social capital – describes more distant connections between people and is characterised by weaker, but more cross-cutting ties e.g. with business associates, acquaintances, friends from different ethnic groups, friends of friends, etc; it is good for ‘getting ahead’ in life.
• Linking social capital – describes connections with people in positions of power and is characterised by relations between those within a hierarchy where there are differing levels of power; it is good for accessing support from formal institutions. It is different from bonding and bridging in that it is concerned with relations between people who are not on an equal footing.
1.3 Analytical frameworks
The sustainable outcomes are embedded in the social / economic / environmental analysis used for the assessment of the individual retrofit measures proposed.
This assessment has been done on a qualitative basis taking into account the following:
• Environment: the assessment of environmental costs and benefits is the most established methodology having been undertaken systematically for new developments through Environmental Impact Assessments (EIAs) for a number of years. In an EIA the impact of a development is assessed against various criteria – such as biodiversity, noise levels, air quality – to assist planners in deciding whether or not to award planning permission. These criteria were used as a checklist when considering the environmental impact of the reconfiguration measures proposed.
• Economic: for the purposes of this report, assessment of economic value is qualitative based on the impact that improving the sustainability of infrastructure could have on neighbourhood economic indicators. Economic indicators considered include increased individual income, the development of social enterprise, and increased resources in the local economy. The analysis draws on work completed by the New Economics Foundation[2] and works published by the SDC on establishing local value [3].
Estimates of capital cost and operational revenue have also been provided in the context of funding options and are further analysed in Chapter 3.
• Social: the value of sustainable infrastructure to society is profound but assessing and measuring this value is complex and many different approaches can be taken. In a traditional Social Impact Assessment (as part of an EIA) consideration is given to quantitative issues that a project may influence such as demographic impact, housing market impact, civic engagement and voluntary contributions, education, health and crime. These issues can have a direct economic value apportioned to them. This report applies a qualitative rather than quantitative approach to give an indication of social costs or benefits of a particular measure.
2 See www.proveandinprove.org or ‘A Guide to Social Return on Investment,’ Cabinet Office, 2009
3 For example ‘Financing Local Futures: Sustainability in Practice’, SDC, 2007

7
Introduction
Buro Happold
©Buro Happold
SDC
Sust
aina
ble
Nei
ghbo
urho
od In
fras
truc
ture
: evi
denc
e ba
se
Figure 1: Figure 1: Ways to measure the value of parks and green spaces, taken from Making the invisible visible: the real value of park assets, CABE, February 2009
1.5 Summary
Sustainable infrastructure impacts upon the environment, on a local economy and on social issues such as social cohesion and health. This study appraises a wide range of potential retrofit measures across all infrastructure types – buildings, utilities, transport, waste, green and blue space and the public realm – in the light of existing assessment methods and bodies of research.
Health and access
Infrastructure upgrades can support and promote other social goods, in particular, health. CABE for example has undertaken detailed research into how the two interact. In a major publication from 2009, CABE [4] comments:
“Health inequalities are persistent, stubborn and difficult to change. But even some of the UK’s most pressing health challenges - such as lifestyle - induced obesity, mental health and wellbeing, childhood asthma and the ageing population - can be mitigated by the quality of our everyday environments. In other words, the considerate design of spaces and places can help to alleviate, and prevent, poor health or physical restrictions.
The commision on the Social Determinants of Health, in its summry of evidence for the Review of Health Inequities in England post - 2010 argues that:
The lived environment — urban settings, neighbourhoods, communities — are critical in that they can both promote or inhibit access to goods and services, social cohesion, physical and psychological well being and the natural environment. Health related outcomes as diverse as obesity, depression and injury through violence or accident can all be linked to the way we live. ”
[Buro Happold emphasis]
The report continues:
“Our environments do not always offer the opportunity to weave physical activity into our daily lives, it is not surprising that walking and physical activity levels generally are decreasing among children and adults.”
Examples provided in the report of where the planned environment can play a role in reducing health inequalities include:
• The means of getting to work, school, or to local services provide an important opening to weave everyday physical activity into our lives and to combat obesity levels.
• Reliance on car use - and environments focused on car use - are driving up noxious emission levels, resulting in some of the worst rates of asthma worldwide.
• Health complications in terms of both physical and cognitive decline become greater with age, and opportunities for both daily exercise and interaction with the community come about with improved accessibility around neighbourhoods and to local services.
Another important and linked aspect of an improved environment is the potential for inclusion and to enable disabled people to live more independent and active lives.
4 Future Health: Sustainable places for health and well being, CABE, 2009

8
SDC
Sust
aina
ble
Nei
ghbo
urho
od In
fras
truc
ture
: evi
denc
e ba
se
©Buro Happold
02 Opportunities
INFRA-STRUCTURE
Capital investment
SELECTION OF MEASURES
Buildings Low Links with local universities to undertake research projects eg involving data collection; or into behaviour change and demand reduction
Efficiency of building resource use / occupancy eg. using school buildings outside school hours, concept of ’16 hour school’
Community training centre on sustainability issues – energy conservation, waste management etc
Installation of low water usage appliances
Use of local planning powers to insist on sustainability (especially energy efficiency) measures to be part of all building renovations
Medium Energy efficiency upgrades, particularly improvement of thermal efficiency eg through insulating hot water tanks, lofts, cavity and solid walls, replacing boilers and heating controls, double or secondary glazing and draught-proofing. Can be undertaken on individual buildings or collectively at street scale
Install smart meters linked to stand alone displays; and potentially linked to intelligent building controls
Use of vacant properties: community groups to work with Local Authorities in relation to using / renovating / transforming vacant properties; refurbishment and utilisation
Aesthetic improvement of buildings, facade and curtilage to improve quality of space
Shared facilities eg. laundry, communal heating systems, shared secure bike park
Clustering of community buildings, shops etc to create community ‘centre’
Rainwater harvesting either through provision of individual rainwater harvesting tanks / water butts or through community based schemes
Green roofs added to existing and new buildings
High Demonstration energy projects eg. retrofitting of selected homes
Low and Zero Carbon energy systems (solar thermal, PV, wood pellet, GSHP)
2.1 Approach
This report presents ways in which infrastructure at community and neighbourhood scale can be reconfigured to support a more a sustainable way of living for residents and workers alike. There are a wide range of measures across the different infrastructure types that could be implemented which have differing costs and benefits in social, environmental and economic terms. A qualitative assessment has been made for each suggested reconfiguration measure using the analytical framework outlined in Section 2. The list of measures is not exhaustive but gives an indication of the broad range of interventions that are available.
2.2 Opportunities
The findings with regard to social, environmental and economic cost benefit analysis are shown in detail in the table presented in Appendix A and a summary is included here.

9
Opportunities
Buro Happold
Stage 2 ©Buro Happold
SDC
Sust
aina
ble
Nei
ghbo
urho
od In
fras
truc
ture
: evi
denc
e ba
se
INFRA-STRUCTURE
Capital investment
SELECTION OF MEASURES
Transport Low Community travel plan – local campaign as to what is available now in terms of alternative means of travel and how to use it. Need to get different stakeholders involved (eg bus companies, local authority, schools – combine with school travel plans)
Travel plan that coordinates logistics / freight locally using RFID technology
Communal taxis (as can be found in developing countries)
Car clubs / car sharing – can be supported by effective ICT
Provision in highway code to ensure drivers have duty of care towards vulnerable road users
Prescription of walking/cycling by NHS
Cycling provision scheme and awareness raising and training
Medium Cycling is encouraged by creating safe and convenient cycling environment ie. safe well maintained routes, well lit and shaded, appropriate signage, facilities at transport nodes (such as secure parking, lockers, showers); initiate cycle repair business and loan scheme; buses to have bike racks
Alternative fuel vehicles eg hydrogen fuel cell buses; hybrid buses
Electric charging points to encourage electric vehicles
Encourage walking through creating a comfortable pedestrian environment ie. wide paths, clean, well maintained (for push chairs, wheel chairs etc), safe, well lit and shaded, appropriate signage (including distances in walking times), clear links between key centres etc.
Dedicated grade separated cycle routes
Encourage bus use through eg. enhancement of waiting environment / bus stops, appropriate positioning of bus stops, links eg to secure bike parks, coordinated timetables, on display waiting information, ‘smart’ networks with information sent to PDAs, etc. by wifi
Creation of pedestrian areas within urban centres
High Bus rapid transit routes to city centre / major public transport nodes
Introduce park and ride schemes
INFRA-STRUCTURE
Capital investment
SELECTION OF MEASURES
Utilities: electricity, gas, water, telecoms
Low Liaison with local water company eg. on a campaign to fit ‘smart’ water meters on all buildings; provide water butts; supply low water fittings
Local biomass supply business to supply local or regional biomass boilers
Community utility / fuel purchasing ie. grouping together to bulk purchase utilities and hence benefit from lower cost
Medium High speed broad band
Local intranet – ‘community LAN’ – that could support information systems/sources to promote sustainable lifestyles e.g. - community level smart metering
- local re-use/swap shop services
- enabling car sharing/local service exchange
Replacement of hard paving with permeable paving to improve surface water drainage
High Non-potable water network
CHP / district heating – particularly linked to public sector buildings, leisure centres (swimming pools) etc
Community wind farm or community solar farm (financed under FITs)
Anaerobic digester used to fuel local CHP plant
Injection of biogas into gas grid from anaerobic digester plant fed by local food waste (less effective in carbon terms than using biogas in CHP)

10
Opportunities
SDC
Sust
aina
ble
Nei
ghbo
urho
od In
fras
truc
ture
: evi
denc
e ba
se
©Buro Happold
INFRA-STRUCTURE
Capital investment
SELECTION OF MEASURES
Blue infra-structure
Low Use of rivers / canals for freight / waste transport
Medium Softening river banks / replanting margins
Public footpaths and cycleways following riverbanks
Encourage leisure activities eg fishing, swimming, boating through improved access
High SUDS features combined with landscaping
INFRA-STRUCTURE
Capital investment
SELECTION OF MEASURES
Waste Low Local repair shops to lengthen life of white goods / reduce waste; could be linked to courses for training in maintenance
Local recycling incentives eg. local promotion of ‘freecycle’ website
Or materials exchange (eg Eastex, Suffolk); or furniture schemes
Local business directory eg for DIY giving details of products available and their ‘greenness’
Polluter pays principle: increase of council tax depending on quantity of domestic waste generated
Medium Rationalisation of recycling points and waste collection infrastructure
Businesses move to service provision model rather than simple sales of goods e.g. pay charge for food refrigeration rather than buy a fridge, capturing externality of whole life cost
High Anaerobic digestion plant fuelled by locally generated green / food waste
Community managed waste recycling facility
Green infrastructure /
public realm
Low Encourage private gardens to promote biodiversity
Food production in green spaces – public / private
‘Gardening club’ including courses, community activities – this would support upkeep of private gardens and local food production initiatives
Links to local agriculture / farmers eg. farmers markets; box delivery schemes; encouraging direct links between farms and schools / hospitals
Medium Improve green space using local skills / labour
Set up a tree and shrub nursery
Install activity circuits in parks
Linking habitats with wildlife corridors
Convert hard landscaping to green space; creation of micro green spaces
Improving the public realm – eg rationalise street lighting (solar powered); clustering community / retail areas, coordinate / improve street furniture, community art works, benches, planting etc
High Incorporate sports facilities in green areas

11
Opportunities
Buro Happold
Stage 2 ©Buro Happold
SDC
Sust
aina
ble
Nei
ghbo
urho
od In
fras
truc
ture
: evi
denc
e ba
se
2.3.2 Potential for realignment to impact on behaviour change
Infrastructure design and behaviour are linked, the one reinforcing the other. Ideally there is positive feed back between the two. However on balance infrastructure design has a greater influence on behaviour than vice versa and indeed can entrench ‘bad’ behaviour making it harder to change: a poor and irregular bus service reinforces the use of the car; someone wanting to do more recycling is put off by having insufficient space to segregate and store their waste.
It is therefore important that new infrastructure design reinforces ‘good’ behaviour which in turn requires an understanding of what underpins behaviour and what motivates behaviour change. Factors influencing behaviour that could be influenced by infrastructure delivery include:
• Convenience: how far do I have to walk to the bus stop?
• Pleasure: I like playing football in the park
• Capacity: I am unable to ride a bicycle so I take the car
• Incentive: I get paid extra for all the renewable energy I generate
There are also aspects of behaviour which have wider social and psychological implications such as social norms (all my neighbours have a car) and habit (I always drive to the out of town shopping centre on Sundays). There will be an interaction between infrastructure design and these factors but it will be less direct and more complex.
In reviewing the basket of potential reconfiguration measures, the table in Appendix A comments on their impact upon behaviour change where these apply. Important factors to consider are location, access, ‘pleasantness’, and, certainly in the longer term, training and information. It is important to make difficult but sustainable actions easy, to enable lifestyle change.
Some examples of retrofit measures that address particular factors affecting behaviour are summarised in Table 1:
There are many more examples of communities taking action to change the places in which they live. The growing Transition Town movement[5] – focused on issues of climate change and the threat of peak oil – has lead to a wide range of initiatives that take a holistic approach and are firmly based on local capacity and need.
The local authority clearly also has a significant role to play, whether it is in reacting to and supporting community led initiatives or actively undertaking change projects itself. The government’s Total Place[6] initiative whereby pilot areas have been looking to redesign processes to improve the efficiency of service delivery has seen a number of successful projects being rolled out that have both reduced cost and improved service delivery.
Local authorities have a particularly important role to play in the management and upgrade of the public realm including green and blue space. The appearance and ongoing management and maintenance of these areas have a profound effect on well being and hence on the success of an area as an integrated and functioning community. They also cross over into other forms of infrastructure such as transport, waste management, food production, surface water management etc.
Although unlikely to lead the retrofit / change process, the other key stakeholders are the utilities. It is important that they are fully engaged as they are key to effective delivery.
In summary, there are linkages between different infrastructure types but in order to exploit these effectively, an organisation or group of organisations needs to be in place that can take a project management role, engage with the necessary stakeholders, and use its local knowledge to lead and deliver infrastructure change projects. Such an organisation needs to be recognised and supported in terms of finance, governance and skills.
5 See www.transitiontowns.org
6 See www.localleadership.gov.uk/totalplace
2.3 Issues arising
The following section discusses some of the primary issues identified by the assessment namely, the impact of linkages, the interaction between infrastructure and behaviour change and the importance of ownership structures.
2.3.1 Linkages and their impact on costs and benefits
Analysis undertaken in Stage 1 of this study showed that on the whole local delivery of different types of infrastructure are separate with few linkages existing in practice. This situation has largely arisen due to the different institutional and regulatory frameworks surrounding each – electricity, gas, water, telecoms, transport and waste in particular. Although this brings efficiencies at larger national and regional scales and addresses the specifics of each in terms of physical characteristics, consumer protection and health and safety, it makes implementation of mixed upgrade projects at community scale complex and inefficient.
Here in Stage 2 we have reviewed a wide range of specific measures that could be implemented to improve sustainability at community scale. The measures have been grouped according to infrastructure type and could be delivered / implemented in this way. However it is clear that coordination of different projects and programmes related to different infrastructure types would bring benefits, particularly where they minimise disruption, promote resource efficiency and bring economies of scale.
The links and interdependencies need to be understood during the retrofit planning process in order to maximise opportunities. For example, recycling collection points need to be planned to make it ‘easy’ for people to recycle which may in turn have implications for pedestrian routes linking individual dwellings to the collection points, these routes needing to be secure, well lit and well maintained. The enhancement of the pedestrian routes needs to be coordinated with green space upkeep, with other types of non-vehicle transport routes such as cycle ways and to ensure appropriate links with other community centres. There is a need therefore to understand the details of the community and to combine this knowledge with a holistic approach to infrastructure upgrade. The question is who has this dual knowledge and is best placed to deliver change?
One answer could lie in the form of an appropriate community organisation that can act as an ‘integrator’ to plan and coordinate multiple activities in a systematic and efficient way. A clear example of this is Blacon Community Trust / Sustainable Blacon which is a community based organisation tackling a wide range of activities all aimed at improving the local infrastructure and amenity. They represent a ‘face’ for the community which can engage with all parties such as the Local Authority, utility suppliers, transport providers, developers, etc.

12
SDC
Sust
aina
ble
Nei
ghbo
urho
od In
fras
truc
ture
: evi
denc
e ba
se
©Buro Happold
Figure 2: Example of Infrastructure linkages that if appropriately exploited could bring
real benefits and cost savings
13
Opportunities
Buro Happold
©Buro Happold
SDC
Sust
aina
ble
Nei
ghbo
urho
od In
fras
truc
ture
: evi
denc
e ba
se
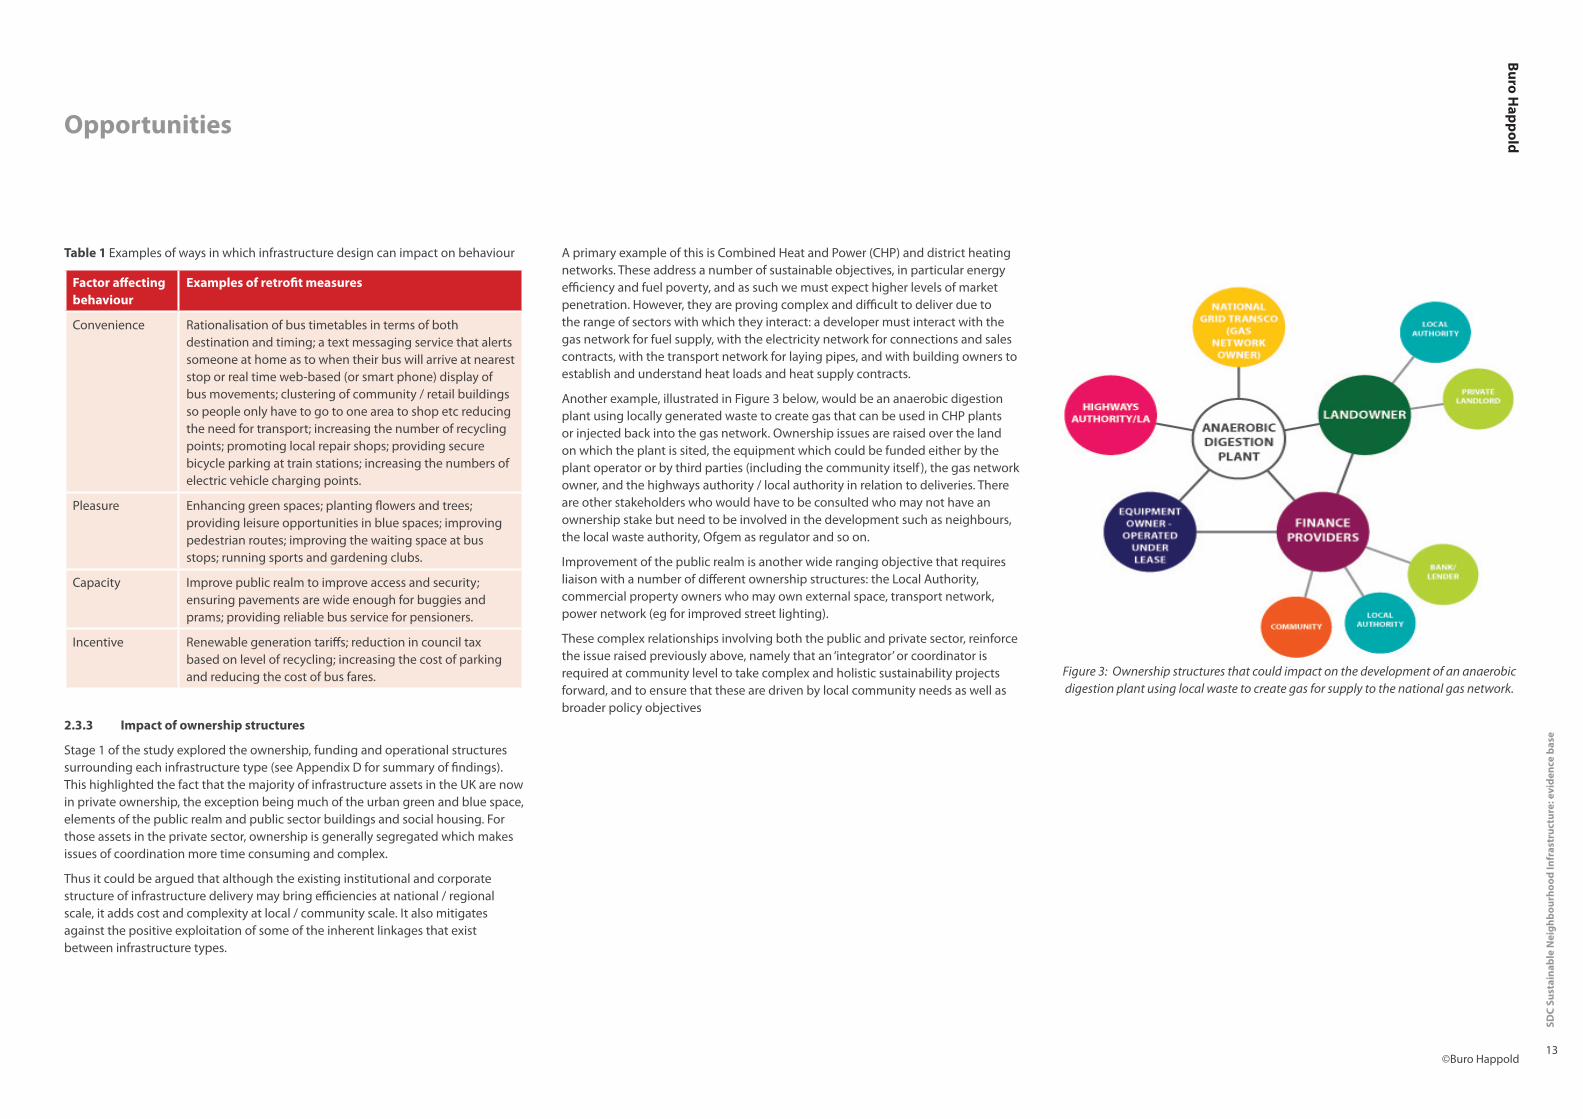
Figure 3: Ownership structures that could impact on the development of an anaerobic digestion plant using local waste to create gas for supply to the national gas network.
A primary example of this is Combined Heat and Power (CHP) and district heating networks. These address a number of sustainable objectives, in particular energy efficiency and fuel poverty, and as such we must expect higher levels of market penetration. However, they are proving complex and difficult to deliver due to the range of sectors with which they interact: a developer must interact with the gas network for fuel supply, with the electricity network for connections and sales contracts, with the transport network for laying pipes, and with building owners to establish and understand heat loads and heat supply contracts.
Another example, illustrated in Figure 3 below, would be an anaerobic digestion plant using locally generated waste to create gas that can be used in CHP plants or injected back into the gas network. Ownership issues are raised over the land on which the plant is sited, the equipment which could be funded either by the plant operator or by third parties (including the community itself ), the gas network owner, and the highways authority / local authority in relation to deliveries. There are other stakeholders who would have to be consulted who may not have an ownership stake but need to be involved in the development such as neighbours, the local waste authority, Ofgem as regulator and so on.
Improvement of the public realm is another wide ranging objective that requires liaison with a number of different ownership structures: the Local Authority, commercial property owners who may own external space, transport network, power network (eg for improved street lighting).
These complex relationships involving both the public and private sector, reinforce the issue raised previously above, namely that an ‘integrator’ or coordinator is required at community level to take complex and holistic sustainability projects forward, and to ensure that these are driven by local community needs as well as broader policy objectives
Table 1 Examples of ways in which infrastructure design can impact on behaviour
Factor affecting behaviour
Examples of retrofit measures
Convenience Rationalisation of bus timetables in terms of both destination and timing; a text messaging service that alerts someone at home as to when their bus will arrive at nearest stop or real time web-based (or smart phone) display of bus movements; clustering of community / retail buildings so people only have to go to one area to shop etc reducing the need for transport; increasing the number of recycling points; promoting local repair shops; providing secure bicycle parking at train stations; increasing the numbers of electric vehicle charging points.
Pleasure Enhancing green spaces; planting flowers and trees; providing leisure opportunities in blue spaces; improving pedestrian routes; improving the waiting space at bus stops; running sports and gardening clubs.
Capacity Improve public realm to improve access and security; ensuring pavements are wide enough for buggies and prams; providing reliable bus service for pensioners.
Incentive Renewable generation tariffs; reduction in council tax based on level of recycling; increasing the cost of parking and reducing the cost of bus fares.
2.3.3 Impact of ownership structures
Stage 1 of the study explored the ownership, funding and operational structures surrounding each infrastructure type (see Appendix D for summary of findings). This highlighted the fact that the majority of infrastructure assets in the UK are now in private ownership, the exception being much of the urban green and blue space, elements of the public realm and public sector buildings and social housing. For those assets in the private sector, ownership is generally segregated which makes issues of coordination more time consuming and complex.
Thus it could be argued that although the existing institutional and corporate structure of infrastructure delivery may bring efficiencies at national / regional scale, it adds cost and complexity at local / community scale. It also mitigates against the positive exploitation of some of the inherent linkages that exist between infrastructure types.

14
SDC
Sust
aina
ble
Nei
ghbo
urho
od In
fras
truc
ture
: evi
denc
e ba
se
©Buro Happold
03 Cost
Figure 4: Chart plotting various retrofit measures in relation to capital investment and potential revenue return. Each bubble represents a different measure, the size of the bubble indicating the range of costs / revenues that could attach to it. Dotted line implies measure has revenue generating potential but not necessarily for local community
3.1 Approach
In seeking to understand potential funding options for the different retrofit measures outlined in Section 2, a high level review of the capital cost of installation has been mapped against the potential for revenue generation.
In the table in Appendix A we have ascribed costs and revenues to each of the basket of measures proposed. Measures are graded according to a broad scale of:
Capital cost (where this excludes the costs of project development / management and costs of disruption – see discussion on this below):
Low (< £10k), Medium (>£10k, <£100k), High (> £100k)
Revenue (ie. the potential to generate revenue locally for / within the community):
None, Low, Medium, High
The costs and revenues have then been plotted on the adjacent chart (see Fig 4).
3.2 Findings
In the public mind, the term ‘infrastructure’ tends to be associated with large capital intensive projects such as roads, railways and power stations. Over recent decades the financing of such projects has been transferred from the public to the private sector either through the wholesale privatisation of an industry such as the electricity industry, or through the use of funding mechanisms such as the Private Finance Initiative which has supported much new transport, health and education infrastructure.
This report is concerned with infrastructure at community scale. It takes a broad definition of the term and is concerned with resource flows and the delivery of services at local level. As highlighted in Section 2, there are a wide range of measures that could be introduced to achieve more sustainable outcomes. The exercise undertaken in this Section shows that these come with an equally wide range of costs and potential revenues.
The revenue that could be generated locally by a particular measure is driven by market structures that place value – or not – on the outputs associated with that measure. For example, improving a public walk way between a residential area and a retail area might encourage people to walk thereby reducing local traffic congestion, improving air quality and improving health. It is difficult however to put a financial value on any of these ‘goods’ and hence such an improvement is funded by the public purse based on wider societal benefits. In contrast, installation of PV panels can generate savings and hence a financial payback directly related to the investment[7].
7 The government’s Feed in Tariff for small scale renewable generation introduced in April 2010 reduces payback periods even further.

15
Cost
Buro Happold
©Buro Happold
SDC
Sust
aina
ble
Nei
ghbo
urho
od In
fras
truc
ture
: evi
denc
e ba
se
Some more innovative funding methods could be developed whereby either public sector funding is used to leverage private sector funding – for example where the public sector invests in early stage project development and hence derisks a project (as is being advocated for district heating schemes); or whereby returns generated by a project such as a wind farm are reinvested in other sustainable upgrades such as a playground or home energy efficiency measure.
An example which is being pioneered by the London Development Agency is street wide energy upgrades. It is recognised that if a group of houses were upgraded as part of a single contract there would be economies of scale as well as possibly a minimisation of, or at least coordinated approach to, disruption. The programme, known as RE:FIT (formally known as the Building Energy Efficiency Programme, BEEP) seeks to “accelerate the retrofit of buildings through an innovative commercial model designed to leverage market expertise in the operational, technological and financial aspects of the energy market. RE:FIT is a “ready-to-use and cost neutral procurement vehicle that allows the public sector to retrofit buildings with energy savings products and measures.” Although this approach is focused solely on energy, it is a model that could as well apply to retrofit of more efficient water appliances, telecoms upgrades, local waste facilities.
Another financing scheme uses an approach whereby energy savings are used to finance the costs of upfront capital investment required to install energy efficient equipment. This scheme was referred to as Pay As You Save (PAYS) by the previous government and is included under the Coalition government’s ‘Green Deal’.
The analysis illustrated is a high level assessment but further quantitative work could usefully be done to categorise sustainable retrofit measures in this way. This would help to understand which measures are more suitable for support and which can be left to market forces. Such work should also factor in the ‘soft’ costs of project development and take into account whole life costs / value in order to draw up a complete picture that complements the social, environmental and economic analysis referred to in Section 2. Typically this work would be done on a project by project basis (e.g. feasibility study for a community heating scheme) but the wide ranging nature of the interventions covered by this study lend themselves to a broader analysis which prioritises certain options for development. Such an analysis would reflect local priorities / issues and so may not be suitable for a top down ‘one size fits all’ approach. Selection of preferred options is also likely to require value judgements as comparing a wide range of different outcomes objectively can be difficult (e.g. are reductions in CO2 emissions more important than reducing fuel poverty).
Plotting revenue and capital cost as shown in Fig 4 gives a broad indication of how different measures might be financed. In simple terms, those that generate an output that is valued by the market – such as electricity, gas, or a particular service for which there is demand – have potential to attract private finance while those that do not – such as enhanced biodiversity, a more pleasant place to walk, greater security – will require alternative funding models.
As would be expected there is a wide range of both costs and revenues depending on the nature of the intervention, although arguably there are more in the low revenue half than the high revenue half of the chart. This has implications for the ability of community retrofit projects to leverage private finance and points to a need for alternative delivery mechanisms.
A major issue that is not explored here is the cost involved in developing and setting up a project (transaction costs) or the cost associated with the disruption caused by installation – both of which can be considerable. These costs are much harder to pin down. It is straightforward to provide a cost per meter of pipe laid in new or existing streets that include some civil engineering and disruption costs. Similarly design and project management costs, which vary by type of project, can be estimated as a % of project value (typically in the range of 5-20% depending on project scale and complexity). However, estimating the time taken by, say a community group, to engage with stakeholders and suppliers and with the community and local authority is more difficult. Assigning a cost to this expenditure of effort and time is a further challenge and may only be relevant at a macroeconomic scale (e.g. estimates of contribution of Gross Value Added (GVA). Development costs tend to be ‘hidden’ costs which act as a significant barrier to project development.
Another issue requiring further study is capital - as opposed to operational value. There may be capital value attached to the effective upgrade of an asset but - quantifying that value and understanding to which party it might accrue can be complex. Private developers involved in urban regeneration are able to capture value through increased property values. However, in a community of existing dwellings with mixed ownership this direct link with investment is lost.
The CABE report on the valuation of public parks, Making the Invisible Visible[8], finds that within the public sector, historic accounting rules have contributed to the undervaluation of parks on local authority balance sheets. Many have been acquired for minimal cost and appear at a value of £1. As such they have not attracted the capital investment that other, more obviously ‘valuable’ assets have.
8 Making the invisible visible: the real value of park assets, CABE, 2009

16
SDC
Sust
aina
ble
Nei
ghbo
urho
od In
fras
truc
ture
: evi
denc
e ba
se
©Buro Happold
04 Reconfiguration of study areas
Table 2 summary of each area and the factors that differentiate them.
Blacon Southville Armley
D Low density, 1960s housing, mostly residential terraces with reasonable sized gardens, a lot of green space both public and private.
Medium density, mostly Victorian residential terraces plus a tower block. Relatively big gardens but little public green space except around tower block.
High density back to back pre 1920s terraces, very little green space either public or private. Some semi industrial units and a primary school.
G About 2 miles from Chester city centre, surrounded by agricultural land. A disused railway runs across the south of the site.
Just south of the New Cut of the River Avon which separates the area from Bristol city centre (approx 1 mile away). Local retail / entertainment high street to the south west of the site.
Railway and the River Aire pass to the north of site restricting access northwards; large park with sports facilities to west. High street to south west separated by network of large roads.
S Relatively deprived area in need of regeneration. Aging population, little local employment.
Apart from the tower block, relatively affluent ‘up and coming area’ of young families and students.
Relatively deprived area in need of regeneration.
I Strong community group in existence with strong links to local authority and which has initiated a number of schemes aimed at improving sustainability of the area.
Informal community group in the form of Southville Community Development Association located at the Southville Centre which acts as a hub for local activities. Bristol’s only Green councillor.
No community group apparent. Area is subject of Area Action Plan (AAP) currently out for consultation by Leeds City Council.
O Redevelopment of Blacon Parade is a key opportunity.
None in particular identified.
Nearby Sports Centre is being redeveloped; AAP consultation presents opportunities.
Institutional framework: this factor takes into account the level of engagement at local authority and community level. An area with an existing community identity and an active community group that is already engaged with the local authority will be in a stronger position to introduce more challenging changes than others. As with social indicators, this is an aspect that will change over time and feeds into a programmed approach, with associated capacity building.
Opportunity: as with social indicators and the institutional framework listed above, this factor has to do with timing. For example the existence of a redevelopment plan in an area offers opportunity for considering change now that might not be appropriate for an area where such plans are not yet in place. This is a relatively short term factor and needs constant reassessment.
4.2 Overview of study areas
The three study areas selected are:
• Blacon, Chester
• Southville, Bristol
• Armley, Leeds
The mapping of existing infrastructure in each of these areas is included in Appendix C.
Based on the above list of differentiating factors, a summary of the three areas is given in Table 2.
4.1 Approach
The purpose of this section is to explore:
• how existing infrastructure at neighbourhood scale can be reconfigured to achieve more sustainable outcomes; and
• the impact that local differentiating factors have on the type of measures that might best be implemented.
Section 2 identified a ‘basket’ of measures suitable for implementation at community scale and some of the costs and benefits associated with these. In this Section, the applicability of these measures to each area is reviewed in the light of its existing infrastructure.
In reviewing the differentiating factors that would have an impact on measures selected it became apparent that ‘softer’ social issues would have as much of an impact on what could be realistically changed as actual physical infrastructure. This introduces the concept of timing and a programme for change rather than a one-off alteration that would transform a community from being unsustainable to being sustainable.
On this basis, a total of 5 differentiators have been identified and used for the assessment. These are summarised as follows:
Density: dwelling density, building type (age / construction) and building mix (residential, commercial, industrial, community etc). This factor is linked to the proportion of green space and hard surfaces in the area. It is clearly a physical factor with associated constraints which in theory can be changed but only at great cost and over a long timeframe. Density also introduces opportunities, for example, dense areas have the potential for sharing facilities at reduced unit cost.
Geography: location and links to the surrounding area / neighbouring infrastructure (eg proximity to water features, to parks, to the city centre, to rural areas etc). Again this is a physical factor presenting both constraints and opportunities to a neighbourhood. It has most impact on choices regarding transport links and accessibility.
Social indicators: demographics and deprivation indices. The makeup of a local population and its level of deprivation or affluence introduces need which should be taken into account when considering infrastructure upgrades. For example, measures that can generate income and are linked to social enterprise are more of a priority in an area with high levels of unemployment. This is a factor that could change over time more rapidly than that of building density. As such it would feed into a programmed approach to improving sustainability.
D
G
S
I
O

17
Reconfiguration of study areas
Buro Happold
©Buro Happold
SDC
Sust
aina
ble
Nei
ghbo
urho
od In
fras
truc
ture
: evi
denc
e ba
se
Figure 6: Typical dwelling in BlaconFigure 5: Aerial view of Blacon
4.3 Blacon, Chester
Blacon is a 1960s extension of Chester. It comprises relatively low dense terraced housing featuring a fair amount of green space - including trees - both in the public realm and in private gardens.
A key feature both in terms of this study and the development of the area as a whole is the existence of a strong community group in the form of Blacon Community Trust and the associated Sustainable Blacon Ltd. These organisations have already taken steps towards capacity building in the area and are actively working on plans and proposals towards making the community more sustainable.
The area is relatively deprived making the development of social enterprises and hence of local employment opportunities a key priority. The deprivation also puts a focus on cost saving and addressing fuel poverty issues, arguably over and above environmental concerns. A third issue to consider is the demographics and generally aging population with young people moving away and hence a change in priority from schools and youth work to support for elderly people.
Based on the above and in conjunction with the sustainability objectives outlined in Appendix B, Table 3 suggests a ‘Top 10’ of measures suitable for the area. These are illustrated on the map on page 19.
4.3.1 Summary
The strong presence of a community group in the area is a key factor driving the ‘Top 10’ initiatives suggested. Ideas already under development should be encouraged and supported as they are already embedded within the community. These include a local CHP / district heating system linked to the redevelopment of the shopping parade and a community centre promoting energy efficiency and other sustainable measures through training and skills development.
The other issue in the area is its social demographics. There is a relatively high level of social deprivation thus projects which address fuel poverty and promote local social enterprise and job creation are important. For example, a local repair shop and taking over contracts from the local authority for the upgrade and maintenance of public space.
The relatively low density of the area and higher proportion of green space – be it in gardens or in the public realm – mean that there is scope for upgrading this, and space for gardening and rainwater harvesting.

18
Reconfiguration of study areas
SDC
Sust
aina
ble
Nei
ghbo
urho
od In
fras
truc
ture
: evi
denc
e ba
se
©Buro Happold
Proposed measure Agreed sustainability outcome(s) supported by the measure
Role played by differentials Comments / issues that could affect delivery
Env’
t
Soci
al
Econ
Gov
F Local repair shops which re-vitalise under used or empty properties
O
S
Coincides with redevelopment of Blacon Parade and potential for new retail outlets.
Addresses need for local employment.
Local repair shops are a good way to reduce purchasing of surplus goods and reduce waste. Some kick start involvement may be required eg in securing lease of premises, helping with business plans for lessors, training etc
The Local Authority may be able to provide low cost or rent free leases - the use of buildings can stop problems of urban decay spreading from derelict sites.
G Local recycling initiatives – furniture scheme
I This is an initiative that is already supported by Sustainable Blacon.
Addresses need for local employment.
Furniture schemes have a good track record in the UK. Many are social enterprises providing both employment and low cost furniture to lower income households. Some kick start involvement may be required eg in securing lease of premises, helping with business plans for lessors, training etc
The Local Authority may be able to provide low cost or rent free leases - the use of buildings can stop problems of urban decay spreading from derelict sites.
H Energy efficiency upgrades, particularly improvement of thermal efficiency. Measures could include: - insulating hot water tanks - loft insulation to at least 400mm - cavity and solid wall insulation (external/internal depending on aesthetic/conservation drivers) - replacing boilers - timed and zoned temperature regulated heating controls - double or secondary glazing - draught-proofing
Potentially undertaken on street wide basis, using a neighbourhood wide procurement model to reduce costs.
Opportunities to promote competition between neighbours/streets/other neighbourhoods through information sharing.
D
S
Most buildings are post war and so may have cavity walls which provide opportunities for low cost and fast payback improvements.
Fuel poverty is an issue of increased relevance due to the economic status of the area.
The benefits of undertaking improvements on a street wide basis in terms of cost efficiency could be undermined by difficulties of coordination and issues of local disruption. However, many of the dwellings are similar, opportunities to assuage fears through the use of an ‘exemplar retrofit’ as a marketing suite (see also under point c above - demonstration homes).
Commercial models of street wide upgrades are still under development and long lead in times may restrict ‘first movers’ who could use proposed ‘Pay as You Save’ approach as set out in DECC’s Household Energy Management Strategy.
Table 3 ‘Top 10’ retrofit measures for Blacon, taking into consideration sustainability outcomes and local differentiating factors (in no particular order).
Proposed measure Agreed sustainability outcome(s) supported by the measure
Role played by differentials Comments / issues that could affect delivery
Env’
t
Soci
al
Econ
Gov
A Installation of Low and Zero Carbon energy systems at community scale (solar thermal collectors for domestic hot water, photovoltaic (PV) panels, wood pellet boilers, ground source heat pumps, combined heat and power (CHP)).
O
I
D
The redevelopment of Blacon Parade offers an opportunity to introduce new energy supply strategy / infrastructure.
Existing support from Sustainable Blacon to provide a focus and leadership for the scheme.
Building grouping and potential heat loads suitable for district heating network.
The project is reasonably well developed with preliminary feasibility studies having been undertaken. The energy strategy needs to be coordinated with the rest of the redevelopment as the masterplan progresses. Issues to resolve will be ongoing governance / management of the energy centre and maximisation of economic return for the community.
B Community centre focused on energy saving including training, information provision regarding energy efficiency, ‘energy doctors’ etc. Can combine with group utility purchasing to reduce cost.
I
O
S
Sustainable Blacon has already identified this as a valuable scheme.
Space available on Blacon Parade.
Blacon is a relatively low income area so cost saving to reduce fuel poverty is important.
This is a relatively low cost measure in terms of capital, however requires on going management and promotion. Unlikely to generate significant revenue hence will require ongoing financial support for staffing etc.
Could provide focal point for development of delivery and management structures.
C Demonstration homes project - this is linked to upgrade of wider building stock to provide better levels of energy efficiency, reduce energy bills and cut carbon emissions.
I
S
This is an initiative already proposed and supported by Sustainable Blacon; government is supporting demonstration schemes.
The use of social housing to catalyse this work could offer a way of bulk purchasing improvements for privately owned building stock in the area.
This is a good opportunity to learn about retrofit and explore what issues can be rolled out on a wider scale. It benefits from existing government support and may not necessarily be replicable elsewhere, however lessons learned and the capacity built in the local area could be useful in further upgrade works.
D Tree and shrub nursery; gardening club etc
I
D
This is an initiative already proposed and supported by Sustainable Blacon.
There is a lot of green space in the area including private gardens so real potential for people to get involved and be motivated.
This is a relatively low cost measure in terms of capital. It also has the potential to self fund to a degree through the sale of plants and shrubs, particularly if the scheme can be staffed by community volunteers.
E Use local skills and labour to improve green space.
Public realm improvements including greening of streets by tree planting or other soft landscaping. Provision of ‘streets not roads’ giving pedestrians priority over vehicle traffic and improved environment for walking and playing outside.
S Low income area – scheme could address need for local employment.
This requires negotiation with the Local Authority. Could be contractual issues if the LA is undertaking green space maintenance work using existing contractors. However, it is a good model that if successful could be replicated elsewhere.
S

19
Reconfiguration of study areas
Buro Happold
©Buro Happold July 2010-07-05
SDC
Sust
aina
ble
Nei
ghbo
urho
od In
fras
truc
ture
: evi
denc
e ba
se
Proposed measure Agreed sustainability outcome(s) supported by the measure
Role played by differentials Comments / issues that could affect delivery
Env’
t
Soci
al
Econ
Gov
I Community travel plan which promotes access to and knowledge of existing transport – public, private, freight, cycle, walking.
Specific plans could be developed for e.g. schools, local businesses etc.
More general plans showing options available could be provided to local residents. The aim of encouraging shift away from private car use can reduce congestion, improve public health by increasing walking/cycling and reduce air pollution.
S
G
Low income area, public transport important.
There is a good cycle path along the disused railway to the south of the site which is generally well used.
Distance form City Centre
Lack of coordination of bus timetables noted as issues of concern locally
Good quality cycle lane provision requires a change in mindset from the local highways authority. Cycle lanes should be given the same level of priority as planning roads, with grade separated routes, signalised crossings and routes which do not end abruptly.
Co-ordinated bus timetables between local operators can be difficult to facilitate due to de-regulation but frequency and reliability are key drivers to encourage bus usage. Some form of information system showing bus ‘wait’ durations could be provided but such systems are expensive. Lower cost measures might include ‘text alerts’ to mobile phones when specific bus services are approaching.
J Promotion of rainwater harvesting for non-potable uses
D The relatively low density of the area means that there is sufficient space for water butts etc; houses have reasonable sized gardens so potential for lots of watering to be required.
Some water companies have already promoted domestic water butts. There is an issue of ongoing use, maintenance and management but this should be relatively straightforward and undertaken by residents. Main issue would be to identify suitable body to initiate an awareness campaign and push the project forward.
Some form of incentivisation, possibly linked to metering would improve uptake. A ‘stick’ approach would involve higher charges for water use above a certain level, whilst a ‘carrot’ approach might be more palatable to residents, and involve some kind of reward, such as a discount if usage is below a given level.
O

20
SDC
Sust
aina
ble
Nei
ghbo
urho
od In
fras
truc
ture
: evi
denc
e ba
se
©Buro Happold
Electrical HV
Electrical LV
Gas LP
Gas MP
PotableWater
SewageWater
SewageMan holes
SurfaceWater
Hospital
Church
Bus Stop
Car Parking
Blacon Map
BT Cabinet
Surface WaterMan holes
Sub Station(Electrical)
BUS
BUS
BUS
P
P
P
Playground
Demonstration Homes
School
Green Space(Public & Private)
Water Butts
Gardening Club
CommunityCentre
Repair Shops BiomassBoilers
FurnitureScheme
Solar PV
Community Travel Plan
Blacon Parade
Running track
Ground SourceHeat Pump
Ground SourceHeat Pump
BT Phone(Overhead Cables)

21
Reconfiguration of study areas
Buro Happold
©Buro Happold
SDC
Sust
aina
ble
Nei
ghbo
urho
od In
fras
truc
ture
: evi
denc
e ba
se
Figure 8: Typical dwellings - terraced houses and tower block
Figure 7: Aerial view of Southville, Bristol
4.4 Southville, Bristol
Southville is an inner city suburb of Bristol situated on the south bank of the River Avon. Most of the houses were built in the late 19th and early 20th centuries either for workers in the coal mining industry or in the tobacco factories. They consist of rows of two storey terraces with on street parking and reasonable sized back to back gardens. The area was bombed in the Second World War, with a large number of streets losing one or more houses. It is likely that the tower block to the north west of the study area (Little Cross House) was one such ‘infill’.
The area has been gentrified since the early 1980s, accompanying the national rise in house prices. New bars and restaurants and the nationally renowned Tobacco Factory theatre attract visitors to the area, while the Southville Community Centre and Southville School have become the central features of a vibrant community atmosphere.
Based on the above and in conjunction with the sustainability objectives outlined in Appendix B, Table 4 suggests a ‘Top 10’ of measures suitable for the area. These are illustrated on the map on page 23.
4.4.1 Summary
The building density of Southville suggests a number of measures that could be suitable for the area. In particular the presence of the tower block introduces the potential for community low carbon heating. Other initiatives associated with this site could be local allotments on ground next to the block, a dedicated bike park and better links to shops through improved bus timetables.
The rest of the area is more affluent and could support investment in other building integrated low carbon technologies such as solar PV, taking advantage of south facing roofs and the Feed in Tariff. There is likely to be considerable commuting out of the area hence introduction of high speed broadband to facilitate home working could be an advantage.
The geography of the area – separated as it is from the city centre by the River Avon – suggests improved transport links to the north such as an additional footbridge over the river, could be a valuable enhancement.

22
Reconfiguration of study areas
SDC
Sust
aina
ble
Nei
ghbo
urho
od In
fras
truc
ture
: evi
denc
e ba
se
©Buro Happold
Proposed measure Agreed sustainability outcome(s) supported by the measure
Role played by differentials Issues that could affect delivery
Env’
t
Soci
al
Econ
Gov
A Energy efficiency upgrades, particularly improvement of thermal efficiency. Measures could include: - insulating hot water tanks - loft insulation to at least 400mm - cavity and solid wall insulation (external/internal depending on aesthetic/conservation drivers) - replacing boilers - timed and zoned temperature regulated heating controls - double or secondary glazing - draught-proofing
Potentially undertaken on street wide basis, using a neighbourhood wide procurement model to reduce costs.
Opportunities to promote competition between neighbours/streets/other neighbourhoods through information sharing.
D
S
Victorian terraces, homogenous buildings could provide an opportunity for upgrade on a collective street basis.
Generally a more affluent area than the other sites - potential for more self funded upgrades given positive paybacks and sufficient information on costs, disruption and risks.
Most buildings will be solid wall making cost of insulation higher but other measures could usefully be undertaken.
The benefits of undertaking improvements on a street wide basis in terms of cost efficiency could be undermined by difficulties of coordination and issues of local disruption. However, many of the dwellings are very similar, opportunities to assuage fears through the use of an ‘exemplar retrofit’ as a marketing suite.
Commercial models of street wide upgrades are still under development and long lead in times may restrict ‘first movers’ who could use proposed ‘Pay as You Save’ approach as set out in DECC’s Household Energy Management Strategy.
Street wide schemes could support development of local delivery and management structures.
B Installation of Low and Zero Carbon energy systems (solar thermal collectors for domestic hot water, photovoltaic (PV) panels, wood pellet boilers, ground source heat pumps, combined heat and power (CHP)).
D
D
S
Existence of tower block (Littlecross House) in the area provides an opportunity for community biomass or CHP heating system. This could act as an anchor load for a wider scheme, though in general the density may be too low to support this within the current economic framework for CHP/district heating. The renewable heat incentive may make this more viable.
South facing roofs on terraced housing provide opportunity for solar thermal / PV.
Relatively affluent and well educated area suggests may be more existing appetite for purchasing and installing LZC equipment.
For the tower block, there would be a need to identify a suitable ‘agent for change’ to take on the development of the scheme. There would also be the issue of ongoing management / governance - eg. whether it was run by a tenants’ association or private ESCo or the Local Authority.
For solar thermal Renewable Heat Incentive likely to reduce payback times; similarly Feed in Tariff for solar PV.
Development of a community scheme could support development of local delivery and management structures.
Proposed measure Agreed sustainability outcome(s) supported by the measure
Role played by differentials Issues that could affect delivery
Env’
t
Soci
al
Econ
Gov
C Provision of high speed broadband to all dwellings, which replaces the ‘copper loop’ from telephone exchange to domestic dwellings could facilitate high quality video-conferencing, cloud computing and high speed file transfer, enabling residents with office jobs to work at least part time from home, travelling to work as required.
S
O
Commuting to work is likely to be a major reason for travel to and from the area, and in particular private car usage.
Digging up streets to install new communications infrastructure could provide an opportunity to renew or install other infrastructure, such as district heating.
This could be funded on a commercial basis in certain areas, provided finance could be raised against the future revenues. However, this approach is high risk and may take a long time to generate any positive cash flow. To ensure widespread coverage the current policy approach is to regulate this requirement, and with an allowable increase in customer’s bills to cross subsidise the cost.
Take up of high speed broadband may be sufficient to give economic returns on investment in high speed networks, though the precedent of cable television shows that take up is often lower than expected, and costs often higher than planned.
D Rainwater harvesting - water butts for domestic properties
D
D
Reasonable sized gardens so likely to have requirement for watering; also size of gardens suggests sufficient space for water butts.
The relatively large roof area versus the density also makes this a good option for a simple decentralised approach using low technology systems.
Some water companies have already promoted domestic water butts. There is an issue of ongoing use, maintenance and management but this should be relatively straightforward and undertaken by residents. Main issue would be to identify suitable body to initiate an awareness campaign and push the project forward.
Some form of incentivisation, possibly linked to metering would improve uptake. A ‘stick’ approach would involve higher charges for water use above a certain level, whilst a ‘carrot’ approach might be more palatable to residents, and involved some kind of reward, such as a discount off the bill if usage is below a given level.
Table 4 ‘Top 10’ retrofit measures for Southville, taking into consideration sustainability outcomes and local differentiating factors (in no particular order).

23
Reconfiguration of study areas
Buro Happold
©Buro Happold
SDC
Sust
aina
ble
Nei
ghbo
urho
od In
fras
truc
ture
: evi
denc
e ba
se
Proposed measure Agreed sustainability outcome(s) supported by the measure
Role played by differentials Issues that could affect delivery
Env’
t
Soci
al
Econ
Gov
H Install covered, safe communal bike park for tower block residents.
D
G
The tower block has a fair amount of space around it some of which could be usefully put aside for a secure bike park.
The nearest shops are to the south west of the site and could be accessed easily by bike.
Bike parks have successfully been installed in some estates in London. They need to be funded by the local council.
Issues arise over sharing costs with owner occupiers in the block. Also best if park is requested by residents - possible that not considered a priority for Little Cross House due to higher proportion of elderly residents?
Secure bike storage is important if residents are to rely on cycling as a regular mode of transport. In flats this can be difficult as there is limited space within the flats, as well as the logistical difficulties in transporting bikes in small lifts.
I Use some of the green space around the tower block for allotments for residents
D
S
The tower block has sufficient space around it to provide a number of allotments.
Demographics of tower block residents (mostly elderly or families) suggests access to nearby allotments for food growing could encourage local activity and be good for health.
Land ownership could be a barrier as the allotments could preclude future use of the site for housing redevelopment.
Funding for the landscaping works required, including sheds, fencing and waste /deliveries storage, would be required.
J Community travel plan which promotes access to and knowledge of existing transport – public, private, freight, cycle, walking.
Specific plans could be developed for e.g. schools, local businesses etc.
More general plans showing options available could be provided to local residents. The aim of encouraging shift away from private car use can reduce congestion, improve public health by increasing walking/cycling and reduce air pollution.
O
O
There is an opportunity to improve the existing bus network and links to the city centre as it is currently not sufficiently extensive according to some local residents.
Could build on Bristol Community Transport which has a specific route through the Southville area linking those in need to specific points such as Asda for shopping.
Good quality cycle lane provision requires a change in mindset from the local highways authority. Cycle lanes should be given the same level of priority as planning roads, with grade separated routes, signalised crossings and routes which do not end abruptly.
Co-ordinated bus timetables between local operators can be difficult to facilitate due to de-regulation but frequency and reliability are key drivers to encourage bus usage. Some form of information system showing bus ‘wait’ durations could be provided but such systems are expensive. Lower cost measures might include ‘text alerts’ to mobile phones when specific bus services are approaching.
Proposed measure Agreed sustainability outcome(s) supported by the measure
Role played by differentials Issues that could affect deliveryEn
v’t
Soci
al
Econ
Gov
E Encourage better use of private gardens to promote biodiversity and food production. Measures might include: - tree and shrub nursery - gardening club - composting bins / collection - planting of indigenous flowers and shrubs to form a wildlife area.
Improve public realm through: - Introducing micro green spaces around streets - Planting trees where constraints allow - Reclaiming underused areas of public realm for planting schemes - Developing ‘green corridors’ which link sites of ecological value, for example using private gardens as corridors
D
I
I
Southville is relatively dense with few green spaces in the public realm. Private gardens are common and of a reasonable size.
Existing community groups eg Southville Community centre and Riverside Garden Centre to provide support.
Bristol City Council is already supporting a tree planting scheme, TreeBristol. Under the scheme, 25 trees have been planted outside Little Cross House (tower block within study area).
This is already happening to a degree in the area with the Southville Community Centre website detailing a number of ‘green’ initiatives. Therefore limited problems with delivery although ongoing promotion and awareness raising required.
F Local repair shops; Local recycling initiatives – furniture scheme
O Main parade of shops in North Street SW of area has issues over vacant lots so could be somewhere for such repair shops to operate
This requires negotiation with the Local Authority. Could be contractual issues if the LA is undertaking work using existing contractors. However, it is a good model that if successful could be replicated elsewhere.
G Public footpaths and cycleways following riverbanks; improvement of number / location of river crossings to facilitate access to city centre
G Proximity to New Cut of the River Avon; this acts as a barrier to access to the city centre
This requires relatively costly intervention both in terms of development time / planning, community liaison and capital. It should be linked to a comprehensive travel plan to ensure people were aware of the route and how it linked to other transport hubs / modes.
Appetite for such a link could be gauged as part of the development of a community travel plan.

24
SDC
Sust
aina
ble
Nei
ghbo
urho
od In
fras
truc
ture
: evi
denc
e ba
se
©Buro Happold
CHP / DistrictHeating
Ground SourceHeat Pump
The SouthvilleCentre
Water Butts
Repair shop in Highstreet
BT Phone(Overhead Cables)
BT Cabinet
Electrical
Gas
Electrical 11Kv
Water Butts
Southville Map
Sub Station(Electrical)
Bus Stop
Car Parking
BUS
P
Green Space(Public & Private)
BUS
BUS
BUS
BUS
BUS
P
PotableWater
High rise �ats
Gardening Club
Communal SecureBike Storage
Bridge over waterways
Allotments
Riverside GardeningCentre

25
Reconfiguration of study areas
Buro Happold
©Buro Happold
SDC
Sust
aina
ble
Nei
ghbo
urho
od In
fras
truc
ture
: evi
denc
e ba
se
Figure 9: Aerial view of Armley, Leeds
4.5 Armley, Leeds
Armley is a district in the west of Leeds, West Yorkshire. It starts less than a mile from Leeds city centre. Like much of Leeds, Armley grew in the industrial revolution and had several mills, one of which is now the Armley Mills museum. Armley is now a largely working class area of the city, which still retains many smaller industrial businesses.
The study area is relatively high density comprising rows of back to back Victorian terraces with minimal gardens. There is very little green space or trees around the streets however the area selected does have reasonable sized parks nearby with associated sports facilities. Some of these are the other side of the canal / railway track that borders the northern edge of the study area making access difficult. There are a number of light industrial units in among the residential areas and a local primary school.
The area is included within an Area Action Plan currently out for consultation by Leeds City Council. This offers an opportunity for influencing and implementing change.
Based on the above and in conjunction with the sustainability objectives outlined in Appendix B, Table 5 suggests a ‘Top 10’ of measures suitable for the area. These are illustrated on the map on page 27.
4.5.1 Summary
Armley is the most dense of the three areas selected with very little green space among the buildings. This building density requires careful planning to improve the streetscape for example replacing some hard surface areas with green space and providing localised recycling points so as to free up space within gardens.
The geography of the area suggests an improvement in links to neighbouring facilities would be beneficial for example improving access northwards over the railway and river and to the south towards the nearest high street.
The area has relatively low income levels so measures that address fuel poverty such as energy efficiency would be good, although the age of the building stock makes things like wall insulation more expensive to implement.
Figure 10: Typical dwellings

26
Reconfiguration of study areas
SDC
Sust
aina
ble
Nei
ghbo
urho
od In
fras
truc
ture
: evi
denc
e ba
se
©Buro Happold
Proposed measure Agreed sustainability outcome(s) supported by the measure
Role played by differentials Comments / issues that could affect delivery
Env’
t
Soci
al
Econ
Gov
B Installation of Low and Zero Carbon energy systems (solar thermal collectors for domestic hot water, photovoltaic (PV) panels, wood pellet boilers, ground source heat pumps, combined heat and power (CHP)).
O
D
D
Armley Sports and Leisure Centre (near the case study area) which has a 25m swimming pool is being redeveloped: – potential for introducing CHP - could act as an anchor load for a district heating system - opportunity to use solar thermal water heaters
There is a primary school within the case study area that could benefit from PV installation for which grants and / or Feed in Tariffs are available.
Similarity of residential buildings within the area may enhance opportunities for neighbourhood wide procurement giving economies of scale.
An initiative such as coordinating with existing development to introduce CHP / district heating requires leadership and a clear ‘agent for change’ to bring together stakeholders and coordinate activities. Although the sports centre refurb provides an opportunity, timing is critical.
Other energy enhancements are likely to be more cost effective and should be pursued in the first instance. However, LZCs could be provided as part of a wider building retrofit.
Opportunities for installation of PV could give reductions in energy bills. Other technologies may not directly reduce bills depending on local fuel prices and electricity tariffs.
C Use of vacant properties: community groups to work with Local Authority to use / renovate / transform vacant properties.
Unused or derelict buildings can lead to wider decay which should be countered by refurbishment and utilisation. Powers available to local authorities to acquire vacant properties. Such transformation links to an improvement in the public realm/streetscape and can enhance feelings of security.
Upgrades could be combined with setting up local repair shops, recycling initiatives such as a furniture scheme, cycle repair business and loan scheme. Other opportunities may include provision of internet access or skills training centre (see below)
Public consultation and a sustainable business plan required to ensure the sustainability of such proposals in the long term.
D
O
Apparently underused areas – could be regenerated for community use. Low value business use such as waste or motor servicing businesses may detract from quality of place, though balance of employment vs. other factors should be considered.
Area Action Plan (AAP) highlights neighbouring high street as area requiring redevelopment including reviewing use of some buildings.
The specific area around Canal Street / Legard Way (SE corner of study area) has been identified specifically for redevelopment under AAP.
Relatively low income area so formation of social enterprises / local business considered appropriate. Role for ‘third sector’ in delivery.
Refurbishing and using existing vacant properties has long been seen as a valuable exercise however current incentives tend to favour new build (eg VAT exemption).
Although local authorities have powers of compulsory purchase these are not easily exercised and there are many legal issues to be resolved. Local authorities are also typically under-resourced in this area.
Development of social enterprises related to material recycling / repair / reuse would probably need kick starting / promoting by an ‘agent for change’. Need for such services should be established through community consultation.
Proposed measure Agreed sustainability outcome(s) supported by the measure
Role played by differentials Comments / issues that could affect delivery
Env’
t
Soci
al
Econ
Gov
A Energy efficiency upgrades, particularly improvement of thermal efficiency. Measures could include: - insulating hot water tanks - loft insulation to at least 400mm - cavity and solid wall insulation (external/internal depending on aesthetic/conservation drivers) - replacing boilers - timed and zoned temperature regulated heating controls - double or secondary glazing - draught-proofing
Potentially undertaken on street wide basis, using a neighbourhood wide procurement model to reduce costs.
Opportunities to promote competition between neighbours/streets/other neighbourhoods through information sharing
I
D
D
S
Recently devolved powers for Leeds City Council; focus on repeating Warm Zone success of Kirklees Council re retrofitting existing homes.
High density area suggesting that buildings will be the major cause of emissions per unit area hence important to any neighbourhood wide targets.
Pre 1920s buildings will have solid walls. However similarity along street offers potential to treat on street wide basis.
Relatively low income area so improved energy efficiency will be good to address issues of fuel poverty.
Most buildings will be solid wall making cost of insulation higher, but even small amounts of insulation will make a significant difference. Other measures could usefully be undertaken before more radical interventions e.g. draught proofing and boiler replacement with new heating controls requires minimal fabric alterations.
The benefits of undertaking improvements on a street wide basis in terms of cost efficiency could be undermined by difficulties of coordination and issues of local disruption. However, many of the dwellings are very similar, opportunities to assuage fears through the use of an ‘exemplar retrofit’ as a marketing suite.
Commercial models of street wide upgrades are still under development and long lead in times may restrict ‘first movers’ who could use proposed ‘Pay as You Save’ approach as set out in DECC’s Household Energy Management Strategy.
Compact dwelling size may make internal insulation less acceptable. External cladding treatment could be used to change or improve external appearance, though brick built dwellings give local character.
Table 5 ‘Top 10’ retrofit measures for Armley, taking into consideration sustainability outcomes and local differentiating factors (in no particular order).
S
O

27
Buro Happold
SDC
Sust
aina
ble
Nei
ghbo
urho
od In
fras
truc
ture
: evi
denc
e ba
se
©Buro Happold
Proposed measure Agreed sustainability outcome(s) supported by the measure
Role played by differentials Comments / issues that could affect delivery
Env’
t
Soci
al
Econ
Gov
H Provision of allotments for local food production
G
O
Large park areas and railway sidings nearby could be utilised for food production.
Area Action Plan has identified Gotts Park as an area for improvement.
The AAP does not quote allotments / food production within its consultation thus work would have to be done to engage the city authority to promote this.
There would be safety issues associated with allotments near the railway line however there are precedents for allotments being located in similar areas in other places.
I Public realm improvements including greening of streets by tree planting or other soft landscaping. Provision of ‘streets not roads’ giving pedestrians priority over vehicle traffic and improved environment for walking and playing outside.
SUDS features can be combined with landscaping and improvement of streetscape such as: permeable paving; swales / ponds within park areas; incentives / support to convert hard surfaced gardens to green gardens; introduction of micro green spaces in public areas. These measures can also provide habitats for different ecological uses.
D The area is high density, mostly hard surfaced, with very small gardens many of which are concreted over. Very little public green space around the streets being studied.
However, there are some greener streets with planted front gardens.
Old stone surfaces have been covered in tar macadam which impairs local character.
Some initiatives, such as replacement of existing paving with new landscaping and/or permeable paving, would result in considerable cost and disruption.
Schemes would require ongoing maintenance which can prove to be an issue, particularly for SUDS measures - they need to be adopted by the Local Authority in order to ensure maintenance over the long term.
Other landscaping improvements such as micro green spaces are easier to introduce at relatively low cost.
Tree planting can be difficult in narrow streets which are congested with utilities and roots may cause problems with building foundations. Careful planning, site selection and choice of species can avoid this.
J Community travel plan which promotes access to and knowledge of existing transport – public, private, freight, cycle, walking.
Specific plans could be developed for e.g. schools, local businesses etc.
More general plans showing options available could be provided to local residents eg. signage to local destinations.
Provision of routes to city centre, schools and shopping areas should be prioritised.
Longer term a local railway station could provide commuter services into Leeds city centre and to other local / regional destinations.
O
D
G
Area Action Plan is seeking to improve pedestrian and cycle paths.
Some properties have limited space for secure and dry cycle storage. Provision of ‘bicycle garages’ or at least locking points should be considered.
Local high street is not far away - improved access by bike/ foot would reduce car use.
Good quality cycle lane provision requires a change in mindset from the local highways authority. Cycle lanes should be given the same level of priority as planning roads, with grade separated routes, signalised crossings and routes which do not end abruptly.
Co-ordinated bus timetables between local operators can be difficult to facilitate due to de-regulation but frequency and reliability are key drivers to encourage bus usage. Some form of information system showing bus ‘wait’ durations could be provided but such systems are expensive. Lower cost measures might include ‘text alerts’ to mobile phones when specific bus services are approaching.
Proposed measure Agreed sustainability outcome(s) supported by the measure
Role played by differentials Comments / issues that could affect delivery
Env’
t
Soci
al
Econ
Gov
D Provision and space for segregation of waste streams at source, to encourage and facilitate recycling.
D High density area, with little garden space. Some dwellings have front garden space for bin storage, others do not.
There are a number of under used spaces that could be utilised for recycling areas or bin storage where this is not provided, or bins are left on the street. These areas are provided in some streets but not in others.
Land ownership is likely to be main barrier. Otherwise a relatively low cost measure, which could also improve quality of space and public realm.
Older buildings with limited garden space often lack sufficient space to allow storage of waste streams separately. Providing a solution to this would require the input of the local municipal waste authority and any associated contractor(s).
E Improve access / links to sites outside the area. In particular possible foot bridge over railway / canals to north connecting to entertainment centre (cinema), sports centre, local schools and nearby railway station.
G Railway and canals to the north of the study area act as a barrier to amenities located there such as a cinema, school, and a local railway station that links to Leeds main station. There is an existing road link but a foot bridge would encourage greater use and more walking / cycling by significantly reducing travel distances. This could also increase footfall in the area, giving an enhanced feeling of security due to the increased permeability of the area.
A direct route to the shopping centre and local school would be around 300m and 800m respectively. Otherwise this trip is around a one mile (~1600m) walk, which greatly increases the likelihood of trips made by car.
This requires relatively costly intervention both in terms of development time / planning, community liaison and capital. It should be linked to a comprehensive travel plan to ensure people were aware of the route and how it linked to other transport hubs / modes.
Appetite for such a link could be gauged as part of the development of a community travel plan.
Good quality landscaping and street lighting would be required to ensure the link was well used, and did not become a security problem.
F Community centre focused on energy saving – training, etc. Can combine with group utility purchasing to reduce energy costs for local residents. Could also combine with a community internet hub.
S Relatively low income area so cost saving initiatives suitable. Also possible that not all homes have internet access hence community internet hub would be beneficial.
Issues over leadership and taking the initiative forward. It would be necessary to either identify a suitable community group or for Leeds City Council to be suitably engaged.
G Improve efficiency of building use / occupancy eg. ‘16 hour schools’
D Local primary school within study area Needs coordinator / ‘agent for change’ to make happen. Need to engage school and community groups.

28
SDC
Sust
aina
ble
Nei
ghbo
urho
od In
fras
truc
ture
: evi
denc
e ba
se
©Buro Happold
RiversRailways
Electrical HV
Sub Station(Electrical)
Gas
Gas ME
Virgin Media
Use of vacant properties
Comm
unity Travel Plan
ManholesWater
Museum
Armley Map
Sports Ground
Improved Acces to North
Sports Centre
Energy e�cientupgrades
Treeplanting
Microgreen space
PotableWater
Green Space(Public & Private)
Bridge over waterways
Space forWaste
Community Centre
CHP / DistrictHeating
Allotments
“16” hr School
BT Phone(Overhead Cables)

29
Buro Happold
SDC
Sust
aina
ble
Nei
ghbo
urho
od In
fras
truc
ture
: evi
denc
e ba
se
©Buro Happold
05 Conclusions
Such studies could consider:
• Importance of community groups; interaction with local authorities; key agents for change
• How to establish priorities taking into account local context and cost benefit analysis of different measures
• Development of decision making toolkit and/or analysis
• Ranking issues in terms of impact
• Carbon analysis / impact of different measures
• Overlay of environmental / sustainability benefits on to financial costs – concept of marginal cost of sustainability improvement
• Motivational studies in relation to infrastructure design
• Interaction with national policy initiatives e.g. decarbonising the grid, smart meter roll out
• Funding in environment where public expenditure is being cut
• Governance structures and accountability
• Local taxes, community leavies or increases in business rates
• Each area is different and although sustainable infrastructure measures may be similar overall, the way in which they are brought together and the detail of implementation will vary. For example there are upgrades that could usefully be applied to all three areas such as energy efficiency improvements or community travel plans however the detail in delivery for each will be different depending on local factors: insulation improvements in Armley will be more costly than in Blacon due to the age and hence form of the building block. Some improvements are very specific and relate strongly to geography such as improving links to neighbouring facilities and areas through the provision of a bridge over a railway or river. Social demographics also points at different priorities for different areas. In Blacon, measures that directly address fuel poverty or increase the potential for local employment are important.
• Infrastructure retrofit is a dynamic process. Different areas are at different stages of development. Blacon for example has a very active community group which has already spearheaded a number of initiatives. It has invested in community engagement and has been building links with the local authority. As such it is further down the ‘development’ path than Armley. Intervention in getting measures implemented therefore needs to be different in the two places
• New models of financing are required as many aspects of infrastructure provision do not fit in a standard business model.
• Behaviour is an important aspect of sustainability and infrastructure needs be configured such as to support appropriate behaviour change.
5.2 Suggestions for further work
This research has focused on a broad qualitative approach to sustainable infrastructure upgrade. More detailed quantitative research to inform the development of policy to facilitate retrofit at community scale further could include:
• Assessment of economic benefits of specific interventions using Gross Value Added or other economic metric
• More detailed sustainability appraisal of interventions is considered a high priority
• Developing a hierarchy of interventions according to their impact and deliverability
5.1 Conclusions
This research project mapped existing infrastructure in three case study areas and combined this with an investigation of delivery mechanisms, costs and ownership structures to explore how these areas could best be reconfigured. Overall:
• There are many technological solutions already available that improve local infrastructure. The list of measures compiled for this study does not contain many surprises in technological terms. What was emphasised instead was that the compartmentalised nature of delivery means that natural linkages between infrastructure types - such as waste and energy or green space and food provision - are not being fully exploited. Thus it was found that technology per se is not a major barrier to delivering sustainable infrastructure.
• There is a need for a local ‘integrator’ or ‘agent for change’ to coordinate projects and act as a ‘face’ for the community. In many cases the type of activities that would best promote community wellbeing and sustainability are those that are based on community involvement and behaviour changes. Although there are many schemes being put in place by central and local government - grants for LZC installations, and building efficiency upgrades, tree planting schemes, public transport awareness schemes, etc - the challenge is for these to be made comprehensible and to motivate people to act upon them. Thus identifying an ‘agent for change’ is seen as a key barrier to delivery. In the case of Blacon such an entity is already in existence and has had to work hard over a number of years to get the degree of engagement it currently enjoys. Not all communities have this.
• There is a need for positive relationship between community groups and the Local Authority.

SDC
Sust
aina
ble
Nei
ghbo
urho
od In
fras
truc
ture
: evi
denc
e ba
se
©Buro Happold
Appendix A – Measures table with cost / benefit analysis
The table on the following pages assesses costs and benefits of a range of benefits across the different infrastucture categories with the following key:
• Environmental
• Social
• Economic

31
Buro Happold
SDC
Sust
aina
ble
Nei
ghbo
urho
od In
fras
truc
ture
: evi
denc
e ba
se
©Buro Happold July 2010-07-05
Measures - Buildings Costs Benefits Capital Revenue
Low Med High None Low Med High
Energy efficiency upgrades, particularly improvement of thermal efficiency eg through insulating hot water tanks, lofts, cavity and solid walls, replacing boilers and heating controls, double or secondary glazing and draught-proofing. Can be undertaken on individual buildings or collectively at street level.
• Upgrades can mean generation of waste – ie due to replacement of old equipment / materials. Needs to be managed to minimise embodied carbon
• Lower primary resource use through lower energy use
Cost savings rather than revenue generation
But some potential for local employment for undertaking the work employment for undertaking the work
• Disruption during the removal/installation phase • Improved thermal comfort (insulation) leading to improved health (less respiratory problems, heart disease, strokes etc)
• Can be high up-front costs but a number of existing schemes in place to address this eg. Warm Front, CERT/CESP, trial Pay as you Save scheme
• Issues over split incentives – capital cost incurred by landlord, benefits accrue to tenant
• Lower energy costs – positive impact on fuel poverty
• Can increase the value of the house, which would benefit the owner
• Undertaking the work can generate local employment
• Economies of scale if work undertaken on street wide basis however complex coordination and planning issues
LZC systems (solar thermal, PV, wood pellet, GSHP)
• Solar PV is particularly carbon intensive to manufacture
• Wood pellet biomass systems require a good local source of fuel; transportation of fuel over large distances significantly reduces the carbon savings
• Lower primary resource use; substitution of fossil fuels with renewable fuels
• Near elimination of distribution losses, with energy generated at the point of demand
Revenue generated in proportion to quantity of power generated; benefits from government incentives
• A biomass system requires regular delivery of fuel in a truck or lorry, thereby increasing heavy traffic which reduces local amenity
• GSHP involves considerable disruption when digging boreholes
• Engages / educates people in energy issues which can contribute to behaviour change
• Relatively high capital cost with long paybacks (although these will be reduced through introduction of FITs)
• Can be revenue generating – eg through new Feed In Tariffs for microgenerators
• Government’s Pay-as-you-save scheme trial to spread capital cost
• Potential for creation of community enterprise eg. funds raised and invested locally with benefits accruing to local investors
Installation of low water usage appliances
• Upgraded appliances will result in the generation of waste from replaced limiter valves.
• Water conservation important particularly in water stressed areas
• Reduces potable water use hence energy required for water treatment
Minor savings dependent on volume of water saved • Also requires behaviour change to get full benefit
which is harder to manage / takes longer to make happen
• Engages / educates people in water issues which can contribute to behaviour change
• Savings to householders only accrue if water use is metered
• Relatively low capital cost
31
SDC
Sust
aina
ble
Nei
ghbo
urho
od In
fras
truc
ture
: evi
denc
e ba
se

32
SDC
Sust
aina
ble
Nei
ghbo
urho
od In
fras
truc
ture
: evi
denc
e ba
se
©Buro Happold
Low Med High None Low Med High
Smart meters linked to stand alone displays; and potentially linked to intelligent building controls
• Improved awareness of energy use could lead to energy and hence resource savings
• Smart meters will support development of a smart grid which should lead to greater energy efficiency and hence resource savings
Minor cost savings rather then revenue generation
• Smart meters themselves reasonably straightforward but to make effective, need management structure to support and ongoing engagement to ensure energy savings materialise
• Some issues over privacy and data protection
• Increased awareness of energy use and hence potential for positive behaviour change
• Costs of changeover are likely to fall to end consumers • Relatively low cost per unit that could be recovered at least in part by energy savings
• Government is already committed to rolling out smart meters in both domestic and non-domestic properties (aiming for full roll out by 2020)
Use of vacant properties: community groups to work with Local Authorities in relation to using / renovating / transforming vacant properties; refurbishment and utilisation
• Renovation of old properties may encounter problems with asbestos and other toxic elements
• Renovation likely to generate waste
• Reduces pressure on green belt / new build by making effective use of existing structures
• Reduces need for new resources
Potential for revenue generation where empty properties used to house new businesses
• Significant legal and other issues over compulsory purchase
• Improved local amenity and increased activity, enhances civic engagement
• Sense of ownership if community is involved
• Funding implications – how is renovation paid for? • Could be revenue generating if building is used for local business eg café, meeting rooms, other community facilities
• Can generate rental income
Aesthetic improvement of buildings to improve quality of space
• Improvements likely to involve replacement of some items, generating waste
No associated revenue stream
• Improved aesthetics of public realm enhances sense of well being and perceptions of local area
• Enhances sense of civic pride
• Increases security and reduces vandalism
• Cost of improvement – who will cover it? No directly attributable revenue arising
• May increase the value of the house, which would benefit the owner
• May also increase value of houses within the area as a whole
Measures - Buildings Costs Benefits Capital Revenue

33
Buro Happold
SDC
Sust
aina
ble
Nei
ghbo
urho
od In
fras
truc
ture
: evi
denc
e ba
se
©Buro Happold
Low Med High None Low Med High
Green roofs • Potential issues over structural load • Improve air quality
• Reduce surface water run-off
• Potential to enhance biodiversity
• Some positive impact on insulation / thermal properties
No associated revenue stream
• Some resistance may be encountered due to media attention gained by green roofs which are not maintained and subsequently die
• Depending on type specified, the green roof may require a level of ongoing maintenance
• Improves well being through improvement of environment, air quality, biodiversity etc
• High capital cost, no associated revenue • Improvement in insulation should reduce heat loss and thus reduce the cost of heating the building to a comfortable level
Rainwater harvesting either through provision of individual rainwater harvesting tanks / water butts or through community based schemes.
• Space requirements both domestically and for large storage tanks, typically located underground
• Rainwater needs minimal treatment before use in non-potable water schemes hence reduces need for water treatment and associated energy costs
• Helps improve green spaces by greater provision of irrigation
• Some impact on surface water drainage but minimal (assuming harvesting tank is not generally empty when there is excessive storm water)
No associated revenue stream; some minor cost savings
• Regular maintenance required
• Community schemes complex to administer and require local support which may not be forthcoming (perceived public health issues over ‘sharing’ water)
• Promotes awareness of water as an issue and supports behaviour change
• Limited ‘payback’ as water is currently ‘cheap’
• Financial savings only accrue if water is metered at the property
• Householder saves money on sewerage charges by reducing the volume of water going into drains
Shared facilities eg. laundry, communal heating systems, shared secure bike park
• Need space to locate systems, which may not be available
• Potential to ensure efficient appliances for all households
• More efficient use of space and resources hence overall environmental improvement
• Reduced transmission losses for localised energy systems due to generation near point of demand
No associated revenue stream; some minor cost savings
• Social / behavioural issues: people prefer to have their own systems
• Needs to be well maintained and secure to avoid vandalism etc
• Improved sense of community
• Increased interaction between residents through use of communal facilities such as laundry, ‘meeting the neighbours’
• Can improve access to facilities for low income groups
• High capital cost, particularly for communal heating systems. Financing may require the buy-in of an ESCo
• Reduced capital costs to households
Measures - Buildings Costs Benefits Capital Revenue

34
SDC
Sust
aina
ble
Nei
ghbo
urho
od In
fras
truc
ture
: evi
denc
e ba
se
©Buro Happold
Measures - Buildings Costs Benefits Capital Revenue
Low Med High None Low Med High
Efficiency of building use / occupancy eg. using school buildings outside school hours, concept of ’16 hour school’
• May result in increased energy consumption due to large buildings such as schools being used for small group gatherings
• More efficient use of space and hence of resources
• Potential to reduce traffic congestion by spreading building use over longer hours
Some returns possible through rental of space
• Requires coordination and planning • Improved security through increased use of public realm
• Opportunity for encouraging local groups at low cost eg. youth, elderly
• Complexities may surround charging for energy consumption and allocating it to different uses
• No capital cost
• Potentially revenue generating eg renting out space to community groups
Clustering of community buildings, shops etc to create community ‘centre’
• Is likely to require new build or significant building refurbishment, generating waste and emissions
• Requires space which may not be available
• Should reduce the requirement to travel and thus the associated emissions
No directly associated revenue stream although could help local businesses
• Enhances community cohesion and perceptions of local area
• Better public safety if well planned
• Increased activity at various times of day; attracts visitors
• Cost associated with moving / changing
• Using spatial planning policy to effect change is relatively slow but low cost
• Bringing activities together should attract more people and thus generate more money for local businesses
• Transport costs for the local community should fall
Community training centre on sustainability issues – energy conservation, waste management etc
• Potential to reduce energy use through changes in behaviour
No associated revenue stream
• Potential for youth and adult education in sustainability issues
• Potential for community engagement
• Likely to require local authority support / funding • Brings potential for greater civic engagement
• Improved social networks through training sessions
Demonstration energy projects eg. retrofitting of selected homes
• May just be limited to a few buildings • Potential to reduce energy use through changes in behaviour
Could be some revenue generation depending on nature of project
• Helps to raise awareness of issues addressed
• Learning opportunity
• Raises profile of local community as ‘pathfinder’
• Unclear where funding would come from; likely to require public funding support
• Some business opportunities eg if project involved power generation
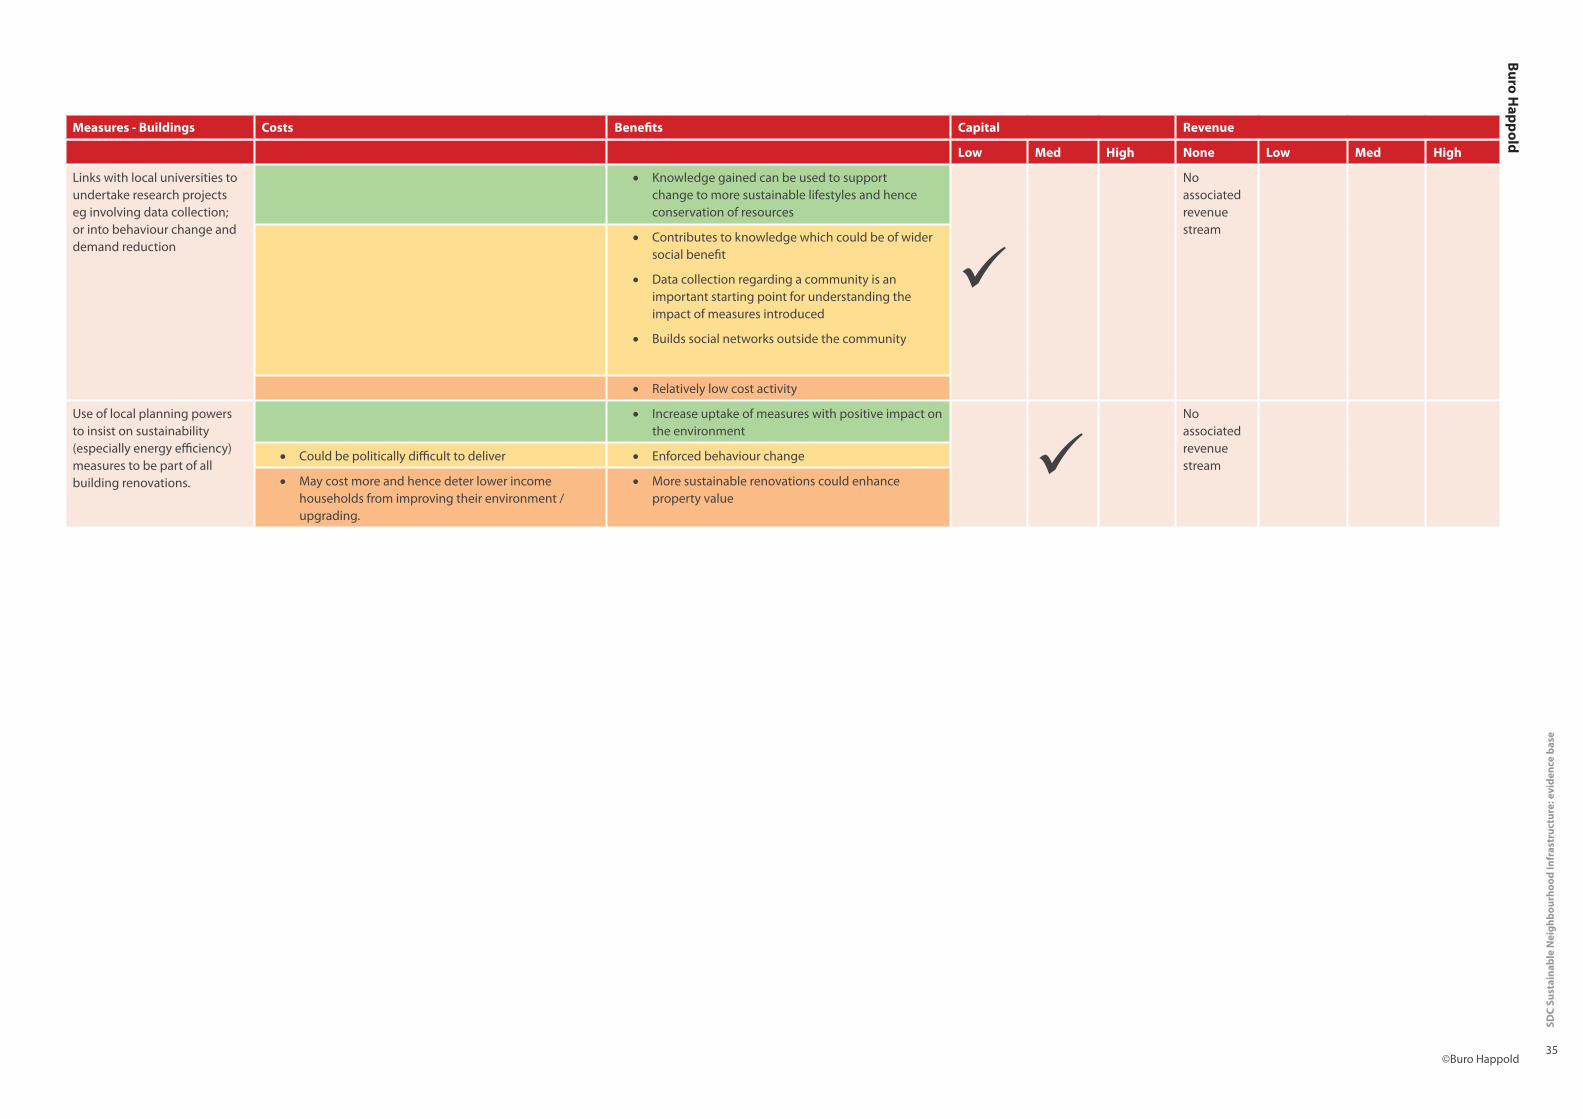
35
Buro Happold
SDC
Sust
aina
ble
Nei
ghbo
urho
od In
fras
truc
ture
: evi
denc
e ba
se
©Buro Happold
Low Med High None Low Med High
Links with local universities to undertake research projects eg involving data collection; or into behaviour change and demand reduction
• Knowledge gained can be used to support change to more sustainable lifestyles and hence conservation of resources
No associated revenue stream • Contributes to knowledge which could be of wider
social benefit
• Data collection regarding a community is an important starting point for understanding the impact of measures introduced
• Builds social networks outside the community
• Relatively low cost activity
Use of local planning powers to insist on sustainability (especially energy efficiency) measures to be part of all building renovations.
• Increase uptake of measures with positive impact on the environment
No associated revenue stream
• Could be politically difficult to deliver • Enforced behaviour change
• May cost more and hence deter lower income households from improving their environment / upgrading.
• More sustainable renovations could enhance property value
Measures - Buildings Costs Benefits Capital Revenue

36
SDC
Sust
aina
ble
Nei
ghbo
urho
od In
fras
truc
ture
: evi
denc
e ba
se
©Buro Happold
Low Med High None Low Med High
CHP / district heating – particularly linked to public sector buildings, leisure centres (swimming pools) etc
• More efficient use of primary energy resources
• Lower carbon emissions
Potential revenue streams exist but requires capital cost contribution to generate overall net returns
• Public perception of district heating is negative in many instances
• Disruption associated with installation – digging up roads etc
• Relatively high capital cost linked to low returns
• Start up costs in terms of project setup and development – coordinating stakeholders, planning, fund raising etc
• Operational cost savings through use of more efficient plant
• Potential to generate employment and revenue locally by supplying energy and running plant by setting up a local ESCo
Replacement of hard paving with permeable paving to improve surface water drainage
http://www.pavingexpert.com/permabl1.html
• Potential for pollutants to run into ground without being intercepted (e.g. petrol)
• Reduction in surface water flooding
• Groundwater recharge
No revenue generated
• Disruption during installation • Reduced surface water flooding improves appearance / usability of an area with consequent increase in perceptions of place
• Maintenance costs eg. to remove weeds • Potential savings in foul water treatment costs due to reduced volume
Local biomass supply business to supply local or regional biomass boilers
• Increased vehicle emissions associated with biomass fuel transport
• Lower net carbon emissions to the extent that the biomass fuel replaces fossil fuel
Potential revenue stream for local business • Would have to be sure of adequate supply of biomass
fuel locally to create viable business • Potential to generate employment and revenue
locally
• Relatively low cost to establish
Community wind farm • Visual and noise issues associated with wind turbines
• Need appropriate conditions eg wind speeds, space, that mean solution will not be widely replicable for urban communities
• Renewable energy source hence reduction in emissions
Potentially good returns due to government incentives
• Negative perception of wind turbines close to dwellings / public space
• Enhances image of renewables among community if linked to community income generation
• Supports civic engagement and creation of community networks
• Significant start up and capital investment required • Potential to generate revenue for the community
• Supported by renewables incentives such as ROCS or the Feed in Tariff
Measures - Utilities Costs Benefits Capital Revenue

37
Buro Happold
SDC
Sust
aina
ble
Nei
ghbo
urho
od In
fras
truc
ture
: evi
denc
e ba
se
©Buro Happold
Low Med High None Low Med High
Community utility / fuel purchasing ie. Grouping together to purchase utilities and hence benefit from lower cost
Cost savings rather then revenue generation
• Supports community cohesion / neighbourliness
• Particularly beneficial where community is off the gas grid and / or uses oil
• Lower costs for consumers
• Low cost to set up
Non-potable water network • Reduces needs for treatment of potable water and hence reduces energy use
No returns directly generated • Disruption associated with laying new pipes
• High capital cost of installation – ie double pipe network
• Ultimately savings to water network operators however this is not likely to be seen locally
Local data network alongside telecoms network – ‘community LAN’ – that could support eg smart meters at community level ie. collect and feed back information as a community rather than individually
• Disruption due to installation of new network or if wireless of transmitters
• Should lead to lower energy usage and hence lower emissions
No returns directly generated • Issues over data security and privacy – but these can
be addressed
Switch to electric cooking linked to use of local CHP / low carbon power generation
• If existing equipment is discarded extra waste is generated
• Only of environmental benefit if electrical supply is decarbonised
No returns directly generated • Requires behaviour change if people prefer cooking
on gas
• Electricity more expensive than gas.
Injection of biogas into gas grid from anaerobic digester plant fed by local food waste
• Could require waste to be transferred into the area to have plant of sufficient scale. Hence increased transport emissions.
• Potential odour issues
• Lower carbon emissions associated with biogas than with fossil fuel gas
• Fertiliser generated as a by product which is good for green space and soil improvement
Potential revenue stream for local business but depends on access to grid
• AD plant requires space / spatial planning
• Issues over access to gas grid
• Helps with fuel security issues – ie less gas required from third parties
• Keeps more value within the local community
• Relatively high capital cost to set up anaerobic digester plant
• Potential to earn revenue from locally generated waste
Measures - Utilities Costs Benefits Capital Revenue

38
SDC
Sust
aina
ble
Nei
ghbo
urho
od In
fras
truc
ture
: evi
denc
e ba
se
©Buro Happold
Low Med High None Low Med High
Anaerobic digester used to fuel local CHP plant.
• Could require waste to be transferred into the area to have plant of sufficient scale. Hence increased transport emissions.
• Potential odour issues
• Lower carbon emissions associated with electricity generation
• Fertiliser generated as a by product which is good for green space and soil improvement
Potential to earn revenue locally through electricity sales but scale an issue
• Best to coordinate with a new development rather than retrofit heating pipes to existing buildings – hence issues over timing
• Keeps more value within the local community
• Relatively high capital cost • Potential to earn revenue from locally generated waste through sales of electricity which would attract government incentives. Scale of operation to be viable an issue however
High speed broad band
No returns directly generated
Disruption associated with installation Enables more effective home working
Facilitates learning
Provides greater scope for local work and activities hence for social networks and civic engagement
Costs of use may be prohibitive in for low income households
Requires payments to external third parties hence income does not accrue locally
Liaison with local water company eg. on campaign to fit water meters on all buildings; provide water butts; supply low water fittings
• Reduces potable water usage hence reduces emissions associated with treatment
Cost savings rather then revenue generation
• Requires liaison with local water company which will take time / effort
• Potential for disruption during fit out
• Encourages behaviour change
• Reduction in domestic water bills but only if building is metered
• Cost savings through reducing foul water drainage costs
Measures - Utilities Costs Benefits Capital Revenue

39
Buro Happold
SDC
Sust
aina
ble
Nei
ghbo
urho
od In
fras
truc
ture
: evi
denc
e ba
se
©Buro Happold
Low Med High None Low Med High
Encourage cycling through creating safe and convenient cycling environment ie. safe well maintained routes, well lit and shaded, appropriate signage, facilities at transport nodes such as secure parking, lockers, showers; initiate cycle repair business and loan scheme; encourage buses to have bike racks
• Could require waste to be transferred into the area to have plant of sufficient scale. Hence increased transport emissions.
• Potential odour issues
• Fewer cars on the road hence less emissions
No revenue generated locally from Infrastructure upgrade
Some revenue could be generated locally through local repair shops etc
• Requires lifestyle change
• Cycling not possible for everyone, issues over disability access
• Cycling enhances health and well being
• Fewer cars on the road hence less congestion and associated disruption
• Opportunity for community activities such as group bike rides, shared maintenance courses, cycle training for kids (eg police liaising with schools)
• Encourages positive behaviour change
• Some costs involved in changing infrastructure – eg. fixing bike racks to buses; signage; maintenance and upkeep of routes (although this should be standard practice anyway rather than additional cos)
• Low cost travel compared with other modes
• Cycle repair business etc has potential to generate income locally / social enterprise
Alternative fuel vehicles eg hydrogen fuel cell buses; hybrid buses
• Less polluting hence improved air quality and positive impact on carbon emission
Unless buses were community owned ticket revenue would not accrue locally
• Positive image of public transport locally; relatively visible upgrade
• Alternative-fuel vehicles are not necessarily cheaper to run, and definitely in the case of hydrogen-powered vehicles the capital cost is high. This is because the procurement network has to be put in place in order to fuel the vehicles.
• Unlikely to generate additional income locally
Measures - Transport Costs Benefits Capital Revenue

SDC
Sust
aina
ble
Nei
ghbo
urho
od In
fras
truc
ture
: evi
denc
e ba
se
©Buro Happold
Measures - Transport Costs Benefits Capital Revenue
Low Med High None Low Med High
Community travel plan – local campaign as to what is available now in terms of alternative means of travel and how to use it. Need to get different stakeholders involved (eg bus companies, local authority, schools – combine with school travel plans)
• Should lead to lower car use and hence fewer emissions and less congestion
No revenue generated locally • Requirement to engage wide range of stakeholders
and ongoing requirement to ensure plan is put into practice across the community makes this complex to implement and deliver real benefits
• Enhance health and well being assuming leads to less car use, more walking and cycling and more use of public transport
• Should encourage positive behaviour change
• Can be designed to improve access
• It would encourage civic engagement locally
• Reduced car use should improve local amenity and hence perception of the area
• Should lead to lower end user costs through careful planning and switch to alternative modes of travel
Electric charging points to encourage electric vehicles
• Replacement of fossil fuel cars by electric vehicles leads to lower emissions and better air quality
No revenue generated locally
Revenue arising through electricity sales
• Likely to be more relevant in a higher income area
• Electric charging points have some costs, namely the installation of the points and the energy. In some cases energy is provided for free to encourage electric vehicles (eg. Westminster) but this cost has to be borne somewhere in the supply chain.
• Unlikely to generate income locally
• As revenue is associated with the output (electricity), private finance available either through automotive industry or power industry
Communal taxis as can be found in developing countries
• Lower emissions per person
Some revenue locally based on taxi fares
• Requires behaviour change which may be hard to achieve
• Less flexible than single occupancy taxis
• Can support neighbourliness through sharing of journeys / requirement for coordination
• Potential to generate income and employment locally
• Capital investment in vehicles can be recovered through fare charging
• Can be lower cost form of convenient travel than single occupancy vehicles
40
Buro Happold
SDC
Sust
aina
ble
Nei
ghbo
urho
od In
fras
truc
ture
: evi
denc
e ba
se

41
Buro Happold
SDC
Sust
aina
ble
Nei
ghbo
urho
od In
fras
truc
ture
: evi
denc
e ba
se
©Buro Happold
Measures - Transport Costs Benefits Capital Revenue
Low Med High None Low Med High
Encourage walking through creating a comfortable pedestrian environment ie. wide paths, clean, well maintained (for push chairs, wheel chairs etc), safe, well lit and shaded, appropriate signage, awareness, distances in walking times, clear links between key centres etc
• Reduced vehicle emissions
• Improvement of the public realm
Some revenue to the extent that LA pays for local work done
• Walking enhances health and well being
• Improved public realm can improve safety and security
• Encourages positive behaviour change
• Potential for local employment if the Local Authority paid the community for maintenance rather than contracting out
• Low capital cost
Encourage bus use through eg. enhancement of waiting environment / bus stops, appropriate positioning of bus stops, links eg to secure bike parks, coordinated timetables
• Reduced vehicle emissions if greater use of buses
No revenue generated locally • Requires a ‘community face’ to liaise with bus
authorities and companies • Enhanced health and well being
• Unlikely to generate income locally hence would require public funds
Car clubs / car sharing – can be supported by effective ICT
• Fewer cars on the road hence less environmental impact (emissions, noise etc)
• Less requirement for parking space hence freeing available land for other more productive uses
• More efficient use of cars
• Maximisation of the car pool resource (less idle hours per vehicle)
Some revenue locally if club was a local one
• Requires behaviour change which may be hard to achieve
• Less flexible than owning own car
• Fewer cars on the road hence less congestion
• End user does not need to deal with maintenance
• Potential to develop social networks / enhance neighbourliness
• Lower operating costs for end user, who is not burdened by insurance costs
• Potential for local employment in terms of running the car club; potential for earning revenue locally reduces need for public funding
• Lower costs overall and potential for cheaper upgrades as car club can make bulk purchases and benefit from scale
41
SDC
Sust
aina
ble
Nei
ghbo
urho
od In
fras
truc
ture
: evi
denc
e ba
se

42
SDC
Sust
aina
ble
Nei
ghbo
urho
od In
fras
truc
ture
: evi
denc
e ba
se
©Buro Happold
Measures - Transport Costs Benefits Capital Revenue
Low Med High None Low Med High
Introduce park and ride schemes
• Space required for car park • Lower congestion and emission in city centre hence improving environment
Some revenue associated with parking charges
• Less flexible than using own car • Less congestion leads to improved public realm
• Should be lower cost for end users assuming they are avoiding city centre parking fees
Travel plan that coordinates logistics / freight locally
• Reduced freight traffic in built up areas leads to less emissions and improved environment
No revenue generated locally, but potential cost savings
• Difficult to implement given differing needs to local businesses
• Can support community cohesion / social networks through requirement for coordination between businesses
• Unlikely to generation income locally but could lead to transport cost savings for participants
Creation of pedestrian areas within urban centres
• If areas are all hard surfaced, raises rain water run off issues
• Less vehicles hence less emissions and better air quality
No revenue generated locally
• Can improve public realm, safety and security etc
• Can improve access
• Relatively high cost if requires major alteration to street infrastructure
• Can positively impact on local retailers through greater footfall
Bus rapid transit routes to city centre / major public transport nodes
• Reduce car usage and hence lower emissions per person
• Less congestion on the roads hence better air quality
No revenue generated locally
• High cost to implement • No revenue generated locally but returns available to bus companies operating on the route
42
Buro Happold
SDC
Sust
aina
ble
Nei
ghbo
urho
od In
fras
truc
ture
: evi
denc
e ba
se

43
Buro Happold
SDC
Sust
aina
ble
Nei
ghbo
urho
od In
fras
truc
ture
: evi
denc
e ba
se
©Buro Happold
Measures - Waste Costs Benefits Capital Revenue
Low Med High None Low Med High
Anaerobic digestion plant fuelled by locally generated green / food waste
• Requires space
• Potential odour issues
• Generates compost that can be used to improve local soil conditions
Some revenue could be generated by sale of fertiliser
• People may not want an AD plant nearby • Can support local food growing
• Relatively high capital cost • Some potential for local income generation but minimal
Local repair shops to lengthen life of white goods / reduce waste; could be linked to courses for training in maintenance
• Improves material use efficiency and reduces embodied carbon
Reasonable revenue stream potential locally
• People like to buy new things; pressure to innovate • Encourages behaviour change
• Potential for generating income locally / social enterprise
• Less requirement for public funds if business case can be demonstrated
Community managed waste recycling facility
• Requires space
• Potential odour issues unless food waste is excluded at source
• Recycling can act counter to primary waste reduction efforts
• Reduces emissions from waste transport if local waste is treated locally
• More recycling means greater materials use efficiency and lower embodied carbon
Reasonable revenue stream potential locally
• People may not want a waste facility next door
• Logistics and liaison with variety of stakeholders would make it challenging to set up
• Visibility of recycling should encourage behaviour change and reduce scepticism, particularly if it is a community owned and managed business
• A community based scheme introduces opportunities for civic engagement and development of social networks
• Need to have a market for reprocessed waste in order to build business case
• Relatively high capital cost although depends on level of sophistication of recycling plant – can be done at low capital cost but higher operating cost through reduced automation
• Potential for local employment and local wealth creation hence potential for raise more private finance
Local recycling incentives eg. local promotion of ‘freecycle’ website
http://freecycle.org/group/United%20Kingdom/North%20West/Chester%20City%20West
Or materials exchange (eg Eastex, Suffolk); or furniture schemes
• Some schemes such as furniture schemes require space
• Increases material use efficiency
Some potential to generate revenue locally
• People prefer to buy new things • Can encourage positive behaviour change by making recycling easier / more convenient
• Potential to generate employment / income locally e.g. through social enterprise
• Saves cost for both buyers and sellers
43
SDC
Sust
aina
ble
Nei
ghbo
urho
od In
fras
truc
ture
: evi
denc
e ba
se

44
SDC
Sust
aina
ble
Nei
ghbo
urho
od In
fras
truc
ture
: evi
denc
e ba
se
©Buro Happold
Measures - Waste Costs Benefits Capital Revenue
Low Med High None Low Med High
Local business directory eg for DIY giving details of products available and their ‘greenness’
• Reduced environmental impact related to transport of goods
Some potential to generate revenue locally • Encourage local enterprise; keeps ‘spend’ within the
local community
• Revenue generating through advertising
Polluter pays principle: increase of council tax depending on quantity of domestic waste generated
• Should act as an incentive that increases recycling rates and hence improves material use efficiency
No revenue generated locally • Political barriers • Enforces behaviour change
• May adversely penalise families • Money saved by those that increase recycling rates / reduce waste
Rationalisation of recycling points and waste collection infrastructure
• Storage and collection access require adequate space • Increased recycling increases material use efficiency
No revenue generated locally
• Better planning to make recycling more convenient should reinforce positive behaviour change
• Better planning can also address access issues
• Relatively low cost measure

Measures - Green Infrastructure
Costs Benefits Capital Revenue
Low Med High None Low Med High
Improve green space using local skills / labour
• Better green space improves biodiversity and air quality
Some potential for local revenue generation if LA willing to pay
• Enhances health and well being
• Enhances perceptions of the local area and hence feelings of civic pride
• Issues over who pays for the service • Potential social enterprise – community undertakes work on behalf of local authority
• Improved green space generally increases local house prices
Set up a tree and shrub nursery
• Requires space • Can enhance local biodiversity
Some potential to generate revenue locally
• Encourages gardening activity locally which is good for health and well being
• Provides local focal point for ‘green’ issues
• Issues over start up funding • Potential social enterprise
Linking habitats with wildlife corridors
• Enhances biodiversity
No associated revenue stream
• Could have dual functions e.g. encouraging walking / cycling, use of a watercourse, improving roadside landscaping
• Can be costs associated with implementation which will require public funding
Encourage private gardens to promote biodiversity
• Enhances biodiversity
No associated revenue stream
• Encourages community cohesion / ‘good neighbours’
• Learning opportunity particularly for households with children
• Requires ongoing upkeep / training • Low cost
Food production in green spaces – public / private
• Requires space • Reduced need to import food into the area, reduces ‘food miles’
• Increased biodiversity Some potential to generate revenue locally • Requires ongoing attention so important to have full
engagement of participants • Increased awareness of where food comes from and
issues surrounding it
• Fitness and wellbeing from gardening
• Potential to set up community gardening groups
• Potential to improve visual amenity
• Saves cost of purchasing food for local participants
Buro Happold

Measures - Green Infrastructure
Costs Benefits Capital Revenue
Low Med High None Low Med High
Convert hard landscaping to green space; creation of micro green spaces
• Reduces surface water run-off; improves drainage
• Potential to enhance biodiversity
No associated revenue stream • Encourages outdoors community activities
• Enhances health and well being
• Potential to grow food
• Improves quality of space
• Promotes informal leisure
• Increased requirement for upkeep / maintenance
• Capital funding required
Incorporate sports facilities in green areas
Some potential for revenue generation
• Enhanced health / fitness and hence well being
• Sports clubs good for social cohesion
• Capital funding required
• Ongoing costs of management and maintenance
• Some potential for local income generation eg. through employment of coaches and trainers, although a lot of sports club work is undertaken voluntarily
Improving the public realm – eg rationalise street lighting (solar powered); clustering community / retail areas, coordinate / improve street furniture, community art works, benches, planting etc
No directly associated revenue stream but likely to enhance trade of local business
• Improved public realm is good for local sense of community
• Can address issues of safety and security and reduce incidences of vandalism / petty crime
• Some capital cost depending on the nature of the upgrade not matched with income (although council could recoup through rates increases)
• Improved public realm likely to have positive impact on local trade
‘Gardening club’ including courses, community activities – this would support upkeep of private gardens and local food production initiatives
• Should lead to enhancement of green space and hence biodiversity
Limited potential for revenue generation
• Good for community cohesion
• Encourages healthy activities
• Minimal cost involved in setting up such a scheme
Links to local agriculture / farmers eg. farmers markets; box delivery schemes; encouraging direct links between farms and schools / hospitals
• Encourages consumption of more locally produced food hence less ‘food miles’
Some potential for revenue generation
• More healthy / fresh food
• Potential for education of urban population regarding rural life eg through farm visits
• Food may be more expensive and thus discriminate against lower income households
• Potential for local enterprises to flourish eg. market stalls / traders

Measures - Blue Infrastructure
Costs Benefits Capital Revenue
Low Med High None Low Med High
Softening river banks / replanting margins
• Enhances biodiversity – can plant different species at different levels along the river bank (benefits terrestrial and aquatic ecology)
• Can reduce risk of local flooding No associated revenue stream
• Environmental improvements enhance health and well being eg through encouraging walking
• Cost of ongoing maintenance an issue, no associated revenue
Public footpaths and cycle ways following riverbanks
• Reduces emissions to the extent that walking / cycling replace vehicle transport
• Keeps riverbanks an active area and hence likely for there to be better upkeep and cleaner environment
No associated revenue stream
• Enhanced well being, calming
• Improved health and fitness
• Cost of ongoing maintenance an issue, no associated revenue
Use of rivers / canals for freight / waste transport
• Needs to be linked to transfer facilities and / or other modes of transport to be useful
• Reduces vehicle emissions and hence air quality
Some revenue can be generated for boat operators; may or may not accrue locally, depends on nature of operator
• Takes freight off the roads which improves local amenity
• Can generate income for boat operators
SUDS features combined with landscaping
• Can have biodiversity benefits
• Reduces surface water run off and therefore flooding
• Can improve water quality No associated revenue stream
• Improved quality of space – ‘looks nice’
• Ownership – and hence ongoing maintenance - of SUDS is an issue
• SUDS reduces cost of water treatment as water is treated naturally by infiltration
Encourage leisure activities eg fishing, swimming, boating through improved access
• Overuse can damage local ecologY • Greater use of water resource likely to ensure it is better maintained which should positively impact upon local flora and fauna
Potential revenue generation if users of facilities are required to pay
• Safety issues for users • Enhances health and well being
• Enhanced social networks eg through sports clubs
• Requires ongoing maintenance • Potential social enterprise – use of facilities pays for maintenance / upkeep by local people
Buro Happold

48
SDC
Sust
aina
ble
Nei
ghbo
urho
od In
fras
truc
ture
: evi
denc
e ba
se
©Buro Happold
Appendix B – Methodology
Stage 2
Once the existing infrastructure had been mapped, a specialist workshop was held with Buro Happold experts in waste, transport, energy, environment, water and buildings to explore and derive the possible measures list given in Appendix A.
A high level qualitative assessment was undertaken of each measure in respect of environmental, social and economic impact taking into account existing analytic frameworks.
A high level assessment of each measure in terms of capital cost (low, medium, high) and potential to generate revenue locally (none, low, medium, high) was undertaken based on industry experience.
Differentiating factors of each case study area were drawn up and overlaid with the list of retrofit measures to derive a list most appropriate to that area.
Methodology
This study was commissioned by the Sustainable Development Commission to provide an evidence base for recommendations for improving the sustainability of neighbourhoods through infrastructure retrofit.
The study was carried out in late 2009 / early 2010 in two stages. Stage 1 involved the detailed mapping of existing infrastructure in three case study areas and Stage 2 explored how this infrastructure could be altered to deliver more sustainable outcomes. Throughout the review, attention was paid to the impact of upgrade measures in environmental, social and economic terms as well as implications for funding.
Stage 1
Area selection
Three case study areas were selected for the focus of the study following the kick off meeting with the SDC on 6 October 2009. Key criteria were:
• dwelling density – low, medium and high
• building typology
• location / geography
In terms of the size of area to be mapped, the requirement was for an area of around 1,000 dwellings. Ordnance Survey 1:1250 maps were selected for this purpose.
Infrastructure mapping
Details of infrastructure (under and over ground) for the utilities - electricity, gas, water and telecoms - were obtained directly from utility companies for each location. These were overlaid onto a single street map to view the combined impact.
Building types were obtained primarily from Google Earth and Google Maps.
Desk top research was undertaken explore both the immediate case study area and its wider geographical context eg. Location of local sewage treatment plants, waste recycling centres, bus and other public transport routes, identification of local Area Action Plans and / or other local authority or community group activity.
Interviews were held with community groups were possible, in particular, Blacon Community Trust.
A workshop was held with the project Task Group members (as selected by SDC) to engage and obtain comment and feedback.

49
Buro Happold
SDC
Sust
aina
ble
Nei
ghbo
urho
od In
fras
truc
ture
: evi
denc
e ba
se
©Buro Happold
Appendix C – Maps of existing infrastructure
Local and Wider area maps for:
Blacon
Southville
Armley

Buro Happold


53
Buro Happold
SDC
Sust
aina
ble
Nei
ghbo
urho
od In
fras
truc
ture
: evi
denc
e ba
se
Stage 2 revision ©Buro Happold July 2010-07-05

54
SDC
Sust
aina
ble
Nei
ghbo
urho
od In
fras
truc
ture
: evi
denc
e ba
se
Stage 2 revision ©Buro Happold July 2010-07-05

55
Buro Happold
SDC
Sust
aina
ble
Nei
ghbo
urho
od In
fras
truc
ture
: evi
denc
e ba
se
Stage 2 revision ©Buro Happold July 2010-07-05

SDC
Sust
aina
ble
Nei
ghbo
urho
od In
fras
truc
ture
: evi
denc
e ba
se
©Buro Happold
Appendix D – Infrastructure ownership and operational structures
Infrastructure Description Asset ownership Asset maintenance / replacement cycles Funding - public
/ private
Revenue sources End consumer
interface
Customer base Scale of
operation
Carbon impact Regulator / regulatory
framework
Blacon, Chester Southville, Bristol Armley, Leeds
Low density Mixed low / high High density
Buildings Permanent structures
for living, working,
industry etc
Various As required. Replacement cycle for dwellings
tends to be longer than that for offices. It is
estimated that 86% of current building stock will
be in use in 2050.
Private and / or
public
"For a developer, revenue comes
from sale of the asset. For a
private owner revenue can come
from rental income.
Limited revenue 'in use'
associated with domestic
ownership however general aim
is for capital growth when move
house.
For public sector buildings
can be some rental income
associated with use."
Yes - residential
developers
sell / rent
directly to
home owners;
commercial
developers sell
/ rent directly
to business
Varied -
individuals,
private
companies,
public sector
Some national
scale residential
developers but
mostly local /
regional
"Carbon impact in use due to energy
requirement for heat, light, small
power etc;
Embodied carbon in construction
materials;
Carbon associated with construction
process."
New build: local planning
authority, national and
local planning guidelines,
Building Regulations,
Code for Sustainable
Homes; specialist
disciplines eg re safety,
pollution etc
Primarily
residential, low rise
buildings (2 storey)
with small gardens,
built approx 1960s.
Also some retail,
a school and a
church.
Predominantly
residential - 2 - 3
storey terrace
housing (pre
1920s), tower
blocks (1960s);
primary school
Predominantly
residential - 2 storey
terrace housing,
pre 1920s, mostly
red brick; primary
school, some
industrial
Gas Transmission National Grid -
transmission plus some
distribution
Long term based on government investment
plans
Private finance Shipping charges No (except
where National
Grid also has
distribution
network)
Distribution
/ supply
companies
National 0.20 kg CO2/kWh (point of
consumption)
Ofgem
Heavily regulated; all
participants to act under
licence (aside from v small
ones)"
National Grid
Distribution / supply 8 distribution
companies
Long term based on government investment
plans
Private finance Customers through unit and
service charges
Yes End consumers:
commercial,
industrial,
domestic
Regional / local National Grid Wales & West Northern Gas
Networks
Supply Suppliers only own
meters; often same as
distribution company
As required Private finance Customers through unit and
service charges
Yes End consumers:
commercial,
industrial,
domestic
National to local Various, depends on customer choice
Heat Generation,
distribution and
supply
Various 20 years for equipment, longer for pipe work Private finance Customers through unit and
service charges
Yes End consumers:
commercial,
industrial,
domestic
Local Depends on fuel and technology None directly - yet No district heating schemes within the study areas

57
Buro Happold
SDC
Sust
aina
ble
Nei
ghbo
urho
od In
fras
truc
ture
: evi
denc
e ba
se
©Buro Happold
Infrastructure Description Asset ownership Asset maintenance / replacement cycles Funding - public
/ private
Revenue sources End consumer
interface
Customer base Scale of
operation
Carbon impact Regulator / regulatory
framework
Blacon, Chester Southville, Bristol Armley, Leeds
Low density Mixed low / high High density
Electricity Generation Various Annual planned maintenance plus regular
ongoing maintenance regime
Private finance Unit charges per MWh
generated
Generally not Supply
companies
unless onsite
generation
National,
regional and
local
Depends on fuel type and generation
process.
"Ofgem
Heavily regulated; all
participants to act under
licence (aside from v small
ones)"
No generation sets within the study areas
Transmission National Grid Long term based on government investment
plans
Private finance Unit charges for transmission
paid by supply companies
No Distribution
/ supply
companies
National 0.54 kg CO2/kWh at point of
consumption (national grid average)
National Grid
Distribution A number of
companies; largest
are former electricity
supply companies;
increasing numbers
of smaller niche
companies entering
market
Regulated on a fixed term basis with OFGEM
setting level of investment over a 5 year price
control period
Private finance Unit charges for distribution
paid by supply companies.
Roughly equal to 1/5 of
domestic tariffs.
No Supply
companies
Regional / local Scottish Power Western Power CE Electric UK
Supply Suppliers only own
meters
Proposals for a switch to smart meters
are currently underway, otherwise meter
replacement is done on an ad-hoc basis
Private finance Unit (and service) charges paid
by end consumers
Yes End consumers:
commercial,
industrial,
domestic
National to local Various, depends on customer choice
Foul Water Foul water collection
and treatment
Water companies
(usually also supply
potable water)
Regulated via OFWAT on a 5 year price review
basis. Historic under investment, high leakage
rates and new water directives resulted in heavy
investment in the past 10 years. Networks
designed for 30-40 year life but often much older
Private finance Unit charge and standing charge
to connected customers. Unit
charge usually based on ~95%
of potable water consumption.
Yes End consumers:
commercial,
industrial,
domestic
Regional / local Included in potable water estimate “Ofwat (England): price /
investment control
Environment Agency
(abstraction licences;
flood risk etc)”
Welsh Water Wessex Water Yorkshire Water
Potable water Production,
distribution and
supply
Water companies See Foul water Private finance Unit charge and standing charge
to connected customers. Often
unmetered.
Yes End consumers:
commercial,
industrial,
domestic
Regional / local Typically 1 kWh/m3 of water supply,
equal to 0.54kgCO2/m3
Dee Valley Bristol Water Yorkshire Water
57
SDC
Sust
aina
ble
Nei
ghbo
urho
od In
fras
truc
ture
: evi
denc
e ba
se

SDC
Sust
aina
ble
Nei
ghbo
urho
od In
fras
truc
ture
: evi
denc
e ba
se
©Buro Happold
Infrastructure Description Asset ownership Asset maintenance / replacement cycles Funding - public
/ private
Revenue sources End consumer
interface
Customer base Scale of
operation
Carbon impact Regulator / regulatory
framework
Blacon, Chester Southville, Bristol Armley, Leeds
Low density Mixed low / high High density
Surface water Rain water run-off
into drains. Often
combined with foul
water sewers, though
this now considered
bad practice.
Local Authorities often
own surface water
drainage as part of
highways. Where a
combined system
exists this is owned by
the foul sewer owner
(water company)
Designed for 30-40 year life, generally as
part of road network. Largely replaced on an
ad-hoc basis. Can be issues over allocation of
responsibility for on going maintenance.
Private
finance plus
some public
for ongoing
maintenance
No revenue No n/a Regional / local Almost entirely embodied carbon
unless combined foul/surface system
"Various pieces of primary
legislation, Building
Regulations, various codes
of practice.
Environment Agency /
Local Authorities / Ofwat /
Highways Agency"
Welsh Water Wessex Water Yorkshire Water
Telecoms Networks and cables,
data centres, radio
masts etc
Various private
companies, BT and
cable
BT owns and maintains the copper networks
but is starting to rent space to other internet
providers; maintenance on an ad hoc basis. BT
exchanges are centralised; Virgin has equipment
at street level and maintains as needed.
Private finance Customers through unit and
service charges
Yes End consumers National to local Data centres account for ~1% of Auk
electricity consumption
Ofcom BT / Virgin Media BT / Virgin Media BT / Virgin Media
Waste Waste handling /
land fill sites
Private Driven by landfill tax and landfill allowances many
waste companies are investing in new facilities
under long term 25 year PFI contracts.
Private finance Gate fee income charged to
waste collection companies/
waste authorities for waste
disposal
No Local
Authorities
Private waste
collection
companies
Regional Depends on the type of waste
and level of recycling; figures are
available for embodied carbon for
different waste types
Wide range of waste
regulation depending on
waste type
Environment Agency
Cheshire West &
Cheshire
Bristol City Council Leeds City Council
Waste collection Local Authority
(domestic waste)
Private companies
(commercial waste)
Generally contracted out to private sector under
competitive tendering. Plant replacement on ad-
hoc basis or on re-tender of contract
Public sector Domestic customers - through
council tax
Commercial customers - through
unit charge
Yes End consumers Regional / local
Road Strategic road
network: motorways
& major trunk roads
Central government or
private sector where
built under PFI
Rolling programme / strategic central planning Public sector
(unless built
under PFI)
Taxation n/a n/a National Operational carbon impact relates to
numbers and type of vehicles, levels
of congestion etc
Highways Agency /
central government
n/a - none in study areas
Other roads Local Authorities own
adopted roads; some
roads may remain in
private ownership
As required Public sector
except for some
private roads
Taxation n/a n/a Regional / local Local Authority Cheshire West &
Cheshire
Bristol City Council Leeds City Council
58
Buro Happold
SDC
Sust
aina
ble
Nei
ghbo
urho
od In
fras
truc
ture
: evi
denc
e ba
se
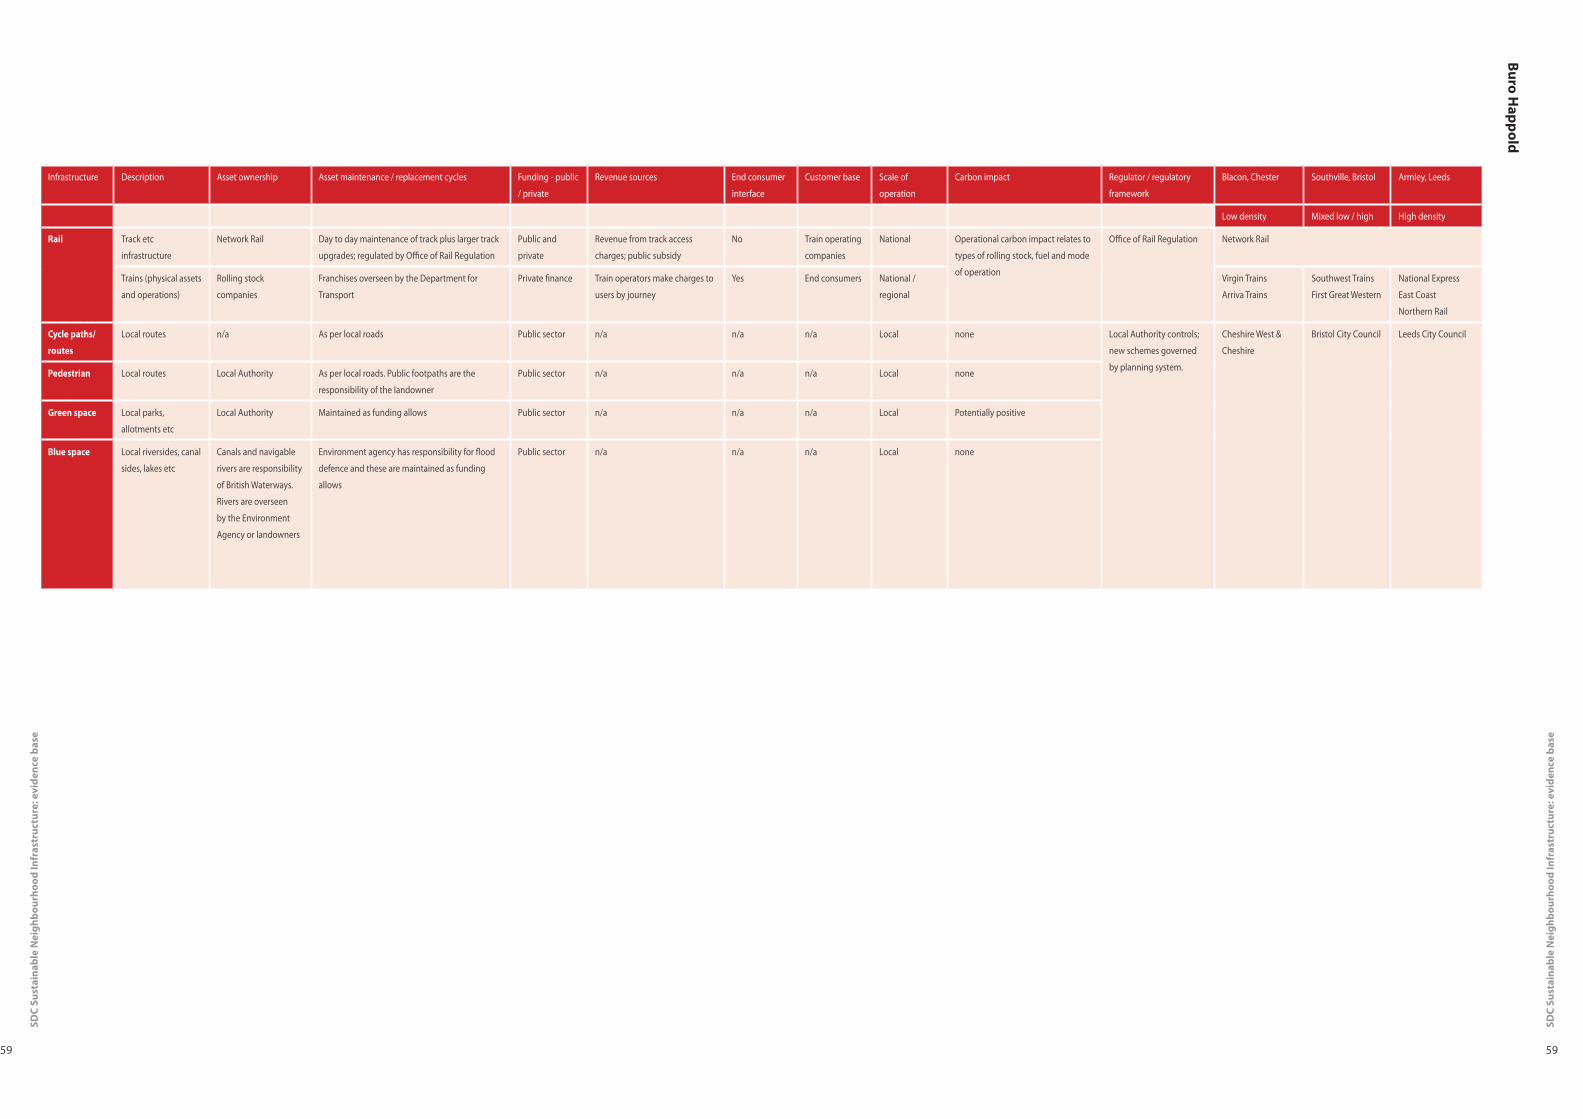
59
Buro Happold
SDC
Sust
aina
ble
Nei
ghbo
urho
od In
fras
truc
ture
: evi
denc
e ba
se
Infrastructure Description Asset ownership Asset maintenance / replacement cycles Funding - public
/ private
Revenue sources End consumer
interface
Customer base Scale of
operation
Carbon impact Regulator / regulatory
framework
Blacon, Chester Southville, Bristol Armley, Leeds
Low density Mixed low / high High density
Rail Track etc
infrastructure
Network Rail Day to day maintenance of track plus larger track
upgrades; regulated by Office of Rail Regulation
Public and
private
Revenue from track access
charges; public subsidy
No Train operating
companies
National Operational carbon impact relates to
types of rolling stock, fuel and mode
of operation
Office of Rail Regulation Network Rail
Trains (physical assets
and operations)
Rolling stock
companies
Franchises overseen by the Department for
Transport
Private finance Train operators make charges to
users by journey
Yes End consumers National /
regional
Virgin Trains
Arriva Trains
Southwest Trains
First Great Western
National Express
East Coast
Northern Rail
Cycle paths/
routes
Local routes n/a As per local roads Public sector n/a n/a n/a Local none Local Authority controls;
new schemes governed
by planning system.
Cheshire West &
Cheshire
Bristol City Council Leeds City Council
Pedestrian Local routes Local Authority As per local roads. Public footpaths are the
responsibility of the landowner
Public sector n/a n/a n/a Local none
Green space Local parks,
allotments etc
Local Authority Maintained as funding allows Public sector n/a n/a n/a Local Potentially positive
Blue space Local riversides, canal
sides, lakes etc
Canals and navigable
rivers are responsibility
of British Waterways.
Rivers are overseen
by the Environment
Agency or landowners
Environment agency has responsibility for flood
defence and these are maintained as funding
allows
Public sector n/a n/a n/a Local none
59
SDC
Sust
aina
ble
Nei
ghbo
urho
od In
fras
truc
ture
: evi
denc
e ba
se

Buro Happold Limited 17 Newman Street London W1T 1PD UKTelephone: +44 (0)20 7927 9700 Facsimile: +44 (0)870 787 4145
Abu DhabiBath
BelfastBerlin
BirminghamBoston
CairoCopenhagen
DubaiEdinburgh
GlasgowHong Kong
JeddahKuwait
LeedsLondon
Los AngelesManchester
MoscowMunich
New YorkPune
RiyadhTorontoWarsaw
Structural Engineering Building Services / MEP EngineeringGround Engineering Infrastructure Engineering Specialist Consulting
www.burohappold.com