
sd FPT Telecom Joint Stock Company (FPT: HSX) · 2019-03-27 · FPT Digital Retail Joint Stock...
17
FPT Telecom Joint Stock Company (FPT: HSX) Sustainable Development – Focus on Technology Development FULL REPORT October 22, 2018 Nguyễn Anh Tùng – Analyst [email protected] FPT is the top information technology enterprise in Vietnam, it has reputation in the region, and is the leading telecom service provider whose internet market share ranks second in the country. Business performance in the first 8 months was positive thanks to software export. Foreseen risks in the long term FPT has currently operated in 3 major business areas which are: (1) Information technology; (2) Telecomunication; (3) Education. Leading in technology trends for 30 years, FPT is now the top enterprise in information and technology sector in Vietnam and has its reputation in the region with a large number of customers including the ones in Fortune 500. In terms of telecom, FPT ranks second in the country with 28.1% market share, and owns Internet infrastructure covering 59 cities and provinces together with 4 data centers over the country. In addition, although the education area only contributes low profit proportion, impressive development stages have been shown. In the first 8 months of 2018, FPT’s revenue and PBT increased by 19% and 32% respectively yoy (excluding revenue of retail and distribution in 2017). Revenue from Technology and Telecomunication accounted for 94% of total revenue; Technology and Telecom PBT reached VND 863 bn and VND 994 bn, increasing by 31% yoy and 19% yoy respectively, software export gained VND 773 bn, increasing by 30% yoy. Large potential growth for software export and telecom would ensure FPT development in medium term. Risks in FPT’s operations in the next 3-5 years is considered relatively low thanks to potential growth in core business. In the long term, risks will reult from in telecommunication area, especially in Internet and Pay TV subcribers. Buy Target price 63,870 VND Upside/Downside 48.5% Current price (19/10/2018) VND 43,000 Target price VND 63,870 Market capital VND 26,382 bn (USD 1.12 bn) Exchange rate on 22/10/2018: 1USD = 23,390 VND Trading data Outstanding share 613,544,396 Avg. Daily volume (3M) 954,387 % Foreign ownership 49% Dividend per share 2,500 VND Forecasted business perfomance FY-End 2016A 2017A 2018F 2019F Revenue (VNDbn) 39,581 42,659 22,194 24,982 Growth rate (%) 4.14% 7.91% -47.97% 12.56% Gross profit (VNDbn) 8,438 9,682 8,434 9,743 Gross margin (%) 21.35% 22.70% 38.00% 39.00% Net profit (VNDbn) 1,991 2,932 2,391 2,794 Growth rate (%) 3.1% 47.3% -18.4% 16.8% EPS (VND) 4,333 5,521 3,896 4,553 EPS Growth -10.8% 27.4% -29.4% 16.8% P/E 10.62 8.33 11.00 9.41 Performance (%) 1M 3M 6M 12M FPT -5.4% 3.5% -14.5% 2.6% VNINDEX -3.7% 1.5% -12.4% 15.6% Nguồn: KBSV 0 2,000,000 4,000,000 6,000,000 8,000,000 10,000,000 12,000,000 0 10,000 20,000 30,000 40,000 50,000 60,000 Lịch sử giá & Khối lượng giao dịch KLGD Giá
Transcript of sd FPT Telecom Joint Stock Company (FPT: HSX) · 2019-03-27 · FPT Digital Retail Joint Stock...

FPT Telecom Joint Stock Company (FPT: HSX)
sd
Sustainable Development – Focus on Technology
Development
FULL REPORT October 22, 2018
Nguyễn Anh Tùng – Analyst
FPT is the top information
technology enterprise in Vietnam,
it has reputation in the region,
and is the leading telecom service
provider whose internet market
share ranks second in the country.
Business performance in the first
8 months was positive thanks to
software export.
Foreseen risks in the long term
FPT has currently operated in 3 major business areas which are: (1) Information
technology; (2) Telecomunication; (3) Education. Leading in technology trends for
30 years, FPT is now the top enterprise in information and technology sector in
Vietnam and has its reputation in the region with a large number of customers
including the ones in Fortune 500. In terms of telecom, FPT ranks second in the
country with 28.1% market share, and owns Internet infrastructure covering 59
cities and provinces together with 4 data centers over the country. In addition,
although the education area only contributes low profit proportion, impressive
development stages have been shown.
In the first 8 months of 2018, FPT’s revenue and PBT increased by 19% and 32%
respectively yoy (excluding revenue of retail and distribution in 2017). Revenue
from Technology and Telecomunication accounted for 94% of total revenue;
Technology and Telecom PBT reached VND 863 bn and VND 994 bn, increasing by
31% yoy and 19% yoy respectively, software export gained VND 773 bn, increasing
by 30% yoy. Large potential growth for software export and telecom would ensure
FPT development in medium term.
Risks in FPT’s operations in the next 3-5 years is considered relatively low thanks to
potential growth in core business. In the long term, risks will reult from in
telecommunication area, especially in Internet and Pay TV subcribers.
Buy
Target price 63,870 VND
Upside/Downside 48.5%
Current price (19/10/2018) VND 43,000
Target price VND 63,870
Market capital VND 26,382 bn
(USD 1.12 bn)
Exchange rate on 22/10/2018: 1USD = 23,390 VND
Trading data
Outstanding share 613,544,396
Avg. Daily volume (3M) 954,387
% Foreign ownership 49%
Dividend per share 2,500 VND
Forecasted business perfomance
FY-End 2016A 2017A 2018F 2019F
Revenue (VNDbn) 39,581 42,659 22,194 24,982
Growth rate (%) 4.14% 7.91% -47.97% 12.56%
Gross profit (VNDbn) 8,438 9,682 8,434 9,743
Gross margin (%) 21.35% 22.70% 38.00% 39.00%
Net profit (VNDbn) 1,991 2,932 2,391 2,794
Growth rate (%) 3.1% 47.3% -18.4% 16.8%
EPS (VND) 4,333 5,521 3,896 4,553
EPS Growth -10.8% 27.4% -29.4% 16.8%
P/E 10.62 8.33 11.00 9.41
Performance
(%) 1M 3M 6M 12M
FPT -5.4% 3.5% -14.5% 2.6%
VNINDEX -3.7% 1.5% -12.4% 15.6%
Nguồn: KBSV
0
2,000,000
4,000,000
6,000,000
8,000,000
10,000,000
12,000,000
0
10,000
20,000
30,000
40,000
50,000
60,000
Lịch sử giá & Khối lượng giao dịch
KLGD Giá

KBSV RESEARCH
2
Table of content
FPT Joint Stock Company (FPT:HOSE) ..................................................................................................................... 1
OVERVIEW ............................................................................................................................................................... 3
Company history .................................................................................................... Error! Bookmark not defined.
Ownership structure .............................................................................................. Error! Bookmark not defined.
Business areas ........................................................................................................ Error! Bookmark not defined.
BUSINESS OPERATION ............................................................................................................................................ 5
Technology ............................................................................................................. Error! Bookmark not defined.
FPT Software ....................................................................................................................................................... 6
FPT IS ................................................................................................................................................................... 7
Telecom .................................................................................................................. Error! Bookmark not defined.
Education................................................................................................................ Error! Bookmark not defined.
Financial Analysis ................................................................................................... Error! Bookmark not defined.
Risks ..................................................................................................................................................................... 12
VALUATION ........................................................................................................................................................... 13
2018 Earnings forecast ........................................................................................... Error! Bookmark not defined.
Valuation ................................................................................................................ Error! Bookmark not defined.
APPENDIX ................................................................................................................. Error! Bookmark not defined.
Financial statement ............................................................................................... Error! Bookmark not defined.
KBSV RESEARCH
3
OVERVIEW
Company history
FPT Joint Stock Company operates in
Information Technology industry
with 3 major business areas: (1)
Technology; (2) Telecom; (3)
Education.
FPT is currently the top enterprise in
the information technology industry
in the country and in the region.
FPT JSC was listed on HSX in
December 2006 (Ticker: FPT).
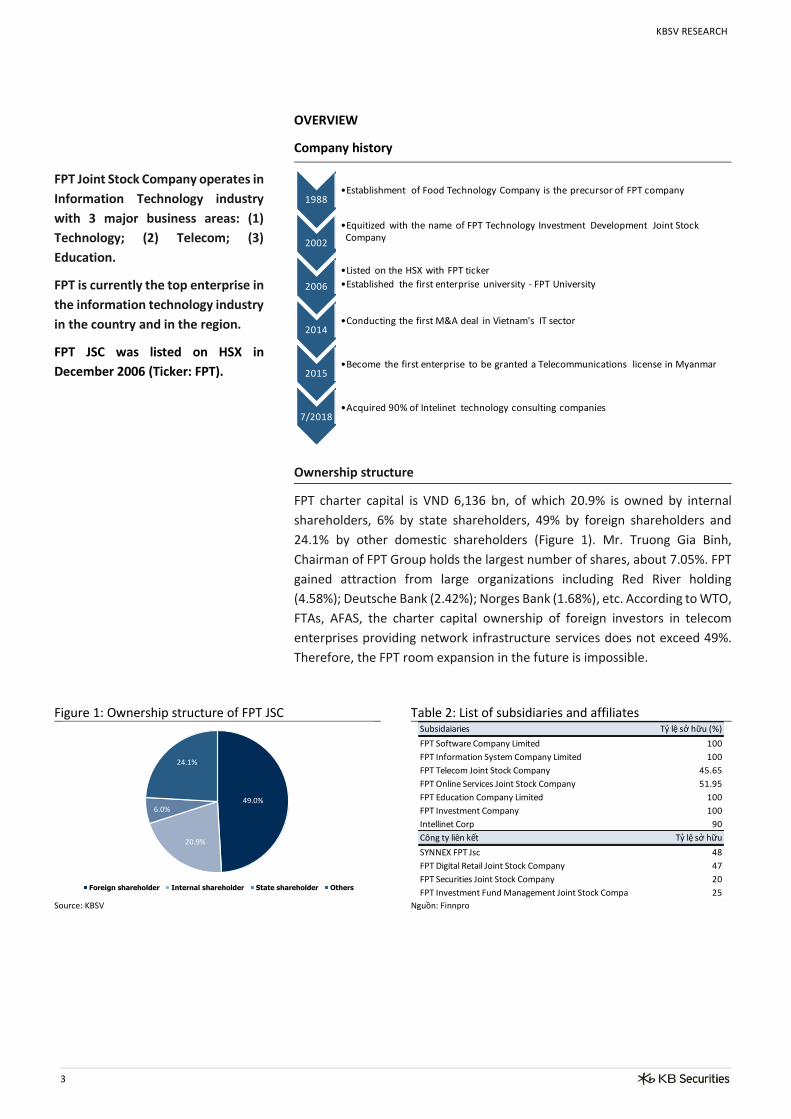
Ownership structure
FPT charter capital is VND 6,136 bn, of which 20.9% is owned by internal
shareholders, 6% by state shareholders, 49% by foreign shareholders and
24.1% by other domestic shareholders (Figure 1). Mr. Truong Gia Binh,
Chairman of FPT Group holds the largest number of shares, about 7.05%. FPT
gained attraction from large organizations including Red River holding
(4.58%); Deutsche Bank (2.42%); Norges Bank (1.68%), etc. According to WTO,
FTAs, AFAS, the charter capital ownership of foreign investors in telecom
enterprises providing network infrastructure services does not exceed 49%.
Therefore, the FPT room expansion in the future is impossible.
Figure 1: Ownership structure of FPT JSC Table 2: List of subsidiaries and affiliates
Source: KBSV Nguồn: Finnpro
1988•Establishment of Food Technology Company is the precursor of FPT company
2002
•Equitized with the name of FPT Technology Investment Development Joint Stock Company
2006
•Listed on the HSX with FPT ticker
•Established the first enterprise university - FPT University
2014•Conducting the first M&A deal in Vietnam's IT sector
2015•Become the first enterprise to be granted a Telecommunications license in Myanmar
7/2018•Acquired 90% of Intelinet technology consulting companies
49.0%
20.9%
6.0%
24.1%
Foreign shareholder Internal shareholder State shareholder Others
Subsidaiaries Tỷ lệ sở hữu (%)
FPT Software Company Limited 100
FPT Information System Company Limited 100
FPT Telecom Joint Stock Company 45.65
FPT Online Services Joint Stock Company 51.95
FPT Education Company Limited 100
FPT Investment Company 100
Intellinet Corp 90
Công ty liên kết Tỷ lệ sở hữu
SYNNEX FPT Jsc 48
FPT Digital Retail Joint Stock Company 47
FPT Securities Joint Stock Company 20
FPT Investment Fund Management Joint Stock Company 25

KBSV RESEARCH
4
Business area
FPT has currently operated in 3
business areas including
Information Technology, Telecom
and Education. Retail and Trading
were divested in 2017.
FPT is the leading enterprise in
information and technology
industry in Vietnam and has its
position in the region.
FPT is the network telecom service provider ranking the second in the country with 29.68% market share in internet service.
FPT University currently has 24,782 students with the employment rate after graduation of 94% in the first 12 months.
FPT currently operates in three main business areas including: (1) Information
Technology; (2) Telecom; (3) Education. Technology accounted for the highest
proportion in revenue and profit, accounting for 56% and 44% respectively,
followed by Telecommunication which contributes 39% to revenue and 47%
to profit. Education added the smallest share with 5% of revenue and 9% of
profit (Figure 3). By the end of 2017, FPT reduced its ownership in FPT Retail
which originally accounted for the largest portion of revenue and FPT’s trading
went down to 47% and 48% respectively to focus on FPT's core areas which
are Technology and Telecom.
With 30-year experience, FPT has always been at the forefront of technology
trends, with two subsidiaries which are FPT Software and FPT IS, FPT is now
the number one company in the information technology industry in Vietnam
and the region, majoring in two main business areas including software export
and information technology solution-services. At present, FPT partners with
550 clients including 64 leading corporations in Fortune 500; providing
solutions and services for 100 banks and financial institutions, 500
government agencies and 200 hospitals.
FPT Telecom operates in three main business areas: (1) Internet
telecommunication services; (2) FPT television services; (3) Digital content
services. With Internet infrastructure spreading across 59 provinces and 4
data centers nationwide, FPT Telecom currently occupies 29.68% of the
market share with a 95.7% brand awareness and trust rate, ranking higher
than Viettel with 11.43% of the market share and only after VNPT with a
market share of 54.6% (Figure 4).
FPT University was founded in 2006, focusing on training majors such as
Journalism & Communication, Language, Business Management, and highly
concenstrate on Information Technology. By the end of 2017, FPT University
was training 24,782 students, with employment rate after graduation of 94%,
which is considerably higher than that of IT departments at other universities.
Moreover, as a subsidiary of Vietnam's leading technology group, software
technology graduates of FPT University have an employment rate of 96%.
Figure 3: Income – profit structure in 2018 Figure 4: Market share – trust rate in technology sector
Source: FPT Source: Brand Strategy and Competitiveness Research Insitute
56%
44%
39%
47%
5%
9%
0% 10% 20% 30% 40% 50% 60% 70% 80% 90% 100%
Revenue
Profit
Technology telecomunication Education
54.6%
29.7%
11.4%
88.0%
89.0%
90.0%
91.0%
92.0%
93.0%
94.0%
95.0%
96.0%
97.0%
98.0%
VNPT FPT Viettel
0.0%
10.0%
20.0%
30.0%
40.0%
50.0%
60.0%
Market share Trust level

KBSV RESEARCH
5
BUSINESS
Technology
The Global Information Technology is expected to develop in the near future.
Revenue and Profit of Technology in 2017 grew 11% and 3% respectively over the same period.
According to Garner's latest forecast, the size of the global IT market in 2018
will be over USD 3.7 trillion, rise 6.2 percent compared to 2017’s (Figure 5).
CompTIA's IT business confidence index reached 70 points by the end of 2017,
which indicates that the world is expecting a prospective period of this
market. In addition, the trend toward software development is taking place
with a two-year CAGR of 7%, in contrast to the saturation of the hardware
production area with a two-year CAGR only at 1.6%. To catch up with the
general trend, FPT has taken development steps and focus its resources on
Information technology, especially software export.
In 2017, FPT's technology area recorded a revenue of VND 11,083 billion, grew
11% yoy, of which revenue from software export reached VND 6,242 billion,
equivalent to 56%, rose by 20% yoy; System integration, software solution and
IT service increased by 1% yoy, reaching 4,841 billion (Figure 7). Overseas
market continued to play a significant role, contributing 62% to total revenue
(Figure 8), CAGR of foreign sales reached 31% per year in the period of 2013-
2017. EBT in 2017 reached 1,131 billion, up 3% yoy, of which software export
accounted for 94%. In the first 6 months of 2018, the impressive growth of IT
sector was recorded at VND 5,457 billion in revenue and VND 592 billion in
EBT, grew 21% and 31% yoy respectively, of which, software export went up
by 23% yoy.
Figure 5: Forecast of the global IT market size Figure 6: Forecast of IT spending in product/service
Source: Gartner Source: Gartner
Figure 7: Technology revenue in 2014-2017 Figure 8: Components of global revenue in Technology
Glob
Source: FPT Annual report Source: FPT Annual report
Data center system Software Device IT Service Communication service
0
200
400
600
800
1000
1200
2015 2016 2017 2018 2019 2020
IT equipment IT Software IT Service
-
1,000
2,000
3,000
4,000
5,000
6,000
7,000
2014 2015 2016 2017
(Billion VND)
Outsource
System integration, software solutions, IT services
4,184 3,871 4,130 4,180 4,212
2,353 3,167
4,475 5,772
6,871
-
2,000
4,000
6,000
8,000
10,000
12,000
2013 2014 2015 2016 2017
Domestic Foreign

KBSV RESEARCH
6
FPT Software
EBT in the first 6 months of 2018 in Offshore software R&D grew 23% yoy thanks to favourable foreign markets. Expectation of a breakthrough in the global market thanks to the acquisition of Intellinet Consulting – the fastest growing technology consulting company in the US.
Competitive advantage due to low labor cost
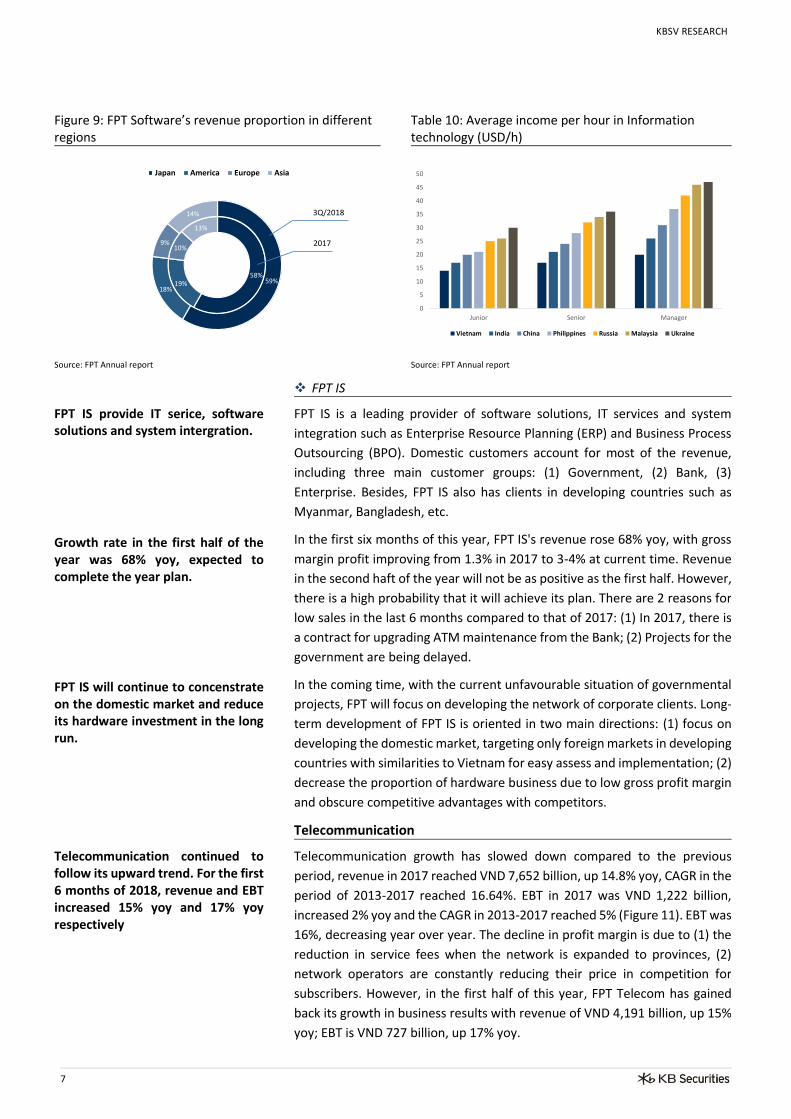
Turnover of offshore software R&D is 100% from overseas market. In the
first six months of 2018, Offshore software R&D continued to grow with
the revenue of VND 3,578 billion, rose 29% yoy and EBT of VND532 billion,
up 23% yoy. Japan is the most important market, contributing 59% of total
revenue, up 29% yoy (Figure 9). In May 2018, FPT Software signed two
large contracts with total value of USD 30 million with ISE Foods and
Toppan Printing in the field of digital conversion. FPT's operations in Japan
are positive with new contracts replacing Chinese companies thanks to the
following reasons: (1) Japan tries to avoid heavy reliance on China as its
biggest software export partner; (2) Chinese companies are withdrawing
to home country due to rising incomes in information technology in China.
The US and European markets contributed 18% and 9% of total revenue
respectively, up 24% and 22% yoy, compared with a 17% and -7% YoY
change in 2017. Noticably, in the Asia Pacific market, revenue increased
40% yoy thanks to strengthened operations in the Australian market. FPT
plans to grow by 25% in each region by 2018.
On July 12, 2018, FPT announced the acquisition of a 90% shares in
Intellinet Consulting, one of the fastest growing technology consulting
firms in the US with a CAGR of 20-25% in the period of 2013-2016.
Intellinet reached USD 30 million in 2017 with more than 150 experienced
consultants and 200 big clients, especially there are many Fortune 500
clients. According to FPT, in the USD 40-50 million transaction, USD 30
million was paid immediately, the rest depends on the business
performance of Intellinet. This is a breakthrough of FPT to provide total
technology services, enhance added value in business orders coupled with
attracting new orders, promoting its operation in the US market and the
global market. FPT expects revenue from the US market in 2018 to reach
VND 100 million, rise from VND 65 million in 2017 thanks to Intellinet's
push.
FPT in particular and IT companies in Vietnam generally have a great
advantage in offshore software R&D in terms of price and labour.
According to Agileengine figures, the average income per hour of junior
and senior staff in Vietnam is USD 14 and USD 20 respectively, which are
much lower than that of competitors such as Malaysia, China and India
(Figure 10). In addition, the income in information technology industry in
Vietnam is relatively high compared to the common level, so the pressure
on rising income is not strong, ensuring the competitiveness in the global
market in medium and long term. On the other hand, although the
competence of FPT personnel is not comparable to other countries in
terms of information technology, the offshore software R&D sector which
does not require advanced skills is not a barrier for FPT in accessing global
partners at present.
KBSV RESEARCH
7
Figure 9: FPT Software’s revenue proportion in different regions
Table 10: Average income per hour in Information technology (USD/h)
Source: FPT Annual report Source: FPT Annual report
FPT IS
FPT IS provide IT serice, software solutions and system intergration.
Growth rate in the first half of the year was 68% yoy, expected to complete the year plan.
FPT IS will continue to concenstrate on the domestic market and reduce its hardware investment in the long run.
FPT IS is a leading provider of software solutions, IT services and system
integration such as Enterprise Resource Planning (ERP) and Business Process
Outsourcing (BPO). Domestic customers account for most of the revenue,
including three main customer groups: (1) Government, (2) Bank, (3)
Enterprise. Besides, FPT IS also has clients in developing countries such as
Myanmar, Bangladesh, etc.
In the first six months of this year, FPT IS's revenue rose 68% yoy, with gross
margin profit improving from 1.3% in 2017 to 3-4% at current time. Revenue
in the second haft of the year will not be as positive as the first half. However,
there is a high probability that it will achieve its plan. There are 2 reasons for
low sales in the last 6 months compared to that of 2017: (1) In 2017, there is
a contract for upgrading ATM maintenance from the Bank; (2) Projects for the
government are being delayed.
In the coming time, with the current unfavourable situation of governmental
projects, FPT will focus on developing the network of corporate clients. Long-
term development of FPT IS is oriented in two main directions: (1) focus on
developing the domestic market, targeting only foreign markets in developing
countries with similarities to Vietnam for easy assess and implementation; (2)
decrease the proportion of hardware business due to low gross profit margin
and obscure competitive advantages with competitors.
Telecommunication
Telecommunication continued to follow its upward trend. For the first 6 months of 2018, revenue and EBT increased 15% yoy and 17% yoy respectively
Telecommunication growth has slowed down compared to the previous
period, revenue in 2017 reached VND 7,652 billion, up 14.8% yoy, CAGR in the
period of 2013-2017 reached 16.64%. EBT in 2017 was VND 1,222 billion,
increased 2% yoy and the CAGR in 2013-2017 reached 5% (Figure 11). EBT was
16%, decreasing year over year. The decline in profit margin is due to (1) the
reduction in service fees when the network is expanded to provinces, (2)
network operators are constantly reducing their price in competition for
subscribers. However, in the first half of this year, FPT Telecom has gained
back its growth in business results with revenue of VND 4,191 billion, up 15%
yoy; EBT is VND 727 billion, up 17% yoy.
58%19%
10%
13%
59%18%
9%
14%
Japan America Europe Asia
3Q/2018
2017
0
5
10
15
20
25
30
35
40
45
50
Junior Senior Manager
Vietnam India China Philippines Russia Malaysia Ukraine
KBSV RESEARCH
8
Internet subscribers remain to grow in 3 to 5 years
Competitive Internet package in high speed segment thanks to technology advantages. The 1 Gbps package has not gain high popularity due to high cost
Pay TV grew 50% yoy in the first half of the year, expecting to break even in 2019
FPT Play is the major area in long-term growth. The profit margin have been improved thanks to reducing contribution in Vietnam Public-Utility Telecommunication Service Fund
According to FPT, in the first 6 months of 2018, revenue from Internet rose by
13% yoy, of which the total subscriber growth was higher than the revenue
growth with the rate of 18%, due to price reduction for subscribers in
provinces. The potential growth of Internet is expected to continue thanks to
these factors: (1) The demand for FTTH fiber network remains to increase.
According to statistics from the Viet Nam Telecommunications Authority,
FTTH subscribers in Vietnam reached 10.61 million, up 39.6% yoy and 5-year
CAGR reached 118% (Figure 13). (2) 45% of the population has not used the
Internet. According to Statisca, the number of Internet users in Vietnam
reached 53.86 million, about 55.5% of the total population of Vietnam (Figure
12). Statisca forecasts that the number of Internet users will reach 59.48
million by 2022. The great market rooms, brand reputation, and new
subscriber growth are main drivers for FPT Telecom's growth in the next 3-5
years.
Thanks to its technological advantages, FPT Telecom now offers very
competitive high speed packages which offer few price differences compared
low speed packages. FPT is the only company in the top 3 offering 45 Mbps
and 55 Mbps packages for individuals and households (Figure 14). In terms of
price, FPT 12-month 45Mbps package is 3.7 million VND, much lower than the
40Mbps package of 12 months of VNPT and Viettel, which are 4.5 million VND
and 4.2 million VND respectively (VAT included and exclusive of frequent
promotional from agents). In addition, in May 2017, FPT officially launched a
1 Gbps - Sóc Internet package targeting at high-income individuals and
households, which is a high-speed package that outperformed all existing
ones. However, this package has not gained popularity due to the cost of 5-7
times higher normal package.
FPT's Pay TV continued to show impressive growth of over 50% yoy in the first
6 months. According to FPT estimations, Pay TV will break even and gain profit
at the end of 2019. Pay-TV market in Vietnam is facing difficulties as providers
have to reduce prices for subscriber growth resulting in profit decline.
However, FPT TV has a several advantages thanks to the integration of online
TV products with the internet to offer customers more choices.
In OTT television, FPT Play, MyK +, Clip TV and Netflix are market leaders in
terms of quality as well as service prices. Investment in OTT is being
considered as a natural trend thanks to the the Internet development, the
popularity of FTTH, and internet mobile which enables young people to use
internet-connected devices instead of traditional TVs. In the early days, FPT
Play, together with other providers accepted loss by reducing price to grow
more subscribers, but they are still struggling with the problem of prevalent
TV piracy. However, with the advantage of resources, technology and brand
awareness, FPT Play is expected to contribute impressively to FPT Telecom's
long-term business results.
On July 16, 2018, the Government approved Decision No. 868/QD-TTG on
reducing contribution to Vietnam Public-Utility Telecommunication
Service Fund from 1.5% to 0.7% of broadband revenue. This decision will help
FPT improve significantly its margins in telecommunication.

KBSV RESEARCH
9
Figure 11: Telecommunication’s earnings in 2013-2017 Figure 12: The number of Internet users (million people)
Source: FPT Source: Statista
Figure 13: FTTH tax growth 2013-2018 Biểu đồ 14: FTTH package price with line speed
Nguồn: Cục Viễn Thông
Nguồn: Bloomberg
Education
FPT University continues to be attractive to students thanks to education quality and the rising of It sector.
Revenue of the education sector in 2017 was VND 1,044 bn, 6% more than expected. The newly recorded student enrolment rate increased by 53% compared to that in 2016, relevant to 12,500 new students of all educational levels. Earnings before taxes reached VND 245 bn. In 2018, FPT expected the number of new students enrolled to rise by 40% based on: (1) Can Tho FPT University has been completely built, and begun to recruit students this year, this new educational institution will attract a large number of students from Southeast provinces, (2) The demand to have a major in information technology will increase because of promising job opportunity and salary. FPT University’s competitive advantage compared to other IT universities such as Hanoi University of Science and Technology and Posts, Telecommunications Institute of Technology, etc. is that students have chance to practice in a real working environment. Branches of FPT University have always been located near FPT Software so that students can work as interns and official staff in their last school year.
0.0%
5.0%
10.0%
15.0%
20.0%
25.0%
30.0%
-
1,000
2,000
3,000
4,000
5,000
6,000
7,000
8,000
9,000
2013 2014 2015 2016 2017
(Tỷ VND)
Revenue Net profit before tax
%
49.7
52.08
53.86
55.1956.24
57.2
58.4859.48
44
46
48
50
52
54
56
58
60
62
2015 2016 2017 2018 2019 2020 2021 2022
0%
50%
100%
150%
200%
250%
300%
-
2,000,000
4,000,000
6,000,000
8,000,000
10,000,000
12,000,000
1/2013 1/2014 1/2015 1/2016 1/2017 1/2018
FTTH Growth
-
1,000
2,000
3,000
4,000
5,000
6,000
25 Mbps 30 Mbps 35 Mbps 40 Mbps 45 Mbps 55 Mbps
FPT VNPT Viettel

KBSV RESEARCH
10
Financial analyzing
In the first six months of 2018, gross margin was improved, reaching 40% thanks to divesment from FPT Retail and Syntex. Revenue and NPAT growth remained healthy. Reliable assets structure with VND 9,000 bn of cash and bank deposits. Loan/ total assets ratio was 47.2%, Current ratio was 1.35.
Net revenue in 2017 was VND 42,569 billion, up 7.91% yoy, this is the fifth
consecutive year of revenue growth since 2012. 10-year CAGR were
12.2%. The gross profit margin in 2017 was 22.7%, up 1.35% compared to
2016’s and 3% compared to 2015’s due to the increase in proportion of
software export. Earning after tax in 2017 reached VND 2,932 billion, rose
by 47.3% yoy thanks to the sharp increase in financial income. 10-year
CAGR of EAT is 14.8%.
Revenue of the first 6 months of 2018 is VND 10,236 billion, increased 19%
in comparable data (combined results of FPT retail and Syntex using the
equity method) and decreased 49% yoy in actual data. Gross profit margin
soared remarkably to 40% because of the absence of FPT Retail and Syntex
which have great revenue but low gross margin. In addition, the cost of
sales dropped substaintially by 37.4% yoy due to a decrease in FPT Retail's
cost of sales. EAT in the first 6 months reached VND 1,103 bn, up 18% yoy.
According to the latest data, revenue of 8 months in 2018 was 14,061
billion, down 49% yoy, EBT was VND 2,340 billion, rose by 17% yoy.
The total assets until the second quarter of 2018 was VND 26,286 bn, increasing by 5.1% compared to early period. Short-term accounts receivables accounted for the largest proportion of current assets, relevant to 32.4%, of which a large amount came from customer accounts receivables and no backlog customer had to pay more than 10% of the total accounts receivable. Short-term financial investment was VND 4,866 bn, stably increasing in the recent years, all of that amount came from bank deposits. Massive amount of cash and bank deposits worth VND 9,000 bn, showing that FPT has a considerable cash amount to make a stable investment in business activities when necessary.
Total assets up to Q2/2018 was VND 26,286 billion, up 5.1%. Short-term
receivables accounted for the largest proportion in short-term asset,
which is 32.4%, the majority from customer receivables, of which there is
no customer outstanding higher than 10% of total receivables. Short-term
financial investment reached 4,866 billion and increased steadily in recent
years, all of them are bank deposits. The amount of cash and deposits in
large banks was nearly 9,000 billion VND, showing that FPT is cash
abundant and able to finance its business activities.
In first half of 2018, FPT's debt / total assets ratio was 47.2%, increased
slightly by 0.2% against 2017 and declined steeply by 14.4% compared to
2016’s. This is due to 2017 reconstructuring and dramatical decline of
short-term and long-term loans. The current and fast payment ratio of FPT
is 1.35 and 1.22, respectively, showing that FPT's asset structure is healthy
and able to pay its debts.

KBSV RESEARCH
11
Figure 15: 2014-2018F Business performance Figure 16: Debt structure and solvency ratio
Nguồn: FPT
Nguồn: FPT
0.0%
5.0%
10.0%
15.0%
20.0%
25.0%
30.0%
35.0%
40.0%
45.0%
-
5,000
10,000
15,000
20,000
25,000
30,000
35,000
40,000
45,000
2014 2015 2016 2017 2018F
Revenue Gross margin Net margin
0.0%
10.0%
20.0%
30.0%
40.0%
50.0%
60.0%
70.0%
-
0.20
0.40
0.60
0.80
1.00
1.20
1.40
1.60
2013 2014 2015 2016 2017
Current ratio Quick ratio Debt/Total Asset

KBSV RESEARCH
12
Risks
Fierce competition in Telecom sector
Staff low competency as compared to the world standards leading to potential risks
FPT business activities growth was supposed to remain positive in the next three to five years, short-term risks would hardly incur thanks to large existing market. In the long term, FPT may have to face the two main risks: Regarding to long-term Internet sector affected from increasing subscribers, telecommunication companies would provide package discounts to enhance competitiveness, which raises subscribers, but decreases profit, adversely affecting profit growth. Changing entertainment consumption habits of customers and competitive challenges from the world famous enterprises such as Netflix, Youtube, Facebook, etc. or other Vietnam large companies like VNPT, Viettel, etc. cause many difficulties to business activities of FPT TV and FPT Play. We strongly believe that FPT software processing activities will become the main drive of FPT development in the upcoming period. However, FPT staff’s low competency compared to other technology companies in the world remains potential risks in the long term. Up to present, FPT has just participated in processing stages whose insignificant surplus value and a few barriers to entry. In case of losing competitive advantage of cheap labor price, FPT would have to face many difficulties in searching for new agreements. Furthermore, in the non-stop developing technology industry of the world, FPT business growth would have to cope with numerous impediments unless the staff quality were improved to approach and create products with high surplus value.

KBSV RESEARCH
13
FPT NPAT in 2018 was expected to be VND 2,391 bn, down by 18.45% yoy, EPS forward was VND 3,896/share.
VALUATION
2018 Earning forecast
In 2018, FPT revenue was forecasted to reach VND 22,194 bn, decreasing by 47.97% yoy if compared in real statistics, increasing by 20.3% yoy if compared relatively based on: Revenue of technology sector went up by 11.7% yoy, and gained VND 12,380 bn, of which software export sector continued to play a vital role in purchase orders from Japan and the U.S. This sector achieved 20% yoy increase, while Hardware and Services ground to a standstill, only up by 1% yoy resulting from businesses’ orientation.
Revenue of Telecom sector was expected to reach VND 8,610 bn,
increasing 12.5% yoy, of which Telecom services kept increasing by 13%
yoy thanks to positive outlook of boosting FTTH, Pay TV và FPT Play
subscribers; Digital content climbed by 6% yoy.
Revenue from education was VND 1,204 bn, increasing by 15.3% yoy with
high expectation of new student enrolment growth in the next
September.
Gross margin was projected to be 38%, significantly improved compared
to previous years, and fluctuated around 20%-22% as in 2017, FPT sold
FPT Retail and Trading and converted them into FPT affiliates which were
the two main sources of revenue but had extremely low margin of 12-
13%.
Cost of goods sold were expected to fell sharply by 44.8% yoy as there
was no extra cost spent for FPT Retail. Projected total COGS and
enterprise management/ revenue was 24.2%.
It was supposed that revenue gained from FPT Retail and FPT Syntex reach
VND 431 bn.
Earnings before taxes was expected to be VND 3,471 bn, reducing by 18.4% yoy, accomplish the planned targets in early year. NPAT of the parent company was VND 2,391, decreasing 18.45% yoy, EPS was expected to gain VND 3,896/ share. In 2019, FPT revenue and NPAT was supposed to achieve VND 24,982 bn, increasing by 12.6% yoy and 16.9% yoy respectively if FPT activities had healthy development as in 2018. EPS forward 2019 was VND 4,553/ share.
KBSV RESEARCH
14
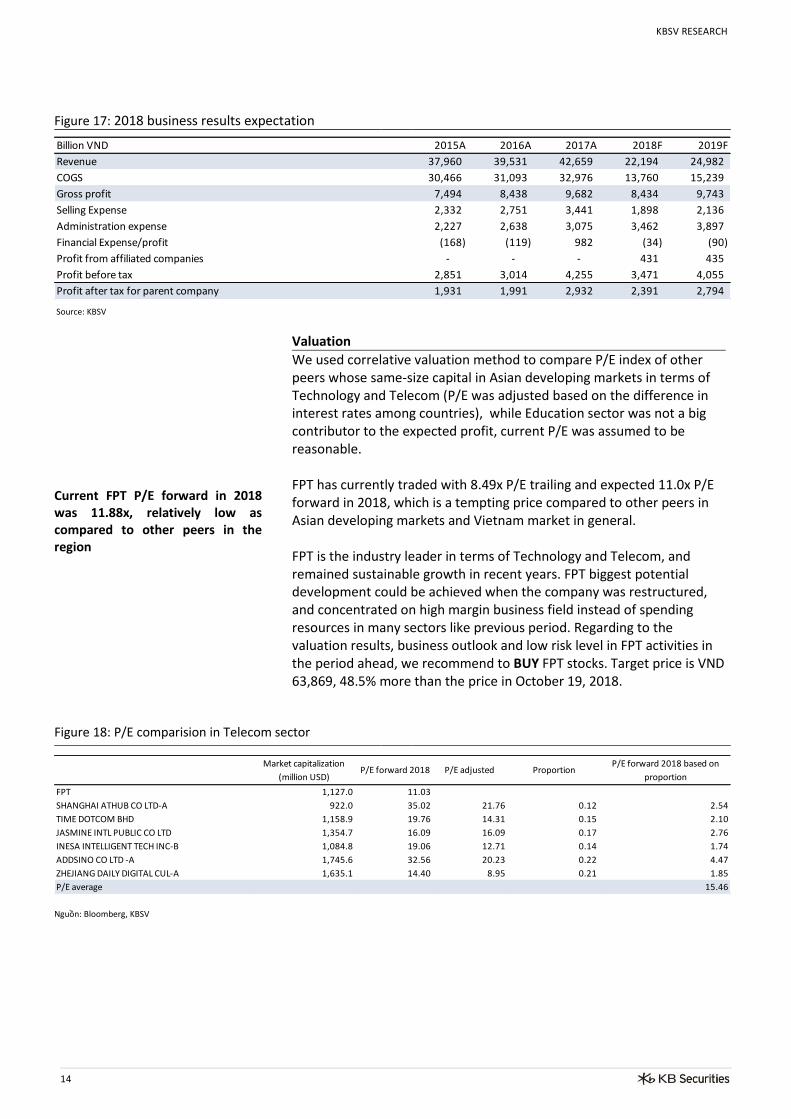
Figure 17: 2018 business results expectation
Source: KBSV
Valuation
Current FPT P/E forward in 2018 was 11.88x, relatively low as compared to other peers in the region
We used correlative valuation method to compare P/E index of other peers whose same-size capital in Asian developing markets in terms of Technology and Telecom (P/E was adjusted based on the difference in interest rates among countries), while Education sector was not a big contributor to the expected profit, current P/E was assumed to be reasonable. FPT has currently traded with 8.49x P/E trailing and expected 11.0x P/E forward in 2018, which is a tempting price compared to other peers in Asian developing markets and Vietnam market in general. FPT is the industry leader in terms of Technology and Telecom, and remained sustainable growth in recent years. FPT biggest potential development could be achieved when the company was restructured, and concentrated on high margin business field instead of spending resources in many sectors like previous period. Regarding to the valuation results, business outlook and low risk level in FPT activities in the period ahead, we recommend to BUY FPT stocks. Target price is VND 63,869, 48.5% more than the price in October 19, 2018.
Figure 18: P/E comparision in Telecom sector
Nguồn: Bloomberg, KBSV
Billion VND 2015A 2016A 2017A 2018F 2019F
Revenue 37,960 39,531 42,659 22,194 24,982
COGS 30,466 31,093 32,976 13,760 15,239
Gross profit 7,494 8,438 9,682 8,434 9,743
Selling Expense 2,332 2,751 3,441 1,898 2,136
Administration expense 2,227 2,638 3,075 3,462 3,897
Financial Expense/profit (168) (119) 982 (34) (90)
Profit from affiliated companies - - - 431 435
Profit before tax 2,851 3,014 4,255 3,471 4,055
Profit after tax for parent company 1,931 1,991 2,932 2,391 2,794
Market capitalization
(million USD)P/E forward 2018 P/E adjusted Proportion
P/E forward 2018 based on
proportion
FPT 1,127.0 11.03
SHANGHAI ATHUB CO LTD-A 922.0 35.02 21.76 0.12 2.54
TIME DOTCOM BHD 1,158.9 19.76 14.31 0.15 2.10
JASMINE INTL PUBLIC CO LTD 1,354.7 16.09 16.09 0.17 2.76
INESA INTELLIGENT TECH INC-B 1,084.8 19.06 12.71 0.14 1.74
ADDSINO CO LTD -A 1,745.6 32.56 20.23 0.22 4.47
ZHEJIANG DAILY DIGITAL CUL-A 1,635.1 14.40 8.95 0.21 1.85
P/E average 15.46

KBSV RESEARCH
15
Figure 19: P/E comparision in Technology sector
Nguồn: Bloomberg, KBSV
Firgure 20: FPT Valuation
Nguồn: KBSV
Vốn hóa thị
trường(million USD)
P/E dự phóng
2018P/E điều chỉnh tỷ trọng
P/E dự phóng 2018 theo tỷ
trọng
FPT 1,127.0 11.03
SHENZHEN DAS INTELLITECH-A 1,047.9 23.87 12.73 6.3% 0.80
NIIT TECHNOLOGIES LTD 954.0 24.65 25.47 5.7% 1.45
SHENZHEN KINGDOM SCI-TECH-A 1,178.2 43.46 14.06 7.0% 0.99
BEIJING PHILISENSE TECHNOL-A 1,132.8 17.94 8.65 6.8% 0.59
TATA ELXSI LTD 1,014.4 30.70 33.34 6.1% 2.02
BEIJING TEAMSUN TECHNOLOGY-A 1,177.7 89.24 24.04 7.0% 1.69
IREADER TECHNOLOGY CO LTD-A 1,292.2 67.18 30.68 7.7% 2.37
HANGZHOU LIANLUO INTERACT-A 1,579.1 56.46 34.45 9.4% 3.25
CHINASOFT INTERNATIONAL LTD 1,619.8 16.27 11.10 9.7% 1.07
HISENSE ELECTRIC CO LTD-A 1,892.4 14.56 6.61 11.3% 0.75
BEYONDSOFT CORP-A 596.0 18.02 9.15 3.6% 0.33
HWA CREATE CO LTD-A 680.8 63.11 14.42 4.1% 0.59
SHENZHEN SUNWIN INTELLIGEN-A 731.0 21.58 11.15 4.4% 0.49
INSPUR SOFTWARE CO LTD-A 862.6 42.95 16.73 5.1% 0.86
GCI SCIENCE & TECHNOLOGY-A 993.3 31.00 18.31 5.9% 1.09
P/E trung bình 18.31
P/E current P/E sector average 2018 profit cotribution 2018P/e dự forward 2018 based
on profit contributiontargeted price
Technology 18.31 44% 8.06 31,388
Communicationi 15.46 47% 7.27 28,316
Education 11.88 9% 1.07 4,166
Tổng 16.39 63,869

KBSV RESEARCH
16
APPENDIX Financial statement
Business performance Accounting balance sheet
Cash flow statement
Source: Fiinpro
Financial targets
Source: Fiinpro
Billion VNĐ 2015 2016 2017 6T/2018
Sales 38,707 40,447 43,298 10,236
Sales deductions -747 -916 -640 -11
Net sales 37,960 39,531 42,659 10,225
Cost of sales -30,466 -31,093 -32,976 -6,369
Gross Profit 7,494 8,438 9,682 3,856
Financial income 453 575 1,583 266
Financial expenses -620 -694 -601 -212
of which: interest expenses -263 -374 -369 -102
Gain/(loss) from joint ventures (from 2015) 34 35 71 216
Selling expenses -2,227 -2,638 -3,075 -875
General and admin expenses -2,332 -2,751 -3,441 -1,600
Operating profit/(loss) 2,802 2,964 4,220 1,651
Other incomes 147 100 102 61
Other expenses -97 -50 -67 -25
Net other income/(expenses) 49 50 35 36
Income from investments in other entities 0 0 0 0
Net accounting profit/(loss) before tax 2,851 3,014 4,255 1,687
Corporate income tax - current -497 -425 -698 -253
Corporate income tax - deferred 84 -13 -29 -22
Corporate income tax expenses -413 -438 -727 -275
Net profit/(loss) after tax 2,438 2,576 3,528 1,412
Minority interests 507 585 597 309
Attributable to parent company 1,931 1,991 2,932 1,103
Billion VND 2015 2016 2017 Q2/2018
CURRENT ASSETS 18,959 21,909 16,060 16,758
Cash and cash equivalents 3,585 6,013 3,481 4,060
Cash 1,879 2,708 1,886 2,415
Cash equivalents 1,705 3,305 1,594 1,645
Short-term investments 2,617 3,472 4,379 4,866
Held-to-maturity investment 2,617 3,472 4,379 4,866
Accounts receivable 5,534 6,640 6,152 5,430
Trade accounts receivable 4,477 4,814 5,038 4,227
Inventories 5,268 4,554 1,020 1,276
Other current assets 1,955 1,229 1,028 1,126
Short-term prepaid expenses 830 701 760 941
VAT to be claimed 1,106 405 156 147
Other taxes receivable 19 123 112 37
LONG-TERM ASSETS 7,087 7,925 8,940 9,528
Long-term trade receivables 349 381 232 246
Fixed assets 4,292 4,590 5,247 5,419
Tangible fixed assets 3,971 4,131 4,585 4,583
Intangible fixed assets 319 456 658 832
Long-term incomplete assets 693 1,021 806 975
Long-term investments 728 826 1,783 1,925
Investments in associates 271 290 1,334 1,498
Other long-term investments 633 757 749 749
Provision for long-term investments -176 -221 -300 -322
Other long-term assets 1,025 1,106 872 962
TOTAL ASSETS 26,046 29,833 25,000 26,286
LIABILITIES 15,863 18,385 11,761 12,401
Current liabilities 14,968 17,430 11,100 11,902
Trade accounts payable 2,815 3,757 2,279 1,618
Advances from customers 297 582 561 576
Taxes and other payable to State Budget 318 342 320 244
Payable to employees 694 827 830 718
Accrued expenses 519 603 918 969
Construction contract in progress payables 13 19 20 23
Short-term unrealized revenue 1,492 1,242 1,294 1,330
Other payables 302 524 439 273
Short-term borrowings 8,191 9,207 4,117 5,972
Provision for ST liabilities 17 8 6 5
Bonus and welfare funds 309 319 314 174
Long-term liabilities 896 956 661 499
Long-term advances from customers 54 54 40 0
Unrealized revenue 35 12 48 83
Other long-term payables 185 149 2 8
Long-term borrowings 614 733 565 405
Deferred income tax liabilities 0 2 3 0
Provision for long-term liabilities 7 6 3 3
Technology-science development fund 0 0 0 0
OWNER'S EQUITY 10,182 11,448 13,238 13,886
Capital and reserves 10,180 11,445 13,236 13,883
Paid-in capital 3,975 4,594 5,310 6,136
Share premium 49 49 49 49
Investment and development funds 79 127 171 167
Other funds 87 87 87 87
Undistributed earnings 4,395 4,614 5,511 4,671
Minority interests 1,601 1,923 1,809 2,124
TOTAL RESOURCES 26,046 29,833 25,000 26,286
Billion VNĐ 2015 2016 2017 Q2/2018
Net profit/(loss) before tax 2,851.15 3,013.90 4,255.12 906.31
Depreciation and amortisation 732.88 933.44 1,039.42 286.03
Amortisation of goodwill 0.00 0.00 0.00 0.00
Provisions 94.01 110.60 184.57 28.00
Unrealised foreign exchange gain/loss -3.15 16.02 -18.95 -34.39
Profit/loss from liquidating fixed assets 0.00 0.00 0.00 0.00
Profit/loss from investing activities -318.81 -351.18 -1,330.95 -208.22
Interest expense 262.50 374.19 368.55 55.09
Operating profit/(loss) before changes in Working Capital 3,618.58 4,096.96 4,497.74 1,032.82
(Increase)/decrease in receivables -863.52 -514.70 -2,311.60 182.89
(Increase)/decrease in inventories -693.10 714.10 -617.89 -19.21
Increase/(decrease) in payables 395.16 1,123.67 1,709.30 483.24
(Increase)/decrease in prepaid expenses -526.46 14.76 -143.62 -94.12
Interest paid -211.92 -359.77 -386.41 -49.02
Corporate Income Tax paid -438.29 -531.44 -493.64 -27.35
Other receipts from operating activities -124.56 -231.93 -265.69 -55.55
Net cash inflows/(outflows) from operating activities 1,155.89 4,311.66 1,988.18 1,453.70
Purchases of fixed assets and other long term assets -2,090.20 -1,433.11 -1,104.37 -658.37
Proceeds from disposal of fixed assets 115.91 4.64 3.87 0.42
Loans granted, purchases of debt instruments -1,218.53 -912.25 -942.51 420.15
Collection of loans, proceeds from sales of debts instruments 0.00 0.00 0.00 -485.88
Investments in other entities 0.00 -314.07 0.00 -79.53
Proceeds from divestment in other entities 65.35 322.22 -973.83 165.90
Dividends and interest received 226.57 308.77 408.06 98.07
Net cash inflows/(outflows) from investing activities -2,900.91 -2,023.81 -2,608.78 -539.24
Proceeds from issue of shares 30.95 66.58 39.14 26.55
Payments for share returns and repurchases -4.35 -0.88 -0.13 0.00
Proceeds from borrowings 23,921.46 22,299.13 21,302.57 2,920.83
Repayment of borrowings -21,980.61 -21,165.45 -21,923.25 -2,078.48
Dividends paid -974.00 -1,058.58 -1,330.43 -799.40
Interests, dividends, profits received 0.00 0.00 0.00 0.00
Net cash inflows/(outflows) from financing activities 993.45 140.80 -1,912.10 69.49
Net increase in cash and cash equivalents -751.57 2,428.65 -2,532.70 983.95
Cash and cash equivalents at the beginning o period 4,336.28 3,584.71 6,013.36 3,076.14
Effect of foreign exchange differences 0.00 0.00 0.00 0.00
Cash and cash equivalents at the end of period 3,584.71 6,013.36 3,480.66 4,060.09
2013 2014 2015 2016 2017 TTM Q2/2018
Current ratio 1.42 1.29 1.27 1.26 1.45 1.41
Debt/Total Asset 0.53 0.59 0.61 0.62 0.47 0.47
EBIT 2,336.07 2,334.67 2,935.16 3,048.52 3,166.64 3,094.28
EBITDA 2,779.06 2,881.94 3,668.04 3,981.96 4,206.06 4,203.14
Gross margin 20.49% 18.96% 19.74% 21.35% 22.70% 27.19%
Net Margin 7.64% 6.37% 6.42% 6.52% 8.27% 11.10%
Asset Turnover 1.70 1.62 1.56 1.41 1.56 1.27
Equity Turnover 4.04 3.96 3.91 3.66 3.46 2.48
ROE% 24.01% 19.82% 19.87% 18.41% 23.75% 22.98%
ROA% 10.12% 8.11% 7.93% 7.12% 10.69% 11.72%
Receiveable turnover 7.87 8.10 8.55 8.09 8.32 6.78
Inventory turnover 7.09 6.61 6.10 6.25 11.69 12.35
Payable turnover 10.72 10.14 10.44 9.46 10.93 11.06
P/E 7.87 9.69 10.50 10.62 8.33 9.06
P/B 1.76 2.00 2.13 2.22 2.14 2.40

KBSV RESEARCH
17
Investment portforlio recommendations
Buy: +15% or more
Take profit: trong khoảng +15% và -15%
Sell: -15% or less
DISCLAIMER
Opinions in this report reflect professional judgment at this date based on information and data obtained from sources KBSV considers reliable. However, KBSV does not guarantee that the information and data are accurate or complete, and, therefore, this report is subject to change without prior notice. Individual investments should be made based on each client’s own judgment and we expressly disclaim all liabilities for any investment decisions and any results thereof. This report is a copyrighted material of KBSV and, thus, it may not be reproduced, distributed, or modified without the prior consent of KB Securities. This report is not prepared for academic purposes and any third party wishing to quote from it for academic publications should receive the prior consent of KBSV. KB SECURITIES VIETNAM (KBSV) Head Office: Floor 1&3, Sky City Tower, 88 Lang Ha Street, Dong Da District, Ha Noi, Vietnam Tel: (84) 24 7303 5333 - Fax: (84) 24 3776 5928 Ha Noi Branch Floor 9, TNR Tower Hoan Kiem, 115 Tran Hung Dao Street Hoan Kiem District, Ha Noi, Vietnam Tel: (84) 24 3776 5929 - Fax: (84) 24 3822 3131 Ho Chi Minh City Branch Floor 2, TNR Tower Nguyen Cong Tru, 180-192 Nguyen Cong Tru Street, District 1, HCMC, Vietnam Tel: (84) 28 7303 5333 - Fax: (84) 28 3914 1969 CONTACT INFORMATION
Institutional Client Center: (84) 28 7303 5333 - Ext: 2556 Private Customer Care Center: (84) 24 7303 5333 - Ext: 2276 Hotmail: [email protected]
Website: www.kbsec.com.vn


