SD APPENDIX F - Entry and Advancement
30
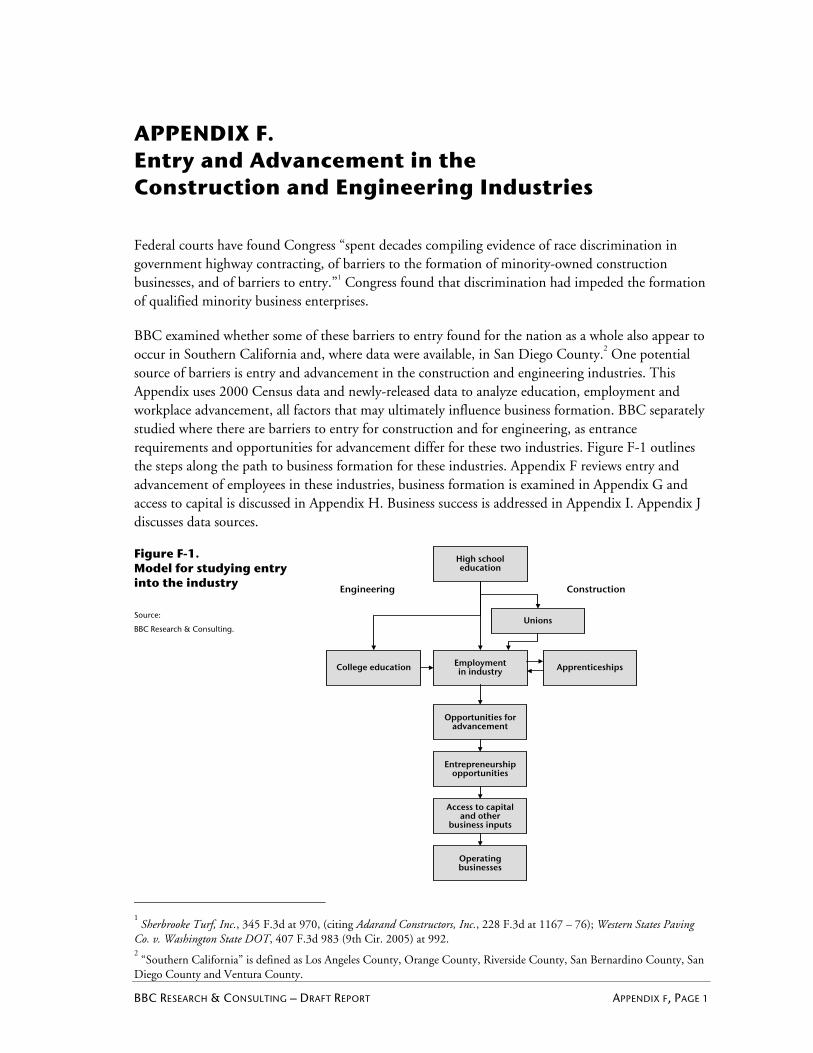
BBC RESEARCH & CONSULTING – DRAFT REPORT APPENDIX F, PAGE 1 APPENDIX F. Entry and Advancement in the Construction and Engineering Industries Federal courts have found Congress “spent decades compiling evidence of race discrimination in government highway contracting, of barriers to the formation of minority-owned construction businesses, and of barriers to entry.” 1 Congress found that discrimination had impeded the formation of qualified minority business enterprises. BBC examined whether some of these barriers to entry found for the nation as a whole also appear to occur in Southern California and, where data were available, in San Diego County. 2 One potential source of barriers is entry and advancement in the construction and engineering industries. This Appendix uses 2000 Census data and newly-released data to analyze education, employment and workplace advancement, all factors that may ultimately influence business formation. BBC separately studied where there are barriers to entry for construction and for engineering, as entrance requirements and opportunities for advancement differ for these two industries. Figure F-1 outlines the steps along the path to business formation for these industries. Appendix F reviews entry and advancement of employees in these industries, business formation is examined in Appendix G and access to capital is discussed in Appendix H. Business success is addressed in Appendix I. Appendix J discusses data sources. Figure F-1. Model for studying entry into the industry Source: BBC Research & Consulting. 1 Sherbrooke Turf, Inc., 345 F.3d at 970, (citing Adarand Constructors, Inc., 228 F.3d at 1167 – 76); Western States Paving Co. v. Washington State DOT, 407 F.3d 983 (9th Cir. 2005) at 992. 2 “Southern California” is defined as Los Angeles County, Orange County, Riverside County, San Bernardino County, San Diego County and Ventura County. High school education College education Employment in industry Apprenticeships Unions Opportunities for advancement Entrepreneurship opportunities Engineering Construction Access to capital and other business inputs Operating businesses
Transcript of SD APPENDIX F - Entry and Advancement
BBC RESEARCH & CONSULTING – DRAFT REPORT APPENDIX F, PAGE 1
APPENDIX F. Entry and Advancement in the Construction and Engineering Industries
Federal courts have found Congress “spent decades compiling evidence of race discrimination in government highway contracting, of barriers to the formation of minority-owned construction businesses, and of barriers to entry.”1 Congress found that discrimination had impeded the formation of qualified minority business enterprises.
BBC examined whether some of these barriers to entry found for the nation as a whole also appear to occur in Southern California and, where data were available, in San Diego County.2 One potential source of barriers is entry and advancement in the construction and engineering industries. This Appendix uses 2000 Census data and newly-released data to analyze education, employment and workplace advancement, all factors that may ultimately influence business formation. BBC separately studied where there are barriers to entry for construction and for engineering, as entrance requirements and opportunities for advancement differ for these two industries. Figure F-1 outlines the steps along the path to business formation for these industries. Appendix F reviews entry and advancement of employees in these industries, business formation is examined in Appendix G and access to capital is discussed in Appendix H. Business success is addressed in Appendix I. Appendix J discusses data sources.
Figure F-1. Model for studying entry into the industry
Source:
BBC Research & Consulting.
1 Sherbrooke Turf, Inc., 345 F.3d at 970, (citing Adarand Constructors, Inc., 228 F.3d at 1167 – 76); Western States Paving
Co. v. Washington State DOT, 407 F.3d 983 (9th Cir. 2005) at 992. 2 “Southern California” is defined as Los Angeles County, Orange County, Riverside County, San Bernardino County, San
Diego County and Ventura County.
High school education
College education Employment in industry Apprenticeships
Unions
Opportunities for advancement
Entrepreneurship opportunities
Engineering Construction
Access to capital and other
business inputs
Operating businesses

BBC RESEARCH & CONSULTING – DRAFT REPORT APPENDIX F, PAGE 2
Education and Training
Education is considered an important factor for entry into the workforce. A four-year college degree in engineering is an important qualification in that industry. Barriers to such education may affect employment and ultimately advancement and business ownership. Greater barriers for minorities and women could, in part, explain relative differences in business ownership by race/ethnicity and gender.3
Formal education beyond high school is not a prerequisite for most construction industry jobs.4 For this reason, the construction industry often attracts individuals who do not have a high level of educational attainment.
Construction. Many construction industry employees in Southern California have at most a high school education. Based on the 2000 Census of Population, 27 percent of workers in construction were just high school graduates and 37 percent had not finished high school. According to the U.S. Bureau of the Census 2007 American Community Survey (ACS) this trend in Southern California continued through 2007, with 33 percent of construction workers just high school graduates and 33 percent with no high school diploma. Of people working in construction in Southern California, 9 percent in 2000 and 10 percent in 2007 had at least a four-year college degree.
In the Southern California workforce, African Americans and Hispanic Americans represent a relatively large share of workers with just a high school education. In 2000, 70 percent of Hispanic Americans and 34 percent of African American workers 25 and older had no college education at all, compared to 23 percent of non-Hispanic whites. Although the percentage of workers with no college education declined for many race/ethnicity groups between 2000 and 2007, percentages for African Americans and Hispanic Americans were still substantially higher than those for non-Hispanic whites in 2007.
Based on education requirements of entry level jobs and the limited education beyond high school for many African Americans and Hispanic Americans in Southern California, one would expect a relatively high representation of these minority groups in the Southern California construction industry, especially in entry-level positions.
Training is largely on-the-job and through trade schools and apprenticeship programs. Entry level jobs for workers out of high school are often laborers, helpers or apprentices. More skilled positions in the construction industry may require additional training through a technical or trade school or through an apprenticeship or other employer-provided training program. Apprenticeship programs can be developed by employers, trade associations, trade unions and other groups. Workers can enter apprenticeship programs from high school or a trade school. Apprenticeships have traditionally been three- to five-year programs that combine on-the-job training with classroom instruction.5
Opportunities for these programs across race/ethnicity are discussed later in this appendix.
3 Feagin, Joe R. and Nikitah Imani. 1994. “Racial Barriers to African American Entrepreneurship: An Exploratory Study.”
Social Problems. 42 (4): 562-584. 4 Educational attainment of San Diego County workers is very similar to Southern California as a whole — 57 percent had
no more than a high school education in 2000 and 55 percent had no more than a high school education in 2007. 5 Bureau of Labor Statistics, U.S. Department of Labor. 2006-07. “Construction.” Career Guide to Industries.
http://www.bls.gov/oco/cg/cgs003.htm (accessed February 15, 2007).

BBC RESEARCH & CONSULTING – DRAFT REPORT APPENDIX F, PAGE 3
In contrast, among workers 25 and older in Southern California, 46 percent of Asian-Pacific Americans and 68 percent of Subcontinent Asian Americans had four-year college degrees in 2000. Given high educational levels of Asian-Pacific Americans and Subcontinent Asian Americans in California, representation of these groups in construction might be low relative to non-Hispanic whites.
In Southern California, women workers age 25 or over have more education, on average, then men. Based on 2000 data, 38 percent of female workers age 25 and over had no college education at all, compared to 42 percent of males in Southern California. In San Diego County, 30 percent of female and 33 percent of male workers age 25 or over had only a high school education in 2000. These differences increased slightly in both San Diego County and Southern California between 2000 and 2007.
Engineering. Based on Census data for 2000, 45 percent of individuals working in the engineering industry in San Diego County had at least a four-year college degree, the same percentage as in all of Southern California. When only examining people who work as civil, mining, geological and environmental engineers, the percentage is even greater — 82 percent had at least a four-year college degree in San Diego County.
The level of education needed to become an engineer is a barrier for African Americans, Hispanic Americans and Native Americans. Very few Hispanic Americans and relatively few African Americans and Native Americans working in Southern California had a degree from a four-year college in either 2000 or 2007.
Figure F-2 examines the percentage of workers 25 and older who had at least a four-year degree, across all industries in San Diego County, Southern California and the United States in 2000 and 2007. In San Diego County in 2007, only 15 percent of Hispanic American workers 25 and older had a college degree, much lower than the 46 percent of non-Hispanic white workers in this age group. About 23 percent of African American workers and 28 percent of Native American workers in San Diego County had college degrees in 2007. Disparities in educational attainment were similar for all of Southern California.
Most race/ethnicity groups showed an increase in the proportion of workers with degrees from 2000 to 2007, with the proportion growing fastest among minorities. However, the percentage of Hispanic Americans, African Americans and Native Americans who had college degrees was still considerably smaller than that of non-Hispanic whites in 2007. In contrast, relatively more Asian-Pacific Americans and Subcontinent Asian Americans had college degrees than non-Hispanic whites in 2007. Between 2000 and 2007, the percentage of female workers with college degrees surpassed that of males in San Diego County, Southern California and the United States.

BBC RESEARCH & CONSULTING – DRAFT REPORT APPENDIX F, PAGE 4
Figure F-2. Percentage of all workers 25 and older with at least a four-year degree in San Diego County, Southern California and the United States, 2000 and 2007.
Note:
** Denotes that the difference in proportions between the minority and non-Hispanic white groups (or female and male gender groups) for the given Census/ACS year is statistically significant at the 95% confidence level.
Source:
BBC Research & Consulting from 2000 U.S. Census 5% sample and 2007 ACS Public Use Micro-sample data. The raw data extracts were obtained through the IPUMS program of the MN Population Center: http://usa.ipums.org/usa/.
San Diego County
Race/ethnicity
African American 18.4 % ** 23.3 % **
Asian-Pacific American 39.6 49.4 **
Subcontinent Asian American 73.2 ** 88.3 **
Hispanic American 12.8 ** 15.2 **
Native American 21.0 ** 28.1 **
Other minority group 35.1 ** 34.2
Non-Hispanic white 40.2 45.8
Gender
Female 32.7 % 37.8 %
Male 32.9 36.7
Southern California
Race/ethnicity
African American 21.5 % ** 27.4 % **
Asian-Pacific American 46.0 ** 51.6 **
Subcontinent Asian American 67.6 ** 75.5 **
Hispanic American 8.5 ** 11.4 **
Native American 20.0 ** 23.2 **
Other minority group 32.8 ** 36.0 **
Non-Hispanic white 38.8 44.1
Gender
Female 28.3 % 32.7 % **
Male 28.5 30.7
United States
Race/ethnicity
African American 17.4 % ** 20.8 % **
Asian-Pacific American 43.6 ** 48.1 **
Subcontinent Asian American 67.1 ** 72.3 **
Hispanic American 12.1 ** 14.3 **
Native American 15.8 ** 17.7 **
Other minority group 29.3 ** 29.6 **
Non-Hispanic white 31.5 35.0
Gender
Female 28.2 % ** 32.3 % **
Male 28.7 30.3
2000 2007
2007
20072000
2000

BBC RESEARCH & CONSULTING – DRAFT REPORT APPENDIX F, PAGE 5
Additional indices of high school educational attainment. Because of the importance of college admission as a step in entering the engineering industry, the study team examined additional information on the educational achievement of minority high school students in Southern California. The California Legislative Black Caucus published a report in early 2007 that included indices of high school achievement for African Americans, Asian Americans, Hispanic Americans and non-Hispanic whites in the San Diego and Los Angeles metropolitan areas. BBC translated the reported statistics into indices where 100 is the value for non-Hispanic white students. Figures lower than 100 indicate a lower rate for minority students.
For example, only 23.5 percent of African American students in San Diego County had completed necessary courses for admission to a University of California (UC) or California State University (CSU) school in 2004-2005. This was far below the rate for non-Hispanic white students (46.7%). BBC created an “index” for African American student achievement for completion of necessary courses by dividing 23.5 percent by 46.7 percent, and then multiplying by 100, yielding an index value of “50.” Hispanic American students in the San Diego area had an achievement index of 47 when compared with non-Hispanic white students completing courses for UC/CSU entrance.
As shown in Figure F-3, high school achievement indices ranged from 50 to 96 for African American students in San Diego County. The range for Hispanic Americans in San Diego County was from 47 to 96.
Figure F-3. Indices of high school achievement for African Americans, Asian Americans, Hispanic Americans and non-Hispanic whites in San Diego and Los Angeles metropolitan areas, 2004-2005 (white=100)
San Diego Metropolitan Area
Completed courses for UC/CSU entrance 2004-2005 50 267 47 100
CAT/6 reading scores (11th Grade) 96 104 96 100
High school exit exam passing rate: English 64 161 64 100
High school exit exam passing rate: math 72 148 63 100
SAT average score 82 94 85 100
High school dropouts: 1 year rate 443 53 286 100
High school dropouts: 4 year rate 436 52 288 100
Los Angeles Metropolitan Area
Completed courses for UC/CSU entrance 2004-2005 75 144 71 100
CAT/6 reading scores (11th Grade) 95 100 95 100
High school exit exam passing rate: English 64 100 63 100
High school exit exam passing rate: math 44 112 49 100
SAT average score 77 100 81 100
High school dropouts: 1 year rate 343 76 281 100
High school dropouts: 4 year rate 327 74 281 100
Non-HispanicAmerican American American whiteAfrican Asian Hispanic
African Asian Hispanic Non-HispanicAmerican American American white
Note: Data for completed courses for UC/CSU entrance were for 2004-2005. Dates not provided in source for other educational statistics.
Source: BBC Research & Consulting from California Legislative Black Caucus. 2007. The State of Black California, Full Report, Sacramento.

BBC RESEARCH & CONSULTING – DRAFT REPORT APPENDIX F, PAGE 6
Notable indices for African Americans included:
Passing the high school exit exam for English at a rate roughly two-thirds that of non-Hispanic white students in San Diego County; and
Having a high school dropout rate more than four times higher than that of non-Hispanic white students in San Diego County.
The achievement index with the least disparity between African Americans and non-Hispanic whites in both metropolitan areas was reading scores from the standardized achievement test administered to students in the 11th grade.
Hispanic American students in both the San Diego and Los Angeles metropolitan areas, on average, exhibited similar disparities in achievement as found for African American students. High school dropout rates were lower for Hispanic Americans than for African Americans, but still more than double that of non-Hispanic whites.
It appears that disparities in educational achievement in high school or in prior grades are important in explaining the relatively low number of African Americans and Hispanic Americans that have college degrees in Southern California. There are many studies throughout the nation that consider whether the causes of the disparities in educational outcomes for African American and Hispanic American high school students are affected by discrimination; these are not reviewed here.
Overall, the California Legislative Black Caucus report showed educational outcomes for Asian American students to be similar or better than non-Hispanic whites.
Additional factors affecting college engineering programs in Southern California. Historically, college engineering programs in the United States were slow to open doors to minorities such as African Americans.6 In recent years, California has stood out as having low percentages of African American engineering students. Out of the top 26 engineering schools in the nation in 2002, two are UC campuses in Southern California — UC-Los Angeles (UCLA) and UC-San Diego (UCSD). A 2003 study identified these schools and other UC campuses for the lowest percentages of African American engineering students among the top 26:7
In fall 2002, at UCLA fewer than 2 percent of engineering enrollments were African American.
UCSD had no African Americans among its 5,264 engineering students in fall 2002.
Because the enrollment statistics for engineering students were for 2002, most of these students enrolled in college after Proposition 209 had gone into effect. Proposition 209 prohibits California’s public colleges from giving preferential treatment to minorities and women in college admissions and financial aid except as part of a federal program. This amendment to the California constitution was passed by voters in 1996 and went into effect in 1998. Many scholars blame Proposition 209 for the
6 Unknown Author. 2003. “Blacks Strive to Build a Bridgehead in Academic Engineering.” The Journal of Blacks in Higher Education. 41 (Autumn): 98-108, 98. 7 Ibid.

BBC RESEARCH & CONSULTING – DRAFT REPORT APPENDIX F, PAGE 7
relatively low representation of African American and Hispanic American students at more selective colleges in California.8,9
Following the passing of Proposition 209, admission rates of minority applicants dropped dramatically and in the ten years following have not entirely recovered. One scholar found that percentages of African American students at UCLA prior to the amendment were nearly double the percentages in 2007.10 A recent article notes that in the case of African Americans, their admission rates at more prestigious UC campuses (including Los Angeles and San Diego) have remained low, but rates at the least selective campuses have grown since Proposition 209.11 Another scholar writes about the effect of Proposition 209 on transfer students and found that African Americans have much lower rates of acceptance while Hispanic Americans experience transfer admission rates similar to non-Hispanic whites.12
Asian American applicants were not negatively affected by the amendment. Asian American students accounted for only 11 percent of California high school graduates in 2006, but accounted for 36 percent of all students admitted to the University of California system.13
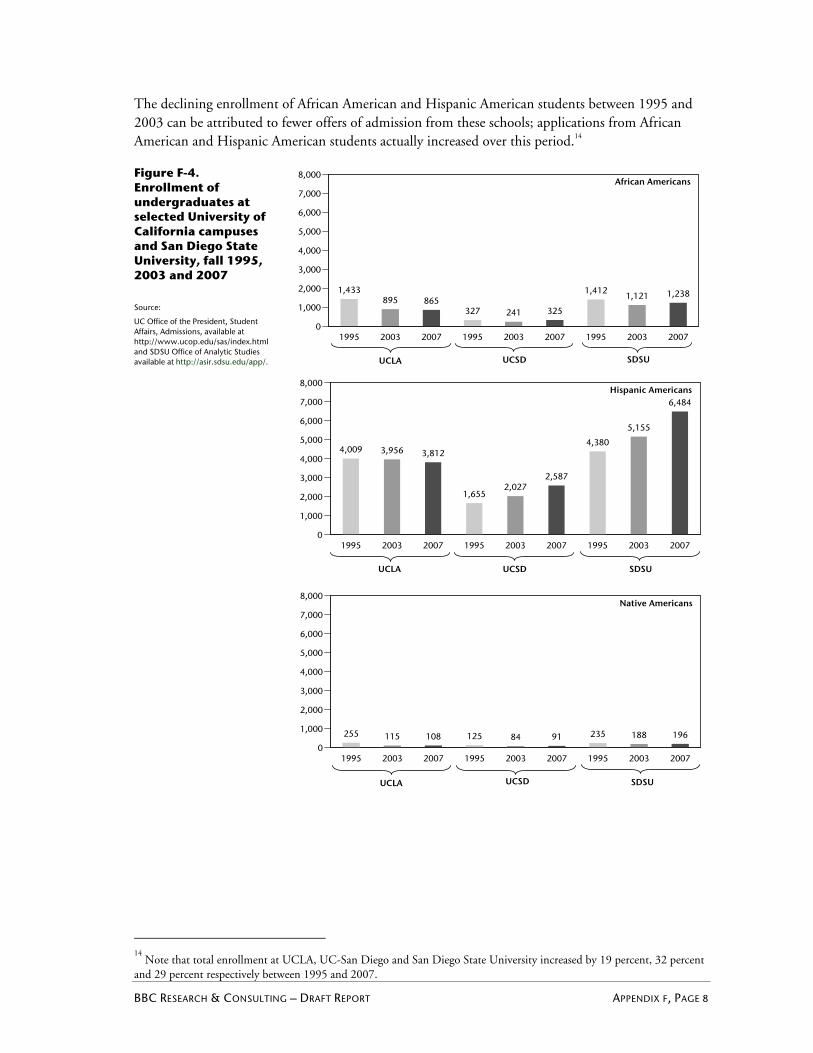
To better understand the broader patterns of enrollment by race and ethnicity in Southern California schools, the study team examined total undergraduate African American, Hispanic American and Native American enrollment at three state universities in Southern California in 1995, 2003 and 2007: UCSD, UCLA and San Diego State University (SDSU). Figure F-4 shows these trends.
Between 1995 and 2003, enrollment of African American students decreased by more than one-third at UCLA and dropped slightly lower in fall 2007. Decreases were also seen at UCSD and SDSU between 1995 and 2003, but the number of African American enrollments rebounded to 1995 levels at UCSD and stabilized at SDSU between 2003 and 2007.
Slight declines in enrollment of Hispanic Americans also occurred at UCLA from 1995 to 2003 and from 2003 to 2007. However, enrollment of Hispanic Americans increased at the other two campuses.
Enrollment of Native Americans dropped at all three campuses from 1995 to 2003. Enrollment numbers increased at UCSD and SDSU from 2003 to 2007, but they remained below enrollment counts prior to the passing of Proposition 209.
8 Contreras, Frances. 2003. “The Reconstruction of Merit Post-Proposition 209.” Educational Policy. 19 (2): 371-395.
9 Karabel, Jerome. 1999. “The Rise and Fall of Affirmative Action at the University of California.” The Journal of Blacks in
Higher Education. 25 (Autumn): 109-112. 10 Unknown Author. 2007. “The Ban on Affirmative Action at the University of California is Now 10 Years Old: The Severe Harm to the Educational Opportunities for African Americans Persists” The Journal of Blacks in Higher Education. 56 (Summer): 34-35, 34. 11 Unknown Author. 2006. “Affirmative Action Ban Continues to Inflict Severe Damage on Black Higher Educational Opportunities in California.” The Journal of Blacks in Higher Education. 51(Spring): 44. 12
Unknown Author. 2006. “The Devastating Impact of Proposition 209 on Black Higher Education in California.” The Journal of Blacks in Higher Education. 59(Spring): 14-15, 14. 13
Unknown Author. 2006. “Affirmative Action Ban Continues to Inflict Severe Damage on Black Higher Educational Opportunities in California. The Journal of Blacks in Higher Education. 51(Spring).
BBC RESEARCH & CONSULTING – DRAFT REPORT APPENDIX F, PAGE 8
The declining enrollment of African American and Hispanic American students between 1995 and 2003 can be attributed to fewer offers of admission from these schools; applications from African American and Hispanic American students actually increased over this period.14
Figure F-4. Enrollment of undergraduates at selected University of California campuses and San Diego State University, fall 1995, 2003 and 2007
Source:
UC Office of the President, Student Affairs, Admissions, available at http://www.ucop.edu/sas/index.html and SDSU Office of Analytic Studies available at http://asir.sdsu.edu/app/.
1995 2003 2007 1995 2003 2007 1995 2003 20070
1,000
2,000
3,000
4,000
5,000
6,000
7,000
8,000
1,433895 865
327 241 325
1,4121,121 1,238
UCSD
African Americans
1995 2003 2007 1995 2003 2007 1995 2003 20070
1,000
2,000
3,000
4,000
5,000
6,000
7,000
8,000
4,009 3,956 3,812
1,6552,027
2,587
4,380
5,155
6,484
UCSD
Hispanic Americans
1995 2003 2007 1995 2003 2007 1995 2003 20070
1,000
2,000
3,000
4,000
5,000
6,000
7,000
8,000
255 115 108 125 84 91 235 188 196
UCSD
Native Americans
SDSUUCLA
UCLA
UCLA SDSU
SDSU
14
Note that total enrollment at UCLA, UC-San Diego and San Diego State University increased by 19 percent, 32 percent and 29 percent respectively between 1995 and 2007.
BBC RESEARCH & CONSULTING – DRAFT REPORT APPENDIX F, PAGE 9
Employment
With educational opportunities and attainment for minorities and women as context, the study team examined employment in construction and engineering in Southern California.
Construction. Based on ACS data, 63 percent of people working in the Southern California construction industry in 2007 were minority; in San Diego County, minorities made up 46 percent of construction industry workers. This represents increases from 2000 for both San Diego and Southern California. Almost all the increase in minority construction workers between 2000 and 2007 corresponds to growth in the number of Hispanic Americans working in the industry. Of the people working in construction in Southern California in 2007:
55 percent were Hispanic Americans;
3 percent were African Americans;
4 percent were Asian-Pacific Americans;
0.7 percent were Native Americans; and
0.2 percent were Subcontinent Asian Americans.
In Southern California, Hispanic Americans make up a greater share of workers in construction than in the economy as a whole, representing over one-half of construction workers, but only about 39 percent of all workers in 2007. In contrast, African Americans, Asian-Pacific Americans and Subcontinent Asian Americans working in Southern California are less likely to work in construction than other industries.
Similarly, Hispanic Americans represent over one-third of the construction industry in San Diego County but only about a quarter of workers in all industries. African Americans, Asian-Pacific Americans and Subcontinent Asian Americans are underrepresented in the San Diego construction industry.
African Americans were 3 percent of the construction workforce and nearly 7 percent of all workers in Southern California in 2007. A similar disparity is seen in San Diego County where African Americans are 5 percent of all workers but only 2 percent of construction workers.
The percentage of California construction workers who are African American declined from 2000 to 2007 in both San Diego and Southern California. Average educational attainment of African Americans is consistent with requirements for construction jobs, so education does not explain the relatively low number of African American workers in this industry. A number of studies throughout the United States have argued that race discrimination by construction unions have held down employment of African Americans in construction trades.15
15
Waldinger, Roger and Thomas Bailey. 1991. “The Continuing Significance of Race: Racial Conflict and Racial Discrimination in Construction.” Politics & Society, 19(3).
BBC RESEARCH & CONSULTING – DRAFT REPORT APPENDIX F, PAGE 10
Asian-Pacific Americans were 3 percent of the construction workforce and 11 percent of all workers in San Diego in 2007 (similar to all of Southern California). The fact that Asian-Pacific Americans are more likely to go to college than other groups may explain part of this difference.
Relative under-representation of Subcontinent Asian Americans is evident in 2000 and 2007 in both San Diego and all of Southern California.16
Overall, these differences in employment patterns are similar to those seen in the construction industry for the nation.
There are also large disparities between the percentage of all workers who are women and the percentage of women in the construction industry in San Diego County, Southern California and the nation. The share of construction workers in the United States who are women has remained relatively unchanged between 2000 and 2007. In San Diego County, the share of construction workers who are women increased from 1980 to 2007 but still remained far below the percent of workers in all industries who are women.
Figure F-5 used data from 1980, 2000 and 2007 to compare the demographic composition of the construction industry with the total workforce in San Diego County, Southern California and the United States.
16
Note that Census definitions of race and ethnicity have changed over time, which affects comparability of statistics from one census year to the next. Appendix I discusses how BBC coded data concerning race and ethnicity for each Census and for the 2007 ACS.

BBC RESEARCH & CONSULTING – DRAFT REPORT APPENDIX F, PAGE 11
Figure F-5. Demographics of workers in construction and all industries in San Diego County, Southern California and the U.S., 1980, 2000 and 2007
Race/ethnicityAfrican American 2.5 % ** 3.4 % ** 1.8 % ** 4.7 % 6.0 % 5.3 %Asian-Pacific American 0.9 ** 3.6 ** 3.4 ** 4.1 10.1 11.2Subcontinent Asian American 0.1 0.1 ** 0.1 ** 0.1 0.5 0.7Hispanic American 14.7 ** 32.4 ** 39.6 ** 13.3 23.5 27.4Native American 1.3 ** 1.3 1.1 0.7 1.1 1.1Other minority group 0.2 0.7 0.3 0.1 0.7 0.3
Total minority 19.6 % 41.5 % 46.3 % 23.0 % 42.0 % 46.0 %
Non-Hispanic white 80.4 ** 58.5 ** 53.7 77.0 58.0 54.0Total 100.0 % 100.0 % 100.0 % 100.0 % 100.0 % 100.0 %
GenderFemale 9.6 % ** 10.3 % ** 13.1 % ** 47.1 % 45.9 % 46.4 %Male 90.4 ** 89.7 ** 86.9 ** 52.9 54.1 53.6
Total 100.0 % 100.0 % 100.0 % 100.0 % 100.0 % 100.0 %
Race/ethnicityAfrican American 4.3 % ** 4.0 % ** 3.1 % ** 7.8 % 7.1 % 6.8 %Asian-Pacific American 1.9 ** 3.7 ** 4.1 ** 4.7 10.9 11.7Subcontinent Asian American 0.1 ** 0.2 ** 0.2 ** 0.2 0.8 1.0Hispanic American 19.8 45.5 ** 55.4 ** 20.3 35.5 39.4Native American 1.0 ** 1.1 ** 0.7 0.7 0.9 0.7Other minority group 0.2 0.9 0.2 ** 0.2 0.9 0.4
Total minority 27.6 % 54.7 % 63.3 % 33.8 % 55.6 % 59.7 %
Non-Hispanic white 72.7 ** 44.7 ** 36.3 ** 66.1 44.0 40.0Total 100.0 % 100.0 % 100.0 % 100.0 % 100.0 % 100.0 %
Gender
Female 10.5 % ** 9.5 % ** 9.6 % ** 46.0 % 46.3 % 46.2 %
Male 89.5 ** 90.5 ** 90.4 ** 54.0 53.7 53.8
Total 100.0 % 100.0 % 100.0 % 100.0 % 100.0 % 100.0 %
Race/ethnicityAfrican American 7.8 % ** 7.6 % ** 6.7 % ** 10.0 % 11.5 % 11.8 %Asian-Pacific American 0.7 ** 1.3 ** 1.5 ** 1.4 3.5 4.0Subcontinent Asian American 0.1 ** 0.2 ** 0.2 ** 0.2 0.7 1.0Hispanic American 5.9 ** 16.2 ** 23.2 ** 5.7 11.6 13.9Native American 0.8 ** 1.6 ** 1.3 ** 0.6 1.2 1.1Other minority group 0.1 0.4 0.3 ** 0.1 0.4 0.2
Total minority 15.4 % 27.3 % 33.2 % 18.0 % 28.9 % 32.0 %
Non-Hispanic white 84.7 ** 72.7 ** 66.8 ** 81.9 71.0 67.9Total 100.0 % 100.0 % 100.0 % 100.0 % 100.0 % 100.0 %
GenderFemale 9.0 % ** 10.1 % ** 9.7 % ** 46.3 % 48.1 % 48.0 %Male 91.0 ** 89.9 ** 90.3 ** 53.7 51.9 52.0
Total 100.0 % 100.0 % 100.0 % 100.0 % 100.0 % 100.0 %
(n=106,106)
Southern CaliforniaConstruction All industries
1980 2000 2007 1980 2000 2007
San Diego County Construction All industries
1980 20071980 20072000 2000
(n=374,532) (n=124,711) (n=6,043,248) (n=1,675,930)2007 19802000
(n=557,707)2000
(n=7,865,814)
(n=16,273)(n=1,112) (n= 47,507)
2007Construction All industries
1980
United States
(n=4,755) (n=76,744)(n=3,193)
(n=19,777) (n=30,911) (n=7,539) (n= 356,525) (n=509,752)
Note: ** Denotes that the difference in proportions between the construction and all industry groups for the given Census/ACS year is statistically
significant at the 95% confidence level.
Source: BBC Research & Consulting from 1980 and 2000 U.S. Census 5% sample and 2007 ACS Public Use Micro-sample data. The raw data extracts were obtained through the IPUMS program of the MN Population Center: http://usa.ipums.org/usa/.

BBC RESEARCH & CONSULTING – DRAFT REPORT APPENDIX F, PAGE 12
Importance of unions in entering the construction industry. Labor scholars characterize construction as a historically volatile industry sensitive to business cycles, making the presence of labor unions important for stability and job security within the industry.17 The temporary nature of construction work results in uncertain job prospects, and the high turnover of laborers presents a disincentive for construction firms to invest in training. Some scholars have claimed that constant turnover has lent itself to informal recruitment practices and nepotism, compelling laborers to tap social networks for training and work. They credit the importance of social networks with the high degree of ethnic segmentation in the construction industry.18 Unable to integrate themselves into traditionally white social networks, African Americans faced long-standing historical barriers to entering the industry.19
Construction unions aim to provide a reliable source of labor for employers and preserve job opportunities for workers by formalizing the recruitment process, coordinating training and apprenticeships, enforcing standards of work and mitigating wage competition. The unionized sector of construction would seemingly be the best road for African American and other underrepresented groups into the industry. However, researchers have identified discrimination by trade unions that have historically prevented minorities from obtaining employment in skilled trades.20 Past papers claim union discrimination took place in a variety of forms including:
Unions have used admissions criteria that adversely affect minorities. Federal courts ruled in the 1970s that standardized testing requirements unfairly disadvantaged minority applicants who had less exposure to testing and that requirements that new union members have relatives in the union perpetuate the effects of past discrimination.21 More recent disparity studies in California reveal that these practices persist: admissions testing requirements for union membership were still being used that adversely affected minorities.22 Moreover, applicants who were relatives of union members were often waived from admissions requirements.23
Of those minority individuals who are admitted to unions, a disproportionately low number are admitted into apprenticeship programs coordinated by unions. Apprenticeship programs are important means of producing skilled construction laborers, and the reported exclusion of African Americans from these programs has severely limited their access to skilled occupations in the construction industry.24
17
Applebaum, Herbert. 1999. Construction Workers, U.S.A. Westport: Greenwood Press. 18
Waldinger, Roger and Thomas Bailey. 1991. “The Continuing Significance of Race: Racial Conflict and Racial Discrimination in Construction.” Politics & Society, 19(3). 19
Feagin, Joe R. and Nikitah Imani. 1994. “Racial Barriers to African American Entrepreneurship: An Exploratory Study.” Social Problems. 41( 4): 562-584. 20
U.S. Department of Justice. 1996. Proposed Reforms to Affirmative Action in Federal Procurement. 61 FR 26042. 21
Ibid. See United States v. Iron Workers Local 86 (1971), Sims v. Sheet Metal Workers International Association (1973), and United States v. International Association of Bridge, Structural and Ornamental Iron Workers (1971). 22
National Economic Research Association, Inc. 1992. The Utilization of Minority and Woman-Owned Business Enterprises by Contra Costa County. 185-186. 23
BPA Economics, Mason Tillman Associates, and Boasberg and Norton. 1990. MBE-WBE Disparity Study of the City of San Jose. 24
Applebaum. 1999. Construction Workers, U.S.A.

BBC RESEARCH & CONSULTING – DRAFT REPORT APPENDIX F, PAGE 13
While formal training and apprenticeship programs exist within unions, most training of union members takes place informally through social networking. Nepotism characterizes the unionized sector of construction as it does the non-unionized sector, and this favors a white-dominated status quo.25
Traditionally white unions have been successful in resisting policies designed to increase African American participation in training programs. The political strength of unions in resisting affirmative action in construction has hindered the advancement of African Americans in the industry.26
Discriminatory practices in employee referral procedures, including apportioning work based on seniority, have precluded minority union members from having the same access to construction work as their white counterparts.27
According to testimony from African American union members, even when unions implement meritocratic mechanisms of apportioning employment to laborers, white workers are often allowed to circumvent procedures and receive preference for construction jobs.28
However, these historical observations may not be indicative of current dynamics in construction unions. For example, the 2007 Current Population Survey (CPS) provides data indicating union membership for African Americans and non-Hispanic whites to be similar.29 The CPS asked participants “Are you a member of a labor union or of an employee association similar to a union?” CPS data show union membership for African Americans in construction to be 11 percent and non-Hispanic whites to be 12 percent (not a statistically significant difference). On the other hand, only 7 percent of Hispanic Americans are union members based on these national data.
A recent study on the presence of African Americans and Hispanic Americans in apprenticeship programs may help explain the high rates of Hispanics in the construction industry despite low union memberships. Two types of apprenticeship programs are available, joint programs (run by a combination of a union and one or more employers) and non-joint programs (run solely by one or more employers). Using 1989-1995 data from the U.S. Department of Labor, the study found that the probability of an African American being an apprentice in a joint program was 8 percent higher than being in a non-joint program.
25
Ibid. 299. A high percentage of skilled workers reported having a father or relative in the same trade. However, the author suggests this may not be indicative of current trends. 26
Waldinger and Bailey. 1991. “The Continuing Significance of Race: Racial Conflict and Racial Discrimination in Construction.” 27
U.S. Department of Justice. 1996. Proposed Reforms to Affirmative Action in Federal Procurement. 61 FR 26042. See United Steelworkers of America v. Weber (1979) and Taylor v. United States Department of Labor (1982). 28
Feagin and Imani. 1994. “Racial Barriers to African American Entrepreneurship: An Exploratory Study.” Social Problems. 41( 4): 562-584. 29
2006 Current Population Survey (CPS), U.S. Census Bureau and Bureau of Labor Statistics.

BBC RESEARCH & CONSULTING – DRAFT REPORT APPENDIX F, PAGE 14
On the other hand, Hispanic Americans’ odds of being in non-joint program are 7 percent higher than a joint program.30 These data suggest that Hispanic Americans may be more likely than African Americans to enter the construction industry without the support of a union. Thus, one reason that Hispanic Americans represent a large portion of the construction workers may be that their participation is less hindered by possible union discrimination.
Another recent study, which used U.S. Department of Labor data in combination with data from the California Apprenticeship Agency from 1995-2003, found that apprenticeship program attrition rates and the occupation students were training for were very different for non-Hispanic whites, African Americans and Hispanic Americans. Non-Hispanics had the lowest attrition rate at 47 percent, African Americans the highest at 70 percent and Hispanic Americans in the middle with an attrition rate of 63 percent. In addition, both African Americans and Hispanic Americans were more likely to enroll in training programs for occupations with lower pay rates and prestige levels.31 This study did not explore causation of the observed variations. However, they could be explained by a variety of factors:
Students in apprenticeship programs may drop out due to dissatisfaction with the program, training or occupation.32
The expected benefits of staying in the apprenticeship program are less for lower paying occupations.33 Thus, there may be less incentive for apprentices in occupations with lower pay levels to complete long arduous programs. Most programs are between 6,000 and 8,000 hours and last several years.34
Unobserved characteristics of the apprentices, such as financial status, previous education, English proficiency, age and a variety of other socioeconomic factors, may limit the ability of an individual to complete the program.
Although the minority and non-minority numbers vary in union membership and union program participation, the causes of these differences and their effects on construction industry employment are unresolved. Research is especially limited on the impact of unions on Asian-Pacific American employment. It is unclear from past studies whether unions presently help or hinder equal opportunity in construction and whether effects in Southern California are different from other parts of the country. In addition, the current research indicates that the effects of unions on entry into the construction industry may be different for different minority groups.
30
Bilginsoy, Cihan. 2005. “How Unions Affect Minority Representation in Building Trades Apprenticeship Programs.” Journal of Labor Research, 57(1). 31
Bilginsoy, Cihan. 2003. “The Hazards of Training: Attrition and Retention in the Construction Industry Apprenticeship Programs.” Industrial & Labor Relations Review, 57(1) 54-67. 32
Bilginsoy. 2003. “The Hazards of Training: Attrition and Retention in the Construction Industry Apprenticeship Programs.” Industrial & Labor Relations Review, 57(1) 54-67. 33
Bilginsoy, Cihan. 2007. “Delivering Skills: Apprenticeship Program Sponsorship and Transition from Training.” Industrial Relations, 46(4): 738-765. 34
Bilginsoy. 2003. “The Hazards of Training: Attrition and Retention in the Construction Industry Apprenticeship Programs.” Industrial & Labor Relations Review, 57(1) 54-67.

BBC RESEARCH & CONSULTING – DRAFT REPORT APPENDIX F, PAGE 15
Engineering industry. The study team also examined the race/ethnicity and gender composition of the engineering industry in Southern California and the U.S. based on data from 1980, 2000 and 2007. The results are presented in Figure F-6.35
In 2007, more than two-thirds of people working as civil engineers in the Southern California engineering industry were non-Hispanic whites — a greater percentage than non-Hispanic whites’ representation across all industries in the state. Compared to all workers in Southern California, Asian-Pacific Americans and Subcontinent Asian Americans also had greater representation in the engineering industry than in all industries. These patterns in Southern California are found in 1980 and 2000 as well, and reflect the trends seen in the nation.
As shown in Figure F-6, African Americans and Hispanic Americans continue to have relatively low representation among civil engineers in Southern California:
African Americans made up a small share of civil engineers relative to African Americans’ share of employment in other industries (3.1% compared with 6.7% in 2007). This was also true in 1980 and 2000.
Hispanic Americans made up about 10 percent of civil engineers in 2007, roughly one-quarter of the Hispanic American representation in the overall Southern California workforce.
In 2000, Native Americans had very little representation among civil engineers in Southern California. In both 1980 and 2007 Census data, no respondents from Southern California reported being a Native American working as a civil engineer.
In 2007, women represented about 15 percent of civil engineers in Southern California (up from 10% in 2000). In contrast, women represented 46 percent of the whole Southern California workforce in both 2000 and 2007.36
Employment patterns seen among civil engineers in Southern California are generally consistent with those for nation.
35
Detailed analysis of the distribution of civil engineers across race/ethnicity in San Diego County was not conducted due to small sample sizes. 36 In general, Asian-Pacific Americans, Subcontinent Asian Americans and non-Hispanic whites in San Diego County represent higher percentages of civil engineers than all workers, while Hispanic Americans and women are underrepresented among civil engineers, similar to Southern California as a whole.

BBC RESEARCH & CONSULTING – DRAFT REPORT APPENDIX F, PAGE 16
Figure F-6. Demographics of civil engineers and workers in all industries in Southern California and the U.S., 1980, 2000 and 2007
Race/ethnicityAfrican American 3.1 % ** 2.6 % ** 3.3 % ** 7.8 % 7.1 % 6.8 %Asian-Pacific American 11.2 ** 22.1 ** 15.6 4.7 10.9 11.7Subcontinent Asian American 2.2 ** 1.9 2.1 0.2 0.8 1.0Hispanic American 5.4 ** 8.3 ** 10.1 ** 20.3 35.5 39.4Native American 0.0 0.7 0.0 ** 0.7 0.9 0.7Other minority group 0.0 1.6 0.0 ** 0.2 0.9 0.4
Total minority 21.9 % 37.3 % 31.1 % 33.8 % 56.0 % 60.0 %
Non-Hispanic white 78.1 ** 62.7 ** 68.9 ** 66.1 44.0 40.0Total 100.0 % 100.0 % 100.0 % 100.0 % 100.0 % 100.0 %
GenderFemale 4.5 % ** 10.3 % ** 15.1 % ** 46.0 % 46.3 % 46.2 %Male 95.5 ** 89.7 ** 84.9 ** 54.0 53.7 53.8
Total 100.0 % 100.0 % 100.0 % 100.0 % 100.0 % 100.0 %
Race/ethnicityAfrican American 1.9 % ** 3.1 % ** 3.0 % ** 10.0 % 11.5 % 11.8 %Asian-Pacific American 4.6 ** 6.5 ** 7.4 ** 1.4 3.5 4.0Subcontinent Asian American 3.2 ** 2.5 ** 3.6 ** 0.2 0.7 1.0Hispanic American 3.0 ** 4.1 ** 4.4 ** 5.7 11.6 13.9Native American 0.1 ** 0.7 ** 0.4 ** 0.6 1.2 1.1Other minority group 0.3 0.5 0.3 0.1 0.4 0.2
Total minority 13.1 % 17.4 % 19.2 % 18.2 % 29.0 % 32.1 %
Non-Hispanic white 87.0 ** 82.6 ** 80.8 ** 81.9 71.0 67.9Total 100.0 % 100.0 % 100.0 % 100.0 % 100.0 % 100.0 %
Gender
Female 3.5 % ** 11.0 % ** 13.8 % ** 46.3 % 48.1 % 48.0 %
Male 96.5 ** 89.0 ** 86.2 ** 53.7 51.9 52.0
Total 100.0 % 100.0 % 100.0 % 100.0 % 100.0 % 100.0 %
(n=6,043,224) (n=7,865,814) (n=1,675,930)(n=6,568)(n=2,347) (n=2,147)
United StatesEngineering All industries
1980 2000 2007 1980 2000 2007
(n=106,106)
Southern CaliforniaEngineering All industries
1980 2000 2007 1980 2000 2007(n=224) (n=462) (n=141) (n= 356,525) (n=509,752)
Note: ** Denotes that the difference in proportions between civil engineers and workers in all industry groups for the given Census/ACS year is statistically
significant at the 95% confidence level.
Source: BBC Research & Consulting from 1980 and 2000 U.S. Census 5% sample and 2007 ACS Public Use Micro-sample data. The raw data extracts were obtained through the IPUMS program of the MN Population Center: http://usa.ipums.org/usa/.

BBC RESEARCH & CONSULTING – DRAFT REPORT APPENDIX F, PAGE 17
The study team examined the relative number of minorities and women among other engineering occupations in 2000 and 2007 that were not recorded in the 1980 Census. Figure F-7 on the next page gives the demographics of individuals employed as civil engineers, environmental engineers or mining and geological engineers. Figure F-7 also includes the demographics of all workers 25 and older with a college degree.
In most cases, relatively fewer minorities work as engineers compared to the population of all workers with college degrees. For example, in Southern California Hispanic Americans represented about 14 percent of workers with college degrees but only 7 percent of engineers in 2007 and African Americans were nearly 6 percent of workers with a college degree but less than 3 percent of engineers — both statistically significant differences.
Although female representation among engineers in Southern California increased slightly between 2000 and 2007, women still made up a very small share of engineers compared to all workers with college degrees.
Similar trends for African Americans, Hispanic Americans and women are seen in San Diego County (not included in Figure F-7 due to small sample sizes).

BBC RESEARCH & CONSULTING – DRAFT REPORT APPENDIX F, PAGE 18
Figure F-7. Demographics of engineers and workers 25 and older with a college degree in Southern California and the U.S., 2000 and 2007
Race/ethnicity
African American 2.3 % ** 5.4 % 2.5 % ** 5.6 %
Asian-Pacific American 23.9 ** 18.2 16.4 20.0
Subcontinent Asian American 2.2 1.8 2.5 2.5
Hispanic American 7.0 ** 9.9 6.8 ** 13.7
Native American 0.5 0.6 0.0 0.5
Other minority group 1.5 1.0 0.5 0.4
Total minority 37.4 % 36.5 % 28.7 % 42.7 %
Non-Hispanic white 62.6 63.2 71.3 ** 57.3
Total 100.0 % 100.0 % 100.0 % 100.0 %
Gender
Female 9.9 % ** 46.1 % 14.6 % ** 47.5 %
Male 90.1 ** 53.9 85.4 ** 52.5
Total 100.0 % 100.0 % 100.0 % 100.0 %
Race/ethnicity
African American 2.6 % ** 6.9 % 3.1 % ** 7.6 %
Asian-Pacific American 6.8 ** 5.5 7.8 ** 6.3
Subcontinent Asian American 2.9 ** 1.8 4.1 ** 2.5
Hispanic American 3.7 ** 4.6 4.0 ** 6.2
Native American 0.7 0.6 0.4 0.6
Other minority group 0.5 0.4 0.2 0.2
Total minority 17.1 % 19.8 % 19.6 % 23.4 %
Non-Hispanic white 82.9 ** 80.2 80.4 ** 76.6
Total 100.0 % 100.0 % 100.0 % 100.0 %
Gender
Female 11.4 % ** 47.8 % 14.7 % ** 49.6 %
Male 88.6 ** 52.2 85.3 ** 50.4
Total 100.0 % 100.0 % 100.0 % 100.0 %
United States2000 2007
Workers 25 + with Workers 25 + with
(n=5,588) (n=1,752,632) (n=1,902) (n=465,556)Engineers a college degree Engineers a college degree
Southern California2000 2007
Workers 25 + with Workers 25 + withEngineers a college degree Engineers a college degree(n=401) (n=118,446) (n=123) (n=31,283)
Note: ** Denotes that the difference in proportions between engineers and workers 25+ with a college degree for the given Census/ACS year is
statistically significant at the 95% confidence level.
Engineers are those individuals whose reported occupation was civil engineer, environmental engineer or mining and geological engineer.
Source: BBC Research & Consulting from the 2000 U.S. Census 5% sample and 2007 ACS Public Use Micro-sample data. The raw data extracts were obtained through the IPUMS program of the MN Population Center: http://usa.ipums.org/usa/.

BBC RESEARCH & CONSULTING – DRAFT REPORT APPENDIX F, PAGE 19
Advancement in Construction
To research opportunities for advancement in the Southern California construction industry, the study team examined representation of minorities and women in construction occupations defined by the U.S. Bureau of Labor Statistics.37 Full descriptions of construction trades with a large enough sample size for analysis in the 2000 Census and 2007 ACS can be found in Appendix J.
Race and ethnic composition of construction occupations. Figure F-8 and F-9 summarize the race/ethnicity of workers in the construction-related occupations defined above, including low-skill occupations such as laborers, higher-skill construction trades and supervisory roles in Southern California in 2000 and 2007, respectively.
Figure F-8. Minorities as a percentage of selected construction occupations in Southern California, 2000
First-line supervisors (n=2,466)
Sheet metal workers (n=196)
Equipment operators (n=725)
Electricians (n=1,358)
Iron and steel workers (n=170)
Pipelayers, plumbers, pipefitters and steamfitters (n=1,416)
Glaziers(n=181)
Drivers, sales workers and truck drivers (n=433)
Carpenters (n=3,442)
Carpet, floor tile and marble layers (n=831)
Brickmasons, blockmasons and stonemasons (n= 412)
Drywall, ceiling tile installers and tapers (n=658)
Painters (n=2,419)
Roofers (n=703)
Cement masons and terrazzo workers (n=321)
All helpers (n=226)
Plasterers and stuccomasons (n=287)
Construction laborers (n=5,617)
All construction workers (n=31,748)
0% 10% 20% 30% 40% 50% 60% 70% 80% 90% 100%
45% 10% 55%
67% 9% 75%
74% 7% 81%
73% 8% 81%
70% 8% 78%
67% 7% 74%
63% 8% 72%
64% 6% 70%
60% 8% 68%
54% 7% 62%
52% 9% 61%
49% 11% 60%
30% 21% 52%
41% 11% 52%
40% 5% 45%
28% 13% 41%
31% 8% 39%
24% 13% 37%
33% 8% 41%
Hispanic Americans
All other minorities
Note: Crane and tower operators, dredge, excavating and loading machine and dragline operators, paving, surfacing
and tamping equipment operators and miscellaneous construction equipment operators were combined into the single category of equipment operators.
Source: BBC Research & Consulting from 2000 U.S. Census 5% sample Public Use Micro-sample data. The raw data extract was obtained through the IPUMS program of the MN Population Center: http://usa.ipums.org/usa/.
37
Bureau of Labor Statistics, U.S. Department of Labor. 2001. “Standard Occupational Classification Major Groups.” http://www.bls.gov/soc/soc_majo.htm (accessed February 15, 2007).

BBC RESEARCH & CONSULTING – DRAFT REPORT APPENDIX F, PAGE 20
Figure F-9. Minorities as a percentage of selected construction occupations in Southern California, 2007
First-line supervisors (n=626)
Sheet metal workers (n=31)
Equipment operators (n=195)
Electricians (n=393)
Iron and steel workers (n=41)
Pipelayers, plumbers, pipefitters and steamfitters (n=329)
Glaziers(n=24)
Drivers, sales workers and truck drivers (n=103)
Carpenters (n=788)
Carpet, floor tile and marble layers (n=200)
Brickmasons, blockmasons and stonemasons (n= 83)
Drywall, ceiling tile installers and tapers (n=184)
Painters (n=447)
Roofers (n=140)
Cement masons and terrazzo workers (n=71)
All helpers (n=66)
Plasterers and stucco masons (n=54)
Construction laborers (n=1,563)
All construction workers (n=7,849)
0% 10% 20% 30% 40% 50% 60% 70% 80% 90% 100%
55% 8% 63%
72% 7% 78%
87% 6% 93%
82% 4% 86%
91% 4% 95%
77% 3% 79%
69% 6% 74%
84% 2% 85%
82% 5% 86%
71% 5% 76%
65% 7% 73%
62% 8% 70%
44% 11% 55%
54% 8% 62%
61% 7% 69%
45% 13% 58%
49% 7% 55%
42% 3% 45%
42% 8% 49%
Hispanic Americans
All other minorities
Note: Crane and tower operators, dredge, excavating and loading machine and dragline operators, paving, surfacing and tamping equipment operators and miscellaneous construction equipment operators were combined into the single category of equipment operators.
Source: BBC Research & Consulting from 2007 American Community Survey data. The raw data extract was obtained through the IPUMS program of the MN Population Center: http://usa.ipums.org/usa/.

BBC RESEARCH & CONSULTING – DRAFT REPORT APPENDIX F, PAGE 21
Based on 2000 Census and 2007 ACS data, there are large differences in the racial and ethnic makeup of workers in various trades related to construction in Southern California. Overall, 55 percent of the construction workforce was minorities in 2000 and 63 percent was minorities in 2007. In Southern California, over one-half of the construction workforce was Hispanic American in 2007. Minorities comprised a relatively large share of the Southern California construction workforce for:
Construction laborers (75% in 2000 and 78% in 2007);
Plasterers and stucco masons (81% in 2000 and 93% in 2007);
Helpers (81% in 2000 and 86% in 2007);
Cement masons, concrete finishers and terrazzo workers (78% in 2000 and 95% in 2007);
Drywall, ceiling tile installers, and tapers (70% in 2000 and 85% in 2007);
Brick, block and stone masons (68% in 2000 and 86% in 2007); and
Roofers (74% in 2000 and 79% in 2007).
Some occupations had a relatively low representation of minorities:
Equipment operators (39% in 2000 and 55% in 2007); and
Sheet metal workers (37% in 2000 and 45% in 2007).
For some occupations, the relative number of minority workers increased substantially between 2000 and 2007:
Minority representation among carpenters increased from 61 percent in 2000 to 73 percent in 2007; and
Minority representation among iron and steel workers grew from 45 percent in 2000 to 69 percent in 2007.
Minority representation among electricians increased from 41 percent in 2000 to 58 percent in 2007.
About 41 percent of first-line supervisors of construction workers were minorities in 2000, less than minorities’ share of all occupations in construction. Minorities made up a greater share of first-line supervisors (49%) in 2007, although this percent was still less than the overall representation of minorities among construction workers.
Most of the overall differences for minorities are driven by differences in the representation of Hispanic Americans in these occupations. However, there were some notable exceptions.

BBC RESEARCH & CONSULTING – DRAFT REPORT APPENDIX F, PAGE 22
In 2000, African Americans represented a relatively large share of construction laborers (4.7%) and a relatively small share of first-line supervisors (2.8%). These are statistically significant differences from the overall representation of African Americans in the construction industry as a whole (4.0%). Similarly in 2007, representation of African Americans among first-line supervisors (2.4%) was lower than among all construction workers (3.1%).
In 2000, Asian-Pacific Americans were a relatively small share of construction laborers (2.4%), cement masons, concrete finishers and terrazzo workers (1.7%), truck drivers (2.0%), iron and steel workers (0.6%) and first-line supervisors (2.9%) compared with the share of all construction workers who were Asian-Pacific Americans (3.6%). In 2007, Asian-Pacific Americans continued to represent a relatively small share of workers in several construction occupations, representing about 2.8 percent of construction laborers and 2.9 percent of construction supervisors, while still accounting for 3.9 percent of all construction workers.
The study team also analyzed the percentages of minority workers in construction–related occupations for San Diego County in 2000. The results are presented in Figure F-10. Small sample sizes in the ACS data restricted analysis, thus 2007 results for San Diego County are not presented.
In San Diego County, the large differences in the racial and ethnic makeup of workers in various trades related to construction are similar to those seen in Southern California. However in San Diego County, minorities are a smaller percentage of all construction workers (about 42%) than in Southern California. Some other notable differences include:
First-line supervisors (minorities were only 31% in San Diego versus 41% in Southern California);
Glaziers (17% in San Diego versus 52% in Southern California);
Truck drivers and sales workers (30% in San Diego versus 60% in Southern California); and
Construction laborers (63% in San Diego versus 75% in Southern California).

BBC RESEARCH & CONSULTING – DRAFT REPORT APPENDIX F, PAGE 23
Figure F-10. Minorities as a percentage of selected construction occupations in San Diego County, 2000
First-line supervisors (n=416)
Sheet metal workers (n=33)
Equipment operators (n=108)
Electricians (n=198)
Iron and steel workers (n=33)
Pipelayers, plumbers, pipefitters and steamfitters (n=211)
Glaziers(n=20)
Drivers, sales workers and truck drivers (n=50)
Carpenters(n=528)
Carpet, floor tile and marble layers (n=154)
Brickmasons, blockmasons and stonemasons (n=51)
Drywall, ceiling tile installers and tapers (n=132)
Painters(n=287)
Roofers (n=96)
Cement masons and terrazzo workers (n=59)
All helpers (n=37)
Plasterers and stucco masons (n=44)
Construction laborers (n=703)
All construction workers (n=4,755)
0% 10% 20% 30% 40% 50% 60% 70% 80% 90% 100%
32% 9% 42%
53% 10% 63%
71% 12% 82%
55% 8% 63%
60% 12% 72%
58% 6% 64%
45% 9% 54%
57% 2% 59%
60% 6% 66%
45% 9% 53%
37% 8% 45%
22% 8% 30%
12% 5% 17%
28% 6% 34%
23% 2% 26%
17% 18% 35%
22% 7% 29%
13% 11% 24%
24% 6% 31%
Hispanic Americans
All other minorities
Note: Crane and tower operators, dredge, excavating and loading machine and dragline operators, paving, surfacing and tamping equipment operators and miscellaneous construction equipment operators were combined into the single category of equipment operators.
Source: BBC Research & Consulting from 2000 U.S. Census 5% sample Public Use Micro-sample data. The raw data extract was obtained through the IPUMS program of the MN Population Center: http://usa.ipums.org/usa/.

BBC RESEARCH & CONSULTING – DRAFT REPORT APPENDIX F, PAGE 24
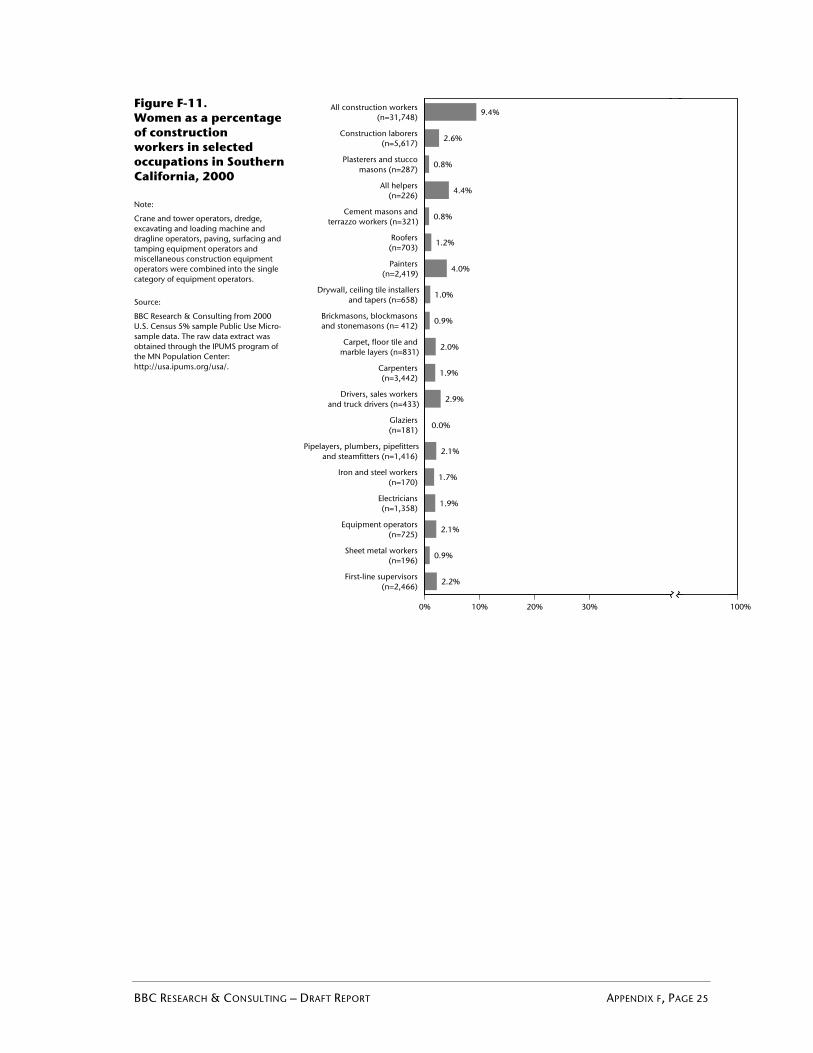
Women in construction trades. The study team also analyzed the proportion of women in construction related occupations. Overall, slightly fewer than 10 percent of workers in the Southern California construction industry were women in 2000 and 2007. Representation of women in the Southern California construction workforce has declined from 1980 to 2007.
Figures F-11 and F-12 show the representation of women in the Southern California construction industry in the occupations defined in Appendix J in 2000 and 2007, respectively. Women represented fewer than 2 percent of workers in the following occupations in both 2000 and 2007:
Roofers;
Drywall, ceiling tile installers and tapers;
Brick, block and stone masons;
Carpenters; and
Iron and steel workers.
In the 2000 Census, no female respondents in Southern California reported being employed as a glazier in the construction industry. In the 2007 ACS, no female respondents reported their occupation as plasterer or stucco mason, cement mason, terrazzo worker or glazier.
Among all the individual occupations listed in Figures F-11 and F-12, first-line supervisors, brick, block and stone masons, electricians, machine operators and sheet metal workers show an increase in the representation of women between 2000 and 2007. On the other hand, the following occupations show a decrease in the representation of women in the same time period:
Construction laborers;
Roofers;
Painters;
Carpet, floor tile and marble layers;
Carpenters;
Truck drivers and sales workers;
Pipelayers, plumbers, pipefitters, and steamfitters; and
Iron and steel workers.
BBC RESEARCH & CONSULTING – DRAFT REPORT APPENDIX F, PAGE 25
Figure F-11. Women as a percentage of construction workers in selected occupations in Southern California, 2000
Note:
Crane and tower operators, dredge, excavating and loading machine and dragline operators, paving, surfacing and tamping equipment operators and miscellaneous construction equipment operators were combined into the single category of equipment operators.
Source:
BBC Research & Consulting from 2000 U.S. Census 5% sample Public Use Micro-sample data. The raw data extract was obtained through the IPUMS program of the MN Population Center: http://usa.ipums.org/usa/.
First-line supervisors (n=2,466)
Sheet metal workers (n=196)
Equipment operators (n=725)
Electricians (n=1,358)
Iron and steel workers (n=170)
Pipelayers, plumbers, pipefitters and steamfitters (n=1,416)
Glaziers(n=181)
Drivers, sales workers and truck drivers (n=433)
Carpenters (n=3,442)
Carpet, floor tile and marble layers (n=831)
Brickmasons, blockmasons and stonemasons (n= 412)
Drywall, ceiling tile installers and tapers (n=658)
Painters (n=2,419)
Roofers (n=703)
Cement masons and terrazzo workers (n=321)
All helpers (n=226)
Plasterers and stucco masons (n=287)
Construction laborers (n=5,617)
All construction workers (n=31,748)
0% 10% 20% 30% 60%70%80%90%100%
9.4%
2.6%
0.8%
4.4%
0.8%
1.2%
4.0%
1.0%
0.9%
2.0%
1.9%
2.9%
2.1%
1.7%
1.9%
2.1%
0.9%
2.2%
0.0%
100%

BBC RESEARCH & CONSULTING – DRAFT REPORT APPENDIX F, PAGE 26
Figure F-12. Women as a percentage of construction workers in selected occupations in Southern California, 2007
Note:
Crane and tower operators, dredge, excavating and loading machine and dragline operators, paving, surfacing and tamping equipment operators and miscellaneous construction equipment operators were combined into the single category of equipment operators.
Source:
BBC Research & Consulting from 2007 American Community Survey data. The raw data extract was obtained through the IPUMS program of the MN Population Center: http://usa.ipums.org/usa/.
First-line supervisors (n=626)
Sheet metal workers (n=31)
Equipment operators (n=195)
Electricians (n=393)
Iron and steel workers (n=41)
Pipelayers, plumbers, pipefitters and steamfitters (n=329)
Glaziers(n=24)
Drivers, sales workers and truck drivers (n=103)
Carpenters (n=788)
Carpet, floor tile and marble layers (n=200)
Brickmasons, blockmasons and stonemasons (n=83)
Drywall, ceiling tile installers and tapers (n=184)
Painters (n=447)
Roofers (n=140)
Cement masons and terrazzo workers (n=71)
All helpers (n=66)
Plasterers and stucco masons (n=54)
Construction laborers (n=1,563)
All construction workers (n=7,849)
0% 10% 20% 30% 60%70%80%90%100%
9.4%
2.4%
4.4%
0.3%
3.1%
1.7%
1.5%
1.9%
1.1%
1.2%
1.2%
1.3%
1.8%
3.6%
2.2%
3.3%
100%
0.0%
0.0%
0.0%

BBC RESEARCH & CONSULTING – DRAFT REPORT APPENDIX F, PAGE 27
The study team also analyzed the percentage of women in construction occupations in San Diego County in 2000. Since small ACS sample sizes restricted analysis, 2007 figures for San Diego County are not presented.
In San Diego County, women made up slightly more than 10 percent of the construction workforce based on 2000 data, an increase from 1980. Several occupations including plasterers and stucco masons, cement masons and terrazzo workers, brick, bock and stone masons, glaziers, and sheet metal workers had zero female respondents from San Diego County in the 2000 census.
Overall, the trends seen in San Diego generally reflect those seen in all of Southern California in 2000, with some exceptions:
Women were a larger percentage of construction laborers in San Diego County than Southern California (3.1% versus 2.6%); and
Women were a higher percentage of painters in San Diego County (5.4%) than Southern California (4.0%).
Figure F-13. Women as a percentage of construction workers in selected occupations in San Diego County, 2000
Note:
Crane and tower operators, dredge, excavating and loading machine and dragline operators, paving, surfacing and tamping equipment operators and miscellaneous construction equipment operators were combined into the single category of equipment operators.
Source:
BBC Research & Consulting from 2000 U.S. Census 5% sample Public Use Micro-sample data. The raw data extract was obtained through the IPUMS program of the MN Population Center: http://usa.ipums.org/usa/.
First-line supervisors (n=416)
Sheet metal workers (n=35)
Machine operators (n=108)
Electricians (n=198)
Iron and steel workers (n=33)
Pipelayers, plumbers, pipefitters and steamfitters (n=211)
Glaizers(n=20)
Drivers, sales workers and truck drivers (n= 50)
Carpenters (n=528)
Carpet, floor tile and marble layers (n=154)
Brickmasons, blockmasons and stonemasons (n=51)
Drywall, ceiling tile installers and tapers (n=132)
Painters (n=287)
Roofers (n=96)
Cement masons and terrazzo workers (n=59)
All helpers (n=37)
Plasterers and stucco masons (n=44)
Construction laborers (n=703)
All construction workers (n=4,755)
0% 10% 20% 30% 60%70%80%90%100%
10.3%
3.1%
4.1%
0.4%
5.4%
1.6%
2.0%
2.5%
3.6%
0.3%
1.9%
2.2%
1.8%
100%
0%
0%
0%
0%
0%
0%

BBC RESEARCH & CONSULTING – DRAFT REPORT APPENDIX F, PAGE 28
Relative share of minorities and women in construction who are managers. Figures F-8 through F-13 show the representation of minorities and women among first-line supervisor positions in the Southern California and San Diego County construction industries. The study team also reviewed employment of minorities and women as managers, which is a higher position than first-line supervisor. Construction managers, on average, have more education than first-line supervisors. In Southern California in 2000, 25 percent of construction managers had at least a bachelor’s degree compared with 8 percent of first-line supervisors. The figures are similar at 31 percent and 11 percent, respectively, for San Diego County. Figure F-14 shows the proportion of workers in the construction industry who reported a “manager” occupation by race/ethnicity and gender groups in 1980, 2000 and 2007.
In 2000, roughly 11 percent of non-Hispanic whites working in the Southern California construction industry were managers. About 9 percent of Asian-Pacific Americans and 10 percent of Subcontinent Asian Americans were managers (not substantial differences from the rate for non-Hispanic whites).
In contrast, other minority groups and women had statistically significant lower proportions of workers who were managers in Southern California compared to non-Hispanic whites and men:
Only 2.4 percent of Hispanic Americans and 5.2 percent of African Americans working in construction in Southern California in 2000 were managers.
Managers represented 8 percent of Native Americans working in construction.
In 2000, a smaller proportion of women than men working in construction were managers (4.4% versus 6.8%).
The percentage of managers in most groups increased from 2000 to 2007. However, the percentages of African American, Subcontinent Asian American and Hispanic American managers were still small compared to non-Hispanic whites in 2007. All of these differences are statistically significant. Also, a smaller percentage of women than men working in construction were managers.
Similar to all of Southern California, African Americans and Hispanic Americans in San Diego County were less likely to be managers than were non-Hispanic whites; women were less likely to be managers than were men. Unlike Southern California, the relative number of Asian-Pacific American managers in San Diego County is substantially less than the number of non-Hispanic white managers.

BBC RESEARCH & CONSULTING – DRAFT REPORT APPENDIX F, PAGE 29
Figure F-14. Percentage of construction workers who work as a manager in San Diego County, Southern California and the U.S., 1980, 2000 and 2007
Note:
** Denotes that the difference in proportions between the minority and non-Hispanic white groups (or female and male gender groups) for the given Census/ACS year is statistically significant at the 95% confidence level.
Source:
BBC Research & Consulting from 1980 and 2000 U.S. Census 5% sample and 2007 ACS Public Use Micro-sample data. The raw data extracts were obtained through the IPUMS program of the MN Population Center: http://usa.ipums.org/usa/.
San Diego County
Race/ethnicity
African American 2.5 % 2.4 % ** 6.8 %
Asian-Pacific American 13.8 6.0 ** 8.9
Subcontinent Asian American 0.0 27.6 0.0
Hispanic American 2.6 ** 2.2 ** 4.1 **
Native American 12.5 4.4 1.5 **
Other minority 16.7 5.3 40.7
Non-Hispanic white 5.7 10.4 16.8
Gender
Female 7.8 % 3.6 % ** 7.8 % **
Male 5.1 7.6 11.7
All individuals 5.3 % 7.2 % 11.2 %
Southern California
Race/ethnicity
African American 1.5 % ** 5.2 % ** 6.9 % **
Asian-Pacific American 5.9 9.2 12.6
Subcontinent Asian American 6.9 10.2 4.3 **
Hispanic American 2.0 ** 2.4 ** 3.6 **
Native American 7.3 8.0 13.5
Other minority 2.8 9.5 15.8
Non-Hispanic white 5.9 10.7 14.3
Gender
Female 6.3 % ** 4.4 % ** 6.4 %
Male 4.8 6.8 8.3
All individuals 4.9 % 6.6 % 8.1 %
United States
Race/ethnicity
African American 1.4 % ** 2.9 % ** 4.9 % **
Asian-Pacific American 3.6 ** 6.9 9.0
Subcontinent Asian American 5.2 10.2 ** 9.5
Hispanic American 1.9 ** 2.4 ** 3.0 **
Native American 2.2 ** 4.1 ** 6.8 **
Other minority 4.5 5.8 ** 2.7 **
Non-Hispanic white 4.6 7.1 10.0
Gender
Female 5.1 % ** 4.0 % ** 5.8 % **
Male 4.1 6.2 8.2
All individuals 4.1 % 6.0 % 8.0 %
1980 2000 2007
1980
1980 2007
20072000
2000

BBC RESEARCH & CONSULTING – DRAFT REPORT APPENDIX F, PAGE 30
Summary of Entry and Advancement in the Construction and Engineering Industries
BBC’s analysis suggests that barriers to entry into the construction and engineering industries in Southern California may begin with education and continue through occupational advancement. Initial results include:
College education appears to be a barrier for entry of African Americans, Hispanic Americans and Native Americans into the engineering industry in San Diego County and Southern California. Disparities in educational attainment for African Americans and Hispanic Americans appear at the high school level, which may affect college opportunities.
There is low representation of women among civil, environmental and geological engineers.
Representation of African Americans in the construction industry is relatively low compared to all industries in Southern California and San Diego County, even among entry-level jobs.
The representation of women in construction as a whole is relatively low.
There appear to be disparities in the advancement of Hispanic Americans to certain construction occupations and first-line supervisor positions.
Relatively few African Americans, Hispanic Americans and women working in construction are managers.
Many of the patterns of disparity seen in entry into the United States construction and engineering industries are also present when only considering Southern California or San Diego County.