Scrutinising the MPI: Brief reflections on Dotter and Klasen’s proposals Sabina Alkire and OPHI...
27
Scrutinising the MPI: Brief reflections on Dotter and Klasen’s proposals Sabina Alkire and OPHI colleagues 4 March 2013 A background paper is available upon request
-
Upload
francis-hecox -
Category
Documents
-
view
223 -
download
3
Transcript of Scrutinising the MPI: Brief reflections on Dotter and Klasen’s proposals Sabina Alkire and OPHI...

Scrutinising the MPI:
Brief reflections on Dotter and Klasen’s proposals
Sabina Alkire and OPHI colleagues 4 March 2013
A background paper is available upon request

Proposals by Dotter and Klasen 2013Empirical Issues1. Dropping the use of the World Health Survey 2. Dynamics exhibited by the MPI 3. Dropping access to electricity, cooking fuel and sanitation
4. Shortening the attendance to school window by two years
5. Restricting the indicator of mortality to children under 5 years of age
6. Modifying the nutritional indicator 7. On adjusting some indicators for hh size8. A ‘hybrid’ approach?9. On severe multidimensional poverty
Conceptual Issues1. Union vs. intermediate poverty cutoff 2. On reporting H and not MPI nor Intensity3. On reporting inequality in the spread of deprivations4. On using a weakly-relative approach to deprivation cutoffs 2

Proposals by Dotter and Klasen 2013Empirical Issues1. Dropping the use of the World Health Survey 2. Dynamics exhibited by the MPI 3. Dropping access to electricity, cooking fuel and
sanitation 4. Shortening the attendance to school window by two
years5. Restricting the indicator of mortality to children under
5 years of age6. Modifying the nutritional indicator 7. On adjusting some indicators for hh size8. A ‘hybrid’ approach?9. On severe multidimensional poverty
Conceptual Issues1. Union vs. intermediate poverty cutoff 2. On reporting H and not MPI nor Intensity3. On reporting inequality in the spread of deprivations
4. On using a weakly-relative approach to deprivation cutoffs3

E1. Dropping the World Health SurveyUsing only DHS and MICS surveys
Yes! Data are not good quality Data are old
Implications: This will entail dropping 14 countries in 2014:
• China, Croatia, Czech Republic, Ecuador, Estonia, Guatemala, Hungary, Latvia, Paraguay, Russian Federation, Slovakia, Slovenia, Sri Lanka, United Arab Emirates
We anticipate at least 3 will be updated in 2014:
• Tunisia, Uruguay, Chad
Problem: how to update MPI for China?4
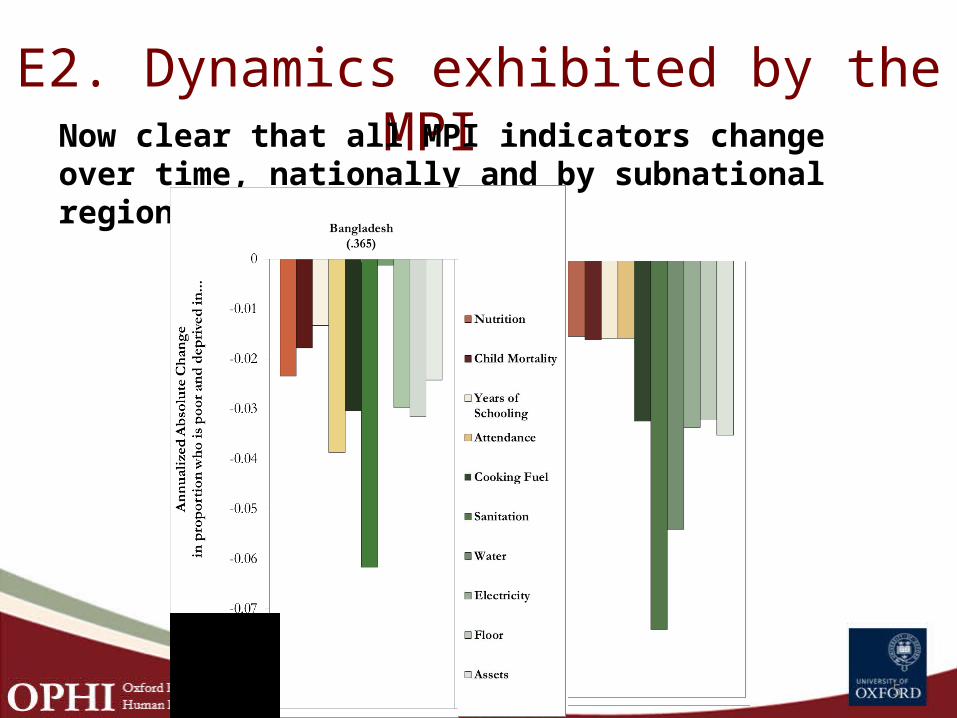
E2. Dynamics exhibited by the MPI Now clear that all MPI indicators change over time, nationally and by subnational regions or groups.
5

Inside the Regions of Nigeria
North Cen-tral
North East
North West
South East
South South
South West
-8.0
-7.0
-6.0
-5.0
-4.0
-3.0
-2.0
-1.0
0.0
1.0
2.0
3.0
AssetsCooking FuelFlooringSafe Drinking WaterImproved San-itationElectricityNutritionChild Mortal-ityYears of SchoolingSchool At-tendanceA
nnuali
zed A
bso
lute
Change i
n
the P
erc
enta
ge W
ho i
s P
oor
and
Depri
ved i
n..
.

E3. Drop electricity, cooking fuel & sanitation
Empirical analysis We implemented multiple measures of
association across MPI censored deprivation indicators as well as raw headcounts and achievements (Alkire and Ballon, 2012).
This was, particularly, to explore redundancy in the standard of living indicators. We had expected to encounter redundancy.
Statistically, we could not detect redundancy: no two indicators moved in lockstep, having consistently high associations across countries having different levels of MPI and different regions. 7

E3a. Drop electricity? (no)
Electricity
Access to electricity remains key to those who lack it.
Romer’s image of children doing homework under a street light.
A question on loadshutting, affordability would improve accuracy.
8

E3b. Drop cooking fuel? (no)
Cooking Fuel -
2010 Global Burden of Disease estimates health burdens from cooking fuel are far higher than previously thought:
4 million deaths, of which 0.5 million are children, from Harmful Air Pollution (HAP) and cookfire smoke.
In DALYs, HAP is 2nd most important risk factor for girls/women’s lost health life years globally and 1st in South Asia and Sub-Saharan Africa.
A follow-up question on ventilation would greatly improve accuracy.
9

E3c. Drop sanitation? (no)
Sanitation
• “1.1 billion people – 15% of the world’s population” – still resort to open defecation. The Report on Progress on Drinking Water and Sanitation 2012 Update UNICEF & WHO, p 19
• “far more countries have sanitation coverage of less than 50% than water coverage of less than 50%” (Ibid, p 18)
• Dropping sanitation will lead to visible falls in the MPI
• Perhaps it should be retained.
10

E4. Shorten school attendance by 2 years
(kids often start late, so increase starting age)
Poor children tend to start school later and drop out earlier. The proposed change will overlook such differences. 2012 EFA
In Guatemala, “indigenous girls from extremely poor households enroll in school 1.2 years later than indigenous girls from non-poor households… and are far more likely to drop out.” (2010 EFA Report p 170)
In [the poorest regions of] Nigeria, Hausa girls who go to school tend to start late... To compound the problem, marriage at 14 or even younger is common and typically signals the end of education’. (2010 EFA Report p.167)
11

E5. Restrict Child mortality to Children under 5
Normatively, the death of a six-year-old is also a devastating experience of total health functionings failure.
Empirically, This proposal was implemented in 2010 for HDRO Advisors using DHS, and does not affect country rankings.
Our proposal, Where possible, only use information about any child deaths that occurred in the past 5 years. This will reduce any large lag effect. Note: only possible in DHS, not MICS.
12

C1. Union vs. intermediate poverty cutoff
Union has been implemented before, and criticised as inaccurate (Mack and Lansley 1985, even Townsend)
MPI cutoff ‘cleans’ data of imperfect indicators and spurious deprivations, to identify acute multidimensional poverty.
Permits diversity – e.g. for indigenous groups, climactic variations, personal preferences.
13
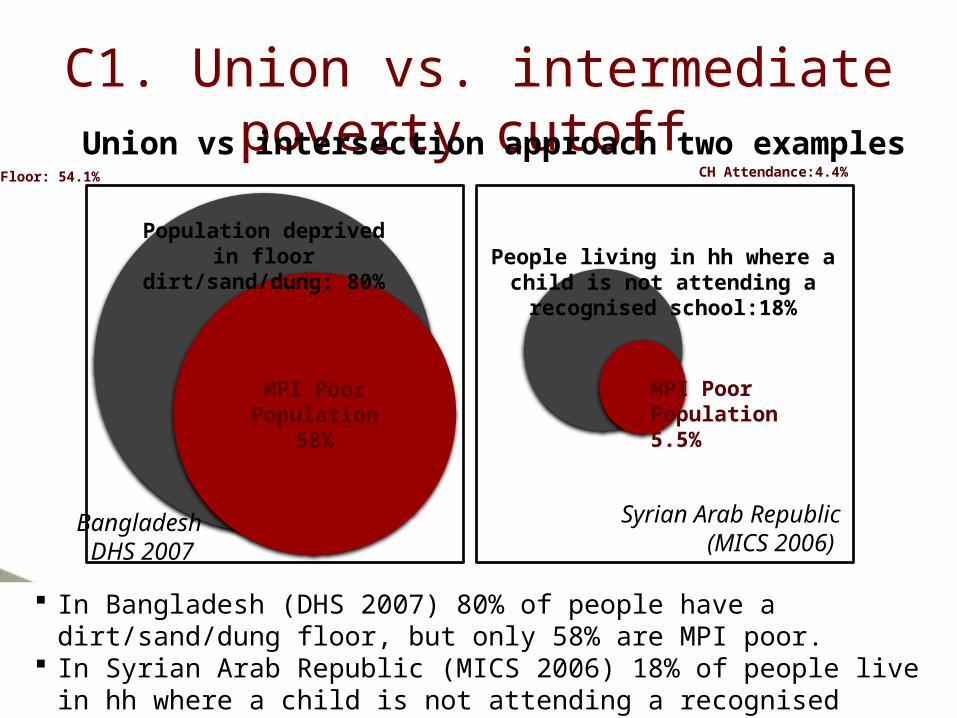
C1. Union vs. intermediate poverty cutoffUnion vs intersection approach two examples
14
MPI Poor Population
58%
Bangladesh DHS 2007
Population deprived in floor dirt/sand/dung:
80%People living in hh where a
child is not attending a recognised school:18%
Syrian Arab Republic (MICS
2006)
MPI Poor Population 5.5%
CH Attendance:4.4%CH Floor: 54.1%
In Bangladesh (DHS 2007) 80% of people have a dirt/sand/dung floor, but only 58% are MPI poor.
In Syrian Arab Republic (MICS 2006) 18% of people live in hh where a child is not attending a recognised school. Only 5.5% are MPI poor.
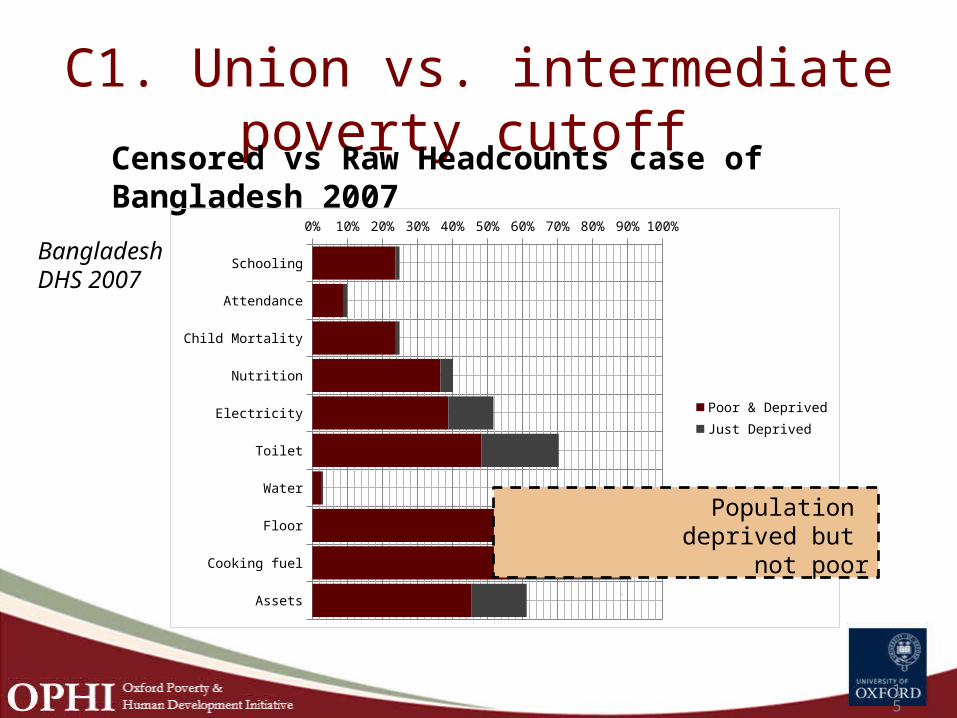
C1. Union vs. intermediate poverty cutoff
Censored vs Raw Headcounts case of Bangladesh 2007
15
Schooling
Attendance
Child Mortality
Nutrition
Electricity
Toilet
Water
Floor
Cooking fuel
Assets
0% 10% 20% 30% 40% 50% 60% 70% 80% 90% 100%
Poor & DeprivedJust Deprived
Population deprived but
not poor
Bangladesh DHS 2007

C1. Union vs. intermediate poverty cutoffExample: 16 African Countries
Countries’ high headcount ratios using union (politically possible?)
50%
55%
60%
65%
70%
75%
80%
85%
90%
95%
100%
86%84%
92%
85%
63%
87%
74%
83% 81%
72%
54%
77%
56%60%
58%
64%
Current Multi-dimensional Poverty Head-count (k=1/3)
Population de-prived in more than one indica-tor but less than 33% of the total number of indi-cators
Multidimensional Headcount Union Approach

C2. On reporting H and not MPI nor IntensityWe propose retaining MPI, H and A
UNICEF’s global child poverty headcount was roundly criticised for overlooking intensity (Delamonica and Minujin, 2007)
H lacks dimensional monotonicity altogether.
MPI provides a political incentive to reach the poorest.
Change in intensity is particularly relevant in poor countries, and in MPI ‘superstars’ (Bangladesh) (Alkire and Roche forthcoming 18 March 2013)
17
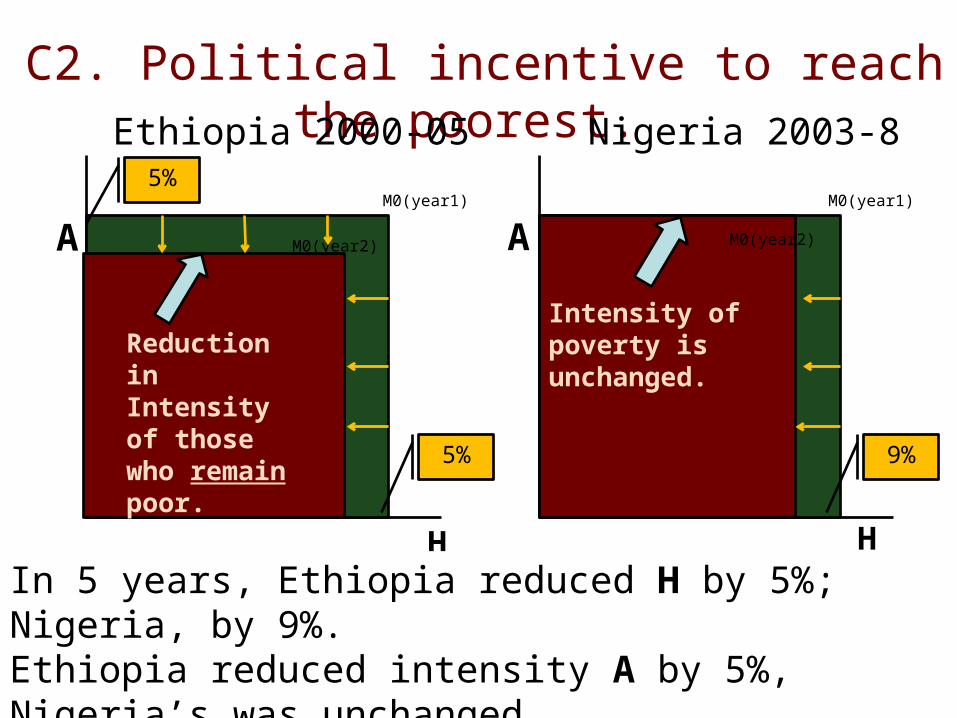
C2. Political incentive to reach the poorest. Ethiopia 2000-05 Nigeria 2003-8
H
AM0(year1)M0(year1)
M0(year2) M0(year2)
In 5 years, Ethiopia reduced H by 5%; Nigeria, by 9%. Ethiopia reduced intensity A by 5%, Nigeria’s was unchanged.Ethiopia reduced MPI more. H would overlook this.
9%5%
5%
Reduction in Intensity of those who remain poor.
Intensity of poverty is unchanged.
H
A

19
Reductions by H (beige) and A (rose)
-.030 -.025 -.020 -.015 -.010 -.005 .000 .005 .010
Annualized Absolute Variation in MPI-.030 -.020 -.010 .000 .010
NepalRwandaBangladeshGhanaTanzaniaCambodiaBoliviaUgandaEthiopia 1Ethiopia 2LesothoNigeriaKenyaMalawiZimbabweIndiaPeruColombiaSenegalGuyanaJordanArmeniaMadagascar
Annualized Absolute Variation in MPI-.030 -.020 -.010 .000 .010
NepalRwandaBangladeshGhanaTanzaniaCambodiaBoliviaUgandaEthiopia 1Ethiopia 2LesothoNigeriaKenyaMalawiZimbabweIndiaPeruColombiaSenegalGuyanaJordanArmeniaMadagascar
Annualized Absolute Variation in MPI
79%
68%67%
79%
21%
32%33%
21%
71%
74%85%
78%
37%
45%83%
94%83%
60%79%
88%
86%90%
16%
95%
107%
29%
26%15%
22%
63%55%
17%
6%17%
40%
21%12%
14%10%
16%
Em
barg
oed
Bangladesh

C3. Reporting inequality in intensity We will propose reporting an inequality indicator
alongside MPI, H, and A (Alkire and Foster, forthcoming)
If that measure were to reflect absolute inequality and to satisfy key principles for policy relevance (Alkire and Seth, 2013):– Additive Decomposability– Population share weighted decomposability – Permutation invariance– Zero inequality when everybody has same deprivation
score– Increase in inequality due to regressive transfer (Dalton)
Then exactly one inequality measure can be used: Variance
(proof in Chakravarty 2001, discussion in Alkire and Seth 2013) Other measures can be used if other properties are desired.
20

MPI Inequality Measure 2014The measure reflects inequality among the deprivation
scores of the poor (or of the society - /n)
V(c) = Si (ci – m(c))2/q
where, V(c) the variance of the deprivation scores c, m(c)) is the mean of elements in c, and q is the number of poor* people.
Simply put, if all poor people are deprived in half the dimensions, this is more equal than if half are deprived in two-thirds and half in one-third of dimensions.
Alkire and Seth (2013) provide examples of this measure and its insights as well as different options that could be reported.
* could also be whole population
21

Example: Inequality among the poor in India over time by
caste
22
1998/9
Intensity (A)
HInequality
(across poor)
Within group
Between Group
caste A_caste poor_shr var_depr_caste_p within_group_p between_group_A
ST 57.0% 12.6% 2.75 SC 55.0% 22.1% 2.67 OBC 52.1% 33.3% 2.38 General 50.6% 32.0% 2.22 India 52.9% 100% 2.49 2.44 0.052005/6ST 56.3% 12.9% 2.86 SC 52.6% 22.9% 2.44 OBC 50.8% 42.1% 2.26 General 49.7% 22.0% 2.30 India 51.7% 100% 2.43 2.39 0.04
Inequality across all the poor declines gr
Inequality between caste groups (intensity) declines blue
Inequality in poorest caste (ST) increases – some are being left behind. red
Inequality in SC declines, as does poverty – a good sign. yellow
To consider inequality across MPIs, need to consider inequality across the censored deprivation vector

C4. A weakly-relative approach to deprivation cutoffs
Like Ravallion, we think this is interesting but not ready for policy.
Cross-country MPI comparisons: complex
MPI across time: complex
“An absolute approach in the space of capabilities translates as a relative approach in the space of commodities” Ravallion and Chen (2011) citing Sen (1983) The MPI gets a bit closer to capturing
underlying capabilities
Weakly relative requires cardinal data – how adapt?
23
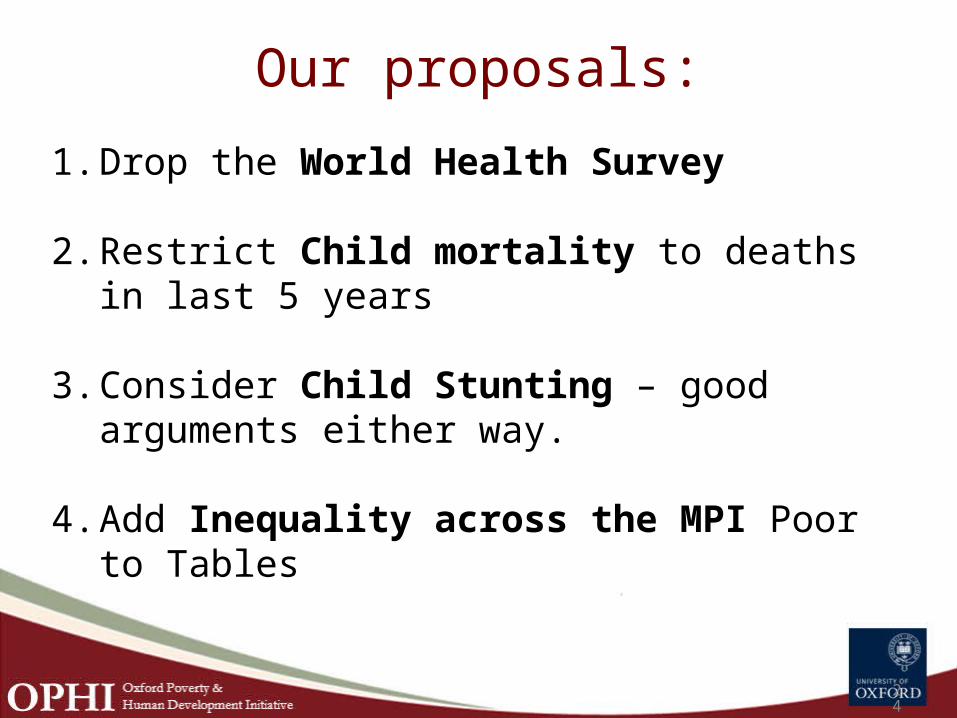
Our proposals:
1. Drop the World Health Survey
2. Restrict Child mortality to deaths in last 5 years
3. Consider Child Stunting – good arguments either way.
4. Add Inequality across the MPI Poor to Tables
24
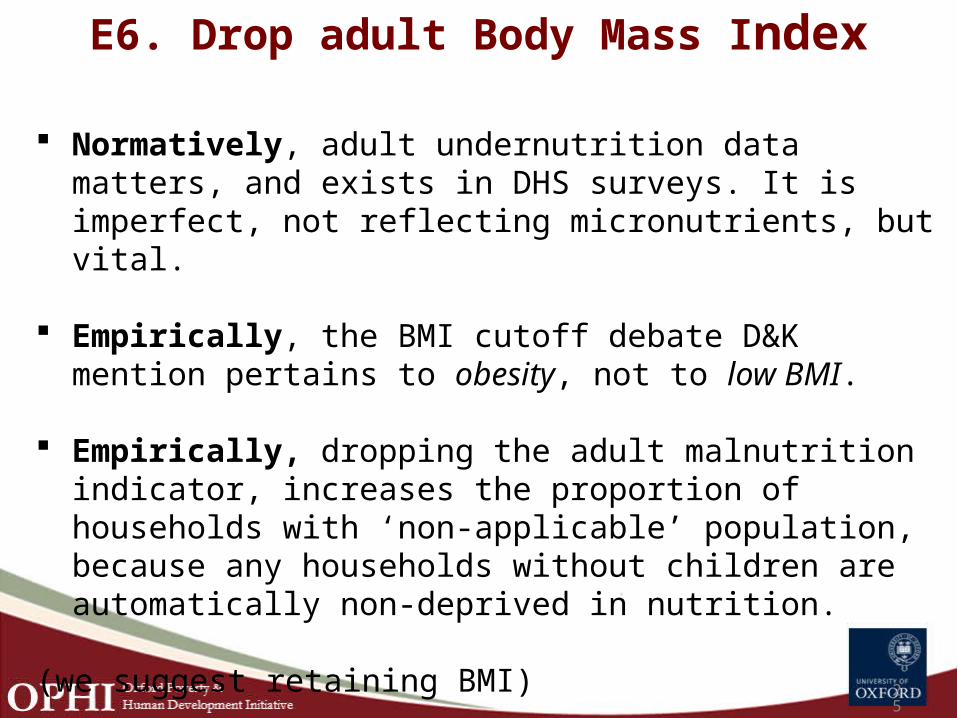
E6. Drop adult Body Mass Index
Normatively, adult undernutrition data matters, and exists in DHS surveys. It is imperfect, not reflecting micronutrients, but vital.
Empirically, the BMI cutoff debate D&K mention pertains to obesity, not to low BMI.
Empirically, dropping the adult malnutrition indicator, increases the proportion of households with ‘non-applicable’ population, because any households without children are automatically non-deprived in nutrition.
(we suggest retaining BMI)25

E7. Adjusting certain indicators by hh size? (worth exploring
academically further)•Years of education: The current distinction refers to the qualitative different case of a proximate literate from an isolate literate.
•From a human rights perspective, a child death, a malnourished person, or a child not attending school is worthy of consideration itself, even if other household members are not similarly deprived: would need careful justification to ignore these in large households.
26

E8. A hybrid approach? (no)
• It prevents break-down by indicator.
• We are unsure whether the ‘bias’ is actual. Children and women are vulnerable groups and may be actually poorer.
• Comparative work has shown hh size consistently matters less for MPI than for income. 27