Scotopic and photopic thresholds : a dependent variable ... · SCOTOPIC AND PHOTOPIC THRESHOLDS A...
46
Portland State University PDXScholar Dissertations and eses Dissertations and eses 1985 Scotopic and photopic thresholds : a dependent variable for the McCollough effect Marilyn Murphy Portland State University Let us know how access to this document benefits you. Follow this and additional works at: hp://pdxscholar.library.pdx.edu/open_access_etds Part of the Cognition and Perception Commons is esis is brought to you for free and open access. It has been accepted for inclusion in Dissertations and eses by an authorized administrator of PDXScholar. For more information, please contact [email protected]. Recommended Citation Murphy, Marilyn, "Scotopic and photopic thresholds : a dependent variable for the McCollough effect" (1985). Dissertations and eses. Paper 3529.
-
Upload
nguyennhan -
Category
Documents
-
view
229 -
download
0
Transcript of Scotopic and photopic thresholds : a dependent variable ... · SCOTOPIC AND PHOTOPIC THRESHOLDS A...

Portland State UniversityPDXScholar
Dissertations and Theses Dissertations and Theses
1985
Scotopic and photopic thresholds : a dependent variable for theMcCollough effectMarilyn MurphyPortland State University
Let us know how access to this document benefits you.Follow this and additional works at: http://pdxscholar.library.pdx.edu/open_access_etds
Part of the Cognition and Perception Commons
This Thesis is brought to you for free and open access. It has been accepted for inclusion in Dissertations and Theses by an authorized administrator ofPDXScholar. For more information, please contact [email protected].
Recommended CitationMurphy, Marilyn, "Scotopic and photopic thresholds : a dependent variable for the McCollough effect" (1985). Dissertations andTheses. Paper 3529.

AN ABSTRACT OF THE THESIS OF Marilyn Murphy for the Master of Science in
Psychology presented November 22, 1985.
Title: Scotopic and Photopic Thresholds: A Dependent Variable for the
McCollough Effect.
APPROVED 8Y MEMBERS OF THE THESIS COMMITTEE:
Gerald M. Murch, Cha~nnan -- --------
James Paul son
evaluate orientation-specific
colored aftereffects (Mccollough Effects) have thus far been unsuccessful
in yielding quantitative measures of relative strengths of the effects.
Similarly, little success has been shown in previous attempts to establish
what level of illumination is necessary in order to evoke the aftereffects.
The present study sought to determine (a) whether threshold measurements
could serve as adequate, quantitative dependent variables of the
Mccollough Effects, (b) whether photopic illumination was necessary in

order to evoke the aftereffect. It was predicted that the greater the
number of inspection trials, the dimmer the i11ijmination level could be
in order for the aftereffects to first be detected. In addition, it was·
predicted that the appearance of the test pattern would change markedly
near the rod-cone break. The strength of the McCollough Effects, as a
function of the number of inspection trials, was examined on subsequent
scotopic and photopic threshold measurements in normal color-visioned
subjects. All subjects were measured alternately on 10 ascending and 10
descending trials at specific times after being conditioned in "short"
(15 min) and "long" (30 min) inspection trials, counterba'lanced across
subjects, with a 7··day interval between test trials. Overall,
statistically insignificant results were achieved for both predictions;
possible explanation of the results and changes in experimental design
were discussed.
SCOTOPIC AND PHOTOPIC THRESHOLDS:
A DEPENDENT VARIABLE FOR THE McCOLLOUGH EFFECT
by
MARILYN MURPHY
A thesis submitted in partial fulfillment of the requirements for the degree of
MASTER OF SCIENCE in
PSYCHOLOGY
Portland State University
1985
PCRTIAHD STATE UNIVERSITY LIBPJRY
TO THE OFFICE OF GRADUATE STUDIES AND RESEARCH:
The members of the Committee approve the thesis of Marilyn Murphy
pre5ented Nove~ber 22, 1985.
James P au 1 son
APPROVED:
f~Psychol ogy
JJm F. , Dean of Graduate Studies and Research
TABLE OF CONTENTS
PAGE
LI ST OF TABLES ••'-'•••••••••• .. rl'•et.l'Ot11(1;eeeee v
CHAPTER
I INTRODUCTION • 1
3
3
II
I r l. l.;
PROCEDURES .. ., .. .. . . QUALITATIVE •
Unrestricted Colour Naming~ • • • • • • • • • • • 3 Forced-Choice Colouring Naming Procedure. .. • • • 3 Colour-cancellation • • • • • • • • • . • • • • • 4
HUE··MATC:11NG.
QUANTITATIVE.
Magnitude Estimation.
EVALUATION OF PAST RESEARCH EMPLOYING THRESHOLD MEASUREMENTSo ••••••
Spatial Features. • • • ... " Luminance Features ••• Temporal Parameters
LIMITATIONS •.• ~ . ~ ••
5
6
6
7
7 11 12
IV STROMEYER'S EXPERIMENT • • • • • • .. • • • .. u, • • •
V THE PRESENT STUDY • . . . . . . .
16
18
21
VI METHOD •.••
SUBJECTS ~ . • e ft
APPARATUS ••••• fl
PROCEDURE.
• • • • 24
• • • 24 24 25
VII RESULTS •• ~ ~ • ~ • o •• e " • • • • • • • • • • • • • 27
VIII DISCUSSION ... ~ •....•. ~ . . • . • . • . . • . 29

9£
38'7'd
. . . . . . . . . . . "' . . . . . . . . . . . . . . . . S3:>N3~3.:13~ mldV'H:l

SE • • • • I I
• • • • • • • • • • • ·ell? P M'l? ~ I
39Vd 318Vl
S318V! .:10 !Sil
CHAPTER I
INTRODUCTION
SCOTOPIC AND PHOTOPIC THRESHOLDS
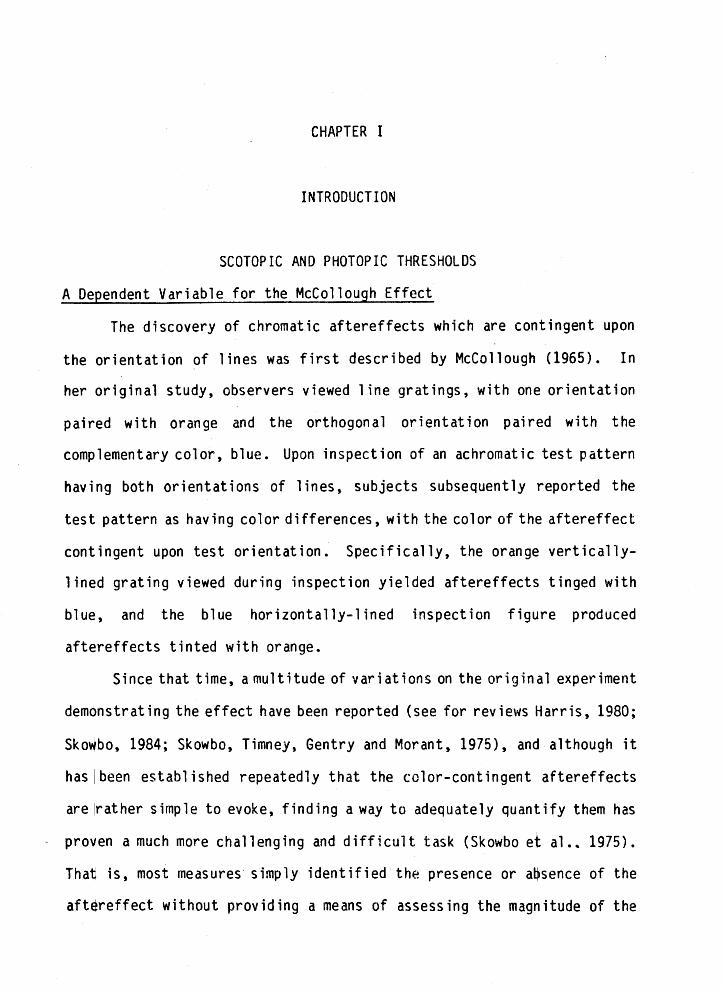
A Dependent Variable for the McCollough Effect
The discovery of chromatic aftereffects which are contingent upon
the orientation of lines was first described by Mccollough (1965). In
her original study, observers viewed line gratings, with one orientation
paired with orange and the orthogonal orientation paired with the
complementary color, blue. Upon inspection of an achromatic test pattern
having both orientations of lines, subjects subsequently reported the
test pattern as having color differences, with the color of the aftereffect
contingent upon test orientation. Specifically, the orange vertically-
1 ined grating viewed during inspection yielded aftereffects tinged with
blue, and the blue horizontally-lined inspection figure produced
aftereffects tinted with orange.
Since that time, a multitude of variations on the original experiment
nstrating the effect have been reported (see for reviews Harris, 1980;
Skowbo, 1984; Skowbo, Timney, Gentry and Morant, 1975), and although it
has I been established repeatedly that the color-contingent aftereffects
are 1rather simple to evoke, finding a way to adequately quantify them has
uch more challenging and difficult task (Skowbo et al., 1975).
Thati is, most measures· simply identified· the presence or a~sence of the
aftereffect without providing a means of assessing the magnitude of the
2
effect. Thus the impact of variations in independent variables have
proven difficult to evaluate. The following summarizes the qualitative
and quantitative procedures used to evaluate the Mccollough Effect.
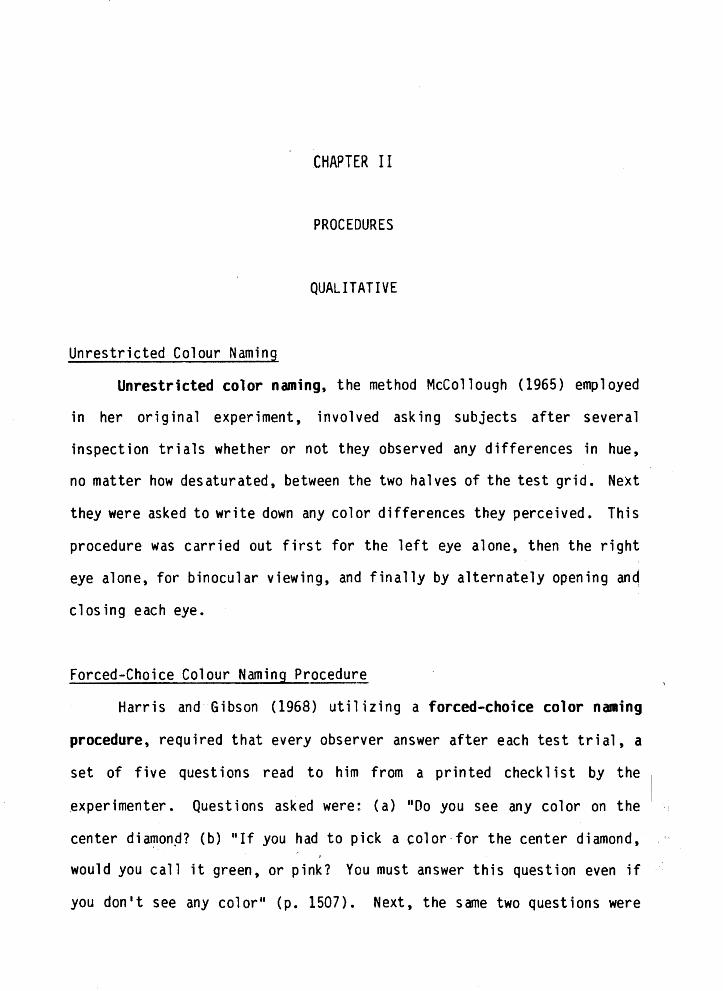
CHAPTER II
PROCEDURES
QUALITATIVE
Unrestricted Colour Naming
Unrestricted color naming, the method Mccollough (1965) employed
in her original experiment, involved asking subjects after several
inspection trials whether or not they observed any differences in hue,
no matter how desaturated, between the two halves of the test grid. Next
they were asked to write down any color differences they perceived. This
procedure was carried out first for the left eye alone, then the right
eye alone, for binocular viewing, and finally by alternately opening and
closing each eye.
Forced-Choice Colour Naming Procedure
Harris and Gibson (1968) utilizing a forced-choice color naming
procedure, required that every observer answer after each test trial, a
set of five questions read to him from a printed checklist by the
_experimenter. Questions asked were: (a) "Do you see any color on the
center diaf!1on.d? (b) "If you had to pick a color-for the center diamond,
would you call it green, or pink? You must answer this question even if
you don't see any color" (p. 1507). Next, the same two questions were
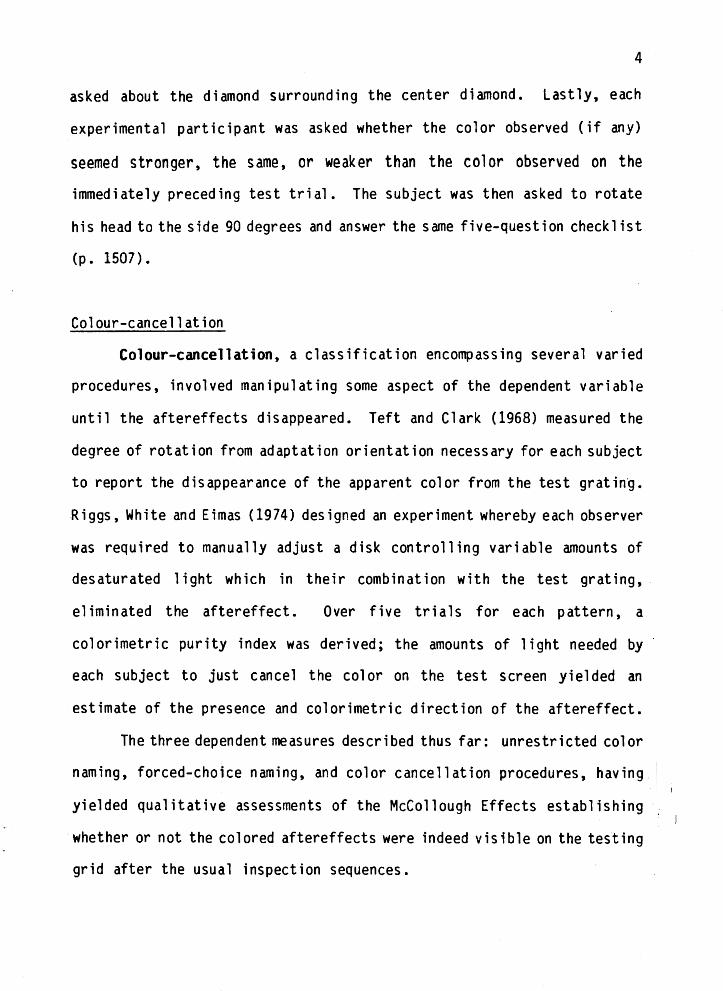
4
asked about the diamond surrounding the center diamond. Lastly, each
experimental participant was asked whether the color observed (if any)
seemed stronger, the same, or weaker than the color observed on the
immediately preceding test trial. The subject was then asked to rotate
his head to the side 90 degrees and answer the same five-question checklist
(p. 1507).
Colour-cancellation
Colour-cancellation, a classification encompassing several varied
procedures, involved manipulating some aspect of the dependent variable
until the aftereffects disappeared. Teft and Clark (1968) measured the
degree of rotation from adaptation orientation necessary for each subject
to report the disappearance of the apparent color from the test grating.
Riggs, White and Eimas (1974) designed an experiment whereby each observer
was required to manually adjust a disk controlling variable amounts of
desaturated 1 ight which in their combination with the test grating,
eliminated the aftereffect. Over five trials for each pattern, a
colorimetric purity index was derived; the amounts of light needed by
each subject to just cancel the color on the test screen yielded an
estimate of the presence and colorimetric direction of the aftereffect.
The three dependent measures described thus far: unrestricted color
naming, forced-choice naming, and color cancellation procedures, having
yielded qualitative assessments of the Mccollough Effects establishing 1
whether or not the colored aftereffects were indeed visible on the testing
grid after the usual inspection sequences.

5
HUE-MATCHING
Researchers who employed hue-match;ng as the dependent variable of
choice began to span the distance between qualitative and quantitative
assessments determining not only t~e presence or absence of the effects,
but attempting to evaluate the strengths of the effects relative to.each
other. In Stromeyer 1 s (1969) design, following several inspection trials,
subjects were requested to match Munsell colored papers with the color
of the aftereffects perceived on the test grating. The Munsell (1941)
system of color notation consists of a set of colored paper chips arranged
such that they are just noticeably different from each other in terms of
hue, saturation, and brightness. Arrayed on the pages of a book, each
page represents a different color, with saturation ordered along the
horizontal dimension of each page and brightness along the vertical
dimension. An experimental participant is then able to identify an unknown
color experience by matching it to the Munsel 1 chip it most closely
approximates. Thus, both the direction of the color (qualitative) and
the magnitude of the color (quantitative) can be evaluated, the former
given by hue identification and the latter given by the degree of
saturation.
Using a somewhat different process, Stromeyer (1972), by use of a
rotating polarizer, required subjects to manually adjust the saturation
of a projected field of color of similar hue to that of the test grating,
to match the strength of the color observed on the test grating.
Murch and H.irsch (1972), after asking subjects to first name the
color they observed on the test gratings, rendered useful hue-matching

6
by means of a projection colorimeter. This enabled them to measure the
amount of each primary wavelength required by the subject to match the
colo~·of each of two test fields. These colorimetric values were then
converted to CIE x,y coordinates. The CIE (International Commission on
Illumination) was established in 1924 to adopt" a standard colorimetric
system, dictated by the facts of color mixture using X (red), Y (green),
Z (blue), as the three primary wavelengths (Wasserman, 1978) ..
A tristimulus projection colorimeter was used in Skowbo, Gentry,
Timney and Morant 1 s (1974) exper imenta 1 design; after subjects were
presented with the usual Mccollough Effect adaptation sequence, they wefe
then exposed to five post-adaptation stimulation (PAS) conditions. tn
order to measure the impact of the PAS states upon the rate of deca
the aftereffects, a homogeneous chromatic field was presented to the right
eye. Subjects were asked to adjust the wavelength contributions in order
to match the color on the test gratings viewed with the left eye. The
obtained values were then converted into CIE· chromaticity coordinates.
Several other investigators have used a similar approach (Hirsch & Murch,
1972; MacKay & MacKay, 1977; Murch, 1979, Timney, Gentry, Skowbo & Morant,
1974) in attempting to quantify the Mccollough Effects.
QUANTITATIVE:
Magnitude Estimation
Stromeyer's (1969) paradigm for determining the relative strengths
of the aftereffects involved asking each subject to assess the saturation
of the first aftereffect viewed during the test phase by assigning to it

7
an arbitrary number. Each successive aftereffect was then rated in
proportion to the first number, thereby yielding a magnitude estimation
for each aftereffect. This procedure marked the transition from
qualitative to quantitative dependent measures of the Mccollough Effects.
EVALUATION OF PAST RESEARCH EMPLOYING THRESHOLD MEASUREMENTS:
Threshold Measurements
In the continuing search for quantitative dependent variables of
the Mccollough Effects, it was found that by systematically manipulating
various features of the independent variables (spatial, luminance and
temporal parameters of the inducing and testing grids, and using the
aforementioned techniques to gauge them) far more informative threshold
measurements of the strengths of the aftereffects relative to each other
could be obtained. Thus, researchers were now able to quantify, by
altering such variables, the minimum stimulus energy necessary for an
observer to indicate an awareness of stimulus change (Wolman, 1973, p.
386).
Spatial Features
Variations in spatial features of the inducing and test grids were
extensively pursued. In light of Hubel and Wiesel's (1968) findings that
electrical stimulation applied to certain cells located within the striate
cortex of the cat revealed orientation specific units with a high degree
of angular specificity, and results from experiments with monkeys
stimulated in the same cortical region yielding cells even more selective I I ~

8
to orientation, Fidell (1968) postulated that perhaps within the human
visual system there could also be edge-detecting units selectively
sensitive to different orientations of lines. The Mccollough Effect would
therefore be evoked only if the orientation of lines on each pair of
adapting grids (paired with complimentary colors) were divergent enough
from each other to stimulate different populations of cortical units
Fidell attempted then to arrive at a quantitative index of {a) the minimum
angle of divergence between adapting stimuli necessary to produce the
effect and, (b) the intensity of the effect at different angles of
divergence. This was accomplished by recording each subject's verbal
color-detection response {"hue" or "no hue"), then their verbal forced-
choice color naming response {11 red 11, "green", "blue" or" "yellow") after
each presentation of the test stimulus. To measure the strengths of the
effects, experimental observers were required to manually adjust an
unmarked dial which varied the saturation, or colorimetric purity, of the
test pattern in order to equalize each to a neutral color. Pre- and
postadaption readings were taken on the unpatterned control stimulus to
measure the amount of generalized color adaption {usually negligible) on
each half of each patterned test stimulus.
Not only were orientation thresholds obtained as possible
determinants of the intensity of the effects, but "density" thresholds
as well. Teft and Clark (1968), using the color-cancellation procedure
discussed earlier, examined the relationship of the density of lines
between adapting and test patterns. By varying the density of lines, or
number of edges between adapting and test patterns, they were able to
measure the degree of rotation from adapting orientation necessary for

9
the subject to report the disappearance of the apparent color from the
test field.
Supported by physiological findings from animal research (Hubel and
Wiesel, 1968) Lovegrove and Over (1972) presented observers with the usual
McCollough Effect adaptation sequences varying however, the spatial
frequenfies between the vertical and horizontal inspection grids.
Subjectk were then instructed to report verbally whether or not either
half of the test display appeared colored, and if it did, would the color
most approximate green or red; the forced-choice color naming procedure
employed by Harris and Gibson (1968).
Leppmann (1973), utilizing inducing grids of differing spatial
frequencies, was able to demonstrate the corresponding color-conditioned
aftereffects using a variable-frequency test grid. By obtaining verbal,
hence qualitative, estimates of (a) the appearance of colors on the test
field and (b) the saturation of the colors on the test grid relative to
each other, he was abl~ to show the strongest effects on the portion of
the variable-frequency test field that most closely resembled the spatial
frequency of the inducing grid.
Riggs (1973), using pairs of oppositely curved inspection grids
projected on red and green colored backgrounds respectively, was able to
induce the subjective colors using achromatic test fields composed of
alternating patterns of convex/concave lines. Observers were asked to
verbally indicate whether or not there seemed to be any hue differences
on the test panels.
Following this, conditioning continued until subjects were able to
correctly name the appropriate color for each particular curvature.
I I {
r f
I ~'
" !i
i
t'j
: .; ~ ;
i .¢ l
t r r r i
10
Regardless of the degree of curvature observed on the grids during
conditioning trials, the most vivid aftereffects were reported on those
test fields with the most strongly curved panels, and viewing inspection
patterns with stronger curvatures yielded McCol lough Effects more rapidly
than did viewing grids composed of more weakly curved lines.
Demonstrating results of a similar nature, White and Riggs (1974)
produced the effects using inspection panels composed of oppositely
po inted chevron CV-shaped) patterns. Presented with achromatic test
grids, experim~ntal participants were asked to verbally judge the
appearance of any color present on any portion of the grid. If any color
was reported, they were then asked to specify what portion of the test
pattern appeared colored and to name the color. The Mccollough Effects
were most easily induced when the lines of the chevron patterns used
during inspection formed 90 degree angles.
Following the usual adaptation sequences, Sharpe and Tees {1978)
measured the strength of the subjective aftereffects using magnitude
estimations by asking subjects to verbally respond to the following
questions when presented with the testing stimuli:
Do you observe any color differences between the two halves? If
so, assign simple color names to the different halves; then assign
a value of five on a scale from zero to five to the strongest
aftereffect elicited, and scale all subsequently presented test
patterns (p. 452).
Using inducing grids composed of segmented or blurred lines,
observers reported the strongest colored aftereffects on test panels with

11
complete or focused lines: the magnitude of the effects decreased as the
similarity of the inspection and test grids decreased.
Luminance Features
While not as widely investigated as other possible parameters of
the effects, systematic man i pul at i ans of luminance features of the
adapting and testing fields were concurrently pursued. Stromeyer and
Mansfield (1970), the first investigators to provide information about
the luminance parameters of the inducing grids used to evoke the subjective
colors, employed an unrestricted color naming procedure. They determined
that rather than the effects being dependent on some absolute level of
adaptation illumination, marked decreases in luminance levels of the
inspections grids could occur without there being a corresponding cha~ge
in the aftereffects.
Following brief (5 sec) and prolonged (15 sec) adaptation to
horizontally or vertically lined grids paired with varying background
colors, Timney, Gentry, Skowbo and Morant (1975) measured luminance
thresholds for test fields of identical or differing orientation and
wavelength. After inspection trials, observers were required to manually
adjust a neutral density wedge until such time that the subjective colors
were just apparent on the test target. Brief viewing durations yielded
slight elevations in orientation--specific luminance thresholds while
prolonged adaptation produced larger orientation specific thresholds.
Using a color-cancellation technique, White (1976) revealed that
over inspection trials of equal duration, stronger effects were induced
using high luminance adaptation gratings rather than lower luminance

12
gratings and stronger effects were viewed on lower luminance test fields
than higher luminance fields.
Investigating pattern contrast, Schmidt and Finke (1979) reported
that stronger subjective col ors were observed on high-contrast test
patterns, the strength attributable to the high degree of luminance
contrast present within each test target rather than to similarities in
luminance levels between inspection and testing grids. The effects were
assessed using a forced-choice procedure; participants were requested to
"inspect the pattern for at least several seconds and then, when ready,
write down on the prepared form which half of each test slide appeared
"redder" or "greener" (p. 409). Directly following each experimental
session, subjects were encouraged to write a short description of their
observations and then discuss them briefly with the investigator.
Using a similar procedure, Mikaelian (1980) determined that high
contrast adaptation figures yielded subjective reports of stronger
Mccollough Effects than did low-contrast inspection fields.
Temporal Parameters
Variations in temporal parameters were methodically investigated.
Looking at rates of acquisition of the McCollough Effects, Stromeyer
(1969) first reported that the rate of alternation between inspection and
test figures seemed to have little effect in evoking the subjective colors
on stationary test gratings. Skowbo and Rich (1982) using a hue-matching
assessment procedure, strove to relate relative strengths of the
aftereffects to the length of exposure to adapting fields. Their results,
plotted on an acquisition curve, revealed a steep rise in strength

13
initially, followed by more moderate increments in strength. In a related
view, Skowbo and White (1983) manipulated trial duration and the number
of alternations of adapting grids within trials. St at i st i ca 11 y
significant results were achieved for trial length only; the number of
color/contour pairings had no significant effect.
Longevity and rates of decay of the colors were similarly pursued.
That they could last as long as six weeks after a 20 min inspection
sequence was demonstrated by Stromeyer and Mansfield (1970). Riggs et
a 1. (1974) have noted increases in the magnitude of the effects with
adaptation times of up to 150 min and MacKay and MacKay (1974) showed
strengthening of the colors after periods of sleep. Pursuant to MacKay
and MacKay (1974) results, Lund and MacKay (1983) found that subjects
could lose up to 50% of initial strength of the aftereffects, if deprived
of three to four hr of sleep the night preceding experimental sessions.
Finally, other researchers have manipulated the temp or a 1
relationship between contour/color pairings during inspection sequences,
attempting to shed light on a mechanism or underlying model to explain
the effects. As the physiological basis of the McCollough Effect is at
present unknown, two theoretical models have emerged, each attributing
the colors to different processes occurring within the visual system.
One class of models assumes a static, 11 prewired 11 visual system, whereby
col or-coded edge detectors undergo chromatic adapt at ion (a change in
sensitivity) after being exposed to the usual Mccollough Effect inspection
sequences. The second class of models credits the aftereffects to a
conditioning, or learning process during which the background color of
inspe~tion panel serves as the UCS and the lined grading as the CS.
14
After rep~ated pairing, the 1 ined grid alone functions to evoke the colored
aftereff~cts, the CR.
Murch (1976) pursuing this line of reasoning, attempted to explore
the temporal relationship between the UCS and the CS, employing both a
delay and trace conditioning paradigm. Using magnitude estimations
ranging from negative numbers if the test stimulus appeared "pinkish"~
to positive numbers if the test target appeared "greenish" to assess th~
strengths of the effects, he demonstrated that the temporal parameters
of the effects conformed to known attributes of the classical conditioning
model. A forced choice color naming procedure was utilized by Schmidt,
Pinette and Finke (1978); they required observers to verbally report which
half of the test target, after viewing the usual adaptation figures,
appeared more red. Results from three experiments, using different
temporal orders during inspection, were interpreted as yielding further
evidence of a classically-conditioned learning process.
Skowbo and Forster (1983) based their research design on experimental
findings extracted from Rescorla and Holland's (1982) recent review:
••• close temporal contiguity between the CS and UCS would fail to
produce conditioning if, during acquisition trials, the UCS were also
presented frequently without the CS: Such a maneuver would lower the
correlation between CS and UCS occurrences (cited in Skowbo, 1984).
In a similar fashion, Skowbo and Forster (1983) designated the
colored panel as the UCS and the lined grating as the CS, interspersed
homogeneous colored stimuli in random fashion, in the usual inspection
sequences. Their results were interpreted as going against Rescorla and
Holland's (1982) predictions, in that reported strengths of the
15
aftereffects were not weaker than those in the control condition, where
homogeneous achromatic panels were used in pl ace of the chromatic
homogeneous panels.
From results cited in her most recent review of the 1 iterature,
Skow~o (11984) concluded that while many similarities have . been
demot1stratled between the basic mechanisms of conditioning and the
McCollougH Effects, until it can be empirically verified as to what
conditions1 are necessary as well as sufficient for evoking the effects,
the ~asic ~echanism by which the subjective colors are evoked remains in
question.
In ~reply (Holding, in press) to Skowbo (1984), it was stated that
she based. her assertion, that "McCollough Effects are not classically
condition~d responses" (p. 215) on classical conditioning literature that
was somew~at out of date. Si nee the time of her pub 1 icat ion, Br and,
Hold;ng, ~nd Jones (in press) have investigated the susceptibil1ty of the
Mccollough Effects to the phenomenon of blocking, defined by Kamin (1969)
as •• 1.occurring when prior conditioning to one stimulus prevents or impairs
the $ubsequent, simultaneous conditioning of a second stimulus (cited in
Bran~ et a~., in press). Using col or matching as the assessment procedure,
they were. able to successfully demonstrate blocking of the conditioned
afteteffe¢ts and regarded these results as yet another piece of evidence
concurrin$ with a learning model underlying the effects.
CHAPTER II I
LIMITATIONS
Albeit the majority of these potential-yardsticks of the Mccollough
Effect have been successful in establishing an intimate rel ationsh1p
between color and contour mechanisms, most measures have serious drawbacks
and limitations that make quantifiable interpretation and comparison of
the data next to impossible.
Those researchers who employed unrestricted color naming found that
naive subjects were sometimes unable to report whether or not the colored
aftereffects were visible on the test grating or were unable to attach
color names to them, possibly due to the desaturated appearance of th·e
hues (Mccollough 1965). Running into difficulties of the opposite nature,
Harris and Gibson (1968) noted that subjects who were unable to report
the appearance of colors on the test field were nonetheless able to give
suitable responses when forced to choose!
Objections have also been raised regarding the efficacy of certain
color-cancellation procedures. Although Teft and Clark (1968) proposed
to measure changes in test pattern orientation, Skowbo et al. (1975)
commented that what was actually being measured was bandwidth; the range
of spatial frequencies over which the effect remained visible.
It should also be noted that hue-matching used in cancellation
experiments assumes a linear relationship between '·hue strength and
aftereffect strength. That the visual perception of hue is 4 non-linear
l: ~-1
i:
~1 '~
' I
r l t !' ; f
' ~ i. ,~
' t i l

17
function is well documented (Murch, 1976), thus rendering this technique
questionable.
Gauging the relative strengths or magnitude estimates of the
Mccollough Effects have yielded finer measures of the effects than the
simple reporting of whether or not the appropriate,hues were perceived.
Placing constraints on this method however was the narrow range in
magnitude (or degree of difference), over which the effects seem to occur
(Stromeyer, 1969).
I !
l f

CHAPTER IV
STROMEYER'S EXPERIMENT
Taking a new slant on the problem, Stromeyer (1974) found that ·form
specific colored aftereffects could be evoked from test patterns observed
in extremely dim light that stimulated the rods but not the cones. His
results suggested that rod and cone signals converge at some level of the
visual system. Previous to this time, evidence indicated that rods alone
functioned in dim light Cscotopic illumination) so that objects appeared
colorless with cones contributing input only at higher levels of
illumination (photopic) to give objects color and form.
In regards to Stromeyer's (1974) controversial findings, an obvious
question must be raised--is there an absolute crossover from scotopic to
photopic sensitivity and through conditioning could the strength of the
Mccollough Effect lower the threshold at which the effect could be
perceived or is the Mccollough Effect merely a function of some static,
prewired constant, an observer's dark adaptation curve.
Another point of contention which must be mentioned but will not
be dealt with extensively in this paper centers around the basic mechanism
by which the effect is evoked. The issue of identifying that mechanism
has led to the development of two theoretical camps. One group, the
"adaptation" theorists, ascribes the effect to some kind of physiological
chromatic adaptation to specific components (i.e., lined grids of specific

19

20
was predicted that the greater the number of inspection trials, the dimmer
the illumination could be in order for the observer to first perceive the
color on the test pattern as illumination of the test pattern shifted
from completely dark to bright (ascending threshold measurements).
Likewise, the greater the number of inspection trials, the longer would
the observer be able to still perceive the color on the test pattern,
even though illumination of the test pattern was getting progressively
dimmer (descending threshold measurements). The failure of the study to
indicate a clearcut relationship between strength of the Mccollough Effect
and threshold measurements was attributed to extremely high measurement
error.
CHAPTER V
THE PRESENT STUDY
The present study, while attempting to closely parallel Stromeyer's
(1974) design (in which a between-subjects format was used and ascending
threshold measurements were obtained after a 20 min inspection trial),
contained the following changes: A within-subjects design was employed,
and ascending and descending threshold measurements were taken on each
subject on both "short" (15 min) and "long" (30 min) inspection times.
With these changes, the study sought to determine (a) wheth~r
threshold measurements could serve as quantitative dependent measures
with which to evaluate the strength of the aftereffects and (b) whether
the Mccollough Effect required a photopic level of illumination in order
to be evoked. Conversely, could the aftereffects be elicited in scotopic
illumination? In accordance with (a), it was predicted that the greater
the number of inspection trials, the dimmer the illumination could be in
order for the subject to first perceive the desaturated hues on the test
target. In accordance with (b), it was predicted that the appearance of
the test pattern would change markedly near the rod-cone crossover point:
just above the break the bars of the grating would appear sharp, and just
below the break they would appear diffuse. The vertical and horizontal
grating of the testing grid would appear faintly pinkish and greenish
respectively at the lowest light level, minus 1.89 log ml below the rod-

22
cone break and become progressively more saturated as the light was
increased.
In relation to the predictions of the adaptation model, a photopic
level of illumination would be necessary in order to observe the
desaturated hues, since it was the chromatic background that was critical
in evoking the effect. Contrarily, the classical conditioning model would
anticipate that the greater the number of inspection sequences, the dinvner
the illumination could be in order for the observer to first detect the
colors on the test field, as it was the 1 ined grid that served as the
inducing stimulus, hence the Mccollough Effects could be elicited in
either photopic or scotopic illumination. Should the following study
demonstrate that these colored aftereffects could be observed in scotopic,
and well as photopic illumination, further evidence would be rendered
concurring with the predictions of the classical conditioning model and
refuting the predictions of the adaptation model •
Interestingly enough, not only does the pursuitc of an adequate
quantitative dependent variable generate interest within the academic
conmunity, but has particular relevance within the industrial setting as
well-with regards to video display terminals with green phosphors.
According to Long (1984), human factors psychologists have wrestled with
the problem of what to do when operators of video display terminals with
green phosphors report observing persistent pink-tinged aftereffects
after viewing the screen.
Should the following study confirm the predictions stated
previously, invaluable practical as well as theoretical contdbutions
would be forthcoming, not only expanding our understanding of mechanisms

23
operating witlhin the human visual system, but providing researchers in
industry wit~ the tools to thereby minimize or eliminate such effects.
I
I I ! r
I f l l
r i i
i
f i
1·'.
I' I
l
j.•
[,: (::
• i. ~ . h .. ~ '
I: l'
i ,.,.
~.
l·; ( t;' ,. i. r 1'
f '
CHAPTER VI
METHOD
SUBJECTS
Twelve naive, color-normal subjects, as ascertained by HRR Plates,
from the penception class at Portland State University participated in
the experiment. Each was awarded three extra-credit points towards the
final grade upon completion of the experiment.
APPARATUS
During the inspection phase, light from one projector was filtered
through a n~rrow-band green filter (Wratten #57A, dom""'526.8nm) paired
with a black vertically-lined square-wave grating while light presented
alternately from the other projector was filtered through a complementary
red filter (~ratten #30, doml\505.Snm) paired with a black horizontally-
1 ined squard-wave grating; both gratings measuring 1.5 cycles per degree
and subtendilng an area of 11 degrees square. A #3 neutral density filter
was placed in front of the lens on each inspection projector.
Durin~ dark adaptation measurement, light from the projector was I
passed thro~gh a left and right diagonally-lined black grating, 1.5 cycles
per degree. I

25
During the test phase, the projector was mounted in such a way to
allow the test beam to project through the test pattern and the variable
neutral density wedge. The left portion of the test pattern consisted of
a horizontally-lined grating contiguous with the right portion, a
vertically-lined grating, both 1.5 cycle per degree. (A low spatial
frequency was used because below the red-cone break, gratings.above 5
cycles per degree cannot be resolved). All apparatus was housed and all
testing conducted in a small, windowless room painted flat-black.
PROCEDURE
During the inspection phase, subjects, individually run, viewed the
high-contrast gratings projected upon a 56 x 56 white cardboard screen.
Counterbalanced across subjects, one half of the observers, randomly
assigned, were exposed to the "short" condition first: 2-sec on and 2-
sec off alternating presentation of the green vertical grating and the
red horizontal grating for 15 min totaling 113 trials with mean luminance
of the green and red inspection stimuli being 4.519 and 4.950 ml
respectively. Then, after dark adapting for 30 min, during which time a
dark adaptation curve was obtained, an alternating series of 10 ascending
and 10 descending threshold measurements of the test pattern was recorded
for each subject, the luminance of the white areas of the test pattern
ranging between -1.89 log ml and approximately -6.00 log ml •
. With a 7-day interval separating conditions, the group receiving
the 11 short .. inspection time first was then exposed to a "long" condition,
30 min of inspection constituting 226 test trials. The remaining half
26
of the:subjects were run in the opposite order. Subsequent threshold
measurements were recorded for each condition.
~uring the dark adaptation phase of each condition, dark adaptation
curves iwere obtained in that after strong 1 ight adaptation to a PH/5 clear
flash bulb 20,000 lm sec, observers fixated on the left and right
di agonally-1 ined grid projected on the screen and would adjust, by manual
control, a neutral wedge controlling illumination level, so that the
grating would always remain just below threshold. These materials had
the same reflectance as the test pattern used during inspection.·

CHAPTER VII
RESULTS
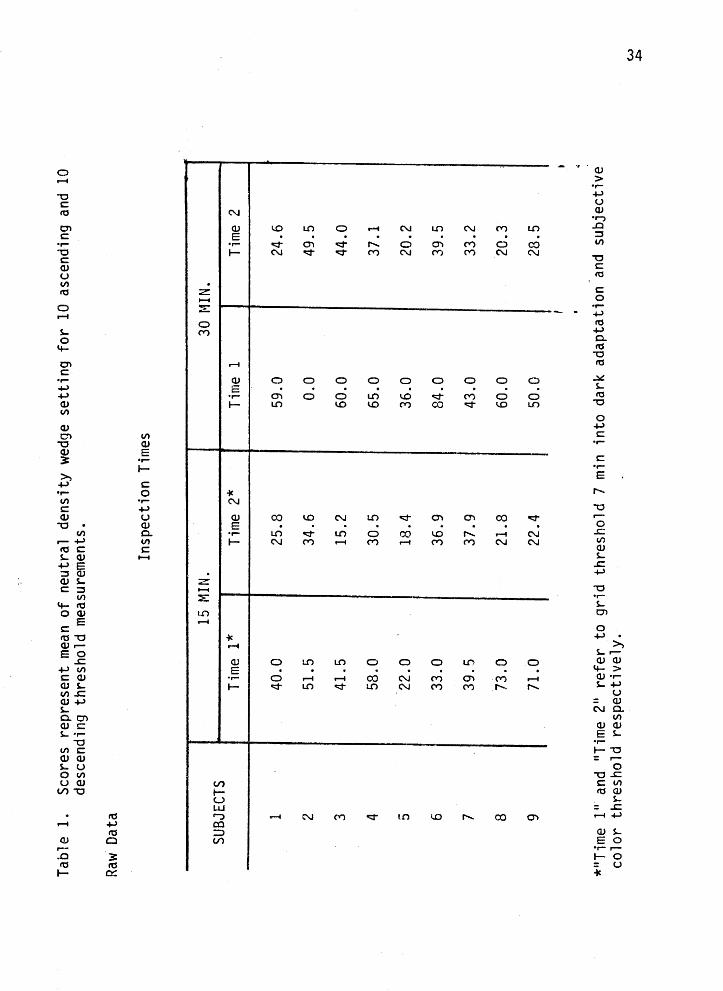
Individual scores representing the mean neutral density wedge
setting (level of illumination) for 10 ascending and 10 descending
threshold measurements for each subject are presented in Table 1.
Insert Table 1 about here
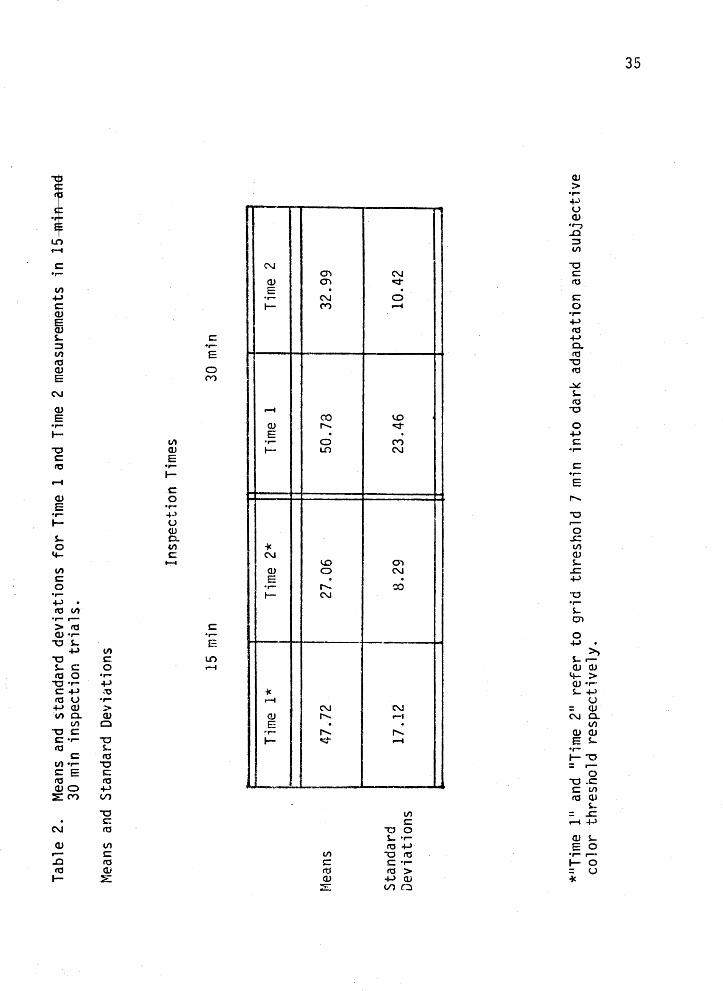
Additionally, means and standard deviations for grid threshold
measurements 7 min into dark adaptation and subjective color threshold
measurements in 15 min and 30 min inspection trials are shown in Table 2.
Insert Table 2 about here
At-test for related measures was performed to test whether threshold
measurements could serve as quantitative dependent variables with which
to evaluate the strengths of the aftereffects ff Results indicated (!_ (8)
= 1.72, £ < .10, one-tailed) that with longer inspection times (30 min)
28
illumination levels were marginally lower than during shorter inspection
times (15 min).
Finally1
it can be noted that higher levels of illumination were
ired to reach subjective color threshold in both 15 min and 30 min
tion trials than were required to reach grid threshold 7 min into
dark adaptation. Hence no scotopic effect was observed.
CHAPTER VII I
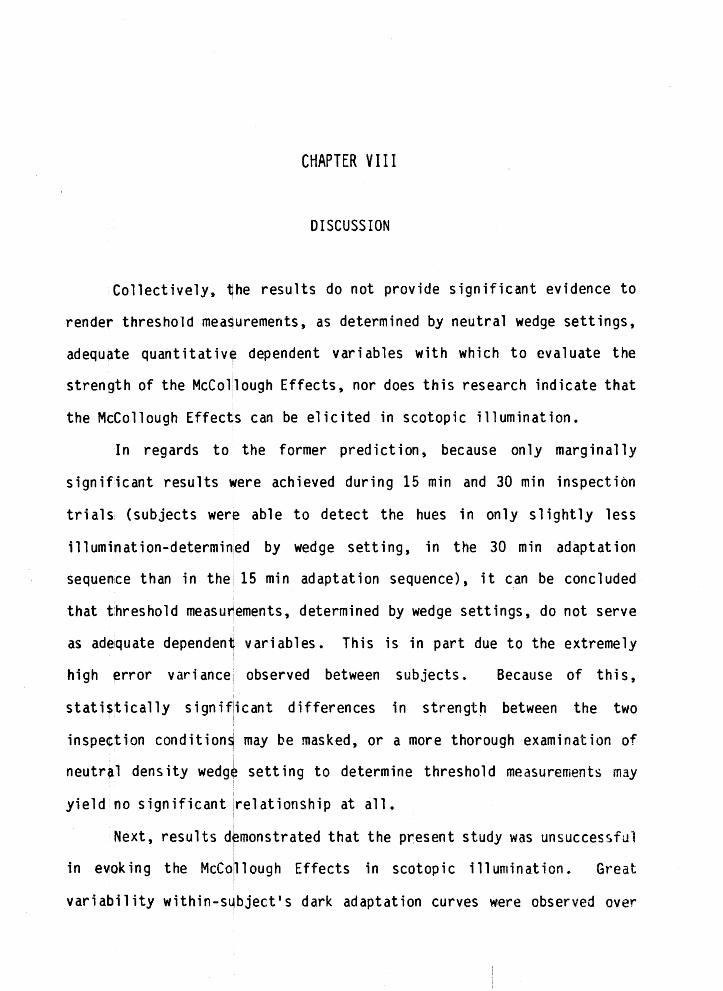
DISCUSSION
Collectively, ~he results do not provide significant evidence to
render threshold mea~urements, as determined by neutral wedge settings,
adequ~te quantitativ¢ dependent variables with which to evaluate the
strength of the McCol!lough Effects, nor does this research indicate that
the Mccollough Effec~s can be elicited in scotopic illumination.
In regards to the former prediction, because only marginally
significant results \flere achieved during 15 min and 30 min inspectiOn
trials: (subjects wer~ able to detect the hues in only slightly less
illumination-determin1ed by wedge setting, in the 30 min adaptation
sequence than in thei 15 min adaptation sequence), it can be concluded
that threshold measunements, determined by wedge settings, do not serve
as adequate dependen~ variables. This is in part due to the extremely
high error variance observed between subjects. Because of this,
statistically signiflicant differences in strengt~ between the two I
inspecction condition~ may be r1asked, or a more thorough examination of
neutr~l density wedg~ setting to determine threshold measurements may
yield no significant 1
relationship at all. I
Next, results d~monstrated that the present study was unsuccessful
in e"oking the McCo laugh Effects in scotopic illumination. Great
vari abi 1 ity within-s~bject' s dark adaptation curves w:ere observed over

30
time. To use them as a standard against which to evaluate other dependent
measures would be erroneous. In addition, it was observed that when
subjects were allowed free range to select wedge settings to where they
could just detect the desaturated hues on ascending trials, they went
immediately into the photopic range! The observers may well have been
able to perceive the aftereffects in scotopic illumination but the hues
are more easily observed in higher levels of illumination. This lends
further evidence to the insensitivity of this dependent measure.
At this point, obvious questions must be raised surrounding
Stromeyer's (1974) experimental findings. The first point of departure
centers on Stromeyer's (1974) dark adaptation threshold measurements
curves. Although this study employed a similar procedure for obtaining
dark adaptation measurements, it was unsuccessful in replicating
Stromeyer's (1974) results. One possible explanation may lie in the
observation that Stromeyer (1974) assigned fixed points at which to take
threshold measurements; to do so may be arbitrary. and erroneous.
Additionally, only one dark adaptation curve was obtained for each subject,
and no index was provided during dark adaptation measurements to indicate
where an observer was with regard to time.
Next, in interpreting Stromeyer's (1974) results two issues must
be examined. First, Strorneyer {1974) used three subjects upon which to
support his predictions, generating group data on so small a sample size
can lead to distortions ot the data, obscuring what results actually were
obtained. Next, of his pool of three subjects, two were experienced
observers of the Mccollough Effect. This could lead to possible
confounding results, although with regards to this contention, the

31
1 iterature is equivocal: Skowbo and Rich (1982) found no evidence to
support changes in aftereffect strength or rate of acquisition with
practiced observers. Murch (1974) and Shute (1979) howevers reported
that only extremely brief exposure times were necessary for trained
observers to report detection of the hues.
Alt~ough serious concerns have been raised in reference to the
strength ~f Stromeyer's (1974) controversial findings, his results could
never-therless be explained in terms of the classical conditioning model.
This moden would predict that because the lined grating of the inspection
figure v1ewed during adaptation serves as the feature component in
eliciting1
1 the desaturated hues, the level of illumination in which the
hues are evoked should make no difference. Specifically, the effects
could be elicited in scotopic illumination provided that there was· a
vehicle ~hrough w~ich it could be evaluated. That Stromeyer (1974) was
able to demonstrate this neatly conforms to these predictions.
Con1trarily, the predictions of the adaptation model would not be
suitable 1in explaining Stromeyer's (1974) data, due to its contention
that the !illumination level would have to be sufficiently high in order
for obser~ers to detect the hues, as it is the background color of the
adapting grid that serves as the feature component in producing the effect.
Stromeyer1 1 s (1974) denonstration of Mccollough Effects evoked in the
scotopic range refutes this claim.
The; present study can lend confirmation to neither group of models
in that overall, statistically insignificant r~sults were achieved. Thus
neither Stromeyer's {1974) study, nor the present study are able to provide
convincing evidence for either of the models, in either direction. That
32
is, both are unable to concur with or refute either model, due to the
reasons just discussed.
While the present study has demonstrated that threshold __ measures,
as determined by neutral density wedge settings are inadequate in serving
as quantifiable dependent variables with which to evaluate the strengths
of the McCollough Effects, perhaps with improvements, i.e., other ways
of evaluating threshold measures, future studies could render them more
sensitive and hence, adequate.
Additionally, i111>rovements are necessary in obtaining dark
adaptation curves. In future research they need to display consistency
over time for them to be considered useful in serving as a standard against
which other dependent variables can be assessed. To remedy this, an item
not mentioned by Stromeyer (1974) and very much worth examining, would
be to have subjects verbally report the point at which the lined grid
appeared clearly sharp and the point at which the grating appeared fuzzy
and indistinct. This would allow investigators to identify where observers
were in their dark adaptation curve(where their rod-cone break occurred).
Obtaining threshold measurements periodically during adaptation
sequences might provide a more sensitive index of the rod-cone: threshold,
as well as providing a more sensitive index of the- strength of the effect.
Evidence has been put forth by Holding, (in press) to suggest that the
first test trial is simultaneously the first extinction trial. Employing
such a technique, this phenomenon could easily be detected.
Another item worth investigating ~enters around the spatial
frequency of the testing grid. Perhaps the width of the bars of the

33
gratings used in this study were too fine, making the rod-cone break
indistinguishable. A low frequency grating might yield a more definitive
rod-cone threshold.
With these changes in experimental design and procedure, threshold
measurements may yet be regarded as adequate, quantitative dependent
variables with which to evaluate the strength of the Mccollough Effects ••
On the other hand, maybe the reason investigators have thus far had such
difficulty in finding a quantitative measure of the effects is that the
Mccollough Effects are not quantitative effects at all, but qualitative
ones. Perhaps there is a distinct cross-over point, below which there
are no effects and above which, there are. Only future research can
determine this.
-,.,i
.:w _
__
__
,
Tab
le 1
. S
core
s re
pres
ent
mea
n of
neu
tral
d
ensi
ty w
edge
se
ttin
g f
or
10 a
scen
ding
and
10
de
scen
ding
th
resh
old
mea
sure
men
ts.
Raw
Dat
a
Insp
ecti
on T
imes
15 M
IN.
30 M
IN.
SUBJ
ECTS
Ti
me
1*
Tim
e 2*
Ti
me
1 Ti
me
2
1 40
.0
25.8
59
.0
24.6
2 51
.5
34.6
0.
0 49
.5
3 41
. 5
15.2
60
.0
44.0
4 58
.0
30.5
65
.0
37.1
5 22
.0
18.4
36
.0
20.2
6 33
.0
36.9
84
.0
39.5
7 39
.5
37.9
43
.0
33.2
8 73
.0
21.8
60
.0
20.3
9 71
.0
22.4
50
.0
28.5
*"T
ime
1"
and
"Tim
e 211
re
fer
to g
rid
thre
shol
d 7
min
in
to d
ark
adap
tati
on a
nd
subj
ecti
ve
colo
r th
resh
old
resp
ecti
vel
y.
w ~
Tab
le 2
. M
eans
an
d st
anda
rd d
evia
tion
s fo
r Ti
me
1 an
d Ti
me
2 m
easu
rem
ents
in
15-
---J
jmH-
Jil
---~
30 m
in
insp
ect i
on
tr
ials
.
Mea
ns
and
Sta
ndar
d D
evia
tion
s
Mea
ns
Sta
ndar
d D
evia
tion
s
15 m
in
Tim
e l*
47
.72
17.1
2
Insp
ecti
on T
imes
30 m
in
Tim
e 2*
Ti
me
1 Ti
me
2
27.0
6 50
.78
32.9
9
8.29
23
.46
10.4
2
*11Ti
me
111
and
"Tim
e 211
re
fer
to g
rid
thr
esho
ld 7
min
in
to d
ark
adap
tati
on a
nd
subj
ecti
ve
colo
r th
resh
old
resp
ecti
vel
y.
---·-·-
---...-
--. --
-·---~--
.. --.
.. ~-
-~·
---·-
·--··
w
U1

REFERENCES
Brand, J.S., Holding, D.H., & Jones, P.O. (in press}. Conditioning and blocking of the McCo11ough effect. Perception and Psychophysics.
Fidell, L.KeS. (1969). Pattern-specific complementary hue aftereffects: more on the McCollough _effect. Unpublished doctoral dissertation, University of Michigan.
Harris, C.S. (1980). Insight or out of sight? Two examples of perceptual plasticity in the human adult. In C.S~ Harris (Ed.) Visual coding and adaptability (pp 95-149) 9 Hillsdale, M.J.: Erlbaum.
Harris, C.S., & Gibson, A.R. (1968). Is orientation-specific color adaptation in human vision_ due to edge detectors, afte~image$ or "di po 1es"1. _?cience, 162, 1506-1507.
Hirsch, J. & Murch, G.M. (1972). Variation in hue of a contour-contingent aftereffect due to color adaptation during inspection of the stimulus patterns. Perception and P~chophysics_, _!_!_, 4·06-408.
Holding, D.H. (in press). Mccollough effects as conditional responses: A reply to Skowbo. perception and .Ps_xcho_P-hysics .•
Hubel, D.H. & Wiesel, T.N. (1968)0 Receptive fields and functional architecture of monkey striate cortexa Journal of Physiology, 195, 215-243.
Leppmann, P.K. (1973). Spatial frequency dependent chromatic aftereffects. Nature, 242, 411-412.
Long, T. (1984). Human factor principles for the design of computer color graphics displays. British Tel~communication Technologic":l Journal, f., 5-14.
Lovegrove, W.J. & Overs R. (1972). Color adaptation of spatial frequency detectors in the human visual system. Science~ ll_~, 541-543.
Lund, N.J., & MacKay, D.M .. (1983) .. Sleep and the Mccollough effect. Vision Research, 23, 903-906.
MacKay, D.M. & Mackay, V. (1974) .. The trial course of the Mccollough effect and its physiological implications. Journal Qf_ Physiology, 327, 38.
Mccollough, C. (1965). Coler adaptation of edge detectors in the human visual system. Science., 149, 115-116.
Mikaelian, M. (1980). Effective luminance contract as a parameter in contingent aftereffects. Perception & P~ychophysics, 27, 531-536.
, '-~"" ....
37
Munsell, A.H. (19~1). Color Notation. Baltimore: Munsell Color Company.
Murch, G.M. · (1975) ... Visual and Auditory PerceQtion. New V:ork: Bobbs-Merrill.
Murch, G~M. (1976). Classical conditioning of the McCollough effect: Temporal parameters. yision Research, l~; 615-619.
Murch, G.M. · (1979). The role of test pattern background hue in the Mccollough effect. _vision Research, 19_, 939-942.
Murch, G.M., & Hirsch, J. (1972). The Mccollough effect created by complimentary afterimages. American Journal of Psychologx_, 85, 241-247.
Riggs9
L.A. (1973). Curvature as a feature of pattern vision. Sci~~, 181_, 1070-1072.
Riggs, L.A., White, K.D., & Eimas, P.O. (1974). Estab1ishment and decay of orientation-contingent aftereffects of color. Perception _?nd Psychophysics, !§_, 535-5420
Schmidt, M~J., Pinette, P. & Finke, R. (1978). Further evidence for conditioning processes in the Mccollough effect. Journal of General Psychology, ·99, 117-132. -- ----
Schmidt, M.J., & Finke, R. (1979). Contrast and frequency competition for orientation-contingent aftereffects of coior. PerceQtion and. Psychophysics, 25, 406-412.
Sharpe & Tees •. (1978). Contour specificit.Y of the McCollough effect.. Percept fon and Psychop~~ cs, 23, 451-458.
Skowbo, O •. (1984). Are the McCollo~gh effects conditioned responses? Psycho 1 ogy Bull et in, 96, 215-226 ·~·
Skowbo, 0., & Forster. (1983). Further evidence against a classical conditioning model of Mccollough effects.. _perception and Psychopt!J~ics, 3~, 552-554.
Skowbo, De, Gentry, L, Timney, B., & Morant, R~B. (1974) .. The McCollough effect: influence of several kinds of visual stimulation on decay rate. PerceP.tion and Psychophysics, ~, 47-49.
Skowbo, 0 .. , & Rich, J~ (1982). Practi~e does not facilitate acquisition of McCoilough effects: evidence against a learning model. ~ce_Q!io~~.f.?.1Chophys ic~.' 32, 551-554.
Skowbo,. D., Timney, B., Gentry, T., & Morant, R.B. (1975)9 Mccollough effects: experimental findings. ·Psychol9qy Bulletin, 82_, 497-510 ..
Skowbo, D. & White, K.D. (1983). McCollough effect acquisition depends on duration of exposure to inducing stimuli, not number of stimulus presentations. .e.~rcept ion and Psychophys J cs, }~, 549-55L
~

Stromeyer, C.F •. (1969). Further studies of the McCollough effect. Perception and Ps1chophysics, §_, 105-110.
Stromeyer, C.F. (1972)~ Edge contingent color aftereffects, spatial frequency specificity. Vision research, 12, 717-732.
Stromeyer, C.F. (1974). Form-specific color aftereffects in scotopic illumination .. Natur,£_, 250, 266-268.
38
Stromeyer, C.F., & Mansfield, R. (1970). Colored aftereffects produced with moving edges. Percept ion and Psych~ys ics, ]_, 108-114.
Teft, L.W., & Clark, f.T. (1968). The effects of stimulus density on orientation specific aftereffects of color adaptation. Esychonomic Science, 11_, 265-266.
Timney, 0., Gentry, T., Skowbo, 0., & Morant, R .. Be grating thresholds and the McCollough effect6 1033-1035.
(1974). Chromatic y 1 s L~.' lt1,
\fasserman, G .. S. (1978). Color vision: an historica·1 intrcduction. New York: John Wiley and Sons. ~---·-
White, K~D~ (1976) .. Lmlinance as a parameter in establishment and testing of the McCo 11 ough effect. Vision Resea'.ch_, .!_~, 297-302.
White, K.D., & Riggs, L.A. (1974). Angle-contingent color aftereffects, Vision Resea·rch, .!!, 1147-1154e
wo·rman, B.B. 0973) ... Q.ictionary of ~ehaviora.·i _Scie~e~ New York: Van Nostran~ Reinhold. Company.