Scope of Cool Roofs in India of Cool Roofs in India ... (Energy Conservation Building Code - ......
14
Scope of Cool Roofs in India An Analysis on the Changes in Residential Roof Construction in India (2001 to 2011) For WinBuild, Inc. 11103 Redford Court, Fairfax, VA 22030 By: Anil Bakshi (Forester) Ex. Student of Prof. N. K. Bansal, New Delhi, India April 1, 2015
Transcript of Scope of Cool Roofs in India of Cool Roofs in India ... (Energy Conservation Building Code - ......

Scope of Cool Roofs in India
An Analysis on the
Changes in Residential Roof Construction in India
(2001 to 2011)
For
WinBuild, Inc. 11103 Redford Court,
Fairfax, VA 22030
By: Anil Bakshi (Forester)
Ex. Student of Prof. N. K. Bansal, New Delhi, India
April 1, 2015

1. Background The Indian construction industry is an integral part of the economy and is poised for solid growth due to industrialisation, urbanisation and economic development together with people’s expectations of improved living standards. The construction sector employs approximately 31 million people, accounting for some 6-8% of GDP and, after agriculture, is the largest employment sector in the country. The construction industry in general has been growing at 9-11% year on year, primarily due to the strength of increased domestic and international manufacturing activities and industrial growth. There have also been increased levels of investment - especially by the Government - in infrastructure and real estate projects (EC Harris Research. 2011). According to the final figures of Census 2011, known as the House Listing and Housing Census, the number of households increased from 191 million to 246 million, registering growth of 28.5% since 2001. The population of India increased from 1.02 billion to 1.21 billion, registering growth of 17.7% in its 35 States and Union Territories since 2001. As per above mentioned census, there is a substantial improvement in the quality of housing both in rural and urban areas. Thus, there is an improvement in the construction material used for roofs, walls and floors. This report reviews the trends in the Indian housing market with a focus on construction practices, building codes (Energy Conservation Building Code - ECBC) that improve the thermal comfort of occupants and energy efficiency in buildings. Though conditions vary by region, India’s climates and building types make roofs the most important building envelope component for achieving energy efficiency and thermal comfort. In the light of this, this study was limited to the analysis of data on roofs alone. The other building envelops like wall and floor would be dealt with separately. The decadal percentage change in households, by construction material of roofs under 5 categories separately under rural and urban set ups, was also linked to decadal percentage change in respective population figures. 2. Study Data Analysis 2.1 Procurement of Study Data For the analysis, data for the two base years, 2001 and 2011, were procured from the website of the "Census of India", Ministry of Home Affairs, Government of India (http://www.devinfolive.info/censusinfodashboard/website/index.php/pages/construction_roof/total/HouseHolds/IND). It includes the following roof parameters and variables (Table 1):
Table 1: Variables and Indices of Study of Change in Households by material of roof
S. N. Variable Indices Available/Selected 1. Year a) 2001 b) 2011

2. Construction materials of roof (5 categories)
a) Grass/Thatch/Bamboo/Wood/Mud/Plastic/Polythene b) Tiles (Hand and Machine made) c) G.I./Metal/Asbestos sheets , d) Concrete e) Any other material (Burnt Brick, Stone/Slate, Other materials)
3. Set up a) Rural b) Urban c) Total 4. Climatic Zone (ECBC) a) Hot and dry b) Cold c) Warm & Humid d) Composite e) Temperate 5. Total Population a) Rural b) Urban c) Total The national level scenario of decadal change in the number of households along with comparative population figures is given in Table 2 below:
Table 2: National Level Change in Households by construction material of roof Households under Roof Material
2001 Households (Number)
2011 Households (Number)
% Change
Rural Urban Total Rural Urban Total Rural Urban Total Grass/Thatch/Bamboo 3,88,60,909 41,42,619 4,30,03,528 3,45,39,160 41,41,638 3,86,80,798 -11.12 -0.02 -10.05
Tiles 5,19,58,331 1,05,47,545 6,25,05,876 4,82,19,995 1,04,23,368 5,86,43,363 -7.19 -1.18 -6.18
G.I./Metal/Asbestos 1,36,36,699 86,29,015 2,22,65,714 2,67,33,862 1,25,39,390 3,92,73,252 96.04 45.32 76.38
Concrete 1,52,74,215 2,27,10,486 3,79,84,701 3,07,46,938 4,09,12,361 7,16,59,299 101.30 80.15 88.65
Any Other 1,86,96,315 75,07,801 2,62,04,116 2,75,86,775 1,08,49,180 3,84,35,955 47.55 44.51 46.68
Total Households 13,84,26,469 5,35,37,466 19,19,63,935 16,78,26,730 7,88,65,937 24,66,92,667 21.24 47.31 28.51
Total Population 74,24,90,639 28,61,19,689 1,02,86,10,328 83,34,63,448 37,71,06,125 1,21,05,69,573 12.25 31.80 17.69
2.2 Discrepancy in the Data The national level scenario of decadal change in households, when presented as the SUM of all 35 States and Union Territories, it shows negligible discrepancy owing to some wrong clubbing of 2001 data in rural set up instead of urban set up, as show in Tables 3-4 below: Table 3: National Level Change in Households shown as Sum of Individual States Households under Roof Material
2001 Households (Number)
2011 Households (Number)
% Change
Rural Urban Total Rural Urban Total Rural Urban Total Grass/Thatch/Bamboo 3,88,49,720 41,53,808 4,30,03,528 3,45,39,160 41,41,638 3,86,80,798 -11.1 -0.29 -10.05
Tiles 5,19,32,746 1,05,73,130 6,25,05,876 4,82,19,995 1,04,23,368 5,86,43,363 -7.15 -1.42 -6.18
G.I./Metal/Asbestos 1,36,09,736 86,55,978 2,22,65,714 2,67,33,862 1,25,39,390 3,92,73,252 96.43 44.86 76.38
Concrete 1,51,92,513 2,27,92,188 3,79,84,701 3,07,46,938 4,09,12,361 7,16,59,299 102.38 79.50 88.65
Any Other 1,86,86,844 75,17,272 2,62,04,116 2,75,86,775 1,08,49,180 3,84,35,955 47.63 44.32 46.68
Total Households 13,82,71,559 5,36,92,376 19,19,63,935 16,78,26,730 7,88,65,937 24,66,92,667 21.37 46.88 28.51
Total Population 74,24,90,639 28,61,19,689 1,02,86,10,328 83,34,63,448 37,71,06,125 1,21,05,69,573 12.25 31.80 17.69
Table 4: Difference of Table 2 and Table 3 Showing discrepancy in Data Households under Roof Material
2001 Households (Number)
2011 Households (Number)
% Change
Rural Urban Total Rural Urban Total Rural Urban Total Grass/Thatch/Bamboo 11,189 -11,189 0 0 0 0 0 0 0

Tiles 25,585 -25,585 0 0 0 0 0 0 0
G.I./Metal/Asbestos 26,963 -26,963 0 0 0 0 0 0 0
Concrete 81,702 -81,702 0 0 0 0 -1 1 0
Any Other 9,471 -9,471 0 0 0 0 0 0 0
Total Households 1,54,910 -1,54,910 0 0 0 0 0 0 0
Table 4 shows that discrepancy in the overall data is nil (as significant to two decimal digits) but it only slightly offsets the interpretations of rural and urban set ups. For all the purposes of analysis of study data, therefore Table 3 would be considered as the base-table. 2.3 Inferences Drawn on the Data The following general inferences could be drawn from Table 3: • The housing deficit gap in India has closed to some extent. While population has
increased by 17.7%, the number of households has gone up 28.5%. This relationship is more apparent in rural areas, where population is up 12.25% and the number of households is up 21.24%). Greater growth in households indicates landless or homeless people have now access to their own houses and earnings of rural people have increased.
• As regards the construction material of roofs, under two categories namely Grass/Thatch/
Bamboo/Wood/Mud/Plastic/Polythene and Tiles (Hand and Machine made), percentage change in both rural and urban set ups is negative. This means these roof materials are being increasingly replaced, which is amply reflected by nearly 100% increase in rural set up in roof categories G.I./Metal/Asbestos sheets and Concrete with handsome increases in urban set up as well.
• Under Urban set up also, there are handsome increases in the roof categories of
G.I./Metal/Asbestos sheets and Concrete.
• The roof material under Any other category (Burnt Brick, Stone/Slate, Other materials) is rather evenly hiked by over 45%.
3. Climate Zone Analysis 3.1 Climate Zones In India - ECBC Guide The Energy Conservation Building Code (ECBC) User Guide (July 2009, Reprinted April 2011) of the Bureau of Energy Efficiency (BEE), Ministry of Power, Government of India is the building code and agency covering energy efficiency in buildings in India. The ECBC classifies India into 5 climate zones as depicted on the Map 1 below and its corresponding climatic variables, as shown in Table 5, taken from their website: (http://eco3.org/wp-content/plugins/downloads-manager/upload/ECBC%20User%20Guide%20V-0.2%20(Public).pdf).

Map 1: Climate Zone Map of India (BEE)
Table 5: Classifications of Different Climate Zones in India (BEE)
Climate Zone
Description Mean Temperature (o C) Places (States/ districts) Summer
Midday (High)
Summer Night (Low)
Winter Midday (High)
Winter Night (Low)
Diurnal Variation
Hot and Dry
High temperature, Low humidity and rainfall, Intense solar radiation and a generally clear sky, Hot winds during the day and cool winds at night,
40 to 45
20 to 30
5 to 25
0 to 10
15 to 20
Rajasthan
Gujarat
Western Madhya
Sandy or rocky ground with little vegetation, Low underground water table and few sources of surface water.
Pradesh Central Maharashtra
etc.
Warm and Humid
Temperature is moderately high during day and night, Very high humidity and rainfall , Diffused solar radiation if cloud cover is high and intense if sky is clear, Calm to very high winds from prevailing wind directions, Abundant vegetation, Provision for drainage of water is required
30 to 35
25 to 30
25 to 30
20 to 25
5 to 8
Kerela Tamilnadu Costal parts of Orissa Andhra Pradesh
etc.
Temperate
Moderate temperature, Moderate humidity and Rainfall. Solar radiation same throughout the year and sky is generally clear, High winds during summer depending on topography, Hilly or high plateau region with abundant vegetation
30 to 34
17 to 24
27 to 33
16 to 18
8 to 13
Bangalore
Goa
Parts of the Deccan
Cold (Sunny/ Cloudy)
Moderate summer temperatures and very low in Winter, Low humidity in cold/sunny and high humidity in cold/cloudy, Low precipitation in cold/sunny and high in cold/cloudy, High solar radiation in cold/sunny and low in cold/cloudy, Cold winds in winter, Very little vegetation in cold/sunny and abundant vegetation in cold/cloudy
17 to 24
/ 20 to 30
4 to 11
/ 17 to 21
(-7) to 8
/ 4 to 8
(-14) to 0
/ (-3) to 4
25 to 25
/ 5 to 15
Jammu & Kashmir including Ladakh Himachal Pradesh Uttaranchal Sikkim Arunachal Pradesh
Composite
This applies when 6 months or more do not fall within any of the above categories, High temperature in summer and cold in winter, Low humidity in summer and high in monsoons, High direct solar radiation in all seasons except monsoons high diffused radiation, Occasional hazy sky Hot winds in summer, cold winds in winter and strong wind in monsoons, Variable landscape and seasonal vegetation
32 to 43
27 to 32
10 to 25
4 to 10
35 to 22
Uttar Pradesh Haryana Punjab Bihar Jharkhand Chattisgarh Madhya Pradesh etc.
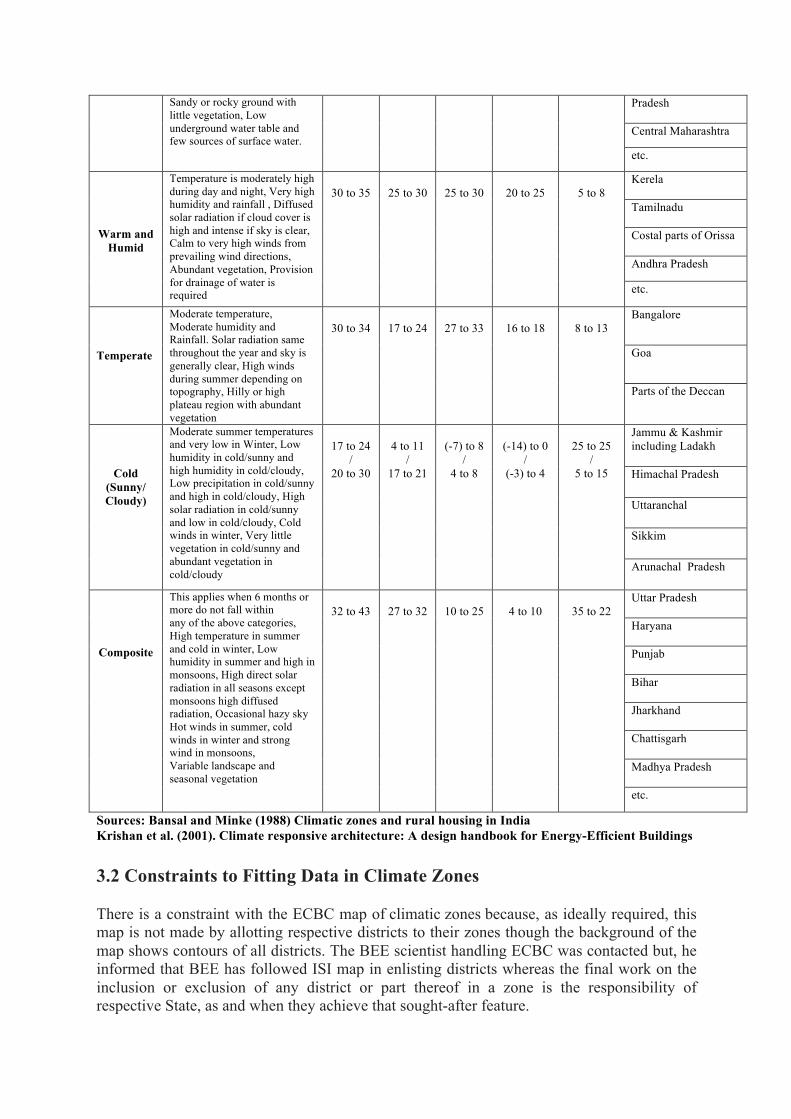
Sources: Bansal and Minke (1988) Climatic zones and rural housing in India Krishan et al. (2001). Climate responsive architecture: A design handbook for Energy-Efficient Buildings 3.2 Constraints to Fitting Data in Climate Zones There is a constraint with the ECBC map of climatic zones because, as ideally required, this map is not made by allotting respective districts to their zones though the background of the map shows contours of all districts. The BEE scientist handling ECBC was contacted but, he informed that BEE has followed ISI map in enlisting districts whereas the final work on the inclusion or exclusion of any district or part thereof in a zone is the responsibility of respective State, as and when they achieve that sought-after feature.

Also, there were some anomalies like Goa which was included in Temperate zone with Bangalore, but Goa is typically a coastal zone entity falling under Warm and Humid zone. Also, some clusters like Deccan were clubbed as such and all states were not listed in Table 5. Under such a situation, the district could not be made the basic unit for fixing the households as per ECBC climate zones. Thus, an approximation was made to by making States as the basic unit, and not districts, as retrievable index. This is based on the criterion that if more than 50% of the state area comes under a given climate zone then the entire state would be taken into that zone. For example, inclusion of entire states of Jammu & Kashmir and Uttrakhand (blue colour with light brown in the northernmost part of Map 1) will not deviate the actual scene a great deal especially in the extreme cold and hot weather months. Accordingly, the following spectrum was chosen to represent states vis-a-vis climate zones (Table 6):
Table 6: Modified Criteria for Fitting Different States in Climate Zones S. N. Climate Zone
(ECBC map) Constraints States/UTs
1-3 Hot and dry (Red)
Quite many districts of other zones included from 3 states (small loss on accounts of coastal parts of 2 states)
> Rajasthan > Gujarat > Maharashtra
4-8 Cold (Blue)
Not much of a departure in first 3 states but other 2 states overlapped (overall stable criteria)
> Jammu & Kashmir > Uttarakhand > Himachal Pradesh > Sikkim > Arunachal Pradesh
9-26 Warm & Humid (Orange)
Not much of a departure Karnataka/Kerala/ Tamil Nadu/ Andhra Pradesh/ Orissa/ West Bengal/ Assam/ Manipur/ Meghalaya/ Mizoram/ Nagaland /Tripura/ Goa/ Andaman & Nicobar/ Dadra & Nagar Haveli/ Daman and Diu/ Lakshadweep/ Pondicherry
27-35 Composite (Brown)
Not much of a departure (Barring inclusion in Rajasthan)
Punjab/ Haryana /Uttar Pradesh/ Madhya Pradesh/ Chhattisgarh/ Jharkhand/ Bihar/ Chandigarh/ Delhi
Temperate (Pink)
These represented district level entities for which data is neither available nor feasible.
Not represented
3.3 Presentation of Data by Climate Zone The overall scenario of decadal percentage change in households under stated categories of roof material is shown above in Table 3. As outlined in Section 3.2, climate zone wise details of decadal percentage change in households is presented below in Tables 7-8 whereas change in household by category roof material in different zones are shown in Tables (Tables 9-12) except the Temperate zone for which there is no data.

Table 7: Percentage Change in Households by Climate Zones
Climate Zone 2001 Households (Number)
2011 Households (Number)
% Change
Rural Urban Total Rural Urban Total Rural Urban Total Hot and Dry
2,40,36,287 1,40,13,145 3,80,49,432 2,92,72,418 1,93,21,183 4,85,93,601 21.78 37.88 27.71 Cold
37,11,258 9,84,817 46,96,075 45,01,396 13,77,086 58,78,482 21.29 39.83 25.18 Warm and Humid
5,65,66,893 2,24,26,758 7,89,93,651 6,50,90,860 3,47,89,523 9,98,80,383 15.07 55.13 26.44 Composite
5,39,57,121 1,62,67,656 7,02,24,777 6,89,62,056 2,33,78,145 9,23,40,201 27.81 43.71 31.49 Temperate
Total Households 13,82,71,559 5,36,92,376 19,19,63,935 16,78,26,730 7,88,65,937 24,66,92,667 21.37 46.88 28.51
Total Population 74,24,90,639 28,61,19,689 1,02,86,10,328 83,34,63,448 37,71,06,125 1,21,05,69,573 12.25 31.80 17.69
Table 8 shows decadal percentage change in households vis-à-vis population in each climate zone. It makes amply clear that the gap between people having their own houses and homeless people has reduced by some extent. Also, more homeless people have now access to their own houses especially in the rural set up on account of their enhanced earnings and thus better social status.
Table 8: Climate Zone Wise Percentage Decadal Change: Households Vs. Population
Climate Zone
% Decadal Change (2001 vs. 2011)
Rural Households
Rural Population
Urban Households
Urban Population
Total Households
Total Population
Hot-Dry 21.78 12.95 37.88 27.80 27.71 18.28
Cold 21.29 14.80 39.83 36.98 25.18 19.49
Warm & Humid 15.07 4.39 55.13 35.68 26.44 13.42
Composite 27.81 18.45 43.71 30.13 31.49 21.18
Temperate
Total 21.37 12.25 46.88 31.80 28.51 17.69
3.3.1 Data under "Hot and Dry" Climate Zone Out of 35 States and Union Territories, the hot and dry climate zone entails three major States of western India namely Rajasthan, Gujarat and Maharashtra. The data is presented in Table 9 below:
Table 9: Percentage Change in Households by construction material of roof (Hot and Dry Climate Zone)
Households under Roof Material
2001 Households (Number)
2011 Households (Number)
% Change
Rural Urban Total Rural Urban Total Rural Urban Total Grass/Thatch/Bamboo 35,08,766 4,46,541 39,55,307 31,55,072 4,80,616 36,35,688 -10.08 7.63 -8.08
Tiles 99,59,860 18,67,793 1,18,27,653 93,10,987 14,75,440 1,07,86,427 -6.51 -21.01 -8.80
G.I./Metal/Asbestos 46,67,907 39,79,752 86,47,659 72,84,732 45,47,423 1,18,32,155 56.06 14.26 36.82
Concrete 20,54,702 59,33,697 79,88,399 37,64,981 1,01,65,528 1,39,30,509 83.24 71.32 74.38
Any Other 38,45,052 17,85,362 56,30,414 57,56,646 26,52,176 84,08,822 49.72 48.55 49.35
Total Households 2,40,36,287 1,40,13,145 3,80,49,432 2,92,72,418 1,93,21,183 4,85,93,601 21.78 37.88 27.71
Total Population 13,08,11,227 7,32,45,605 20,40,56,832 14,77,51,035 9,36,11,427 24,13,62,462 12.95 27.80 18.28
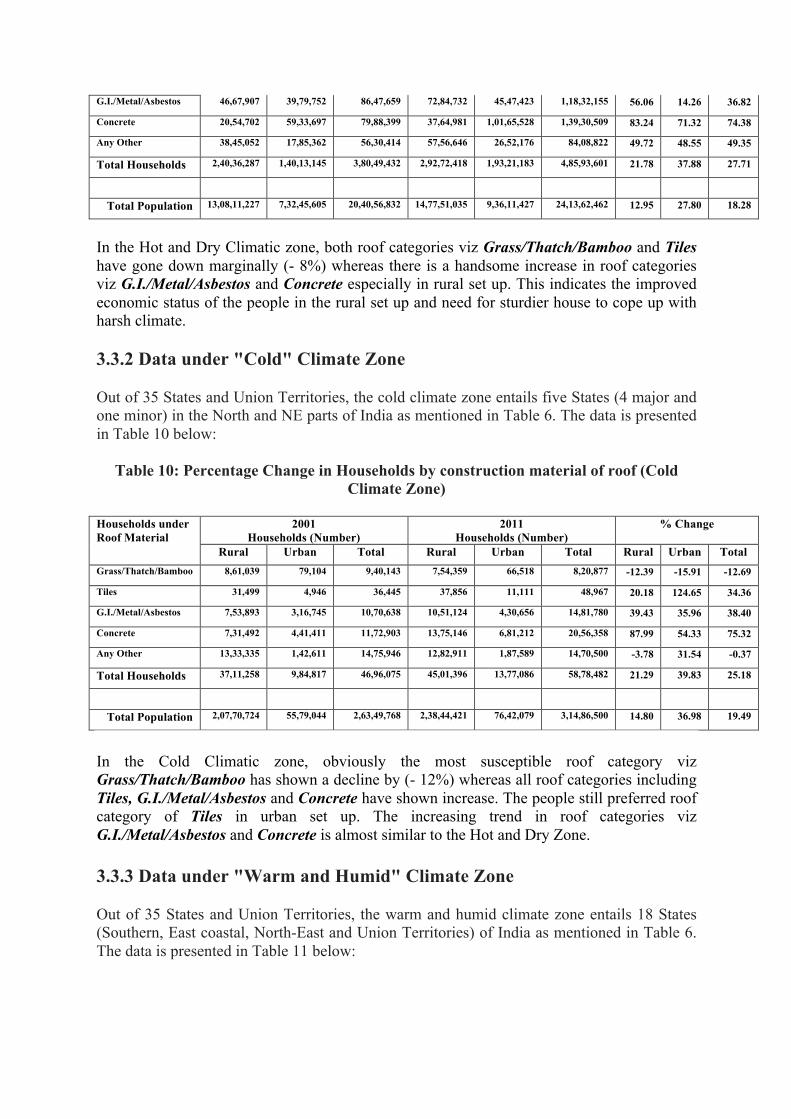
In the Hot and Dry Climatic zone, both roof categories viz Grass/Thatch/Bamboo and Tiles have gone down marginally (- 8%) whereas there is a handsome increase in roof categories viz G.I./Metal/Asbestos and Concrete especially in rural set up. This indicates the improved economic status of the people in the rural set up and need for sturdier house to cope up with harsh climate. 3.3.2 Data under "Cold" Climate Zone Out of 35 States and Union Territories, the cold climate zone entails five States (4 major and one minor) in the North and NE parts of India as mentioned in Table 6. The data is presented in Table 10 below:
Table 10: Percentage Change in Households by construction material of roof (Cold Climate Zone)
Households under Roof Material
2001 Households (Number)
2011 Households (Number)
% Change
Rural Urban Total Rural Urban Total Rural Urban Total Grass/Thatch/Bamboo 8,61,039 79,104 9,40,143 7,54,359 66,518 8,20,877 -12.39 -15.91 -12.69
Tiles 31,499 4,946 36,445 37,856 11,111 48,967 20.18 124.65 34.36
G.I./Metal/Asbestos 7,53,893 3,16,745 10,70,638 10,51,124 4,30,656 14,81,780 39.43 35.96 38.40
Concrete 7,31,492 4,41,411 11,72,903 13,75,146 6,81,212 20,56,358 87.99 54.33 75.32
Any Other 13,33,335 1,42,611 14,75,946 12,82,911 1,87,589 14,70,500 -3.78 31.54 -0.37
Total Households 37,11,258 9,84,817 46,96,075 45,01,396 13,77,086 58,78,482 21.29 39.83 25.18
Total Population 2,07,70,724 55,79,044 2,63,49,768 2,38,44,421 76,42,079 3,14,86,500 14.80 36.98 19.49
In the Cold Climatic zone, obviously the most susceptible roof category viz Grass/Thatch/Bamboo has shown a decline by (- 12%) whereas all roof categories including Tiles, G.I./Metal/Asbestos and Concrete have shown increase. The people still preferred roof category of Tiles in urban set up. The increasing trend in roof categories viz G.I./Metal/Asbestos and Concrete is almost similar to the Hot and Dry Zone. 3.3.3 Data under "Warm and Humid" Climate Zone Out of 35 States and Union Territories, the warm and humid climate zone entails 18 States (Southern, East coastal, North-East and Union Territories) of India as mentioned in Table 6. The data is presented in Table 11 below:

Table 11: Percentage Change in Households by construction material of roof (Warm and Humid Climate Zone)
Households under Roof Material
2001 Households (Number)
2011 Households (Number)
% Change
Rural Urban Total Rural Urban Total Rural Urban Total Grass/Thatch/Bamboo 2,05,09,206 23,73,626 2,28,82,832 1,41,65,396 19,20,314 1,60,85,710 -30.93 -19.10 -29.70
Tiles 1,93,92,110 62,93,301 2,56,85,411 1,86,68,842 68,99,668 2,55,68,510 -3.73 9.64 -0.46
G.I./Metal/Asbestos 71,04,775 33,24,989 1,04,29,764 1,46,80,597 58,51,827 2,05,32,424 106.63 76.00 96.86
Concrete 74,86,533 96,53,712 1,71,40,245 1,49,22,626 1,88,55,466 3,37,78,092 99.33 95.32 97.07
Any Other 20,74,269 7,81,130 28,55,399 26,53,399 12,62,248 39,15,647 27.92 61.59 37.13
Total Households 5,65,66,893 2,24,26,758 7,89,93,651 6,50,90,860 3,47,89,523 9,98,80,383 15.07 55.13 26.44
Total Population 27,07,90,023 10,98,34,915 38,06,24,938 28,26,87,256 14,90,23,230 43,17,10,486 4.39 35.68 13.42
In the Warm and Humid climate zone, covering many States, both roof categories viz Grass/Thatch/Bamboo and Tiles have gone down sizeably whereas nearly 100% increase is seen in roof categories viz G.I./Metal/Asbestos and Concrete in general but especially in rural set up showing an improvement in the economic status of people in general. 3.3.4 Data under "Composite" Climate Zone Out of 35 States and Union Territories, the composite climate zone entails 9 States (5 major, 4 minor) mainly in the central part of India as mentioned in Table 6. The data is presented in Table 12 below:
Table 12: Percentage Change in Households by construction material of roof (Composite Climate Zone)
Households under Roof Material
2001 Households (Number)
2011 Households (Number)
% Change
Rural Urban Total Rural Urban Total Rural Urban Total Grass/Thatch/Bamboo 1,39,70,709 12,54,537 1,52,25,246 1,64,64,333 16,74,190 1,81,38,523 17.85 33.45 19.13
Tiles 2,25,49,277 24,07,090 2,49,56,367 2,02,02,310 20,37,149 2,22,39,459 -10.41 -15.37 -10.89
G.I./Metal/Asbestos 10,83,161 10,34,492 21,17,653 37,17,409 17,09,484 54,26,893 243.20 65.25 156.27
Concrete 49,19,786 67,63,368 1,16,83,154 1,06,84,185 1,12,10,155 2,18,94,340 117.17 65.75 87.40
Any Other 1,14,34,188 48,08,169 1,62,42,357 1,78,93,819 67,47,167 2,46,40,986 56.49 40.33 51.71
Total Households 5,39,57,121 1,62,67,656 7,02,24,777 6,89,62,056 2,33,78,145 9,23,40,201 27.81 43.71 31.49
Total Population 32,01,18,665 9,74,60,125 41,75,78,790 37,91,80,736 12,68,29,389 50,60,10,125 18.45 30.13 21.18
In the Composite climate zone, as a marked departure, roof category Grass/Thatch/Bamboo has shown quite an increase in both rural and urban set ups may be as these areas supported good forests, whereas roof category Tiles as usual showed a decrease. There is more 200% increase under roof category G.I./Metal/Asbestos and more than 100% increase under roof category Concrete under the rural set up with about 65% increase in both under the urban set up.

4. Scope for Cool Roofs 4.1 Types of Cool Roofs Cool roofs fall into one of three categories: roofs made from cool roofing materials, roofs made of materials that have been coated with a solar reflective coating, or green roofs. Membrane cool roofs White thermoplastic membrane roofs, are inherently reflective, achieving some of the highest reflectance and emittance measurements of which roofing materials are capable. A roof made of white thermoplastic, for example, can reflect 80 percent or more of the sun’s rays and emit at least 70% of the solar radiation that the roof absorbs. An asphalt roof only reflects between 6 and 26% of solar radiation. Coated cool roofs An existing (or new) roof can be made reflective by applying a solar reflective coating to its surface. The reflectivity and emissivity ratings for over 500 reflective coatings can be found in the Cool Roofs Rating Council. Green cool roofs Green roofs provide a thermal mass layer which helps reduce the flow of heat into a building. The solar reflectance of green roofs varies depending on the plant types (generally 0.3-0.5). Green roofs may not reflect as much as other cool roofs but do have other benefits such as evapo-transpiration which cools the plants and the immediate area around the plants, aiding in lowering rooftop temperatures, naturally. 4.2 Relative Thermal Advantages of Materials of Roofs Used
S. N.
Construction Materials of Roof in Households
Relative Thermal Advantage of roof category
1. Grass/Thatch/Bamboo/Wood/ Mud/Plastic/Polythene
These materials do not as such qualify to be useful for any additional thermal advantages of any of 3 cool roof categories. In practice, such roofs are also devoid of any evapo-transpiration advantage of green roofs.
2. Tiles (Hand and Machine made) The kind of tiles used in rural set up are both hard to work on with coatings. If used somehow, the maintenance would be costly and advantage feeble. Thus, Tiles as roof material also do not as such qualify to be useful for any additional thermal advantages of any of 3 cool roof categories.
3. G.I./Metal/Asbestos sheets Readily qualify to be useful for coated cool roof category. 4. Concrete Readily qualify to be useful for cool roofs. 5. Any other material (Burnt Brick,
Stone/Slate, Other materials) Some of these materials qualify to be useful for cool roofs.
4.3 Scope of Cool Roofs in Current Household Scenario In order to drive home the scope of cool roofs, for their technologically possible relative thermal advantages, various construction materials of roof used in the above household scenario were grouped. As presented in section 4.2, households data of first two categories viz Grass/Thatch/Bamboo and Tiles was categorized as a Non-Cool Roof and next two

categories (G.I./Metal/Asbestos and Concrete) were categorized as a Cool Roof. "Any Other Material" was termed as Miscellaneous category as shown in Table 13 below: Table 13: Scope of Cool Roofs - Change in Households by construction material of roof
Scope for Cool Roofs [Combined Roof Material Categories]
2001 Households (Number)
2011 Households (Number)
% Change
Rural Urban Total Rural Urban Total Rural Urban Total
Non-Cool Roof Category 1.Grass/Thatch/Bamboo 2. Tiles
9,07,82,466 1,47,26,938 10,55,09,404 8,27,59,155 1,45,65,006 9,73,24,161 -8.84 -1.10 -7.76
Cool Roof Category 3. G.I./Metal/Asbestos 4. Concrete
2,88,02,249 3,14,48,166 6,02,50,415 5,74,80,800 5,34,51,751 11,09,32,551 99.57 69.97 84.12
Misc. Category 5. Any Other
1,86,86,844 75,17,272 2,62,04,116 2,75,86,775 1,08,49,180 3,84,35,955 47.63 44.32 46.68
Total Households
13,82,71,559 5,36,92,376 19,19,63,935 16,78,26,730 7,88,65,937 24,66,92,667 21.37 46.88 28.51
Table 13 clearly shows that the potential for cool roofs has substantially increased in India as reflected by about 100% increase in the rural set up and 70% in the urban set up under the cool-roof category. If the government of India makes suitable changes in the guidelines for housing sector to adopt green technologies by all operators, as recently done by the Ministry of Rural Development in their housing scheme for weaker sections (Indira Aawas Yojna), energy efficiency in households will get a desirable kick to address urban heat-island effect (UHI) which is fast gripping the rural set up around mega-cities and well-known towns. In fact, some of the households from Misc. Category (Burnt Brick, Stone/Slate, Other materials) also qualify to be treated using reflective or cool roof surfaces thus adding to to the potential for cool roofs in India. 5. Thermal Comfort in Households in Different Climate Zones For India, roofs are one of the most important building envelop components for setting the thermal comfort and cost and cooling or heating in buildings. 5.1 Thermal Comfort in Households with Untreated Roof Thermal comfort is the condition of mind that expresses satisfaction with the thermal environment and is assessed by subjective evaluation (ANSI/ASHRAE Standard 55).

Fig. 1 shows the energy flow into a household through an untreated roof of thickness (d).
Fig 1: Energy Flow into a Household through an Untreated Roof The rate of heat gain (q watt/m^2) at the top of the roof surface could be written as, q = αI - (hr + hc) [t(x=0) - ta] hr = σ ϵ [𝑻 𝒙 = 𝟎 𝟐 + 𝑻𝒂𝟐] 𝑻 𝒙 = 𝟎 + 𝑻𝒂 σ = Stefan-Boltzmann constant, ϵ = Emissivity of roof surface, ho = (hr + hc) The above energy balance equation at the top of roof along with energy balance equations through the roof and into the household yield: q = αI - ho [t(x=0) - ta] …………………….…… (1) q = (k/d) [t(x=0) - t(x=d)] ………………….…… (2) q = hi [t(x=d) - tr] …………………….………… (3) (1/U) = [(1/ho) + (d/k) + (1/hi)] q = (αU/ho) I - U [tr - ta] …………………..…… (4) Where: q = Rate of heat gain or loss (W/m^2), I = Solar Intensity (W/m^2), α = Absorptivity of roof material, hr = Radiative heat transfer coefficient to ambient (W/m^2.K), hc = Convective heat transfer coefficient to ambient (W/m^2.K), ho = Overall heat transfer coefficient to ambient, t(x=0) = Temperature at the top of roof (Deg C), t(x=d) = Temperature at the internal surface of roof (Deg C), ta = Ambient temperature (Deg C), T(x=0) = t(x=0) + 273, Ta = ta + 273, k = Thermal conductivity of the roof material (W/m. K), d = Thickness of roof (m), hi = Convective heat transfer coefficient inside the room (W/m^2.K), U = U-Value or reciprocal of thermal resistance of the building envelop i.e. roof (W/m^2. K), and tr = Inside room temperature (Deg C). 5.2 Thermal Comfort in Households with Treated Roof When the roof of thickness (d) is treated with cool roof material (say reflective paint, tile or plastic sheet) of thickness (do), conductivity (ko), emissivity (ϵo) and absorptivity (αo), the modified rate of heat gain (q') equations at various boundaries could be written as, hro = σ ϵo [𝑻 𝒙 = 𝟎 𝟐 + 𝑻𝒂𝟐] 𝑻 𝒙 = 𝟎 + 𝑻𝒂 σ = Stefan-Boltzmann constant, ϵo = Emissivity of reflective surface
I
αI Roof
tr
hi
(1 - α)I
Room
x = d , t (x=d)
x = 0 , t (x=0)
ta
hr hc

ho' = (hro + hc) q' = αo. I - ho' [t(x=0) - ta] …………………….…… (1') q' = (ko/do) [t(x=0) - t(x=do)] ………………..…..… (2') q' = (k/d) [t(x=do) - t(x=do+d)] …………….……... (2'') q' = hi [t(x=do+d) - tr] …………………….……..… (3') (1/U') = [(1/ho') + (do/ko) + (d/k) + (1/hi)] q' = (αo. U' /ho') I - U' [tr - ta] …………………...… (4') Where: q' = Modified rate of heat gain or loss (W/m^2), αo = Absorptivity of reflective material, hro = Modified radiative heat transfer coefficient to ambient (W/m^2.K), ho' = Modified overall heat transfer coefficient to ambient (W/m^2.K), ko = Thermal conductivity of the reflective material (W/m. K), do = Thickness of reflective material on roof (m), U = Modified U-Value or reciprocal of thermal resistance of the treated building envelop (W/m^2. K), and tr = Inside room temperature (Deg C). Note: The value of Radiative heat transfer coefficient (hr) depends on the Roof-top temperature [t(x =0)], which is an unknown variable that could be found be iteration by equating equations (1) and (4) which gives: t(x=0) = ta + (Iα/ho)[1 - (U/ho) ] + (U/ho) [tr - ta] or t(x=0) = {(Iα/ho) + ta}[1 - (U/ho) ] + (U/ho) [tr] For a given climate zone, on the basis of data provided in Table 5 of ECBC code for India, rate of heat gain or loss (q) could be calculated for various construction materials of roofs under 5 categories using a uniform roof thickness (d) using equation (4). Due to the constraints, as mentioned in Section 3.2, head gain or loss for climatic zones would be calculated in a separate study when district-wise zonation of climate zones is achieved by all States.