SCIENCE VS PRECONCEPTIONS Lough Foyle’s … VS PRECONCEPTIONS Lough Foyle’s two disposal ......
40
Number 130 | March 2013 THEORY VS REALITY testing the ‘pilferer’ draghead SCIENCE VS PRECONCEPTIONS Lough Foyle’s two disposal sites TERRA ET AQUA Maritime Solutions for a Changing World EXPECTATIONS VS FACTS silt concentrations at Maasvlakte 2
Transcript of SCIENCE VS PRECONCEPTIONS Lough Foyle’s … VS PRECONCEPTIONS Lough Foyle’s two disposal ......
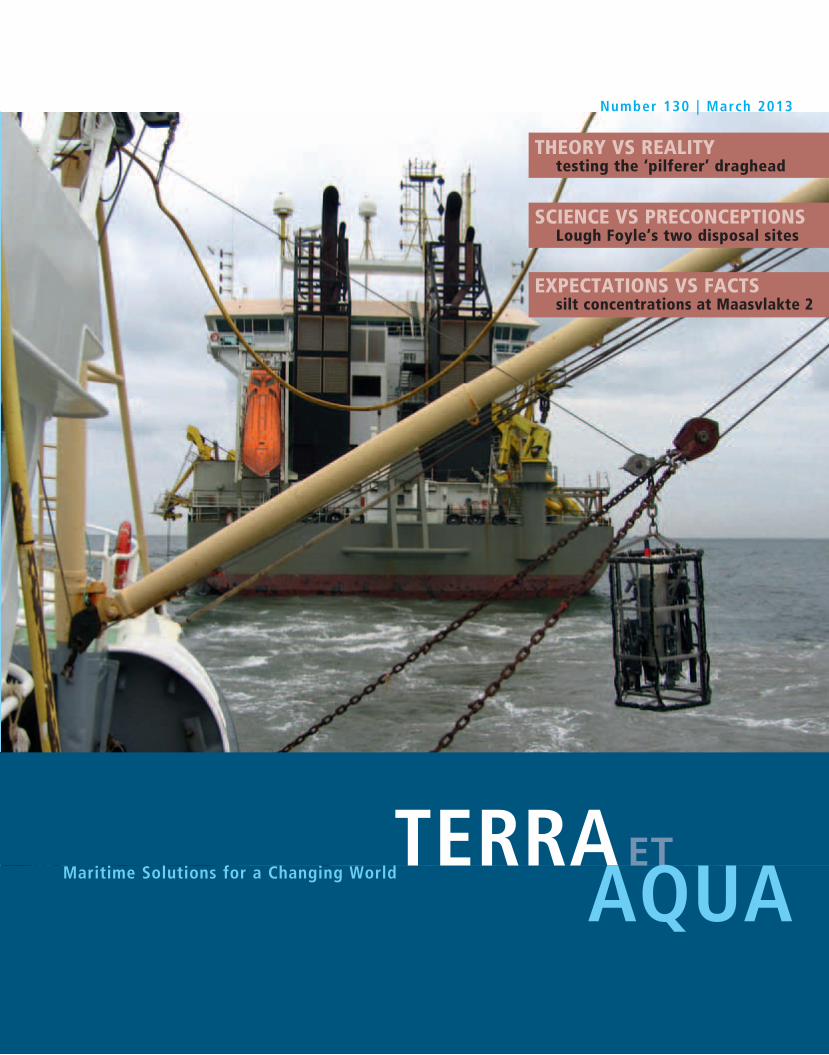
Number 130 | March 2013
THEORY VS REALITYtesting the ‘pilferer’ draghead
SCIENCE VS PRECONCEPTIONSLough Foyle’s two disposal sites
TERRA ETAQUAMaritime Solutions for a Changing World
EXPECTATIONS VS FACTSsilt concentrations at Maasvlakte 2
Editor
Marsha R. Cohen
Editorial Advisory Committee
Bert Groothuizen, Chair
Robert de Bruin
René Kolman
Heleen Schellinck
Martijn Schuttevâer
Roberto Vidal Martin
Ann Wittemans
IADC Board of Directors
P. de Ridder, President
Y. Kakimoto, Vice President
C. van Meerbeeck, Treasurer
Th. Baartmans
P. Catteau
N. Haworth
P. Tison
IADC Secretariat
René Kolman, Secretary General
Alexanderveld 84
2585 DB The Hague
Mailing address:
P.O. Box 80521
2508 GM The Hague
The Netherlands
T +31 (0)70 352 3334
F +31 (0)70 351 2654
I www.iadc-dredging.com
I www.terra-et-aqua.com
Please address enquiries to the editor.
Articles in Terra et Aqua do not necessarily
reflect the opinion of the IADC Board or
of individual members.
CovER
A survey ship with a specially developed silt profiler – designed and constructed in 2009 and owned
by the Port of Rotterdam – follows a trailing suction hopper dredger at work to measure active and
surface plumes. This was an integral part of the extensive monitoring programme at the Maasvlakte 2
expansion project in Rotterdam (see page 20).
TERRA ETAQUA
Guidelines for Authors
Terra et Aqua is a quarterly publication of the International Association of Dredging Companies,
emphasising “maritime solutions for a changing world”. It covers the fields of civil, hydraulic
and mechanical engineering including the technical, economic and environmental aspects
of dredging. Developments in the state of the art of the industry and other topics from the
industry with actual news value will be highlighted.
• AsTerra et Aqua is an English language journal, articles must be submitted in English.
• Contributionswillbeconsideredprimarilyfromauthorswhorepresentthevariousdisciplines
of the dredging industry or professions, which are associated with dredging.
• Studentsandyoungprofessionalsareencouragedtosubmitarticlesbasedontheirresearch.
• Articlesshouldbeapproximately10-12A4s.Photographs,graphicsandillustrationsare
encouraged. Original photographs should be submitted, as these provide the best quality.
Digital photographs should be of the highest resolution.
• Articles should be original and should not have appeared in other magazines or publications.
An exception is made for the proceedings of conferences which have a limited reading public.
• Inthecaseofarticlesthathavepreviouslyappearedinconferenceproceedings,permission
to reprint in Terra et Aqua will be requested.
• Authorsarerequestedtoprovideinthe“Introduction”aninsightintothedrivers(theWhy)
behind the dredging project.
• Bysubmittinganarticle,authorsgrantIADCpermissiontopublishsaidarticleinboththe
printed and digital version of Terra et Aqua without limitations and remunerations.
• AllarticleswillbereviewedbytheEditorialAdvisoryCommittee(EAC).Publicationofan
article is subject to approval by the EAC and no article will be published without approval
of the EAC.
MEMbERShip liST iADC 2013Through their regional branches or through representatives, members of IADC operate directly at all locations worldwide
AfricABKI Egypt for Marine Contracting Works S.A.E., Cairo, EgyptDredging and Reclamation Jan De Nul Ltd., Lagos, NigeriaDredging International Services Nigeria Ltd., Ikoyi Lagos, NigeriaNigerian Westminster Dredging and Marine Ltd., Lagos, NigeriaVan Oord Nigeria Ltd., Victoria Island, Nigeria
AsiABeijing Boskalis Dredging Technology Co. Ltd., Beijing, PR ChinaBoskalis Dredging India Pvt Ltd., Mumbai, IndiaBoskalis International (S) Pte. Ltd., SingaporeDredging International Asia Pacific (Pte) Ltd., SingaporeHyundai Engineering & Construction Co. Ltd., Seoul, KoreaInternational Seaport Dredging Private Ltd., New Delhi, IndiaJan De Nul Dredging India Pvt. Ltd., IndiaJan De Nul Singapore Pte. Ltd., SingaporeP.T. Boskalis International Indonesia, Jakarta, IndonesiaPenta-Ocean Construction Co. Ltd., Tokyo, JapanPT Van Oord Indonesia, Jakarta, IndonesiaToa Corporation, Tokyo, JapanVan Oord (Malaysia) Sdn Bhd, Selangor, MalaysiaVan Oord (Shanghai) Dredging Co. Ltd., Shanghai, PR ChinaVan Oord Dredging and Marine Contractors bv Hong Kong Branch, Hong Kong, PR ChinaVan Oord Dredging and Marine Contractors bv Korea Branch, Busan, Republic of KoreaVan Oord Dredging and Marine Contractors bv Philippines Branch, Manilla, PhilippinesVan Oord Dredging and Marine Contractors bv Singapore Branch, SingaporeVan Oord India Pte Ltd., Mumbai, IndiaVan Oord Thai Ltd., Bangkok, Thailand Zinkcon Marine Singapore Pte. Ltd., Singapore
AusTrAliA + NEW ZEAlANDBoskalis Australia Pty, Ltd., Sydney, AustraliaDredging International (Australia) Pty. Ltd., Brisbane, QLD, AustraliaJan De Nul Australia Ltd., AustraliaNZ Dredging & General Works Ltd., Maunganui, New ZealandVan Oord Australia Pty Ltd., Brisbane, QLD, AustraliaWA Shell Sands Pty Ltd., Perth, Australia
EuropEAtlantique Dragage Sarl, St. Germain en Laye, FranceBaggermaatschappij Boskalis B.V., Papendrecht, NetherlandsBaggerwerken Decloedt & Zoon NV, Oostende, BelgiumBallast Ham Dredging, St. Petersburg, RussiaBaltic Marine Contractors SIA, Riga, LatviaBKW Dredging & Contracting Ltd., CyprusBoskalis B.V., Rotterdam, NetherlandsBoskalis International B.V., Papendrecht, NetherlandsBoskalis Italia Srl., Rome, ItalyBoskalis Offshore bv, Papendrecht, NetherlandsBoskalis Sweden AB, Gothenburg, SwedenBoskalis Westminster Ltd., Fareham, UK Boskalis Westminster Marine (Cyprus) Ltd., Limassol, CyprusBoskalis Westminster Middle East Ltd., Limassol, CyprusBoskalis Westminster Shipping BV, Papendrecht, NetherlandsBrewaba Wasserbaugesellschaft Bremen mbH, Bremen, GermanyDEME Building Materials NV (DBM), Zwijndrecht, BelgiumDragapor Dragagens de Portugal S.A., Alcochete, PortugalDravo SA, Italia, Amelia (TR), ItalyDravo SA, Lisbon, PortugalDravo SA, Madrid, Spain
Dredging and Contracting Rotterdam b.v., Bergen op Zoom, NetherlandsDredging and Maritime Management s.a., Steinfort, LuxembourgDredging International (Luxembourg) SA, Luxembourg, LuxembourgDredging International (UK) Ltd., East Grinstead, UKDredging International N.V., Zwijndrecht, BelgiumFlota Proyectos Singulares S.A., Madrid, SpainHeinrich Hirdes G.m.b.H., Hamburg, GermanyIrish Dredging Company Ltd., Cork, IrelandJan De Nul (UK) Ltd., Ascot, UKJan De Nul n.v., Hofstade/Aalst, BelgiumMijnster Zand- en Grinthandel bv, Gorinchem, NetherlandsNordsee Nassbagger-und Tiefbau GmbH, Bremen, GermanyPaans Van Oord B.V., Gorinchem, NetherlandsRock Fall Company Ltd., Aberdeen, UKRohde Nielsen, Copenhagen, DenmarkSociedade Española de Dragados S.A., Madrid, SpainSocieta Italiana Dragaggi SpA ‘SIDRA’, Rome, ItalySociété de Dragage International ‘SDI’ SA, Lambersart, FranceSodraco International S.A.S., Lille, FranceSodranord SARL, Le Blanc-Mesnil Cédex, FranceTerramare Eesti OU, Tallinn, EstoniaTerramare Oy, Helsinki, FinlandTideway B.V., Breda, NetherlandsTOA (LUX) S.A., Luxembourg, LuxembourgVan Oord (Gibraltar) Ltd., GibraltarVan Oord ACZ Marine Contractors bv, Rotterdam, NetherlandsVan Oord Ireland Ltd., Dublin, IrelandVan Oord Middle East Ltd., Nicosia, CyprusVan Oord Nederland bv, Gorinchem, NetherlandsVan Oord nv, Rotterdam, NetherlandsVan Oord Offshore bv, Gorinchem, NetherlandsVan Oord UK Ltd., Newbury, UK
MiDDlE EAsTBoskalis Middle East Ltd., Abu Dhabi, UAEBoskalis Westminster (Oman) LLC, Muscat, OmanBoskalis Westminster Al Rushaid Co. Ltd., Al Khobar, Saudi ArabiaBoskalis Westminster Middle East Ltd., Manama, BahrainGulf Cobla (Limited Liability Company), Dubai, UAEJan De Nul Dredging Ltd. (Dubai Branch), Dubai, UAEMiddle East Dredging Company (MEDCO), Doha, QatarNational Marine Dredging Company, Abu Dhabi, UAEVan Oord Gulf FZE, Dubai, UAE
ThE AMEricAsBoskalis International bv Sucural Argentina, Buenos Aires, ArgentinaBoskalis International Uruguay S.A., Montevideo, UruguayBoskalis Panama SA, Panama City, PanamaCompañía Sud Americana de Dragados S.A., Buenos Aires, ArgentinaDragabras Servicos de Dragagem Ltda., BrazilDragamex SA de CV, Mexcio City, MexicoDravensa C.A., Caracas, VenezuelaDredging International de Panama SA, PanamaDredging International Mexico SA de CV, Veracruz, MexicoJan De Nul do Brasil Dragagem Ltda., BrazilMexicana de Dragados S.A. de C.V., Mexico City, MexicoStuyvesant Dredging Company, Louisiana, USAVan Oord Curaçao nv, Willemstad, CuraçaoVan Oord Dragagens do Brasil Ltd., Rio de Janeiro, BrazilWestminster Dredging (Overseas) Ltd., Trinidad
Terra et Aqua is published quarterly by the IADC, The International Association
of Dredging Companies. The journal is available on request to individuals or
organisations with a professional interest in dredging and maritime infrastructure
projects including the development of ports and waterways, coastal protection,
land reclamation, offshore works, environmental remediation and habitat restoration.
The name Terra et Aqua is a registered trademark.
for a free subscription register at www.terra-et-aqua.com
© 2013 IADC, The Netherlands
All rights reserved. Electronic storage, reprinting or
abstracting of the contents is allowed for non-commercial
purposes with permission of the publisher.
ISSN 0376-6411
Typesetting and printing by Opmeer Drukkerij bv,
The Hague, The Netherlands. PEFC/30-31-372
Contents 1
EDITORIAL 2
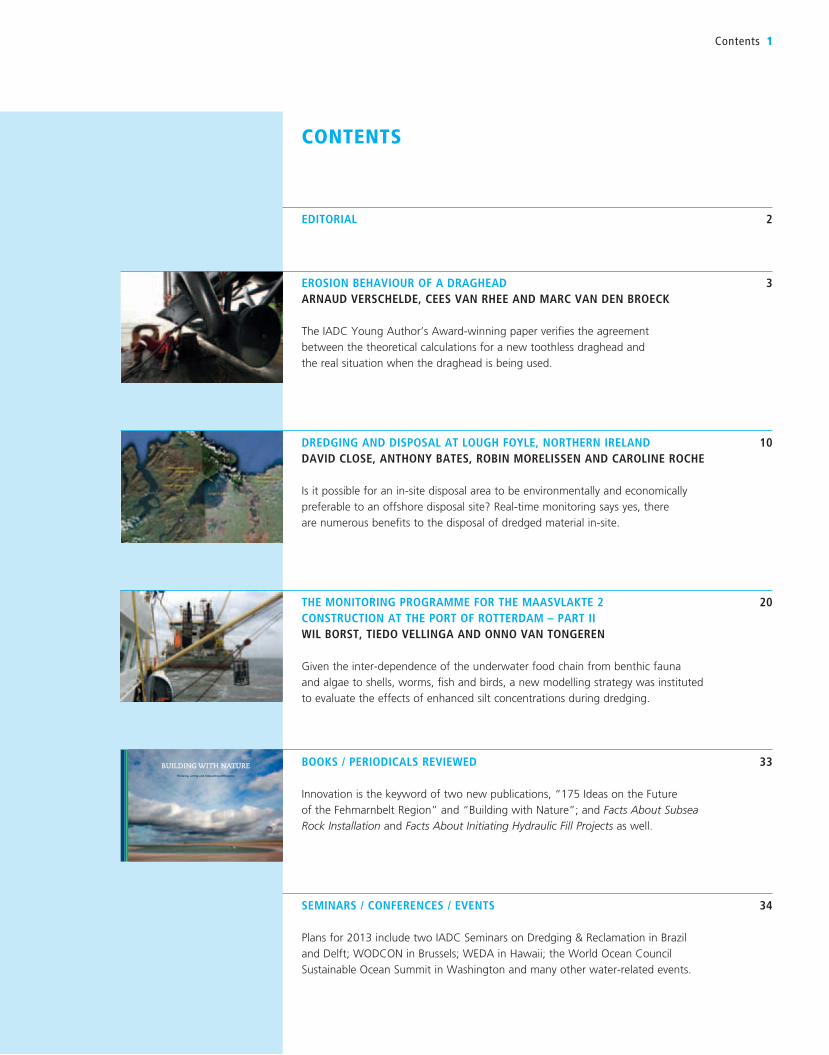
EROSION BEHAVIOUR OF A DRAGHEAD 3ARNAUD VERSCHELDE, CEES VAN RHEE AND MARC VAN DEN BROECk
The IADC Young Author’s Award-winning paper verifies the agreement
between the theoretical calculations for a new toothless draghead and
the real situation when the draghead is being used.
DREDGING AND DISPOSAL AT LOUGH FOYLE, NORTHERN IRELAND 10DAVID CLOSE, ANTHONY BATES, ROBIN MORELISSEN AND CAROLINE ROCHE
Is it possible for an in-site disposal area to be environmentally and economically
preferable to an offshore disposal site? Real-time monitoring says yes, there
are numerous benefits to the disposal of dredged material in-site.
THE MONITORING PROGRAMME FOR THE MAASVLAkTE 2 20CONSTRUCTION AT THE PORT OF ROTTERDAM – PART II WIL BORST, TIEDO VELLINGA AND ONNO VAN TONGEREN
Given the inter-dependence of the underwater food chain from benthic fauna
and algae to shells, worms, fish and birds, a new modelling strategy was instituted
to evaluate the effects of enhanced silt concentrations during dredging.
BOOkS / PERIODICALS REVIEWED 33
Innovation is the keyword of two new publications, “175 Ideas on the Future
of the Fehmarnbelt Region” and “Building with Nature”; and Facts About SubseaRock Installation and Facts About Initiating Hydraulic Fill Projects as well.
SEMINARS / CONFERENCES / EVENTS 34
Plans for 2013 include two IADC Seminars on Dredging & Reclamation in Brazil
and Delft; WODCON in Brussels; WEDA in Hawaii; the World Ocean Council
Sustainable Ocean Summit in Washington and many other water-related events.
contents
Building with natureThinking, acting and interacting differently
eDItoRIALEducation and the dissemination of information about state-of-the-art dredging and maritime
construction stand high on the list of the priorities of the International Association of Dredging.
With this in mind IADC publishes Terra et Aqua, the Facts About series, Dredging for Development and other books. IADC also supports the publication of third- party books such as
Hydraulic Fill Manual, Clarksons’ The Dredger Register and FIDIC’s Form of Contract for Dredging and Reclamation Works.
Educational outreach is also achieved by organising seminars worldwide. The first of 2013 will
be the International Seminar on Dredging and Land Reclamation, to be held in Búzios, Brazil in
April. Brazil was chosen because of the enormous amount of activity going on in Latin America.
That will be followed by the IHE-UNESCO seminar in Delft, an annual event that informs young
professionals doing advanced water-related studies specifically about dredging. Ultimately this
helps increase knowledge of sound dredging techniques in emerging nations. In both these
seminars, the instructors are dredging experts with both academic and professional credentials.
Looking further forward, a reprisal of the “Early Contractor Involvement Forum” is planned for
the autumn in Kuala Lumpur, Malaysia. This Forum, successfully held in London in 2011, is an
interactive event which stimulated surprising, sometimes controversial, dialogues amongst
participants. The Forum examines the full scope of maritime construction projects. It explores the
possibilities for the exchange of knowledge and experiences between clients, consultants and
contractors even before the launch of a project.
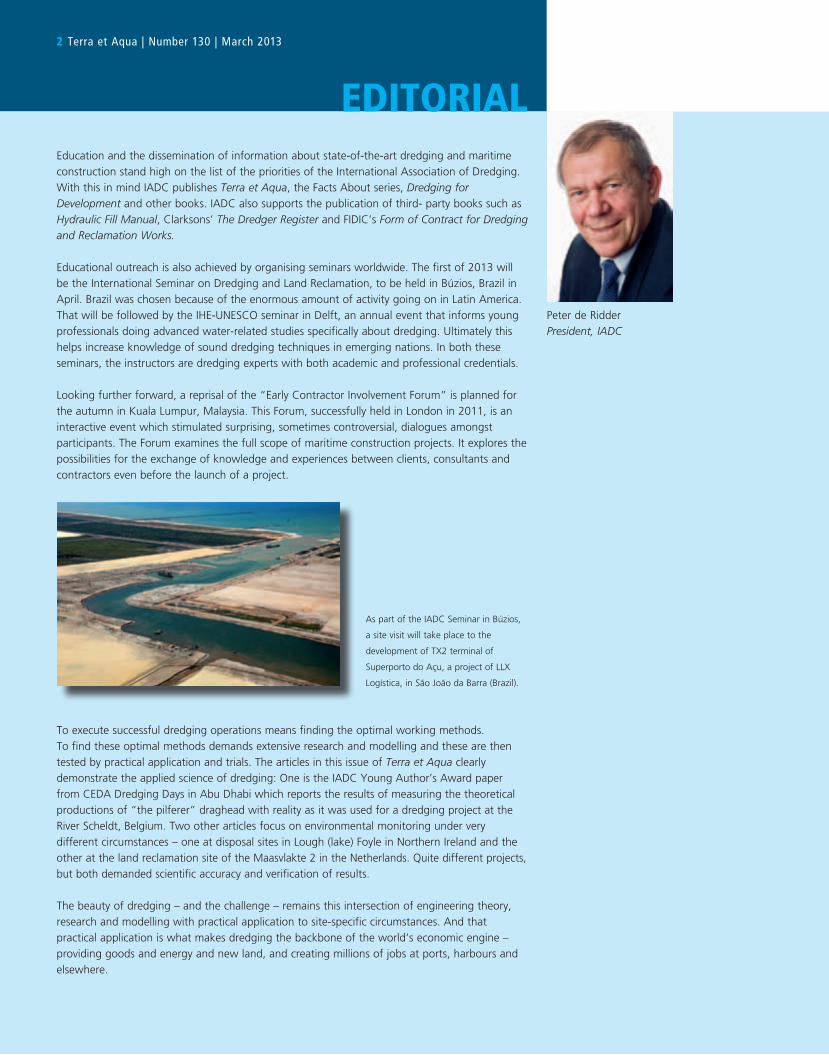
As part of the IADC Seminar in Búzios,
a site visit will take place to the
development of TX2 terminal of
Superporto do Açu, a project of LLX
Logística, in São João da Barra (Brazil).
To execute successful dredging operations means finding the optimal working methods.
To find these optimal methods demands extensive research and modelling and these are then
tested by practical application and trials. The articles in this issue of Terra et Aqua clearly
demonstrate the applied science of dredging: One is the IADC Young Author’s Award paper
from CEDA Dredging Days in Abu Dhabi which reports the results of measuring the theoretical
productions of “the pilferer” draghead with reality as it was used for a dredging project at the
River Scheldt, Belgium. Two other articles focus on environmental monitoring under very
different circumstances – one at disposal sites in Lough (lake) Foyle in Northern Ireland and the
other at the land reclamation site of the Maasvlakte 2 in the Netherlands. Quite different projects,
but both demanded scientific accuracy and verification of results.
The beauty of dredging – and the challenge – remains this intersection of engineering theory,
research and modelling with practical application to site-specific circumstances. And that
practical application is what makes dredging the backbone of the world’s economic engine –
providing goods and energy and new land, and creating millions of jobs at ports, harbours and
elsewhere.
2 Terra et Aqua | Number 130 | March 2013
Peter de Ridder
President, IADC
ABSTRACT
A draghead known as “the pilferer”, based
on the principle of erosion, was invented by
DEME dredging company. Using the concept
of van Rhee (2010) the erosion behaviour of
this particular draghead was investigated.
The erosion rates created by the flow velocity
along the seabed are calculated using
potential flow theory. Certain assumptions
were made during the use of this theory.
These assumptions were validated in a
Computational Fluid Dynamics (CFD) model
using OpenFOAM. The CFD model also gave
a better understanding of the flow field of a
draghead during the erosion process. With
these theories the productions of the erosion
head were calculated and compared to reality.
Agreement between calculations and the real
situation is promising. The theory explained in
this research can also be used to describe the erosion behaviour of other types of dragheads.
The author wishes to thank C. van Rhee,
Professor, Delft University of Technology,
Section Dredging Engineering, Faculty
Mechanical, Maritime and Materials
Engineering, and M. van den Broeck, Head
Research, Method, Production and
Engineering department, DEME, Zwijndrecht,
Belgium for their contributions to this
research. This article originally was published
in the Proceedings of the CEDA Dredging
Days 2012 in Abu Dhabi and is reprinted here
in an adapted version with permission.
INTRODUCTION
In 2010 DEME (Dredging, Environmental and
Marine Engineering) wanted to tender for a
dredging project at the River Scheldt in Belgium.
At this project site two 50kV electricity cables
were buried which could not be touched, yet
dredging works needed to be done in their
vicinity. As a result of years of erosion from
river flow and other natural effects, the depth
of these cables was not precisely known.
Therefore careful dredging was recommended.
DEME wanted to make use of one of their
existing vessels without much extra equipment
onboard and therefore they decided to
develop a specialised type of draghead. The
results was the so-called “pilferer” draghead
(see Figures 1 and 2), which is based on the
principle of erosion and can remove small
layers of soil without really touching the river-
or seabed. This would allow careful dredging
without damaging the buried cables.
The draghead is the part of the dredging
excavating system that is in touch with the
seabed. Most dragheads excavate soil from
the seabed with the help of jet water flow
and a number of teeth. The pilferer draghead
is designed without teeth and with jets that
have a relatively low jet water velocity (up to
10 m/s). These jets are positioned in such a
way that their only purpose is to create a
higher water flow to the draghead for better
transport of the eroded sand particles. The
erosion is set up by a flow along the seabed
which is created by the suction effect of the
centrifugal pump. This topic was a research
project as part of an MSc study in the Section
Offshore and Dredging Engineering at Delft
University of Technology, carried out under
the guidance of Professor C. van Rhee and
started in March 2011. For describing the
erosion behaviour of the pilferer draghead
actually three main ingredients are necessary:
1 erosion theory
2 flow velocities along the seabed
3 groundwater flow
eRosIon BeHAVIoUR oF A DRAGHeAD
ARnAUD VeRscHeLDe, cees VAn RHee AnD MARc VAn Den BRoeck
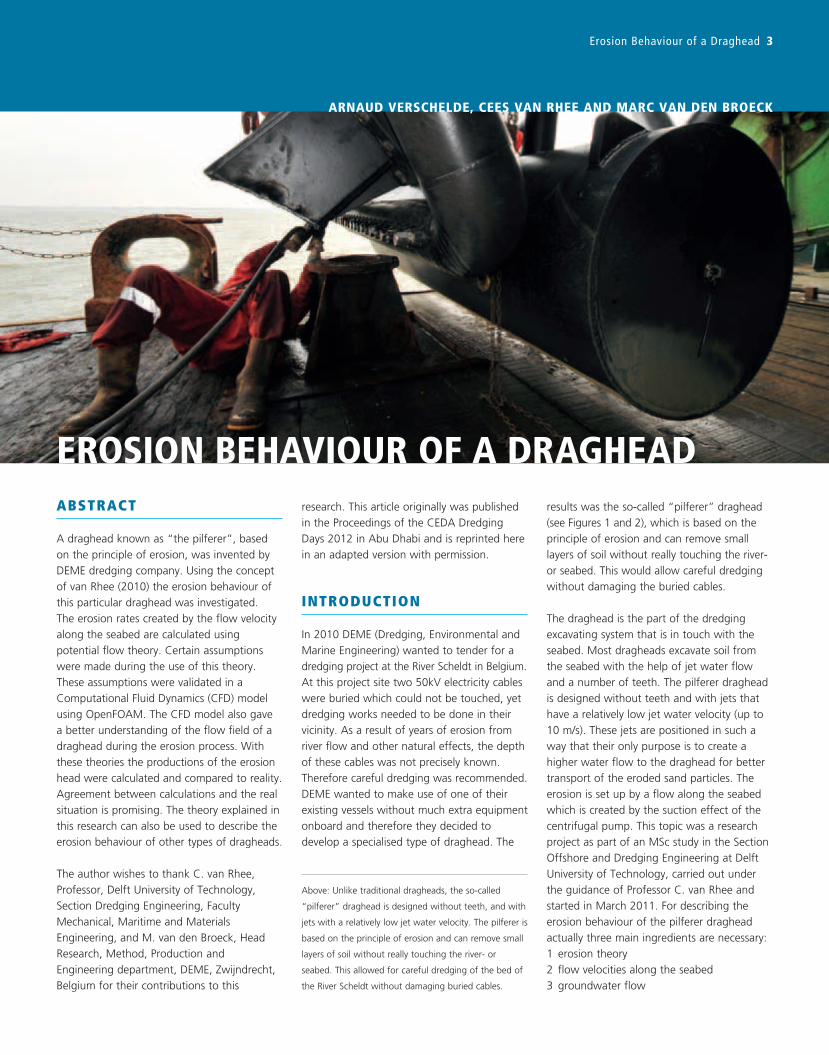
Above: Unlike traditional dragheads, the so-called
“pilferer” draghead is designed without teeth, and with
jets with a relatively low jet water velocity. The pilferer is
based on the principle of erosion and can remove small
layers of soil without really touching the river- or
seabed. This allowed for careful dredging of the bed of
the River Scheldt without damaging buried cables.
Erosion Behaviour of a Draghead 3
These three subjects were each investigated
separately and brought together at the end
of the research for describing the erosion
behaviour of the pilferer draghead. In this
article, first a description is given of erosion
theory, then how the flow velocities along the
seabed evolve are explained, next the ground-
water flow theory is clarified, and finally these
three subjects are combined to explain the
final erosion behaviour of the draghead.
Although in this research only the erosion
behaviour of the pilferer draghead was
investigated, using the theory explained here,
the erosion behaviour of other types of
dragheads can also be investigated.
eRosIon tHeoRYThe research started by comparing several
erosion theories in a literature study. Three
erosion theories were found to be appropriate
for this research. These were the theory of
van Rijn (1984), the theory of Visser (1995)
and the theory of van Rhee (2010). Visser
(Bisschop, Visser, van Rhee and Verhagen,
2010) compared these theories with his
theory and measurements and came to the
conclusion that the van Rhee theory (2010)
was the most consistent with the real
situation. This is one of the reasons why the
van Rhee theory was used for this research.
The theory of van Rhee (2010) is based on the
theory of van Rijn (1984). The theory of van Rijn
(1984) can only be used for erosion created
by low velocities (< 10 m/s). With the
adjustments of van Rhee, this theory can be
used for erosion created by higher flow
velocities (≥ 10 m/s). Because during dredging
the flow velocities that are encountered are
higher than 10 m/s, the van Rhee theory
(2010) was preferred for this research. The
4 Terra et Aqua | Number 130 | March 2013
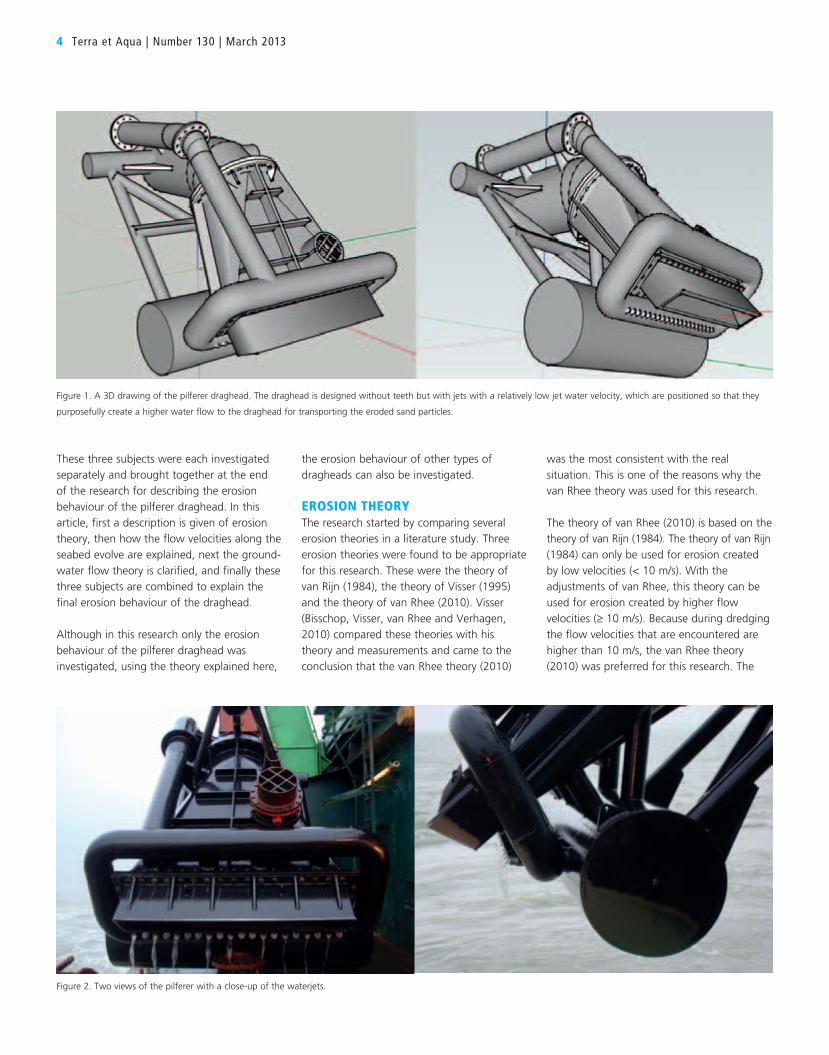
Figure 1. A 3D drawing of the pilferer draghead. The draghead is designed without teeth but with jets with a relatively low jet water velocity, which are positioned so that they
purposefully create a higher water flow to the draghead for transporting the eroded sand particles.
Figure 2. Two views of the pilferer with a close-up of the waterjets.
Erosion Behaviour of a Draghead 5
IADC YOUNG AUTHORS AWARD
PRESENTED AT CEDA DREDGING DAYS
ABU DHABI, UAE, DECEMBER 12-13 2012
The International Association of Dredging Companies (IADC)
presented its Best Paper Award for a Young Author for the
28th time at the CEDA Dredging Days on December 13,
2012 in Abu Dhabi, to Mr. Arnaud Verschelde for his paper
“Erosion Behaviour of a Draghead”. Mr. Verschelde started
his studies at Delft University of Technology in 2006.
In 2009 he obtained his bachelor degree of Marine
Technology. He continued his studies with a Master’s
degree in Offshore and Dredging Engineering. In 2011 he
graduated from the Delft University of Technology Faculty
of 3ME (Mechanical, Maritime and Materials Engineering).
His graduation project was developed in cooperation with
Dredging International, part of the DEME (Dredging,
Environmental and Marine Engineering) group. In 2012
his graduation project was selected as best graduation
project of 2011-2012 by the Dutch engineers society
KIVI (Koninklijk Instituut van Ingenieurs) Niria. He is
presently a Project Engineer Automation at DEME.
The purpose of the IADC Young Authors Award is to
stimulate the promotion of new ideas and to encourage
young professionals under the age of 35 working in the
dredging industry and related fields. It is presented each
year at selected conferences at the recommendation of the
Conference Paper Committee. The winner receives € 1,000
and a certificate of recognition. The paper may then be
published in Terra et Aqua, IADC’s quarterly journal.
IADC Secretary General René Kolman (right) presents
the Young Authors Award to Arnaud Verschelde at
CEDA Dredging Days in Abu Dhabi, December 2012.
𝑣𝑣! =𝐸𝐸 − 𝑆𝑆
𝜌𝜌! 1 − 𝑛𝑛! − 𝑐𝑐!
(1)
where: 𝑣𝑣! = erosion velocity 𝑆𝑆 = settling flux 𝐸𝐸 = pick-up flux 𝜌𝜌! = density of particles 𝜌𝜌! = density of water 𝑛𝑛! = porosity of the settled bed 𝑐𝑐! = near-bed volumetric concentration 𝑤𝑤! = settling velocity
(2)
11 − 𝑛𝑛! − 𝑐𝑐!
𝜙𝜙!! 𝑔𝑔∆𝐷𝐷 − 𝑐𝑐!𝑤𝑤!𝑣𝑣! =
𝜙𝜙!! = 0.00033 ∙ 𝐷𝐷∗!.! ∙𝜃𝜃 − 𝜃𝜃!"!
𝜃𝜃!"!
!.!
(3)
where: 𝐷𝐷∗ = dimensionless particle diameter 𝜃𝜃!"! = adapted critical Shields parameter This adapted critical Shields parameter 𝜃𝜃!"! is different from van Rijn in that it takes into account a hydraulic gradient and the slope angle. The adapted critical Shields parameter is:
𝜃𝜃!"! = 𝜃𝜃!"sin 𝜙𝜙 − 𝛽𝛽sin𝜙𝜙
+𝑣𝑣!𝑘𝑘!∙𝑛𝑛! − 𝑛𝑛!1 − 𝑛𝑛!
𝐴𝐴∆
(4)
where: 𝑔𝑔 = gravitational acceleration 𝐷𝐷!" = median particle size diameter 𝜏𝜏 = bed shear stress 𝜃𝜃 = Shields parameter = !
!!!!! !!!"
𝜃𝜃!" = critical Shields parameter 𝜙𝜙 = angle of internal friction 𝛽𝛽 = slope angle 𝑘𝑘! = permeability at moment of dilatation 𝑛𝑛! = porosity at moment of dilatation 𝐴𝐴 = constant describing single particle or continuum mode stability ∆ = relative sediment density = !!!!!
!!
𝜃𝜃 is the Shields parameter and is a non-dimensional number for describing the bed shear stress. If the critical Shields parameter 𝜃𝜃!" is exceeded then the initiation of motion of the sand particles will start (Miedema, 2008). The critical value of 𝜃𝜃 in equation (4) is multiplied by a term which includes the slope angle and an extra term which is important at high erosion velocities. This last term is a multiplication of the hydraulic gradient that is present during erosion !!
!!∙ !!!!!!!!!
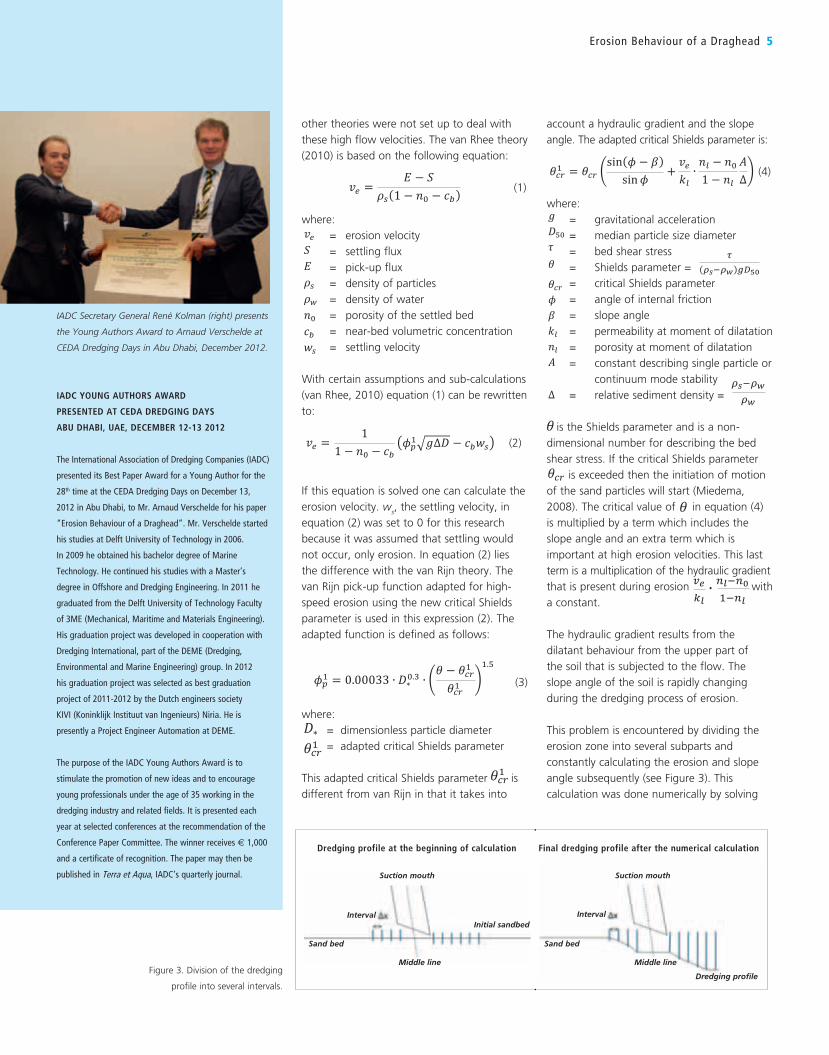
with a constant. The hydraulic gradient results from the dilatant behaviour from the upper part of the soil that is subjected to the flow. The slope angle of the soil is rapidly changing during the dredging process of erosion. This problem is encountered by dividing the erosion zone into several subparts and constantly calculating the erosion and slope angle subsequently (see Figure 3). This calculation was done numerically by solving equation (5). This numerical calculation was done with the help of the Newton-Raphson method.
11 − 𝑛𝑛! − 𝑐𝑐!
𝜙𝜙!! 𝑔𝑔∆𝐷𝐷 − 𝑐𝑐!𝑤𝑤! − 𝑣𝑣! = 0 (5)
𝜙𝜙!! = 0.00033 ∙ 𝐷𝐷∗!.! ∙𝜃𝜃 − 𝜃𝜃!"!
𝜃𝜃!"!
!.!
(3)
where: 𝐷𝐷∗ = dimensionless particle diameter 𝜃𝜃!"! = adapted critical Shields parameter This adapted critical Shields parameter 𝜃𝜃!"! is different from van Rijn in that it takes into account a hydraulic gradient and the slope angle. The adapted critical Shields parameter is:
𝜃𝜃!"! = 𝜃𝜃!"sin 𝜙𝜙 − 𝛽𝛽sin𝜙𝜙
+𝑣𝑣!𝑘𝑘!∙𝑛𝑛! − 𝑛𝑛!1 − 𝑛𝑛!
𝐴𝐴∆
(4)
where: 𝑔𝑔 = gravitational acceleration 𝐷𝐷!" = median particle size diameter 𝜏𝜏 = bed shear stress 𝜃𝜃 = Shields parameter = !
!!!!! !!!"
𝜃𝜃!" = critical Shields parameter 𝜙𝜙 = angle of internal friction 𝛽𝛽 = slope angle 𝑘𝑘! = permeability at moment of dilatation 𝑛𝑛! = porosity at moment of dilatation 𝐴𝐴 = constant describing single particle or continuum mode stability ∆ = relative sediment density = !!!!!
!!
𝜃𝜃 is the Shields parameter and is a non-dimensional number for describing the bed shear stress. If the critical Shields parameter 𝜃𝜃!" is exceeded then the initiation of motion of the sand particles will start (Miedema, 2008). The critical value of 𝜃𝜃 in equation (4) is multiplied by a term which includes the slope angle and an extra term which is important at high erosion velocities. This last term is a multiplication of the hydraulic gradient that is present during erosion !!
!!∙ !!!!!!!!!
with a constant. The hydraulic gradient results from the dilatant behaviour from the upper part of the soil that is subjected to the flow. The slope angle of the soil is rapidly changing during the dredging process of erosion. This problem is encountered by dividing the erosion zone into several subparts and constantly calculating the erosion and slope angle subsequently (see Figure 3). This calculation was done numerically by solving equation (5). This numerical calculation was done with the help of the Newton-Raphson method.
11 − 𝑛𝑛! − 𝑐𝑐!
𝜙𝜙!! 𝑔𝑔∆𝐷𝐷 − 𝑐𝑐!𝑤𝑤! − 𝑣𝑣! = 0 (5)
Dredging profile at the beginning of calculation
Suction mouth
IntervalInitial sandbed
Sand bed
Middle line
Final dredging profile after the numerical calculation
Suction mouth
Interval
Dredging profile
Sand bed
Middle lineFigure 3. Division of the dredging
profile into several intervals.
𝜙𝜙!! = 0.00033 ∙ 𝐷𝐷∗!.! ∙𝜃𝜃 − 𝜃𝜃!"!
𝜃𝜃!"!
!.!
(3)
where: 𝐷𝐷∗ = dimensionless particle diameter 𝜃𝜃!"! = adapted critical Shields parameter This adapted critical Shields parameter 𝜃𝜃!"! is different from van Rijn in that it takes into account a hydraulic gradient and the slope angle. The adapted critical Shields parameter is:
𝜃𝜃!"! = 𝜃𝜃!"sin 𝜙𝜙 − 𝛽𝛽sin𝜙𝜙
+𝑣𝑣!𝑘𝑘!∙𝑛𝑛! − 𝑛𝑛!1 − 𝑛𝑛!
𝐴𝐴∆
(4)
where: 𝑔𝑔 = gravitational acceleration 𝐷𝐷!" = median particle size diameter 𝜏𝜏 = bed shear stress 𝜃𝜃 = Shields parameter = !
!!!!! !!!"
𝜃𝜃!" = critical Shields parameter 𝜙𝜙 = angle of internal friction 𝛽𝛽 = slope angle 𝑘𝑘! = permeability at moment of dilatation 𝑛𝑛! = porosity at moment of dilatation 𝐴𝐴 = constant describing single particle or continuum mode stability ∆ = relative sediment density = !!!!!
!!
𝜃𝜃 is the Shields parameter and is a non-dimensional number for describing the bed shear stress. If the critical Shields parameter 𝜃𝜃!" is exceeded then the initiation of motion of the sand particles will start (Miedema, 2008). The critical value of 𝜃𝜃 in equation (4) is multiplied by a term which includes the slope angle and an extra term which is important at high erosion velocities. This last term is a multiplication of the hydraulic gradient that is present during erosion !!
!!∙ !!!!!!!!!
with a constant. The hydraulic gradient results from the dilatant behaviour from the upper part of the soil that is subjected to the flow. The slope angle of the soil is rapidly changing during the dredging process of erosion. This problem is encountered by dividing the erosion zone into several subparts and constantly calculating the erosion and slope angle subsequently (see Figure 3). This calculation was done numerically by solving equation (5). This numerical calculation was done with the help of the Newton-Raphson method.
11 − 𝑛𝑛! − 𝑐𝑐!
𝜙𝜙!! 𝑔𝑔∆𝐷𝐷 − 𝑐𝑐!𝑤𝑤! − 𝑣𝑣! = 0 (5)
other theories were not set up to deal with
these high flow velocities. The van Rhee theory
(2010) is based on the following equation:
𝑣𝑣! =
𝐸𝐸 − 𝑆𝑆𝜌𝜌! 1 − 𝑛𝑛! − 𝑐𝑐!
(1)
where: 𝑣𝑣! = erosion velocity 𝑆𝑆 = settling flux 𝐸𝐸 = pick-up flux 𝜌𝜌! = density of particles 𝜌𝜌! = density of water 𝑛𝑛! = porosity of the settled bed 𝑐𝑐! = near-bed volumetric concentration 𝑤𝑤! = settling velocity
𝒗𝒗𝒆𝒆 =𝟏𝟏
𝟏𝟏 − 𝒏𝒏𝟎𝟎 − 𝒄𝒄𝒃𝒃𝝓𝝓𝒑𝒑𝟏𝟏 𝒈𝒈∆𝑫𝑫 − 𝒄𝒄𝒃𝒃𝒘𝒘𝒔𝒔
(2)
(1)
where:
= erosion velocity
= settling flux
= pick-up flux
= density of particles
= density of water
= porosity of the settled bed
= near-bed volumetric concentration
= settling velocity
With certain assumptions and sub-calculations
(van Rhee, 2010) equation (1) can be rewritten
to:
𝑣𝑣! =𝐸𝐸 − 𝑆𝑆
𝜌𝜌! 1 − 𝑛𝑛! − 𝑐𝑐!
(1)
where: 𝑣𝑣! = erosion velocity 𝑆𝑆 = settling flux 𝐸𝐸 = pick-up flux 𝜌𝜌! = density of particles 𝜌𝜌! = density of water 𝑛𝑛! = porosity of the settled bed 𝑐𝑐! = near-bed volumetric concentration 𝑤𝑤! = settling velocity
(2)
11 − 𝑛𝑛! − 𝑐𝑐!
𝜙𝜙!! 𝑔𝑔∆𝐷𝐷 − 𝑐𝑐!𝑤𝑤!𝑣𝑣! = (2)
If this equation is solved one can calculate the
erosion velocity. ws, the settling velocity, in
equation (2) was set to 0 for this research
because it was assumed that settling would
not occur, only erosion. In equation (2) lies
the difference with the van Rijn theory. The
van Rijn pick-up function adapted for high-
speed erosion using the new critical Shields
parameter is used in this expression (2). The
adapted function is defined as follows:
𝜙𝜙!! = 0.00033 ∙ 𝐷𝐷∗!.! ∙𝜃𝜃 − 𝜃𝜃!"!
𝜃𝜃!"!
!.!
(3)
where: 𝐷𝐷∗ = dimensionless particle diameter 𝜃𝜃!"! = adapted critical Shields parameter This adapted critical Shields parameter 𝜃𝜃!"! is different from van Rijn in that it takes into account a hydraulic gradient and the slope angle. The adapted critical Shields parameter is:
𝜃𝜃!"! = 𝜃𝜃!"sin 𝜙𝜙 − 𝛽𝛽sin𝜙𝜙
+𝑣𝑣!𝑘𝑘!∙𝑛𝑛! − 𝑛𝑛!1 − 𝑛𝑛!
𝐴𝐴∆
(4)
where: 𝑔𝑔 = gravitational acceleration 𝐷𝐷!" = median particle size diameter 𝜏𝜏 = bed shear stress 𝜃𝜃 = Shields parameter = !
!!!!! !!!"
𝜃𝜃!" = critical Shields parameter 𝜙𝜙 = angle of internal friction 𝛽𝛽 = slope angle 𝑘𝑘! = permeability at moment of dilatation 𝑛𝑛! = porosity at moment of dilatation 𝐴𝐴 = constant describing single particle or continuum mode stability ∆ = relative sediment density = !!!!!
!!
𝜃𝜃 is the Shields parameter and is a non-dimensional number for describing the bed shear stress. If the critical Shields parameter 𝜃𝜃!" is exceeded then the initiation of motion of the sand particles will start (Miedema, 2008). The critical value of 𝜃𝜃 in equation (4) is multiplied by a term which includes the slope angle and an extra term which is important at high erosion velocities. This last term is a multiplication of the hydraulic gradient that is present during erosion !!
!!∙ !!!!!!!!!
with a constant. The hydraulic gradient results from the dilatant behaviour from the upper part of the soil that is subjected to the flow. The slope angle of the soil is rapidly changing during the dredging process of erosion. This problem is encountered by dividing the erosion zone into several subparts and constantly calculating the erosion and slope angle subsequently (see Figure 3). This calculation was done numerically by solving equation (5). This numerical calculation was done with the help of the Newton-Raphson method.
11 − 𝑛𝑛! − 𝑐𝑐!
𝜙𝜙!! 𝑔𝑔∆𝐷𝐷 − 𝑐𝑐!𝑤𝑤! − 𝑣𝑣! = 0 (5)
(3)
where:
= dimensionless particle diameter
= adapted critical Shields parameter
This adapted critical Shields parameter
𝜙𝜙!! = 0.00033 ∙ 𝐷𝐷∗!.! ∙𝜃𝜃 − 𝜃𝜃!"!
𝜃𝜃!"!
!.!
(3)
where: 𝐷𝐷∗ = dimensionless particle diameter 𝜃𝜃!"! = adapted critical Shields parameter This adapted critical Shields parameter 𝜃𝜃!"! is different from van Rijn in that it takes into account a hydraulic gradient and the slope angle. The adapted critical Shields parameter is:
𝜃𝜃!"! = 𝜃𝜃!"sin 𝜙𝜙 − 𝛽𝛽sin𝜙𝜙
+𝑣𝑣!𝑘𝑘!∙𝑛𝑛! − 𝑛𝑛!1 − 𝑛𝑛!
𝐴𝐴∆
(4)
where: 𝑔𝑔 = gravitational acceleration 𝐷𝐷!" = median particle size diameter 𝜏𝜏 = bed shear stress 𝜃𝜃 = Shields parameter = !
!!!!! !!!"
𝜃𝜃!" = critical Shields parameter 𝜙𝜙 = angle of internal friction 𝛽𝛽 = slope angle 𝑘𝑘! = permeability at moment of dilatation 𝑛𝑛! = porosity at moment of dilatation 𝐴𝐴 = constant describing single particle or continuum mode stability ∆ = relative sediment density = !!!!!
!!
𝜃𝜃 is the Shields parameter and is a non-dimensional number for describing the bed shear stress. If the critical Shields parameter 𝜃𝜃!" is exceeded then the initiation of motion of the sand particles will start (Miedema, 2008). The critical value of 𝜃𝜃 in equation (4) is multiplied by a term which includes the slope angle and an extra term which is important at high erosion velocities. This last term is a multiplication of the hydraulic gradient that is present during erosion !!
!!∙ !!!!!!!!!
with a constant. The hydraulic gradient results from the dilatant behaviour from the upper part of the soil that is subjected to the flow. The slope angle of the soil is rapidly changing during the dredging process of erosion. This problem is encountered by dividing the erosion zone into several subparts and constantly calculating the erosion and slope angle subsequently (see Figure 3). This calculation was done numerically by solving equation (5). This numerical calculation was done with the help of the Newton-Raphson method.
11 − 𝑛𝑛! − 𝑐𝑐!
𝜙𝜙!! 𝑔𝑔∆𝐷𝐷 − 𝑐𝑐!𝑤𝑤! − 𝑣𝑣! = 0 (5)
is
different from van Rijn in that it takes into
𝜙𝜙!! = 0.00033 ∙ 𝐷𝐷∗!.! ∙𝜃𝜃 − 𝜃𝜃!"!
𝜃𝜃!"!
!.!
(3)
where: 𝐷𝐷∗ = dimensionless particle diameter 𝜃𝜃!"! = adapted critical Shields parameter This adapted critical Shields parameter 𝜃𝜃!"! is different from van Rijn in that it takes into account a hydraulic gradient and the slope angle. The adapted critical Shields parameter is:
𝜃𝜃!"! = 𝜃𝜃!"sin 𝜙𝜙 − 𝛽𝛽sin𝜙𝜙
+𝑣𝑣!𝑘𝑘!∙𝑛𝑛! − 𝑛𝑛!1 − 𝑛𝑛!
𝐴𝐴∆
(4)
where: 𝑔𝑔 = gravitational acceleration 𝐷𝐷!" = median particle size diameter 𝜏𝜏 = bed shear stress 𝜃𝜃 = Shields parameter = !
!!!!! !!!"
𝜃𝜃!" = critical Shields parameter 𝜙𝜙 = angle of internal friction 𝛽𝛽 = slope angle 𝑘𝑘! = permeability at moment of dilatation 𝑛𝑛! = porosity at moment of dilatation 𝐴𝐴 = constant describing single particle or continuum mode stability ∆ = relative sediment density = !!!!!
!!
𝜃𝜃 is the Shields parameter and is a non-dimensional number for describing the bed shear stress. If the critical Shields parameter 𝜃𝜃!" is exceeded then the initiation of motion of the sand particles will start (Miedema, 2008). The critical value of 𝜃𝜃 in equation (4) is multiplied by a term which includes the slope angle and an extra term which is important at high erosion velocities. This last term is a multiplication of the hydraulic gradient that is present during erosion !!
!!∙ !!!!!!!!!
with a constant. The hydraulic gradient results from the dilatant behaviour from the upper part of the soil that is subjected to the flow. The slope angle of the soil is rapidly changing during the dredging process of erosion. This problem is encountered by dividing the erosion zone into several subparts and constantly calculating the erosion and slope angle subsequently (see Figure 3). This calculation was done numerically by solving equation (5). This numerical calculation was done with the help of the Newton-Raphson method.
11 − 𝑛𝑛! − 𝑐𝑐!
𝜙𝜙!! 𝑔𝑔∆𝐷𝐷 − 𝑐𝑐!𝑤𝑤! − 𝑣𝑣! = 0 (5)
account a hydraulic gradient and the slope
angle. The adapted critical Shields parameter is:
𝜙𝜙!! = 0.00033 ∙ 𝐷𝐷∗!.! ∙𝜃𝜃 − 𝜃𝜃!"!
𝜃𝜃!"!
!.!
(3)
where: 𝐷𝐷∗ = dimensionless particle diameter 𝜃𝜃!"! = adapted critical Shields parameter This adapted critical Shields parameter 𝜃𝜃!"! is different from van Rijn in that it takes into account a hydraulic gradient and the slope angle. The adapted critical Shields parameter is:
𝜃𝜃!"! = 𝜃𝜃!"sin 𝜙𝜙 − 𝛽𝛽sin𝜙𝜙
+𝑣𝑣!𝑘𝑘!∙𝑛𝑛! − 𝑛𝑛!1 − 𝑛𝑛!
𝐴𝐴∆
(4)
where: 𝑔𝑔 = gravitational acceleration 𝐷𝐷!" = median particle size diameter 𝜏𝜏 = bed shear stress 𝜃𝜃 = Shields parameter = !
!!!!! !!!"
𝜃𝜃!" = critical Shields parameter 𝜙𝜙 = angle of internal friction 𝛽𝛽 = slope angle 𝑘𝑘! = permeability at moment of dilatation 𝑛𝑛! = porosity at moment of dilatation 𝐴𝐴 = constant describing single particle or continuum mode stability ∆ = relative sediment density = !!!!!
!!
𝜃𝜃 is the Shields parameter and is a non-dimensional number for describing the bed shear stress. If the critical Shields parameter 𝜃𝜃!" is exceeded then the initiation of motion of the sand particles will start (Miedema, 2008). The critical value of 𝜃𝜃 in equation (4) is multiplied by a term which includes the slope angle and an extra term which is important at high erosion velocities. This last term is a multiplication of the hydraulic gradient that is present during erosion !!
!!∙ !!!!!!!!!
with a constant. The hydraulic gradient results from the dilatant behaviour from the upper part of the soil that is subjected to the flow. The slope angle of the soil is rapidly changing during the dredging process of erosion. This problem is encountered by dividing the erosion zone into several subparts and constantly calculating the erosion and slope angle subsequently (see Figure 3). This calculation was done numerically by solving equation (5). This numerical calculation was done with the help of the Newton-Raphson method.
11 − 𝑛𝑛! − 𝑐𝑐!
𝜙𝜙!! 𝑔𝑔∆𝐷𝐷 − 𝑐𝑐!𝑤𝑤! − 𝑣𝑣! = 0 (5)
(4)
where:
= gravitational acceleration
= median particle size diameter
= bed shear stress
= Shields parameter =
= critical Shields parameter
= angle of internal friction
= slope angle
= permeability at moment of dilatation
= porosity at moment of dilatation
= constant describing single particle or
continuum mode stability
= relative sediment density =
𝜙𝜙!! = 0.00033 ∙ 𝐷𝐷∗!.! ∙𝜃𝜃 − 𝜃𝜃!"!
𝜃𝜃!"!
!.!
(3)
where: 𝐷𝐷∗ = dimensionless particle diameter 𝜃𝜃!"! = adapted critical Shields parameter This adapted critical Shields parameter 𝜃𝜃!"! is different from van Rijn in that it takes into account a hydraulic gradient and the slope angle. The adapted critical Shields parameter is:
𝜃𝜃!"! = 𝜃𝜃!"sin 𝜙𝜙 − 𝛽𝛽sin𝜙𝜙
+𝑣𝑣!𝑘𝑘!∙𝑛𝑛! − 𝑛𝑛!1 − 𝑛𝑛!
𝐴𝐴∆
(4)
where: 𝑔𝑔 = gravitational acceleration 𝐷𝐷!" = median particle size diameter 𝜏𝜏 = bed shear stress 𝜃𝜃 = Shields parameter = !
!!!!! !!!"
𝜃𝜃!" = critical Shields parameter 𝜙𝜙 = angle of internal friction 𝛽𝛽 = slope angle 𝑘𝑘! = permeability at moment of dilatation 𝑛𝑛! = porosity at moment of dilatation 𝐴𝐴 = constant describing single particle or continuum mode stability ∆ = relative sediment density = !!!!!
!!
𝜃𝜃 is the Shields parameter and is a non-dimensional number for describing the bed shear stress. If the critical Shields parameter 𝜃𝜃!" is exceeded then the initiation of motion of the sand particles will start (Miedema, 2008). The critical value of 𝜃𝜃 in equation (4) is multiplied by a term which includes the slope angle and an extra term which is important at high erosion velocities. This last term is a multiplication of the hydraulic gradient that is present during erosion !!
!!∙ !!!!!!!!!
with a constant. The hydraulic gradient results from the dilatant behaviour from the upper part of the soil that is subjected to the flow. The slope angle of the soil is rapidly changing during the dredging process of erosion. This problem is encountered by dividing the erosion zone into several subparts and constantly calculating the erosion and slope angle subsequently (see Figure 3). This calculation was done numerically by solving equation (5). This numerical calculation was done with the help of the Newton-Raphson method.
11 − 𝑛𝑛! − 𝑐𝑐!
𝜙𝜙!! 𝑔𝑔∆𝐷𝐷 − 𝑐𝑐!𝑤𝑤! − 𝑣𝑣! = 0 (5)
is the Shields parameter and is a non-
dimensional number for describing the bed
shear stress. If the critical Shields parameter
𝜙𝜙!! = 0.00033 ∙ 𝐷𝐷∗!.! ∙𝜃𝜃 − 𝜃𝜃!"!
𝜃𝜃!"!
!.!
(3)
where: 𝐷𝐷∗ = dimensionless particle diameter 𝜃𝜃!"! = adapted critical Shields parameter This adapted critical Shields parameter 𝜃𝜃!"! is different from van Rijn in that it takes into account a hydraulic gradient and the slope angle. The adapted critical Shields parameter is:
𝜃𝜃!"! = 𝜃𝜃!"sin 𝜙𝜙 − 𝛽𝛽sin𝜙𝜙
+𝑣𝑣!𝑘𝑘!∙𝑛𝑛! − 𝑛𝑛!1 − 𝑛𝑛!
𝐴𝐴∆
(4)
where: 𝑔𝑔 = gravitational acceleration 𝐷𝐷!" = median particle size diameter 𝜏𝜏 = bed shear stress 𝜃𝜃 = Shields parameter = !
!!!!! !!!"
𝜃𝜃!" = critical Shields parameter 𝜙𝜙 = angle of internal friction 𝛽𝛽 = slope angle 𝑘𝑘! = permeability at moment of dilatation 𝑛𝑛! = porosity at moment of dilatation 𝐴𝐴 = constant describing single particle or continuum mode stability ∆ = relative sediment density = !!!!!
!!
𝜃𝜃 is the Shields parameter and is a non-dimensional number for describing the bed shear stress. If the critical Shields parameter 𝜃𝜃!" is exceeded then the initiation of motion of the sand particles will start (Miedema, 2008). The critical value of 𝜃𝜃 in equation (4) is multiplied by a term which includes the slope angle and an extra term which is important at high erosion velocities. This last term is a multiplication of the hydraulic gradient that is present during erosion !!
!!∙ !!!!!!!!!
with a constant. The hydraulic gradient results from the dilatant behaviour from the upper part of the soil that is subjected to the flow. The slope angle of the soil is rapidly changing during the dredging process of erosion. This problem is encountered by dividing the erosion zone into several subparts and constantly calculating the erosion and slope angle subsequently (see Figure 3). This calculation was done numerically by solving equation (5). This numerical calculation was done with the help of the Newton-Raphson method.
11 − 𝑛𝑛! − 𝑐𝑐!
𝜙𝜙!! 𝑔𝑔∆𝐷𝐷 − 𝑐𝑐!𝑤𝑤! − 𝑣𝑣! = 0 (5)
is exceeded then the initiation of motion
of the sand particles will start (Miedema,
2008). The critical value of
𝜙𝜙!! = 0.00033 ∙ 𝐷𝐷∗!.! ∙𝜃𝜃 − 𝜃𝜃!"!
𝜃𝜃!"!
!.!
(3)
where: 𝐷𝐷∗ = dimensionless particle diameter 𝜃𝜃!"! = adapted critical Shields parameter This adapted critical Shields parameter 𝜃𝜃!"! is different from van Rijn in that it takes into account a hydraulic gradient and the slope angle. The adapted critical Shields parameter is:
𝜃𝜃!"! = 𝜃𝜃!"sin 𝜙𝜙 − 𝛽𝛽sin𝜙𝜙
+𝑣𝑣!𝑘𝑘!∙𝑛𝑛! − 𝑛𝑛!1 − 𝑛𝑛!
𝐴𝐴∆
(4)
where: 𝑔𝑔 = gravitational acceleration 𝐷𝐷!" = median particle size diameter 𝜏𝜏 = bed shear stress 𝜃𝜃 = Shields parameter = !
!!!!! !!!"
𝜃𝜃!" = critical Shields parameter 𝜙𝜙 = angle of internal friction 𝛽𝛽 = slope angle 𝑘𝑘! = permeability at moment of dilatation 𝑛𝑛! = porosity at moment of dilatation 𝐴𝐴 = constant describing single particle or continuum mode stability ∆ = relative sediment density = !!!!!
!!
𝜃𝜃 is the Shields parameter and is a non-dimensional number for describing the bed shear stress. If the critical Shields parameter 𝜃𝜃!" is exceeded then the initiation of motion of the sand particles will start (Miedema, 2008). The critical value of 𝜃𝜃 in equation (4) is multiplied by a term which includes the slope angle and an extra term which is important at high erosion velocities. This last term is a multiplication of the hydraulic gradient that is present during erosion !!
!!∙ !!!!!!!!!
with a constant. The hydraulic gradient results from the dilatant behaviour from the upper part of the soil that is subjected to the flow. The slope angle of the soil is rapidly changing during the dredging process of erosion. This problem is encountered by dividing the erosion zone into several subparts and constantly calculating the erosion and slope angle subsequently (see Figure 3). This calculation was done numerically by solving equation (5). This numerical calculation was done with the help of the Newton-Raphson method.
11 − 𝑛𝑛! − 𝑐𝑐!
𝜙𝜙!! 𝑔𝑔∆𝐷𝐷 − 𝑐𝑐!𝑤𝑤! − 𝑣𝑣! = 0 (5)
in equation (4)
is multiplied by a term which includes the
slope angle and an extra term which is
important at high erosion velocities. This last
term is a multiplication of the hydraulic gradient
that is present during erosion with
a constant.
The hydraulic gradient results from the
dilatant behaviour from the upper part of
the soil that is subjected to the flow. The
slope angle of the soil is rapidly changing
during the dredging process of erosion.
This problem is encountered by dividing the
erosion zone into several subparts and
constantly calculating the erosion and slope
angle subsequently (see Figure 3). This
calculation was done numerically by solving
𝜙𝜙!! = 0.00033 ∙ 𝐷𝐷∗!.! ∙𝜃𝜃 − 𝜃𝜃!"!
𝜃𝜃!"!
!.!
(3)
where: 𝐷𝐷∗ = dimensionless particle diameter 𝜃𝜃!"! = adapted critical Shields parameter This adapted critical Shields parameter 𝜃𝜃!"! is different from van Rijn in that it takes into account a hydraulic gradient and the slope angle. The adapted critical Shields parameter is:
𝜃𝜃!"! = 𝜃𝜃!"sin 𝜙𝜙 − 𝛽𝛽sin𝜙𝜙
+𝑣𝑣!𝑘𝑘!∙𝑛𝑛! − 𝑛𝑛!1 − 𝑛𝑛!
𝐴𝐴∆
(4)
where: 𝑔𝑔 = gravitational acceleration 𝐷𝐷!" = median particle size diameter 𝜏𝜏 = bed shear stress 𝜃𝜃 = Shields parameter = !
!!!!! !!!"
𝜃𝜃!" = critical Shields parameter 𝜙𝜙 = angle of internal friction 𝛽𝛽 = slope angle 𝑘𝑘! = permeability at moment of dilatation 𝑛𝑛! = porosity at moment of dilatation 𝐴𝐴 = constant describing single particle or continuum mode stability ∆ = relative sediment density = !!!!!
!!
𝜃𝜃 is the Shields parameter and is a non-dimensional number for describing the bed shear stress. If the critical Shields parameter 𝜃𝜃!" is exceeded then the initiation of motion of the sand particles will start (Miedema, 2008). The critical value of 𝜃𝜃 in equation (4) is multiplied by a term which includes the slope angle and an extra term which is important at high erosion velocities. This last term is a multiplication of the hydraulic gradient that is present during erosion !!
!!∙ !!!!!!!!!
with a constant. The hydraulic gradient results from the dilatant behaviour from the upper part of the soil that is subjected to the flow. The slope angle of the soil is rapidly changing during the dredging process of erosion. This problem is encountered by dividing the erosion zone into several subparts and constantly calculating the erosion and slope angle subsequently (see Figure 3). This calculation was done numerically by solving equation (5). This numerical calculation was done with the help of the Newton-Raphson method.
11 − 𝑛𝑛! − 𝑐𝑐!
𝜙𝜙!! 𝑔𝑔∆𝐷𝐷 − 𝑐𝑐!𝑤𝑤! − 𝑣𝑣! = 0 (5)
6 Terra et Aqua | Number 130 | March 2013
Suction mouth
Sand bed
Middle line of suction mouth
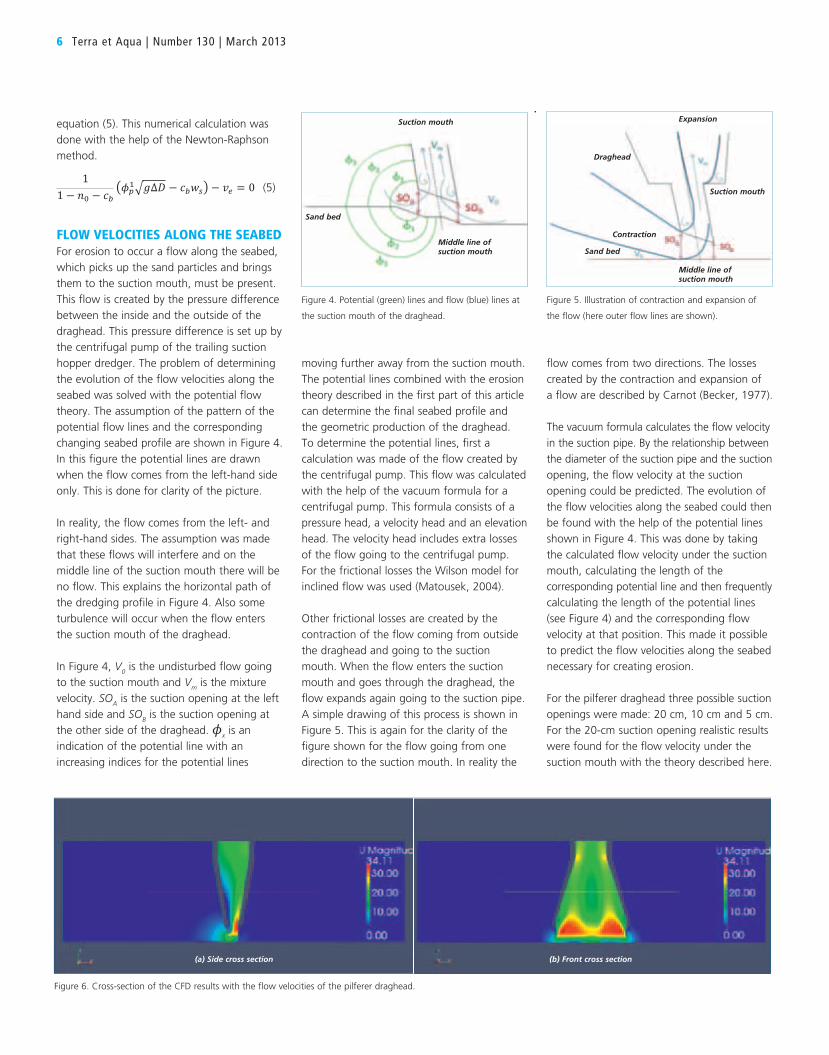
Figure 4. Potential (green) lines and flow (blue) lines at
the suction mouth of the draghead.
Expansion
Draghead
Contraction
Sand bed
Suction mouth
Middle line ofsuction mouth
Figure 5. Illustration of contraction and expansion of
the flow (here outer flow lines are shown).
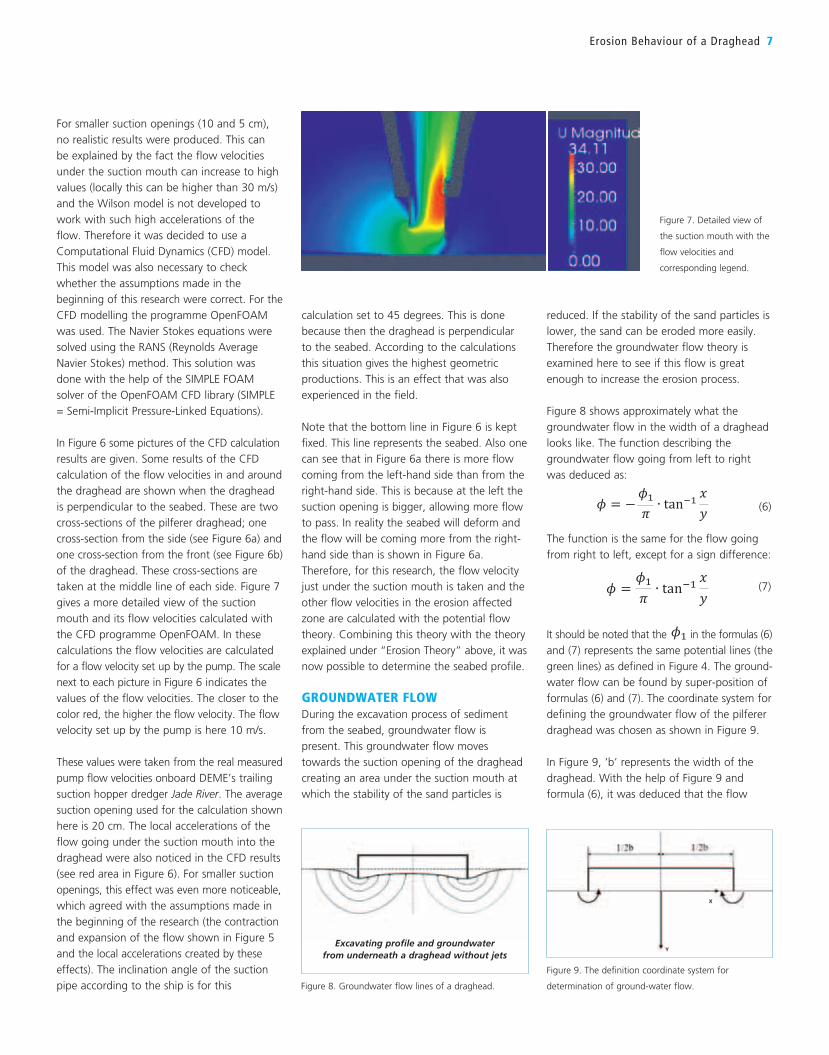
Figure 6. Cross-section of the CFD results with the flow velocities of the pilferer draghead.
(a) Side cross section (b) Front cross section
equation (5). This numerical calculation was
done with the help of the Newton-Raphson
method.
𝜙𝜙!! = 0.00033 ∙ 𝐷𝐷∗!.! ∙𝜃𝜃 − 𝜃𝜃!"!
𝜃𝜃!"!
!.!
(3)
where: 𝐷𝐷∗ = dimensionless particle diameter 𝜃𝜃!"! = adapted critical Shields parameter This adapted critical Shields parameter 𝜃𝜃!"! is different from van Rijn in that it takes into account a hydraulic gradient and the slope angle. The adapted critical Shields parameter is:
𝜃𝜃!"! = 𝜃𝜃!"sin 𝜙𝜙 − 𝛽𝛽sin𝜙𝜙
+𝑣𝑣!𝑘𝑘!∙𝑛𝑛! − 𝑛𝑛!1 − 𝑛𝑛!
𝐴𝐴∆
(4)
where: 𝑔𝑔 = gravitational acceleration 𝐷𝐷!" = median particle size diameter 𝜏𝜏 = bed shear stress 𝜃𝜃 = Shields parameter = !
!!!!! !!!"
𝜃𝜃!" = critical Shields parameter 𝜙𝜙 = angle of internal friction 𝛽𝛽 = slope angle 𝑘𝑘! = permeability at moment of dilatation 𝑛𝑛! = porosity at moment of dilatation 𝐴𝐴 = constant describing single particle or continuum mode stability ∆ = relative sediment density = !!!!!
!!
𝜃𝜃 is the Shields parameter and is a non-dimensional number for describing the bed shear stress. If the critical Shields parameter 𝜃𝜃!" is exceeded then the initiation of motion of the sand particles will start (Miedema, 2008). The critical value of 𝜃𝜃 in equation (4) is multiplied by a term which includes the slope angle and an extra term which is important at high erosion velocities. This last term is a multiplication of the hydraulic gradient that is present during erosion !!
!!∙ !!!!!!!!!
with a constant. The hydraulic gradient results from the dilatant behaviour from the upper part of the soil that is subjected to the flow. The slope angle of the soil is rapidly changing during the dredging process of erosion. This problem is encountered by dividing the erosion zone into several subparts and constantly calculating the erosion and slope angle subsequently (see Figure 3). This calculation was done numerically by solving equation (5). This numerical calculation was done with the help of the Newton-Raphson method.
11 − 𝑛𝑛! − 𝑐𝑐!
𝜙𝜙!! 𝑔𝑔∆𝐷𝐷 − 𝑐𝑐!𝑤𝑤! − 𝑣𝑣! = 0 (5)
(5)
FLoW VeLocItIes ALonG tHe seABeDFor erosion to occur a flow along the seabed,
which picks up the sand particles and brings
them to the suction mouth, must be present.
This flow is created by the pressure difference
between the inside and the outside of the
draghead. This pressure difference is set up by
the centrifugal pump of the trailing suction
hopper dredger. The problem of determining
the evolution of the flow velocities along the
seabed was solved with the potential flow
theory. The assumption of the pattern of the
potential flow lines and the corresponding
changing seabed profile are shown in Figure 4.
In this figure the potential lines are drawn
when the flow comes from the left-hand side
only. This is done for clarity of the picture.
In reality, the flow comes from the left- and
right-hand sides. The assumption was made
that these flows will interfere and on the
middle line of the suction mouth there will be
no flow. This explains the horizontal path of
the dredging profile in Figure 4. Also some
turbulence will occur when the flow enters
the suction mouth of the draghead.
In Figure 4, V0 is the undisturbed flow going
to the suction mouth and Vm is the mixture
velocity. SOA is the suction opening at the left
hand side and SOB is the suction opening at
the other side of the draghead. 𝜙𝜙 =𝜙𝜙!𝜋𝜋∙ tan!!
𝑥𝑥𝑦𝑦
(7)
It should be noted that the 𝝓𝝓𝟏𝟏 in the formulas (6) and (7) represents the same potential lines (the green lines) as defined in Figure 4. The groundwater flow can be found by superposition of formulas (6) and (7). The coordinate system for defining the groundwater flow of the pilferer draghead was chosen as follows:
𝜙𝜙 = −𝜙𝜙!𝜋𝜋∙ tan!!
𝑥𝑥 − 0.5𝑏𝑏𝑦𝑦
(8)
where: b = width of the suction mouth of the draghead.
𝜙𝜙 =𝜙𝜙!𝜋𝜋∙ tan!!
𝑥𝑥 + 0.5𝑏𝑏𝑦𝑦
(9)
𝜙𝜙 = −𝜙𝜙!𝜋𝜋∙ tan!!
𝑥𝑥 − 0.5𝑏𝑏𝑦𝑦
+𝜙𝜙!𝜋𝜋∙ tan!!
𝑥𝑥 + 0.5𝑏𝑏𝑦𝑦
(10)
x is an
indication of the potential line with an
increasing indices for the potential lines
moving further away from the suction mouth.
The potential lines combined with the erosion
theory described in the first part of this article
can determine the final seabed profile and
the geometric production of the draghead.
To determine the potential lines, first a
calculation was made of the flow created by
the centrifugal pump. This flow was calculated
with the help of the vacuum formula for a
centrifugal pump. This formula consists of a
pressure head, a velocity head and an elevation
head. The velocity head includes extra losses
of the flow going to the centrifugal pump.
For the frictional losses the Wilson model for
inclined flow was used (Matousek, 2004).
Other frictional losses are created by the
contraction of the flow coming from outside
the draghead and going to the suction
mouth. When the flow enters the suction
mouth and goes through the draghead, the
flow expands again going to the suction pipe.
A simple drawing of this process is shown in
Figure 5. This is again for the clarity of the
figure shown for the flow going from one
direction to the suction mouth. In reality the
flow comes from two directions. The losses
created by the contraction and expansion of
a flow are described by Carnot (Becker, 1977).
The vacuum formula calculates the flow velocity
in the suction pipe. By the relationship between
the diameter of the suction pipe and the suction
opening, the flow velocity at the suction
opening could be predicted. The evolution of
the flow velocities along the seabed could then
be found with the help of the potential lines
shown in Figure 4. This was done by taking
the calculated flow velocity under the suction
mouth, calculating the length of the
corresponding potential line and then frequently
calculating the length of the potential lines
(see Figure 4) and the corresponding flow
velocity at that position. This made it possible
to predict the flow velocities along the seabed
necessary for creating erosion.
For the pilferer draghead three possible suction
openings were made: 20 cm, 10 cm and 5 cm.
For the 20-cm suction opening realistic results
were found for the flow velocity under the
suction mouth with the theory described here.
Erosion Behaviour of a Draghead 7
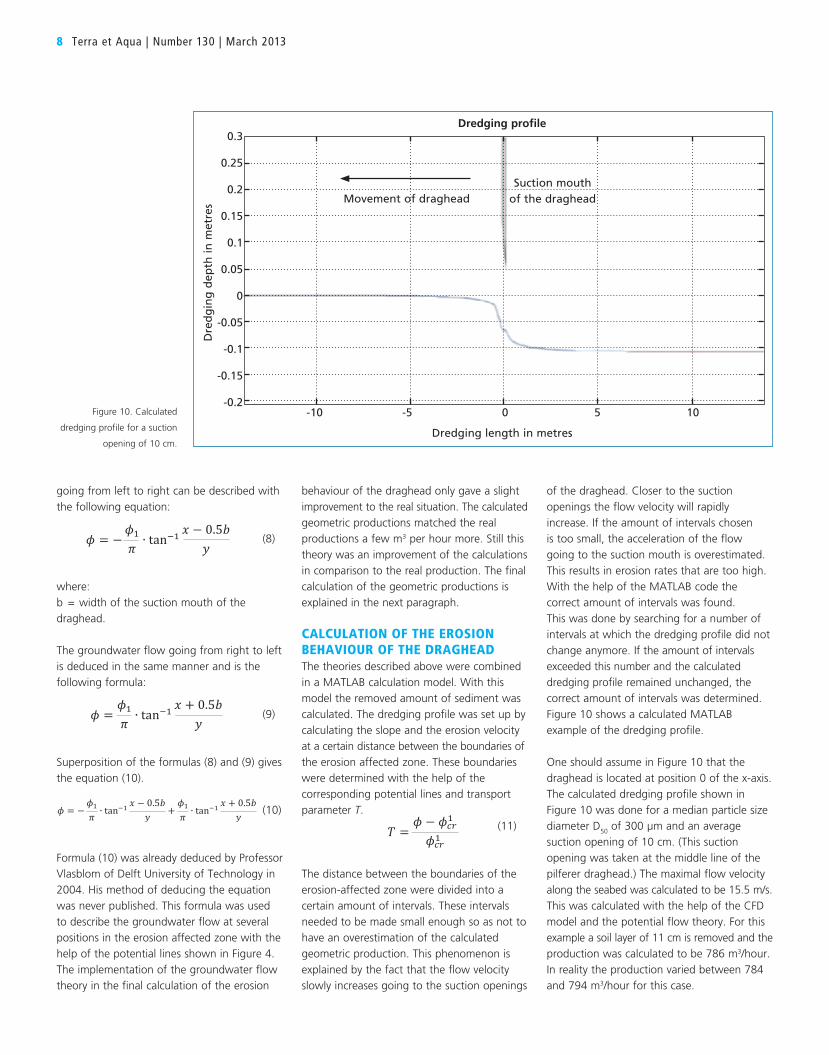
Figure 7. Detailed view of
the suction mouth with the
flow velocities and
corresponding legend.
X
YExcavating profile and groundwater
from underneath a draghead without jets
Figure 8. Groundwater flow lines of a draghead.
Figure 9. The definition coordinate system for
determination of ground-water flow.
For smaller suction openings (10 and 5 cm),
no realistic results were produced. This can
be explained by the fact the flow velocities
under the suction mouth can increase to high
values (locally this can be higher than 30 m/s)
and the Wilson model is not developed to
work with such high accelerations of the
flow. Therefore it was decided to use a
Computational Fluid Dynamics (CFD) model.
This model was also necessary to check
whether the assumptions made in the
beginning of this research were correct. For the
CFD modelling the programme OpenFOAM
was used. The Navier Stokes equations were
solved using the RANS (Reynolds Average
Navier Stokes) method. This solution was
done with the help of the SIMPLE FOAM
solver of the OpenFOAM CFD library (SIMPLE
= Semi-Implicit Pressure-Linked Equations).
In Figure 6 some pictures of the CFD calculation
results are given. Some results of the CFD
calculation of the flow velocities in and around
the draghead are shown when the draghead
is perpendicular to the seabed. These are two
cross-sections of the pilferer draghead; one
cross-section from the side (see Figure 6a) and
one cross-section from the front (see Figure 6b)
of the draghead. These cross-sections are
taken at the middle line of each side. Figure 7
gives a more detailed view of the suction
mouth and its flow velocities calculated with
the CFD programme OpenFOAM. In these
calculations the flow velocities are calculated
for a flow velocity set up by the pump. The scale
next to each picture in Figure 6 indicates the
values of the flow velocities. The closer to the
color red, the higher the flow velocity. The flow
velocity set up by the pump is here 10 m/s.
These values were taken from the real measured
pump flow velocities onboard DEME’s trailing
suction hopper dredger Jade River. The average
suction opening used for the calculation shown
here is 20 cm. The local accelerations of the
flow going under the suction mouth into the
draghead were also noticed in the CFD results
(see red area in Figure 6). For smaller suction
openings, this effect was even more noticeable,
which agreed with the assumptions made in
the beginning of the research (the contraction
and expansion of the flow shown in Figure 5
and the local accelerations created by these
effects). The inclination angle of the suction
pipe according to the ship is for this
calculation set to 45 degrees. This is done
because then the draghead is perpendicular
to the seabed. According to the calculations
this situation gives the highest geometric
productions. This is an effect that was also
experienced in the field.
Note that the bottom line in Figure 6 is kept
fixed. This line represents the seabed. Also one
can see that in Figure 6a there is more flow
coming from the left-hand side than from the
right-hand side. This is because at the left the
suction opening is bigger, allowing more flow
to pass. In reality the seabed will deform and
the flow will be coming more from the right-
hand side than is shown in Figure 6a.
Therefore, for this research, the flow velocity
just under the suction mouth is taken and the
other flow velocities in the erosion affected
zone are calculated with the potential flow
theory. Combining this theory with the theory
explained under “Erosion Theory” above, it was
now possible to determine the seabed profile.
GRoUnDWAteR FLoWDuring the excavation process of sediment
from the seabed, groundwater flow is
present. This groundwater flow moves
towards the suction opening of the draghead
creating an area under the suction mouth at
which the stability of the sand particles is
reduced. If the stability of the sand particles is
lower, the sand can be eroded more easily.
Therefore the groundwater flow theory is
examined here to see if this flow is great
enough to increase the erosion process.
Figure 8 shows approximately what the
groundwater flow in the width of a draghead
looks like. The function describing the
groundwater flow going from left to right
was deduced as:
𝜙𝜙 = −𝜙𝜙!𝜋𝜋∙ tan!!
𝑥𝑥𝑦𝑦
(6)
(6)
The function is the same for the flow going
from right to left, except for a sign difference:
𝜙𝜙 =𝜙𝜙!𝜋𝜋∙ tan!!
𝑥𝑥𝑦𝑦
(7)
It should be noted that the 𝝓𝝓𝟏𝟏 in the formulas (6) and (7) represents the same potential lines (the green lines) as defined in Figure 4. The groundwater flow can be found by superposition of formulas (6) and (7). The coordinate system for defining the groundwater flow of the pilferer draghead was chosen as follows:
𝜙𝜙 = −𝜙𝜙!𝜋𝜋∙ tan!!
𝑥𝑥 − 0.5𝑏𝑏𝑦𝑦
(8)
where: b = width of the suction mouth of the draghead.
𝜙𝜙 =𝜙𝜙!𝜋𝜋∙ tan!!
𝑥𝑥 + 0.5𝑏𝑏𝑦𝑦
(9)
𝜙𝜙 = −𝜙𝜙!𝜋𝜋∙ tan!!
𝑥𝑥 − 0.5𝑏𝑏𝑦𝑦
+𝜙𝜙!𝜋𝜋∙ tan!!
𝑥𝑥 + 0.5𝑏𝑏𝑦𝑦
(10)
(7)
It should be noted that the 𝜙𝜙 =𝜙𝜙!𝜋𝜋∙ tan!!
𝑥𝑥𝑦𝑦
(7)
It should be noted that the 𝝓𝝓𝟏𝟏 in the formulas (6) and (7) represents the same potential lines (the green lines) as defined in Figure 4. The groundwater flow can be found by superposition of formulas (6) and (7). The coordinate system for defining the groundwater flow of the pilferer draghead was chosen as follows:
𝜙𝜙 = −𝜙𝜙!𝜋𝜋∙ tan!!
𝑥𝑥 − 0.5𝑏𝑏𝑦𝑦
(8)
where: b = width of the suction mouth of the draghead.
𝜙𝜙 =𝜙𝜙!𝜋𝜋∙ tan!!
𝑥𝑥 + 0.5𝑏𝑏𝑦𝑦
(9)
𝜙𝜙 = −𝜙𝜙!𝜋𝜋∙ tan!!
𝑥𝑥 − 0.5𝑏𝑏𝑦𝑦
+𝜙𝜙!𝜋𝜋∙ tan!!
𝑥𝑥 + 0.5𝑏𝑏𝑦𝑦
(10)
in the formulas (6)
and (7) represents the same potential lines (the
green lines) as defined in Figure 4. The ground-
water flow can be found by super-position of
formulas (6) and (7). The coordinate system for
defining the groundwater flow of the pilferer
draghead was chosen as shown in Figure 9.
In Figure 9, ‘b’ represents the width of the
draghead. With the help of Figure 9 and
formula (6), it was deduced that the flow
8 Terra et Aqua | Number 130 | March 2013
of the draghead. Closer to the suction
openings the flow velocity will rapidly
increase. If the amount of intervals chosen
is too small, the acceleration of the flow
going to the suction mouth is overestimated.
This results in erosion rates that are too high.
With the help of the MATLAB code the
correct amount of intervals was found.
This was done by searching for a number of
intervals at which the dredging profile did not
change anymore. If the amount of intervals
exceeded this number and the calculated
dredging profile remained unchanged, the
correct amount of intervals was determined.
Figure 10 shows a calculated MATLAB
example of the dredging profile.
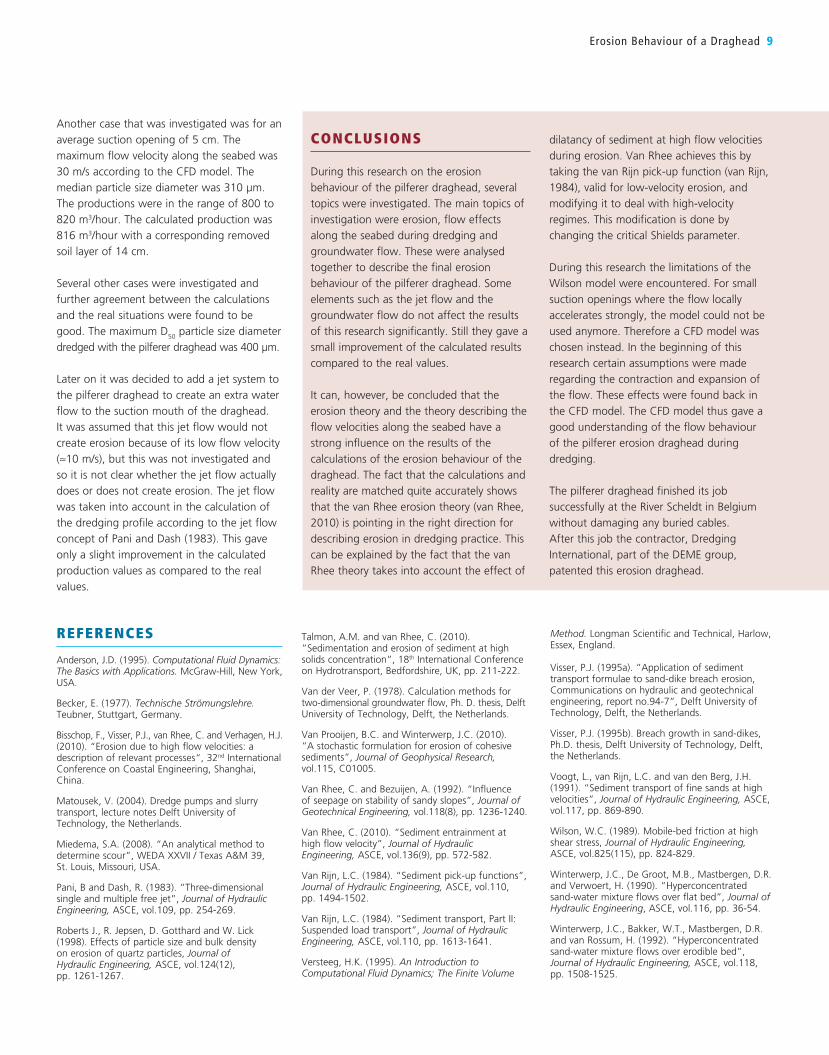
One should assume in Figure 10 that the
draghead is located at position 0 of the x-axis.
The calculated dredging profile shown in
Figure 10 was done for a median particle size
diameter D50
of 300 μm and an average
suction opening of 10 cm. (This suction
opening was taken at the middle line of the
pilferer draghead.) The maximal flow velocity
along the seabed was calculated to be 15.5 m/s.
This was calculated with the help of the CFD
model and the potential flow theory. For this
example a soil layer of 11 cm is removed and the
production was calculated to be 786 m3/hour.
In reality the production varied between 784
and 794 m3/hour for this case.
behaviour of the draghead only gave a slight
improvement to the real situation. The calculated
geometric productions matched the real
productions a few m3 per hour more. Still this
theory was an improvement of the calculations
in comparison to the real production. The final
calculation of the geometric productions is
explained in the next paragraph.
cALcULAtIon oF tHe eRosIon BeHAVIoUR oF tHe DRAGHeADThe theories described above were combined
in a MATLAB calculation model. With this
model the removed amount of sediment was
calculated. The dredging profile was set up by
calculating the slope and the erosion velocity
at a certain distance between the boundaries of
the erosion affected zone. These boundaries
were determined with the help of the
corresponding potential lines and transport
parameter T.
𝑇𝑇 =𝜙𝜙 − 𝜙𝜙!"!
𝜙𝜙!"!
(11) (11)
The distance between the boundaries of the
erosion-affected zone were divided into a
certain amount of intervals. These intervals
needed to be made small enough so as not to
have an overestimation of the calculated
geometric production. This phenomenon is
explained by the fact that the flow velocity
slowly increases going to the suction openings
going from left to right can be described with
the following equation:
𝜙𝜙 =𝜙𝜙!𝜋𝜋∙ tan!!
𝑥𝑥𝑦𝑦
(7)
It should be noted that the 𝝓𝝓𝟏𝟏 in the formulas (6) and (7) represents the same potential lines (the green lines) as defined in Figure 4. The groundwater flow can be found by superposition of formulas (6) and (7). The coordinate system for defining the groundwater flow of the pilferer draghead was chosen as follows:
𝜙𝜙 = −𝜙𝜙!𝜋𝜋∙ tan!!
𝑥𝑥 − 0.5𝑏𝑏𝑦𝑦
(8)
where: b = width of the suction mouth of the draghead.
𝜙𝜙 =𝜙𝜙!𝜋𝜋∙ tan!!
𝑥𝑥 + 0.5𝑏𝑏𝑦𝑦
(9)
𝜙𝜙 = −𝜙𝜙!𝜋𝜋∙ tan!!
𝑥𝑥 − 0.5𝑏𝑏𝑦𝑦
+𝜙𝜙!𝜋𝜋∙ tan!!
𝑥𝑥 + 0.5𝑏𝑏𝑦𝑦
(10)
(8)
where:
b = width of the suction mouth of the
draghead.
The groundwater flow going from right to left
is deduced in the same manner and is the
following formula:
𝜙𝜙 =𝜙𝜙!𝜋𝜋∙ tan!!
𝑥𝑥𝑦𝑦
(7)
It should be noted that the 𝝓𝝓𝟏𝟏 in the formulas (6) and (7) represents the same potential lines (the green lines) as defined in Figure 4. The groundwater flow can be found by superposition of formulas (6) and (7). The coordinate system for defining the groundwater flow of the pilferer draghead was chosen as follows:
𝜙𝜙 = −𝜙𝜙!𝜋𝜋∙ tan!!
𝑥𝑥 − 0.5𝑏𝑏𝑦𝑦
(8)
where: b = width of the suction mouth of the draghead.
𝜙𝜙 =𝜙𝜙!𝜋𝜋∙ tan!!
𝑥𝑥 + 0.5𝑏𝑏𝑦𝑦
(9)
𝜙𝜙 = −𝜙𝜙!𝜋𝜋∙ tan!!
𝑥𝑥 − 0.5𝑏𝑏𝑦𝑦
+𝜙𝜙!𝜋𝜋∙ tan!!
𝑥𝑥 + 0.5𝑏𝑏𝑦𝑦
(10)
(9)
Superposition of the formulas (8) and (9) gives
the equation (10).
𝜙𝜙 =𝜙𝜙!𝜋𝜋∙ tan!!
𝑥𝑥𝑦𝑦
(7)
It should be noted that the 𝝓𝝓𝟏𝟏 in the formulas (6) and (7) represents the same potential lines (the green lines) as defined in Figure 4. The groundwater flow can be found by superposition of formulas (6) and (7). The coordinate system for defining the groundwater flow of the pilferer draghead was chosen as follows:
𝜙𝜙 = −𝜙𝜙!𝜋𝜋∙ tan!!
𝑥𝑥 − 0.5𝑏𝑏𝑦𝑦
(8)
where: b = width of the suction mouth of the draghead.
𝜙𝜙 =𝜙𝜙!𝜋𝜋∙ tan!!
𝑥𝑥 + 0.5𝑏𝑏𝑦𝑦
(9)
𝜙𝜙 = −𝜙𝜙!𝜋𝜋∙ tan!!
𝑥𝑥 − 0.5𝑏𝑏𝑦𝑦
+𝜙𝜙!𝜋𝜋∙ tan!!
𝑥𝑥 + 0.5𝑏𝑏𝑦𝑦
(10) (10)
Formula (10) was already deduced by Professor
Vlasblom of Delft University of Technology in
2004. His method of deducing the equation
was never published. This formula was used
to describe the groundwater flow at several
positions in the erosion affected zone with the
help of the potential lines shown in Figure 4.
The implementation of the groundwater flow
theory in the final calculation of the erosion
Figure 10. Calculated
dredging profile for a suction
opening of 10 cm.
0.3
0.25
0.2
0.15
0.1
0.05
0
-0.05
-0.1
-0.15
-0.2-10 -5 0 5 10
Dredging length in metres
Dre
dg
ing
dep
th i
n m
etre
s
Dredging profile
Suction mouth of the dragheadMovement of draghead
Erosion Behaviour of a Draghead 9
Another case that was investigated was for an
average suction opening of 5 cm. The
maximum flow velocity along the seabed was
30 m/s according to the CFD model. The
median particle size diameter was 310 μm.
The productions were in the range of 800 to
820 m3/hour. The calculated production was
816 m3/hour with a corresponding removed
soil layer of 14 cm.
Several other cases were investigated and
further agreement between the calculations
and the real situations were found to be
good. The maximum D50
particle size diameter
dredged with the pilferer draghead was 400 μm.
Later on it was decided to add a jet system to
the pilferer draghead to create an extra water
flow to the suction mouth of the draghead.
It was assumed that this jet flow would not
create erosion because of its low flow velocity
(≈10 m/s), but this was not investigated and
so it is not clear whether the jet flow actually
does or does not create erosion. The jet flow
was taken into account in the calculation of
the dredging profile according to the jet flow
concept of Pani and Dash (1983). This gave
only a slight improvement in the calculated
production values as compared to the real
values.
REFERENCES
Anderson, J.D. (1995). Computational Fluid Dynamics: The Basics with Applications. McGraw-Hill, New York, USA.
Becker, E. (1977). Technische Strömungslehre. Teubner, Stuttgart, Germany.
Bisschop, F., Visser, P.J., van Rhee, C. and Verhagen, H.J. (2010). “Erosion due to high flow velocities: a description of relevant processes“, 32nd International Conference on Coastal Engineering, Shanghai, China.
Matousek, V. (2004). Dredge pumps and slurry transport, lecture notes Delft University of Technology, the Netherlands.
Miedema, S.A. (2008). “An analytical method to determine scour”, WEDA XXVII / Texas A&M 39, St. Louis, Missouri, USA.
Pani, B and Dash, R. (1983). “Three-dimensional single and multiple free jet”, Journal of Hydraulic Engineering, ASCE, vol.109, pp. 254-269.
Roberts J., R. Jepsen, D. Gotthard and W. Lick (1998). Effects of particle size and bulk density on erosion of quartz particles, Journal of Hydraulic Engineering, ASCE, vol.124(12), pp. 1261-1267.
CONCLUSIONS
During this research on the erosion
behaviour of the pilferer draghead, several
topics were investigated. The main topics of
investigation were erosion, flow effects
along the seabed during dredging and
groundwater flow. These were analysed
together to describe the final erosion
behaviour of the pilferer draghead. Some
elements such as the jet flow and the
groundwater flow do not affect the results
of this research significantly. Still they gave a
small improvement of the calculated results
compared to the real values.
It can, however, be concluded that the
erosion theory and the theory describing the
flow velocities along the seabed have a
strong influence on the results of the
calculations of the erosion behaviour of the
draghead. The fact that the calculations and
reality are matched quite accurately shows
that the van Rhee erosion theory (van Rhee,
2010) is pointing in the right direction for
describing erosion in dredging practice. This
can be explained by the fact that the van
Rhee theory takes into account the effect of
dilatancy of sediment at high flow velocities
during erosion. Van Rhee achieves this by taking the van Rijn pick-up function (van Rijn,
1984), valid for low-velocity erosion, and
modifying it to deal with high-velocity
regimes. This modification is done by
changing the critical Shields parameter.
During this research the limitations of the
Wilson model were encountered. For small
suction openings where the flow locally
accelerates strongly, the model could not be
used anymore. Therefore a CFD model was
chosen instead. In the beginning of this
research certain assumptions were made
regarding the contraction and expansion of
the flow. These effects were found back in
the CFD model. The CFD model thus gave a
good understanding of the flow behaviour
of the pilferer erosion draghead during
dredging.
The pilferer draghead finished its job
successfully at the River Scheldt in Belgium
without damaging any buried cables.
After this job the contractor, Dredging
International, part of the DEME group,
patented this erosion draghead.
Talmon, A.M. and van Rhee, C. (2010). ”Sedimentation and erosion of sediment at high solids concentration”, 18th International Conference on Hydrotransport, Bedfordshire, UK, pp. 211-222.
Van der Veer, P. (1978). Calculation methods for two-dimensional groundwater flow, Ph. D. thesis, Delft University of Technology, Delft, the Netherlands.
Van Prooijen, B.C. and Winterwerp, J.C. (2010). “A stochastic formulation for erosion of cohesive sediments”, Journal of Geophysical Research, vol.115, C01005.
Van Rhee, C. and Bezuijen, A. (1992). “Influence of seepage on stability of sandy slopes”, Journal of Geotechnical Engineering, vol.118(8), pp. 1236-1240.
Van Rhee, C. (2010). “Sediment entrainment at high flow velocity”, Journal of Hydraulic Engineering, ASCE, vol.136(9), pp. 572-582.
Van Rijn, L.C. (1984). “Sediment pick-up functions”, Journal of Hydraulic Engineering, ASCE, vol.110, pp. 1494-1502.
Van Rijn, L.C. (1984). “Sediment transport, Part II: Suspended load transport”, Journal of Hydraulic Engineering, ASCE, vol.110, pp. 1613-1641.
Versteeg, H.K. (1995). An Introduction to Computational Fluid Dynamics; The Finite Volume
Method. Longman Scientific and Technical, Harlow, Essex, England.
Visser, P.J. (1995a). “Application of sediment transport formulae to sand-dike breach erosion, Communications on hydraulic and geotechnical engineering, report no.94-7”, Delft University of Technology, Delft, the Netherlands.
Visser, P.J. (1995b). Breach growth in sand-dikes, Ph.D. thesis, Delft University of Technology, Delft, the Netherlands.
Voogt, L., van Rijn, L.C. and van den Berg, J.H. (1991). “Sediment transport of fine sands at high velocities”, Journal of Hydraulic Engineering, ASCE, vol.117, pp. 869-890.
Wilson, W.C. (1989). Mobile-bed friction at high shear stress, Journal of Hydraulic Engineering, ASCE, vol.825(115), pp. 824-829. Winterwerp, J.C., De Groot, M.B., Mastbergen, D.R. and Verwoert, H. (1990). “Hyperconcentrated sand-water mixture flows over flat bed”, Journal of Hydraulic Engineering, ASCE, vol.116, pp. 36-54. Winterwerp, J.C., Bakker, W.T., Mastbergen, D.R. and van Rossum, H. (1992). “Hyperconcentrated sand-water mixture flows over erodible bed”, Journal of Hydraulic Engineering, ASCE, vol.118, pp. 1508-1525.
ABSTRACT
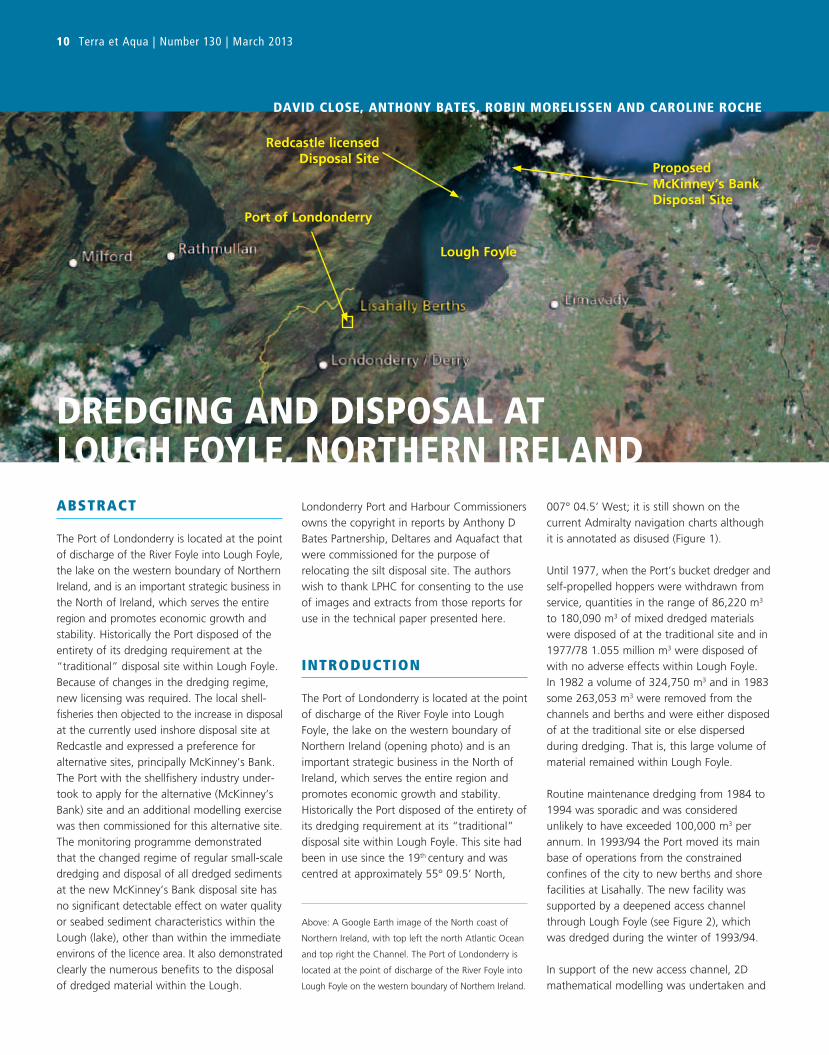
The Port of Londonderry is located at the point
of discharge of the River Foyle into Lough Foyle,
the lake on the western boundary of Northern
Ireland, and is an important strategic business in
the North of Ireland, which serves the entire
region and promotes economic growth and
stability. Historically the Port disposed of the
entirety of its dredging requirement at the
“traditional” disposal site within Lough Foyle.
Because of changes in the dredging regime,
new licensing was required. The local shell-
fisheries then objected to the increase in disposal
at the currently used inshore disposal site at
Redcastle and expressed a preference for
alternative sites, principally McKinney’s Bank.
The Port with the shellfishery industry under-
took to apply for the alternative (McKinney’s
Bank) site and an additional modelling exercise
was then commissioned for this alternative site.
The monitoring programme demonstrated
that the changed regime of regular small-scale
dredging and disposal of all dredged sediments
at the new McKinney’s Bank disposal site has
no significant detectable effect on water quality
or seabed sediment characteristics within the
Lough (lake), other than within the immediate
environs of the licence area. It also demonstrated
clearly the numerous benefits to the disposal
of dredged material within the Lough.
Londonderry Port and Harbour Commissioners
owns the copyright in reports by Anthony D
Bates Partnership, Deltares and Aquafact that
were commissioned for the purpose of
relocating the silt disposal site. The authors
wish to thank LPHC for consenting to the use
of images and extracts from those reports for
use in the technical paper presented here.
INTRODUCTION
The Port of Londonderry is located at the point
of discharge of the River Foyle into Lough
Foyle, the lake on the western boundary of
Northern Ireland (opening photo) and is an
important strategic business in the North of
Ireland, which serves the entire region and
promotes economic growth and stability.
Historically the Port disposed of the entirety of
its dredging requirement at its “traditional”
disposal site within Lough Foyle. This site had
been in use since the 19th century and was
centred at approximately 55° 09.5’ North,
007° 04.5’ West; it is still shown on the
current Admiralty navigation charts although
it is annotated as disused (Figure 1).
Until 1977, when the Port’s bucket dredger and
self-propelled hoppers were withdrawn from
service, quantities in the range of 86,220 m3
to 180,090 m3 of mixed dredged materials
were disposed of at the traditional site and in
1977/78 1.055 million m3 were disposed of
with no adverse effects within Lough Foyle.
In 1982 a volume of 324,750 m3 and in 1983
some 263,053 m3 were removed from the
channels and berths and were either disposed
of at the traditional site or else dispersed
during dredging. That is, this large volume of
material remained within Lough Foyle.
Routine maintenance dredging from 1984 to
1994 was sporadic and was considered
unlikely to have exceeded 100,000 m3 per
annum. In 1993/94 the Port moved its main
base of operations from the constrained
confines of the city to new berths and shore
facilities at Lisahally. The new facility was
supported by a deepened access channel
through Lough Foyle (see Figure 2), which
was dredged during the winter of 1993/94.
In support of the new access channel, 2D
mathematical modelling was undertaken and
DReDGInG AnD DIsPosAL At LoUGH FoYLe, noRtHeRn IReLAnD
Above: A Google Earth image of the North coast of
Northern Ireland, with top left the north Atlantic Ocean
and top right the Channel. The Port of Londonderry is
located at the point of discharge of the River Foyle into
Lough Foyle on the western boundary of Northern Ireland.
10 Terra et Aqua | Number 130 | March 2013
DAVID cLose, AntHonY BAtes, RoBIn MoReLIssen AnD cARoLIne RocHe
Proposed McKinney’s BankDisposal Site
Lough Foyle
Port of Londonderry
Redcastle licensedDisposal Site
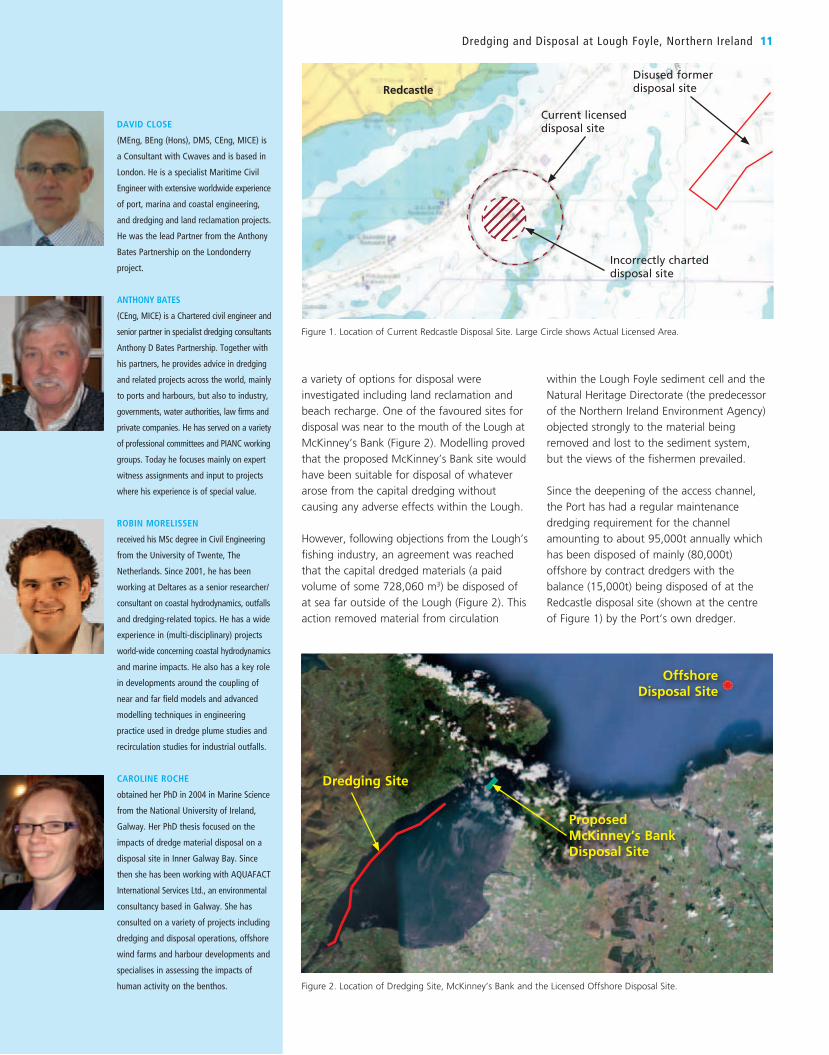
a variety of options for disposal were
investigated including land reclamation and
beach recharge. One of the favoured sites for
disposal was near to the mouth of the Lough at
McKinney’s Bank (Figure 2). Modelling proved
that the proposed McKinney’s Bank site would
have been suitable for disposal of whatever
arose from the capital dredging without
causing any adverse effects within the Lough.
However, following objections from the Lough’s
fishing industry, an agreement was reached
that the capital dredged materials (a paid
volume of some 728,060 m3) be disposed of
at sea far outside of the Lough (Figure 2). This
action removed material from circulation
within the Lough Foyle sediment cell and the
Natural Heritage Directorate (the predecessor
of the Northern Ireland Environment Agency)
objected strongly to the material being
removed and lost to the sediment system,
but the views of the fishermen prevailed.
Since the deepening of the access channel,
the Port has had a regular maintenance
dredging requirement for the channel
amounting to about 95,000t annually which
has been disposed of mainly (80,000t)
offshore by contract dredgers with the
balance (15,000t) being disposed of at the
Redcastle disposal site (shown at the centre
of Figure 1) by the Port’s own dredger.
DAVID CLOSE
(MEng, BEng (Hons), DMS, CEng, MICE) is
a Consultant with Cwaves and is based in
London. He is a specialist Maritime Civil
Engineer with extensive worldwide experience
of port, marina and coastal engineering,
and dredging and land reclamation projects.
He was the lead Partner from the Anthony
Bates Partnership on the Londonderry
project.
ANTHONY BATES
(CEng, MICE) is a Chartered civil engineer and
senior partner in specialist dredging consultants
Anthony D Bates Partnership. Together with
his partners, he provides advice in dredging
and related projects across the world, mainly
to ports and harbours, but also to industry,
governments, water authorities, law firms and
private companies. He has served on a variety
of professional committees and PIANC working
groups. Today he focuses mainly on expert
witness assignments and input to projects
where his experience is of special value.
ROBIN MORELISSEN
received his MSc degree in Civil Engineering
from the University of Twente, The
Netherlands. Since 2001, he has been
working at Deltares as a senior researcher/
consultant on coastal hydrodynamics, outfalls
and dredging-related topics. He has a wide
experience in (multi-disciplinary) projects
world-wide concerning coastal hydrodynamics
and marine impacts. He also has a key role
in developments around the coupling of
near and far field models and advanced
modelling techniques in engineering
practice used in dredge plume studies and
recirculation studies for industrial outfalls.
CAROLINE ROCHE
obtained her PhD in 2004 in Marine Science
from the National University of Ireland,
Galway. Her PhD thesis focused on the
impacts of dredge material disposal on a
disposal site in Inner Galway Bay. Since
then she has been working with AQUAFACT
International Services Ltd., an environmental
consultancy based in Galway. She has
consulted on a variety of projects including
dredging and disposal operations, offshore
wind farms and harbour developments and
specialises in assessing the impacts of
human activity on the benthos.
Dredging and Disposal at Lough Foyle, Northern Ireland 11
Redcastle
Figure 1. Location of Current Redcastle Disposal Site. Large Circle shows Actual Licensed Area.
Figure 2. Location of Dredging Site, McKinney’s Bank and the Licensed Offshore Disposal Site.
Proposed McKinney’s BankDisposal Site
OffshoreDisposal Site
Dredging Site
Disused former disposal site
Current licenseddisposal site
Incorrectly charted disposal site
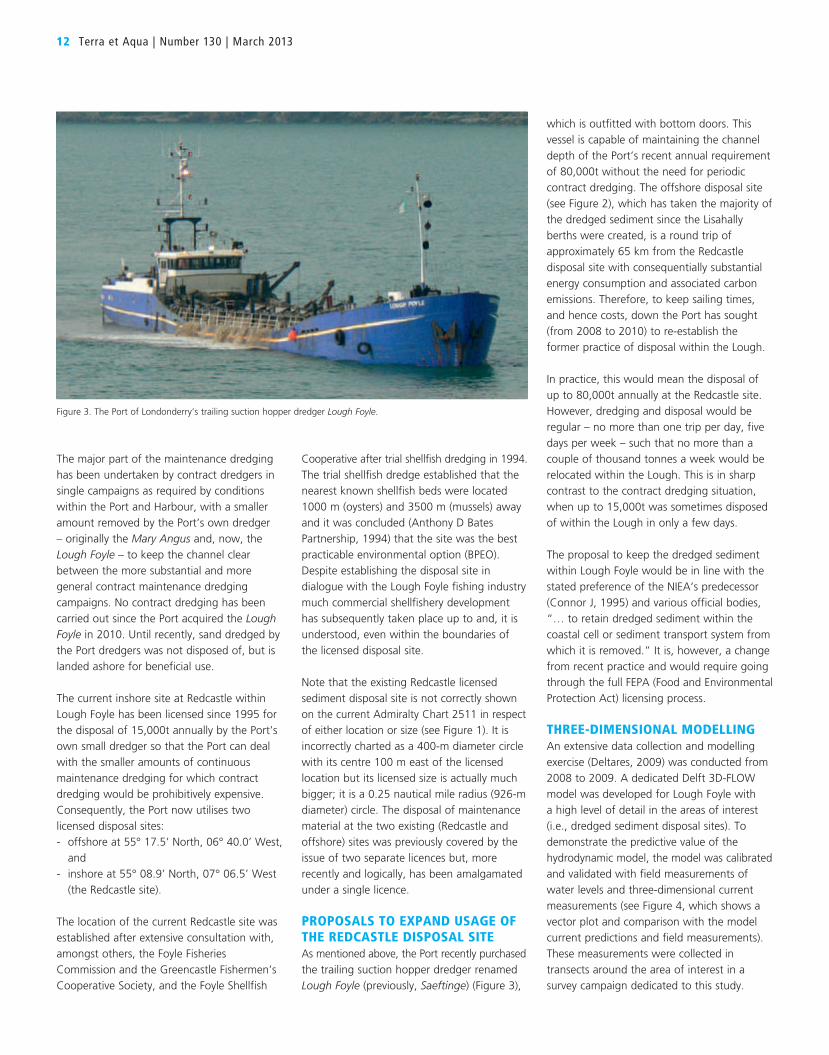
12 Terra et Aqua | Number 130 | March 2013
The major part of the maintenance dredging
has been undertaken by contract dredgers in
single campaigns as required by conditions
within the Port and Harbour, with a smaller
amount removed by the Port’s own dredger
– originally the Mary Angus and, now, the
Lough Foyle – to keep the channel clear
between the more substantial and more
general contract maintenance dredging
campaigns. No contract dredging has been
carried out since the Port acquired the Lough Foyle in 2010. Until recently, sand dredged by
the Port dredgers was not disposed of, but is
landed ashore for beneficial use.
The current inshore site at Redcastle within
Lough Foyle has been licensed since 1995 for
the disposal of 15,000t annually by the Port’s
own small dredger so that the Port can deal
with the smaller amounts of continuous
maintenance dredging for which contract
dredging would be prohibitively expensive.
Consequently, the Port now utilises two
licensed disposal sites:
- offshore at 55° 17.5’ North, 06° 40.0’ West,
and
- inshore at 55° 08.9’ North, 07° 06.5’ West
(the Redcastle site).
The location of the current Redcastle site was
established after extensive consultation with,
amongst others, the Foyle Fisheries
Commission and the Greencastle Fishermen’s
Cooperative Society, and the Foyle Shellfish
Cooperative after trial shellfish dredging in 1994.
The trial shellfish dredge established that the
nearest known shellfish beds were located
1000 m (oysters) and 3500 m (mussels) away
and it was concluded (Anthony D Bates
Partnership, 1994) that the site was the best
practicable environmental option (BPEO).
Despite establishing the disposal site in
dialogue with the Lough Foyle fishing industry
much commercial shellfishery development
has subsequently taken place up to and, it is
understood, even within the boundaries of
the licensed disposal site.
Note that the existing Redcastle licensed
sediment disposal site is not correctly shown on the current Admiralty Chart 2511 in respect
of either location or size (see Figure 1). It is
incorrectly charted as a 400-m diameter circle
with its centre 100 m east of the licensed
location but its licensed size is actually much
bigger; it is a 0.25 nautical mile radius (926-m
diameter) circle. The disposal of maintenance
material at the two existing (Redcastle and
offshore) sites was previously covered by the
issue of two separate licences but, more
recently and logically, has been amalgamated
under a single licence.
PRoPosALs to eXPAnD UsAGe oF tHe ReDcAstLe DIsPosAL sIteAs mentioned above, the Port recently purchased
the trailing suction hopper dredger renamed
Lough Foyle (previously, Saeftinge) (Figure 3),
which is outfitted with bottom doors. This
vessel is capable of maintaining the channel
depth of the Port’s recent annual requirement
of 80,000t without the need for periodic
contract dredging. The offshore disposal site
(see Figure 2), which has taken the majority of
the dredged sediment since the Lisahally
berths were created, is a round trip of
approximately 65 km from the Redcastle
disposal site with consequentially substantial
energy consumption and associated carbon
emissions. Therefore, to keep sailing times,
and hence costs, down the Port has sought
(from 2008 to 2010) to re-establish the
former practice of disposal within the Lough.
In practice, this would mean the disposal of
up to 80,000t annually at the Redcastle site.
However, dredging and disposal would be
regular – no more than one trip per day, five
days per week – such that no more than a
couple of thousand tonnes a week would be
relocated within the Lough. This is in sharp
contrast to the contract dredging situation,
when up to 15,000t was sometimes disposed
of within the Lough in only a few days.
The proposal to keep the dredged sediment
within Lough Foyle would be in line with the
stated preference of the NIEA’s predecessor
(Connor J, 1995) and various official bodies,
“… to retain dredged sediment within the
coastal cell or sediment transport system from
which it is removed.” It is, however, a change
from recent practice and would require going through the full FEPA (Food and Environmental
Protection Act) licensing process.
tHRee-DIMensIonAL MoDeLLInGAn extensive data collection and modelling
exercise (Deltares, 2009) was conducted from
2008 to 2009. A dedicated Delft 3D-FLOW
model was developed for Lough Foyle with
a high level of detail in the areas of interest
(i.e., dredged sediment disposal sites). To
demonstrate the predictive value of the
hydrodynamic model, the model was calibrated
and validated with field measurements of
water levels and three-dimensional current
measurements (see Figure 4, which shows a
vector plot and comparison with the model
current predictions and field measurements).
These measurements were collected in
transects around the area of interest in a
survey campaign dedicated to this study.
Figure 3. The Port of Londonderry’s trailing suction hopper dredger Lough Foyle.
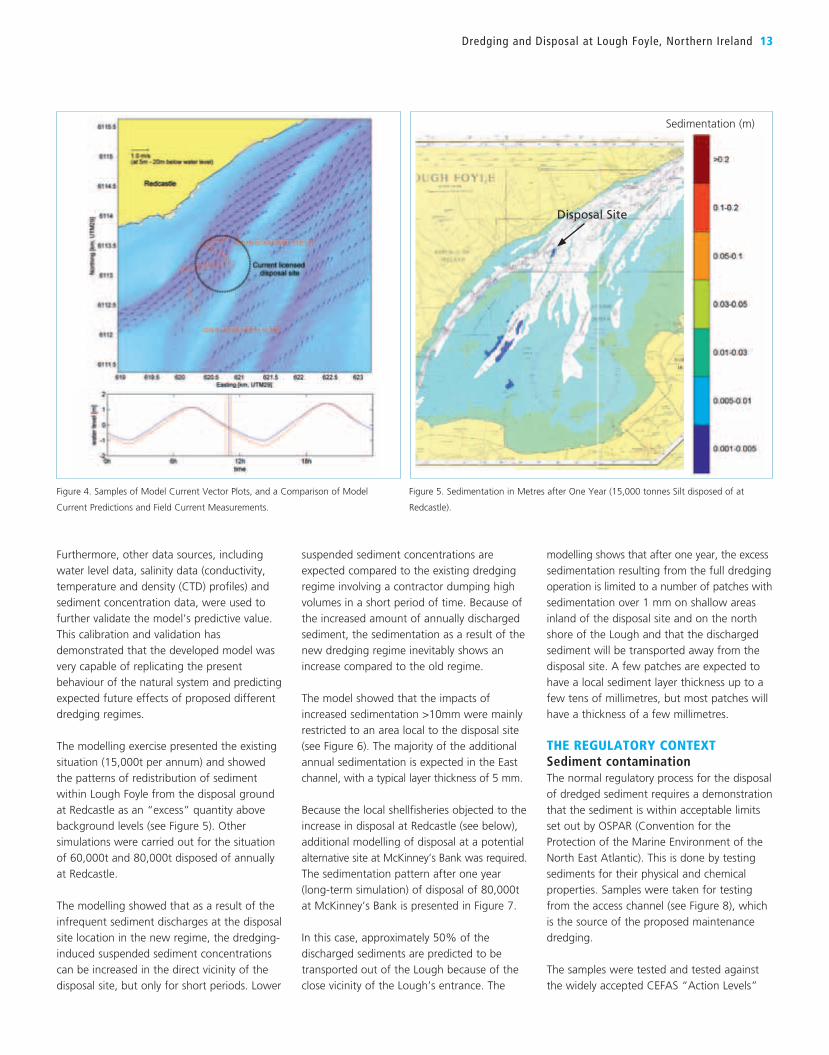
Dredging and Disposal at Lough Foyle, Northern Ireland 13
Furthermore, other data sources, including
water level data, salinity data (conductivity,
temperature and density (CTD) profiles) and
sediment concentration data, were used to
further validate the model’s predictive value.
This calibration and validation has
demonstrated that the developed model was
very capable of replicating the present
behaviour of the natural system and predicting
expected future effects of proposed different
dredging regimes.
The modelling exercise presented the existing
situation (15,000t per annum) and showed
the patterns of redistribution of sediment
within Lough Foyle from the disposal ground
at Redcastle as an “excess” quantity above
background levels (see Figure 5). Other
simulations were carried out for the situation
of 60,000t and 80,000t disposed of annually
at Redcastle.
The modelling showed that as a result of the
infrequent sediment discharges at the disposal
site location in the new regime, the dredging-
induced suspended sediment concentrations
can be increased in the direct vicinity of the
disposal site, but only for short periods. Lower
Figure 4. Samples of Model Current Vector Plots, and a Comparison of Model
Current Predictions and Field Current Measurements.
suspended sediment concentrations are
expected compared to the existing dredging
regime involving a contractor dumping high
volumes in a short period of time. Because of
the increased amount of annually discharged
sediment, the sedimentation as a result of the
new dredging regime inevitably shows an
increase compared to the old regime.
The model showed that the impacts of
increased sedimentation >10mm were mainly
restricted to an area local to the disposal site
(see Figure 6). The majority of the additional
annual sedimentation is expected in the East channel, with a typical layer thickness of 5 mm.
Because the local shellfisheries objected to the
increase in disposal at Redcastle (see below),
additional modelling of disposal at a potential
alternative site at McKinney’s Bank was required.
The sedimentation pattern after one year
(long-term simulation) of disposal of 80,000t
at McKinney’s Bank is presented in Figure 7.
In this case, approximately 50% of the
discharged sediments are predicted to be
transported out of the Lough because of the
close vicinity of the Lough’s entrance. The
modelling shows that after one year, the excess
sedimentation resulting from the full dredging
operation is limited to a number of patches with
sedimentation over 1 mm on shallow areas
inland of the disposal site and on the north
shore of the Lough and that the discharged
sediment will be transported away from the
disposal site. A few patches are expected to
have a local sediment layer thickness up to a
few tens of millimetres, but most patches will
have a thickness of a few millimetres.
tHe ReGULAtoRY conteXtSediment contamination The normal regulatory process for the disposal
of dredged sediment requires a demonstration
that the sediment is within acceptable limits
set out by OSPAR (Convention for the
Protection of the Marine Environment of the
North East Atlantic). This is done by testing
sediments for their physical and chemical
properties. Samples were taken for testing
from the access channel (see Figure 8), which
is the source of the proposed maintenance
dredging.
The samples were tested and tested against
the widely accepted CEFAS “Action Levels”
Sedimentation (m)
Figure 5. Sedimentation in Metres after One Year (15,000 tonnes Silt disposed of at
Redcastle).
Disposal Site
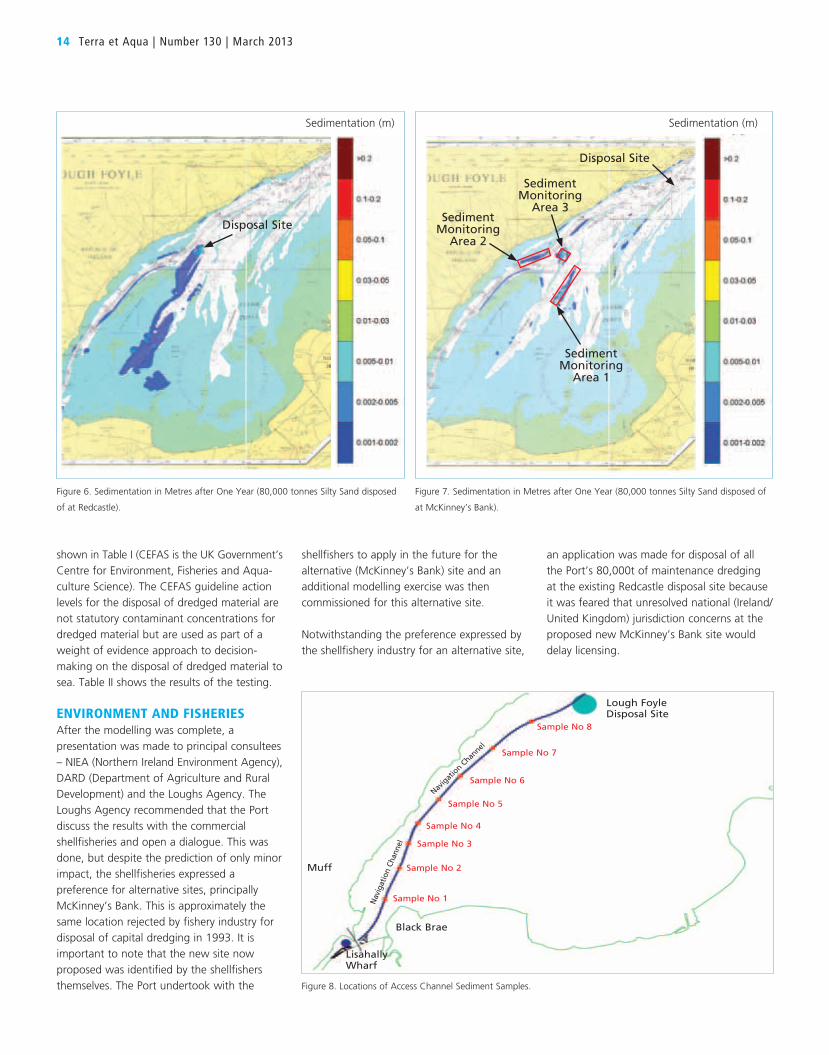
14 Terra et Aqua | Number 130 | March 2013
shown in Table I (CEFAS is the UK Government’s
Centre for Environment, Fisheries and Aqua-
culture Science). The CEFAS guideline action
levels for the disposal of dredged material are
not statutory contaminant concentrations for
dredged material but are used as part of a
weight of evidence approach to decision-
making on the disposal of dredged material to
sea. Table II shows the results of the testing.
enVIRonMent AnD FIsHeRIesAfter the modelling was complete, a
presentation was made to principal consultees
– NIEA (Northern Ireland Environment Agency),
DARD (Department of Agriculture and Rural
Development) and the Loughs Agency. The
Loughs Agency recommended that the Port
discuss the results with the commercial
shellfisheries and open a dialogue. This was
done, but despite the prediction of only minor
impact, the shellfisheries expressed a
preference for alternative sites, principally
McKinney’s Bank. This is approximately the
same location rejected by fishery industry for
disposal of capital dredging in 1993. It is
important to note that the new site now
proposed was identified by the shellfishers
themselves. The Port undertook with the
shellfishers to apply in the future for the
alternative (McKinney’s Bank) site and an
additional modelling exercise was then
commissioned for this alternative site.
Notwithstanding the preference expressed by
the shellfishery industry for an alternative site,
Figure 6. Sedimentation in Metres after One Year (80,000 tonnes Silty Sand disposed
of at Redcastle).
Figure 7. Sedimentation in Metres after One Year (80,000 tonnes Silty Sand disposed of
at McKinney’s Bank).
Sedimentation (m)Sedimentation (m)
an application was made for disposal of all
the Port’s 80,000t of maintenance dredging
at the existing Redcastle disposal site because
it was feared that unresolved national (Ireland/
United Kingdom) jurisdiction concerns at the
proposed new McKinney’s Bank site would
delay licensing.
Figure 8. Locations of Access Channel Sediment Samples.
Disposal Site
Disposal Site
Sediment Monitoring
Area 3Sediment
Monitoring Area 2
Sediment Monitoring
Area 1
Lough FoyleDisposal Site
Sample No 8
Sample No 7
Sample No 6
Sample No 5
Sample No 4
Sample No 3
Sample No 2
Sample No 1
Black Brae
LisahallyWharf
Muff
Nav
igat
ion
Chan
nel
Navig
atio
n Chan
nel
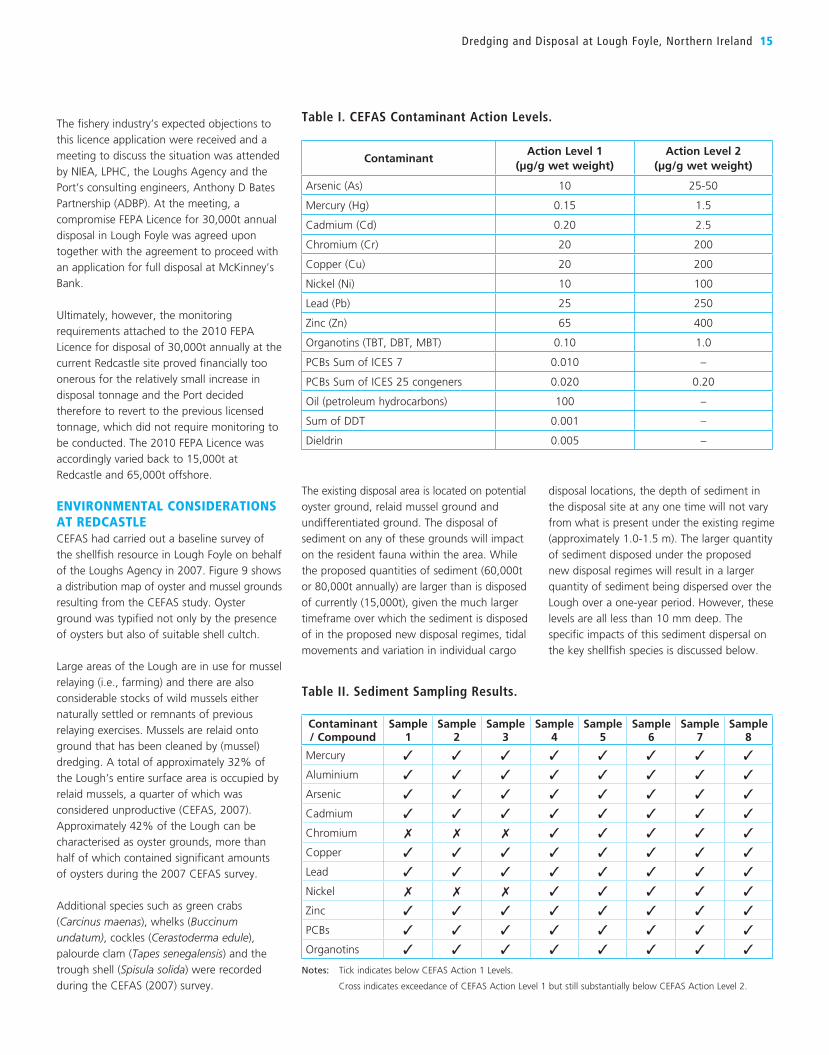
Dredging and Disposal at Lough Foyle, Northern Ireland 15
The fishery industry’s expected objections to
this licence application were received and a
meeting to discuss the situation was attended
by NIEA, LPHC, the Loughs Agency and the
Port’s consulting engineers, Anthony D Bates
Partnership (ADBP). At the meeting, a
compromise FEPA Licence for 30,000t annual
disposal in Lough Foyle was agreed upon
together with the agreement to proceed with
an application for full disposal at McKinney’s
Bank.
Ultimately, however, the monitoring
requirements attached to the 2010 FEPA
Licence for disposal of 30,000t annually at the
current Redcastle site proved financially too
onerous for the relatively small increase in
disposal tonnage and the Port decided
therefore to revert to the previous licensed
tonnage, which did not require monitoring to
be conducted. The 2010 FEPA Licence was
accordingly varied back to 15,000t at
Redcastle and 65,000t offshore.
enVIRonMentAL consIDeRAtIons At ReDcAstLeCEFAS had carried out a baseline survey of
the shellfish resource in Lough Foyle on behalf
of the Loughs Agency in 2007. Figure 9 shows
a distribution map of oyster and mussel grounds
resulting from the CEFAS study. Oyster
ground was typified not only by the presence
of oysters but also of suitable shell cultch.
Large areas of the Lough are in use for mussel
relaying (i.e., farming) and there are also
considerable stocks of wild mussels either
naturally settled or remnants of previous
relaying exercises. Mussels are relaid onto
ground that has been cleaned by (mussel)
dredging. A total of approximately 32% of
the Lough’s entire surface area is occupied by
relaid mussels, a quarter of which was
considered unproductive (CEFAS, 2007).
Approximately 42% of the Lough can be
characterised as oyster grounds, more than
half of which contained significant amounts
of oysters during the 2007 CEFAS survey.
Additional species such as green crabs
(Carcinus maenas), whelks (Buccinum undatum), cockles (Cerastoderma edule),
palourde clam (Tapes senegalensis) and the
trough shell (Spisula solida) were recorded
during the CEFAS (2007) survey.
The existing disposal area is located on potential
oyster ground, relaid mussel ground and
undifferentiated ground. The disposal of
sediment on any of these grounds will impact
on the resident fauna within the area. While
the proposed quantities of sediment (60,000t
or 80,000t annually) are larger than is disposed
of currently (15,000t), given the much larger
timeframe over which the sediment is disposed
of in the proposed new disposal regimes, tidal
movements and variation in individual cargo
disposal locations, the depth of sediment in
the disposal site at any one time will not vary
from what is present under the existing regime
(approximately 1.0-1.5 m). The larger quantity
of sediment disposed under the proposed
new disposal regimes will result in a larger
quantity of sediment being dispersed over the
Lough over a one-year period. However, these
levels are all less than 10 mm deep. The
specific impacts of this sediment dispersal on
the key shellfish species is discussed below.
Table I. CEFAS Contaminant Action Levels.
ContaminantAction Level 1
(μg/g wet weight)Action Level 2
(μg/g wet weight)
Arsenic (As) 10 25-50
Mercury (Hg) 0.15 1.5
Cadmium (Cd) 0.20 2.5
Chromium (Cr) 20 200
Copper (Cu) 20 200
Nickel (Ni) 10 100
Lead (Pb) 25 250
Zinc (Zn) 65 400
Organotins (TBT, DBT, MBT) 0.10 1.0
PCBs Sum of ICES 7 0.010 –
PCBs Sum of ICES 25 congeners 0.020 0.20
Oil (petroleum hydrocarbons) 100 –
Sum of DDT 0.001 –
Dieldrin 0.005 –
Table II. Sediment Sampling Results.
Contaminant / Compound
Sample1
Sample2
Sample3
Sample4
Sample5
Sample6
Sample7
Sample8
Mercury ✓ ✓ ✓ ✓ ✓ ✓ ✓ ✓
Aluminium ✓ ✓ ✓ ✓ ✓ ✓ ✓ ✓
Arsenic ✓ ✓ ✓ ✓ ✓ ✓ ✓ ✓
Cadmium ✓ ✓ ✓ ✓ ✓ ✓ ✓ ✓
Chromium ✗ ✗ ✗ ✓ ✓ ✓ ✓ ✓
Copper ✓ ✓ ✓ ✓ ✓ ✓ ✓ ✓
Lead ✓ ✓ ✓ ✓ ✓ ✓ ✓ ✓
Nickel ✗ ✗ ✗ ✓ ✓ ✓ ✓ ✓
Zinc ✓ ✓ ✓ ✓ ✓ ✓ ✓ ✓
PCBs ✓ ✓ ✓ ✓ ✓ ✓ ✓ ✓
Organotins ✓ ✓ ✓ ✓ ✓ ✓ ✓ ✓
Notes: Tick indicates below CEFAS Action 1 Levels.
Cross indicates exceedance of CEFAS Action Level 1 but still substantially below CEFAS Action Level 2.
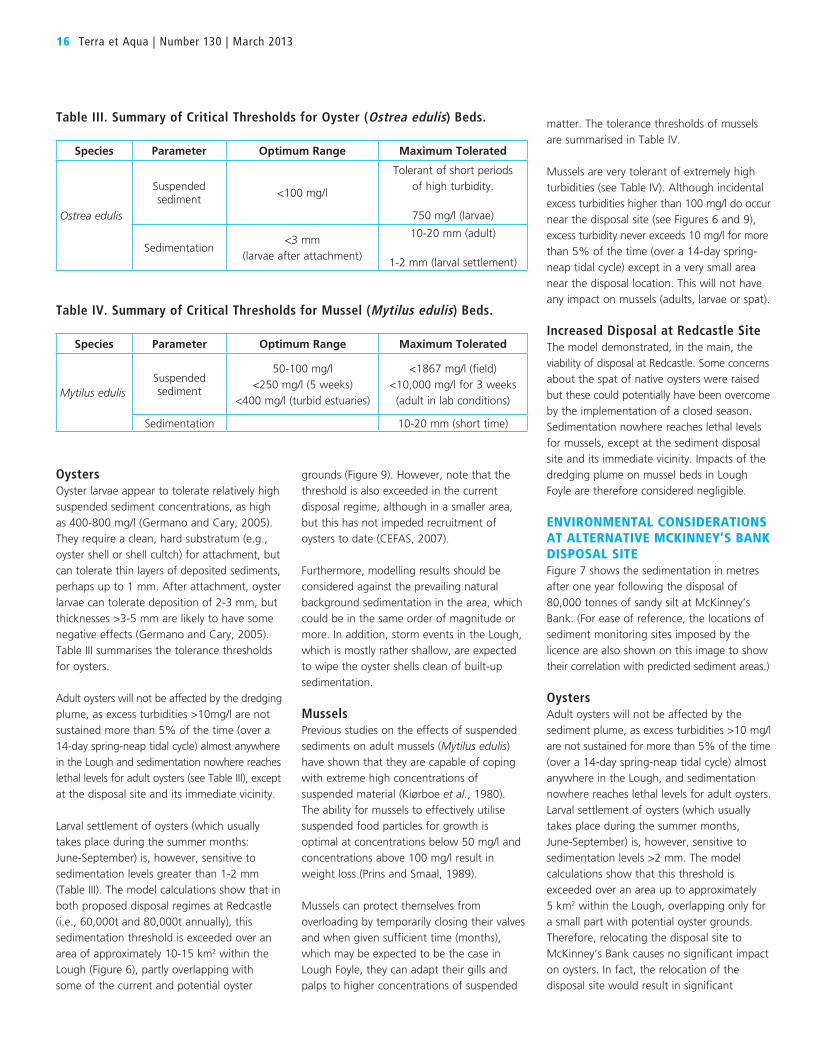
16 Terra et Aqua | Number 130 | March 2013
Oysters Oyster larvae appear to tolerate relatively high
suspended sediment concentrations, as high
as 400-800 mg/l (Germano and Cary, 2005).
They require a clean, hard substratum (e.g.,
oyster shell or shell cultch) for attachment, but
can tolerate thin layers of deposited sediments,
perhaps up to 1 mm. After attachment, oyster
larvae can tolerate deposition of 2-3 mm, but
thicknesses >3-5 mm are likely to have some
negative effects (Germano and Cary, 2005).
Table III summarises the tolerance thresholds
for oysters.
Adult oysters will not be affected by the dredging
plume, as excess turbidities >10mg/l are not
sustained more than 5% of the time (over a
14-day spring-neap tidal cycle) almost anywhere
in the Lough and sedimentation nowhere reaches
lethal levels for adult oysters (see Table III), except
at the disposal site and its immediate vicinity.
Larval settlement of oysters (which usually
takes place during the summer months:
June-September) is, however, sensitive to
sedimentation levels greater than 1-2 mm
(Table III). The model calculations show that in
both proposed disposal regimes at Redcastle
(i.e., 60,000t and 80,000t annually), this
sedimentation threshold is exceeded over an
area of approximately 10-15 km2 within the
Lough (Figure 6), partly overlapping with
some of the current and potential oyster
grounds (Figure 9). However, note that the
threshold is also exceeded in the current
disposal regime, although in a smaller area,
but this has not impeded recruitment of
oysters to date (CEFAS, 2007).
Furthermore, modelling results should be
considered against the prevailing natural
background sedimentation in the area, which
could be in the same order of magnitude or
more. In addition, storm events in the Lough,
which is mostly rather shallow, are expected
to wipe the oyster shells clean of built-up
sedimentation.
MusselsPrevious studies on the effects of suspended
sediments on adult mussels (Mytilus edulis) have shown that they are capable of coping
with extreme high concentrations of
suspended material (Kiørboe et al., 1980).
The ability for mussels to effectively utilise
suspended food particles for growth is
optimal at concentrations below 50 mg/l and
concentrations above 100 mg/l result in
weight loss (Prins and Smaal, 1989).
Mussels can protect themselves from
overloading by temporarily closing their valves
and when given sufficient time (months),
which may be expected to be the case in
Lough Foyle, they can adapt their gills and
palps to higher concentrations of suspended
matter. The tolerance thresholds of mussels
are summarised in Table IV.
Mussels are very tolerant of extremely high
turbidities (see Table IV). Although incidental excess turbidities higher than 100 mg/l do occur
near the disposal site (see Figures 6 and 9),
excess turbidity never exceeds 10 mg/l for more
than 5% of the time (over a 14-day spring-
neap tidal cycle) except in a very small area
near the disposal location. This will not have
any impact on mussels (adults, larvae or spat).
Increased Disposal at Redcastle SiteThe model demonstrated, in the main, the
viability of disposal at Redcastle. Some concerns
about the spat of native oysters were raised
but these could potentially have been overcome
by the implementation of a closed season.
Sedimentation nowhere reaches lethal levels
for mussels, except at the sediment disposal
site and its immediate vicinity. Impacts of the
dredging plume on mussel beds in Lough
Foyle are therefore considered negligible.
enVIRonMentAL consIDeRAtIons At ALteRnAtIVe MckInneY’s BAnk DIsPosAL sIteFigure 7 shows the sedimentation in metres
after one year following the disposal of
80,000 tonnes of sandy silt at McKinney’s
Bank. (For ease of reference, the locations of
sediment monitoring sites imposed by the
licence are also shown on this image to show
their correlation with predicted sediment areas.)
OystersAdult oysters will not be affected by the
sediment plume, as excess turbidities >10 mg/l
are not sustained for more than 5% of the time
(over a 14-day spring-neap tidal cycle) almost
anywhere in the Lough, and sedimentation
nowhere reaches lethal levels for adult oysters.
Larval settlement of oysters (which usually
takes place during the summer months,
June-September) is, however, sensitive to
sedimentation levels >2 mm. The model
calculations show that this threshold is
exceeded over an area up to approximately
5 km2 within the Lough, overlapping only for
a small part with potential oyster grounds.
Therefore, relocating the disposal site to
McKinney’s Bank causes no significant impact
on oysters. In fact, the relocation of the
disposal site would result in significant
Table IV. Summary of Critical Thresholds for Mussel (Mytilus edulis) Beds.
Species Parameter Optimum Range Maximum Tolerated
Mytilus edulisSuspendedsediment
50-100 mg/l
<250 mg/l (5 weeks)
<400 mg/l (turbid estuaries)
<1867 mg/l (field)
<10,000 mg/l for 3 weeks
(adult in lab conditions)
Sedimentation 10-20 mm (short time)
Table III. Summary of Critical Thresholds for Oyster (Ostrea edulis) Beds.
Species Parameter Optimum Range Maximum Tolerated
Ostrea edulis
Suspendedsediment
<100 mg/l
Tolerant of short periods
of high turbidity.
750 mg/l (larvae)
Sedimentation<3 mm
(larvae after attachment)
10-20 mm (adult)
1-2 mm (larval settlement)
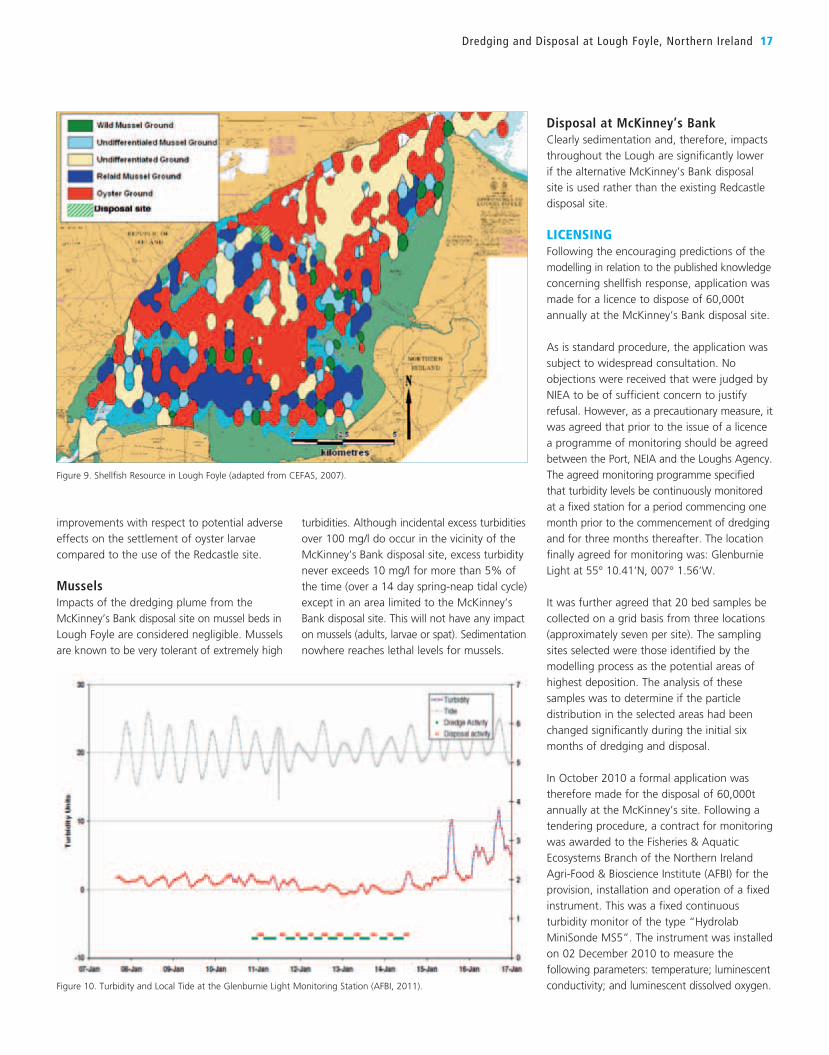
Dredging and Disposal at Lough Foyle, Northern Ireland 17
improvements with respect to potential adverse
effects on the settlement of oyster larvae
compared to the use of the Redcastle site.
MusselsImpacts of the dredging plume from the
McKinney’s Bank disposal site on mussel beds in
Lough Foyle are considered negligible. Mussels
are known to be very tolerant of extremely high
turbidities. Although incidental excess turbidities
over 100 mg/l do occur in the vicinity of the
McKinney’s Bank disposal site, excess turbidity
never exceeds 10 mg/l for more than 5% of
the time (over a 14 day spring-neap tidal cycle)
except in an area limited to the McKinney’s
Bank disposal site. This will not have any impact
on mussels (adults, larvae or spat). Sedimentation
nowhere reaches lethal levels for mussels.
Disposal at Mckinney’s BankClearly sedimentation and, therefore, impacts
throughout the Lough are significantly lower
if the alternative McKinney’s Bank disposal
site is used rather than the existing Redcastle
disposal site.
LIcensInGFollowing the encouraging predictions of the
modelling in relation to the published knowledge
concerning shellfish response, application was
made for a licence to dispose of 60,000t
annually at the McKinney’s Bank disposal site.
As is standard procedure, the application was
subject to widespread consultation. No
objections were received that were judged by
NIEA to be of sufficient concern to justify
refusal. However, as a precautionary measure, it
was agreed that prior to the issue of a licence
a programme of monitoring should be agreed
between the Port, NEIA and the Loughs Agency.
The agreed monitoring programme specified
that turbidity levels be continuously monitored
at a fixed station for a period commencing one
month prior to the commencement of dredging
and for three months thereafter. The location
finally agreed for monitoring was: Glenburnie
Light at 55° 10.41’N, 007° 1.56’W.
It was further agreed that 20 bed samples be
collected on a grid basis from three locations
(approximately seven per site). The sampling
sites selected were those identified by the
modelling process as the potential areas of
highest deposition. The analysis of these
samples was to determine if the particle
distribution in the selected areas had been
changed significantly during the initial six
months of dredging and disposal.
In October 2010 a formal application was
therefore made for the disposal of 60,000t
annually at the McKinney’s site. Following a tendering procedure, a contract for monitoring
was awarded to the Fisheries & Aquatic
Ecosystems Branch of the Northern Ireland
Agri-Food & Bioscience Institute (AFBI) for the
provision, installation and operation of a fixed
instrument. This was a fixed continuous
turbidity monitor of the type “Hydrolab
MiniSonde MS5”. The instrument was installed
on 02 December 2010 to measure the
following parameters: temperature; luminescent
conductivity; and luminescent dissolved oxygen.
Figure 9. Shellfish Resource in Lough Foyle (adapted from CEFAS, 2007).
Figure 10. Turbidity and Local Tide at the Glenburnie Light Monitoring Station (AFBI, 2011).
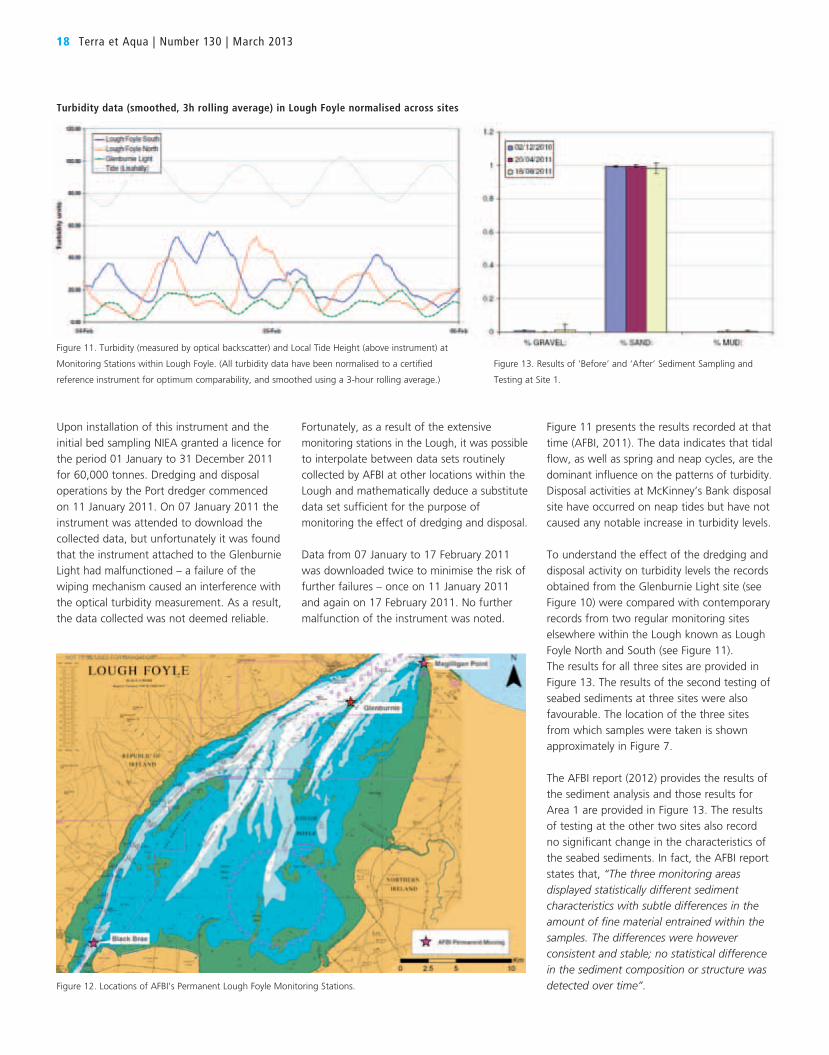
Upon installation of this instrument and the
initial bed sampling NIEA granted a licence for
the period 01 January to 31 December 2011
for 60,000 tonnes. Dredging and disposal
operations by the Port dredger commenced
on 11 January 2011. On 07 January 2011 the
instrument was attended to download the
collected data, but unfortunately it was found
that the instrument attached to the Glenburnie
Light had malfunctioned – a failure of the
wiping mechanism caused an interference with
the optical turbidity measurement. As a result,
the data collected was not deemed reliable.
Figure 11. Turbidity (measured by optical backscatter) and Local Tide Height (above instrument) at
Monitoring Stations within Lough Foyle. (All turbidity data have been normalised to a certified
reference instrument for optimum comparability, and smoothed using a 3-hour rolling average.)
Figure 13. Results of ‘Before’ and ‘After’ Sediment Sampling and
Testing at Site 1.
Fortunately, as a result of the extensive
monitoring stations in the Lough, it was possible
to interpolate between data sets routinely
collected by AFBI at other locations within the
Lough and mathematically deduce a substitute
data set sufficient for the purpose of
monitoring the effect of dredging and disposal.
Data from 07 January to 17 February 2011
was downloaded twice to minimise the risk of
further failures – once on 11 January 2011
and again on 17 February 2011. No further
malfunction of the instrument was noted.
18 Terra et Aqua | Number 130 | March 2013
Turbidity data (smoothed, 3h rolling average) in Lough Foyle normalised across sites
Figure 11 presents the results recorded at that
time (AFBI, 2011). The data indicates that tidal
flow, as well as spring and neap cycles, are the
dominant influence on the patterns of turbidity.
Disposal activities at McKinney’s Bank disposal
site have occurred on neap tides but have not
caused any notable increase in turbidity levels.
To understand the effect of the dredging and
disposal activity on turbidity levels the records
obtained from the Glenburnie Light site (see
Figure 10) were compared with contemporary
records from two regular monitoring sites
elsewhere within the Lough known as Lough
Foyle North and South (see Figure 11).
The results for all three sites are provided in
Figure 13. The results of the second testing of
seabed sediments at three sites were also
favourable. The location of the three sites
from which samples were taken is shown
approximately in Figure 7.
The AFBI report (2012) provides the results of
the sediment analysis and those results for
Area 1 are provided in Figure 13. The results
of testing at the other two sites also record
no significant change in the characteristics of
the seabed sediments. In fact, the AFBI report
states that, “The three monitoring areas displayed statistically different sediment characteristics with subtle differences in the amount of fine material entrained within the samples. The differences were however consistent and stable; no statistical difference in the sediment composition or structure was detected over time”.Figure 12. Locations of AFBI’s Permanent Lough Foyle Monitoring Stations.
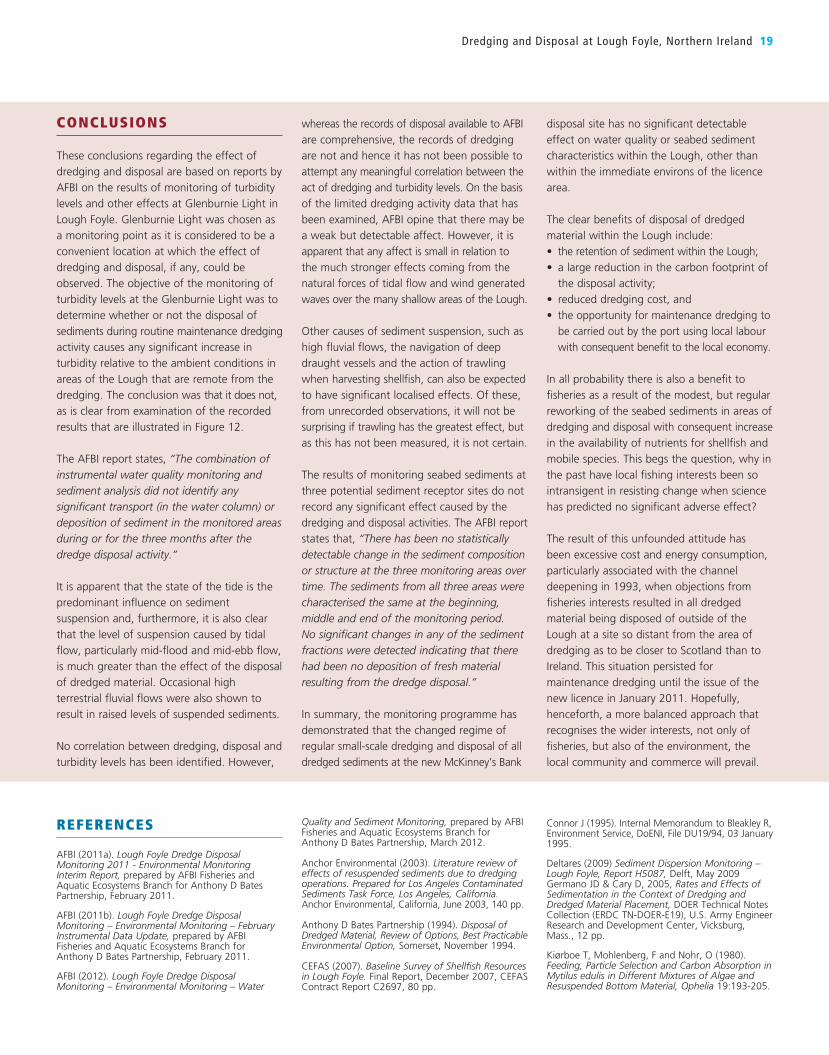
Dredging and Disposal at Lough Foyle, Northern Ireland 19
CONCLUSIONS
These conclusions regarding the effect of
dredging and disposal are based on reports by
AFBI on the results of monitoring of turbidity
levels and other effects at Glenburnie Light in
Lough Foyle. Glenburnie Light was chosen as
a monitoring point as it is considered to be a
convenient location at which the effect of
dredging and disposal, if any, could be
observed. The objective of the monitoring of
turbidity levels at the Glenburnie Light was to
determine whether or not the disposal of
sediments during routine maintenance dredging
activity causes any significant increase in
turbidity relative to the ambient conditions in
areas of the Lough that are remote from the
dredging. The conclusion was that it does not,
as is clear from examination of the recorded
results that are illustrated in Figure 12.
The AFBI report states, “The combination of instrumental water quality monitoring and sediment analysis did not identify any significant transport (in the water column) or deposition of sediment in the monitored areas during or for the three months after the dredge disposal activity.”
It is apparent that the state of the tide is the
predominant influence on sediment
suspension and, furthermore, it is also clear
that the level of suspension caused by tidal
flow, particularly mid-flood and mid-ebb flow,
is much greater than the effect of the disposal
of dredged material. Occasional high
terrestrial fluvial flows were also shown to
result in raised levels of suspended sediments.
No correlation between dredging, disposal and
turbidity levels has been identified. However,
whereas the records of disposal available to AFBI
are comprehensive, the records of dredging
are not and hence it has not been possible to
attempt any meaningful correlation between the
act of dredging and turbidity levels. On the basis
of the limited dredging activity data that has
been examined, AFBI opine that there may be
a weak but detectable affect. However, it is
apparent that any affect is small in relation to
the much stronger effects coming from the
natural forces of tidal flow and wind generated
waves over the many shallow areas of the Lough.
Other causes of sediment suspension, such as
high fluvial flows, the navigation of deep
draught vessels and the action of trawling
when harvesting shellfish, can also be expected
to have significant localised effects. Of these,
from unrecorded observations, it will not be
surprising if trawling has the greatest effect, but
as this has not been measured, it is not certain.
The results of monitoring seabed sediments at
three potential sediment receptor sites do not
record any significant effect caused by the
dredging and disposal activities. The AFBI report
states that, “There has been no statistically detectable change in the sediment composition or structure at the three monitoring areas over time. The sediments from all three areas were characterised the same at the beginning, middle and end of the monitoring period. No significant changes in any of the sediment fractions were detected indicating that there had been no deposition of fresh material resulting from the dredge disposal.”
In summary, the monitoring programme has
demonstrated that the changed regime of
regular small-scale dredging and disposal of all
dredged sediments at the new McKinney’s Bank
disposal site has no significant detectable
effect on water quality or seabed sediment
characteristics within the Lough, other than
within the immediate environs of the licence
area.
The clear benefits of disposal of dredged
material within the Lough include:
• theretentionofsedimentwithintheLough;
• alargereductioninthecarbonfootprintof
the disposal activity;
• reduceddredgingcost,and
• theopportunityformaintenancedredgingto
be carried out by the port using local labour
with consequent benefit to the local economy.
In all probability there is also a benefit to
fisheries as a result of the modest, but regular
reworking of the seabed sediments in areas of
dredging and disposal with consequent increase
in the availability of nutrients for shellfish and
mobile species. This begs the question, why in
the past have local fishing interests been so
intransigent in resisting change when science
has predicted no significant adverse effect?
The result of this unfounded attitude has
been excessive cost and energy consumption,
particularly associated with the channel
deepening in 1993, when objections from
fisheries interests resulted in all dredged
material being disposed of outside of the
Lough at a site so distant from the area of
dredging as to be closer to Scotland than to
Ireland. This situation persisted for
maintenance dredging until the issue of the
new licence in January 2011. Hopefully,
henceforth, a more balanced approach that
recognises the wider interests, not only of
fisheries, but also of the environment, the
local community and commerce will prevail.
REFERENCES
AFBI (2011a). Lough Foyle Dredge Disposal Monitoring 2011 - Environmental Monitoring Interim Report, prepared by AFBI Fisheries and Aquatic Ecosystems Branch for Anthony D Bates Partnership, February 2011.
AFBI (2011b). Lough Foyle Dredge Disposal Monitoring – Environmental Monitoring – February Instrumental Data Update, prepared by AFBI Fisheries and Aquatic Ecosystems Branch for Anthony D Bates Partnership, February 2011.
AFBI (2012). Lough Foyle Dredge Disposal Monitoring – Environmental Monitoring – Water
Quality and Sediment Monitoring, prepared by AFBI Fisheries and Aquatic Ecosystems Branch for Anthony D Bates Partnership, March 2012.
Anchor Environmental (2003). Literature review of effects of resuspended sediments due to dredging operations. Prepared for Los Angeles Contaminated Sediments Task Force, Los Angeles, California. Anchor Environmental, California, June 2003, 140 pp.
Anthony D Bates Partnership (1994). Disposal of Dredged Material, Review of Options, Best Practicable Environmental Option, Somerset, November 1994.
CEFAS (2007). Baseline Survey of Shellfish Resources in Lough Foyle. Final Report, December 2007, CEFAS Contract Report C2697, 80 pp.
Connor J (1995). Internal Memorandum to Bleakley R, Environment Service, DoENI, File DU19/94, 03 January 1995.
Deltares (2009) Sediment Dispersion Monitoring – Lough Foyle, Report H5087, Delft, May 2009Germano JD & Cary D, 2005, Rates and Effects of Sedimentation in the Context of Dredging and Dredged Material Placement, DOER Technical Notes Collection (ERDC TN-DOER-E19), U.S. Army Engineer Research and Development Center, Vicksburg, Mass., 12 pp.
Kiørboe T, Mohlenberg, F and Nohr, O (1980). Feeding, Particle Selection and Carbon Absorption in Mytilus edulis in Different Mixtures of Algae and Resuspended Bottom Material, Ophelia 19:193-205.
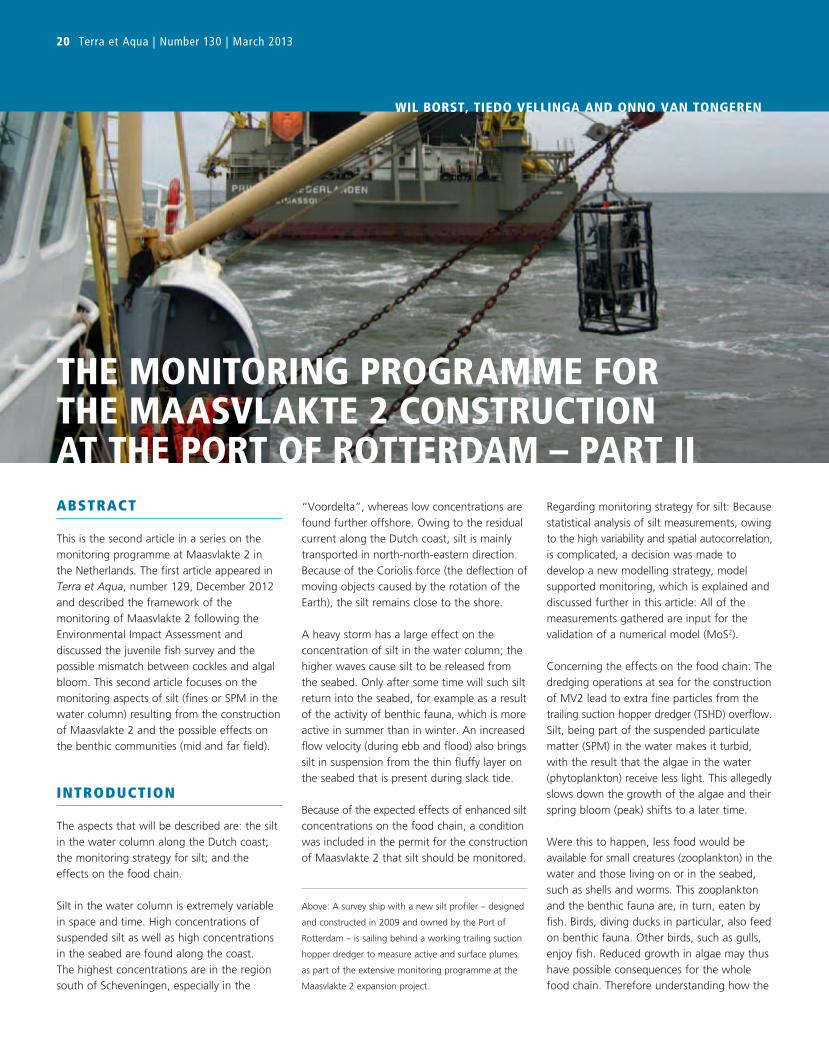
ABSTRACT
This is the second article in a series on the
monitoring programme at Maasvlakte 2 in
the Netherlands. The first article appeared in
Terra et Aqua, number 129, December 2012
and described the framework of the
monitoring of Maasvlakte 2 following the
Environmental Impact Assessment and
discussed the juvenile fish survey and the
possible mismatch between cockles and algal
bloom. This second article focuses on the
monitoring aspects of silt (fines or SPM in the
water column) resulting from the construction
of Maasvlakte 2 and the possible effects on
the benthic communities (mid and far field).
INTRODUCTION
The aspects that will be described are: the silt
in the water column along the Dutch coast;
the monitoring strategy for silt; and the
effects on the food chain.
Silt in the water column is extremely variable
in space and time. High concentrations of
suspended silt as well as high concentrations
in the seabed are found along the coast.
The highest concentrations are in the region
south of Scheveningen, especially in the
“Voordelta”, whereas low concentrations are
found further offshore. Owing to the residual
current along the Dutch coast, silt is mainly
transported in north-north-eastern direction.
Because of the Coriolis force (the deflection of
moving objects caused by the rotation of the
Earth), the silt remains close to the shore.
A heavy storm has a large effect on the
concentration of silt in the water column; the
higher waves cause silt to be released from
the seabed. Only after some time will such silt
return into the seabed, for example as a result
of the activity of benthic fauna, which is more
active in summer than in winter. An increased flow velocity (during ebb and flood) also brings
silt in suspension from the thin fluffy layer on
the seabed that is present during slack tide.
Because of the expected effects of enhanced silt
concentrations on the food chain, a condition
was included in the permit for the construction
of Maasvlakte 2 that silt should be monitored.
Regarding monitoring strategy for silt: Because
statistical analysis of silt measurements, owing
to the high variability and spatial autocorrelation,
is complicated, a decision was made to
develop a new modelling strategy, model
supported monitoring, which is explained and
discussed further in this article: All of the
measurements gathered are input for the
validation of a numerical model (MoS2).
Concerning the effects on the food chain: The
dredging operations at sea for the construction
of MV2 lead to extra fine particles from the
trailing suction hopper dredger (TSHD) overflow.
Silt, being part of the suspended particulate
matter (SPM) in the water makes it turbid,
with the result that the algae in the water
(phytoplankton) receive less light. This allegedly
slows down the growth of the algae and their
spring bloom (peak) shifts to a later time.
Were this to happen, less food would be
available for small creatures (zooplankton) in the
water and those living on or in the seabed,
such as shells and worms. This zooplankton
and the benthic fauna are, in turn, eaten by
fish. Birds, diving ducks in particular, also feed
on benthic fauna. Other birds, such as gulls,
enjoy fish. Reduced growth in algae may thus
have possible consequences for the whole
food chain. Therefore understanding how the
tHe MonItoRInG PRoGRAMMe FoRtHe MAAsVLAkte 2 constRUctIonAt tHe PoRt oF RotteRDAM – PARt II
WIL BoRst, tIeDo VeLLInGA AnD onno VAn tonGeRen
Above: A survey ship with a new silt profiler – designed
and constructed in 2009 and owned by the Port of
Rotterdam – is sailing behind a working trailing suction
hopper dredger to measure active and surface plumes
as part of the extensive monitoring programme at the
Maasvlakte 2 expansion project.
20 Terra et Aqua | Number 130 | March 2013
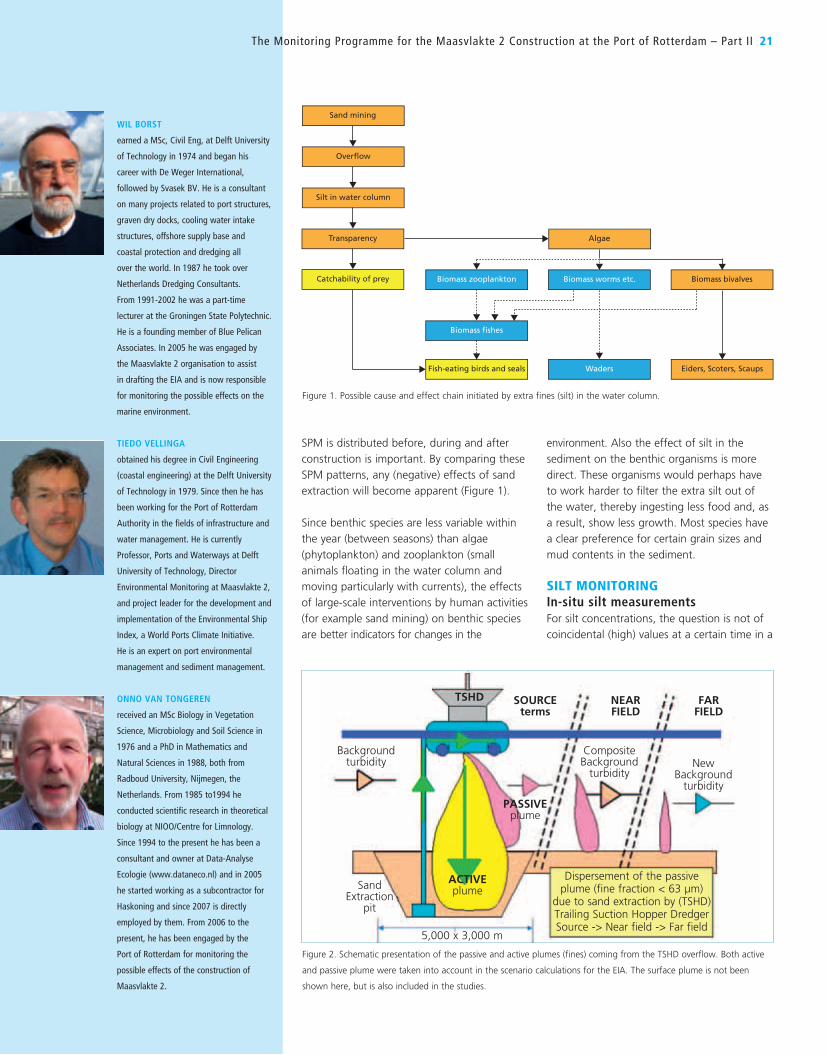
SPM is distributed before, during and after
construction is important. By comparing these
SPM patterns, any (negative) effects of sand
extraction will become apparent (Figure 1).
Since benthic species are less variable within
the year (between seasons) than algae
(phytoplankton) and zooplankton (small
animals floating in the water column and
moving particularly with currents), the effects
of large-scale interventions by human activities
(for example sand mining) on benthic species
are better indicators for changes in the
environment. Also the effect of silt in the
sediment on the benthic organisms is more
direct. These organisms would perhaps have
to work harder to filter the extra silt out of
the water, thereby ingesting less food and, as
a result, show less growth. Most species have
a clear preference for certain grain sizes and
mud contents in the sediment.
sILt MonItoRInGIn-situ silt measurementsFor silt concentrations, the question is not of
coincidental (high) values at a certain time in a
WIL BORST
earned a MSc, Civil Eng, at Delft University
of Technology in 1974 and began his
career with De Weger International,
followed by Svasek BV. He is a consultant
on many projects related to port structures,
graven dry docks, cooling water intake
structures, offshore supply base and
coastal protection and dredging all
over the world. In 1987 he took over
Netherlands Dredging Consultants.
From 1991-2002 he was a part-time
lecturer at the Groningen State Polytechnic.
He is a founding member of Blue Pelican
Associates. In 2005 he was engaged by
the Maasvlakte 2 organisation to assist
in drafting the EIA and is now responsible
for monitoring the possible effects on the
marine environment.
TIEDO VELLINGA
obtained his degree in Civil Engineering
(coastal engineering) at the Delft University
of Technology in 1979. Since then he has
been working for the Port of Rotterdam
Authority in the fields of infrastructure and
water management. He is currently
Professor, Ports and Waterways at Delft
University of Technology, Director
Environmental Monitoring at Maasvlakte 2,
and project leader for the development and
implementation of the Environmental Ship
Index, a World Ports Climate Initiative.
He is an expert on port environmental
management and sediment management.
ONNO VAN TONGEREN
received an MSc Biology in Vegetation
Science, Microbiology and Soil Science in
1976 and a PhD in Mathematics and
Natural Sciences in 1988, both from
Radboud University, Nijmegen, the
Netherlands. From 1985 to1994 he
conducted scientific research in theoretical
biology at NIOO/Centre for Limnology.
Since 1994 to the present he has been a
consultant and owner at Data-Analyse
Ecologie (www.dataneco.nl) and in 2005
he started working as a subcontractor for
Haskoning and since 2007 is directly
employed by them. From 2006 to the
present, he has been engaged by the
Port of Rotterdam for monitoring the
possible effects of the construction of
Maasvlakte 2.
The Monitoring Programme for the Maasvlakte 2 Construction at the Port of Rotterdam – Part II 21
Fish-eating birds and seals
Biomass fishes
Biomass zooplankton
Waders
Biomass worms etc.Catchability of prey
Transparency
Silt in water column
Overflow
Sand mining
Algae
Biomass bivalves
Eiders, Scoters, Scaups
Figure 1. Possible cause and effect chain initiated by extra fines (silt) in the water column.
TSHD SOURCEterms
NEARFIELD
FARFIELD
PASSIVEplume
CompositeBackground
turbidityNew
Backgroundturbidity
Dispersement of the passive plume (fine fraction < 63 μm)
due to sand extraction by (TSHD)Trailing Suction Hopper DredgerSource -> Near field -> Far field
5,000 x 3,000 m
ACTIVEplume
Backgroundturbidity
Sand Extraction
pit
Figure 2. Schematic presentation of the passive and active plumes (fines) coming from the TSHD overflow. Both active
and passive plume were taken into account in the scenario calculations for the EIA. The surface plume is not been
shown here, but is also included in the studies.
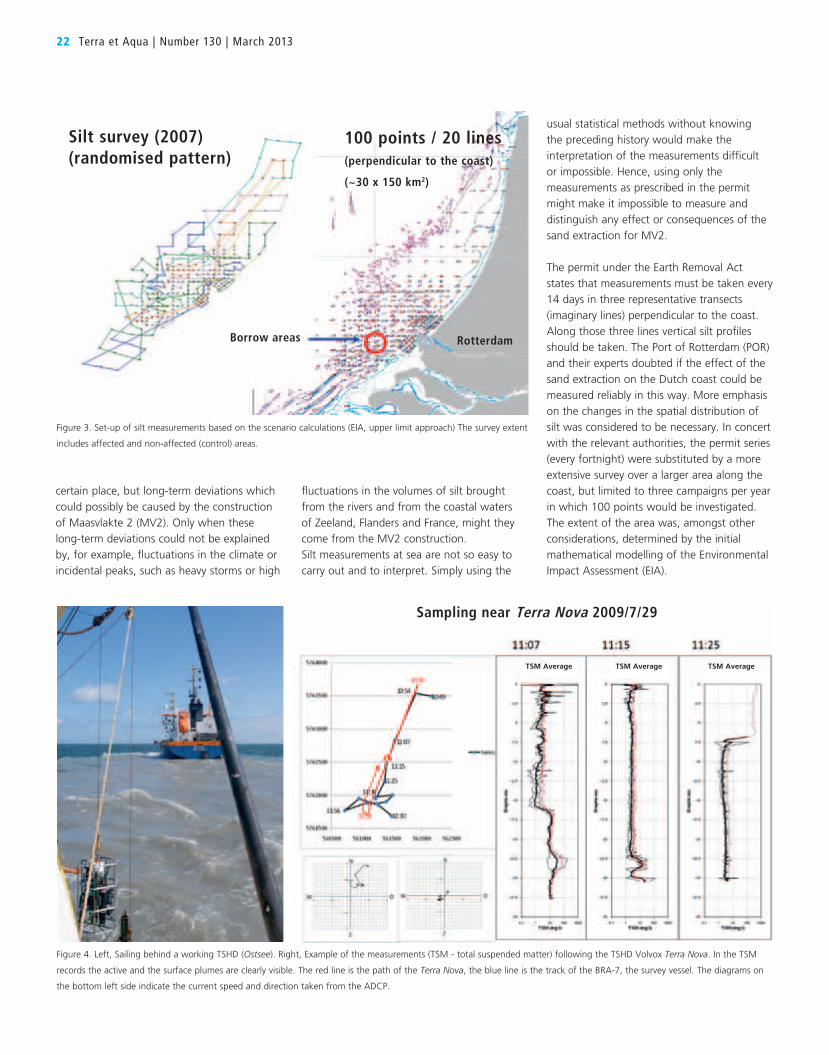
certain place, but long-term deviations which
could possibly be caused by the construction
of Maasvlakte 2 (MV2). Only when these
long-term deviations could not be explained
by, for example, fluctuations in the climate or
incidental peaks, such as heavy storms or high
fluctuations in the volumes of silt brought
from the rivers and from the coastal waters
of Zeeland, Flanders and France, might they
come from the MV2 construction.
Silt measurements at sea are not so easy to
carry out and to interpret. Simply using the
usual statistical methods without knowing
the preceding history would make the
interpretation of the measurements difficult
or impossible. Hence, using only the
measurements as prescribed in the permit
might make it impossible to measure and
distinguish any effect or consequences of the
sand extraction for MV2.
The permit under the Earth Removal Act
states that measurements must be taken every
14 days in three representative transects
(imaginary lines) perpendicular to the coast.
Along those three lines vertical silt profiles
should be taken. The Port of Rotterdam (POR)
and their experts doubted if the effect of the
sand extraction on the Dutch coast could be
measured reliably in this way. More emphasis
on the changes in the spatial distribution of
silt was considered to be necessary. In concert
with the relevant authorities, the permit series
(every fortnight) were substituted by a more
extensive survey over a larger area along the
coast, but limited to three campaigns per year
in which 100 points would be investigated.
The extent of the area was, amongst other
considerations, determined by the initial
mathematical modelling of the Environmental
Impact Assessment (EIA).
22 Terra et Aqua | Number 130 | March 2013
Figure 3. Set-up of silt measurements based on the scenario calculations (EIA, upper limit approach) The survey extent
includes affected and non-affected (control) areas.
Figure 4. Left, Sailing behind a working TSHD (Ostsee). Right, Example of the measurements (TSM - total suspended matter) following the TSHD Volvox Terra Nova. In the TSM
records the active and the surface plumes are clearly visible. The red line is the path of the Terra Nova, the blue line is the track of the BRA-7, the survey vessel. The diagrams on
the bottom left side indicate the current speed and direction taken from the ADCP.
Sampling near Terra Nova 2009/7/29
TSM Average TSM Average TSM Average
Silt survey (2007)(randomised pattern)
100 points / 20 lines(perpendicular to the coast)
(~30 x 150 km2)
Borrow areas Rotterdam
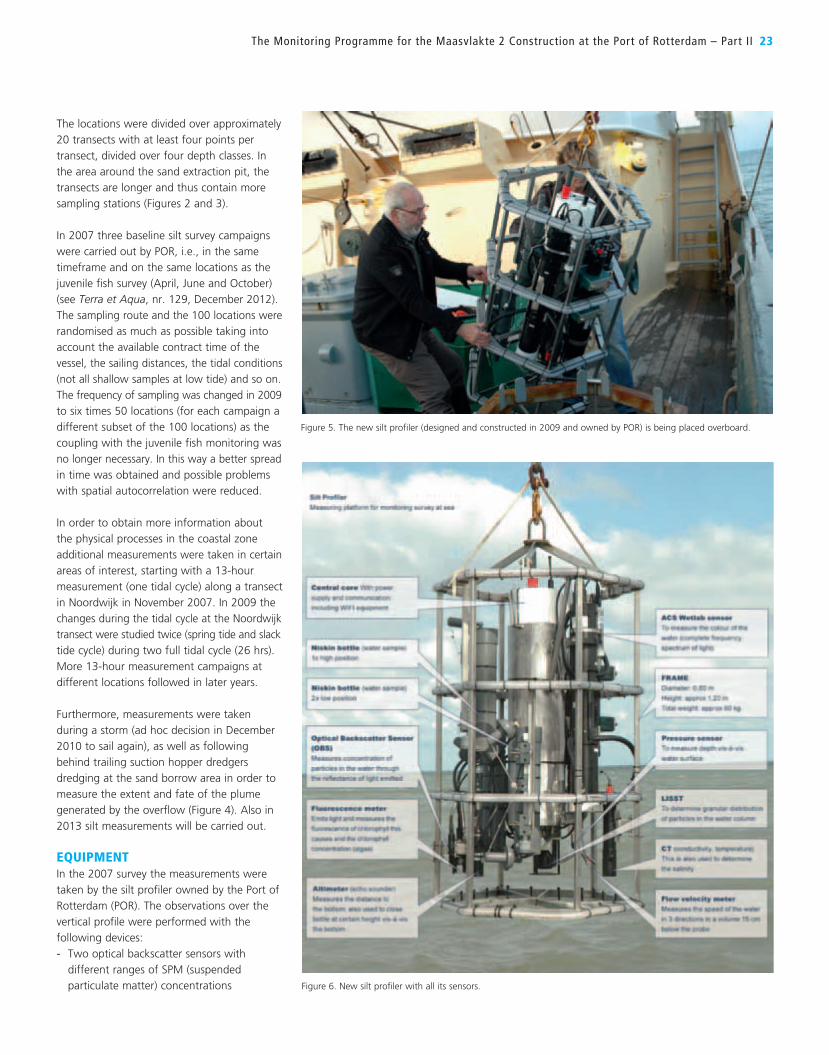
The Monitoring Programme for the Maasvlakte 2 Construction at the Port of Rotterdam – Part II 23
The locations were divided over approximately
20 transects with at least four points per
transect, divided over four depth classes. In
the area around the sand extraction pit, the
transects are longer and thus contain more
sampling stations (Figures 2 and 3).
In 2007 three baseline silt survey campaigns
were carried out by POR, i.e., in the same
timeframe and on the same locations as the
juvenile fish survey (April, June and October)
(see Terra et Aqua, nr. 129, December 2012).
The sampling route and the 100 locations were
randomised as much as possible taking into
account the available contract time of the
vessel, the sailing distances, the tidal conditions
(not all shallow samples at low tide) and so on.
The frequency of sampling was changed in 2009
to six times 50 locations (for each campaign a
different subset of the 100 locations) as the
coupling with the juvenile fish monitoring was
no longer necessary. In this way a better spread
in time was obtained and possible problems
with spatial autocorrelation were reduced.
In order to obtain more information about
the physical processes in the coastal zone
additional measurements were taken in certain
areas of interest, starting with a 13-hour
measurement (one tidal cycle) along a transect
in Noordwijk in November 2007. In 2009 the
changes during the tidal cycle at the Noordwijk
transect were studied twice (spring tide and slack
tide cycle) during two full tidal cycle (26 hrs).
More 13-hour measurement campaigns at
different locations followed in later years.
Furthermore, measurements were taken
during a storm (ad hoc decision in December
2010 to sail again), as well as following
behind trailing suction hopper dredgers
dredging at the sand borrow area in order to
measure the extent and fate of the plume
generated by the overflow (Figure 4). Also in
2013 silt measurements will be carried out.
eQUIPMent In the 2007 survey the measurements were
taken by the silt profiler owned by the Port of
Rotterdam (POR). The observations over the
vertical profile were performed with the
following devices:
- Two optical backscatter sensors with
different ranges of SPM (suspended
particulate matter) concentrations
Figure 5. The new silt profiler (designed and constructed in 2009 and owned by POR) is being placed overboard.
Figure 6. New silt profiler with all its sensors.
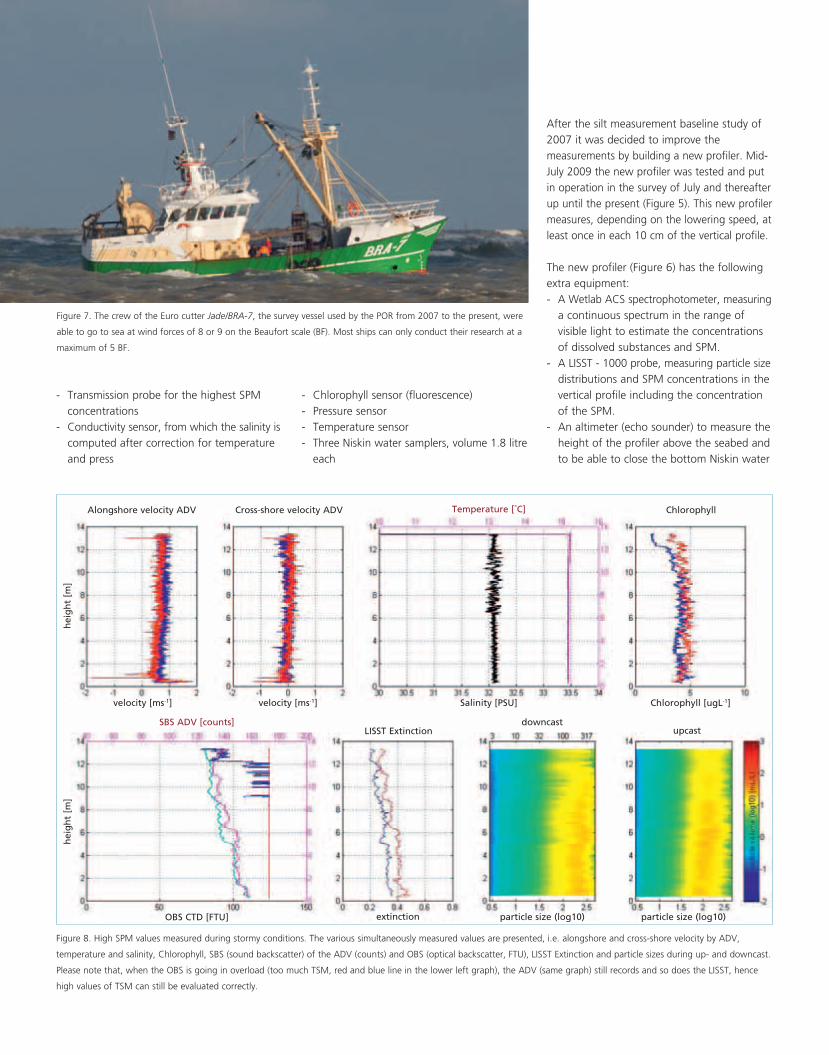
24 Terra et Aqua | Number 130 | March 2013
- Transmission probe for the highest SPM
concentrations
- Conductivity sensor, from which the salinity is
computed after correction for temperature
and press
- Chlorophyll sensor (fluorescence)
- Pressure sensor
- Temperature sensor
- Three Niskin water samplers, volume 1.8 litre
each
After the silt measurement baseline study of
2007 it was decided to improve the
measurements by building a new profiler. Mid-
July 2009 the new profiler was tested and put
in operation in the survey of July and thereafter
up until the present (Figure 5). This new profiler
measures, depending on the lowering speed, at
least once in each 10 cm of the vertical profile.
The new profiler (Figure 6) has the following
extra equipment:
- A Wetlab ACS spectrophotometer, measuring
a continuous spectrum in the range of
visible light to estimate the concentrations
of dissolved substances and SPM.
- A LISST - 1000 probe, measuring particle size
distributions and SPM concentrations in the
vertical profile including the concentration
of the SPM.
- An altimeter (echo sounder) to measure the
height of the profiler above the seabed and
to be able to close the bottom Niskin water
Figure 7. The crew of the Euro cutter Jade/BRA-7, the survey vessel used by the POR from 2007 to the present, were
able to go to sea at wind forces of 8 or 9 on the Beaufort scale (BF). Most ships can only conduct their research at a
maximum of 5 BF.
Figure 8. High SPM values measured during stormy conditions. The various simultaneously measured values are presented, i.e. alongshore and cross-shore velocity by ADV,
temperature and salinity, Chlorophyll, SBS (sound backscatter) of the ADV (counts) and OBS (optical backscatter, FTU), LISST Extinction and particle sizes during up- and downcast.
Please note that, when the OBS is going in overload (too much TSM, red and blue line in the lower left graph), the ADV (same graph) still records and so does the LISST, hence
high values of TSM can still be evaluated correctly.
Alongshore velocity ADV Cross-shore velocity ADV Temperature [˚C] Chlorophyll
velocity [ms-1] velocity [ms-1] Salinity [PSU] Chlorophyll [ugL-1]
SBS ADV [counts]LISST Extinction
downcastupcast
OBS CTD [FTU] extinction particle size (log10) particle size (log10)
hei
gh
t [m
]h
eig
ht
[m]
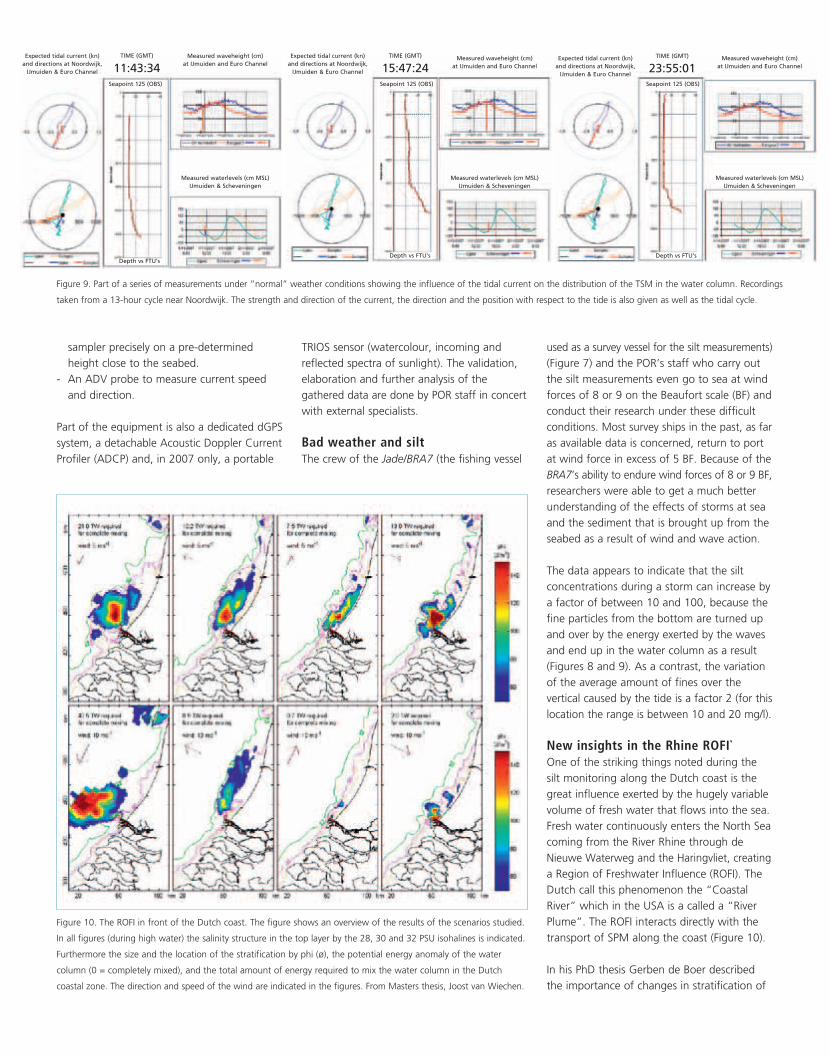
sampler precisely on a pre-determined
height close to the seabed.
- An ADV probe to measure current speed
and direction.
Part of the equipment is also a dedicated dGPS
system, a detachable Acoustic Doppler Current
Profiler (ADCP) and, in 2007 only, a portable
TRIOS sensor (watercolour, incoming and
reflected spectra of sunlight). The validation,
elaboration and further analysis of the
gathered data are done by POR staff in concert
with external specialists.
Bad weather and siltThe crew of the Jade/BRA7 (the fishing vessel
used as a survey vessel for the silt measurements)
(Figure 7) and the POR’s staff who carry out
the silt measurements even go to sea at wind
forces of 8 or 9 on the Beaufort scale (BF) and
conduct their research under these difficult
conditions. Most survey ships in the past, as far
as available data is concerned, return to port
at wind force in excess of 5 BF. Because of the
BRA7’s ability to endure wind forces of 8 or 9 BF,
researchers were able to get a much better
understanding of the effects of storms at sea
and the sediment that is brought up from the
seabed as a result of wind and wave action.
The data appears to indicate that the silt
concentrations during a storm can increase by
a factor of between 10 and 100, because the
fine particles from the bottom are turned up
and over by the energy exerted by the waves
and end up in the water column as a result
(Figures 8 and 9). As a contrast, the variation
of the average amount of fines over the vertical caused by the tide is a factor 2 (for this
location the range is between 10 and 20 mg/l).
New insights in the Rhine ROFI`One of the striking things noted during the
silt monitoring along the Dutch coast is the
great influence exerted by the hugely variable
volume of fresh water that flows into the sea.
Fresh water continuously enters the North Sea
coming from the River Rhine through de
Nieuwe Waterweg and the Haringvliet, creating
a Region of Freshwater Influence (ROFI). The
Dutch call this phenomenon the “Coastal
River” which in the USA is a called a “River
Plume”. The ROFI interacts directly with the
transport of SPM along the coast (Figure 10).
In his PhD thesis Gerben de Boer described
the importance of changes in stratification of
Figure 9. Part of a series of measurements under ”normal” weather conditions showing the influence of the tidal current on the distribution of the TSM in the water column. Recordings
taken from a 13-hour cycle near Noordwijk. The strength and direction of the current, the direction and the position with respect to the tide is also given as well as the tidal cycle.
Figure 10. The ROFI in front of the Dutch coast. The figure shows an overview of the results of the scenarios studied.
In all figures (during high water) the salinity structure in the top layer by the 28, 30 and 32 PSU isohalines is indicated.
Furthermore the size and the location of the stratification by phi (ø), the potential energy anomaly of the water
column (0 = completely mixed), and the total amount of energy required to mix the water column in the Dutch
coastal zone. The direction and speed of the wind are indicated in the figures. From Masters thesis, Joost van Wiechen.
Expected tidal current (kn) and directions at Noordwijk,
IJmuiden & Euro Channel
Expected tidal current (kn) and directions at Noordwijk,
IJmuiden & Euro Channel
Expected tidal current (kn) and directions at Noordwijk,
IJmuiden & Euro Channel
Measured waveheight (cm)at IJmuiden and Euro Channel
Measured waveheight (cm)at IJmuiden and Euro Channel
Measured waveheight (cm)at IJmuiden and Euro Channel
Seapoint 125 (OBS)Seapoint 125 (OBS)Seapoint 125 (OBS)
TIME (GMT)
11:43:34
Measured waterlevels (cm MSL)IJmuiden & Scheveningen
Measured waterlevels (cm MSL)IJmuiden & Scheveningen
Measured waterlevels (cm MSL)IJmuiden & Scheveningen
Depth vs FTU’sDepth vs FTU’sDepth vs FTU’s
TIME (GMT)
15:47:24TIME (GMT)
23:55:01
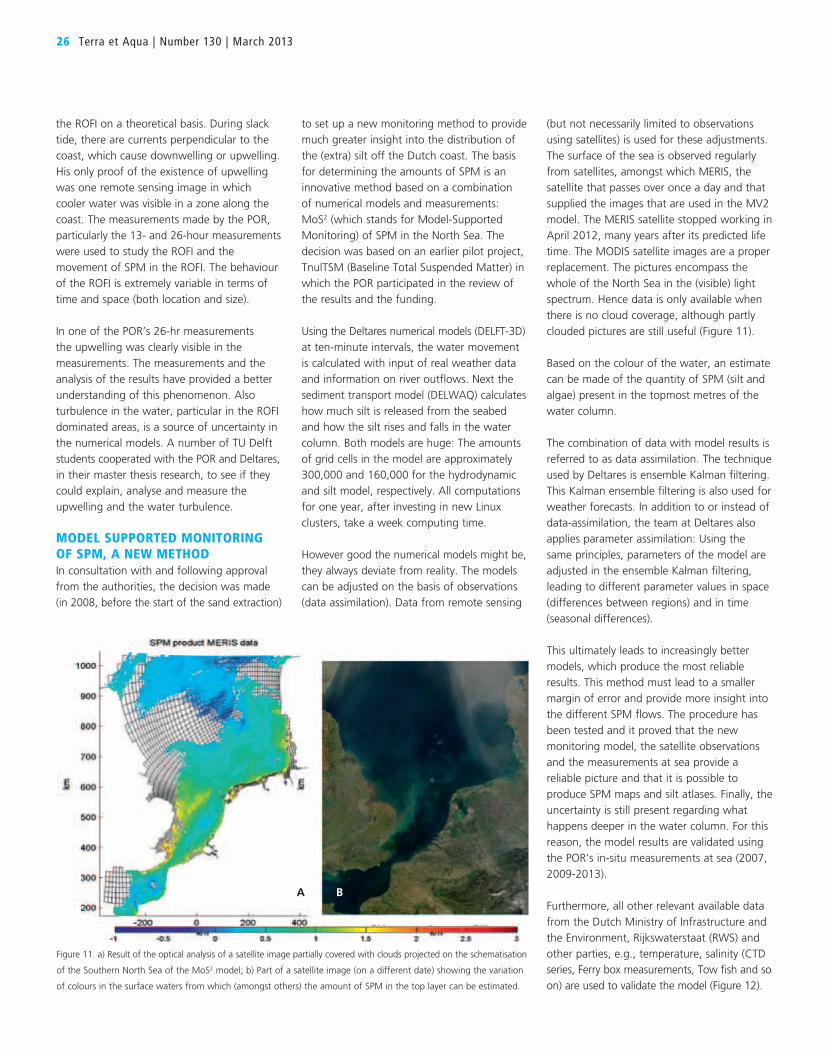
26 Terra et Aqua | Number 130 | March 2013
the ROFI on a theoretical basis. During slack
tide, there are currents perpendicular to the
coast, which cause downwelling or upwelling.
His only proof of the existence of upwelling
was one remote sensing image in which
cooler water was visible in a zone along the
coast. The measurements made by the POR,
particularly the 13- and 26-hour measurements
were used to study the ROFI and the
movement of SPM in the ROFI. The behaviour
of the ROFI is extremely variable in terms of
time and space (both location and size).
In one of the POR’s 26-hr measurements
the upwelling was clearly visible in the
measurements. The measurements and the
analysis of the results have provided a better
understanding of this phenomenon. Also
turbulence in the water, particular in the ROFI
dominated areas, is a source of uncertainty in
the numerical models. A number of TU Delft students cooperated with the POR and Deltares,
in their master thesis research, to see if they
could explain, analyse and measure the
upwelling and the water turbulence.
MoDeL sUPPoRteD MonItoRInG oF sPM, A neW MetHoDIn consultation with and following approval
from the authorities, the decision was made
(in 2008, before the start of the sand extraction)
to set up a new monitoring method to provide
much greater insight into the distribution of
the (extra) silt off the Dutch coast. The basis
for determining the amounts of SPM is an
innovative method based on a combination
of numerical models and measurements:
MoS2 (which stands for Model-Supported
Monitoring) of SPM in the North Sea. The
decision was based on an earlier pilot project,
TnulTSM (Baseline Total Suspended Matter) in
which the POR participated in the review of
the results and the funding.
Using the Deltares numerical models (DELFT-3D)
at ten-minute intervals, the water movement
is calculated with input of real weather data
and information on river outflows. Next the
sediment transport model (DELWAQ) calculates
how much silt is released from the seabed
and how the silt rises and falls in the water
column. Both models are huge: The amounts
of grid cells in the model are approximately
300,000 and 160,000 for the hydrodynamic
and silt model, respectively. All computations
for one year, after investing in new Linux
clusters, take a week computing time.
However good the numerical models might be,
they always deviate from reality. The models
can be adjusted on the basis of observations
(data assimilation). Data from remote sensing
(but not necessarily limited to observations
using satellites) is used for these adjustments.
The surface of the sea is observed regularly
from satellites, amongst which MERIS, the
satellite that passes over once a day and that
supplied the images that are used in the MV2
model. The MERIS satellite stopped working in
April 2012, many years after its predicted life
time. The MODIS satellite images are a proper
replacement. The pictures encompass the
whole of the North Sea in the (visible) light
spectrum. Hence data is only available when
there is no cloud coverage, although partly
clouded pictures are still useful (Figure 11).
Based on the colour of the water, an estimate
can be made of the quantity of SPM (silt and
algae) present in the topmost metres of the
water column.
The combination of data with model results is
referred to as data assimilation. The technique
used by Deltares is ensemble Kalman filtering.
This Kalman ensemble filtering is also used for
weather forecasts. In addition to or instead of
data-assimilation, the team at Deltares also
applies parameter assimilation: Using the
same principles, parameters of the model are
adjusted in the ensemble Kalman filtering,
leading to different parameter values in space
(differences between regions) and in time
(seasonal differences).
This ultimately leads to increasingly better
models, which produce the most reliable
results. This method must lead to a smaller
margin of error and provide more insight into
the different SPM flows. The procedure has
been tested and it proved that the new
monitoring model, the satellite observations
and the measurements at sea provide a
reliable picture and that it is possible to
produce SPM maps and silt atlases. Finally, the
uncertainty is still present regarding what
happens deeper in the water column. For this
reason, the model results are validated using
the POR’s in-situ measurements at sea (2007,
2009-2013).
Furthermore, all other relevant available data
from the Dutch Ministry of Infrastructure and
the Environment, Rijkswaterstaat (RWS) and
other parties, e.g., temperature, salinity (CTD series, Ferry box measurements, Tow fish and so
on) are used to validate the model (Figure 12).
Figure 11. a) Result of the optical analysis of a satellite image partially covered with clouds projected on the schematisation
of the Southern North Sea of the MoS2 model; b) Part of a satellite image (on a different date) showing the variation
of colours in the surface waters from which (amongst others) the amount of SPM in the top layer can be estimated.
A B
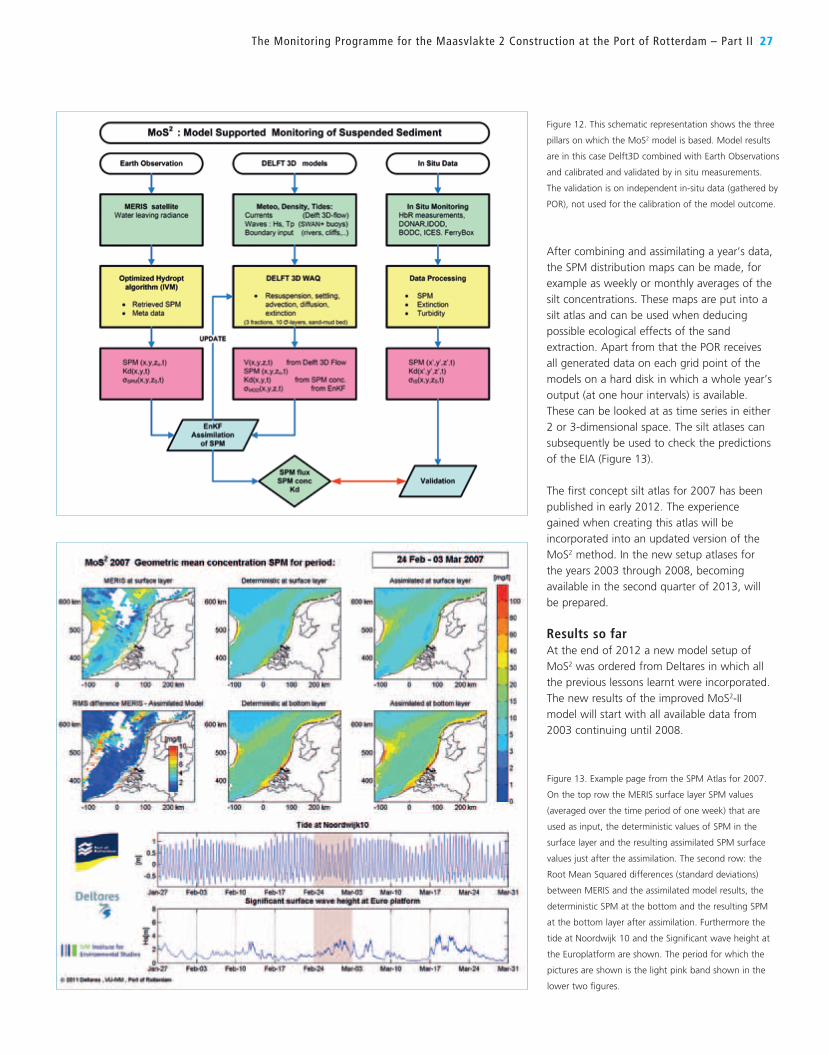
After combining and assimilating a year’s data,
the SPM distribution maps can be made, for
example as weekly or monthly averages of the
silt concentrations. These maps are put into a
silt atlas and can be used when deducing
possible ecological effects of the sand
extraction. Apart from that the POR receives
all generated data on each grid point of the
models on a hard disk in which a whole year’s
output (at one hour intervals) is available.
These can be looked at as time series in either
2 or 3-dimensional space. The silt atlases can
subsequently be used to check the predictions
of the EIA (Figure 13).
The first concept silt atlas for 2007 has been
published in early 2012. The experience
gained when creating this atlas will be
incorporated into an updated version of the
MoS2 method. In the new setup atlases for
the years 2003 through 2008, becoming
available in the second quarter of 2013, will
be prepared.
Results so farAt the end of 2012 a new model setup of
MoS2 was ordered from Deltares in which all
the previous lessons learnt were incorporated.
The new results of the improved MoS2-II
model will start with all available data from
2003 continuing until 2008.
The Monitoring Programme for the Maasvlakte 2 Construction at the Port of Rotterdam – Part II 27
Figure 12. This schematic representation shows the three
pillars on which the MoS2 model is based. Model results
are in this case Delft3D combined with Earth Observations
and calibrated and validated by in situ measurements.
The validation is on independent in-situ data (gathered by
POR), not used for the calibration of the model outcome.
Figure 13. Example page from the SPM Atlas for 2007.
On the top row the MERIS surface layer SPM values
(averaged over the time period of one week) that are
used as input, the deterministic values of SPM in the
surface layer and the resulting assimilated SPM surface
values just after the assimilation. The second row: the
Root Mean Squared differences (standard deviations)
between MERIS and the assimilated model results, the
deterministic SPM at the bottom and the resulting SPM
at the bottom layer after assimilation. Furthermore the
tide at Noordwijk 10 and the Significant wave height at
the Europlatform are shown. The period for which the
pictures are shown is the light pink band shown in the
lower two figures.
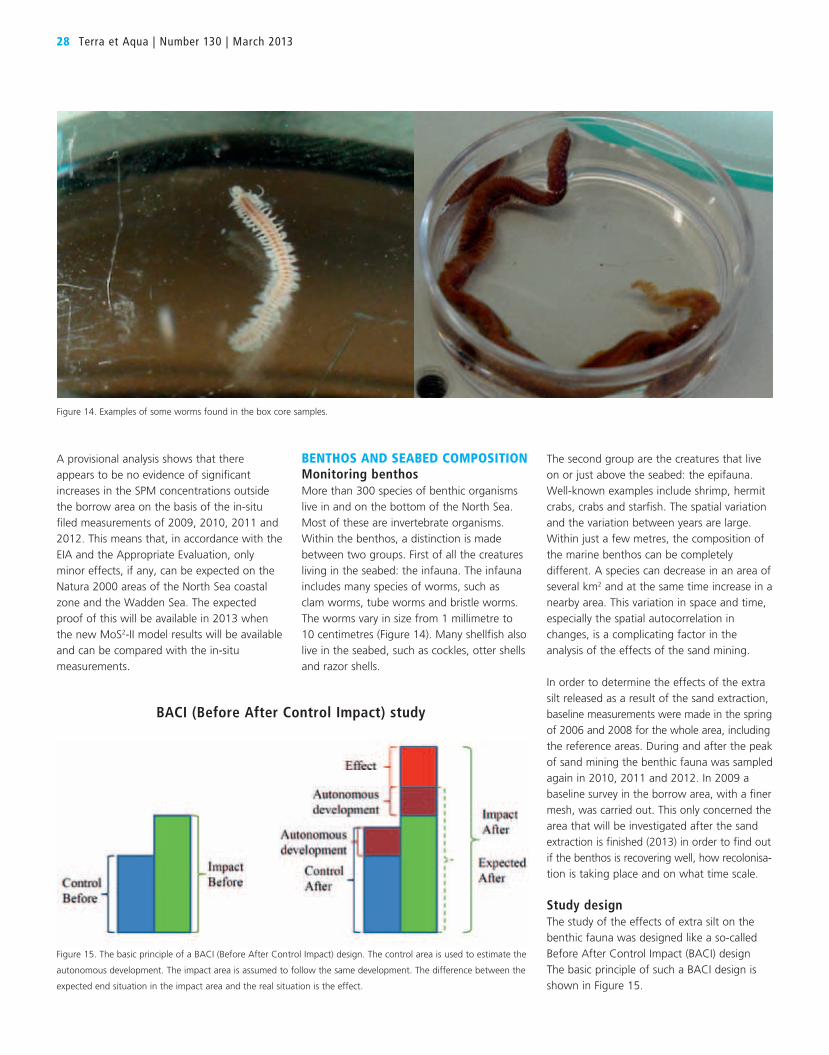
28 Terra et Aqua | Number 130 | March 2013
The second group are the creatures that live
on or just above the seabed: the epifauna.
Well-known examples include shrimp, hermit
crabs, crabs and starfish. The spatial variation
and the variation between years are large.
Within just a few metres, the composition of
the marine benthos can be completely
different. A species can decrease in an area of
several km2 and at the same time increase in a
nearby area. This variation in space and time,
especially the spatial autocorrelation in
changes, is a complicating factor in the
analysis of the effects of the sand mining.
In order to determine the effects of the extra
silt released as a result of the sand extraction,
baseline measurements were made in the spring
of 2006 and 2008 for the whole area, including
the reference areas. During and after the peak
of sand mining the benthic fauna was sampled
again in 2010, 2011 and 2012. In 2009 a
baseline survey in the borrow area, with a finer
mesh, was carried out. This only concerned the
area that will be investigated after the sand
extraction is finished (2013) in order to find out
if the benthos is recovering well, how recolonisa-
tion is taking place and on what time scale.
Study designThe study of the effects of extra silt on the
benthic fauna was designed like a so-called
Before After Control Impact (BACI) design
The basic principle of such a BACI design is
shown in Figure 15.
A provisional analysis shows that there
appears to be no evidence of significant
increases in the SPM concentrations outside
the borrow area on the basis of the in-situ
filed measurements of 2009, 2010, 2011 and
2012. This means that, in accordance with the
EIA and the Appropriate Evaluation, only
minor effects, if any, can be expected on the
Natura 2000 areas of the North Sea coastal
zone and the Wadden Sea. The expected
proof of this will be available in 2013 when
the new MoS2-II model results will be available
and can be compared with the in-situ
measurements.
BentHos AnD seABeD coMPosItIonMonitoring benthosMore than 300 species of benthic organisms
live in and on the bottom of the North Sea.
Most of these are invertebrate organisms.
Within the benthos, a distinction is made
between two groups. First of all the creatures
living in the seabed: the infauna. The infauna
includes many species of worms, such as
clam worms, tube worms and bristle worms.
The worms vary in size from 1 millimetre to
10 centimetres (Figure 14). Many shellfish also
live in the seabed, such as cockles, otter shells
and razor shells.
BACI (Before After Control Impact) study
Figure 15. The basic principle of a BACI (Before After Control Impact) design. The control area is used to estimate the
autonomous development. The impact area is assumed to follow the same development. The difference between the
expected end situation in the impact area and the real situation is the effect.
Figure 14. Examples of some worms found in the box core samples.
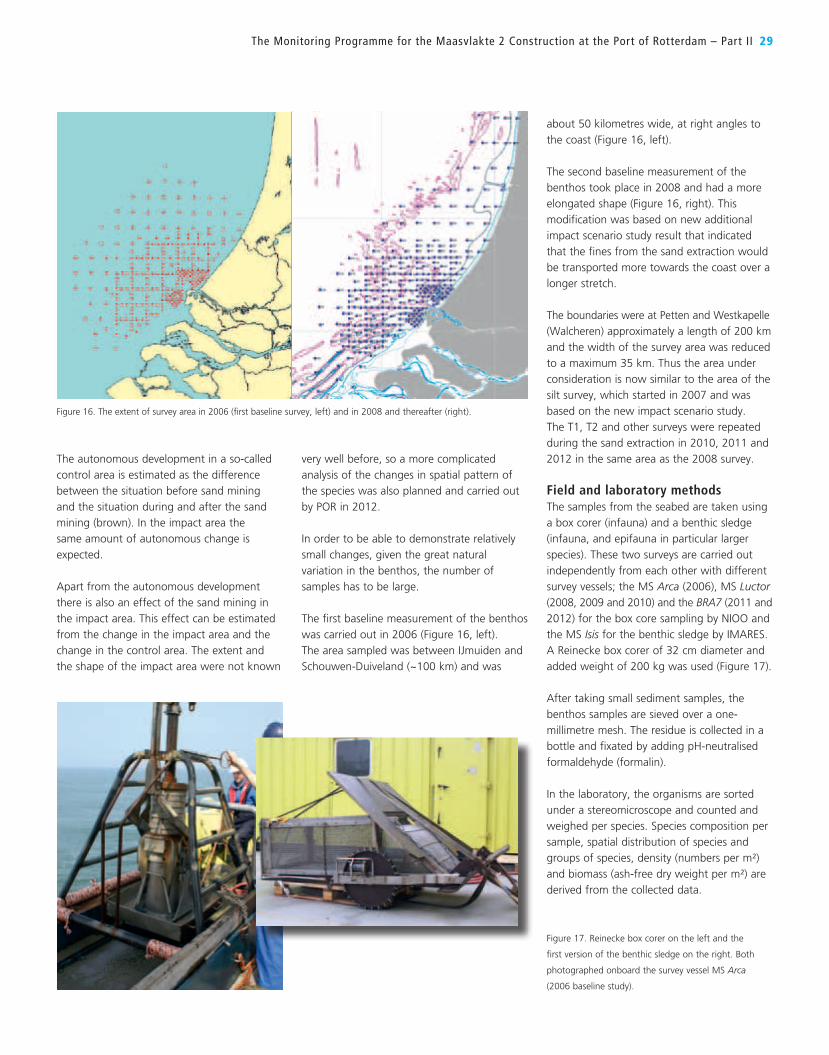
The Monitoring Programme for the Maasvlakte 2 Construction at the Port of Rotterdam – Part II 29
The autonomous development in a so-called
control area is estimated as the difference
between the situation before sand mining
and the situation during and after the sand
mining (brown). In the impact area the
same amount of autonomous change is
expected.
Apart from the autonomous development
there is also an effect of the sand mining in
the impact area. This effect can be estimated
from the change in the impact area and the
change in the control area. The extent and
the shape of the impact area were not known
very well before, so a more complicated
analysis of the changes in spatial pattern of
the species was also planned and carried out
by POR in 2012.
In order to be able to demonstrate relatively
small changes, given the great natural
variation in the benthos, the number of
samples has to be large.
The first baseline measurement of the benthos
was carried out in 2006 (Figure 16, left).
The area sampled was between IJmuiden and
Schouwen-Duiveland (~100 km) and was
about 50 kilometres wide, at right angles to
the coast (Figure 16, left).
The second baseline measurement of the
benthos took place in 2008 and had a more
elongated shape (Figure 16, right). This
modification was based on new additional
impact scenario study result that indicated
that the fines from the sand extraction would
be transported more towards the coast over a
longer stretch.
The boundaries were at Petten and Westkapelle
(Walcheren) approximately a length of 200 km
and the width of the survey area was reduced
to a maximum 35 km. Thus the area under
consideration is now similar to the area of the
silt survey, which started in 2007 and was
based on the new impact scenario study.
The T1, T2 and other surveys were repeated
during the sand extraction in 2010, 2011 and
2012 in the same area as the 2008 survey.
Field and laboratory methodsThe samples from the seabed are taken using
a box corer (infauna) and a benthic sledge
(infauna, and epifauna in particular larger
species). These two surveys are carried out
independently from each other with different
survey vessels; the MS Arca (2006), MS Luctor (2008, 2009 and 2010) and the BRA7 (2011 and
2012) for the box core sampling by NIOO and
the MS Isis for the benthic sledge by IMARES.
A Reinecke box corer of 32 cm diameter and
added weight of 200 kg was used (Figure 17).
After taking small sediment samples, the
benthos samples are sieved over a one-
millimetre mesh. The residue is collected in a
bottle and fixated by adding pH-neutralised
formaldehyde (formalin).
In the laboratory, the organisms are sorted
under a stereomicroscope and counted and
weighed per species. Species composition per
sample, spatial distribution of species and
groups of species, density (numbers per m²)
and biomass (ash-free dry weight per m²) are
derived from the collected data.
Figure 16. The extent of survey area in 2006 (first baseline survey, left) and in 2008 and thereafter (right).
Figure 17. Reinecke box corer on the left and the
first version of the benthic sledge on the right. Both
photographed onboard the survey vessel MS Arca
(2006 baseline study).
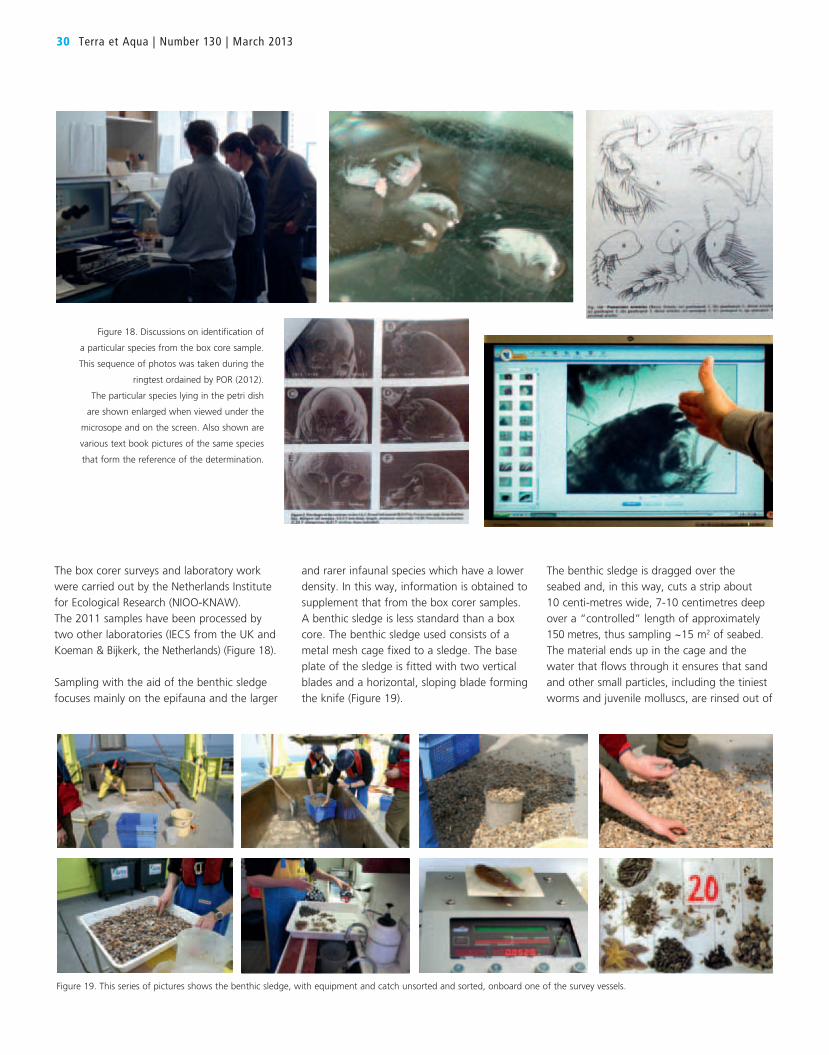
30 Terra et Aqua | Number 130 | March 2013
The box corer surveys and laboratory work
were carried out by the Netherlands Institute
for Ecological Research (NIOO-KNAW).
The 2011 samples have been processed by
two other laboratories (IECS from the UK and
Koeman & Bijkerk, the Netherlands) (Figure 18).
Sampling with the aid of the benthic sledge
focuses mainly on the epifauna and the larger
and rarer infaunal species which have a lower
density. In this way, information is obtained to
supplement that from the box corer samples.
A benthic sledge is less standard than a box
core. The benthic sledge used consists of a
metal mesh cage fixed to a sledge. The base
plate of the sledge is fitted with two vertical
blades and a horizontal, sloping blade forming
the knife (Figure 19).
The benthic sledge is dragged over the
seabed and, in this way, cuts a strip about
10 centi-metres wide, 7-10 centimetres deep
over a “controlled” length of approximately
150 metres, thus sampling ~15 m2 of seabed.
The material ends up in the cage and the
water that flows through it ensures that sand
and other small particles, including the tiniest
worms and juvenile molluscs, are rinsed out of
Figure 18. Discussions on identification of
a particular species from the box core sample.
This sequence of photos was taken during the
ringtest ordained by POR (2012).
The particular species lying in the petri dish
are shown enlarged when viewed under the
microsope and on the screen. Also shown are
various text book pictures of the same species
that form the reference of the determination.
Figure 19. This series of pictures shows the benthic sledge, with equipment and catch unsorted and sorted, onboard one of the survey vessels.
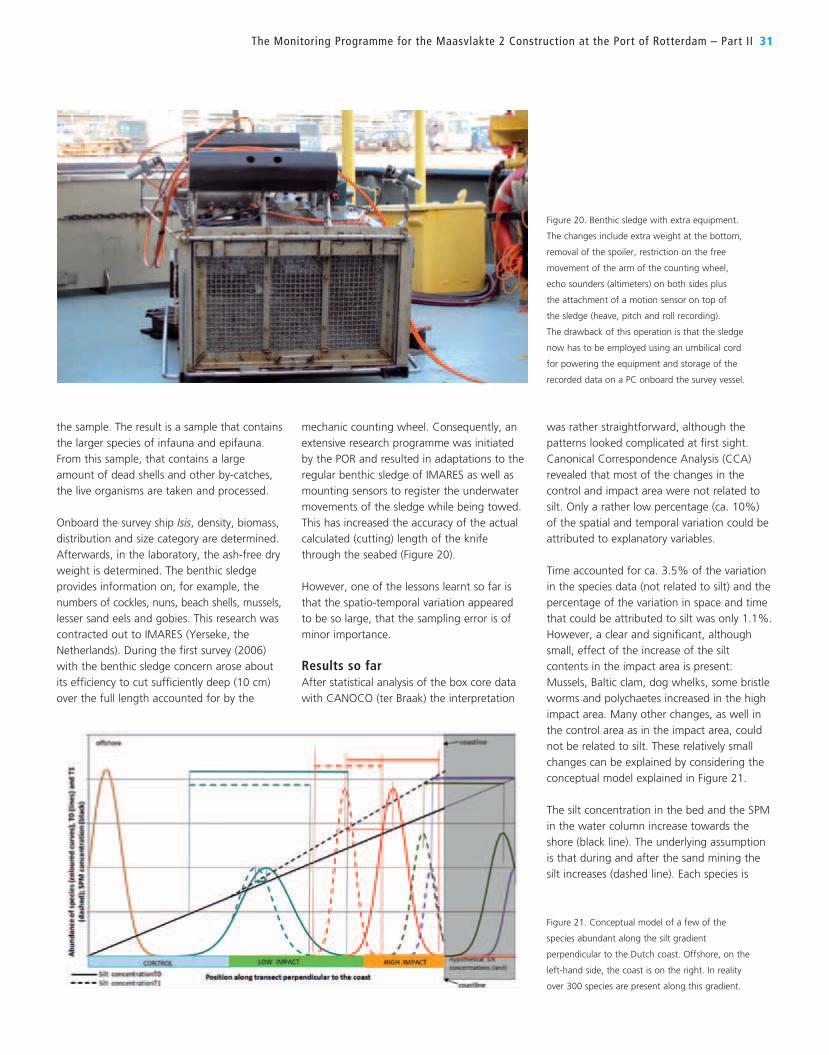
The Monitoring Programme for the Maasvlakte 2 Construction at the Port of Rotterdam – Part II 31
the sample. The result is a sample that contains
the larger species of infauna and epifauna.
From this sample, that contains a large
amount of dead shells and other by-catches,
the live organisms are taken and processed.
Onboard the survey ship Isis, density, biomass,
distribution and size category are determined.
Afterwards, in the laboratory, the ash-free dry
weight is determined. The benthic sledge
provides information on, for example, the
numbers of cockles, nuns, beach shells, mussels,
lesser sand eels and gobies. This research was
contracted out to IMARES (Yerseke, the
Netherlands). During the first survey (2006)
with the benthic sledge concern arose about
its efficiency to cut sufficiently deep (10 cm)
over the full length accounted for by the
mechanic counting wheel. Consequently, an
extensive research programme was initiated
by the POR and resulted in adaptations to the
regular benthic sledge of IMARES as well as
mounting sensors to register the underwater
movements of the sledge while being towed.
This has increased the accuracy of the actual
calculated (cutting) length of the knife
through the seabed (Figure 20).
However, one of the lessons learnt so far is
that the spatio-temporal variation appeared
to be so large, that the sampling error is of
minor importance.
Results so farAfter statistical analysis of the box core data
with CANOCO (ter Braak) the interpretation
was rather straightforward, although the
patterns looked complicated at first sight.
Canonical Correspondence Analysis (CCA)
revealed that most of the changes in the
control and impact area were not related to
silt. Only a rather low percentage (ca. 10%)
of the spatial and temporal variation could be
attributed to explanatory variables.
Time accounted for ca. 3.5% of the variation
in the species data (not related to silt) and the
percentage of the variation in space and time
that could be attributed to silt was only 1.1%.
However, a clear and significant, although
small, effect of the increase of the silt
contents in the impact area is present:
Mussels, Baltic clam, dog whelks, some bristle
worms and polychaetes increased in the high
impact area. Many other changes, as well in
the control area as in the impact area, could
not be related to silt. These relatively small
changes can be explained by considering the
conceptual model explained in Figure 21.
The silt concentration in the bed and the SPM
in the water column increase towards the
shore (black line). The underlying assumption
is that during and after the sand mining the
silt increases (dashed line). Each species is
Figure 20. Benthic sledge with extra equipment.
The changes include extra weight at the bottom,
removal of the spoiler, restriction on the free
movement of the arm of the counting wheel,
echo sounders (altimeters) on both sides plus
the attachment of a motion sensor on top of
the sledge (heave, pitch and roll recording).
The drawback of this operation is that the sledge
now has to be employed using an umbilical cord
for powering the equipment and storage of the
recorded data on a PC onboard the survey vessel.
Figure 21. Conceptual model of a few of the
species abundant along the silt gradient
perpendicular to the Dutch coast. Offshore, on the
left-hand side, the coast is on the right. In reality
over 300 species are present along this gradient.
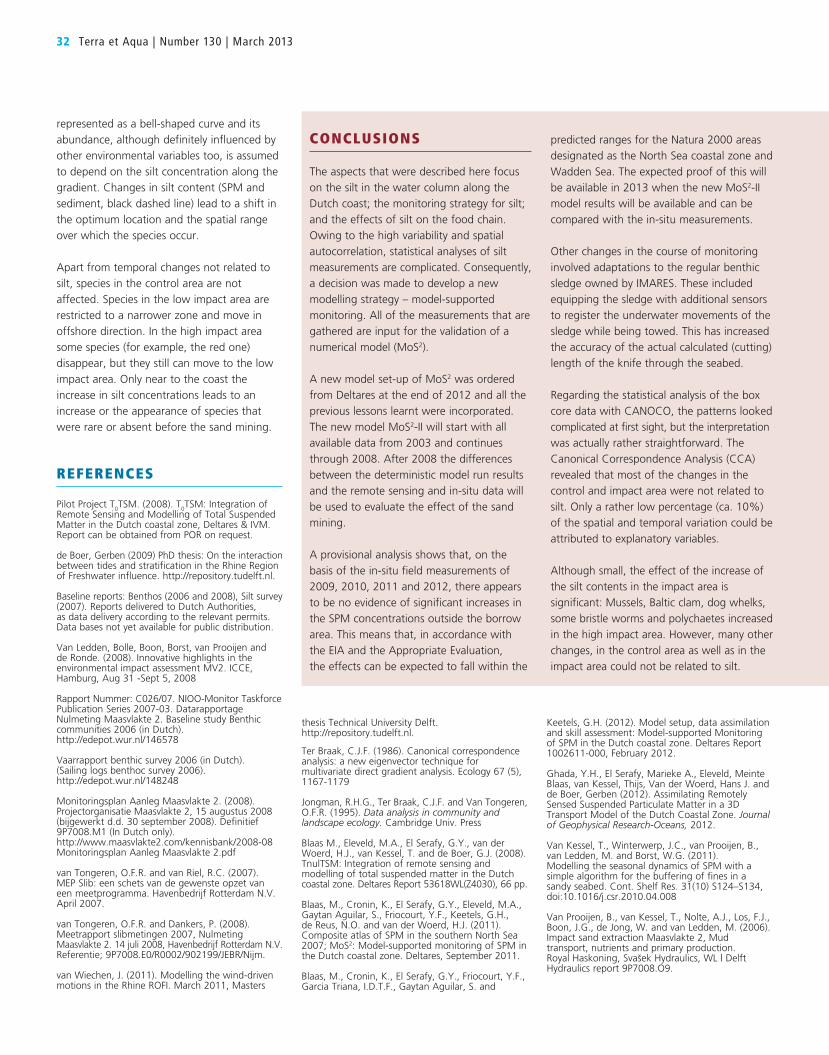
32 Terra et Aqua | Number 130 | March 2013
represented as a bell-shaped curve and its
abundance, although definitely influenced by
other environmental variables too, is assumed
to depend on the silt concentration along the
gradient. Changes in silt content (SPM and
sediment, black dashed line) lead to a shift in
the optimum location and the spatial range
over which the species occur.
Apart from temporal changes not related to
silt, species in the control area are not
affected. Species in the low impact area are
restricted to a narrower zone and move in
offshore direction. In the high impact area
some species (for example, the red one)
disappear, but they still can move to the low
impact area. Only near to the coast the
increase in silt concentrations leads to an
increase or the appearance of species that
were rare or absent before the sand mining.
REFERENCES
Pilot Project T0TSM. (2008). T
0TSM: Integration of
Remote Sensing and Modelling of Total Suspended Matter in the Dutch coastal zone, Deltares & IVM. Report can be obtained from POR on request.
de Boer, Gerben (2009) PhD thesis: On the interaction between tides and stratification in the Rhine Region of Freshwater influence. http://repository.tudelft.nl.
Baseline reports: Benthos (2006 and 2008), Silt survey (2007). Reports delivered to Dutch Authorities, as data delivery according to the relevant permits. Data bases not yet available for public distribution.
Van Ledden, Bolle, Boon, Borst, van Prooijen and de Ronde. (2008). Innovative highlights in the environmental impact assessment MV2. ICCE, Hamburg, Aug 31 -Sept 5, 2008
Rapport Nummer: C026/07. NIOO-Monitor Taskforce Publication Series 2007-03. Datarapportage Nulmeting Maasvlakte 2. Baseline study Benthic communities 2006 (in Dutch). http://edepot.wur.nl/146578
Vaarrapport benthic survey 2006 (in Dutch). (Sailing logs benthoc survey 2006). http://edepot.wur.nl/148248
Monitoringsplan Aanleg Maasvlakte 2. (2008). Projectorganisatie Maasvlakte 2, 15 augustus 2008 (bijgewerkt d.d. 30 september 2008). Definitief 9P7008.M1 (In Dutch only).http://www.maasvlakte2.com/kennisbank/2008-08 Monitoringsplan Aanleg Maasvlakte 2.pdf
van Tongeren, O.F.R. and van Riel, R.C. (2007). MEP Slib: een schets van de gewenste opzet van een meetprogramma. Havenbedrijf Rotterdam N.V. April 2007.
van Tongeren, O.F.R. and Dankers, P. (2008). Meetrapport slibmetingen 2007, Nulmeting Maasvlakte 2. 14 juli 2008, Havenbedrijf Rotterdam N.V. Referentie; 9P7008.E0/R0002/902199/JEBR/Nijm.
van Wiechen, J. (2011). Modelling the wind-driven motions in the Rhine ROFI. March 2011, Masters
Keetels, G.H. (2012). Model setup, data assimilation and skill assessment: Model-supported Monitoring of SPM in the Dutch coastal zone. Deltares Report 1002611-000, February 2012.
Ghada, Y.H., El Serafy, Marieke A., Eleveld, Meinte Blaas, van Kessel, Thijs, Van der Woerd, Hans J. and de Boer, Gerben (2012). Assimilating Remotely Sensed Suspended Particulate Matter in a 3D Transport Model of the Dutch Coastal Zone. Journal of Geophysical Research-Oceans, 2012.
Van Kessel, T., Winterwerp, J.C., van Prooijen, B., van Ledden, M. and Borst, W.G. (2011). Modelling the seasonal dynamics of SPM with a simple algorithm for the buffering of fines in a sandy seabed. Cont. Shelf Res. 31(10) S124–S134, doi:10.1016/j.csr.2010.04.008
Van Prooijen, B., van Kessel, T., Nolte, A.J., Los, F.J., Boon, J.G., de Jong, W. and van Ledden, M. (2006). Impact sand extraction Maasvlakte 2, Mud transport, nutrients and primary production. Royal Haskoning, Svašek Hydraulics, WL | Delft Hydraulics report 9P7008.O9.
thesis Technical University Delft. http://repository.tudelft.nl.
Ter Braak, C.J.F. (1986). Canonical correspondence analysis: a new eigenvector technique for multivariate direct gradient analysis. Ecology 67 (5), 1167-1179
Jongman, R.H.G., Ter Braak, C.J.F. and Van Tongeren, O.F.R. (1995). Data analysis in community and landscape ecology. Cambridge Univ. Press
Blaas M., Eleveld, M.A., El Serafy, G.Y., van der Woerd, H.J., van Kessel, T. and de Boer, G.J. (2008). TnulTSM: Integration of remote sensing and modelling of total suspended matter in the Dutch coastal zone. Deltares Report 53618WL(Z4030), 66 pp.
Blaas, M., Cronin, K., El Serafy, G.Y., Eleveld, M.A., Gaytan Aguilar, S., Friocourt, Y.F., Keetels, G.H., de Reus, N.O. and van der Woerd, H.J. (2011). Composite atlas of SPM in the southern North Sea 2007; MoS2: Model-supported monitoring of SPM in the Dutch coastal zone. Deltares, September 2011.
Blaas, M., Cronin, K., El Serafy, G.Y., Friocourt, Y.F., Garcia Triana, I.D.T.F., Gaytan Aguilar, S. and
CONCLUSIONS
The aspects that were described here focus
on the silt in the water column along the
Dutch coast; the monitoring strategy for silt;
and the effects of silt on the food chain.
Owing to the high variability and spatial
autocorrelation, statistical analyses of silt
measurements are complicated. Consequently,
a decision was made to develop a new
modelling strategy – model-supported
monitoring. All of the measurements that are
gathered are input for the validation of a
numerical model (MoS2).
A new model set-up of MoS2 was ordered
from Deltares at the end of 2012 and all the
previous lessons learnt were incorporated.
The new model MoS2-II will start with all
available data from 2003 and continues
through 2008. After 2008 the differences
between the deterministic model run results
and the remote sensing and in-situ data will
be used to evaluate the effect of the sand
mining.
A provisional analysis shows that, on the
basis of the in-situ field measurements of
2009, 2010, 2011 and 2012, there appears
to be no evidence of significant increases in
the SPM concentrations outside the borrow
area. This means that, in accordance with
the EIA and the Appropriate Evaluation,
the effects can be expected to fall within the
predicted ranges for the Natura 2000 areas
designated as the North Sea coastal zone and
Wadden Sea. The expected proof of this will
be available in 2013 when the new MoS2-II
model results will be available and can be
compared with the in-situ measurements.
Other changes in the course of monitoring
involved adaptations to the regular benthic
sledge owned by IMARES. These included
equipping the sledge with additional sensors
to register the underwater movements of the
sledge while being towed. This has increased
the accuracy of the actual calculated (cutting)
length of the knife through the seabed.
Regarding the statistical analysis of the box
core data with CANOCO, the patterns looked complicated at first sight, but the interpretation
was actually rather straightforward. The
Canonical Correspondence Analysis (CCA)
revealed that most of the changes in the
control and impact area were not related to
silt. Only a rather low percentage (ca. 10%)
of the spatial and temporal variation could be
attributed to explanatory variables.
Although small, the effect of the increase of
the silt contents in the impact area is
significant: Mussels, Baltic clam, dog whelks,
some bristle worms and polychaetes increased
in the high impact area. However, many other
changes, in the control area as well as in the
impact area could not be related to silt.
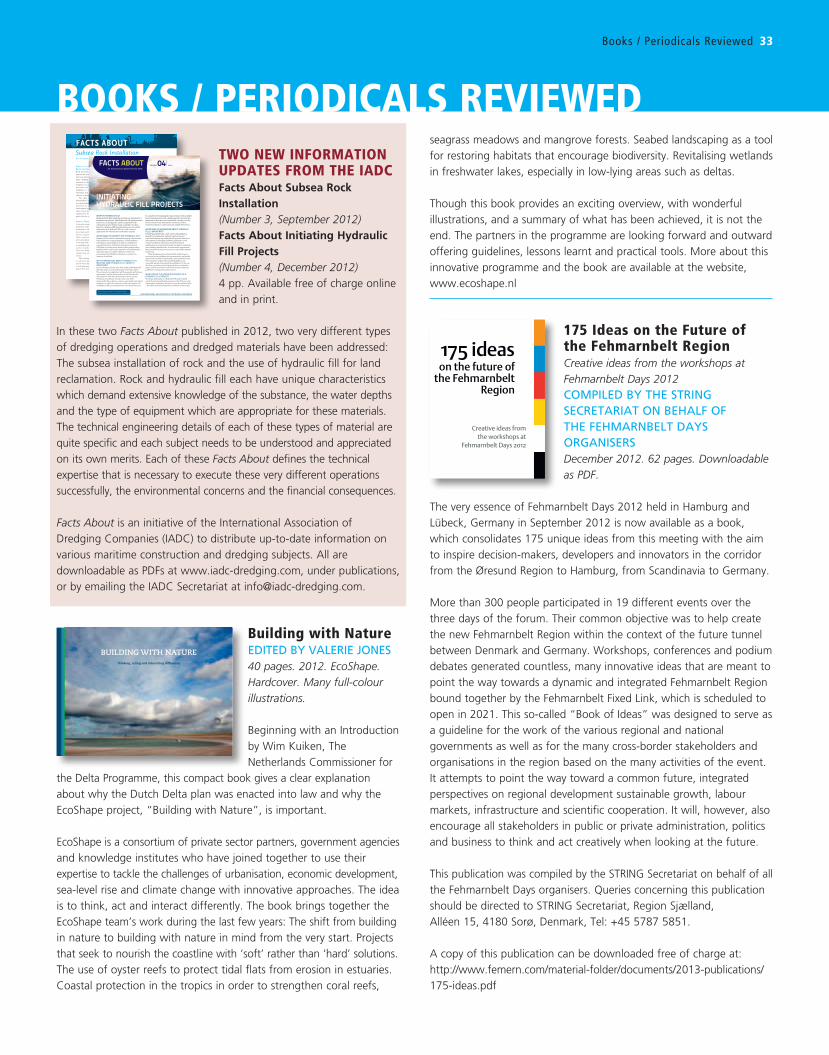
Books / Periodicals Reviewed 33
Books / PeRIoDIcALs ReVIeWeD
175 Ideas on the Future of the Fehmarnbelt Region Creative ideas from the workshops at Fehmarnbelt Days 2012COMPILED BY THE STRING SECRETARIAT ON BEHALF OF THE FEHMARNBELT DAYS ORGANISERSDecember 2012. 62 pages. Downloadable as PDF.
The very essence of Fehmarnbelt Days 2012 held in Hamburg and
Lübeck, Germany in September 2012 is now available as a book,
which consolidates 175 unique ideas from this meeting with the aim
to inspire decision-makers, developers and innovators in the corridor
from the Øresund Region to Hamburg, from Scandinavia to Germany.
More than 300 people participated in 19 different events over the
three days of the forum. Their common objective was to help create
the new Fehmarnbelt Region within the context of the future tunnel
between Denmark and Germany. Workshops, conferences and podium
debates generated countless, many innovative ideas that are meant to
point the way towards a dynamic and integrated Fehmarnbelt Region
bound together by the Fehmarnbelt Fixed Link, which is scheduled to
open in 2021. This so-called “Book of Ideas” was designed to serve as
a guideline for the work of the various regional and national
governments as well as for the many cross-border stakeholders and
organisations in the region based on the many activities of the event.
It attempts to point the way toward a common future, integrated
perspectives on regional development sustainable growth, labour
markets, infrastructure and scientific cooperation. It will, however, also
encourage all stakeholders in public or private administration, politics
and business to think and act creatively when looking at the future.
This publication was compiled by the STRING Secretariat on behalf of all
the Fehmarnbelt Days organisers. Queries concerning this publication
should be directed to STRING Secretariat, Region Sjælland,
Alléen 15, 4180 Sorø, Denmark, Tel: +45 5787 5851.
A copy of this publication can be downloaded free of charge at:
http://www.femern.com/material-folder/documents/2013-publications/
175-ideas.pdf
175 ideas on the future of
the Fehmarnbelt Region
Creative ideas from
the workshops at Fehmarnbelt Days 2012
Building with natureEDITED BY VALERIE JONES40 pages. 2012. EcoShape. Hardcover. Many full-colour illustrations.
Beginning with an Introduction
by Wim Kuiken, The
Netherlands Commissioner for
the Delta Programme, this compact book gives a clear explanation
about why the Dutch Delta plan was enacted into law and why the
EcoShape project, “Building with Nature”, is important.
EcoShape is a consortium of private sector partners, government agencies
and knowledge institutes who have joined together to use their
expertise to tackle the challenges of urbanisation, economic development,
sea-level rise and climate change with innovative approaches. The idea
is to think, act and interact differently. The book brings together the
EcoShape team’s work during the last few years: The shift from building
in nature to building with nature in mind from the very start. Projects
that seek to nourish the coastline with ‘soft’ rather than ‘hard’ solutions.
The use of oyster reefs to protect tidal flats from erosion in estuaries.
Coastal protection in the tropics in order to strengthen coral reefs,
Building with natureThinking, acting and interacting differently
tWo neW InFoRMAtIon UPDAtes FRoM tHe IADcFacts About Subsea Rock Installation (Number 3, September 2012) Facts About Initiating Hydraulic Fill Projects (Number 4, December 2012)4 pp. Available free of charge online
and in print.
In these two Facts About published in 2012, two very different types
of dredging operations and dredged materials have been addressed:
The subsea installation of rock and the use of hydraulic fill for land
reclamation. Rock and hydraulic fill each have unique characteristics
which demand extensive knowledge of the substance, the water depths
and the type of equipment which are appropriate for these materials.
The technical engineering details of each of these types of material are
quite specific and each subject needs to be understood and appreciated
on its own merits. Each of these Facts About defines the technical
expertise that is necessary to execute these very different operations
successfully, the environmental concerns and the financial consequences.
Facts About is an initiative of the International Association of
Dredging Companies (IADC) to distribute up-to-date information on
various maritime construction and dredging subjects. All are
downloadable as PDFs at www.iadc-dredging.com, under publications,
or by emailing the IADC Secretariat at [email protected].
What is typically meant by Subsea Rock Installation?Rock has been used for ports and coastal protection purposes for centuries – for dikes and breakwaters, groins and scour protection. During the past several decades the major dredging contractors have become increasingly involved in the development and execution of Rock Installation in marine environments. From the previously used term rock dumping, today the term Subsea Rock Installation is commonly used to reflect the advanced techniques that are being applied, in particular for the offshore oil and gas sector. Two types of Subsea Rock Installation should be distinguished: One is for shallow water and is typically used for coastal and embankment protection works and for scour protection for the offshore oil, gas and wind energy developments at up to 50 metres of water depths. The other is Rock Installation at greater water depths, usually ranging from 50 to 2,200 metres, and is most frequently applied for the offshore oil and gas industry.
How is Rock Installation implemented?At first the installation of rock was done from shore or by hand from a flat deck barge. In the last century the first mechanical rock dumping vessels were designed, built, tested and used for ever larger maritime works worldwide, for port extensions as well as flood protection structures. These vessels were typically self propelled and outfitted with a strengthened flat deck to load the rock, hydraulically or mechanically operated “shovels”, which were designed to gradually push the rock over the side of the vessel, and a series of anchors and winches for accurate positioning. They were designed to handle a large range of rock sizes, varying from gravel to large boulders weighing many tonnes. This technique is still used frequently and is referred to as side-stone dumping. Side-stone dumping is primarily used in water depths up to 50 metres, because the accuracy of rock placement from the water surface is limited. The deeper the waters, the more the currents may influence and
disperse the rock, the more difficult it becomes to ensure placement accuracy. With the exploration and development of oil and gas fields in increasingly deeper waters, new rock placement technologies were needed to guarantee accuracy, whilst the workability in more remote offshore locations had to be secure.
How did the dredging industry adapt to working at greater depths?To keep up with the pace of oil and gas field developments in deeper waters an entirely new solution was developed: A fall pipe, which could guide the rocks from the water surface subsea to much greater depths. By the end of the 1970s a steel, telescopic fall pipe was developed for Rock Installation at water depths significantly exceeding 50 metres. Big diameter steel fall pipes are, however, sensitive to large drag and gravity forces. In the mid-1980s an improved technique was developed based on a semi-open, flexible fall pipe consisting of a string of bottomless, heavy plastic buckets along two chains. At the lower end of the string a remotely operated, propelled vehicle (ROV) was attached. The ROV was equipped with a sophisticated range of technologies such as camera, survey and positioning equipment. This flexible fall pipe design, in combination with the ROV, installed on a dynamically positioned vessel, was able to achieve more accurate placement of rock by correcting the off-setting caused by currents. The drag forces were lower and therefore the system was less sensitive to rupture. This guaranteed a higher workability as the semi-open and flexible string of buckets is able to adjust its shape to the currents. In the early 1990s DGPS (Differential Global Positioning System) was introduced in the offshore oil and gas and marine construction worlds: Differential drift of the rock-laying fall pipe vessel with respect to the subsea pipeline or cable could be achieved by dynamic positioning. The success of this technique has proven invaluable as the dredging industry has become more and more involved with the offshore energy industry, working at ever greater depths.
Facts aboutSubsea Rock InstallationAn Information Update from the IADC – Number 3 – 2012
64797_FactsAbout.indd 1 23-08-12 15:04
INITIATINGHYDRAULIC FILL PROJECTS
FACTS ABOUT number 04
An Information Update from the IADC
2012
international association of dredging companiesPictured above: A trailer suction hopper dredger placing sand fill in a reclamation area by rainbowing.
What is hydraulic Fill?Hydraulic Fill is fill in which the materials are deposited by a flowing stream of water. This fill material will originate from a borrow area or dredging site and be transported to the reclamation area by dredger, barge or pipeline. It is then placed as a mixture of fill material and process water in the reclamation area. Hydraulic Fill has a wide variety of applications for infrastructure construction projects.
What kinds oF projects use hydraulic Fill?Hydraulic Fill is used for reclamation projects, which means land creation for a range of purposes – from building or extending an airport platform to land for residential or recreational areas to industrial construction such as an LNG plant or nuclear power station. Other projects where Hydraulic Fill is used are the restoration of eroded beaches and construction of coastline defences as well as for environmental and habitat restoration or creation, for instance, of wetlands.
Why is knoWledGe about hydraulic Fill material and hydraulic Fill projects important?No two situations are the same. The quality of the Hydraulic Fill to be used is crucial to the quality of the end product. The end product or application will have specific performance requirements and the characteristics of the fill mass will determine how well these performance criteria are met. The physical conditions of project areas may differ dramatically. Wave climate, currents, water depth and subsoil conditions as well as the sensitivity of the environment and availability of fill at or nearby the site are essential factors to
be considered. Determining the characteristics of the available borrow material such as type, grading and silt content is also important as these may vary considerably. In some cases the borrow material may need specific construction and/or treatment methods in order to become suitable fill material.
What kind oF knoWledGe about hydraulic Fill is important?Detailed knowledge from a wide variety of disciplines in geotechnical engineering, hydraulic engineering and mechanical engineering combined with practical know-how and experience of dredging and filling techniques are all critical. Insufficient information about the technical specifications of a reclamation project can lead to inadequate and conflicting specifications, to construction requirements that cannot be met and/or to excessive costs for fill treatment and testing. These developments may frustrate the tender process, may cause serious problems during construction and quality control and may lead to long-lasting, costly arbitration cases. The formulation of generally accepted guidelines and reasonable specifications should be established. In this way the client can understand and properly plan a reclamation project and the consultants and contractors have adequate guidelines for design and quality control.
What drives the desiGn philosophy oF a hydraulic Fill project?The design philosophy of a Hydraulic Fill project should match the anticipated loading response of the fill mass to the requirements imposed by the future use of the reclaimed land – all within the technical boundary conditions of the project.
65640_Facts about_nr4.indd 1 27-11-12 15:10
seagrass meadows and mangrove forests. Seabed landscaping as a tool
for restoring habitats that encourage biodiversity. Revitalising wetlands
in freshwater lakes, especially in low-lying areas such as deltas.
Though this book provides an exciting overview, with wonderful
illustrations, and a summary of what has been achieved, it is not the
end. The partners in the programme are looking forward and outward
offering guidelines, lessons learnt and practical tools. More about this
innovative programme and the book are available at the website,
www.ecoshape.nl
34 Terra et Aqua | Number 130 | March 2013
seMInARs / conFeRences / eVentsIADc seMInAR on DReDGInG & RecLAMAtIonAPRIL 15-19, 2013 ATLÂNTICO BÚZIOS CONVENTION & RESORT BÚZIOS, BRAZIL
The International Seminar on Dredging and Reclamation is being
organised by the International Association of Dredging Companies
(IADC), the premier organisation representing the private dredging
industry, in Búzios, Brazil from April 15 to 19, 2013. The seminar
includes a tour of the immense dredging project at Superporto do
Açu, the biggest port complex of its type in the world, the largest
investment in port infrastructure in Latin America, in the country with
the greatest GDP growth for a region.
Why Brazil? Why now?Latin America – and especially Brazil – is booming. And port
development and dredging is an essential element. Dredging in Latin
America has been steadily growing over the last few years including
such mega-projects as the Superporto do Açu. And many more
projects and works are going on or being planned for the near future.
No wonder that ABD, Associação Brasileira de Dragagem – together
with other interested parties – has asked IADC to organise its
informative and educational Seminar in Latin America for a second time.
Seeing is Believing: Site visit to Boskalis’ Superporto do Açu projectPart of the beauty of the IADC Seminar is getting out of the classroom
and into the field. In that context, seminar participants will be delighted
that Boskalis, one of the world’s largest dredging companies, is allowing
us a close up view of their dredging site at the Superporto do Açu.
Most likely one of their state-of-the-art dredging vessels will be
available for a visit.
The Superporto do Açu, a US$1.6 billion project developed by LLX,
a logistics company, is an impressive effort to improve the freight
transport infrastructure and support the country’s growing trade links
with China, the U.S. and others. Deemed a one-stop-shop, the
90-kilometer square area (about 1.5 the size of Manhattan) will
provide everything necessary for the production, processing, storage
and transport of materials such as steel, iron ore, oil, slag, granite
amongst others, as well as specialised companies to assist with
regulations and customs clearance.
The port area of Açu will have a 2.9 kilometre-long bridge with
10 docking berths, which will be able to accommodate the latest
generation of super-ships, including 380-metre-long Chinamax vessels
with a reported capacity of 400,000 tonnes of cargo.
To appreciate the enormity of this project view this movie about the
project(s): http://www.youtube.com/watch?v=G8e2lscJXCg
By Professionals for ProfessionalsDredging plays an essential role in world trade and economic and
social progress. To optimise the chances of the successful completion
of a project, contracting parties should, from the start, fully
understand the requirements of a dredging project.
That’s why IADC developed this comprehensive Seminar for
professionals in dredging-related industries – presented by professionals
from the major dredging companies. Since 1993 IADC, often in
co-operation with local universities and/or other associations, has
provided this Seminar combining classroom lectures and workshops with
a site visit to a dredging project. Hundreds of past participants agree:
this is a unique chance to receive invaluable hands-on experience.
Costs and early registration discountThe fee for the week-long seminar is € 2,950.- (VAT inclusive).
This includes all tuition, seminar proceedings, workshops and special
participants’ dinner, but excludes travel costs and accommodations.
Seminar participants can get a preferential rate at the hotel where the
Seminar will be held (Atlântico Búzios Convention & Resort). Participants
registering before 1 March 2013 will receive a € 200.- discount.
For further information contact: Jurgen Dhollander, International Association of Dredging Companies
Tel.: +31 70 352 3334
• Email: [email protected]
WInD FARM DeVeLoPMent:eURoPeAn oFFsHoRe 2013APRIL 10-11, 2013EDINBURGH, UK
Wind Farm Development: European Offshore 2013 will provide
presentations and interactive discussions lead by senior representatives
from the leading companies operating in the offshore wind sector.
Key industry players and decision makers will be present to discuss
the development and future of this significant renewable energy
source. This is an opportunity to enhance your network and gain
contacts from within the leading organisations making a difference
in the offshore wind industry with two days of networking and
open interactive discussions.
Attendees will be senior management from within the industry
including: wind farm developers, wind farm operators, turbine
manufacturers, engineers, consultants, ports and harbours, offshore
shipping companies, energy analysts and lawyers. Fees for the
conference will be £1,495 (ex VAT).
For further information contact:Justyna Korfanty
Tel.: +44 207 981 2503
• Email: [email protected]
tekst nog plaatsen 35Seminars / Conferences / Events 35
tHe HYDRAULIc FILL MAnUAL InteRnAtIonAL coURseAPRIL 11-12, 2013PAO POST-ACADEMIC ONDERWIJS, DELFT, THE NETHERLANDS
This course covers the initiation, design and construction of hydraulic
fill projects as described in the recently published Hydraulic Fill
Manual. Without proper hydraulic fill and suitable specialised
equipment, major infrastructure projects such as ports, airports,
roads, industrial or housing projects cannot be realised. To date
comprehensive information about hydraulic fill is difficult to find.
The Hydraulic Fill Manual is a thoroughly researched book, written by
noted experts, which takes the reader step-by-step through the complex
development of a hydraulic fill project. This in-depth Manual will enable
the client and his consultant to understand and properly plan a
reclamation project. It provides guidelines for design and quality control
and allows the contractor to work to known and generally accepted
procedures and reasonable specifications. The ultimate goal is to realise
better-designed, better- specified and less costly hydraulic fill projects.
The course is of particular interest to clients, consultants, planning
and consenting authorities, environmental advisors, contractors and
civil, geotechnical, hydraulic and coastal engineers involved in
dredging and land reclamation projects. For following this course
some background knowledge in geotechnical engineering is required.
CEDA, CUR and IADC are happy to support The Hydraulic Fill Manual
International. The course leader will be Engineer Jan van ‘t Hoff
(Van ‘t Hoff & Partners), one of the editors of the Manual. The course
fee is € 990,00 excl. VAT and includes a copy of the Manual.
Participants will receive 10 PDH’s Bouw- en Waterbouwkunde
(Construction and Maritime construction) study points.
For further information contact:http://pao-tudelft.nl/Infoaanvragen/2439/0/The_Hydraulic_Fill_Manual.
html
WoRLD oceAn coUncIL sUstAInABLe oceAn sUMMIt (sos) 2013APRIL 22-24, 2013WASHINGTON, DC
In 2050, what will the state of the ocean and the ocean business
community be – and what must be done between now and then to ensure
that both are healthy and productive? The Sustainable Ocean Summit
(SOS) 2013 is the only international, cross-sectoral ocean sustainability
conference designed by and for the private sector, focused on Corporate
Ocean Responsibility. This is the World Ocean Council’s second SOS and
builds on the highly successful SOS 2010, held in Belfast, Northern
Ireland, which drew together more than 150 representatives from a
wide range of ocean industries. The aim is to further advance leadership
and collaboration amongst the diverse ocean business community in
addressing marine environment and sustainability challenges.
A wide range of industries are involved in the use of marine space
and resources, including shipping, oil and gas, fisheries, aquaculture,
ports, mining, renewable energy, tourism, dredging, marine science/
technology, maritime law, insurance, finance, and others. The conference
will address priorities for cross-sectoral industry leadership and
collaboration in ocean sustainability, including: ocean policy, regulations
and governance; marine spatial planning; the role of industries in ocean
and climate observations; biofouling and invasive species; fisheries and
aquaculture interaction with other industries; cross-sectoral collaboration
in responsible use of the Arctic; sound and marine life; cargo issues, port
waste reception facilities and marine debris; marine mammal interactions;
the role of finance, insurance and legal sectors in ocean sustainability.
Other cross-cutting topics critical to responsible industry operations in
the marine environment will be developed as the programme evolves.
SOS sessions will be designed to provide the state of the knowledge
on these issues, including topic overviews, case studies and examples
of best practices. Limited opportunities are available for speakers to
address the themes above. Experts and thought leaders interested in
being considered as speakers are encouraged to contact the WOC.
SOS participants are primarily the senior management responsible for
environment and sustainability in companies and industry associations
from a wide range of ocean industries. Other ocean stakeholders are
welcome to participate, e.g., senior representatives of international
organisations, government agencies, academic/research institutions
and non-government organisations.
For further information contact:• Email: [email protected] http://www.oceancouncil.org/site/summit_2013/
WoDcon XXJUNE 3-7, 2013SQUARE-BRUSSELS MEETING CENTRE, BRUSSELS, BELGIUM
Organised by CEDA on behalf of WODA (World Organisation of
Dredging Associations) which incorporates WEDA, CEDA and EADA,
WODCON XX, with the theme, “The Art of Dredging” will showcase
some 120 technical papers over three days covering all aspects of dredging
and maritime construction. All WODCON XX papers will be peer
reviewed and provide up to date, relevant and high quality information.
The Congress will also feature a technical exhibition and technical
visits. These technical programme elements will ensure a complete
learning process, while various social events will allow participants to
meet fellow professionals from all over the world in a friendly and
inspiring atmosphere. The 2013 conference marks the XXth edition of
WODCON and coincides with the 35th anniversary of the current
WODA and its three component associations.
Topics of interest include but are not limited to the following broad
areas: Method, Equipment & Techniques; Management of Sediments
36 Terra et Aqua | Number 130 | March 2013
(clean and contaminated); Environmental Issues; Regulatory Issues;
Management and Economics; Alluvial and Deep Sea Mining.
For further information contact:Congrex Belgium - WODCON XX Organisation Office
Tel.: +32 (0)2 627 0166, Fax: +32 (0)2 645 26 71
• Email: [email protected]/wodcon
IADc seMInAR on DReDGInG & RecLAMAtIon JUNE 24-28, 2013 UNESCO-IHE DELFT, THE NETHERLANDS
For (future) decision makers and their advisors in governments, port
and harbour authorities, off-shore companies and other organisations
that have to execute dredging projects, the International Association
of Dredging Companies will again organise the International Seminar
on Dredging and Reclamation at UNESCO-IHE, Delft, The Netherlands.
To optimise the chances of the successful completion of a project,
contracting parties should, from the start, fully understand the
requirements of a dredging project. This five-day course strives to
provide an understanding through lectures by experts in the field and
workshops, partly conducted on-site in order to give the “students”
hands-on experience. An important feature of the Seminars is a trip to
visit a dredging project being executed in the given geographical area.
Each participant receives a set of comprehensive proceedings with an
extensive reference list of relevant literature and, at the end of the
week, a Certificate of Achievement in recognition of the completion
of the coursework. Please note that full attendance is required for
obtaining the Certificate of Achievement. The fee for the week-long
seminar is € 2,250.- (VAT inclusive). This includes all tuition, seminar
proceedings, workshops and a special participants’ dinner, but
excludes travel costs and accommodations.
For further information contact:Jurgen Dhollander, International Association of Dredging Companies
Tel.: +31 70 352 3334
• Email: [email protected]
WeDA 33 / tAMU 44
AUGUST 25-28, 2013 HILTON HAWAIIAN VILLAGE, HONOLULU, HAWAII
The theme of the Western Dredging Association’s 33nd Annual Western
Hemisphere Dredging Conference and Texas A&M’s 44th Annual Dredging
Seminar (WEDA 33/TAMU 44) is “So That Ships May Pass”. It will
focus on the Historical, Structural and Operational Development of
Navigation throughout the Western Hemisphere. Included in the
dredging conversations will be the critical global economic need for
dredging, the importance of enhancing the marine environment as
well as historical dredging developments, trends and the dredging
progress that has created today’s market trends and also emerging
environmental issues. The conference will provide a forum for
discussions between North, Central, South American and Pacific regions.
For further information contact:Tel.: +1 360 750 0209
• Email: [email protected] www.westerndredging.org
PoRts 2013AUGUST 25-29 2013SEATTLE, WASHINGTON, USA
PORTS ‘13 – “Ports: Success through Diversification” – is the 13th in a
series of international port and harbour specialty conferences held on
a tri-annual basis since 1977. This year’s conference theme recognises
the broad spectrum of factors that make ports so important to their
local, regional and national communities, including the broad missions
they support, such as moving cargo, providing recreational
opportunities, serving as engines of economic development, and
providing for stewardship of environmental resources. The PORTS
Conference series is internationally recognised as an outstanding
opportunity to network with hundreds of leading practitioners,
researchers and specialists in the port engineering profession. This
year PORTS ‘13 has expanded to 3 full days, resulting in a 50 percent
increase in opportunities to present ideas and experiences.
For further information see:http://content.asce.org/conferences/ports2013/index.html
coAsts, MARIne stRUctURes AnD BReAkWAteRsSEPTEMBER 17-20, 2013EICC EDINBURGH, SCOTLAND, UK
The Institution of Civil Engineers is pleased to announce the tenth in this
highly-regarded series of specialist conferences. This is an international
forum addressing the developments in offshore and nearshore energy
production, procurement, issues with coastal defence, and the construction,
management and refurbishment of all coastal assets. Whilst retaining
the historical coverage on shoreline structures, coastal processes, and
design and construction of breakwaters and related structures, the
conference will also emphasise aspects at the civil and coastal engineering
interface, such as fluid loadings, resource modelling, interactions with the
environment, construction, installation, cabling, servicing and maintenance.
For further information contact:ICE Events Team, Institution of Civil Engineers
One Great George Street
Westminster, London SW1P 3AA, UK
Tel.: +44 (0)20 7665 222, Fax: +44 (0)20 7233 1743
• Email: [email protected]/Upcoming-events/ICE-Breakwaters
Editor
Marsha R. Cohen
Editorial Advisory Committee
Bert Groothuizen, Chair
Robert de Bruin
René Kolman
Heleen Schellinck
Martijn Schuttevâer
Roberto Vidal Martin
Ann Wittemans
IADC Board of Directors
P. de Ridder, President
Y. Kakimoto, Vice President
C. van Meerbeeck, Treasurer
Th. Baartmans
P. Catteau
N. Haworth
P. Tison
IADC Secretariat
René Kolman, Secretary General
Alexanderveld 84
2585 DB The Hague
Mailing address:
P.O. Box 80521
2508 GM The Hague
The Netherlands
T +31 (0)70 352 3334
F +31 (0)70 351 2654
I www.iadc-dredging.com
I www.terra-et-aqua.com
Please address enquiries to the editor.
Articles in Terra et Aqua do not necessarily
reflect the opinion of the IADC Board or
of individual members.
CovER
A survey ship with a specially developed silt profiler – designed and constructed in 2009 and owned
by the Port of Rotterdam – follows a trailing suction hopper dredger at work to measure active and
surface plumes. This was an integral part of the extensive monitoring programme at the Maasvlakte 2
expansion project in Rotterdam (see page 20).
TERRA ETAQUA
Guidelines for Authors
Terra et Aqua is a quarterly publication of the International Association of Dredging Companies,
emphasising “maritime solutions for a changing world”. It covers the fields of civil, hydraulic
and mechanical engineering including the technical, economic and environmental aspects
of dredging. Developments in the state of the art of the industry and other topics from the
industry with actual news value will be highlighted.
• AsTerra et Aqua is an English language journal, articles must be submitted in English.
• Contributionswillbeconsideredprimarilyfromauthorswhorepresentthevariousdisciplines
of the dredging industry or professions, which are associated with dredging.
• Studentsandyoungprofessionalsareencouragedtosubmitarticlesbasedontheirresearch.
• Articlesshouldbeapproximately10-12A4s.Photographs,graphicsandillustrationsare
encouraged. Original photographs should be submitted, as these provide the best quality.
Digital photographs should be of the highest resolution.
• Articles should be original and should not have appeared in other magazines or publications.
An exception is made for the proceedings of conferences which have a limited reading public.
• Inthecaseofarticlesthathavepreviouslyappearedinconferenceproceedings,permission
to reprint in Terra et Aqua will be requested.
• Authorsarerequestedtoprovideinthe“Introduction”aninsightintothedrivers(theWhy)
behind the dredging project.
• Bysubmittinganarticle,authorsgrantIADCpermissiontopublishsaidarticleinboththe
printed and digital version of Terra et Aqua without limitations and remunerations.
• AllarticleswillbereviewedbytheEditorialAdvisoryCommittee(EAC).Publicationofan
article is subject to approval by the EAC and no article will be published without approval
of the EAC.
MEMbERShip liST iADC 2013Through their regional branches or through representatives, members of IADC operate directly at all locations worldwide
AfricABKI Egypt for Marine Contracting Works S.A.E., Cairo, EgyptDredging and Reclamation Jan De Nul Ltd., Lagos, NigeriaDredging International Services Nigeria Ltd., Ikoyi Lagos, NigeriaNigerian Westminster Dredging and Marine Ltd., Lagos, NigeriaVan Oord Nigeria Ltd., Victoria Island, Nigeria
AsiABeijing Boskalis Dredging Technology Co. Ltd., Beijing, PR ChinaBoskalis Dredging India Pvt Ltd., Mumbai, IndiaBoskalis International (S) Pte. Ltd., SingaporeDredging International Asia Pacific (Pte) Ltd., SingaporeHyundai Engineering & Construction Co. Ltd., Seoul, KoreaInternational Seaport Dredging Private Ltd., New Delhi, IndiaJan De Nul Dredging India Pvt. Ltd., IndiaJan De Nul Singapore Pte. Ltd., SingaporeP.T. Boskalis International Indonesia, Jakarta, IndonesiaPenta-Ocean Construction Co. Ltd., Tokyo, JapanPT Van Oord Indonesia, Jakarta, IndonesiaToa Corporation, Tokyo, JapanVan Oord (Malaysia) Sdn Bhd, Selangor, MalaysiaVan Oord (Shanghai) Dredging Co. Ltd., Shanghai, PR ChinaVan Oord Dredging and Marine Contractors bv Hong Kong Branch, Hong Kong, PR ChinaVan Oord Dredging and Marine Contractors bv Korea Branch, Busan, Republic of KoreaVan Oord Dredging and Marine Contractors bv Philippines Branch, Manilla, PhilippinesVan Oord Dredging and Marine Contractors bv Singapore Branch, SingaporeVan Oord India Pte Ltd., Mumbai, IndiaVan Oord Thai Ltd., Bangkok, Thailand Zinkcon Marine Singapore Pte. Ltd., Singapore
AusTrAliA + NEW ZEAlANDBoskalis Australia Pty, Ltd., Sydney, AustraliaDredging International (Australia) Pty. Ltd., Brisbane, QLD, AustraliaJan De Nul Australia Ltd., AustraliaNZ Dredging & General Works Ltd., Maunganui, New ZealandVan Oord Australia Pty Ltd., Brisbane, QLD, AustraliaWA Shell Sands Pty Ltd., Perth, Australia
EuropEAtlantique Dragage Sarl, St. Germain en Laye, FranceBaggermaatschappij Boskalis B.V., Papendrecht, NetherlandsBaggerwerken Decloedt & Zoon NV, Oostende, BelgiumBallast Ham Dredging, St. Petersburg, RussiaBaltic Marine Contractors SIA, Riga, LatviaBKW Dredging & Contracting Ltd., CyprusBoskalis B.V., Rotterdam, NetherlandsBoskalis International B.V., Papendrecht, NetherlandsBoskalis Italia Srl., Rome, ItalyBoskalis Offshore bv, Papendrecht, NetherlandsBoskalis Sweden AB, Gothenburg, SwedenBoskalis Westminster Ltd., Fareham, UK Boskalis Westminster Marine (Cyprus) Ltd., Limassol, CyprusBoskalis Westminster Middle East Ltd., Limassol, CyprusBoskalis Westminster Shipping BV, Papendrecht, NetherlandsBrewaba Wasserbaugesellschaft Bremen mbH, Bremen, GermanyDEME Building Materials NV (DBM), Zwijndrecht, BelgiumDragapor Dragagens de Portugal S.A., Alcochete, PortugalDravo SA, Italia, Amelia (TR), ItalyDravo SA, Lisbon, PortugalDravo SA, Madrid, Spain
Dredging and Contracting Rotterdam b.v., Bergen op Zoom, NetherlandsDredging and Maritime Management s.a., Steinfort, LuxembourgDredging International (Luxembourg) SA, Luxembourg, LuxembourgDredging International (UK) Ltd., East Grinstead, UKDredging International N.V., Zwijndrecht, BelgiumFlota Proyectos Singulares S.A., Madrid, SpainHeinrich Hirdes G.m.b.H., Hamburg, GermanyIrish Dredging Company Ltd., Cork, IrelandJan De Nul (UK) Ltd., Ascot, UKJan De Nul n.v., Hofstade/Aalst, BelgiumMijnster Zand- en Grinthandel bv, Gorinchem, NetherlandsNordsee Nassbagger-und Tiefbau GmbH, Bremen, GermanyPaans Van Oord B.V., Gorinchem, NetherlandsRock Fall Company Ltd., Aberdeen, UKRohde Nielsen, Copenhagen, DenmarkSociedade Española de Dragados S.A., Madrid, SpainSocieta Italiana Dragaggi SpA ‘SIDRA’, Rome, ItalySociété de Dragage International ‘SDI’ SA, Lambersart, FranceSodraco International S.A.S., Lille, FranceSodranord SARL, Le Blanc-Mesnil Cédex, FranceTerramare Eesti OU, Tallinn, EstoniaTerramare Oy, Helsinki, FinlandTideway B.V., Breda, NetherlandsTOA (LUX) S.A., Luxembourg, LuxembourgVan Oord (Gibraltar) Ltd., GibraltarVan Oord ACZ Marine Contractors bv, Rotterdam, NetherlandsVan Oord Ireland Ltd., Dublin, IrelandVan Oord Middle East Ltd., Nicosia, CyprusVan Oord Nederland bv, Gorinchem, NetherlandsVan Oord nv, Rotterdam, NetherlandsVan Oord Offshore bv, Gorinchem, NetherlandsVan Oord UK Ltd., Newbury, UK
MiDDlE EAsTBoskalis Middle East Ltd., Abu Dhabi, UAEBoskalis Westminster (Oman) LLC, Muscat, OmanBoskalis Westminster Al Rushaid Co. Ltd., Al Khobar, Saudi ArabiaBoskalis Westminster Middle East Ltd., Manama, BahrainGulf Cobla (Limited Liability Company), Dubai, UAEJan De Nul Dredging Ltd. (Dubai Branch), Dubai, UAEMiddle East Dredging Company (MEDCO), Doha, QatarNational Marine Dredging Company, Abu Dhabi, UAEVan Oord Gulf FZE, Dubai, UAE
ThE AMEricAsBoskalis International bv Sucural Argentina, Buenos Aires, ArgentinaBoskalis International Uruguay S.A., Montevideo, UruguayBoskalis Panama SA, Panama City, PanamaCompañía Sud Americana de Dragados S.A., Buenos Aires, ArgentinaDragabras Servicos de Dragagem Ltda., BrazilDragamex SA de CV, Mexcio City, MexicoDravensa C.A., Caracas, VenezuelaDredging International de Panama SA, PanamaDredging International Mexico SA de CV, Veracruz, MexicoJan De Nul do Brasil Dragagem Ltda., BrazilMexicana de Dragados S.A. de C.V., Mexico City, MexicoStuyvesant Dredging Company, Louisiana, USAVan Oord Curaçao nv, Willemstad, CuraçaoVan Oord Dragagens do Brasil Ltd., Rio de Janeiro, BrazilWestminster Dredging (Overseas) Ltd., Trinidad
Terra et Aqua is published quarterly by the IADC, The International Association
of Dredging Companies. The journal is available on request to individuals or
organisations with a professional interest in dredging and maritime infrastructure
projects including the development of ports and waterways, coastal protection,
land reclamation, offshore works, environmental remediation and habitat restoration.
The name Terra et Aqua is a registered trademark.
for a free subscription register at www.terra-et-aqua.com
© 2013 IADC, The Netherlands
All rights reserved. Electronic storage, reprinting or
abstracting of the contents is allowed for non-commercial
purposes with permission of the publisher.
ISSN 0376-6411
Typesetting and printing by Opmeer Drukkerij bv,
The Hague, The Netherlands. PEFC/30-31-372

Number 130 | March 2013
THEORY VS REALITYtesting the ‘pilferer’ draghead
SCIENCE VS PRECONCEPTIONSLough Foyle’s two disposal sites
TERRA ETAQUAMaritime Solutions for a Changing World
EXPECTATIONS VS FACTSsilt concentrations at Maasvlakte 2