
Science &Technology for Resurgent India By Dr T.H. CHOWDARY Director: Center for Telecom Management...
25
Science &Technology for Resurgent India By Dr T.H. CHOWDARY Director: Center for Telecom Management and Studies Chairman: Pragna Bharati (intellect India ) Former: Chairman & Managing Director Videsh Sanchar Nigam Limited & Information Technology Advisor, Government of Andhra Pradesh T: +91(40) 5567-1191/ 2784-6137(O) 2784-3121® F: +91 (40) 5567-1111, 2789-6103 [email protected] [email protected] Talk @ Osmania University: 8th Feb 2008
-
Upload
emma-riley -
Category
Documents
-
view
217 -
download
3
Transcript of Science &Technology for Resurgent India By Dr T.H. CHOWDARY Director: Center for Telecom Management...
Science &Technology for Resurgent India
By
Dr T.H. CHOWDARY Director: Center for Telecom Management and Studies
Chairman: Pragna Bharati (intellect India )Former: Chairman & Managing Director
Videsh Sanchar Nigam Limited &Information Technology Advisor, Government of Andhra Pradesh
T: +91(40) 5567-1191/ 2784-6137(O) 2784-3121®F: +91 (40) 5567-1111, 2789-6103
[email protected]@satyam.com
Talk @ Osmania University: 8th Feb 2008
THC_CTMS S373_Feb'08 2
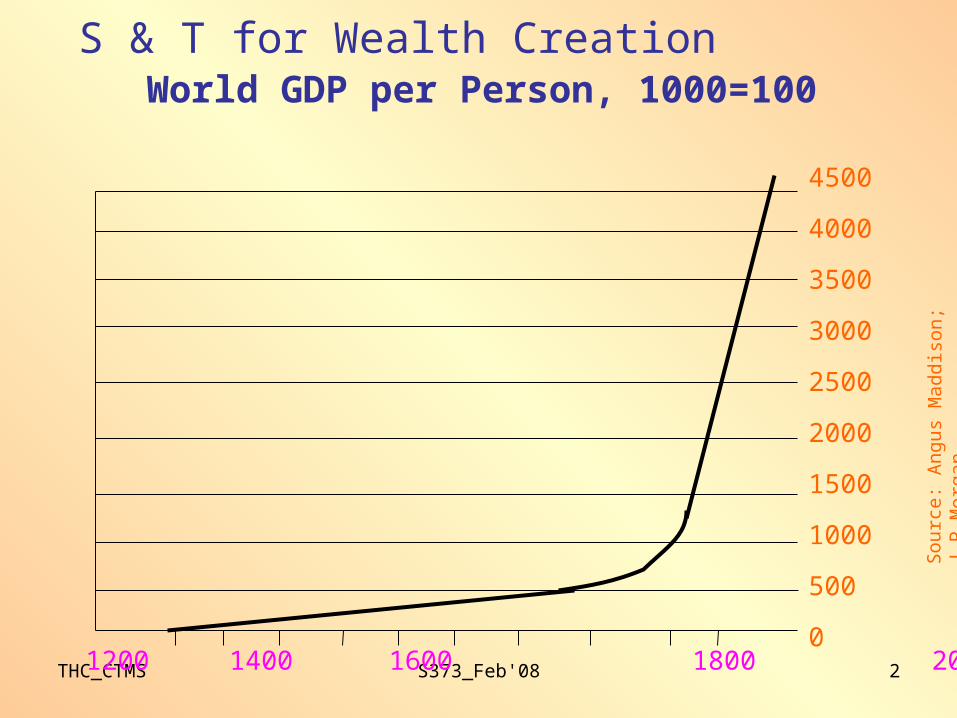
4500
4000
3500
3000
2500
2000
1500
1000
500
01000 1200 1400 1600 1800 2000
Sou
r ce :
Ang
us M
addi
s on;
J.P
.Mor
gan
World GDP per Person, 1000=100S & T for Wealth Creation
THC_CTMS S373_Feb'08 3
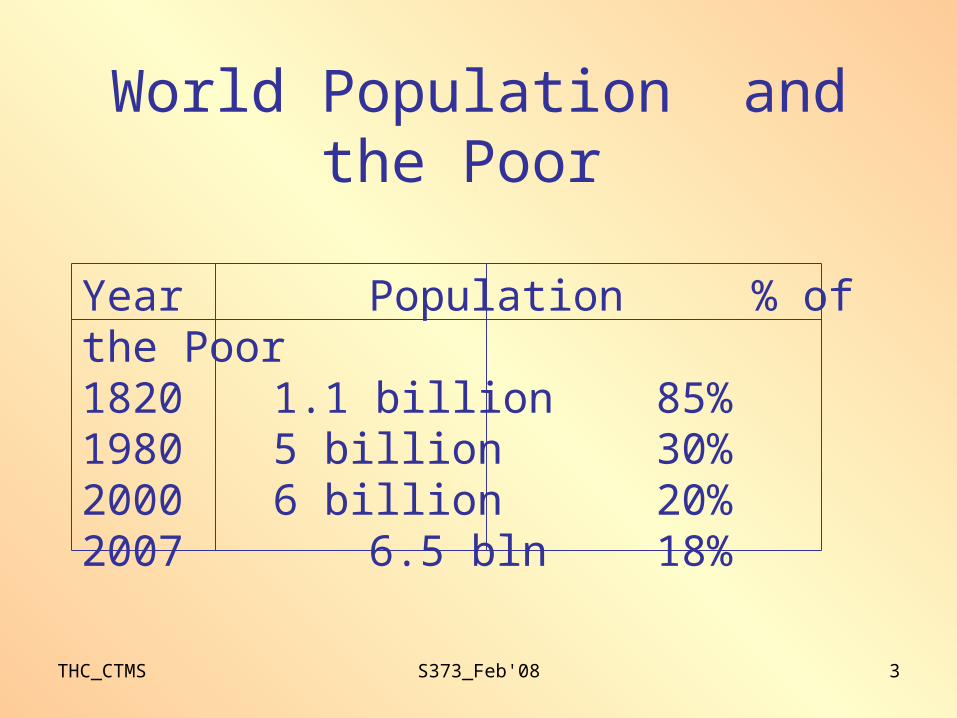
World Population and the Poor
Year Population % of the Poor1820 1.1 billion 85%1980 5 billion 30%2000 6 billion 20%2007 6.5 bln 18%
THC_CTMS S373_Feb'08 4
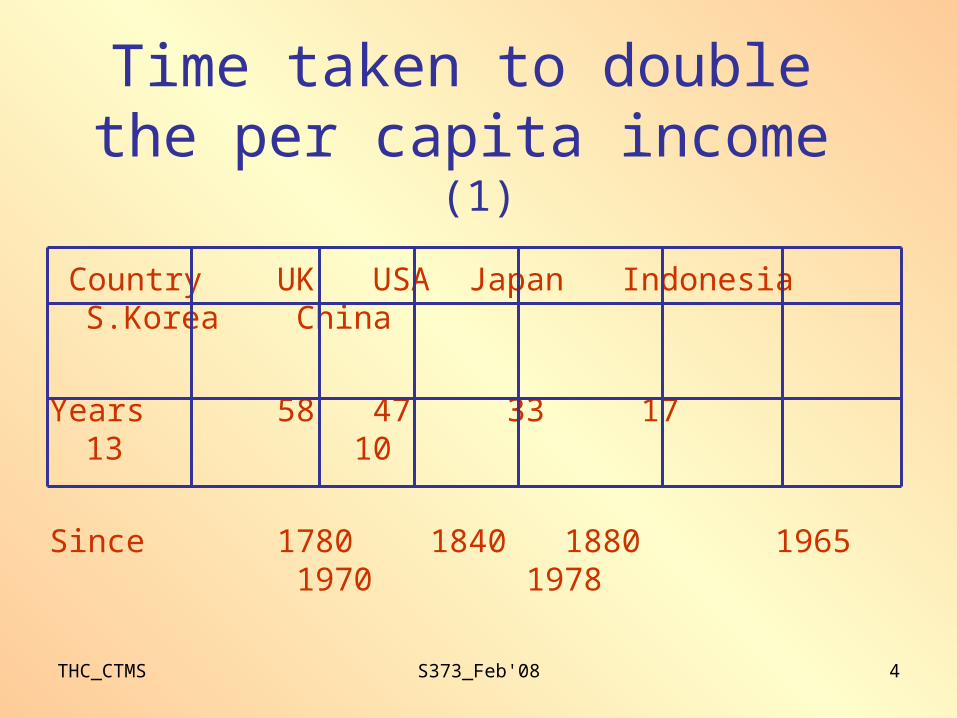
Time taken to double the per capita income (1)
Country UK USA Japan Indonesia S.Korea China
Years 58 47 33 17 13 10
Since 1780 1840 1880 1965 1970 1978
THC_CTMS S373_Feb'08 5
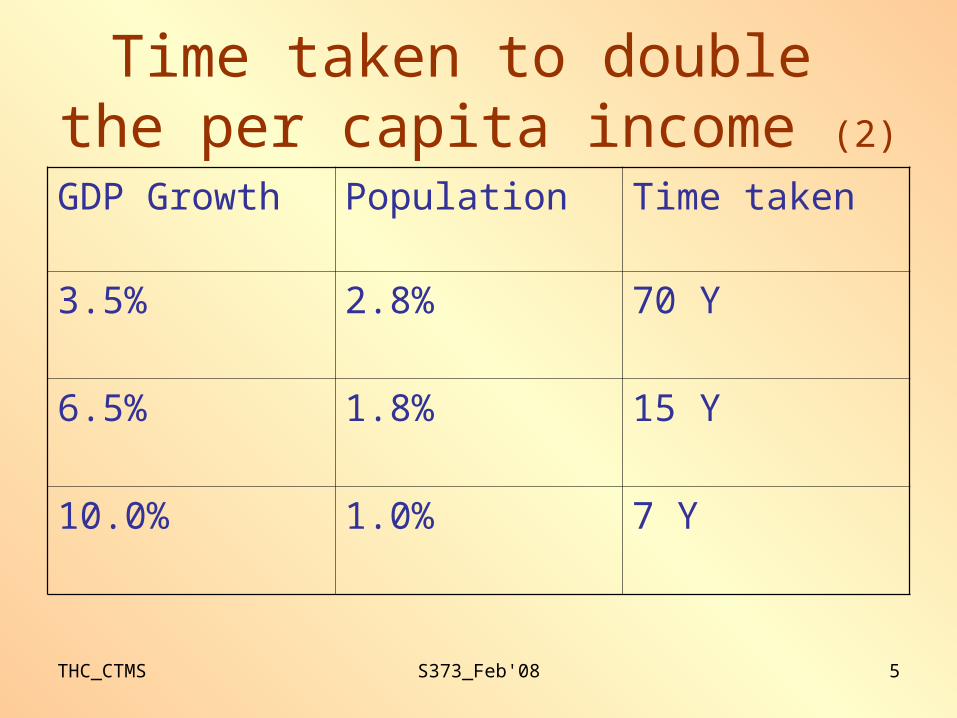
Time taken to double the per capita income (2)
GDP Growth Population Time taken
3.5% 2.8% 70 Y
6.5% 1.8% 15 Y
10.0% 1.0% 7 Y
THC_CTMS S373_Feb'08 6
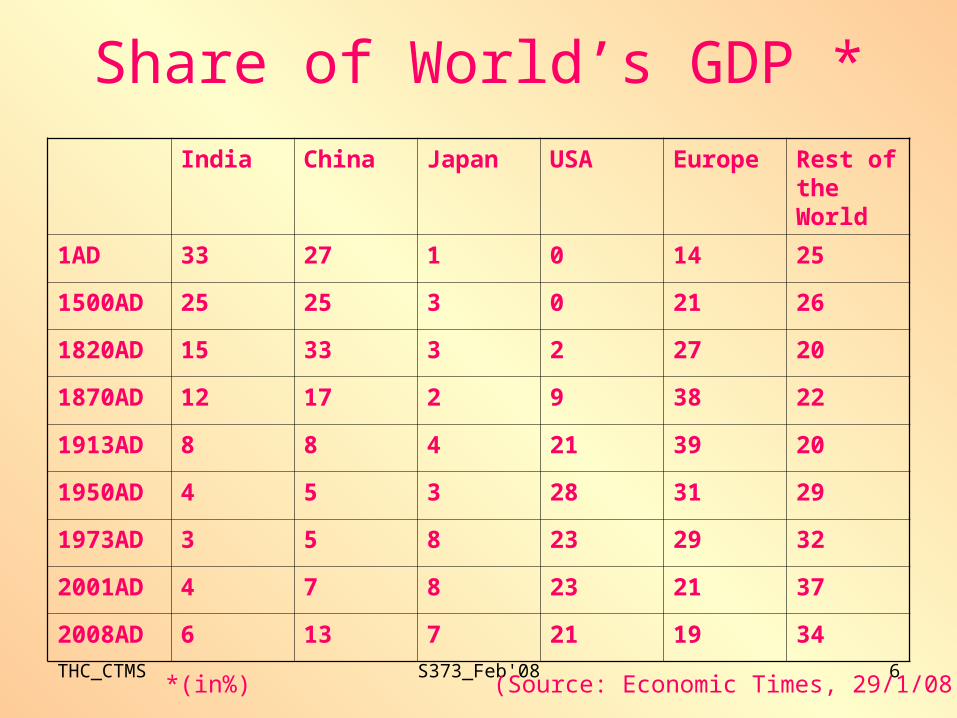
Share of World’s GDP *
India China Japan USA Europe Rest of the World
1AD 33 27 1 0 14 25
1500AD 25 25 3 0 21 26
1820AD 15 33 3 2 27 20
1870AD 12 17 2 9 38 22
1913AD 8 8 4 21 39 20
1950AD 4 5 3 28 31 29
1973AD 3 5 8 23 29 32
2001AD 4 7 8 23 21 37
2008AD 6 13 7 21 19 34
*(in%) (Source: Economic Times, 29/1/08)
THC_CTMS S373_Feb'08 7
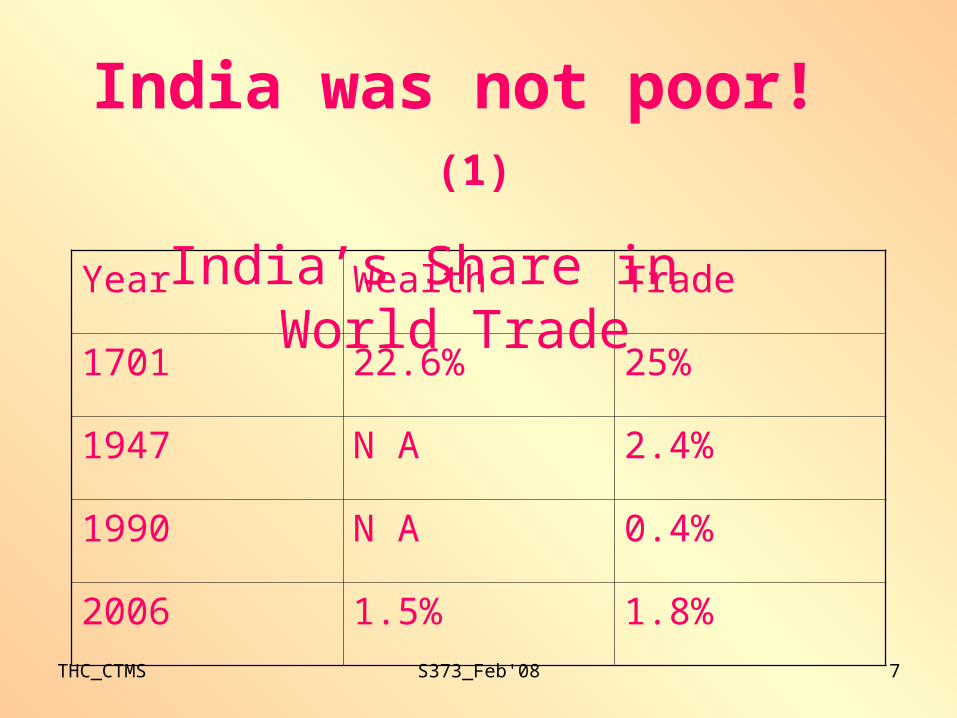
Year Wealth Trade
1701 22.6% 25%
1947 N A 2.4%
1990 N A 0.4%
2006 1.5% 1.8%
India was not poor! (1)
India’s Share in World Trade
THC_CTMS S373_Feb'08 8
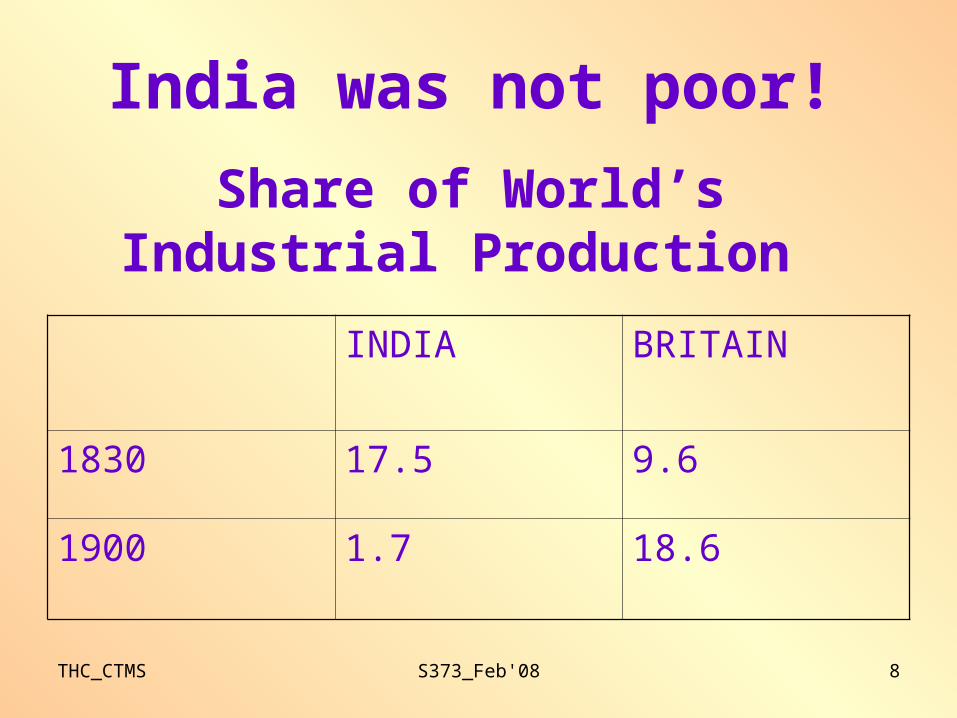
INDIA BRITAIN
1830 17.5 9.6
1900 1.7 18.6
India was not poor!
Share of World’s Industrial Production
THC_CTMS S373_Feb'08 9
India held in high esteem
When Alexander set out to invade India, he went to his teacher, Aristotle and asked what Guru Dakshina he would want to be brought from India. Aristotle told him to bring a pail of Ganga Jel and the instrument Venu, the flute of Lord Krishna.
“India is becoming the sink of the World’s gold”
- Pliny, Roman Historian“An Ocean named after – not England, France, Portugal, Netherlands,
America, Spain, Russia, China…..but India
THC_CTMS S373_Feb'08 10
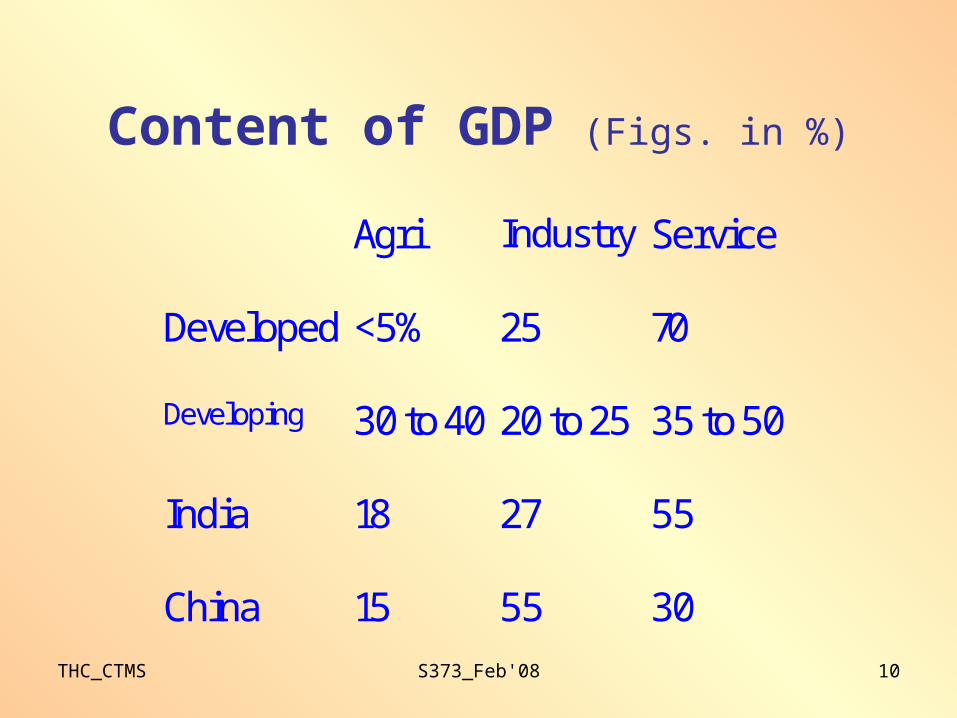
Agri Industry Service
Developed <5% 25 70
Developing 30 to 40 20 to 25 35 to 50
India 18 27 55
China 15 55 30
Content of GDP (Figs. in %)
THC_CTMS S373_Feb'08 11
India developed
• Population must be stabilised to sustain economic growth
• Education for all• Health for all • Vision and Enterprise• Military Power; projectable anywhere• Generate knowledge ( R&D; Discovery;
Innovation)• Ethics ,morality, spiritual (Ritam, Satyam)
THC_CTMS S373_Feb'08 12
India developed
• Education for all (SSC); Graduation for the aspiring.
• Population: Stabilised consistent with wealth creation.
• Health for all : No malnutrition & no Epidemics• Vision and Enterprise • Diffusion of wealth and knowledge for the entire
human race • Ethics ,morality, spiritual
THC_CTMS S373_Feb'08 13
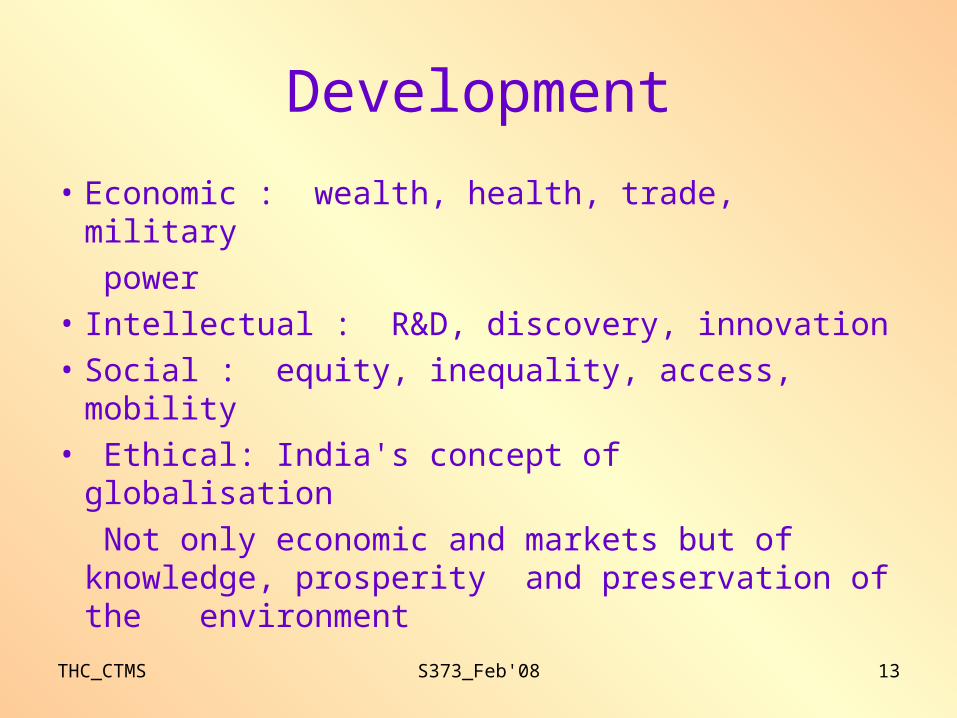
Development
• Economic : wealth, health, trade, military
power
• Intellectual : R&D, discovery, innovation
• Social : equity, inequality, access, mobility
• Ethical: India's concept of globalisation
Not only economic and markets but of knowledge, prosperity and preservation of the environment
THC_CTMS S373_Feb'08 14
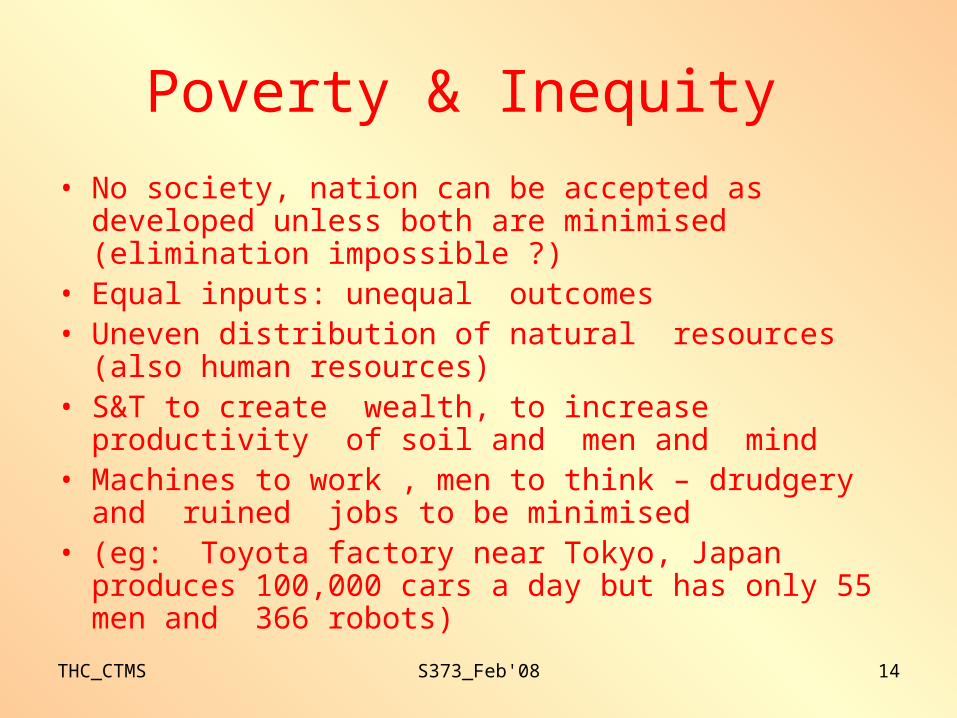
Poverty & Inequity
• No society, nation can be accepted as developed unless both are minimised (elimination impossible ?)
• Equal inputs: unequal outcomes • Uneven distribution of natural resources (also human
resources)• S&T to create wealth, to increase productivity of soil
and men and mind • Machines to work , men to think – drudgery and ruined
jobs to be minimised • (eg: Toyota factory near Tokyo, Japan produces
100,000 cars a day but has only 55 men and 366 robots)
THC_CTMS S373_Feb'08 15
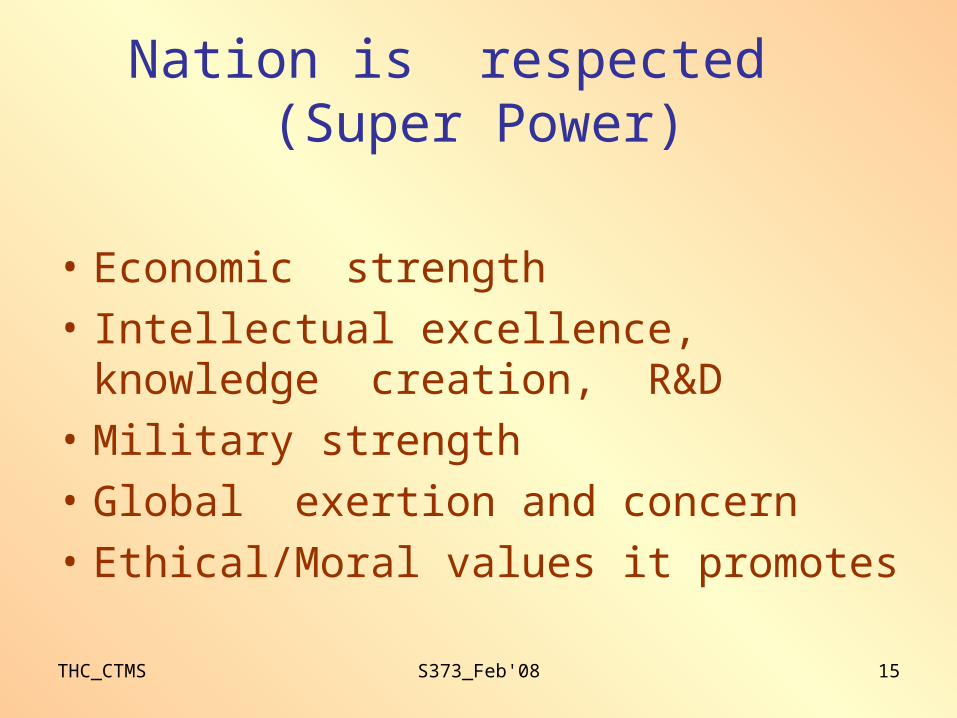
Nation is respected (Super Power)
• Economic strength
• Intellectual excellence, knowledge creation, R&D
• Military strength
• Global exertion and concern
• Ethical/Moral values it promotes
THC_CTMS S373_Feb'08 16
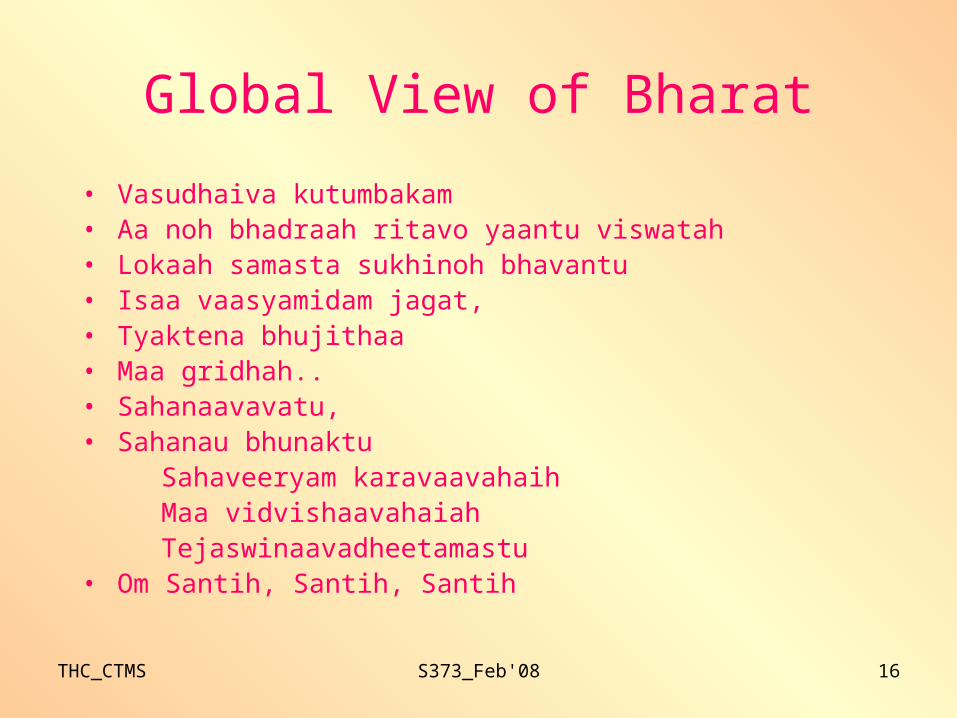
Global View of Bharat
• Vasudhaiva kutumbakam• Aa noh bhadraah ritavo yaantu viswatah• Lokaah samasta sukhinoh bhavantu• Isaa vaasyamidam jagat,• Tyaktena bhujithaa• Maa gridhah..• Sahanaavavatu,• Sahanau bhunaktu Sahaveeryam karavaavahaih Maa vidvishaavahaiah Tejaswinaavadheetamastu• Om Santih, Santih, Santih
THC_CTMS S373_Feb'08 17
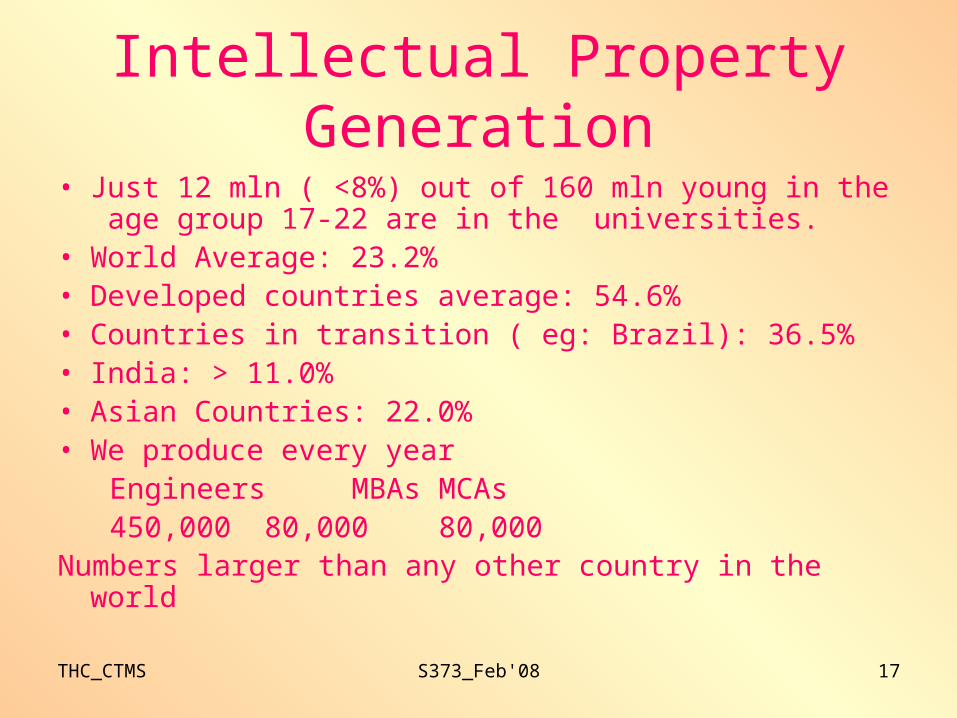
Intellectual Property Generation
• Just 12 mln ( <8%) out of 160 mln young in the age group 17-22 are in the universities.
• World Average: 23.2%• Developed countries average: 54.6%• Countries in transition ( eg: Brazil): 36.5%• India: > 11.0%• Asian Countries: 22.0%• We produce every year Engineers MBAs MCAs 450,000 80,000 80,000Numbers larger than any other country in the world
THC_CTMS S373_Feb'08 18
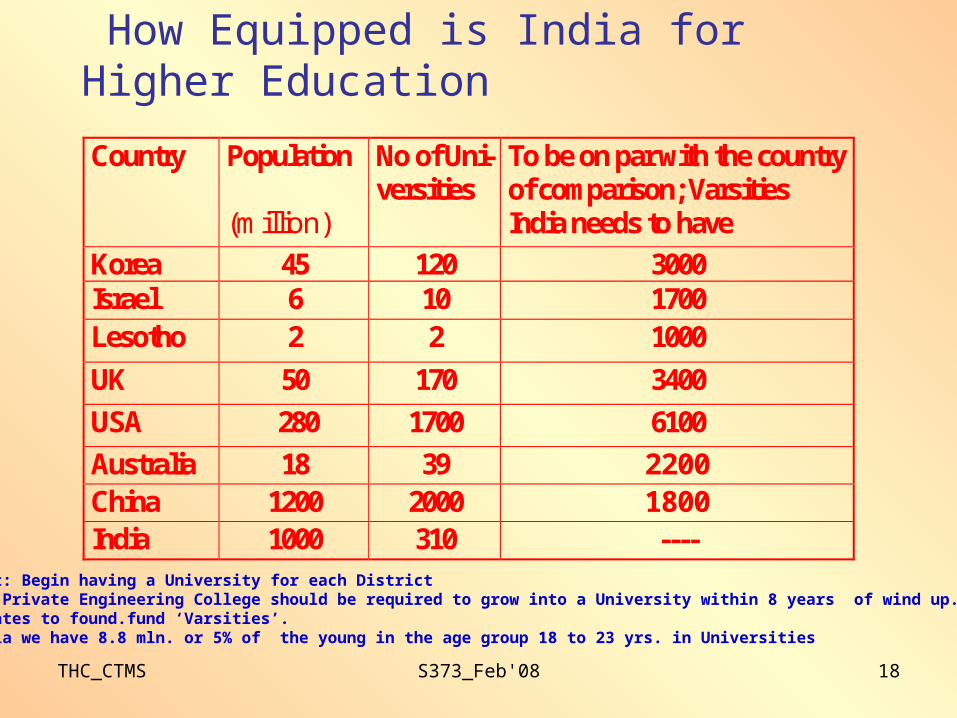
How Equipped is India for Higher Education
Country Population
(million)
No of Uni-versities
To be on par with the country of comparison; Varsities India needs to have
Korea 45 120 3000 Israel 6 10 1700 Lesotho 2 2 1000
UK 50 170 3400
USA 280 1700 6100
Australia 18 39 2200 China 1200 2000 1800 India 1000 310 ----
*Suggest: Begin having a University for each District* Every Private Engineering College should be required to grow into a University within 8 years of wind up.•Corporates to found.fund ‘Varsities’.•In India we have 8.8 mln. or 5% of the young in the age group 18 to 23 yrs. in Universities
THC_CTMS S373_Feb'08 19
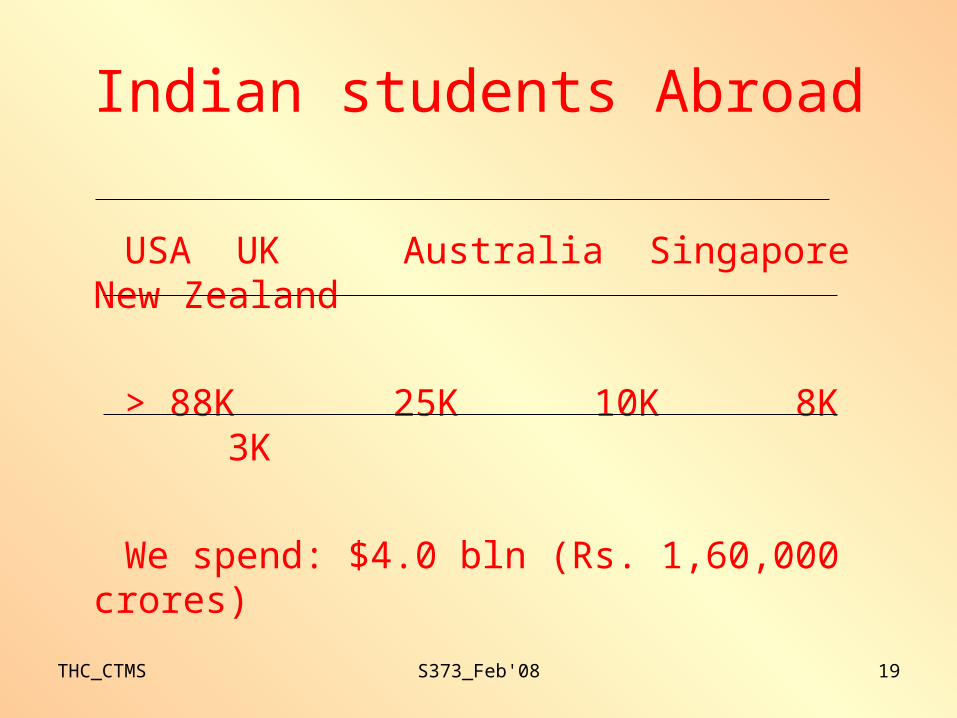
Indian students Abroad
USA UK Australia Singapore New Zealand
> 88K 25K 10K 8K 3K
We spend: $4.0 bln (Rs. 1,60,000 crores)
THC_CTMS S373_Feb'08 20
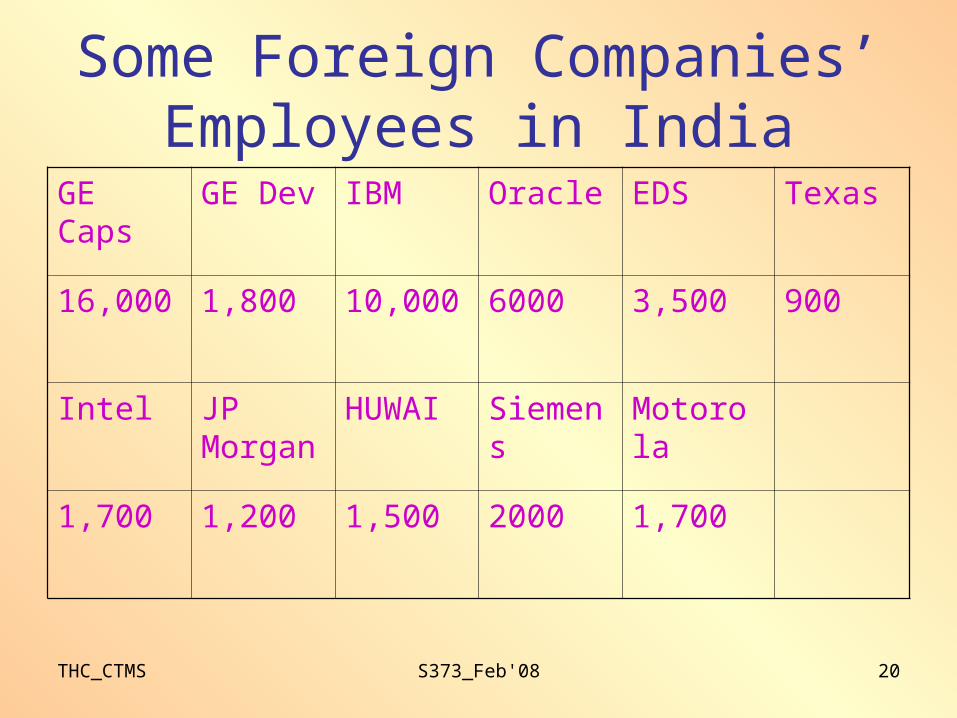
Some Foreign Companies’ Employees in India
GE Caps
GE Dev IBM Oracle EDS Texas
16,000 1,800 10,000 6000 3,500 900
Intel JP Morgan
HUWAI Siemens Motorola
1,700 1,200 1,500 2000 1,700
THC_CTMS S373_Feb'08 21
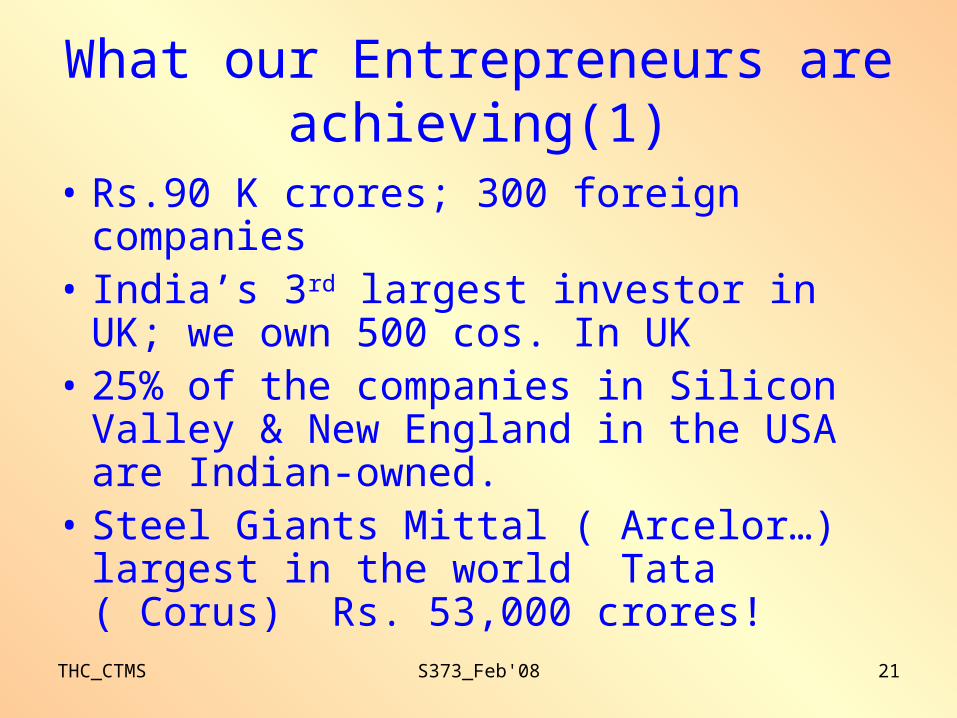
What our Entrepreneurs are achieving(1)
• Rs.90 K crores; 300 foreign companies• India’s 3rd largest investor in UK; we own
500 cos. In UK• 25% of the companies in Silicon Valley &
New England in the USA are Indian-owned.
• Steel Giants Mittal ( Arcelor…) largest in the world Tata ( Corus) Rs. 53,000 crores!
THC_CTMS S373_Feb'08 22
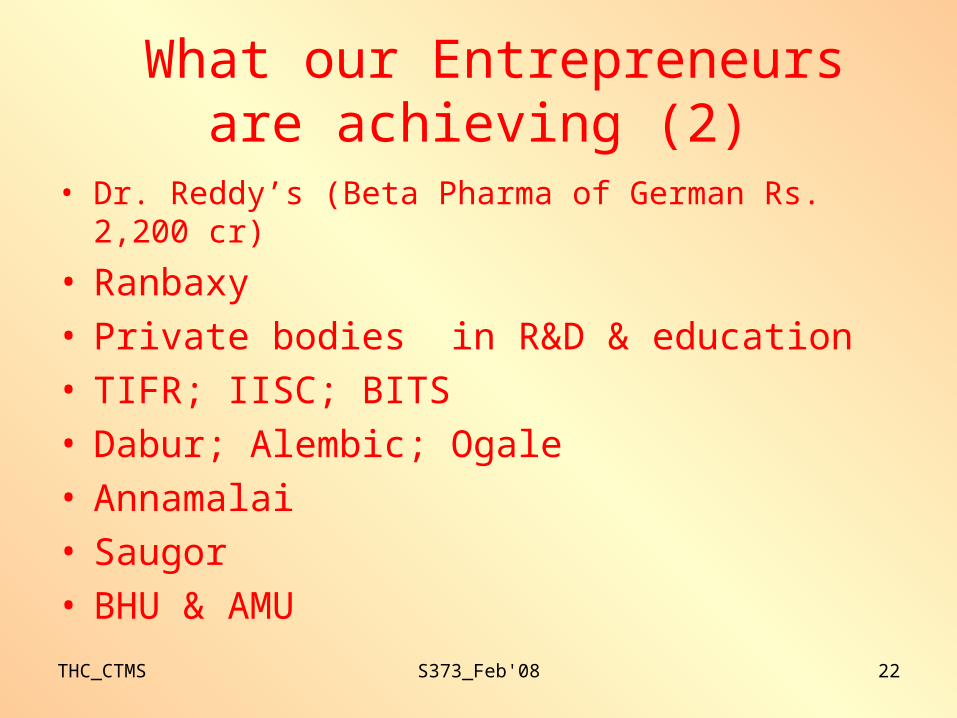
What our Entrepreneurs are achieving (2)
• Dr. Reddy’s (Beta Pharma of German Rs. 2,200 cr)
• Ranbaxy • Private bodies in R&D & education• TIFR; IISC; BITS • Dabur; Alembic; Ogale• Annamalai• Saugor• BHU & AMU
THC_CTMS S373_Feb'08 23
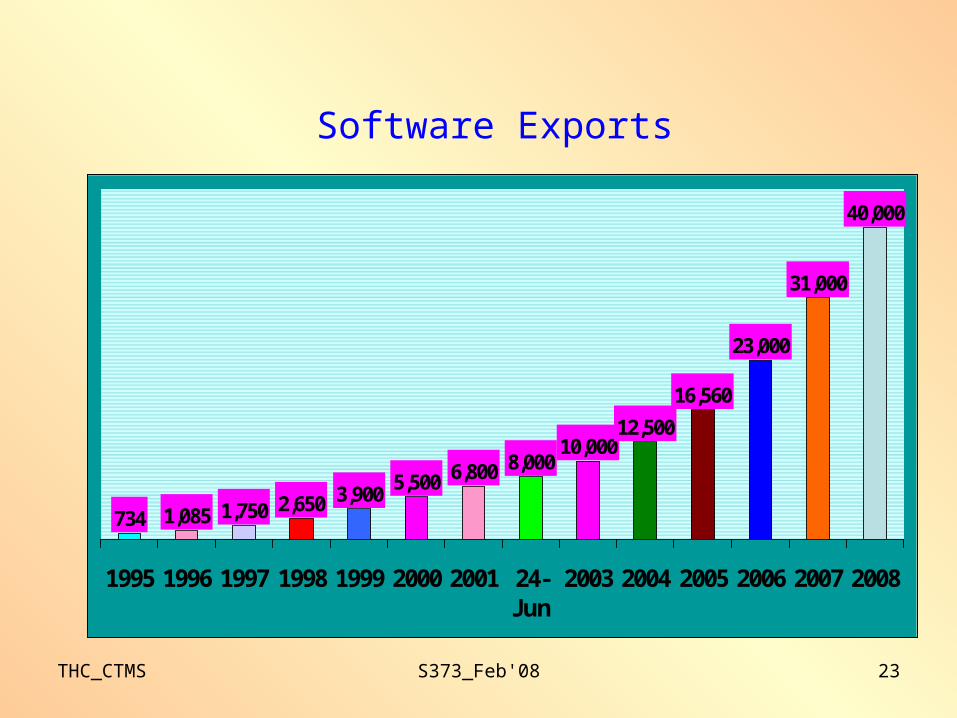
Software Exports
734 1,085 1,750 2,650 3,9005,500 6,800 8,000
10,00012,500
16,560
23,000
31,000
40,000
1995 1996 1997 1998 1999 2000 2001 24-Jun
2003 2004 2005 2006 2007 2008
THC_CTMS S373_Feb'08 24
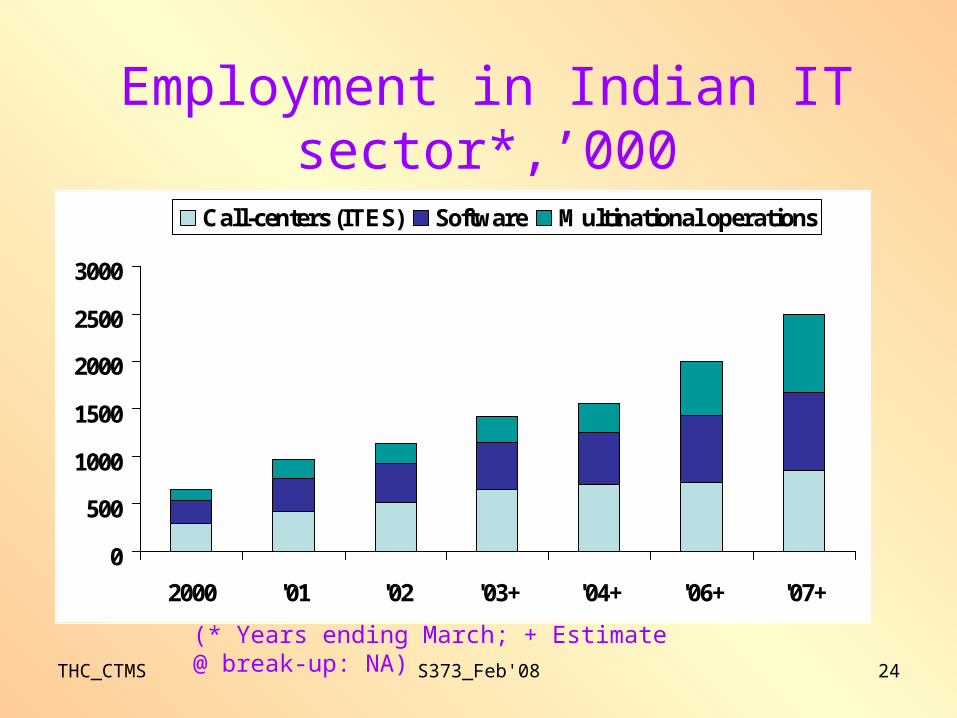
Employment in Indian IT sector*,’000
0
500
1000
1500
2000
2500
3000
2000 '01 '02 '03+ '04+ '06+ '07+
Call-centers (ITES) Software Multinational operations
(* Years ending March; + Estimate@ break-up: NA)
THC_CTMS S373_Feb'08 25
Dhanyawad: Thankyou


