
Science, Scientists, and Local Weather: … Scientists, and Local Weather: Understanding Mass...
35
Science, Scientists, and Local Weather: Understanding Mass Perceptions of Global Warming ∗ Wanyun Shao, Auburn University, Montgomery James C. Garand, Louisiana State University Barry D. Keim, Louisiana State University Lawrence C. Hamilton, University of New Hampshire Objective. To explore the effects of long-term climate trends and short-term weather fluctuations, evaluations of scientists and science, political predispositions, religious affiliation, the information environment, and demographic attributes on individuals’ views about whether global warming exists and, if so, whether it is a result of natural cycles or human activity. Methods. We use data from the 2009 Pew General Public Science Survey, along with data on long- and short-term patterns of temperature and precipitation in individuals’ home communities. Results. We find that long-term trends in summer temperatures influence perceptions of global warming. Individuals who reside in communities with long-term warming of summer temperatures that are coupled with long-term cooling of spring temperatures are significantly more likely to perceive that global warming exists and is due to human activity. We also find that Americans’ attitudes toward scientists and science, political dispositions, evangelical religious affiliation, education, and some demographic attributes all have discernible effects on their perceptions of anthropogenic (man-made) global warming. Conclusion. Individuals’ attitudes toward global warming are influenced by long-term temperature trends in their home communities, as well as a variety of attitudinal and demographic attributes. There are few topics in American politics today that generate as much controversy as the subject of global warming and climate change. 1 Americans are sharply divided on this issue. For many Americans, global warming is very real and the result of human activity, and climate change has the potential of generating catastrophic conditions of global proportions. For these Americans, a state of alarm is fully warranted, and complex effects ∗ Direct correspondence to Dr. Wanyun Shao, Department of Sociology, Anthropology, and Geography, Auburn University at Montgomery, P.O. Box 244023, Montgomery, AL 36124-4023 [email protected]; [email protected]. The author will provide all data and coding information to those wishing to replicate this study. In addition, there are numerous references throughout the article to an appendix that reports an extensive set of auxiliary analyses; interested readers can obtain a copy of this appendix by contacting Dr. Shao at the above e-mail addresses. The authors thank the Pew Research Center for the People and the Press for making available its data from the 2009 Pew General Public Science Survey. The authors acknowledge that the Center bears no responsibility for the interpretations presented or conclusions that we have reached based on our analyses of these data. 1 We note at the outset that we use the terms “climate change” and “global warming” interchangeably throughout the article. Many observers prefer the term “climate change,” though survey data used in this article are based on survey questions that refer to “global warming.” Further, we note the different definitions of “weather” and “climate.” By “weather,” we mean patterns of temperature, precipitation, and other atmospheric conditions that occur in the short term (i.e., today, over the past few days, or over the past week) at a location or in a specific geographic area. By “climate,” we refer to general, longer-term patterns (i.e., over months or years) of weather that characterize a location or geographic area. SOCIAL SCIENCE QUARTERLY C 2016 by the Southwestern Social Science Association DOI: 10.1111/ssqu.12317
Transcript of Science, Scientists, and Local Weather: … Scientists, and Local Weather: Understanding Mass...
Science, Scientists, and Local Weather:Understanding Mass Perceptions ofGlobal Warming∗
Wanyun Shao, Auburn University, Montgomery
James C. Garand, Louisiana State University
Barry D. Keim, Louisiana State University
Lawrence C. Hamilton, University of New Hampshire
Objective. To explore the effects of long-term climate trends and short-term weather fluctuations,evaluations of scientists and science, political predispositions, religious affiliation, the informationenvironment, and demographic attributes on individuals’ views about whether global warmingexists and, if so, whether it is a result of natural cycles or human activity. Methods. We use data fromthe 2009 Pew General Public Science Survey, along with data on long- and short-term patterns oftemperature and precipitation in individuals’ home communities. Results. We find that long-termtrends in summer temperatures influence perceptions of global warming. Individuals who reside incommunities with long-term warming of summer temperatures that are coupled with long-termcooling of spring temperatures are significantly more likely to perceive that global warming existsand is due to human activity. We also find that Americans’ attitudes toward scientists and science,political dispositions, evangelical religious affiliation, education, and some demographic attributesall have discernible effects on their perceptions of anthropogenic (man-made) global warming.Conclusion. Individuals’ attitudes toward global warming are influenced by long-term temperaturetrends in their home communities, as well as a variety of attitudinal and demographic attributes.
There are few topics in American politics today that generate as much controversy asthe subject of global warming and climate change.1 Americans are sharply divided on thisissue. For many Americans, global warming is very real and the result of human activity,and climate change has the potential of generating catastrophic conditions of globalproportions. For these Americans, a state of alarm is fully warranted, and complex effects
∗Direct correspondence to Dr. Wanyun Shao, Department of Sociology, Anthropology, and Geography,Auburn University at Montgomery, P.O. Box 244023, Montgomery, AL 36124-4023 〈[email protected];[email protected]〉. The author will provide all data and coding information to those wishing toreplicate this study. In addition, there are numerous references throughout the article to an appendix thatreports an extensive set of auxiliary analyses; interested readers can obtain a copy of this appendix by contactingDr. Shao at the above e-mail addresses. The authors thank the Pew Research Center for the People and thePress for making available its data from the 2009 Pew General Public Science Survey. The authors acknowledgethat the Center bears no responsibility for the interpretations presented or conclusions that we have reachedbased on our analyses of these data.
1We note at the outset that we use the terms “climate change” and “global warming” interchangeablythroughout the article. Many observers prefer the term “climate change,” though survey data used in this articleare based on survey questions that refer to “global warming.” Further, we note the different definitions of“weather” and “climate.” By “weather,” we mean patterns of temperature, precipitation, and other atmosphericconditions that occur in the short term (i.e., today, over the past few days, or over the past week) at a locationor in a specific geographic area. By “climate,” we refer to general, longer-term patterns (i.e., over months oryears) of weather that characterize a location or geographic area.
SOCIAL SCIENCE QUARTERLYC© 2016 by the Southwestern Social Science AssociationDOI: 10.1111/ssqu.12317

2 Social Science Quarterly
of rising temperatures call for immediate attention and action by both policymakers andthe mass public. For other Americans, global warming and climate change is merely “real,”insofar as there is some evidence that something is going on with the global climate butalso enough uncertainty about the causes of this phenomenon (or even whether it exists)that a state of crisis and alarm is not warranted. For these Americans, humankind is nota major player in climate change, any changes in global climate are due largely to naturalcycles that are beyond the control of humankind, and in any event there is little thatsociety can do to affect major changes in the world’s climate. Still other Americans denythat climate change exists at all. For these Americans, concerns about global warming arenot only unwarranted but rather represent a hyperbolic overreaction by environmentalextremists, the scientific community, and the mass media.
The disagreement about climate change in the mass public stands in contrast to theconsensus in the international scientific community about both the warming of globaltemperatures and the view that global warming is due to the cumulative effect of humanactivity over the past two centuries; indeed, almost 90 percent of scientists attribute climatechange to human activity (Funk, Rainie, and Page, 2015). How can the views of themass public and the views of the scientific community be so out of sync? It is likelythat Americans’ perceptions of climate change and its causes, as well as attitudes towardpolicies designed to alleviate climate change in the long run, are the result of a confluence offactors, including political attitudes, trust in scientist and science, specific knowledge aboutclimate change, exposure to information about climate change in the media and from othersources, and individuals’ own experiences with local weather and climate patterns. Someof these factors—especially political dispositions, attitudes toward science and scientists,and knowledge about climate change—may contribute to a distribution of opinion aboutclimate change within the mass public that differs in stark terms from the consensus ofopinion within the scientific community. (See Appendix A for a brief discussion of thescientific consensus on climate change and differences in perceptions by the mass public.)
In this article, we explore the role of local weather fluctuations and climate trends,science beliefs, and other social and cognitive predictors in shaping perceptions aboutclimate change. For instance, does local weather and climate help to understand why someAmericans are convinced that global warming is a major problem confronting the planet,while still other Americans are either ambivalent or deny its existence? Recently, otherscholars, using a variety of models and data sets, have explored such questions (cf. Eganand Mullin, 2012; Hamilton and Keim, 2009; Hamilton and Stampone, 2013; Kellstedt,Zahran, and Vedlitz, 2008; Lorenzoni and Pidgeon, 2006; Shao et al., 2014). We build onthis body of research by considering the effects of a wide range of predictor variables, but wefocus particular attention on the effects of long- and short-term patterns of local weatherand climate, as well the role of beliefs about science and scientists. We find that both positiveattitudes toward science and scientists, as well as long-term seasonal temperature trends inindividuals’ local environments, have a discernible effect on how Americans perceive globalwarming and its causes.
Previous Research on Mass Attitudes and Perceptions About Climate Change
What explains variation in individuals’ attitudes toward and perceptions of global warm-ing and climate change? Previous studies have identified several theoretical clusters ofvariables as determinants of public opinion toward global warming: (1) geographic and en-vironmental context, (2) attitudes toward scientists and science, (3) political predispositions

Science, Scientists, and Local Weather 3
and attitudinal variables, (4) the information environment, (5) religious beliefs and attach-ments, and (6) socioeconomic and demographic characteristics.
Geographic and Environmental Context. That weather could affect how individualsthink about climate change makes some sense. The role of local weather has a storied historyin studies of American electoral behavior, with the conventional wisdom that bad weatheron Election Day decreases voter turnout and favors Republicans in American electionsfinding considerable empirical support (Gomez, Hansford, and Krause, 2007). Regardingpublic perception of global warming, the effect of local weather has been estimated inseveral studies. Personal observation of local weather (Borick and Rabe, 2010; Krosnicket al., 2006; Myers et al., 2013), short-term weather fluctuations (Egan and Mullin, 2012;Hamilton and Stampone, 2013; Howe et al., 2013), and long-term temperature trends(Hamilton and Keim, 2009; Shao et al., 2014) have all been found to have significanteffects on public perception of global warming. Further, Hamilton and Stampone (2013)and Egan and Mullin (2012) find evidence that the effects of local short-term weatherfluctuations on perceptions of global warming vary systematically by partisanship andideology. It appears that local weather plays a role in shaping individuals’ attitudes towardand perceptions of global warming.
Attitudes Toward Scientists and Science. The scientific community has been theprimary advocate for the view that climate change is occurring and that it is the result ofhuman activity, so it would not be surprising that how Americans think about scientists andscience would affect their views of climate change. Indeed, Malka, Krosnick, and Langer(2009) find that trust in scientists has a powerful effect on the conversion of knowledgeabout global warming into perceptions of how serious climate change is as a problem. Onthe other hand, Kellstedt, Zahran, and Vedlitz (2008) find that confidence in science isnegatively related to concern with climate change; they suggest that this reflects confidencethat scientists will be able to come up with workable solutions for dealing with climatechange.
Political Predispositions and Attitudinal Variables. How individuals think aboutpolitics also influences how they think about global warming. The perception that globalwarming exists and is due to human activity leads many observers to the inexorableconclusion that effective government regulation of the emission of greenhouse gases isnecessary. For many, this means a substantial involvement of government in the regulationof individuals and the economy, such as the adoption of a carbon tax or cap and tradepolicies. Hence, individuals who are skeptical of governmental power and who favorindividualism over collective action would be less likely to perceive that global warmingis a problem and to support government action to combat global warming. In contrast toliberals, conservatives tend to favor individual freedom in the economic sphere and privateproperty rights over collective rights, as well as free market over governmental intervention,so we would expect conservatives to be more skeptical than liberals of anthropogenic globalwarming. In previous research scholars have found that Republicans and conservatives aremore likely to be skeptical of anthropogenic global warming than Democrats and liberals,and therefore these groups show lower levels of concern about global warming (Shao et al.,2014; McCright and Dunlap, 2011b; Malka, Krosnick, and Langer, 2009; Dunlap andMcCright, 2008; Pew Research Center, 2006, 2007; Gallup, 2008). Moreover, educationhas been found to have different effects on risk perception of global warming amongDemocrats and Republicans. While concern about global warming has been found to

4 Social Science Quarterly
increase with the level of education among Democrats or liberals, these concerns decrease orare invariant with the level of education among Republicans or conservatives (McCright andDunlap, 2011b; Hamilton and Keim, 2009; Hamilton, 2008, 2011, 2012; Pew ResearchCenter, 2007). It would appear that partisanship has a direct effect on attitudes towardglobal warming, but partisanship also serves to filter information about global warming.
Information Environment. Because the scale of global warming transcends personalexperience, public understanding of this phenomenon is reliant on a variety of informationsources. The role of the media has drawn particular attention in the scholarly literature.Indeed, the mass media’s pursuit of “balance” by employing “dueling scientists” to coverboth sides has helped to maintain the public impression of broad scientific disagreementabout the reality of global warming (Boykoff, 2008; Boykoff and Boykoff, 2004; Dunlap,1998). Moreover, previous studies produce confusing results about the effect of attentionon public perception of global warming; Kellstedt, Zahran, and Vedlitz (2008) find thatthe level of information about global warming is negatively associated with concern aboutthis issue, while Wood and Vedlitz (2007) find that respondents who are more attentive toglobal warming have higher level of concern about this issue. Trust in these informationsources also comes into play as an important moderating force (Malka, Krosnick, andLanger, 2009). Krosnick et al. (2006) find that television exposure is positively associatedwith belief in the existence of global warming only among individuals who have highlevel of education and show more trust in scientists. Finally, education has usually beenhypothesized to be positively associated with environmental concern, but empirical testshave generated mixed results. Arguably, individuals with high levels of education are betterinformed about environmental matters and are more sensitive to perceptions of risk thanothers. Hamilton (2008, 2011, 2012) provides support for this hypothesis, showing thathigher levels of education are associated with greater concern or belief in the reality of climatechange. Egan and Mullen (2012) find that individuals who have completed postgraduatework are more likely to perceive that there is “solid evidence” of global warming.
Religious Beliefs and Attachments. The role of religion in shaping Americans’ attitudestoward climate change has drawn some scholarly attention in recent years. The argumentis that the teachings of many religions stress the role of stewardship in describing the rela-tionship between human society and nature. Jones, Cox, and Navarro-Rivera (2015) doc-ument basic differences in concern about climate change across religious affiliations, withwhite evangelical Christians (35 percent) exhibiting the lowest level of concern, followed bywhite Catholics (41 percent) and mainline Protestants (43 percent) as groups with less than50 percent of adherents saying that they are “very concerned” or “somewhat concerned.”For other religious affiliations, a majority of adherents express some level of concernwith climate change: Jews (53 percent), the non-Christian religious (56 percent), blackProtestants (58 percent), the religious unaffiliated (60 percent), and Hispanic Catholics(73 percent). The finding that American evangelicals are less concerned by climate change isreinforced by Smith and Leiserowitz (2013). Moreover, scholars have explored evidence forthe “greening of Christianity” (Van Dyke et al., 1996; Wilkinson, 2010, 2012; Clements,McCright, and Xiao, 2014). The study of the role of religion in influencing attitudestoward climate change is likely to develop further as debates about Pope Francis’s recentclimate change encyclical are played out in the near future.
Socioeconomic and Demographic Characteristics. Numerous scholars have exploredthe effects of socioeconomic and demographic factors on public perceptions of and attitudes

Science, Scientists, and Local Weather 5
toward climate change (cf. Brody et al., 2008; Dietz, Dan, and Shwom, 2007; Dunlapand McCright, 2008; Hamilton and Keim, 2009; Hamilton, 2012; Krosnick et al., 2006;Leiserowitz, 2006; Shao et al., 2014). First, the effects of race and gender appear to berelatively stable across studies of public perception and attitudes relating to global warming.Racial minorities and women are typically found to have higher levels of public concernabout climate change (Leiserowitz, 2006; Malka, Krosnick, and Langer, 2009; McCrightand Dunlap, 2011b; Shao et al., 2014). Second, the effect of age on public attitudes towardglobal warming is usually found to be negative, indicating that older individuals tend toshow lower levels of concern for global warming (Hamilton, 2012; Hamilton et al., 2012;Kellstedt et al., 2008; Krosnick et al., 2006; Malka, Krosnick, and Langer, 2009; McCrightand Dunlap, 2011b; Shao et al., 2014). Third, income and other variables relating to socialclass have been hypothesized to be negatively related to attitudes toward global warming.This may well be due to the high costs likely to be borne by individuals with high incomesshould policies designed to combat global warming be adopted. In previous research incomehas a negative effect on public risk perceptions of climate change (Hamilton and Keim,2009; Shao et al., 2014) and concern for this issue (McCright and Dunlap, 2011b), thoughHamilton (2008) shows that higher levels of income are associated with greater concernfor some impacts of global warming.
Data and Methods
We investigate the effects of geographic and environmental context, attitudes towardscientists and science, political predispositions and attitudinal variables, the informationenvironment, religious beliefs and attachments, and socioeconomic and demographic char-acteristics on individuals’ perceptions of global warming. Our strategy is to combine surveydata with aggregate weather and climate data linked to the geographic areas within whichsurvey respondents reside. In order to explore the determinants of individuals’ perceptionsof global warming, we rely on data from the 2009 Pew Research Center for the Peopleand the Press General Public Science Survey, conducted nationally from April 28 to May12, 2009 for a representative sample of 2,001 individuals aged 18 or above (Pew ResearchCenter, 2009). This survey includes a rich set of variables, including items that specificallyask respondents’ about their perceptions of global warming. The survey also asked respon-dents a series of questions that permit us to measure key independent variables. Moreover,the geographic information collected at the zip-code level permits us to identify the geo-graphic context within which each respondent resides so that we can merge local weatherdata with survey data. (For more detail on how we merge survey and contextual data, seeAppendix B.)
What are the components of our model of individuals’ perceptions of global warming?We discuss here the independent variables used in our model of public opinion towardglobal warming. A brief summary of the variables used in this analysis and their coding canbe found in Appendix Table B1, and descriptive statistics for these variables are presentedin Appendix Table B2.
Dependent Variable
The dependent variable in our models is based on responses to the following questionasked in the 2009 Pew General Public Science Survey: “Which of these three statements

6 Social Science Quarterly
about the earth’s temperature comes closest to your view?” This variable is coded 0 forthose who respond that “the earth is not getting warmer,” 1 for those who respondthat “the earth is getting warmer mostly because of natural changes in the atmosphere,”and 2 for respondents who indicate that “the earth is getting warmer mostly because ofhuman activity such as burning fossil fuels.” Among these three views on global warming,87.5 percent of respondents believe in either natural or anthropogenic global warming,while only 12.5 percent do not believe global warming is occurring. This suggests that thelarge majority of the public accepts that global warming is a reality. Among those who believethat global warming is taking place, whether global warming is mainly anthropogenic ornatural is hotly debated. Indeed, 37.2 percent of respondents believe that the earth iswarming mainly because of a naturally occurring cycle, while 50.3 percent believe thatthe earth is warming mainly because of human activities. Only about 50 percent of thepublic accepts the scientific consensus that global warming is occurring and is the resultof processes influenced by human activity. A detailed justification for this measure can befound in Appendix C.
Independent Variables
Local Weather and Climate. We consider the effects of local weather and climate onindividuals’ perceptions of the existence of global warming and that global warming isattributed to human activity. One of the problems with studying the effects of objectiveweather and climate on perceptions of climate change is in determining the proper timehorizon for considering these effects. There are plenty of data on weather conditionsat the local level and over extensive time periods, but it is unclear at which temporallevel weather influences how individuals perceive their local climate. What makes thestrongest impression in the minds of individuals as they consider local weather and climateconditions? Are individuals influenced by weather patterns in the short term—that is, inthe past few days or weeks? Are individuals more likely to perceive that climate change isoccurring if temperatures in the past few days are unseasonably warm? Alternatively, areindividuals aware of long-term climate trends in the local environments—say, over the past10 or 20 years—and do these trends affect how they think about climate change? Or doindividuals consider and take notice of comparisons in weather or climate patterns acrossseasons—for instance, from cold winters or springs to warm summers? Do unseasonablycold and warm seasons draw the attention of individuals in their thinking about climatechange?
Different scholars use different time horizons in estimating the effects of weather andclimate on perceptions of climate change, but to date there are no firm theoretical reasonspresented in the literature to favor one time horizon over another. We suggest that thereare two temporal attributes of information and personal experiences that may underliethe effects of weather and climate on individuals’ perceptions of climate change. The firstis temporal proximity—that is, the degree to which individuals have experienced or beenexposed to information about notable weather patterns in the recent past. With all elseequal, human memory favors proximate events over those that are in the distant past, so onemight expect recent weather events or patterns to be more easily and accurately retrievedfrom memory and hence play a bigger role in shaping individuals’ perceptions of climatechange. For instance, individuals who experience unseasonably warm temperatures overthe past few days are much more likely to remember those temperatures and that they areunusually high than if they experienced unusually warm temperatures for a single week10 or 20 years ago.
Science, Scientists, and Local Weather 7
The second temporal attribute of information and personal experiences that might relateto perceptions of climate change is long-term temporal consistency. When members of thescientific community discuss climate change or global warming, they are not talking abouttemperature deviations that have been observed over the period of a few days or weeks.Rather, scientific discussions of climate change focus on long-term patterns of temperature,precipitation, and other weather events. Hence short-term weather fluctuations are notevidence of climate change. When individuals experience short-run climate patterns in theirlocal environments that deviate from long-term patterns, they integrate these experiencesinto their short-term memory, but when climate patterns return to normal, the unusualexperiences eventually are either forgotten or are else more difficult to retrieve from memory.However, when these short-term deviations from the previous normal pattern are repeatedover an extended time period, individuals’ experiences (and resulting memories) of unusuallocal climate patterns begin to accumulate, and over the long run individuals begin to realizethat the change in weather patterns may actually represent a change in long-term climate.We suggest that individuals who reside in geographic localities that experience long-term,consistent patterns of climate change (i.e., those that are consistent with scientific evidenceof global warming) will be more likely to perceive local climate change and attribute theselong-term climate shifts to global climate change. On the other hand, individuals whoreside in localities that experience stable climate patterns over time will have little in theircollection of personal experiences to support assertions of global climate change.
In order to explore the effects of weather and climate patterns on perceptions of globalwarming, it is necessary to measure local weather and climate variables in a way thatcaptures different time horizons through which weather and climate could influence in-dividuals’ thinking about climate change. We begin by creating four seasonal temperatureand four seasonal precipitation trends using data from the U.S. Historical Climate Net-work (USHCN). These trends are measured for the winter (December, January, February),spring (March, April, May), summer (June, July, August), and fall (September, October,November) and are based on the mean seasonal temperatures for each year. These trendvariables are calculated using data over the past 10 years prior to the survey date.2 Consid-ering that the survey was conducted from April 28–May 12, 2009, for winter and springwe calculate temperature and precipitation trends from 2000 to 2009, while for summerand fall, we calculate trends from 1999 to 2008 to capture the long-term climate trendsin each respondent’s immediate environment. Specifically, we regress the average seasonaltemperature or precipitation for a particular season on year, and we use the unstandardizedbivariate regression coefficient to represent seasonal trends.
Our hypotheses relating to these long-term local temperature indicators are quite simple,insofar as we suggest that positive trends in temperatures for each season are positivelyassociated with public perceptions of global warming. We speculate that individuals whoexperience rising seasonal temperatures in their home communities over the past 10 yearsare more likely to believe that global warming is occurring and mainly human induced.3
For our precipitation trend variables, the hypothesized directions are less clear, so we test
2We also create variables that measure seasonal temperature trends over the past 40, 30, 20, 10, and 5 years.Our results suggest that seasonal temperature trends over the past 10 years yield the strongest empirical results.The results indicate that individuals are most responsive to 10-year trends than long-term trends for otherdurations.
3There is some evidence that winter and summer temperatures are particularly relevant as determinantsof individuals’ perceptions of global warming. As noted in Hamilton and Keim (2009), warming wintertemperatures in snow country are associated with public perceptions of global warming. This suggests thatindividuals who experience rising winter temperatures in their home communities over the past 10 years aremore likely to believe that global warming is occurring and mainly human induced. On the other hand, inwarmer parts of the country summer may be the season in which people are most aware of rising temperatures

8 Social Science Quarterly
the coefficients for these variables using statistical criteria associated with nondirectionalhypotheses.
In addition, we capture short-term weather fluctuations by including two weather mea-sures: (1) average temperature departure from normal temperature during April 2009,which is the month prior to the survey dates, and (2) average precipitation departure fromnormal precipitation, also during April 2009.4 To account for relative weather fluctuationin different regions, these departures are normalized (i.e., measured in standard deviationunits).
Attitudes Toward Scientists and Science. We suggest that the attitudes toward scien-tists can have important effects on individuals’ perceptions of global warming. Individualswho have positive views toward scientists and who perceive that there is a scientific con-sensus about global warming are more likely than others to perceive that global warming isa problem. To capture these effects, we include three independent variables in our models.First, we measure individuals’ general evaluations of scientists’ contributions to society,coded from 0 (nothing at all) to 3 (a lot). We hypothesize that this variable is positivelyassociated with the dependent variable, indicating that those with positive views aboutscientific contributions are more likely to perceive that global warming is taking place andthat it is caused by human activity. Second, scientists’ ideology reflects respondents’ percep-tions of the ideological position of scientists and is measured as a three-point scale rangingfrom −1 (scientists are liberal) to 1 (scientists are conservative). Because perceptions ofglobal warming are perceived to involve an environmentalist or liberal worldview, somecritics perceive that global warming is exaggerated (at best) or manufactured (at worst) byliberal scientists to force environmental action on the American political system. Giventhis, we hypothesize that the coefficient for this variable will be positive, indicating thatindividuals who perceive that scientists are conservative (liberal) will be more (less) likelyto perceive the existence and severity of global warming. Third, we speculate that peoplewho believe there is a consensus on global warming among scientists would be more likelyto accept global warming and the argument that global warming is mainly caused by humanactivity. This variable is coded 1 for those who perceive that “scientists generally agree thatthe earth is getting warmer” and 0 for those who disagree. The coefficient for this variableis expected to be positive.
We also include two items from the Pew Science Survey that capture the attitudes ofthe mass public toward science in general. The first variable represents the degree to whichindividuals perceive that scientists have a positive effect on American life. This variableis a scale derived from a factor analysis of three items: (1) science effects on society,which is coded as a three-point scale, ranging from −1 (mostly negative) to 1 (mostlypositive); (2) science effects on life, which is coded as a three-point scale ranging from −1(science makes life more difficult) to 1 (science makes life easier); and (3) science effectson the environment, which is also a three-point scale ranging from −1 (mostly negative)to 1 (mostly positive). All three items load on one factor (eigenvalue = 1.513; variance
because of the greater discomfort from summer heat and the need for more air conditioning. This suggeststhat individuals who experience increasingly hot summers in their local communities over the past decade aremore likely to perceive global warming and tend to attribute global warming to anthropogenic causes.
4It is important to note that our measure of “short-term” temperature and precipitation fluctuations aredifferent than those reported in the literature, most notably in the work of Egan and Mullin (2012) andHamilton and Stampone (2013). In both of these works, the authors use daily data to create a measure ofshort-term temperature and/or precipitation in the week (Egan and Mullin) or two-day period prior to orincluding the survey interview. Our “short-term” measure captures temperature and precipitation fluctuationsover the longer time period of a single month.

Science, Scientists, and Local Weather 9
explained = 0.504). We speculate that people who perceive that science has positive effectswill be more likely to believe that global warming is occurring and/or is a result of humanactivity. A second indicator of individuals’ attitudes toward science represents whetherrespondents perceive that government investments in basic scientific research usually payoff in the long run; this variable is coded 1 for those who agree that government investmentsin scientific research pay off, and 0 otherwise. We hypothesize that greater confidence inscientific research promotes individuals’ beliefs in anthropogenic global warming.
Political Predispositions. We include two political attitudinal variables in our models,partisan identification and ideology, both of which have been shown to be important pre-dictors of perception of global warming. We measure partisan identification by combiningtwo items from the Pew Survey—one measuring the direction of partisanship, and theother measuring the degree to which professed independents lean toward one party or theother. The result is a partisanship variable that is measured on a five-point scale, rangingfrom 0 (Democrat) to 4 (Republican). Moreover, we measure respondents’ self-reportedideology based on a five-point scale, ranging from 0 (very liberal) to 4 (very conservative).We hypothesize that people who are conservative and are Republicans are more likely tobe skeptical of anthropogenic global warming and global warming more generally. Finally,because previous studies have shown that partisanship interacts with education to generatevariation in perceptions of global warming (McCright and Dunlap, 2011b; Hamilton,2011, 2012; Hamilton and Keim, 2009), we include an interaction variable for partisanidentification and education in our models. We hypothesize that in our interaction modelsthe (noninteraction) coefficients for education will be positive, indicating the effects of thisvariable for Democratic partisans (i.e., for whom partisan identification is equal to 0). Thecoefficients for our interaction variable are expected to be negative, indicating that as indi-viduals become more Republican the effect of education on perceptions of global warmingbecomes less positive and, for the strongest Republican partisans, possibly negative.
Information Environment. The issue of global warming is complex, and individuals’perceptions on this issue will be at least partly a function of the information to which theyare exposed. Individuals who are knowledgeable about public affairs and science, as well asindividuals who are exposed to information about global warming, should be more likelyto perceive that global warming exists and/or is a result of human activity.
Any study of the effects of the information environment on perceptions of global warmingshould start with education. We measure education on a seven-point scale, ranging from 0(respondent has completed eight grades or less and no diploma) to 6 (respondent has earneda postgraduate degree). We hypothesize that individuals with higher levels of educationare more likely to perceive global warming and to attribute it to human activity. Hence,the coefficient for this variable should be positive though, as noted, this effect may bemoderated by partisanship.
Second, we use a survey item that specifically measures respondents’ knowledge aboutglobal warming by asking respondents about this basic scientific fact: “What gas do mostscientists believe causes temperatures in the atmosphere to rise?” We code this variable 1 forrespondents who provide the correct answer (i.e., carbon dioxide), and 0 for other respon-dents. We hypothesize that individuals with sufficient knowledge about global warmingthat they are able to correctly recall the correct answer are more likely to accept both globalwarming (in general) and anthropogenic global warming.
Third, we consider the effects of media use, suggesting that individuals who are heavymedia users may be either more or less likely to perceive global warming as a matter of

10 Social Science Quarterly
concern. We measure both general media use and attention to science news on four-pointscales, with each ranging from 0 (not at all enjoy keeping up with news) to 3 (enjoykeeping up with news a lot). The third variable, which we denote as “scientific mediause,” is based on a factor analysis of three items: (1) “Do you regularly watch televisionprograms or channels about science such as Nova or Discovery Channel, or not?” (2) “Doyou regularly visit science web sites and blogs, such as NOAA.gov or ScienceDaily.com, ornot?” (3) “And do you regularly read science magazines, such as Popular Science or ScientificAmerican, or not?” All three of these variables are binary variables, coded 1 (regularly)and 0 (not regularly). We find that these items load on a single dimension (eigenvalue =1.418, variance explained = 0.473). Because there is some dispute in the literature aboutthe direction of the effects of media use, we employ a two-tailed test in evaluating thecoefficients for these media variables.
Religious Beliefs and Attachments. In order to capture the possible effects of reli-gion, we include in our models a series of dichotomous variables representing each ofthe following religious groups: (1) white evangelical Protestants, (2) black Protestants,(3) mainline Protestants, (4) Catholics, (5) other Christian, (6) Jewish, (7) Mormon,(8) other religion, and (9) secular. Each of these variables is coded 1 for respondents whoare members of the specific religious group, and 0 otherwise. Following previous research,we hypothesize that white evangelicals will be the least likely to perceive that climate changeis occurring and/or is due to human activity, so this is the excluded (contrast) group in ourmodels. Hence, we hypothesize that the coefficients for the other religious group variableswill be positive. Moreover, we include in our model a measure of respondents’ frequency ofreligious service attendance, which reflects the possibility that individuals will be exposedto alternative information sources that may downplay the certainty of science. This variableis measured on a scale ranging from 0 (never attend services) to 5 (more than once a week).The frequency of attending religious services has been shown to have a negative effect on theperception of local effects from climate change (Hamilton and Keim, 2009; McCright andDunlap, 2011b). Hence, we posit that individuals who attend religious services more oftenare less likely to believe in anthropogenic global warming or global warming in general.
Demographic Characteristics. These variables serve as control variables in our models.First, we posit that individuals’ perceptions of global warming are shaped by race andgender. In previous studies scholars have shown that racial minorities and women aremore sensitive to and concerned about risks due to their vulnerabilities. Given this, wecreate two separate binary variables to represent race (1 = white; 0 = other) and gender(1 = women; 0 = men). We hypothesize that the coefficients for race in our various modelsare negative, while the coefficients for gender are positive. Second, we include income andage in our models. We measure income on a scale ranging from 1 (respondent earned lessthan $10,000) to 9 (respondent earned $150,000 or more). We hypothesize that there willbe a negative relationship between income and perceptions of global warming. We alsomeasure respondents’ age in years, ranging from 18 to 95 years. As suggested by previousresearch, we speculate that older people are less likely to believe in global warming and toperceive that global warming is due to human activity.
Empirical Results
As a starting point, in Model (1) of Table 1, we report estimates for our model ofindividuals’ perceptions of global warming to include individual-level attributes but without

Science, Scientists, and Local Weather 11
TABLE 1
Ordered Logit Estimates for Models of Perceptions About Global Warming, as a Functionof Attitudes, Politics, Information, Demographics, and Climate
Model (1) Model (2)
Variable b z b z
Climate: 10-year temperature trendsWinter [+] – – −0.027 −0.75Spring [+] – – −0.159 −1.88Summer [+] – – 0.123 1.74∗
Fall [+] – – 0.074 0.93Climate: 10-year precipitation trends
Winter [+/−] – – −0.002 −0.31Spring [+/−] – – 0.006 1.02Summer [+/−] – – 0.001 0.11Fall [+/−] – – −0.006 −0.75
Weather: short-term fluctuationDeparture from normal temperature [+] – – 0.040 0.26Departure from normal precipitation [+/−] – – −0.124 −1.47
Attitudes toward scientists and scienceScientists’ contributions [+] 0.337 2.71∗∗∗ 0.309 2.12∗
Scientists’ ideology [+] 0.259 2.12∗ 0.267 2.03∗
Scientists’ consensus [+] 1.577 11.37∗∗∗ 1.586 11.28∗∗∗
Science effects [+] −0.051 −0.68 −0.050 −0.55Investment in science [+] 0.721 4.22∗∗∗ 0.790 4.08∗∗∗
Political predispositionsLiberal–conservative ideology [−] −0.283 −3.46∗∗∗ −0.298 −3.46∗∗∗
Partisan identification [−] −0.045 −0.36 −0.029 −0.24Education [+] 0.257 3.98∗∗∗ 0.244 3.92∗∗∗
Partisan identification ∗education [−] −0.062 −2.50∗∗ −0.064 −2.69∗∗
Religion variablesBlack Protestant [+] −0.438 −1.23 −0.470 −1.22Mainline Protestant [+] 0.769 3.38∗∗∗ 0.749 2.97∗∗
Catholic [+] 0.168 0.86 0.185 0.85Other Christian [+] 0.152 0.56 0.154 0.54Jewish [+] 1.122 1.80∗ 1.094 2.24∗
Mormon [+/−] 1.218 2.09∗ 0.770 1.07Other religion [+/−] 0.568 1.20 0.463 1.00Secular [+] 0.153 0.62 0.159 0.56Church attendance [−] −0.025 −0.48 −0.005 −0.09
Information environmentScientific knowledge [+] 0.211 1.36 0.216 1.22Church attendance [−] −0.025 −0.48 −0.005 −0.09General media use [+/−] 0.003 0.04 0.010 0.12Scientific media use [+/−] −0.032 −0.48 −0.038 −0.59
Demographic attributesAge [−] −0.009 −2.17∗ −0.010 −2.22∗
Gender [+] 0.295 2.12∗ 0.283 1.90∗
Income [−] −0.061 −1.83∗ −0.060 −1.72∗
White [−] −0.296 −1.28 −0.337 −1.19N 1,161 1,143Pseudo R2 0.226 0.233Wald χ2 500.31 439.58Probability (χ2) 0.0000 0.0000
∗∗∗Probability < 0.001 (one-tail test); ∗∗probability < 0.01 (one-tail test); ∗probability < 0.05 (one-tail test).NOTE: z statistics in Model (2) are based on standard errors estimated with clustering by weather station.The constant terms are omitted from the table for the sake of brevity.DATA SOURCE: 2009 Pew General Public Science Survey.

12 Social Science Quarterly
our measures of climate and weather. In Model (2), we add the contextual climate variablesto the model. Both models perform well in general terms; the pseudo-R2 values in themodels are 0.226 and 0.233, respectively, and the Wald χ2 statistics are highly significant,indicating that the models do a much better job at predicting individuals’ perceptions ofglobal warming than what one would expect by chance.5 We focus our attention on theresults from Model (2) and include the results from Model (1) for purposes of comparison.
Long- and Short-Term Climate and Weather Effects
We begin by considering the effects of long- and short-term climate and weather effects.In Model (2) of Table 2, we report the results for a model that permits us to explore theeffects of various climate and weather variables on perceptions of global warming. Here,our analytical strategy is to add to our core model a series of variables that capture long-term (10-year) trends in temperature and precipitation in our survey respondents’ localcommunities for each of the four seasons, as well as short-term fluctuations in weatherpatterns. As one can see from a comparison of the results from Models (1) and (2), there islittle difference in the magnitude and significance of the coefficients for the variables fromour core model.
The effects of 10-year climate trends and short-term weather deviations are generallyquite modest. First, none of the coefficients for the variables representing 10-year seasonalprecipitation trends are statistically significant; simply, upward or downward trends in pre-cipitation over the past 10 years are unrelated to how individuals perceive global warming.It would appear that precipitation trends in individuals’ local communities are not a majorconsideration as they are developing their perceptions of anthropogenic global warming.Second, short-term departures from normal temperatures and normal precipitation (i.e.,departures over the month prior to the survey dates) are also unrelated to the dependentvariable. While two other studies (Egan and Mullin, 2012; Hamilton and Stampone, 2013)report short-term temperature effects on climate change beliefs, we do not see such effectsin these data. Our findings are not necessarily incompatible with those of these otherscholars, since our measure of “short-term” weather fluctuations covers a longer timeframethan in these other works. Our measure captures the effects of weather in the recent past,as opposed to the immediate past.
What we do find is some mixed evidence about the effects of long-term trends inseasonal temperatures on perceptions of global warming. We speculate that increases inwinter temperatures would have a strong effect on global warming perceptions, but thisis not the case (b = −0.027, z = −0.75). It appears that individuals who reside ingeographic areas with an upward trend in winter temperatures are no more or no lesslikely to perceive that global warming exists and is due to human activity. Our coefficientsfor fall temperature trends are also small and statistically nonsignificant. Surprisingly, thecoefficient for spring temperature trends is negative, though it barely misses conventionallevels of statistical significance in a two-tailed test (b = −0.159, z = −1.88). However, wedo find evidence that upward trends in summer temperatures have an effect on perceptionsof anthropogenic global warming (b = 0.123; z = 1.74). In Appendix Figure C1, wepresent the predicted probabilities for our three global warming outcomes as a function ofsummer temperature trends; based on these results, one can see that increases in summer
5We conduct regression diagnostics for multicollinearity among the independent variables for each modelpresented in this study. In no case are the variance inflation factors (VIFs) sufficiently large to suggest that thisis a matter of concern.

Science, Scientists, and Local Weather 13
TABLE 2
Ordered Logit Estimates for Models of Individuals’ Perceptions of Global Warming, withVariable for Spring–Summer Temperature Trend Difference,
2009 Pew General Public Science Survey
Variable b z
Climate: 10-year temperature trendsSpring–summer trend difference [+] 0.145 2.70∗∗
Attitudes toward scientists and scienceScientists’ contributions [+] 0.311 2.14∗
Scientists’ ideology [+] 0.254 1.95∗
Scientists’ consensus [+] 1.583 11.29∗∗∗
Science effects [+] −0.056 −0.63Investment in science [+] 0.782 4.09∗∗∗
Political predispositionsLiberal–conservative ideology [−] −0.307 −3.61∗∗∗
Partisan identification [−] −0.043 −0.35Education [+] 0.247 3.98∗∗∗
Partisan identification ∗education [−] −0.061 −2.58∗∗
Religion variablesBlack Protestant [+] −0.553 −1.47Mainline Protestant [+] 0.706 2.83∗∗
Catholic [+] 0.162 0.77Other Christian [+] 0.140 0.49Jewish [+] 1.091 2.32∗∗
Mormon [+/−] 0.810 1.16Other religion [+/−] 0.476 1.02Secular [+] 0.125 0.44Church attendance [−] −0.008 −0.14
Information environmentScientific knowledge [+] 0.221 1.25General media use [+/−] 0.006 0.07Scientific media use [+/−] −0.034 −0.53
Demographic attributesAge [−] −0.010 −2.22∗
Gender [+] 0.277 1.87∗
Income [−] −0.062 −1.78∗
White [−] −0.357 −1.26N 1,143Pseudo R2 0.231Wald χ2 424.61Prob (χ2) 0.0000
∗∗∗Probability < 0.001 (one-tail test); ∗∗probability < 0.01 (one-tail test); ∗probability < 0.05 (one-tail test).NOTE: z statistics are based on standard errors estimated with clustering by weather station. The constantterms are omitted from the table for the sake of brevity.
temperature trends result in an increase in the probability that one perceives that globalwarming is due to human activity and a decrease in the probability of perceiving no globalwarming or global warming based on natural cycles. The increase in the probability ofperceiving anthropogenic global warming is not trivial; as they move from the lowest tothe highest trend in local summer temperatures, individuals increase the probability ofperceiving that global warming is due to human activity by about 0.20.
While it appears that summer temperature trends have a positive effect on individualsperceptions of anthropogenic global warming, one other possibility is that individuals’

14 Social Science Quarterly
perceptions of global warming may be sensitive to temperature trends that show greaterdisparity from one season to the next. We see that warmer summer temperatures inindividuals’ communities increase the perceptions of anthropogenic global warming,but there is a tantalizing hint—albeit not a statistically significant one by conventionalstandards—that cooling spring temperatures have the same effect. Is it possible that per-ceptions of anthropogenic global warming may be responsive to greater disparities intrends for summer and spring temperatures? Are perceptions that global warming is dueto human activity more likely to develop for individuals who reside in communities withmatched trends toward cooling spring temperatures but warming summer temperatures—and, hence, growing summer–spring temperature disparities? Is it this pattern of temper-ature disparities in adjacent seasons over time that creates long-term temporal consistencysufficient to stand out in individuals’ memories and hence shape their thinking aboutclimate change? It may well be the case that the meaning of trends toward warmer summertemperatures in individuals’ minds depends not only on a comparison of summer tem-peratures from one year to the next, but also on a contrast between summer and springtemperatures. When summer temperatures are increasingly high compared to spring tem-peratures, individuals may be more likely to perceive that climate is changing and convertthose observations into perceptions about anthropogenic global warming.
To consider this possibility, we create a variable by calculating the difference in the sum-mer and spring temperature trends; a high score on this variable means that the 10-yeartrend in summer temperatures in an individual’s community is much greater than the10-year trend in spring temperatures. To simplify our model, we drop all of the othercontextual weather and climate variables, none of which are shown to have a significanteffect on perceptions of global warming. Our findings are presented in Table 2 and confirmour speculation that an increasing gap in summer and spring temperature trends over timehas a strong positive effect on individuals’ perceptions of anthropogenic global warming(b = 0.145, z = 2.70). Individuals who are experiencing rising trends in summer temper-atures relative to the trend in spring temperatures are significantly more likely to developthe perception that global warming is occurring and mainly due to human activity. Itwould appear that if individuals are observing a trend toward cooler spring temperatures,then an associated trend toward warmer summer temperatures would mean that the highersummer temperatures stand out and are more likely to be remembered and integrated intotheir climate perceptions. This would accentuate the effects of higher summer tempera-tures on perceptions of global warming. In Appendix Figure C2, we present the pattern ofpredicted probabilities for the three outcomes on our dependent variable as a function ofthe difference in summer–spring temperature trends, and one can see that moving fromthe lowest to highest values on this independent variable increases the probability that anindividual perceives anthropogenic global warming by 0.31—that is, from 0.36 to 0.67.Simply, individuals who reside in communities where there is a trend toward bigger spring–summer temperature swings are significantly more likely to perceive that global warmingexists and is due to human activity. This is strong evidence that long-term local temper-ature trends in individuals’ local communities can help shape their views toward globalwarming.
One caveat that might be expressed about this analysis is that not all individuals residingin a given county when the Pew survey was conducted have lived there for a long enoughtime to experience the 10-year climate pattern. Arguably, our ordered logit estimatesrepresent average effects across all individuals, regardless of whether they have lived in theirpresent location for 10 years or more. However, one might expect the effect of 10-yeartrends in spring–summer temperature swings to be stronger for those residing in their

Science, Scientists, and Local Weather 15
home counties for at least 10 years than for those who are “new” residents of less than10 years. In Appendix D, we present a detailed consideration of this possibility, using ageas a proxy for length of residence. We find that older survey respondents are significantlyresponsive to differences in long-term spring–summer temperature trends, while youngerrespondents are not. Our findings provide indirect support for the argument that exposureto long-term temperature trends may have an effect on individuals’ perceptions of climatechange.
Attitudes Toward Scientists. Turning back to Model (1) in Table 1, we find that howindividuals perceive scientists has a strong and consistent effect on how individuals thinkabout global warming. Individuals who perceive that scientists make a strong contributionto the well-being of society are significantly more likely to accept anthropogenic globalwarming; the coefficient for this variable is positive and significant (b = 0.309, z = 2.12).Moreover, the effect of this variable can be seen in Appendix Figure D1, in which we reportpredicted probabilities for each of the three outcomes on the dependent variable as beliefin scientists’ contributions increases, holding constant the effects of other independentvariables. As one can see, perceptions of contributions by scientists have a strong positiveeffect on perceptions that global warming exists and is due to human activity. Second, wefind that perceptions of scientists’ ideological leanings have a modest effect on how indi-viduals perceive global warming. As individuals perceive scientists to be more conservative,they become more likely to perceive that global warming exists (b = 0.267, z = 2.03).Conversely, individuals who perceive that scientists are liberal are less likely to perceive thatglobal warming is generated by human activity. This is in keeping with the perceptions heldby some individuals that scientists are an ideological liberal group and that their findingsare tainted by ideological bias.
Perhaps the most powerful variable in our models is individuals’ perceptions that there is ascientific consensus about global warming. Those individuals who perceive that scientists arein agreement that “the earth is getting warmer because of human activity” are significantlymore likely to believe in anthropogenic global warming (b = 1.586, z = 11.28), suggestingthat individuals consider the degree to which there is a scientific consensus in shapingtheir own views on global warming. Indeed, we can see from Appendix Figure D2 thatindividuals who perceive a scientific consensus are about twice as likely to believe that globalwarming is due to human activity as those who do not perceive a scientific consensus. Theseresults suggest the possibility that having dissenting voices in debates over global warmingmay create for some individuals sufficient doubt in anthropogenic global warming.
Not only do we propose that attitudes toward scientists will shape global warmingperceptions, but we also suggest that how individuals perceive science will have a simi-lar effect. Contrary to expectations, we find little evidence that individuals’ perceptionsof positive effects of science on various aspects of American life (i.e., “society,” “mak-ing life easier,” and “the environment) influence how they think about global warming(b = −0.050, z = −0.55). On the other hand, we find that individuals who perceivethat investments in “basic scientific research” usually pay off are more likely to accept thescientific consensus in support of anthropogenic global warming (b = 0.790, z = 4.08).The perception that science has positive societal payoffs creates the impression of scien-tific credibility and promotes perceptions that global warming exists and is due to humanactivity.
Political Predispositions. The effects of political ideology and partisanship on per-ceptions of global warming are generally as expected. First, we hypothesize that there is

16 Social Science Quarterly
a negative relationship between conservative ideology and perceptions of anthropogenicglobal warming, and our results provide strong support for this assertion (b = −0.298,z = −3.46). This effect can be visualized in Appendix Figure D3, in which we present thepredicted probabilities for each of the three outcomes on the dependent variable that areassociated with each outcome on the political ideology variable. As one can see, politicalconservatives are significantly less likely than political liberals to perceive anthropogenicglobal warming, and they are significantly more likely to perceive that global warming isdue to natural cycles or does not exist at all.
The effect of partisan identification on perceptions of global warming is a bit morecomplicated, insofar as partisanship mediates (and is mediated by) education. At a simplelevel, partisanship is expected to have a negative effect on perceptions of global warming,since Republicans are less likely to perceive that global warming either exists or is dueto human activity. This can be confirmed by the partisan identification coefficient in amodel that specifies an additive effect of partisanship (b = −0.325, z = −6.86, full modelresults not shown). This additive effect of partisan identification can be seen in AppendixFigure D4, with Republican partisans less likely to perceive anthropogenic global warming,but more likely to perceive that global warming is due to natural cycles or does not existat all. However, we consider explicitly the possibility that that the effect of educationon perceptions of global warming varies as a function of individuals’ partisanship, asdocumented by other scholars (McCright and Dunlap, 2011b; Hamilton, 2011, 2012;Hamilton and Keim, 2009). In Model (2) of Table 1, we include variables for partisanidentification, education, and the interaction for partisanship and education. With theinteraction included in the model, the coefficient for education represents the effect ofeducation for Democrats (i.e., those who are coded 0 on partisanship); the coefficient forthe party × education interaction reflects how the effect of education changes as individualsmove by one unit in the Republican direction. As one can see, the coefficient for educationis positive and highly significant (b = 0.244, z = 3.92), indicating that for Democratsincreases in education are related positively to perceptions of anthropogenic global warming.On the other hand, the coefficient for the interaction variable is negative (b = −0.064,z = −2.69), indicating that increases in (Republican) partisanship result in a weakeningof the relationship between education and perceptions of global warming. Indeed, inAppendix Figure D5, we present the pattern of predicted probabilities for perceptions ofanthropogenic global warming as a function of education, presented separately for strongDemocrats and strong Republicans. These results show that for strong Democrats thereis a strong positive effect of education on perceptions of anthropogenic global warming;as strong Democrats become more educated, they are much more likely to perceive thatglobal warming exists and is a result of human activity. On the other hand, for strongRepublicans there is no relationship between education and perceptions of anthropogenicglobal warming. Strong Republicans with both high and low education levels hold the samemean predicted probabilities of perceiving that global warming is due to human activity.It is also the case that increases in education are associated with a greater disparity inperceptions of anthropogenic global warming for Democrats and Republicans, suggestingthat the effects of partisanship increase with higher levels of education.
Religious Variables. We find some evidence of religion effects, primarily in comparingwhite evangelical Christians and other groups. White mainline Protestants are significantlymore likely than white evangelical Christians to perceive anthropogenic global warming(b = 0.749, z = 2.97), as are Jews (b = 1.094, z = 2.24). Moreover, in our model estimatedwithout our local climate variables, Mormons are also found to be more likely to perceive

Science, Scientists, and Local Weather 17
anthropogenic global warming (b = 1.218, z = 2.09), though this effect decreases tostatistical nonsignificance when we add the local climate variables to our model. It wouldappear that white evangelical Christians are somewhat less likely to perceive anthropogenicclimate changes once we control for the effects of other variables (including politicalideology and partisan identification).6 Finally, church attendance is found to be statisticallyunrelated to perceptions about global warming.
Information Environment. Given the state of climate science and the widespreadreports of a scientific consensus over global warming, we speculate that individuals’ exposureto information should have a positive effect on their perceptions that global warming existsand is attributable to human activity. Turning to the model estimates in Model (2), wefind that none of the independent variables in the information environment cluster have asignificant effect on perceptions of global warming. Knowledge of global warming and thethree media variables all have coefficients that fail to achieve standard levels of statisticalsignificance. It appears that information effects reside in the effects of individuals’ level ofeducation, though this effect is primarily among non-Republicans.
Demographic Attributes. There is some evidence that demographic characteristics arerelated to perceptions of global warming. First, the coefficient for age is both negative(as expected) and statistically significant (b = −0.010, z = −2.22); this suggests that olderindividuals are more likely to be skeptical of global warming than those who are younger.Second, consistent with previous studies, we find that women are significantly more likelyto perceive that there is anthropogenic global warming (b = 0.283, z = 1.90) Third, wefind little evidence that race is related to perceptions of global warming (b = −0.337,z = −1.193). This null finding stands in some contrast to the findings of other scholars.7
Finally, income is negatively related to global warming perceptions (b = −0.060, z =−1.72); individuals with higher incomes are less likely to perceive that global warmingexists and is due to human activity than those with lower incomes. This is in keeping withthe argument that high-income individuals are likely to recognize the high costs that areassociated with addressing anthropogenic global warming.
Summary and Conclusions
In this article, we explore the determinants of Americans’ perceptions of global warming.We develop a model in which we depict global warming perceptions as a function of severalclusters of independent variables, including the long-term climate and short-term weatherin individuals’ home communities, attitudes toward scientists and science, political predis-positions, religious variables, the information environment, and demographic attributes.We use data from the 2009 Pew Public Science Survey, which includes a wide range ofvariables representing the interplay of science, politics, and policy.
6We also estimate a model that includes only religion variables (results not shown), and we find that thecoefficients for all of the religion variables (except the Mormon variable) are positive and statistically significant.This indicates that all religious groups are more likely to perceive anthropogenic climate change than whiteevangelical Christians, though these effects disappear for several religious groups once the effects of controlvariables are introduced into the model.
7We also consider whether there is an interaction between gender and race, but the coefficient for thisinteraction variable is small and statistically insignificant (b = 0.027, z = 0.10). Hence, it appears that thereis a general gender effect but not a specific white male effect.
18 Social Science Quarterly
What have we learned about the determinants of Americans’ perceptions of globalwarming? First, we suggest that, over time, trends toward higher temperatures may cumulateto form effects that go beyond the effects of weather patterns in the recent past, and wefind that seasonal temperature trends in the medium term (i.e., over the past 10 years)show some effects on public perceptions about global warming. Increasingly hot summershave a positive effect on individuals’ perceptions of anthropogenic global warming, andthere is a hint that cooling spring temperatures may have an effect on global warmingperceptions under some circumstances. Indeed, we find that coupling summer warmingtrends and spring cooling trends has a strong, discernible effect on individuals’ perceptionsof global warming. Specifically, individuals who reside in communities that combinesummer warming trends and spring cooling trends are significantly more likely to perceivethat global warming is due to human activity. This suggests that the effects of warmingsummer temperatures should be viewed in the context of trends in spring temperatures.It also indicates that the experience of contrast in seasonal temperatures has a strongereffect on perceptions of global warming than that of simple trends or short-term means.We are at an early stage of exploring the effects of climate and weather on perceptions ofglobal warming, and we suggest that the finding of a strong effect of seasonal contrast (e.g.,between spring and summer temperature trends) should generate further research. On theother hand, it seems that seasonal precipitation trends and short-term weather fluctuationsdo not have significant effects on public perceptions of global warming. It is possible thatthe effects of these variables vary considerably across contexts, and we suggest that thepossibility of heterogeneous effects across contexts certainly warrants further study in thefuture.
Second, we explore the degree to which individuals’ perceptions of global warming aredetermined by how individuals perceive scientists and science, as well as how individualsevaluate the role of science in American society. The claims that global temperatures arerising and that global warming is a result of human activity are generated through scientificactivity conducted by scientists. We suggest that the degree to which individuals trust thework of scientists, have positive views about the contributions made by scientists and sci-ence, and correctly perceive the scientific consensus about global warming will be positivelyrelated to their propensity to perceive that anthropogenic global warming is taking place.Our empirical findings provide strong support for our assertions that the effects of attitudesabout scientists and science influence individuals’ perceptions of global warming. This con-clusion is both good and bad news to scientists. From a positive perspective, advocates ofglobal climate change can direct their efforts toward the establishment of positive imagesof scientists, and this may serve to make their research conclusions more convincing andacceptable to the public. The bad news is that any event such as “Climategate” or a carelessparagraph about Himalayan ice melting could lead to mistrust of scientists’ findings onglobal warming. Due to what global warming skeptics purport to be mistakes made bysome climate scientists, the entire scientific community—and the case for anthropogenicglobal warming—is still recovering from the adverse effects of these perceived missteps.
Third, we confirm the findings from previous research that global warming has becomehighly politicized. Political ideology and party identification are strong significant predic-tors of individuals’ perceptions of global warming; conservatives and Republicans tend to besignificantly more skeptical of anthropogenic global warming than liberals and Democrats,who are more likely to accept the idea that global warming is due to human activity. More-over, we find that the effect of education on perceptions of anthropogenic global warmingis conditioned by partisan identification; the relationship is positive for Democrats butstatistically indistinguishable from 0 for Republicans. Our results support the hypothesis

Science, Scientists, and Local Weather 19
that people rely on their political predispositions when they interpret evidence about globalwarming.
Fourth, we find some evidence of an effect of religion variables, particularly in terms of ourfinding that white evangelical Protestants differ from several other groups. White evangelicalProtestants differ from other religious groups in their perception of anthropogenic climatechange, though many of these differences disappear in full models that include a wide rangeof control variables. With the recent release of the papal encyclical on climate change, therole of religion in shaping debates about global warming promises to be a subject of interestto scholars interested in the determinants of attitudes toward climate change.
Fifth, our findings confirm to a large extent the results of previous research about theeffects of demographic attributes on attitudes toward and perceptions of global warming.We find that age, gender, and income all have effects on perceptions of anthropogenic globalwarming that are consistent with those reported in prior research, though (surprisingly) wefind that race is unrelated to perceptions of global warming. We also find little evidencethat the information environment influences perceptions of global warming, though ourfindings relating to education are consistent with expectations.
Finally, it is worth noting that the effects of our independent variables on perceptions of“natural cycle” global warming usually differ from the effects of our independent variableson perceptions of anthropogenic global warming. Variables that have a positive effect onthe probability that individuals perceive that global warming is due to human activityhave a negative effect on the probability that individuals perceive that global warming isdue to natural cycles. Indeed, it would appear that perceptions of “natural cycle” globalwarming behave more similarly to perceptions of no global warming than to perceptionsof anthropogenic global warming. It may be that perceptions of “natural cycle” globalwarming represent a middle ground for those who are somewhat skeptical of the scientificconsensus about the causes of global warming but who perceive that global warming isoccurring.
Our analyses are limited in some ways, and the research agenda on public opiniontoward global warming is subsequently a full one. Where do we go from here? First, ourdependent variable is based on a series of questions that are commonly asked in surveyson climate change and global warming. However, it is possible that there is more nuanceto individuals’ attitudes about the causes of climate change. Individuals who perceive thatclimate change is occurring may perceive that both natural cycles and human activityaccount for at least some of the variability of weather and climate over time. Our presentmeasurement strategy assumes a discrete “either–or” process, but individuals may weightthese two sets of causes differently. In future research, we hope to develop survey questionsto explore more fully the relative weight that individuals give to these two potential causes ofclimate change. Second, more work is needed on the connections between objective long-and short-term weather patterns and individuals’ perceptions of those weather patterns.Do individuals who live in communities or regions that experience upward temperature orprecipitation trends accurately perceive those trends? Do the perceptions of those trendsthen influence perceptions of global warming? Third, how do Republicans/conservativesand Democrats/liberals associate climate and weather with their perceptions of globalwarming? Do they respond differently or similarly to long-term climate trends and short-term weather fluctuations when they make judgments on global warming? Fourth, doesweather and climate affect behavior relating to climate change? How do weather and climateaffect individuals’ willingness to engage in action touted by scientists and policymakers tocombat climate change? It is important for scholars to explore more fully the determinantsof attitudes toward policies designed to alleviate global warming in the long run. To what

20 Social Science Quarterly
extent are Americans willing to take on what economists describe as the considerable costsof combating global warming? Will Americans support a carbon tax and/or higher taxes ongoods and services that contribute to climate change? To what extent will Americans “buyin” to policies that many scientists contend will have the effect of reducing the humancontributions to climate change?
Appendix A: Elite Consensus and Mass Opinion on Climate Change
It is generally agreed that there is a consensus among scientists about the existenceof global warming and the high likelihood that global temperature changes are due tohuman activity. The scientific community was originally conservative in its opinions aboutglobal warming. Indeed, in 1992 the U.N. Intergovernmental Panel on Climate Change(IPCC) reported that global warming might have very negative consequences for theworld’s ecosystems (Krosnick, Holbrook, and Visser, 2000). However, in 1995 the IPCCdramatically changed its judgment on this issue from being “uncertain” to “real” (Krosnick,Holbrook, and Visser, 2000). In its 2007 assessment report (Solomon et al., 2007), theIPCC used the word unequivocal to describe evidence of warming of the climate system andchose the words “very likely” when attributing the temperature rise to human activity. Inits most recent assessment report, the IPCC (2013) reinforced the certainty of its findingsthat climate change is occurring and that human activity is a substantial contributor. TheIPCC is not the only authoritative organization to come to this conclusion. The mostrecent report from the U.S. Global Change Research Program shares the same sentiment,reaching the conclusion that “global climate is changing . . . . The global warming of thepast 50 years is primarily due to human activities, predominantly the burning of fossilfuels” (Walsh et al., 2014:20). The National Research Council Advancing the Scienceof Climate Change endorsed the notion of “anthropogenic global warming” by statingthat “climate is changing and these changes are in large part caused by human activities”(U. S. National Research Council, 2010:1).
Despite the consensus in the scientific community about global warming and the “highprobability” that human activity plays a role, the American public is much more sharplydivided on both the existence of global warming and whether human activity is responsible.In Table A1, we present results from the Pew Research Center survey conducted in October2013, and in Appendix Figures A1 and A2, we report trends in various perceptions of global
TABLE A1
Individuals’ Perceptions of Global Warming, Pew Research Center for the Peopleand the Press, October 2013 Political Survey
Response Percentage (%)
The earth is not getting warmer 26The earth is getting warmer 67
The earth is getting warmer because of natural changes in the atmosphere 18The earth is getting warmer because of human activity 44The earth is getting warmer but do not know why 4
Do not know/mixed evidence 7N = 1,504 100
SOURCE: Pew Research Center for the People and the Press, October 2013 Political Survey.

Science, Scientists, and Local Weather 21
FIGURE A1
Trends in Individuals’ Perceptions of Global Warming, 2006–2013
The Earth is getting warmer
The Earth is warming because of human activity
3040
5060
7080
Per
cent
age
2006 2008 2010 2012 2014Year
SOURCE: Adapted from Pew Research Center (2013).
FIGURE A2
Trends in Individuals’ Perceptions of Seriousness of Global Warming Problem, 2006–2013
Very serious
Somewhat serious
Not too serious
Not a problem
1020
3040
50P
erce
ntag
e
2006 2008 2010 2012 2014Year
SOURCE: Adapted from Pew Research Center (2013).

22 Social Science Quarterly
warming over time from 2006 to 2013 (Pew Research Center, 2013). According to thesedata from October 2013, 67 percent of the American public agrees that the earth iswarming, but only 44 percent agrees that global warming is due primarily to humanactivity. According to Figure A1, the “human activity” percentage is a high-water marksince 2010 and the “Earth is getting warmer” percentage is nearly so, following a downwardtrend since 2006 in perceptions of both global warming and human activity as a cause.Further, based on Figure A2 it appears that the percentage of Americans who perceivethat global warming is a “very serious” problem has declined since 2009, though there hasbeen a modest uptick in the past two years. As of October 2013, only 33 percent perceiveglobal warming as a “very serious problem,” though another 32 percent perceive it as a“somewhat serious problem.” Regarding the consensus among scientists, as of October2013, 54 percent of Americans perceive that “scientists agree that earth is getting warmerbecause of human activity,” a figure that is up from 45 percent just a year earlier, while37 percent of respondents perceive that “scientists do not generally agree that the earthis getting warmer because of human activity,” down from 43 percent in October 2012.Clearly, Americans continue to have widely differing views about the existence of globalwarming, the role of human activity in creating climate change, and the degree to whichthere is a scientific consensus on the issue.
Appendix B: Integrating Contextual and Survey Data
The Pew Research Center for the People and the Press makes most of its data accessibleto the public. For reasons of confidentiality, Pew Research Center strips out geographicinformation that could be potentially identifiable; these geocoded data are available fromthe Pew Research Center through the implementation of the Pew Research Center SpecialDataset Use Agreement.
FIGURE B1
Map of the United States Showing Placement of Survey Respondents and Weather Stations

Science, Scientists, and Local Weather 23
TAB
LEB
1
Des
crip
tion
ofV
aria
bles
Varia
ble
Des
crip
tion
Per
cep
tions
ofg
lob
alw
arm
ing
2=
resp
ond
entp
erce
ives
that
the
eart
his
get
ting
war
mer
mos
tlyb
ecau
seof
hum
anac
tivity
;1
=re
spon
den
tper
ceiv
esth
atth
eea
rth
isg
ettin
gw
arm
erm
ostly
bec
ause
ofna
tura
lcha
nges
inth
eat
mos
phe
re;a
nd0
=re
spon
den
tper
ceiv
esth
atth
eea
rth
isno
tget
ting
war
mer
Sci
entis
ts’c
ontr
ibut
ions
Res
pon
den
ts’p
erce
ptio
nsof
scie
ntis
tsco
ntrib
utio
ns“t
oth
ew
ell-b
eing
ofou
rso
ciet
y”:3
=a
lot;
...;
0=
noth
ing
atal
lS
cien
tists
’id
eolo
gy
Res
pon
den
ts’p
erce
ptio
nsof
ideo
log
yof
scie
ntis
tsas
ag
roup
:1=
scie
ntis
tsas
ag
roup
are
cons
erva
tive;
0=
scie
ntis
tsas
ag
roup
are
neith
erlib
eral
nor
cons
erva
tive;
−1=
scie
ntis
tsas
ag
roup
are
liber
alS
cien
tific
cons
ensu
sR
esp
ond
ents
’per
cep
tion
ofsc
ient
ific
cons
ensu
sov
erg
lob
alw
arm
ing
:1=
yes,
“sci
entis
tsg
ener
ally
agre
eth
atth
eea
rth
isg
ettin
gw
arm
erb
ecau
seof
hum
anac
tivity
”;0
=no
,the
reis
noco
nsen
sus
Sci
ence
effe
cts
Res
pon
den
ts’p
erce
ptio
nsof
the
effe
cts
ofsc
ienc
e,b
ased
onp
rinci
pal
com
pon
ents
anal
ysis
ofth
ree
item
s:(1
)sc
ienc
eef
fect
son
soci
ety,
rang
ing
from
−1(m
ostly
neg
ativ
e)to
+1(m
ostly
pos
itive
);(2
)sc
ienc
eef
fect
son
life,
rang
ing
from
−1(s
cien
cem
akes
life
mor
ed
ifficu
lt)to
+1(s
cien
cem
akes
life
easi
er);
and
(3)
scie
nce
effe
cts
onth
een
viro
nmen
t,ra
ngin
gfro
m−1
(mos
tlyne
gat
ive)
to+1
(mos
tlyp
ositi
ve);
eig
enva
lue
=1.
513,
varia
nce
exp
lain
ed=
0.50
4In
vest
men
tin
scie
nce
Res
pon
den
ts’p
erce
ptio
nsof
pay
offo
finv
estm
enti
nsc
ienc
e:1
=g
over
nmen
tinv
estm
ents
inb
asic
scie
ntifi
cre
sear
chus
ually
pay
sof
fin
the
long
run;
0=
gov
ernm
enti
nves
tmen
tsin
bas
icsc
ient
ific
rese
arch
are
not
wor
thit
Par
tisan
iden
tifica
tion
Five
-poi
ntsc
ale
ofp
artis
anid
entifi
catio
n:4
=R
epub
lican
;..
.;0
=D
emoc
rat
Lib
eral
–con
serv
ativ
eid
eolo
gy
Five
-poi
ntsc
ale
oflib
eral
–con
serv
ativ
eid
eolo
gy:
4=
stro
ngco
nser
vativ
e;..
.;0
=st
rong
liber
alE
duc
atio
nS
cale
ofed
ucat
iona
latta
inm
ent:
6=
resp
ond
enth
asea
rned
ap
ostg
rad
uate
deg
ree;
...;
0=
resp
ond
enth
asco
mp
lete
dei
ght
gra
des
orle
ssan
dno
dip
lom
aG
reen
hous
eg
askn
owle
dg
e1
=re
spon
den
tcan
corr
ectly
iden
tify
carb
ond
ioxi
de
asth
eg
asth
at“m
osts
cien
tists
bel
ieve
caus
este
mp
erat
ures
inth
eat
mos
phe
reto
rise”
;0=
inco
rrec
tor
do
notk
now
resp
onse
Chu
rch
atte
ndan
ceFr
eque
ncy
ofch
urch
atte
ndan
ce:5
=m
ore
than
once
aw
eek;
...;
0=
neve
rat
tend
serv
ices
Gen
eral
med
iaus
eR
esp
ond
ents
’sel
f-re
por
ted
enjo
ymen
tatk
eep
ing
upw
ithth
ene
ws:
3=
alo
t;..
.;0
=no
tata
llA
ttent
ion
tosc
ienc
ene
ws
Res
pon
den
ts’s
elf-
rep
orte
den
joym
enta
tkee
pin
gup
with
new
sab
outs
cien
ce:3
=a
lot;
...;
0=
nota
tall
Sci
entifi
cm
edia
use
Res
pon
den
ts’s
cien
tific
med
iaus
e,b
ased
onp
rinci
pal
com
pon
ents
anal
ysis
ofth
ree
item
s:(1
)D
oyo
ure
gul
arly
wat
chte
levi
sion
pro
gra
ms
orch
anne
lsab
outs
cien
cesu
chas
Nov
aor
the
Dis
cove
ryC
hann
el?
(2)
Do
you
reg
ular
lyvi
sits
cien
cew
ebsi
tes
and
blo
gs,
such
asN
OA
A.g
ovor
Sci
ence
Dai
ly.c
om?
and
(3)
Do
you
reg
ular
lyre
adsc
ienc
em
agaz
ines
,suc
has
Pop
ular
Sci
ence
orS
cien
tific
Am
eric
an?
eig
enva
lue
=1.
418,
varia
nce
exp
lain
ed=
0.47
3co
ntin
ued

24 Social Science Quarterly
TAB
LEB
1
Con
tinue
d
Varia
ble
Des
crip
tion
Ag
eR
esp
ond
ents
’ag
e,in
year
sG
end
er1
=fe
mal
ere
spon
den
ts;0
=m
ale
resp
ond
ents
Inco
me
Sca
leof
fam
ilyin
com
e:9
=re
spon
den
tfam
ilyea
rned
“$15
0,00
0or
mor
e”;
...;
0=
resp
ond
entf
amily
earn
ed“l
ess
than
$10,
000”
Rac
e:w
hite
1=
resp
ond
ents
elf-
iden
tifies
asw
hite
;0=
allo
ther
resp
ond
ents
Win
ter
tem
per
atur
etre
nd10
-yea
rw
inte
rte
mp
erat
ure
trend
inre
spon
den
ts’h
ome
com
mun
ityS
prin
gte
mp
erat
ure
trend
10-y
ear
sprin
gte
mp
erat
ure
trend
inre
spon
den
ts’h
ome
com
mun
ityS
umm
erte
mp
erat
ure
trend
10-y
ear
sum
mer
tem
per
atur
etre
ndin
resp
ond
ents
’hom
eco
mm
unity
Fall
tem
per
atur
etre
nd10
-yea
rfa
llte
mp
erat
ure
trend
inre
spon
den
ts’h
ome
com
mun
ityW
inte
rp
reci
pita
tion
trend
10-y
ear
win
ter
pre
cip
itatio
ntre
ndin
resp
ond
ents
’hom
eco
mm
unity
Sp
ring
pre
cip
itatio
ntre
nd10
-yea
rsp
ring
pre
cip
itatio
ntre
ndin
resp
ond
ents
’hom
eco
mm
unity
Sum
mer
pre
cip
itatio
ntre
nd10
-yea
rsu
mm
erp
reci
pita
tion
trend
inre
spon
den
ts’h
ome
com
mun
ityFa
llp
reci
pita
tion
trend
10-y
ear
fall
pre
cip
itatio
ntre
ndin
resp
ond
ents
’hom
eco
mm
unity
Dep
artu
refro
mno
rmal
tem
per
atur
eA
vera
ge
tem
per
atur
ed
epar
ture
from
norm
alte
mp
erat
ures
over
the
mon
thp
rior
toth
esu
rvey
dat
e,no
rmal
ized
inst
and
ard
dev
iatio
nun
itsD
epar
ture
from
norm
alp
reci
pita
tion
Ave
rag
ep
reci
pita
tion
dep
artu
refro
mno
rmal
pre
cip
itatio
nov
erth
em
onth
prio
rto
the
surv
eyd
ate,
norm
aliz
edin
stan
dar
dd
evia
tion
units
Sp
ring
–sum
mer
trend
diff
eren
ceD
iffer
ence
insu
mm
eran
dsp
ring
tem
per
atur
etre
nds,
calc
ulat
edb
ysu
btr
actin
gth
esp
ring
tem
per
atur
etre
ndfro
mth
esu
mm
erte
mp
erat
ure
trend
;hig
hsc
ores
ind
icat
eth
atsu
mm
erte
mp
erat
ure
trend
sar
eco
nsid
erab
lyhi
ghe
rth
ansp
ring
tem
per
atur
etre
nds

Science, Scientists, and Local Weather 25
TABLE B2
Descriptive Statistics
StandardVariable Mean Deviation Minimum Maximum
Perceptions of global warming 1.411 0.691 0 2Scientists’ contributions 2.721 0.536 0 3Scientists’ ideology −0.117 0.536 −1 1Scientific consensus 0.619 0.486 0 1Science effects 0.004 0.968 −4.155 0.543Investment in science 0.824 0.381 0 1Partisan identification 1.647 1.670 0 4Liberal–conservative ideology 2.143 0.953 0 4Education 3.852 1.621 0 6Greenhouse gas knowledge 0.750 0.433 0 1Church attendance 2.611 1.564 0 5General media use 2.474 0.814 0 3Attention to science news 2.183 0.802 0 3Scientific media use 0.072 1.012 −1.109 2.524Age 48.962 16.451 18 93Gender 0.459 0.498 0 1Income 5.493 2.292 1 9Race: white 0.570 0.495 0 1Winter temperature trend −0.595 2.166 −7.826 5.097Spring temperature trend −0.714 0.912 −3.630 3.030Summer temperature trend 0.572 1.109 −2.885 4.455Fall temperature trend 0.305 1.051 −2.121 4.164Winter precipitation trend 5.270 10.716 −38.212 33.473Spring precipitation trend 0.678 11.463 −31.115 44.836Summer precipitation trend 4.089 13.471 −44.697 47.648Fall precipitation trend 0.613 11.396 −38.661 37.248Departure from normal temperature 0.022 0.529 −1.520 1.966Departure from normal precipitation 0.236 0.934 −1.481 3.176Summer–spring trend difference 1.286 1.229 −2.897 4.897
We use geographic techniques to integrate the two different layers of data. Specifically,the centroid of each zip code polygon is used to represent the location of respondentsidentified by corresponding zip codes, and the weather station that is located closestto each zip code centroid is spatially joined to each respondent. Once we have linkedeach respondent to a weather station, we can merge various measures of local weather witheach respondent. In Appendix Figure B1, we present a U.S. map that shows the locationof each respondent and each of the weather stations used in our analyses.
In most cases weather stations are joined to only one survey respondent, though thereare a relatively small number of weather stations that are joined to more than one sur-vey respondent. The fact that some respondents share the same weather station raisessome complications in regression analyses. Merging two data sets with different levels ofanalysis—aggregate (weather station) and individual level—violates one important statis-tical assumption. Specifically, the error terms are not independent for observations thatshare the same weather station, and this can affect standard errors for regression estimates.To correct this, there are two major approaches—clustered standard errors and multilevelmodeling. Unfortunately, we do not have a sufficient number of observations per weatherstation to estimate a multilevel model. Almost one-half of weather stations are joined toone survey respondent, 65 percent are joined to one or two respondents, and 87 percent

26 Social Science Quarterly
have five or fewer respondents. Under the circumstances, we estimate our models withclustered standard errors, which require fewer assumptions and less intensive computationthan multilevel modeling (Primo, Jacobsmeier, and Milyo, 2007).
Appendix C: Measuring the Dependent Variable
We suggest that the responses to this survey item represent ordered categories and hencethat this variable can be treated as an ordinal variable. Conceptually, these three responsesrepresent three ordered conditions that vary in terms of individuals’ perceptions of howhuman society should react to this aspect of the environment around them. First, thosewho perceive that there is no global warming suggest an “if it ain’t broke, don’t fix it”approach and signal a justification for environmental inaction. Second, individuals whoperceive that global warming has root causes associated with natural cycles recognize thatglobal warming is a reality; however, while human activity has little or nothing to do withthe cause of global warming, human society still needs to adapt to the consequences ofglobal warming. The third response—belief in anthropogenic global warming—recognizesthe reality of global warming and suggests that humans are at the core of the problem; giventhis view, human society should be part of the solution by both mitigating the effects ofglobal warming and adapting to the warming planet. Simply, these three responses implya pattern of incremental political and environmental involvement, ranging from (1) “noproblem, no action needed” to (2) “adaptation needed to a problem that is beyond the
FIGURE C1
Predicted Probabilities of Three Views Toward Global Warming, by Summer TemperatureTrend, 2009 Pew General Public Science Survey
Anthropogenic Global Warming
Natural Cycle
No Global Warming
00.
20.
40.
60.
8P
roba
bilit
y
-4 -2 0 2 4Summer Temperature Trend

Science, Scientists, and Local Weather 27
FIGURE C2
Predicted Probabilities of Three Views Toward Global Warming, by Difference in Summer andSpring Temperature Trend, 2009 Pew General Public Science Survey
Anthropogenic Global Warming
Natural Cycle
No Global Warming
00.
20.
40.
60.
8P
roba
bilit
y
-4 -2 0 2 4 6Difference in Summer and Spring Temperature Trends
control of human society” to (3) both “adaptation and mitigation required for a seriousproblem caused by human activity.” Because this is an ordinal dependent variable, weestimate our models using ordered logit.
There is good evidence that this ordering of responses is appropriate. We have calculatedthe mean values on a number of our attitudinal independent variables, calculated separatelyfor each of the three values on the dependent variable. The patterns are that these dataare consistent with an ordered dependent variable: the means for partisan identification,ideology, and most of the science attitudinal variables are at one extreme for the lowestvalue on the dependent variable, the other extreme for the highest value, and in the middlefor the middle value on the dependent variable. It would appear that the mean values ofthese independent variables coincide with values on the dependent variable in a way tosuggest that the dependent variable is ordered.
The original survey has two forms of this variable, and the order in which the responsechoices are offered varies between the forms. In one form “the earth is not getting warmer”is the first choice in order, whereas in the second form this option is placed last in order.The effects of changing the order of response choices have been found to be substantial,especially among less-educated adults (Krosnick and Alwin, 1987). However, in this casethe relationship between perceptions of global warming and form type are not statisticallysignificant (γ = 0.0454, z = 1.135), and a comparison of frequencies does not reveal amajor effect of form type on responses to the global warming item. Hence, we combinethe data from the two forms to create a single variable.

28 Social Science Quarterly
Appendix D: Exploring Heterogeneity in Effects of Long-Term Temperature Trendsfor Long- and Short-Term Residents
One issue associated with studying the effects of 10-year temperature trends on individ-uals’ perceptions of climate change involves individuals’ exposure to those trends. Peoplewho have lived in a given county for 10 years or more have been exposed directly to theclimate of that locale and are hence able to develop perceptions of climate trends over thattime period. On the other hand, individuals who are transplants and have resided in agiven county for less than 10 years are not directly exposed to the 10-year climate pattern.It is possible that they may be aware of local climate patterns indirectly—for example,they may read or watch news stories about trends in temperature, precipitation, or extremeweather, or they may have communication with long-term residents who describe thosepatterns over time—but they are less likely to have experienced the weather patterns andhence incorporate that experience into their perceptions about climate change.
The best way to study this would be to identify those who have resided in a given countyfor at least 10 years and differentiate them from those who have resided in a given countyfor less than 10 years. Unfortunately, the 2009 Pew General Public Science Survey does notinclude a variable that measures how long survey respondents have lived in their currenthome county. However, not all age groups are equally likely to reside in the same locationover time. Benetsky, Burd, and Rapino (2015) show that mobility is much greater foryounger Americans, particularly for those in the 18–34 age group. Approximately one inthree individuals in this age group report to have moved in the past year, compared to less
FIGURE D1
Predicted Probabilities for Three Views Toward Global Warming, by Belief in Scientists’Contributions to Society, 2009 Pew General Public Science Survey
Anthropogenic Global Warming
No Global Warming
Natural Cycle
00.
20.
40.
60.
8P
roba
bilit
y
0 1 2 3Belief in Scientists' Contribution

Science, Scientists, and Local Weather 29
FIGURE D2
Predicted Probabilities for Three Views Toward Global Warming, by Perceptions of ScientificConsensus on Global Warming, 2009 Pew General Public Science Survey
Anthropogenic global warming
Natural cycle
No global warming
00.
20.
40.
60.
8
0 0.2 0.4 0.6 0.8 1Belief in Scientific Consensus
FIGURE D3
Predicted Probabilities of Three Views Toward Global Warming, by Political Ideology, 2009 PewGeneral Public Science Survey
Anthropogenic Global Warming
Natural Cycle
No Global Warming
00.
20.
40.
60.
8P
roba
bilit
y
0 1 2 3 4Political Ideology

30 Social Science Quarterly
FIGURE D4
Predicted Probabilities of Three Views Toward Global Warming, by Partisan Identification, 2009Pew General Public Science Survey
Anthropogenic Global Warming
Natural Cycle
No Global Warming
00.
20.
40.
60.
8P
roba
bilit
y
0 1 2 3 4Party Identification
FIGURE D5
Predicted Probabilities that Respondents Believe that Global Warming is Due Mostly to HumanActivity, by Partisan Identification, 2009 Pew General Public Science Survey
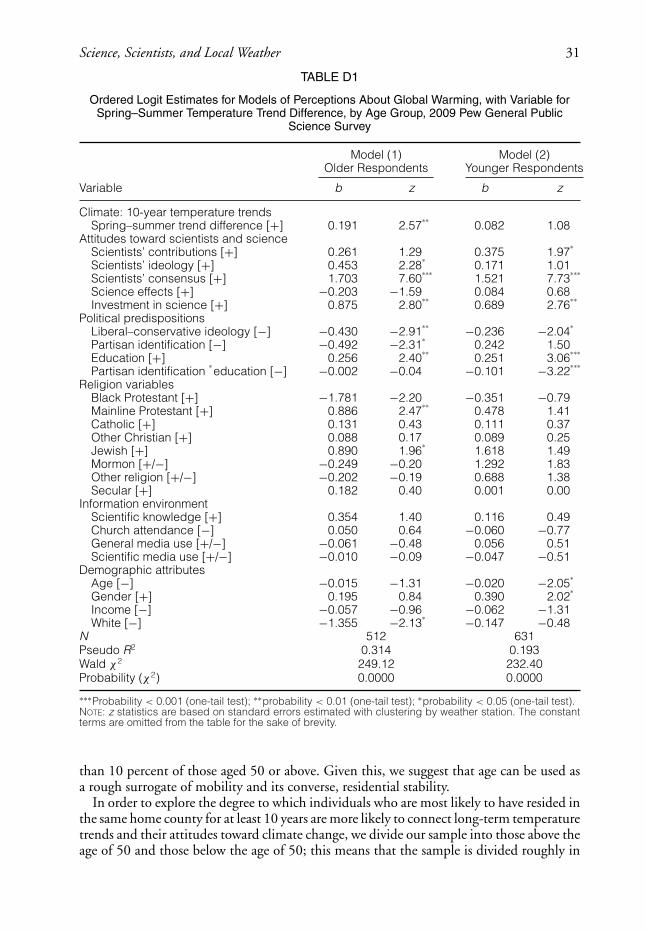
Science, Scientists, and Local Weather 31
TABLE D1
Ordered Logit Estimates for Models of Perceptions About Global Warming, with Variable forSpring–Summer Temperature Trend Difference, by Age Group, 2009 Pew General Public
Science Survey
Model (1) Model (2)Older Respondents Younger Respondents
Variable b z b z
Climate: 10-year temperature trendsSpring–summer trend difference [+] 0.191 2.57
∗∗0.082 1.08
Attitudes toward scientists and scienceScientists’ contributions [+] 0.261 1.29 0.375 1.97
∗
Scientists’ ideology [+] 0.453 2.28∗
0.171 1.01Scientists’ consensus [+] 1.703 7.60
∗∗∗1.521 7.73
∗∗∗
Science effects [+] −0.203 −1.59 0.084 0.68Investment in science [+] 0.875 2.80
∗∗0.689 2.76
∗∗
Political predispositionsLiberal–conservative ideology [−] −0.430 −2.91
∗∗ −0.236 −2.04∗
Partisan identification [−] −0.492 −2.31∗
0.242 1.50Education [+] 0.256 2.40
∗∗0.251 3.06
∗∗∗
Partisan identification∗education [−] −0.002 −0.04 −0.101 −3.22
∗∗∗
Religion variablesBlack Protestant [+] −1.781 −2.20 −0.351 −0.79Mainline Protestant [+] 0.886 2.47
∗∗0.478 1.41
Catholic [+] 0.131 0.43 0.111 0.37Other Christian [+] 0.088 0.17 0.089 0.25Jewish [+] 0.890 1.96
∗1.618 1.49
Mormon [+/−] −0.249 −0.20 1.292 1.83Other religion [+/−] −0.202 −0.19 0.688 1.38Secular [+] 0.182 0.40 0.001 0.00
Information environmentScientific knowledge [+] 0.354 1.40 0.116 0.49Church attendance [−] 0.050 0.64 −0.060 −0.77General media use [+/−] −0.061 −0.48 0.056 0.51Scientific media use [+/−] −0.010 −0.09 −0.047 −0.51
Demographic attributesAge [−] −0.015 −1.31 −0.020 −2.05
∗
Gender [+] 0.195 0.84 0.390 2.02∗
Income [−] −0.057 −0.96 −0.062 −1.31White [−] −1.355 −2.13
∗ −0.147 −0.48N 512 631Pseudo R2 0.314 0.193Wald χ2 249.12 232.40Probability (χ2) 0.0000 0.0000
∗∗∗Probability < 0.001 (one-tail test); ∗∗probability < 0.01 (one-tail test); ∗probability < 0.05 (one-tail test).NOTE: z statistics are based on standard errors estimated with clustering by weather station. The constantterms are omitted from the table for the sake of brevity.
than 10 percent of those aged 50 or above. Given this, we suggest that age can be used asa rough surrogate of mobility and its converse, residential stability.
In order to explore the degree to which individuals who are most likely to have resided inthe same home county for at least 10 years are more likely to connect long-term temperaturetrends and their attitudes toward climate change, we divide our sample into those above theage of 50 and those below the age of 50; this means that the sample is divided roughly in

32 Social Science Quarterly
TABLE D2
Ordered Logit Estimates for Models of Perceptions About Global Warming, with Interaction forOlder–Younger Variable and Spring–Summer Temperature Trend Difference, 2009 Pew
General Public Science Survey
Variable b z
Climate: 10-year temperature trendsSpring–summer trend difference [+] 0.071 0.96Older
∗spring–summer trend difference [+] 0.162 1.75
∗
Attitudes toward scientistsScientists’ contributions [+] 0.299 2.08
∗
Scientists’ ideology [+] 0.261 2.00∗
Scientists’ consensus [+] 1.598 11.38∗∗∗
Attitudes toward scienceScience effects [+] −0.044 −0.49Investment in science [+] 0.789 4.11
∗∗∗
Political predispositionsLiberal–conservative ideology [−] −0.304 −3.57
∗∗∗
Partisan identification [−] −0.030 −0.25Education [+] 0.248 4.03
∗∗∗
Partisan identification∗education [−] −0.063 −2.69
∗∗
Information environmentScientific knowledge [+] 0.223 1.26Church attendance [−] −0.007 −0.13General media use [+/−] 0.011 0.13Scientific media use [+/−] −0.028 −0.43
Demographic attributesAge [−] −0.015 −2.81
∗∗
Gender [+] 0.279 1.88∗
Income [−] −0.063 −1.81∗
White [−] −0.339 −1.21Black Protestant [+] −0.554 −1.48Mainline Protestant [+] 0.677 2.71
∗∗
Catholic [+] 0.139 0.65Other Christian [+] 0.118 0.41Jewish [+] 1.052 2.23
∗
Mormon [+/−] 0.783 1.11Other religion [+/−] 0.503 1.07Secular [+] 0.108 0.38
N 1,143Pseudo R2 0.233Wald χ2 445.51Probability (χ2) 0.0000
∗∗∗Probability < 0.001 (one-tail test); ∗∗probability < 0.01 (one-tail test); ∗probability < 0.05 (one-tail test).NOTE: z statistics are based on standard errors estimated with clustering by weather station. The constantterms are omitted from the table for the sake of brevity.
half. We expect those above the age of 50 to exhibit a strong relationship between long-termtrends in spring–summer temperatures and perceptions of anthropogenic global warming;on the other hand, those below 50—who are more likely to be mobile and hence less likelyto reside in the same locale for 10 years or more—should be less likely to connect long-termtemperature trends and perceptions of climate change.
In Table D1, we find strong support for our arguments. For those above the age of 50,there is a strong positive relationship between differences in spring–summer temperature
Science, Scientists, and Local Weather 33
trends and perceptions of global warming (b = 0.191, z = 2.57). On the other hand, for theyounger sample subset there is no discernible relationship between long-term temperaturetrends and global warming perceptions (b = 0.082, z = −1.08). Indeed, the coefficientfor older individuals is more than twice the size of the coefficient for younger individuals.In Table D2, we supplement these results by estimating an interaction model in whichwe include an interaction comprising a dichotomous variable for age (1 = above 50, 0 =otherwise) and the long-term spring–summer temperature trend difference. The coefficientfor the spring–summer temperature trend difference variable represents the effect of thisvariable for those survey respondents aged 50 or below, and as one can see this variabledoes not have a significant effect on the dependent variable (b = 0.071, z = 0.96). Onthe other hand, the coefficient for the interaction variable gives us an estimate of thedifference in the effects of long-term temperature trends for those above 50 years of ageand those 50 years of age or below; clearly, the effect of long-term temperature trends issignificantly different for these two age groups (b = 0.162, z = 1.75).
The bottom line is that it appears that older survey respondents—who are less likely tomove and hence more likely to reside in their current home county for a long time period—are more likely than younger survey respondents to connect long-term temperature trendsand their perceptions of global warming. This is not a direct test of the length-of-residencehypothesis, but it does provide some indirect evidence to support the notion that long-term residents are more likely to internalize 10-year temperature trends in shaping theirperceptions of global warming.
REFERENCES
Benetsky, Megan J., Charlynn Burd, and Melanie Rapino, 2015. “Young Adult Migration: 2007–2009 to2010–2012.” American Community Survey Reports, ACS-31.Washington, DC: U.S. Census Bureau.
Borick, C. P., and B. G. Rabe. 2010. “A Reason to Believe: Examining the Factors that Determine IndividualViews on Global Warming.” Social Science Quarterly 91:777–800.
Boykoff, M. T. 2008. “Media and Scientific Communication: A Case of Climate Change.” Geological Society305:11–18.
Boykoff, M. T., and J. M. Boykoff. 2004. “Balance as Bias: Global Warming and the U.S. Prestige Press.”Global Environmental Change—Human and Policy Dimensions 14:125–36.
Brody, S. D., S. Zahran, A. Vedlitz, and H. Grover. 2008. “Examining the Relationship Between PhysicalVulnerability and Public Perceptions of Global Climate Change in the United States.” Environment andBehavior 40:72–95.
Clements, J. M., A. M. McCright,and C. Xiao. (2014). “Green Christians? An Empirical Examination ofEnvironmental Concern Within the U.S. General Public.“ Organization Environment 27(1):85–102.
Dietz, T., A. Dan, and R. Shwom. 2007. “Support for Climate Change Policy: Social Psychological and SocialStructural Influences. Rural Sociology 72:185–214.
Dunlap, R. E. 1998. “Lay Perceptions of Global Risk—Public Views of Global Warming in Cross-NationalContext.” International Sociology 13:473–98.
Dunlap, R. E., and A. M. McCright. 2008. “A Widening Gap—Republican and Democratic Views on ClimateChange.” Environment 50:26–35.
Egan, Patrick J., and Megan Mullin. 2012. “Turning Personal Experience into Political Attitudes: The Effectof Local Weather on Americans’ Perceptions About Global Warming.” Journal of Politics 79:796–809.
Finucane, M. L., P. Slovic, C. K. Mertz, J. Flynn, and T. A. Satterfield. 2000. “Gender, Race, and PerceivedRisk: The ‘White Male’ Effect.” Health Risk and Society 2:159–72.

34 Social Science Quarterly
Funk, Cary, Lee Rainie, and Dana Page. 2015. “Public and Scientists’ Views on Science and Society.” PewResearch Center Report. Washington, DC: Pew Research Center. Available at 〈http://www.pewinternet.org/files/2015/01/PI_ScienceandSociety_Report_012915.pdf〉.Gallup. 2008. “Climate-Change Views: Republican-Democratic Gaps Expand.” Available at 〈http://www.gallup.com/poll/107569/climatechange-views-republicandemocratic-gaps-expand.aspx〉.Gomez, Brad T., Thomas G. Hansford, and George A. Krause. 2007. “The Republicans Should Pray for Rain:Weather, Turnout, and Voting in U.S. Presidential Elections.” Journal of Politics 69:649–63.
Hamilton, L. C. 2008. “Who Cares About Polar Region?” Arctic, Antarctic, and Alpine Research 40:671–78.
——— 2011. “Education, Politics, and Opinions About Climate Change: Evidence for Interaction Effects.”Climatic Change 104:231–42.
———. 2012. “Did the Arctic Ice Recover? Demographics of True and False Climate Facts.” Weather, Climate,and Society 4(4):236–49.
Hamilton, L. C., and B. D. Keim. 2009. “Regional Variation in Perceptions About Climate Change.”International Journal of Climatology 29:2348–52.
Hamilton, L. C., and M. D. Stampone. 2013. “Blowin’ in the Wind: Short-Term Weather and Belief inAnthropogenic Climate Change.” Weather, Climate, and Society 5:112–19.
Howe, P., E. Markowitz, T. M. Lee, C. Y. Ko, and A. Leiserowitz, 2013. “Global Perceptions of LocalTemperature Change.” Nature Climate Change 3:352–56.
IPCC. 2013. “Climate Change 2013: The Physical Science Base.” In T. F. Stocker, D. Qin, G.-K. Plattner, M.Tignor, S. K. Allen, J. Boschung, A. Nauels, Y. Xia, V. Bex, and P. M. Midgley, eds., Contribution of WorkingGroup I to the Fifth Assessment Report of the Intergovernmental Panel on Climate Change. Cambridge, UK andNew York, NY: Cambridge University Press.
Jones, R. P., D. Cox, and J. Navarro-Rivera. 2014. “Believers, Sympathizers, and Skeptics– Why Americansare Conflicted About Climate Change, Environmental Policy, and Science.” Public Religion Research InstituteReport. Available at 〈https://hazdoc.colorado.edu/bitstream/handle/10590/2921/C023108.pdf?sequence=1〉.Kahan, D. M., H. Jenkins-Smith, and D. Braman. 2011. “Cultural Cognition of Scientific Consensus.” Journalof Risk Research 14(2):147–74.
Karl, T. R., J. M. Melillo, and T. C. Peterson. 2009. Global Climate Change Impacts in the United States. NewYork: Cambridge University Press.
Kellstedt, P. M., S. Zahran, and A. Vedlitz. 2008. “Personal Efficacy, the Information Environment, andAttitudes Toward Global Warming and Climate Change in the United States.” Risk Analysis 28:113–26.
Krosnick, J. A., and D. F. Alwin. 1987. “An Evaluation of a Cognitive Theory of Response Order Effects inSurvey Measurement.” Public Opinion Quarterly 51:201–19.
Krosnick, J. A., A. L. Holbrook, and P. S. Visser. (2000). “The Impact of the Fall 1997 Debate About GlobalWarming on American Public Opinion.” Public Understanding of Science 9(3):239–60.
———. 2006. “The Origins and Consequences of Democratic Citizens’ Policy Agendas: A Study of PopularConcern About Global Warming.” Climatic Change 77:7–43.
Leiserowitz, A. 2006. “Climate Change Risk Perception and Policy Preferences: The Role of Affect, Imagery,and Values.” Climatic Change 77:45–72.
Lorenzoni, Irene, and Nick Pidgeon.2006. “Public Views on Climate Change: European and USA Perspec-tives.” Climatic Change 77:73–95.
Malka, A., J. A. Krosnick, and G. Langer. 2009. “The Association of Knowledge with Concern About GlobalWarming: Trusted Information Sources Shape Public Thinking.” Risk Analysis 29:633–47.
Marshall, B. K. 2004. “Gender, Race, and Perceived Environmental Risk: The ‘White Male’ Effect in CancerAlley, LA.” Sociological Spectrum 24:453–78.
McCright, A. M., and R. E. Dunlap. 2000. “Challenging Global Warming as a Social Problem: An Analysisof the Conservative Movement’s Counter-Claims.” Social Problems 47:499–522.
———. 2011a. “Cool Dudes: The Denial of Climate Change Among Conservative White Males in the UnitedStates.” Global Environmental Change—Human and Policy Dimensions 21:1163–72.

Science, Scientists, and Local Weather 35
———.2011b. “The Politicization of Climate Change and Polarization in the American Public’s Views ofGlobal Warming, 2001–2010.” Sociological Quarterly 52:155–94.
Myers, T., E. Maibach, C. Roser-Renouf, K. Akerlof, and A. Leiserowitz. 2013. “The Relationship BetweenPersonal Experience and Belief in the Reality of Global Warming.” Nature Climate Change 3:343–47.
Nisbet, M. C., and T. Myers. 2007. “The Polls—Trends—Twenty Years of Public Opinion About GlobalWarming.” Public Opinion Quarterly 71:444–70.
Oreskes, N. 2004. “Beyond the Ivory Tower: The Scientific Consensus on Climate Change.” Science306(5702):1686.
Pew Research Center. 2006. “Little Consensus on Global Warming: Partisanship Drives Opinion.” Availableat 〈http://www.people-press.org/2006/07/12/little-consensus-on-global-warming/〉.———. 2007. “Global Warming: A Divide on Causes and Solutions.” Available at 〈http://www.people-press.org/2007/01/24/global-warming-a-divide-on-causes-and-solutions/〉.———. 2009. “May 2009 Science Survey.” Available at 〈http://www.people-press.org/2009/07/30/may-2009-science-survey/〉.———. 2012. “More Say There is Solid Evidence of Global Warming.” Available at 〈http://www.people-press.org/2012/10/15/more-say-there-is-solid-evidence-of-global-warming/〉.———. 2013. “GOP Deeply Divided Over Climate Change.” Available at 〈http://www.people-press.org/2013/11/01/gop-deeply-divided-over-climate-change/〉.Primo, D. M., M. L. Jacobsmeier, and J. Milyo. 2007. “Estimating the Impact of State Policies and Institutionswith Mixed-Level Data.” State Politics and Policy Quarterly 7:446–59.
Shao, W., B. D. Keim, J. C. Garand, and L. C. Hamilton. 2014. “Weather, Climate, and the Economy:Explaining Risk Perceptions of Global Warmking, 2001–10.” Weather, Climate, and Society 6:119–34.
Smith, N., and A. Leiserowitz. (2013). “American Evangelicals and Global Warming.” Global EnvironmentalChange 23:1009–17.
Solomon, S., D. Qin, M. Manning, Z. Chen, M. Marquis, K. B. Averyt, M. Tignor, and H. L. Miller. 2007.Contribution of Working Group I to the Fourth Assessment Report of the Intergovernmental Panel on ClimateChange. Cambridge, UK and New York, NY: Cambridge University Press.
U.S. National Research Council. 2010. Advancing the Science of Climate Change. Washington, DC: NationalAcademies Press.
Van Dyke, F. H., D. C. Mahan, J. K. Sheldon, and R. H. Brand. (1996). Redeeming Creation: The BiblicalBasis for Environmental Stewardship. Downer’s Grove, IL: IVP Academic.
Vanliere, K. D., and R. E. Dunlap. 1980. “The Social Bases of Environmental Concern—A Review ofHypotheses, Explanations, and Empirical Evidence.” Public Opinion Quarterly 44:181–97.
Walsh, J., D. Wuebbles, K. Hayhoe, J. Kossin, K. Kunkel, G. Stephens, et al. (2014). “Our Changing Climate.”Chapter 2 in J. M. Melillo, T. Richmond, and G. W. Yohe, eds., Climate Change Impacts in the United States:The Third National Climate Assessment. Global Change Research Program.
Wilkinson, K. K. (2010). “Climate’s Salvation? Why and How American Evangelicals are Engaging withClimate Change.” Environment 52:47–57.
———. (2012). Between God & Green: How Evangelicals are Cultivating a Middle Ground on Climate Change.Osford: Oxford University Press.
Wood, B. D., and A. Vedlitz. 2007. “Issue Definition, Information Processing, and the Politics of GlobalWarming.” American Journal of Political Science 51:552–68.
Zaller, J. R. 1992. The Nature and Origins of Mass Opinion. New York: Cambridge University Press.


![M1 Garand Barrel Replacement – New Barrel[1]](https://static.fdocuments.net/doc/165x107/577c79801a28abe05492e684/m1-garand-barrel-replacement-a-new-barrel1.jpg)


