Science Rice - Philippine Rice Research Institute · Science Rice Why Is Per Capita ... because of...
4
FOR DECISION- MAKERS VOL. 3 NO. 1 • ISSN 2094-8409 Rice Science Why Is Per Capita Rice Consumption Increasing? Per Capita Rice Consumption (PCRC) is the average amount of milled rice consumed by an individual annually. This is used in estimating rice imports and in setting rice self-sufficiency targets. PCRC has been increasing over time. This can be attributed to real and arithmetical factors. Real factors are the shift in consumers’ preference from other staples (i.e., cassava, corn, and kamote) to rice, and the increasing number of poor families. Arithmetical factors are the outdated parameters of the Supply and Utilization Accounts (SUA), and rice smuggling. The domestic price of rice should approximate its world price to discourage smuggling. Adopt policies that favor wealth distribution and poverty reduction. Policies need to encourage the production and consumption of rice substitutes and brown rice. The Department of Agriculture’s Inter-Agency Com- mittee on Cereals could set new estimates of SUA parameters to derive a more realistic Per Capita Net Food Disposable (PCNFD) figure. KEY P INTS INTRODUCTION Per Capita Rice Consumption (PCRC) is an approximate measure of the amount of milled rice consumed by a person in a year. This is a critical variable used in estimating the rice requirement of the country. Therefore, this has an impact on setting the import requirement of the country. Increased PCRC means more imported rice 1 . The Bureau of Agricultural Statistics (BAS) has two ways of estimating PCRC: the Food Consumption Surveys (FCS) and the Supply and Utilization Accounts (SUA) framework. FCS measures the amount of food actually consumed by sample households. Survey data are more accurate but availability is for selected years only because data gathering is expensive. In the SUA framework, PCRC is derived by dividing the Net Food Disposable (NFD) by the total population. NFD is the total amount of rice available for consumption after deducting allotments for exports, seeds, feeds and wastes, processing, and ending stocks from total supply 2 of milled rice. SUA enables the BAS to provide annual estimates of PCRC. SUA-based PCRC is therefore frequently used in agricultural policy planning. Both methods assert that PCRC has been generally increasing over the years. This has earned growing concern because of its effect on rice importation and self-sufficiency targets. 1 Assuming that local production is held constant. 2 Total supply includes local production (harvest from first to third cropping seasons), imports, and beginning stocks.
Transcript of Science Rice - Philippine Rice Research Institute · Science Rice Why Is Per Capita ... because of...
FOR
DECISION- MAKERS
VOL. 3 NO. 1 • ISSN 2094-8409
RiceScience
Why Is Per Capita Rice Consumption Increasing?
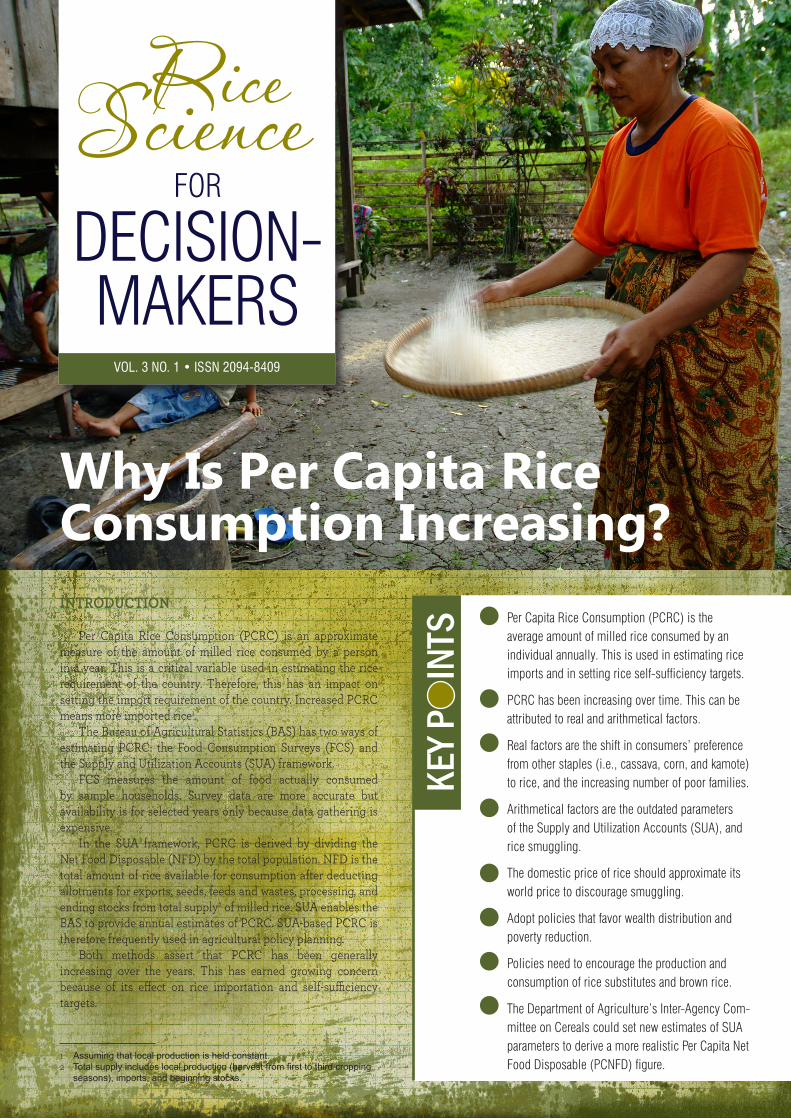
Per Capita Rice Consumption (PCRC) is the average amount of milled rice consumed by an individual annually. This is used in estimating rice imports and in setting rice self-sufficiency targets.
PCRC has been increasing over time. This can be attributed to real and arithmetical factors.
Real factors are the shift in consumers’ preference from other staples (i.e., cassava, corn, and kamote) to rice, and the increasing number of poor families.
Arithmetical factors are the outdated parameters of the Supply and Utilization Accounts (SUA), and rice smuggling.
The domestic price of rice should approximate its world price to discourage smuggling.
Adopt policies that favor wealth distribution and poverty reduction.
Policies need to encourage the production and consumption of rice substitutes and brown rice.
The Department of Agriculture’s Inter-Agency Com-mittee on Cereals could set new estimates of SUA parameters to derive a more realistic Per Capita Net Food Disposable (PCNFD) figure.
KEY P
IN
TS
INTRODUCTION
Per Capita Rice Consumption (PCRC) is an approximate measure of the amount of milled rice consumed by a person in a year. This is a critical variable used in estimating the rice requirement of the country. Therefore, this has an impact on setting the import requirement of the country. Increased PCRC means more imported rice1.
The Bureau of Agricultural Statistics (BAS) has two ways of estimating PCRC: the Food Consumption Surveys (FCS) and the Supply and Utilization Accounts (SUA) framework.
FCS measures the amount of food actually consumed by sample households. Survey data are more accurate but availability is for selected years only because data gathering is expensive.
In the SUA framework, PCRC is derived by dividing the Net Food Disposable (NFD) by the total population. NFD is the total amount of rice available for consumption after deducting allotments for exports, seeds, feeds and wastes, processing, and ending stocks from total supply2 of milled rice. SUA enables the BAS to provide annual estimates of PCRC. SUA-based PCRC is therefore frequently used in agricultural policy planning.
Both methods assert that PCRC has been generally increasing over the years. This has earned growing concern because of its effect on rice importation and self-sufficiency targets.
1 Assuming that local production is held constant. 2 Total supply includes local production (harvest from first to third cropping
seasons), imports, and beginning stocks.
Reasons for Increasing PCRCFactors affecting PCRC are real and arithmetical in nature.
Real factors include the shift in consumers’ preference from other staples3 to rice and the increase in the number of poor families. Arithmetical factors involve the parameters of the SUA framework and rice smuggling.
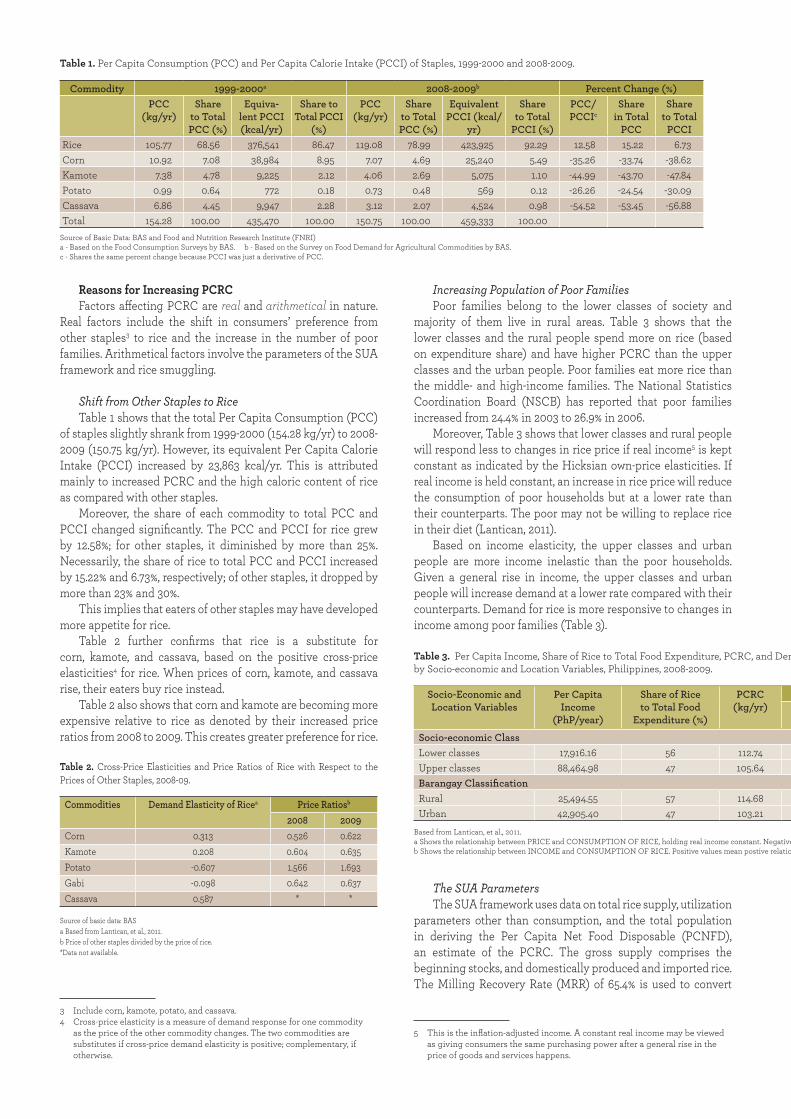
Shift from Other Staples to RiceTable 1 shows that the total Per Capita Consumption (PCC)
of staples slightly shrank from 1999-2000 (154.28 kg/yr) to 2008-2009 (150.75 kg/yr). However, its equivalent Per Capita Calorie Intake (PCCI) increased by 23,863 kcal/yr. This is attributed mainly to increased PCRC and the high caloric content of rice as compared with other staples.
Moreover, the share of each commodity to total PCC and PCCI changed significantly. The PCC and PCCI for rice grew by 12.58%; for other staples, it diminished by more than 25%. Necessarily, the share of rice to total PCC and PCCI increased by 15.22% and 6.73%, respectively; of other staples, it dropped by more than 23% and 30%.
This implies that eaters of other staples may have developed more appetite for rice.
Table 2 further confirms that rice is a substitute for corn, kamote, and cassava, based on the positive cross-price elasticities4 for rice. When prices of corn, kamote, and cassava rise, their eaters buy rice instead.
Table 2 also shows that corn and kamote are becoming more expensive relative to rice as denoted by their increased price ratios from 2008 to 2009. This creates greater preference for rice.
Table 2. Cross-Price Elasticities and Price Ratios of Rice with Respect to the Prices of Other Staples, 2008-09.
Commodities Demand Elasticity of Ricea Price Ratiosb
2008 2009Corn 0.313 0.526 0.622Kamote 0.208 0.604 0.635Potato -0.607 1.566 1.693Gabi -0.098 0.642 0.637Cassava 0.587 * *
Source of basic data: BASa Based from Lantican, et al., 2011.b Price of other staples divided by the price of rice. *Data not available.
3 Include corn, kamote, potato, and cassava.4 Cross-price elasticity is a measure of demand response for one commodity
as the price of the other commodity changes. The two commodities are substitutes if cross-price demand elasticity is positive; complementary, if otherwise.
Increasing Population of Poor FamiliesPoor families belong to the lower classes of society and
majority of them live in rural areas. Table 3 shows that the lower classes and the rural people spend more on rice (based on expenditure share) and have higher PCRC than the upper classes and the urban people. Poor families eat more rice than the middle- and high-income families. The National Statistics Coordination Board (NSCB) has reported that poor families increased from 24.4% in 2003 to 26.9% in 2006.
Moreover, Table 3 shows that lower classes and rural people will respond less to changes in rice price if real income5 is kept constant as indicated by the Hicksian own-price elasticities. If real income is held constant, an increase in rice price will reduce the consumption of poor households but at a lower rate than their counterparts. The poor may not be willing to replace rice in their diet (Lantican, 2011).
Based on income elasticity, the upper classes and urban people are more income inelastic than the poor households. Given a general rise in income, the upper classes and urban people will increase demand at a lower rate compared with their counterparts. Demand for rice is more responsive to changes in income among poor families (Table 3).
The SUA ParametersThe SUA framework uses data on total rice supply, utilization
parameters other than consumption, and the total population in deriving the Per Capita Net Food Disposable (PCNFD), an estimate of the PCRC. The gross supply comprises the beginning stocks, and domestically produced and imported rice. The Milling Recovery Rate (MRR) of 65.4% is used to convert
5 This is the inflation-adjusted income. A constant real income may be viewed as giving consumers the same purchasing power after a general rise in the price of goods and services happens.
Table 1. Per Capita Consumption (PCC) and Per Capita Calorie Intake (PCCI) of Staples, 1999-2000 and 2008-2009.
Commodity 1999-2000a 2008-2009b Percent Change (%)PCC
(kg/yr)Share
to Total PCC (%)
Equiva-lent PCCI (kcal/yr)
Share to Total PCCI
(%)
PCC (kg/yr)
Share to Total PCC (%)
Equivalent PCCI (kcal/
yr)
Share to Total
PCCI (%)
PCC/PCCIc
Share in Total
PCC
Share to Total
PCCIRice 105.77 68.56 376,541 86.47 119.08 78.99 423,925 92.29 12.58 15.22 6.73Corn 10.92 7.08 38,984 8.95 7.07 4.69 25,240 5.49 -35.26 -33.74 -38.62Kamote 7.38 4.78 9,225 2.12 4.06 2.69 5,075 1.10 -44.99 -43.70 -47.84Potato 0.99 0.64 772 0.18 0.73 0.48 569 0.12 -26.26 -24.54 -30.09Cassava 6.86 4.45 9,947 2.28 3.12 2.07 4,524 0.98 -54.52 -53.45 -56.88Total 154.28 100.00 435,470 100.00 150.75 100.00 459,333 100.00
Source of Basic Data: BAS and Food and Nutrition Research Institute (FNRI)a - Based on the Food Consumption Surveys by BAS. b - Based on the Survey on Food Demand for Agricultural Commodities by BAS.c - Shares the same percent change because PCCI was just a derivative of PCC.
Table 3. Per Capita Income, Share of Rice to Total Food Expenditure, PCRC, and Demand Elasticities (Hicksian Own-Price and Income), by Socio-economic and Location Variables, Philippines, 2008-2009.
Socio-Economic and Location Variables
Per Capita Income
(PhP/year)
Share of Rice to Total Food
Expenditure (%)
PCRC (kg/yr)
Hicksian Own-Price Elasticitya Income Elasticityb
Uncensored LA/AIDS
Censored LA/AIDS
Uncensored LA/AIDS
Censored LA/AIDS
Socio-economic ClassLower classes 17,916.16 56 112.74 -0.222 -0.224 0.102 0.103Upper classes 88,464.98 47 105.64 -0.277 -0.281 0.023 0.023Barangay ClassificationRural 25,494.55 57 114.68 -0.209 -0.212 0.069 0.069Urban 42,905.40 47 103.21 -0.389 -0.389 0.062 0.062
Based from Lantican, et al., 2011. a Shows the relationship between PRICE and CONSUMPTION OF RICE, holding real income constant. Negative values mean negative relationship , i.e. price increase will reduce consumption, and vice-versa. b Shows the relationship between INCOME and CONSUMPTION OF RICE. Positive values mean postive relationship, i.e. a raise in income will increase consumption, and vice-versa.
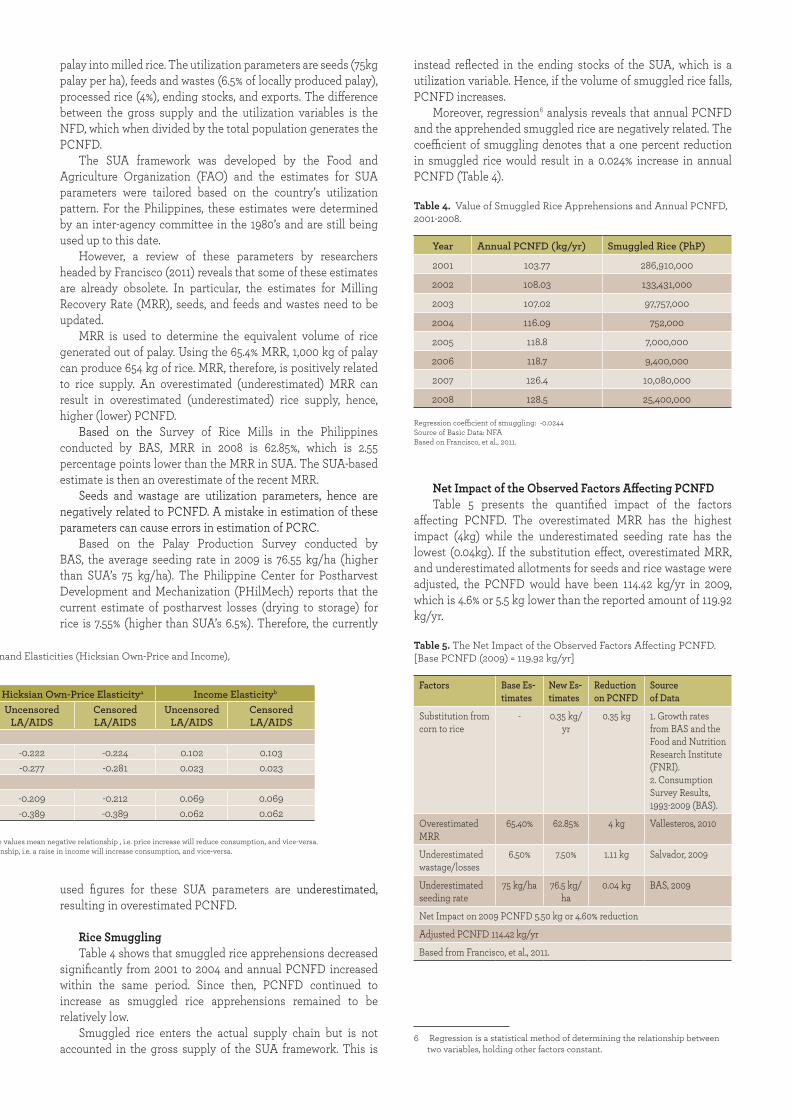
palay into milled rice. The utilization parameters are seeds (75kg palay per ha), feeds and wastes (6.5% of locally produced palay), processed rice (4%), ending stocks, and exports. The difference between the gross supply and the utilization variables is the NFD, which when divided by the total population generates the PCNFD.
The SUA framework was developed by the Food and Agriculture Organization (FAO) and the estimates for SUA parameters were tailored based on the country’s utilization pattern. For the Philippines, these estimates were determined by an inter-agency committee in the 1980’s and are still being used up to this date.
However, a review of these parameters by researchers headed by Francisco (2011) reveals that some of these estimates are already obsolete. In particular, the estimates for Milling Recovery Rate (MRR), seeds, and feeds and wastes need to be updated.
MRR is used to determine the equivalent volume of rice generated out of palay. Using the 65.4% MRR, 1,000 kg of palay can produce 654 kg of rice. MRR, therefore, is positively related to rice supply. An overestimated (underestimated) MRR can result in overestimated (underestimated) rice supply, hence, higher (lower) PCNFD.
Based on the Survey of Rice Mills in the Philippines conducted by BAS, MRR in 2008 is 62.85%, which is 2.55 percentage points lower than the MRR in SUA. The SUA-based estimate is then an overestimate of the recent MRR.
Seeds and wastage are utilization parameters, hence are negatively related to PCNFD. A mistake in estimation of these parameters can cause errors in estimation of PCRC.
Based on the Palay Production Survey conducted by BAS, the average seeding rate in 2009 is 76.55 kg/ha (higher than SUA’s 75 kg/ha). The Philippine Center for Postharvest Development and Mechanization (PHilMech) reports that the current estimate of postharvest losses (drying to storage) for rice is 7.55% (higher than SUA’s 6.5%). Therefore, the currently
instead reflected in the ending stocks of the SUA, which is a utilization variable. Hence, if the volume of smuggled rice falls, PCNFD increases.
Moreover, regression6 analysis reveals that annual PCNFD and the apprehended smuggled rice are negatively related. The coefficient of smuggling denotes that a one percent reduction in smuggled rice would result in a 0.024% increase in annual PCNFD (Table 4).
Table 4. Value of Smuggled Rice Apprehensions and Annual PCNFD, 2001-2008.
Year Annual PCNFD (kg/yr) Smuggled Rice (PhP)
2001 103.77 286,910,000
2002 108.03 133,431,000
2003 107.02 97,757,000
2004 116.09 752,000
2005 118.8 7,000,000
2006 118.7 9,400,000
2007 126.4 10,080,000
2008 128.5 25,400,000 Regression coefficient of smuggling: -0.0244Source of Basic Data: NFABased on Francisco, et al., 2011.
Net Impact of the Observed Factors Affecting PCNFDTable 5 presents the quantified impact of the factors
affecting PCNFD. The overestimated MRR has the highest impact (4kg) while the underestimated seeding rate has the lowest (0.04kg). If the substitution effect, overestimated MRR, and underestimated allotments for seeds and rice wastage were adjusted, the PCNFD would have been 114.42 kg/yr in 2009, which is 4.6% or 5.5 kg lower than the reported amount of 119.92 kg/yr.
Table 5. The Net Impact of the Observed Factors Affecting PCNFD.[Base PCNFD (2009) = 119.92 kg/yr]
Factors Base Es-timates
New Es-timates
Reduction on PCNFD
Source of Data
Substitution from corn to rice
- 0.35 kg/yr
0.35 kg 1. Growth rates from BAS and the Food and Nutrition Research Institute (FNRI). 2. Consumption Survey Results, 1993-2009 (BAS).
Overestimated MRR
65.40% 62.85% 4 kg Vallesteros, 2010
Underestimated wastage/losses
6.50% 7.50% 1.11 kg Salvador, 2009
Underestimated seeding rate
75 kg/ha 76.5 kg/ha
0.04 kg BAS, 2009
Net Impact on 2009 PCNFD 5.50 kg or 4.60% reduction
Adjusted PCNFD 114.42 kg/yr
Based from Francisco, et al., 2011.
6 Regression is a statistical method of determining the relationship between two variables, holding other factors constant.
used figures for these SUA parameters are underestimated, resulting in overestimated PCNFD.
Rice SmugglingTable 4 shows that smuggled rice apprehensions decreased
significantly from 2001 to 2004 and annual PCNFD increased within the same period. Since then, PCNFD continued to increase as smuggled rice apprehensions remained to be relatively low.
Smuggled rice enters the actual supply chain but is not accounted in the gross supply of the SUA framework. This is
Table 3. Per Capita Income, Share of Rice to Total Food Expenditure, PCRC, and Demand Elasticities (Hicksian Own-Price and Income), by Socio-economic and Location Variables, Philippines, 2008-2009.
Socio-Economic and Location Variables
Per Capita Income
(PhP/year)
Share of Rice to Total Food
Expenditure (%)
PCRC (kg/yr)
Hicksian Own-Price Elasticitya Income Elasticityb
Uncensored LA/AIDS
Censored LA/AIDS
Uncensored LA/AIDS
Censored LA/AIDS
Socio-economic ClassLower classes 17,916.16 56 112.74 -0.222 -0.224 0.102 0.103Upper classes 88,464.98 47 105.64 -0.277 -0.281 0.023 0.023Barangay ClassificationRural 25,494.55 57 114.68 -0.209 -0.212 0.069 0.069Urban 42,905.40 47 103.21 -0.389 -0.389 0.062 0.062
Based from Lantican, et al., 2011. a Shows the relationship between PRICE and CONSUMPTION OF RICE, holding real income constant. Negative values mean negative relationship , i.e. price increase will reduce consumption, and vice-versa. b Shows the relationship between INCOME and CONSUMPTION OF RICE. Positive values mean postive relationship, i.e. a raise in income will increase consumption, and vice-versa.
CALL
FOR
ACTI
N
Rice Science for Decision-Makers is published by the DA-Philippine Rice Research Institute (PhilRice). It synthesizes findings in rice science to help craft decisions relating to rice production and technology adoption and adaptation. It also provides recommendations that may offer policy triggers to relevant rice stakeholders in search of opportunities to share their knowledge on rice-related policies.
The articles featured here are grounded on solid basic and applied research in agronomy, biology, chemistry, and engineering; but it also underscores major contribution from the social sciences.
The theme for this issue aims to answer why per capita rice consumption is increasing. A PhilRice study sought to investigate the reason behind this phenomenon and recommends setting new estimates of Supply and Utilization Accounts (SUA) parameters to derive a more realistic Per Capita Net Food Disposable (PCNFD) figure. The Per Capita Rice Consumption (PCRC) as yardstick for economic development is significant as it calculates average amount of milled rice consumed by an individual annually. This is used in estimating rice imports and in setting rice self-sufficiency targets.
For comments and requests for additional copies, please write to:
Development Communication Division Philippine Rice Research Institute Maligaya, Science City of Muñoz, Nueva Ecija
Contact: [email protected] (44) 456-0258,-0277,-0285 loc. 511, 512
Editorial Team: Eufemio T. Rasco, Jr. Sergio R. Francisco Aileen Castañeda-Litonjua Flordeliza H. Bordey Constante T. Briones Suennie Jane C. Paran
Managing Editor: Anne Marie Jennifer E. Eligio
Layout Artist: Carlo G. Dacumos
Rice Science for Decision-Makers is published as a quarterly policy advocacy material by the Philippine Rice Research Institute, Science City of Muñoz, Nueva Ecija, Philippines. ISSN 2094-8409
ABOUT THE MATERIAL
The DA’s Inter-Agency Committee on Cereals could set new estimates of SUA parameters (i.e. MRR, seeds, processing, and feeds and wastes) to derive a more realistic PCNFD figure. The new estimates should then be endorsed to the National Statistics Coordination Board (NSCB) for approval and adoption.
Policies that encourage the production and consumption of non-rice staples such as cassava, corn, and kamote as substitutes for rice are needed. This will help government to manage consumption and ease demand pressure on rice. A stop-gap policy measure that may be considered is to allow NFA price of rice to approximate the market price; subsidized prices could induce higher consumption of rice.
Encourage production and consumption of brown rice. Brown rice is more nutritious and more satiating than white rice, resulting in less amount consumed.
The domestic price of rice should approximate the world price to discourage smuggling. Government must enhance the competitiveness of local rice producers and processors through adoption of new technologies. Thus, support to rice research, development, and extension should continue.
Food and Nutrition Research Institute [1997] The Philippine Food Composition Tables. Manila: FNRI, Department of Science and Technology.
Francisco, S.R., A.B. Mataia, A.M. Eusebio, E.B. Sanguyo, M.A.S. Constantino, E.D. Causon, K.P. Quilloy, and M.A. Sombilla [2011] “Increasing Per Capita Rice Consumption in the Philippines: Myths and Realities”, a paper presented in the monthly seminar series of the Philippine Rice Research Institute (PhilRice) held at PhilRice, Muñoz, Nueva Ecija, October 2011.
Lantican, F.A., K.P. Quilloy, and M.A. Sombilla [2011] “Estimating the Demand Elasticities of Rice in the Philippines”, a report submitted to PhilRice for the project Explaining the Increasing Per Capita Rice Consumption in the Philippines.
REFERENCES