Science report: SC030134 - gov.uk...Science Report Sewage Risks to Urban Groundwater 3 Science at...
36
Sewage risks to urban groundwater Science report: SC030134 SCHO0907BNGD-E-P
Transcript of Science report: SC030134 - gov.uk...Science Report Sewage Risks to Urban Groundwater 3 Science at...

Sewage risks to urban groundwater
Science report: SC030134
SCHO0907BNGD-E-P

Science Report Sewage Risks to Urban Groundwater 2
The Environment Agency is the leading public body protecting and improving the environment in England and Wales. It's our job to make sure that air, land and water are looked after by everyone in today's society, so that tomorrow's generations inherit a cleaner, healthier world. Our work includes tackling flooding and pollution incidents, reducing industry's impacts on the environment, cleaning up rivers, coastal waters and contaminated land, and improving wildlife habitats. This report is the result of research commissioned and funded by the Environment Agency's Science Programme.
Published by: Environment Agency, Rio House, Waterside Drive, Aztec West, Almondsbury, Bristol, BS32 4UD Tel: 01454 624400 Fax: 01454 624409 www.environment-agency.gov.uk ISBN: 978-1-84432-820-8 © Environment Agency February 2008 All rights reserved. This document may be reproduced with prior permission of the Environment Agency. The views expressed in this document are not necessarily those of the Environment Agency. This report is printed on Cyclus Print, a 100% recycled stock, which is 100% post consumer waste and is totally chlorine free. Water used is treated and in most cases returned to source in better condition than removed. Further copies of this report are available from: The Environment Agency's National Customer Contact Centre by emailing [email protected] or by telephoning 08708 506506.
Authors:B.N.Chisala D.N.Lerner Dissemination Status: Publicly available / released to all regions Keywords: pathogens, urban groundwater, sewers, exfiltration, GIS, probabilistic, risk model Research Contractor: Groundwater Protection and Restoration Group Kroto Research Institute The University of Sheffield Sheffield S3 7HQ Environment Agency's Project Manager: Alwyn Hart Science Project reference: SC030134 Product code: SCHO0907BNGD-E-P

Science Report Sewage Risks to Urban Groundwater 3
Science at the Environment Agency Science underpins the work of the Environment Agency, by providing an up to date understanding of the world about us, and helping us to develop monitoring tools and techniques to manage our environment as efficiently as possible. The work of the Science Department is a key ingredient in the partnership between research, policy and operations that enables the Environment Agency to protect and restore our environment. The Environment Agency's Science Group focuses on five main areas of activity: • Setting the agenda: To identify the strategic science needs of the Environment
Agency to inform its advisory and regulatory roles. • Sponsoring science: To fund people and projects in response to the needs
identified by the agenda setting. • Managing science: To ensure that each project we fund is fit for purpose and
that it is executed according to international scientific standards. • Carrying out science: To undertake the research itself, by those best placed to
do it – either by in-house Environment Agency scientists, or by contracting it out to universities, research institutes or consultancies.
• Providing advice: To ensure that the knowledge, tools and techniques generated by the science programme are taken up by relevant decision-makers, policy makers and operational staff.
Steve Killeen - Head of Science

Science Report Sewage Risks to Urban Groundwater 4
Contents 1 Introduction 6 1.1 The project 6 1.2 Urban groundwater 6
2 Objectives 8 3 Development of BOS-Micro tool 9 3.1 Conceptual model 9 3.2 Components of BOS-Micro 9
4 Validation of BOS-Micro 16 4.1 Description of validation data and sites 16 4.2 Simulation 17 4.3 Results and discussion 20
5 Assessment of generic microbiological risks 23 5.1 Introduction 23 5.2 Description of locations and types of forecast used in simulations 23 5.3 Description of alternative receptor targets for the risk assessment 24 5.4 Results 25 5.5 Discussion 26
6 Conclusion 28 7 Recommendations 29
References 30 Glossary 34 Abbreviations 35

Science Report Sewage Risks to Urban Groundwater 5
List of figures and tables Figure 3.1 Conceptual model of BOS-Micro tool 9 Figure 3.2 BOS-Micro graphical user interface 10 Figure 3.3 Groundwater flow model boundary showing the recharge zones in Nottingham and the sewer network map for Zone 2 (urban recharge zone) 11 Figure 3.4 Conceptual model of the microbial transport processes in the MPRM 13 Figure 3.5 Conceptual distribution of groundwater flow velocities in a bimodal distribution of transport
(matrix and preferential flow mechanism) 14 Figure 4.1 Nottingham region, showing the groundwater flow model boundary of the Sherwood Sandstone aquifer and the locations used in the validation of BOS-Micro 17 Figure 5.1 Locations used in assessing the generic microbiological risks in the sandstone aquifer of
Nottingham from leaking sewers 23 Table 3.1 Typical estimated travel time factors indicating rapid transport of microbial tracers relative to the transport of conservative tracers in a variety of hydrogeological environments 13 Table 4.1 Summary of the data used in validating BOS-Micro 17 Table 4.2 Summary of model input parameter values 18 Table 4.3 Estimated travel time factors from this study in comparison with the typical published values
(taken from Table 3.1) 20 Table 4.4 Estimated range of inactivation rates from this study in comparison with range values compiled from the reviewed published values 21 Table 5.1 Summary of the generic microbiological risks in the sandstone aquifer 24

Science Report Sewage Risks to Urban Groundwater 6
1. Introduction
1.1 The project The goal of this project was to analyse the risk to groundwater from microbiological contaminants in sewage leaking from sewers. A probabilistic risk model was developed as a sub-tool of the existing Borehole Optimisation System (BOS). Nottingham was used as a case study for validation of the model and to explore the consequences of the results. The project was co-funded by the University of Sheffield and the Environment Agency.
1.2 Urban groundwater Urban groundwater is a largely underused resource and the potentially productive Triassic Sherwood Sandstone aquifer beneath the city of Nottingham in the UK is no exception (Lerner and Barrett, 1996; Davison et al., 2002). The perception that it is at risk of pollution from multiple industrial and residential sources and practices has, in the past, made it unattractive as a source of drinking water or indeed process water. However, in recent years, urban groundwater in the UK has been recognised as a potentially valuable resource because of the environmental problems associated with the rising urban water tables and heavy reliance upon rural aquifers. To achieve more sustainable use of our groundwater resource, a balance needs to be attained whereby pressures on rural groundwater are reduced and the continuing rise in urban groundwater levels is arrested. This in turn requires tools to be developed that can be used as aids in decision-making on matters pertaining to urban groundwater pollution risks. Risk is defined as the expected outcome that is the sum of all the possible outcomes multiplied by their probability of occurrence. Risk analysis refers to methods that aim to develop a comprehensive understanding and awareness of the risk associated with a particular variable of interest (Hertz and Thomas, 1983). It is based on the source-pathway-receptor concept. Lerner et al. (2000) state that a full risk analysis of groundwater combines the probabilities of (a) possible source term, that is types, quantities and frequencies of pollutant inputs, and (b) attenuation along the groundwater pathway, with the effects on receptors. The results of the risk analysis are presented in the form of probability distributions, weighing up the likelihood of alternative outcomes. Probability distributions are used in order to describe uncertainty and variability (Environment Agency, 2001a). Significant risk of groundwater pollution can arise from high probability of occurrence combined with relatively mild effects, such as the widespread occurrence of chlorinated solvent pollution, or the converse. Sewer leakage is an example of the converse, with severe health consequences from microbiological pollution, but with low probabilities of occurrence. It is estimated that as many as 4 billion cases per year of water-borne diseases occur globally because of the consumption of polluted drinking water (WHO, 2000). In the UK, outbreaks of water-borne diseases associated with polluted groundwater sources have been documented (Lerner and Halliday, 1994; Bishop et al., 1998), but are rare, with only some 70 officially documented cases over the past 60 years or so (Blackwood et al., 2001). Nevertheless it is very possible that there are other cases which go unrecognised and unreported. In contrast to our increasing knowledge about the prevalence of organic and inorganic pollutants in urban groundwater (Lerner and Cronin, 2004), we know little about the frequency and severity of sewer leakage into groundwater. In addition, we currently do not have tools to analyse the microbiological risks to urban groundwater from leaking sewers.

Science Report Sewage Risks to Urban Groundwater 7
Lerner and Halliday (1994) carried out an early review of leakage from sewers to groundwater, work that was reaffirmed in a later study by Bishop et al. (1998). Both of these studies collected information on reported sewer leaks but did not quantify the risk. A recent exercise found widespread microbiological pollution in shallow groundwater in Nottingham (Barrett et al., 1999), and evidence of enteric bacteria and viruses tens of metres below the water table in both Nottingham and Birmingham (Cronin et al., 2003; Powell et al., 2003). More recently BOS, which predicts the risk of pollution to groundwater in urban areas, was developed. BOS consists of (1) a Catchment Zone Probabilistic Model (CZPM) to find probabilistic borehole catchments from a groundwater flow model, (2) a land-use database, with information on all the industrial land parcels and their potential pollution for six dates in the 20th century, and (3) a probabilistic fate and transport model for the behaviour of organic pollutants in the unsaturated and saturated zones, linked together in a GIS with a single graphical user interface. BOS did not analyse microbiological risks. However, it provides an excellent framework that could be extended and used to assess microbiological risks to urban groundwater from leaking sewers. Detailed information on the development of BOS and its application in assessing the risk to urban groundwater from specific organic contaminants is available (Davison et al., 2002; Tait et al., 2004, 2007; Chisala et al., 2006).

Science Report Sewage Risks to Urban Groundwater 8
2. Objectives The existing BOS tool contains a groundwater flow model and datasets for Nottingham representing some 6 person-years of effort. Therefore, it was a sound basis for the research study and the objectives were defined as follows: 1. Incorporate the Sewer Exfiltration Model (SEM), which is based on a sewer network
map of Nottingham containing sewer network data and properties, into BOS's GIS database.
2. Link the SEM to BOS's CZPM so that, for any borehole, potential sources of microbiological pollution are determined.
3. Build and link the Microbial Pollution Risk Model (MPRM) of fate and transport of microbiological pollution to the SEM and CZPM to form BOS-Micro, as a new sub-tool of BOS for assessing microbiological risks to urban groundwater from leaking sewers.
4. Validate BOS-Micro against field data obtained from urban Nottingham. 5. Use the model to assess the generic microbiological risks in the sandstone aquifer of
Nottingham from leaking sewers.
Science Report Sewage Risks to Urban Groundwater 9
3. Development of BOS-Micro tool
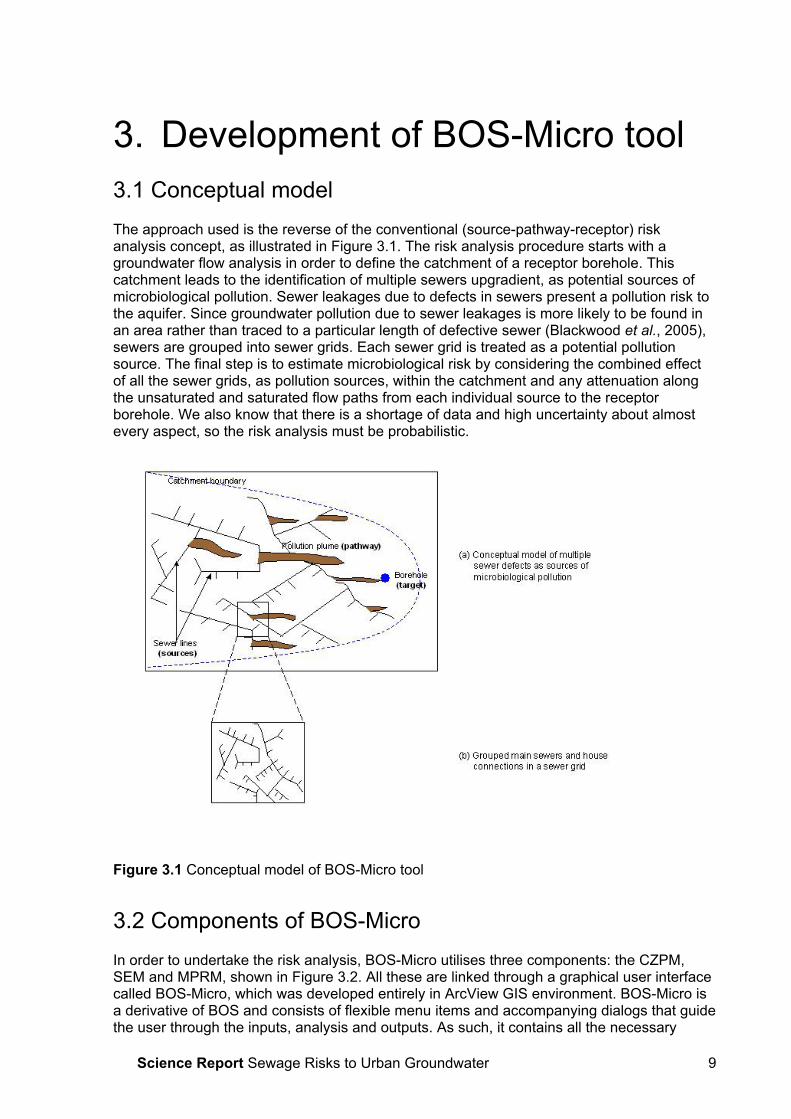
3.1 Conceptual model The approach used is the reverse of the conventional (source-pathway-receptor) risk analysis concept, as illustrated in Figure 3.1. The risk analysis procedure starts with a groundwater flow analysis in order to define the catchment of a receptor borehole. This catchment leads to the identification of multiple sewers upgradient, as potential sources of microbiological pollution. Sewer leakages due to defects in sewers present a pollution risk to the aquifer. Since groundwater pollution due to sewer leakages is more likely to be found in an area rather than traced to a particular length of defective sewer (Blackwood et al., 2005), sewers are grouped into sewer grids. Each sewer grid is treated as a potential pollution source. The final step is to estimate microbiological risk by considering the combined effect of all the sewer grids, as pollution sources, within the catchment and any attenuation along the unsaturated and saturated flow paths from each individual source to the receptor borehole. We also know that there is a shortage of data and high uncertainty about almost every aspect, so the risk analysis must be probabilistic.
Figure 3.1 Conceptual model of BOS-Micro tool
3.2 Components of BOS-Micro In order to undertake the risk analysis, BOS-Micro utilises three components: the CZPM, SEM and MPRM, shown in Figure 3.2. All these are linked through a graphical user interface called BOS-Micro, which was developed entirely in ArcView GIS environment. BOS-Micro is a derivative of BOS and consists of flexible menu items and accompanying dialogs that guide the user through the inputs, analysis and outputs. As such, it contains all the necessary

Science Report Sewage Risks to Urban Groundwater 10
functions that allow any location (be it an existing or hypothetical borehole) within the urban area under study to be selected, the abstracted groundwater risk analysis to be undertaken and the potential contamination risk to be displayed as a probability distribution (Tait et al., 2004). All the components are run direct from, and all analysis can be completed within, BOS-Micro. In addition, the user is shielded from complexities of the background risk analysis process controlling the components.
Figure 3.2 BOS-Micro graphical user interface
3.2.1 Catchment Zone Probabilistic Model (CZPM) The CZPM is an uncertainty-based analysis developed from the well-respected groundwater modelling tools, MODFLOW and MODPATH. The underlying groundwater flow model was initially developed from the hydrogeological conceptual model of the area as part of the regional sandstone aquifer (Rushton and Bishop, 1993). Gebbet (1996) used this information to develop a model of groundwater flow in the urban area of Nottingham with a basic grid spacing of 500 m, which was later modified by Yang et al. (1999) by refining the grid spacing down to 250 m and 125 m for the city centre. For the case study, the CZPM is based on the Yang et al. (1999) model version, which is a one-layer steady-state model with a resolution of 17,500 cells. The CZPM inserts user-defined borehole and aquifer hydrogeological attributes into the MODFLOW files and undertakes the simulations as specified (Tait et al., 2004). Every simulation is based on a set of key model parameters (recharge, hydraulic conductivity, porosity and borehole pumping rate) selected randomly but such that the ensemble fulfils the specified distributions. For each set, a flow field is calculated and, if accepted under the calibration criteria, the advective transport of a hypothetical contaminant originating from the midpoint of each cell of the flow is simulated using particle tracking in MODPATH (Pollock, 1989). Forward tracking was used and involved placing a particle at the centre of each model cell. The particle was then tracked forward in time to see whether it eventually reaches the well or leaves the model at another point. By carrying out many simulations, the probability distribution P[x] is given by n/N where N is the total number of simulations and n is the

Science Report Sewage Risks to Urban Groundwater 11
number of simulations that a particle starting at x reaches the borehole. Note that, for a single simulation, P[x] at a given position is either 0 (the particle does not reach the well) or 1 (the particle does reach a well). Although the CZPM's flow model is steady state, tracking particles requires a transient process of sufficient duration to ensure each particle reaches its endpoint. The main output from the CZPM is a grid showing the probability of capture for each cell within the borehole's catchment. The simulation of groundwater flow also provides the travel time for each cell to the borehole as a probability density function (PDF), which is required as a direct input to the MPRM.
3.2.2 Sewer Exfiltration Model (SEM) Once the catchment is identified, the SEM can then be used to identify part of the sewer network that may affect the microbiological quality of abstracted groundwater. The SEM comprises a sewer network map for Nottingham (right hand side of Figure 3.3). It was constructed by collating information already contained in BOS's GIS database with the digitised sewer asset data obtained from Severn Trent Water (B. Dowd, Severn Trent Water, personal communication, February 2004). The groundwater water flow model on which the CZPM is based on has three recharge zones shown in the left hand side of Figure 3.3. However, the sewer recharge rate that is required as a direct input to the MPRM was quantified only for Zone 2. Therefore, the sewer network map created only covers Zone 2.
Figure 3.3 Groundwater flow model boundary showing the recharge zones in Nottingham and the sewer network map for Zone 2 (urban recharge zone)
As mentioned previously, sewers were grouped into sewer grids, created as a shapefile using the centre point of each sewer grid. The properties of sewers in each sewer grid, total sewer pipe length and average sewer depth to groundwater required as direct inputs to the MPRM, were recorded in the sewer grids attribute table. Sewer age has been shown to be

Science Report Sewage Risks to Urban Groundwater 12
an important parameter associated with sewer leakages. Investigations by Lester and Farrar (1979) and O'Reilly et al. (1989) showed that older sewers had more structural defects that would allow sewer leakages than newer sewers. On the other hand, water companies hold limited information in their sewer asset databases with little or no systematic recording of pipe age (Fenner and Sweeting, 1999). From the early 20th century onwards, development of new buildings was mirrored by the development of sewers to serve them (Davies et al., 2001). Therefore, a plausible assumption can be made that the age of a particular sewer may be approximated from the age of the buildings that the sewer services. The age of the buildings in turn may be estimated by tracing the development of an area using historical maps. Therefore, six historical maps for the years 1900, 1920, 1939, 1955, 1974 and 1991, already contained in BOS's GIS database, were used to estimate the age of each sewer grid. By assuming that the sewer grid age represents the age of sewers contained in it, this information was in turn used to estimate the sewer age leakage factor. The age leakage factor for each sewer grid was populated in the sewer grids attribute table. It is also required as a direct input to the MPRM.
3.2.3 Microbial Pollution Risk Model (MPRM) Conceptual model The MPRM was developed as a simple one-dimensional analytical microbial transport model consisting of two interconnected components: an unsaturated (vadose) zone and a saturated (groundwater) zone model (Figure 3.4). The interconnection is based on the condition that the contaminant flux through the bottom of the unsaturated zone equals that at the top of the saturated zone. The MPRM accounts for the predominant fate and transport processes, namely advection, sorption and inactivation. Transverse dispersion is neglected because it is assumed that the contaminant does not disperse outside the capture zone. Similarly longitudinal dispersion is neglected because it is assumed that it will just smear rather than cause major changes. The contaminant concentrations are established with the premise that there is blending of the pollution plume with clean water simultaneously captured and extracted by a pumping well. Therefore, the MPRM instead accounts for contaminant dilution at a pumping borehole.

Science Report Sewage Risks to Urban Groundwater 13
Figure 3.4 Conceptual model of the microbial transport processes in the MPRM
Recent studies in the UK have provided evidence which shows that matrix dominated flow fails to explain microbiological contamination of groundwater in the sandstone aquifer (Taylor et al., 2004; Morris et al., 2006). These studies suggest that the presence of fractures additionally create important ways of preferential groundwater flow that permit rapid transport of pathogens to a pumping borehole. Published evidence from studies in several hydrogeological environments also suggests the operation of two transport mechanisms – rapid preferential transport of a small proportion of pathogens and much slower matrix flow for the bulk of the pathogens (Table 3.1). Table 3.1 Typical estimated travel time factors indicating rapid transport of microbial tracers relative to the transport of conservative tracers in a variety of hydrogeological environments Organism Factors – Mean
(range) Hydrogeological environment
References
E. coli 5 (1.1 – 9) times faster
Alluvial sand and gravel, fractured granite
(Champ and Schroeter, 1988; Sinton et al., 1997; Deborde et al., 1999)
MS2 7 (1.2 – 71) times faster
Alluvial sand and gravel, fissured glacial till, fissured chalk
(McKay et al., 1993; Sinton et al., 1997, 2000; Deborde et al., 1999)
PRD1 21 (1.2 – 71) times faster
Alluvial sand and gravel, fissured chalk, glacial till
(McKay et al., 1993; Sinton et al., 1997; Deborde et al., 1999)
Furthermore, it has been observed in water quality surveys and groundwater monitoring studies that the magnitude of microbial contamination is often low, implying that only a small proportion (≅1%) of pathogens present are transported to wells or springs via preferential flow (Bales et al., 1989; Prince et al., 1992; Pieper et al., 1997; Sinton et al., 1997; Deborde et al., 1999; Woessner et al., 2001). Most of the pathogens are removed by adsorption and inactivation. The operations of both matrix flow and preferential flow mechanism in the transport of pathogens can be represented by a bimodal distribution of pathogen transport,

Science Report Sewage Risks to Urban Groundwater 14
as shown in Figure 3.5. It may better explain how pathogens move in fractured or fissured aquifers. Since fractures have been observed in the sandstone aquifer beneath Nottingham our study area (Powell et al., 2003), this kind of bimodal distribution of transport in the saturated zone was postulated.
Figure 3.5 Conceptual distribution of groundwater flow velocities in a bimodal distribution of transport (matrix and preferential flow mechanism)
Mathematical model The microbial contaminant flux, Fu (count/T), at the bottom of the unsaturated zone is represented by equation 1, which contains, for each pollution source (sewer grid), initial source flux Fi (count/T) and decay terms. The decay term consists of the pathogen transport process, inactivation, modelled with first order kinetic rate constant, λ (1/T) (Schijven and Hassanizadeh, 2000), and the travel time, tu (T), for pathogens to be transported from each sewer grid through the unsaturated zone to the water table. )*exp( uiu tFF λ−= (1) Fi is conceptualised as the pathogen load in sewage leaking from sewer pipes within a grid, so is represented by the pathogen concentration in raw sewage Co (count/L3), the sewer exfiltration rate E (L3/T.L), the sewer age leakage factor fage (dimensionless) and the total pipe length Lgrid (L) for sewers within a sewer grid, as shown in equation 2. E is assumed to be a function of the average sewer recharge rate R (L/T), the Nottingham urban zone area A (L2) and total sewer pipe length within Nottingham urban zone. E
gridageoi LfLARCF ****= (2)
The processes of advection or the mechanism by which soil moisture transports contaminants through the unsaturated zone governs the movement of the source flux down through the unsaturated zone. Furthermore, as the source flux moves down through the unsaturated zone pathogens adhere to the soil surfaces due to sorption process and this retards their transport. Therefore, tu is a function of soil moisture content θ (%), depth of the

Science Report Sewage Risks to Urban Groundwater 15
unsaturated zone to groundwater z (L), sewage percolation rate Prate (L/T), and sorption is incorporated in the calculation of tu by applying a retardation factor Rf (dimensionless). tu is represented by equation 3:
rate
fu P
Rzt
**θ= (3)
Prate, represented by equation 4, is assumed to be a function of the average sewer recharge rate R (L/T), the Nottingham urban zone area A (L2) and the total area within the whole study area over which wastewater seeps through the unsaturated zone to the water table Parea (L2).
arearate P
ARP *= (4)
In the saturated zone, pathogenic micro-organisms move with the groundwater. The bulk pollution flux is retarded relative to the groundwater travel time due to the sorption and inactivation processes. Since a bimodal distribution of transport – slower matrix flow transport of most of the pathogens and rapid transport of a small fraction of pathogens through preferential flow via fractures – has been assumed, the travel time of pathogens was calculated separately for the two modes of transport. As suggested by several authors, 1% of the proportion of pathogens was assumed to be transported through preferential flow (Bales et al., 1989; Prince et al., 1992; Pieper et al., 1997; Sinton et al., 1997 Deborde et al., 1999; Woessner et al., 2001). Consequently, the pollution flux at a pumping borehole for pathogens travelling via preferential flow, Fw_1 (count/T), was calculated using equation 5 by incorporating inactivation and sorption through the application of a first order inactivation rate constant and retardation factor respectively.
−=
time
fuw F
tRFF
**exp*01.01_
λ (5)
t (T) is the average groundwater travel time and Ftime (dimensionless) is the travel time factor needed to allow faster movement of pathogens, relative to t, via preferential flow. The remaining 99% proportion of pathogens was assumed to travel at the average groundwater velocity as via the matrix flow. Therefore, the pollution flux, Fw_99 (count/T), at a pumping borehole for these pathogens was calculated according to equation 6 by also applying a first order inactivation rate constant and retardation factor.
)**exp(*99.099_ tRFF fuw λ−= (6) The pathogen concentration, Cw (count/L3), was established by summing the pollution fluxes over the total number of sewer grids, m (number) within the borehole's catchment and incorporation of the dilution process described by the borehole pumping rate Q (L3/T) according to equation 7.
∑+
=m
www Q
FFC 99_1_ (7)
Science Report Sewage Risks to Urban Groundwater 16
4. Validation of BOS-Micro Establishing the accuracy or predictive power of the model is a fundamental step in risk assessment. Model validation is probably the best way of establishing the accuracy or predictive power of a model. It ideally involves comparison of model results/predictions with actual field measurements from the system being studied (Frey and Patil, 2002; Begueria, 2006). Validation of risk assessment models has historically been hampered because of their complexity, combining both scenario generation and fate and transport, often in situations where data is scarce (Kakko et al., 1996). Furthermore, they are designed to predict the probability of an outcome, that is they are concerned with events that may not have occurred yet at the site of interest. These factors may explain why these risk models are rarely validated against field data (Frey and Patil, 2002; Lerner et al., 2004). Nonetheless, in this study an attempt was made to validate the BOS-Micro tool as described in the following paragraphs.
4.1 Description of validation data and sites The detection of total and faecal coliforms is used as a way of assessing the bacterial faecal pollution of water (Jagals et al., 2000). Faecal coliforms, a subset of total coliforms, are considered as a more reliable indicator of faecal pollution. This is because some members of the total coliform group have also been frequently found in non-faecally polluted water (Maier et al., 2000). Therefore, it is considered acceptable that low numbers of total coliforms may occasionally occur in water samples and their presence in the absence of faecal coliforms does not represent a risk to health (DWI, 2005). The methods for detecting pathogenic viruses are relatively laborious, require specialised personnel and are expensive (Havelaar et al., 1993; Toze, 1999; Leclerc et al., 2000). Bacteriophages, (viruses that infect bacterial hosts), have been proposed as an obvious alternative because they are readily detectable by simple, rapid and inexpensive methods, (IAWPRC, 1991; Leclerc et al., 2000). A group known as coliphages have been widely used as a useful indicator of the potential presence of enteric viruses in water samples (Grabow et al., 1995). Validation of BOS-Micro was achieved by comparing model predictions from three sites against field data obtained from two studies (Figure 4.1). The criterion used in selecting the three sites was the availability of field data. Site 1 is located in the most industrialised area of Nottingham. In 1900, the land use was largely agricultural with small clusters of industries, but by 1997, the land use was residential with large numbers of industrial sites (Davison et al., 2002). Site 2 is located on an open grassed area within zones of mixed industrial, institutional and residential use (Davison et al., 2002; Powell et al., 2003). In comparison to Site 1, there are fewer industries near Site 2. Site 3 is located at the mid point of a completely residential area of a 1970s housing development. Field data used in the validation process for Sites 1 and 2, located directly on the sandstone aquifer, came from multilevel boreholes (Powell et al., 2003). Samples were taken at different depths and over a period of time. Therefore, the datasets for Sites 1 and 2 represent vertically separated and multiple measurements taken over a period of time. On the other hand, validation data for Site 3 came from a set of 11 shallow boreholes, which were only sampled once (Barrett et al., 1999). The boreholes were installed within 1 km2 of a 1970s housing development, which is located on the river sands and gravel immediately overlying the Sherwood Sandstone aquifer. The boreholes were too close together to be individually resolved within the model. A single position in the middle of the group was modelled, and the field data from the 11 boreholes was used to reflect the local variability in observations. The

Science Report Sewage Risks to Urban Groundwater 17
validation data for Site 3, hence, represents a snapshot of the microbiological quality of water from physically separated boreholes.
Figure 4.1 Nottingham region, showing the groundwater flow model boundary of the Sherwood Sandstone aquifer and the locations used in the validation of BOS-Micro Only one out of the three sites had data for both total and faecal coliforms as an indication of the bacterial quality of water. Therefore, the data that was utilised was only for faecal coliforms and coliphages. The variety of data available was summarised for each category as (a) the number of positive detections in the total number of samples taken, and (b) the mean concentration observed in that category. The summary is presented in Table 4.1. Table 4.1 Summary of the data used in validating BOS-Micro Sites Faecal coliforms Coliphages No. of positive detection
(total samples) Mean (range) cfu/100 ml
No. of positive detection (total samples)
Mean (range) pfu/l
1 22 (71) 3 (0–172) 3 (60) 34 (0–1000) 2 3 (30) - 1 (20) - 3 11 (11) 29 (1–160)* 5 (11) 454 (0–1000)Notes: - not done, *concentration unit is mpn/100 ml

Science Report Sewage Risks to Urban Groundwater 18
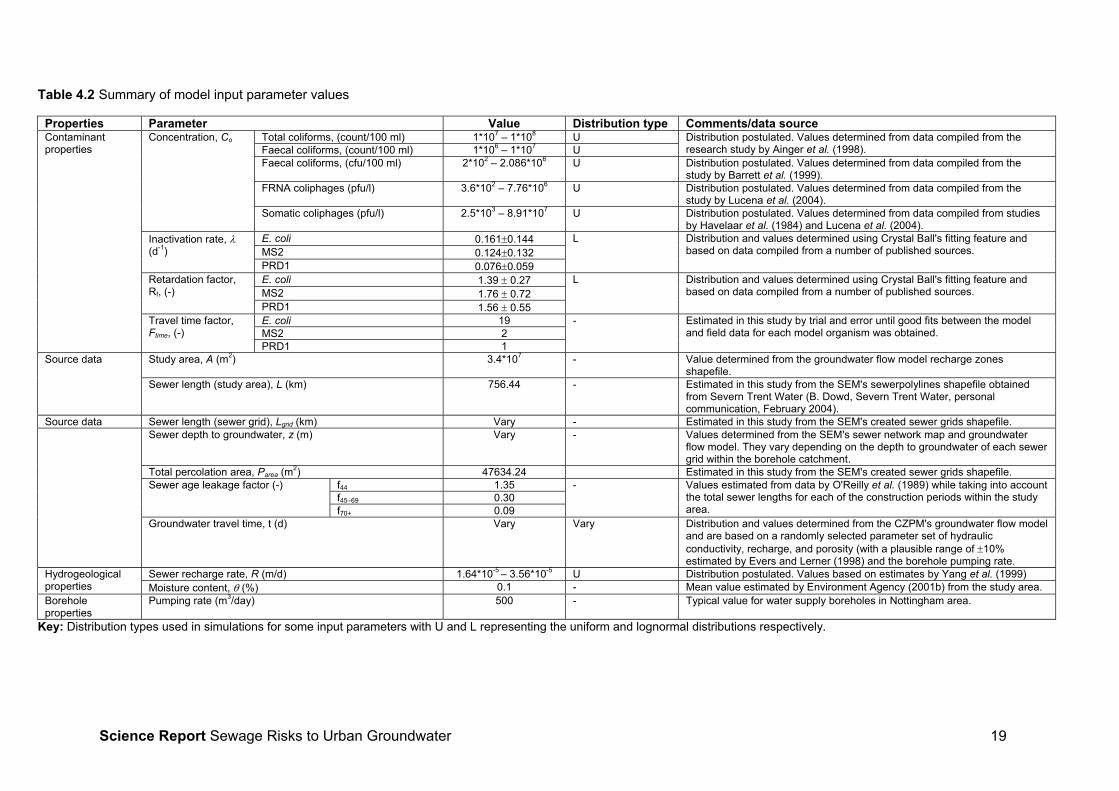
4.2 Simulation In order to run BOS-Micro simulations, representative datasets had to be constructed for the CZPM and SEM. These datasets were in turn used as inputs in the MPRM module procedure to estimate the forecast (concentration of bacterial or viral pathogens in abstracted groundwater) from Sites 1, 2 and 3. The constants for the input parameters needed to run BOS-Micro simulations are listed in Table 4.2 with the data sources.
Science Report Sewage Risks to Urban Groundwater 19
Table 4.2 Summary of model input parameter values
Properties Parameter Value Distribution type Comments/data source Total coliforms, (count/100 ml) 1*107 – 1*108 U Faecal coliforms, (count/100 ml) 1*106 – 1*107 U
Distribution postulated. Values determined from data compiled from the research study by Ainger et al. (1998).
Faecal coliforms, (cfu/100 ml) 2*102 – 2.086*106 U Distribution postulated. Values determined from data compiled from the study by Barrett et al. (1999).
FRNA coliphages (pfu/l) 3.6*102 – 7.76*106 U Distribution postulated. Values determined from data compiled from the study by Lucena et al. (2004).
Concentration, Co
Somatic coliphages (pfu/l) 2.5*103 – 8.91*107 U Distribution postulated. Values determined from data compiled from studies by Havelaar et al. (1984) and Lucena et al. (2004).
E. coli 0.161±0.144 MS2 0.124±0.132
Inactivation rate, λ (d-1)
PRD1 0.076±0.059
L Distribution and values determined using Crystal Ball's fitting feature and based on data compiled from a number of published sources.
E. coli 1.39 ± 0.27 MS2 1.76 ± 0.72
Retardation factor, Rf, (-)
PRD1 1.56 ± 0.55
L Distribution and values determined using Crystal Ball's fitting feature and based on data compiled from a number of published sources.
E. coli 19 MS2 2
Contaminant properties
Travel time factor, Ftime, (-)
PRD1 1
- Estimated in this study by trial and error until good fits between the model and field data for each model organism was obtained.
Study area, A (m2) 3.4*107 - Value determined from the groundwater flow model recharge zones shapefile.
Source data
Sewer length (study area), L (km) 756.44 - Estimated in this study from the SEM's sewerpolylines shapefile obtained from Severn Trent Water (B. Dowd, Severn Trent Water, personal communication, February 2004).
Source data Sewer length (sewer grid), Lgrid (km) Vary - Estimated in this study from the SEM's created sewer grids shapefile. Sewer depth to groundwater, z (m) Vary - Values determined from the SEM's sewer network map and groundwater
flow model. They vary depending on the depth to groundwater of each sewer grid within the borehole catchment.
Total percolation area, Parea (m2) 47634.24 Estimated in this study from the SEM's created sewer grids shapefile. f44 1.35 f45–69 0.30
Sewer age leakage factor (-)
f70+ 0.09
- Values estimated from data by O'Reilly et al. (1989) while taking into account the total sewer lengths for each of the construction periods within the study area.
Groundwater travel time, t (d) Vary Vary Distribution and values determined from the CZPM's groundwater flow model and are based on a randomly selected parameter set of hydraulic conductivity, recharge, and porosity (with a plausible range of ±10% estimated by Evers and Lerner (1998) and the borehole pumping rate.
Sewer recharge rate, R (m/d) 1.64*10-5 – 3.56*10-5 U Distribution postulated. Values based on estimates by Yang et al. (1999) Hydrogeological properties Moisture content, θ (%) 0.1 - Mean value estimated by Environment Agency (2001b) from the study area. Borehole properties
Pumping rate (m3/day) 500 - Typical value for water supply boreholes in Nottingham area.
Key: Distribution types used in simulations for some input parameters with U and L representing the uniform and lognormal distributions respectively.

Science Report Sewage Risks to Urban Groundwater 20
E. coli is the only faecal coliform bacterium that is invariably found in faeces of warm-blooded animals and it can mimic the presence of physiologically similar enteric bacteria (Harvey, 1997; Foppen and Schijven, 2006). Therefore, it has been used as a model organism to examine the fate and transport potential of pathogenic bacteria through the subsurface (Ferguson et al., 1996; Harvey, 1997; Leclerc et al., 2001). This implies that available data on the fate and transport properties of pathogenic bacteria is for E. coli. Therefore, one type of model simulation was run to estimate the forecast (concentration of bacterial pathogens in abstracted groundwater) using the concentration level of faecal coliforms in raw sewage and E. coli fate and transport properties. Since there are many pathogenic viruses, it is difficult to find a model organism that represents more than a few of all the pathogenic viruses (Harvey and Harms, 2002). In addition, they often occur in extremely low numbers and the methods for their detection are costly, tedious, difficult and time-consuming (Leclerc et al., 2000). Therefore, bacteriophages, which are harmless but occur in sewage-polluted environments in greater numbers than enteric viruses and exhibit good survival characteristics as well as a structure, morphology, size and behaviour in the subsurface which closely resemble those of enteric viruses, have been proposed as model organisms of enteric viruses (Grabow et al., 1995; Harvey, 1997; Harvey and Harms, 2002; Skraber et al., 2003). Two groups of bacteriophages, namely somatic and F-pilus (FRNA) coliphages, have been widely used as model organisms to examine the fate and transport potential of pathogenic viruses. Somatic coliphages can infect many gram-negative bacterial species including E. coli and other coliform bacteria. This makes it difficult to ascertain whether an isolate of somatic coliphages arose from faecal or non-faecal sources because there are many non-faecal sources of coliform bacteria (Grabow et al., 1995; Leclerc et al., 2000). On the other hand, FRNA coliphages specifically infect E. coli cells (Ferguson et al., 1996). They have also been found exclusively and occur consistently, in greater numbers than the enteric viruses, in human and animal faeces (Grabow, 2001). Therefore they have been suggested as a more reliable alternative model organism for pathogenic viruses (Havelaar and Hogeboom, 1984; IAWPRC, 1991). Although a number of both somatic and FRNA coliphages were used as tracers in public health studies, recent studies have focused specifically on PRD1 and MS2 (Harvey and Harms, 2002). PRD1, a somatic coliphage, is more persistent at higher temperatures (12 to 23°C) in aqueous and geological media than other bacteriophages (Yahya et al., 1993; Schijven and Hassanizadeh, 2000). It is also structurally and functionally similar to mammalian rotaviruses and adenoviruses (Sinton et al., 1997; Wyn-Jones and Sellwood, 2001). MS2, an FRNA coliphage, has the same diameter and exhibits similar survival rates as enteroviruses (Yates et al., 1985; Wyn-Jones and Sellwood, 2001) and has similar morphology to enteroviruses and Norwalk viruses (Sinton et al., 1997). It has a low inactivation rate at temperatures common in UK groundwaters and shows little or no adsorption (Yates et al., 1985; Bales et al., 1989; Powelson et al., 1990; Yahya et al., 1993; Jin et al., 1997; Schijven et al., 1999). The features of PRD1 and MS2 discussed above make them both to be worst-case model organisms for pathogenic viruses of major concern in groundwater. For instance, PRD1 can be considered as an ideal tracer for predicting fate and transport of rotaviruses and adenoviruses. On the other hand, MS2 can be considered as an ideal tracer for predicting fate and transport of enteroviruses and Norwalk viruses. Therefore, two types of model simulation were run to estimate the forecast (concentration of viral pathogens in abstracted groundwater). In the first simulation the concentration level of somatic coliphages in raw sewage and the properties of PRD1 were utilised while in the second simulation the concentration level of FRNA coliphages in raw sewage and the properties of MS2 were used.

Science Report Sewage Risks to Urban Groundwater 21
4.3 Results and discussion The validation results show that a good match between the model forecasts and field data on the percentage number of positive predictions was obtained which resulted in the same model estimated travel time, presented in Table 4.3, at Sites 1 and 2. The model predicted travel time factors for MS2 and PRD1 are both within the published range (1.2–71) of typical travel time factors (McKay and Cherry, 1993; Sinton et al., 1997; Deborde et al., 1999; Sinton et al., 2000). On the other hand, the model predicted travel time factor for E. coli is only two times above the upper limit of the published range (1.1–9) of typical travel time factors (Champ and Schroeter 1988; Sinton et al., 1997; Deborde et al., 1999). Given all the other uncertainties, it was considered acceptable. Table 4.3 Estimated travel time factors from this study in comparison with the typical published values (taken from Table 3.1) Organism Estimated (this study) Range of published values E. coli 19 1.1–9 MS2 2 1.2–71 PRD1 1 1.2–71 Higher travel time factors were needed in order to obtain a good match between the model and field data at Site 3. In the case of E. coli, it was impossible for the model to match the field data of 100% positive detections even when a very high travel time factor of 99.9 was used. For MS2 and PRD1 the estimated travel time factors were 4 to 6 times higher than the estimated travel time factors obtained for Sites 1 and 2. Such high travel time factors are unlikely to be correct especially given that Site 3 is located on river sand and gravel where fractures are not expected. Therefore, BOS-Micro successfully simulated the fate and transport of pathogens from leaking sewers at Sites 1 and 2 but failed to successfully simulate the fate and transport of pathogens at Site 3. This failure could be attributed to the fact that the data used for validating Site 3 might not have been representative and/or the presence of river sand and gravel above the sandstone aquifer. The estimated travel time factor for all the model organisms used generally agree well with the published values, certainly way below the one to two orders of magnitude that have been considered acceptable for other environmental risk models (e.g. Zhang et al., 2003). Furthermore, since BOS-Micro successfully simulated the fate and transport of pathogens at two out of the three selected sites it may be considered a reasonable model representation of the processes and effects. Therefore, the estimated travel time factor values of 19 for E. coli, 2 for MS2 and 1 for PRD1 were adopted in the assessment of the generic microbiological risks in the sandstone aquifer of Nottingham from leaking sewers. In earlier testing of the model, a unimodal distribution of travel times was used; that is no preferential flow mechanism was included. This approach was not successful and could not reproduce the observed data. A further attempt was made to estimate the inactivation rate by trial and error until good fits between the model and field data for each model tracer was obtained. Inactivation is mostly influenced by temperature (Yates et al., 1988; Schijven and Hassanizadeh, 2000). Therefore, it was hypothesised that the estimated inactivation rate at the three sites for each model tracer ought be similar as the groundwater temperature was the same. Nonetheless, it was not possible to get the same inactivation rate that produced a good fit at all the sites. Instead a range of values was needed and for E. coli unrealistically low values were needed which are below the published range of values (Table 4.4).

Science Report Sewage Risks to Urban Groundwater 22
Table 4.4 Estimated range of inactivation rates from this study in comparison with range values compiled from the reviewed published values Organism Estimated (per day)1 Published (per day)2
E. coli 0.017–0.026 0.058–0.770 MS2 0.020–0.029 0.010–0.435 PRD1 0.030–0.033 0.007–0.120 Note: 1Estimated from this study at the three selected sites
2Compiled from reviewed studies mostly from outside the UK

Science Report Sewage Risks to Urban Groundwater 23
5. Assessment of generic microbiological risks
5.1 Introduction The objective of generic microbiological risk assessment was to use the validated BOS-Micro tool to evaluate the general level of microbiological risk in the sandstone aquifer and, based on these results, interpolate risks to other typical UK aquifers. The approach used was to select some locations within the urban recharge zone of Nottingham as a case study and run simulations. Probabilistic risk tools are valuable for assessing pollution risks to urban groundwater. However, due to the complex interactions of cities with their underlying groundwater and limited data, risk tools have limitations and major assumptions have to be made. The key limitations of BOS-Micro are that it does not yet work for locations with a mixed hydrogeology, such as locations within the sandstone aquifer that is overlaid by river sand and gravel, and is site specific. Therefore, it cannot be applied at locations where the hydrogeology is mixed and it may be unreasonable to use the Nottingham results to interpolate risks to other types of aquifer, other than the sandstone aquifer. Furthermore, BOS-Micro assumes that the hydrogeology and the exfiltration of sewage from sewers are modelled correctly.
5.2 Description of locations and types of forecast used in simulations
Eight locations were selected (Figure 5.1). The criterion for selecting these locations was that all the sites should be completely residential. In addition, because BOS-Micro was assumed not to have successfully simulated the fate and transport of pathogens at Site 3, sites that showed some resemblance with Site 3 in terms of hydrogeology were excluded. The risk assessment involved model simulation runs, as was done in the validation process, and the same constants listed in Table 4.2 were used in all the simulation runs. Two types of forecasts were performed for both bacterial and viral pathogens. Concentration levels of total and faecal coliforms with E. coli properties were used in the forecasts for bacterial pathogens. On the other hand concentration levels of somatic coliphages with PRD1 properties and of FRNA coliphages with MS2 properties were used in the forecasts for viral pathogens.

Science Report Sewage Risks to Urban Groundwater 24
Figure 5.1 Locations used in assessing the generic microbiological risks in the sandstone aquifer of Nottingham from leaking sewers
5.3 Description of alternative receptor targets for the risk assessment
Two types of receptor targets, Non-potable/Pre-treatment and Drinking Water Standard (DWS), were adopted in order to assess the generic risk. The Non-potable/Pre-treatment receptor target was considered to be liberal and was based on the minimum number of infectious pathogenic organisms required to cause infection. To cause infection, more than 1000 enteric bacterial organisms are required (USEPA, 1992). Therefore, it was assumed that locations at which the model predicted >1000 cfu/100 ml of total and/or faecal coliforms have the potential to cause health risks from bacterial pathogens. On the other hand, since bacteriophages are harmless, their predicted concentrations could not be used directly to assess the potential health risks from viral pathogens. Therefore, a relationship between concentration levels of coliphages and enteric viruses was used. In a survey conducted by Grabow et al. (1998), FRNA coliphages were found to outnumber enteric viruses by a factor of 100. Assuming that this relationship is true and that one enteric viral organism is capable of causing infection (Toze, 1999), locations at which the model predicted ≥100 pfu/l of FRNA coliphages were considered to have the potential to cause health risks from viral pathogens. No information was available in the literature on the relationship between enteric viruses and somatic coliphages. Even though this may not be accurate, locations at which the model predicted ≥100 pfu/l of somatic coliphages were considered to have the potential to cause health risks from viral pathogens. The DWS receptor target, considered to be a more stringent criterion, is based on the drinking water quality standards that have been established both at European and National

Science Report Sewage Risks to Urban Groundwater 25
(England and Wales) level. The drinking water quality standards for bacterial indicators are 0 for total coliforms and 0 for E. coli expressed as number per 100 ml (EC, 1998; DWI, 2005). The presence of total coliforms in the absence of other faecal indicators, such as E. coli, does not represent a risk to health (DWI, 2005). This is because it is generally accepted that low numbers of total coliforms may occasionally occur in water supplies because some members of this group have also been frequently found in non-faecally polluted water (Maier et al., 2000; DWI, 2005). Thus, it was assumed that locations at which the model predicted ≥1 cfu/100 ml of total coliforms and in the presence of ≥1 cfu/100 ml faecal coliforms represent a potential risk to health from bacterial pathogens. Although enteric viruses have recently been recognised as pathogens of major threat to human health in groundwater (Environment Agency, 1998; Schijven and Hassanizadeh, 2000), there are no monitoring requirements and drinking water quality standards for viral indicators both at European and national level. The high costs associated with water quality viral tests might explain why there are no drinking water quality standards for viruses. Therefore, the standard values of 0 pfu/l were assumed for both somatic and FRNA coliphages. Since, somatic coliphages can infect both E. coli and all the other coliform bacteria, it can also be assumed, for the same reason as given above for total coliforms, that their presence in the absence of FRNA coliphages does not represent a risk to health. Furthermore, it was again assumed that coliphages outnumber enteric viruses by a factor of 100 (Grabow et al., 1998). Therefore, in the DWS receptor targets for viruses it was assumed that locations at which the model predicted ≥100 pfu/l of somatic coliphages and in the presence of ≥100 pfu/L FRNA coliphages represent a potential risk to health.
5.4 Results The summary in terms of the percentage of positive predictions and the predicted mean values are shown in Table 5.1. Adopting the liberal approach by using the Non-potable/Pre-treatment receptor targets, abstracted water at all locations except one would have a low risk to public health for all the selected microbiological indicators. Even at this one location the high risk relates only to enteric viruses and only when somatic coliphages were used. Since there was no information to indicate a relationship between enteric viruses and somatic coliphages, the content of enteric viruses may not be accurately ascertained. This in turn severely limits how accurately an assessment can be made that abstracted water at the location in question would have a high risk to public health. Table 5.1 Summary of the generic microbiological risks in the sandstone aquifer
Number of locations out of the selected eight locations with concentrations above the:
Pathogen type
Indicator type
Non-potable/Pre-treatment receptor targets
Drinking Water Standarreceptor targets
Mean concentrations (range)1
Total coliforms 0 13 – 279 count /100 mlBacterial Faecal coliforms 0
5 0 – 4 count / 100 ml
Somatic coliphages 1 0 – 278 pfu/l Virus FRNA coliphages 0
2 0 – 21 pfu/l
Note: 1 Model predicted means after 1000 simulations Three sites were above the DWS receptor target for bacterial pathogens and two were above the DWS receptor targets for both bacterial and viral pathogens. Therefore, five out of the eight selected locations would represent a high risk to public health. In addition, there is a higher certainty in the risk estimate for the two sites in which the DWS receptor for both bacterial and viral pathogens were exceeded. Therefore, abstracted water at these two locations may represent a risk to public health, more so, as indicators (total and faecal

Science Report Sewage Risks to Urban Groundwater 26
coliforms for bacterial pathogens and somatic and FRNA coliphages for viral pathogens) were assessed in combination.
5.5 Discussion Risk analysis at the eight selected locations produced interesting results, which generally showed low and high risk at most locations when Non-potable/Pre-treatment and DWS receptor targets were used respectively. Therefore, Non-potable/Pre-treatment receptor targets might be more appropriate for industrial water supply or for non-potable uses while DWS receptor targets would be more appropriate for potable uses. The results have also demonstrated that pathogens exfiltrating from sewers in urban environments might pose a risk to groundwater and abstracted water would not be suitable for potable use without applying disinfection treatment. However, the customary application of precautionary disinfection to all public supplies in the UK (Lerner and Halliday, 1994; Environment Agency, 1998) means that the risk is reduced. Thus, water from most locations might be suitable for potable use without compromising the microbiological quality of water if it is adequately chlorinated. The eight borehole locations that have been analysed were all in residential areas. If the borehole locations were in non-residential areas the risk calculation would certainly be different. This is because generally the density of sewers, particularly foul sewers that carry a higher load of pathogens, would be low. Furthermore, the population density per square kilometre in non-residential areas is low, which in turn implies that the microbiological pollution load is low. On the other hand, rural areas tend to have more private sewerage and indeed more private water supplies. Therefore, the microbiological pollution risks would be expected to change. Also, if the non-residential areas were industrial the risk of chemical contamination would be probably higher. The risk analysis results probably can be applied to other parts of the sandstone aquifer, which have the same kind of superficial geology. However, because BOS-Micro is site specific the results were used only to comment on what the likely risks could be in other major aquifers in the UK. • Permo-Triassic sandstone with significant superficial cover, e.g. boulder clay. Such
superficial cover is expected to protect the aquifer by reducing infiltration amounts and velocities, and risks of microbiological pollution of deep groundwater should be very low.
• Chalk. The dual porosity in the chalk is much more pronounced than in the sandstone because the matrix is much tighter in the chalk and fractures are known to have high porosities. Therefore, the risk would probably be higher in the chalk aquifer. This hypothesis agrees with the findings from two reviews by Lerner and Halliday (1994) and Bishop et al. (1998) that showed that more pollution incidents have occurred in the chalk aquifer.
Since the age of sewers is an important factor in sewer deterioration, the long-term risks would be expected to increase as sewers increase in age but reduce as sewers get restored/repaired. Historically, because of budgetary constraints, maintenance of the sewer systems in the UK has been based on the concept of 'critical' sewers. Critical sewers, which make up around 25% of the total length, are those sewers for which the consequences of failure in capital terms are greatest (Davies et al., 2001). The critical sewers are subject to a proactive rehabilitation programme while the remaining 75% are maintained only on a reactive basis. The activity levels in the period 1991 to 1998 showed a repair or replacement frequency, based on length, of once every 1300 years, and so sewers are continuously increasing in age (OFWAT, 2000). Therefore, with the current

Science Report Sewage Risks to Urban Groundwater 27
replacement/renewal levels, the long-term risks to groundwater from sewers of all ages are expected to increase.

Science Report Sewage Risks to Urban Groundwater 28
6. Conclusion A GIS-based risk analysis tool called BOS-Micro has been created that combines three models: CZPM, SEM and MPRM. The risk analysis done using BOS-Micro has demonstrated its applicability as a tool for analysing microbiological risks from leaking sewers in urban environments. The use of such tools involves uncertainty at all stages, from estimating the catchment zone through to accurately estimating the sewage loading to the aquifer and predicting the pumped microbiological concentrations. Therefore, evidence of the validity of risk tools is essential if they are to become useful in the sustainable management of urban groundwater. Validation of BOS-Micro was achieved by comparing model predictions with field data at three sites. BOS-Micro successfully simulated the fate and transport of pathogenic bacteria and viruses from leaking sewers to a pumped borehole as a receptor at two (Sites 1 and 2) out of the three selected sites. The validation results suggest preferential flow via fractures is the most important mechanism responsible for migration of pathogens in the sandstone aquifer. Although only a small proportion of the pathogens travel by this mechanism, they are enough to create significant risks. A major result of the study is that it enabled, for the first time, the observed occurrence of microbiological contaminants under Nottingham to be modelled. We estimated travel time multipliers of 1–2 for viral indicators and 18 for the bacterial indicator in the 1% of the pathogen load that travels faster than average groundwater velocity. BOS-Micro was used to assess the generic microbiological risks to groundwater from leaking sewers in the sandstone aquifer underlying Nottingham city, in situations where there was no superficial cover. The risk analysis showed that at most of the sites the risk was low if Non-potable/Pre-treatment receptor targets were adopted, but high if DWS receptor targets were used. However, with the current replacement/renewal levels of once every 1300 years the long-term risks to groundwater from sewers of all ages should be expected to increase.

Science Report Sewage Risks to Urban Groundwater 29
7. Recommendations The study has highlighted the potential for sewers to contaminate groundwater and hence the authors recommend: • There is need to take into account rapid transport pathways in the approaches used
in the protection and management of urban aquifers. Therefore, the determination of the natural attenuation of pathogens within wellhead protection areas should be defined by both average groundwater velocities and rapid groundwater velocities transporting pathogens via preferential flow.
• Since some pathogenic viruses may have a greater infectivity and potential to rapidly travel through smaller physical apertures compared to pathogenic bacteria, there is need for the assessment of water quality to include viral indicators as well.
• Nearly all the published values that were used in this study to estimate the model input values of inactivation rate and retardation factor for the three model organisms relate to sand–gravel aquifer systems and nearly all (99%) are from outside the UK. Therefore, more studies need to be undertaken to provide information on the fate and transport of pathogens that are relevant and applicable to UK aquifers.
• There is need for environmental standards to be set that would encourage water companies to directly address the issue of sewer exfiltration.

Science Report Sewage Risks to Urban Groundwater 30
References Ainger, C. M., Armstrong, R. J., Butler, D., 1998. Dry Weather Flow in Sewers. CIRIA.
CIRIA Report. 177. Bales, R. C., Gerba, C. P., Grondin, G. H., Jensen, S. L., 1989. Bacteriophage transport in
sandy soil and fractured tuff. Applied and Environmental Microbiology, 55(8), 2061–2067.
Barrett, M. H., Hiscock, K. M., Pedley, S., Lerner, D. N., Tellam, J. H., French, M. J., 1999. Marker species for identifying urban groundwater recharge sources: a review and case study in Nottingham, UK. Water Research, 33(14), 3083–3097.
Begueria, S., 2006. Validation and evaluation of predictive models in hazard assessment and risk management. Natural Hazards, 37(3), 315–329.
Bishop, P. K., Misstear, B. D., White, M., Harding, N. J., 1998. Impacts of sewers on groundwater quality. Journal of Chartered Institution of Water & Environmental Management, 12, 216–223.
Blackwood, D. J., Cavill, S., Hendry, S., Marr, I., 2001. The Incidence and Impact of Exfiltration from Sewers. UK Water Industry Research Ltd.
Blackwood, D. J., Ellis, J. B., Revitt, D. M., Gilmour, D. J., 2005. Factors influencing exfiltration processes in sewers. Water Science and Technology, 51(2), 147–154.
Champ, D. R., Schroeter, J., 1988. Bacterial transport in fractured rock – a field scale tracer test at the Chalk River nuclear laboratories. Water Science and Technology, 20, 81–87.
Chisala, B. N., Tait, N. G., Lerner, D. N., 2006. Evaluating the risks of methyl tertiary butyl ether (MTBE) pollution of urban groundwater. Journal of Contaminant Hydrology, 91(1–2), 128–145.
Cronin, A. A., Taylor, R. G., Powell, K. L., Barrett, M. H., Trowsdale, S. A., Lerner, D. N., 2003. Temporal trends in the hydrochemistry and sewage-related microbiology of urban sandstone aquifer – Nottingham, United Kingdom. Hydrogeology Journal, 11(2), 205–216.
Davies, J. P., Clarke, B. A., Whiter, J. T., Cunningham, R. J., Leidi, A., 2001. The structural condition of rigid sewer pipes: a statistical investigation. Urban Water, 3, 277–286.
Davison, R. M., Prabnarong, P., Whittaker, J. J., Lerner, D. N., 2002. A probabilistic management system to optimise the use of urban groundwater. In: Hiscock, K. M., Rivett, M. O., Davison, R. M. (eds), Sustainable Groundwater Development. Geological Society, London, pp. 265–276.
Deborde, D. C., Woessner, W. W., Kiley, Q. T., Ball, P., 1999. Rapid transport of viruses in a floodplain aquifer. Water Research, 33(10), 2229–2238.
DWI, 2005. Guidance on the Water Supply (Water Quality) Regulations 2000 (England) and Water Supply (Water Quality) Regulations 2001 (Wales). Drinking Water Inspectorate.
EC, 1998. European Drinking Water Directive 98/83/EC. European Commission. Environment Agency, 1998. A Review of the Impact of Microbiological Contaminants in
Groundwater. Environment Agency, UK. R&D Technical Report. P139. Environment Agency, 2001a. Guide to Good Practice for the Development of Conceptual
Models and the Selection and Application of Mathematical Models of Contaminant Transport Processes in the Subsurface. Environment Agency, UK. NGCLC Report NC/99/38/2.
Environment Agency, 2001b. The Impact of Cities on the Quantity and Quality of Their Underlying Groundwater; incorporating: The importance of non-agricultural sources of nitrate in UK. Environment Agency, UK. Technical Report TR P185.
Evers, S., Lerner, D. N., 1998. How certain is our estimate of a wellhead protection zone? Ground Water, 36(1), 49–57.

Science Report Sewage Risks to Urban Groundwater 31
Fenner, A. R., Sweeting, L., 1999. A decision support model for the rehabilitation of 'non-critical' sewers. Water Science and Technology, 39(9), 193–200.
Ferguson, C. M., Coote, B. G., Asbolt, N. J., Stevenson, I. M., 1996. Relationship between indicators, pathogens and water quality in an estuarine system. Water Research, 30(9), 2045–2054.
Foppen, J. W. A., Schijven, J. F., 2006. Evaluation of data from literature on the transport and survival of Escherichia coli and thermotolerant coliforms in aquifers under saturated conditions. Water Research, 40(3), 401–426.
Frey, H. C., Patil, S. R., 2002. Identification and review of sensitivity analysis methods. Risk Analysis, 22(3), 553–578.
Gebbet, S., 1996. Groundwater flow in Nottingham Triassic Sandstone Aquifer (A Groundwater Flow Model Using MODFLOW). Unpublished MSc thesis. University of Birmingham.
Grabow, W. O. K., 2001. Bacteriophages: update on application as models for viruses in water. Water SA, 27(2), 251–268.
Grabow, W. O. K., Naubrech, T. E., Holtzhausen, C. S., Jofre, J., 1995. Bacterial fragilis and Escherichia coli bacteriophages: excretion by humans and animals. Water Science and Technology, 31(5–6), 223–230.
Grabow, W. O. K., Vrey, A., Uys, M., De Villiers, J. C., 1998. Evaluation of the Application of Bacteriophages as Indicators of Water Quality. Water Research Commission. WRC Report 540/1/98.
Harvey, R. W., 1997. Microorganisms as tracers in groundwater injection and recovery experiments: a review. FEMS Microbiology Reviews, 20, 461–472.
Harvey, R. W., Harms, H., 2002. Tracers in groundwater: use of microorganisms and microspheres. In: Bitton, G. (ed), Encyclopaedia of Environmental Microbiology. John Wiley & Sons Inc, New York, pp. 3194–3202.
Havelaar, A. H., Hogeboom, W. M., 1984. A method for the enumeration of male-specific bacteriophages in sewage. Journal of Applied Bacteriology, 56(3), 439–447.
Havelaar, A. H., Van Olphen, M., Drost, Y. C., 1993. F-specific RNA bacteriophages are adequate model organisms for enteric viruses in fresh water. Applied and Environmental Microbiology, 59(9), 2956–2962.
Hertz, D., Thomas, H., 1983. Risk Analysis and Its Application. John Wiley & Sons, New York.
IAWPRC, 1991. Bacteriophages as model viruses in water quality control. Water Research, 25(5), 529–545.
Jagals, P., Grabow, W. O. K., Riesel, M., Jagals, C., 2000. Evaluation of selected membrane filtration and most probable number methods for the enumeration of faecal coliforms, Escherichia coli and enterococce in environmental waters. Quantitative Microbiology, 2(2), 129–140.
Jin, Y., Yates, M. V., Thompson, S. S., Jury, W. A., 1997. Sorption of viruses during flow through saturated sand columns. Environmental Science and Technology, 31(2), 548–555.
Kakko, P., Lansipuro, H., Kujansuu, E., Lancia, A., Gambirasio, A., Ziomas, I. C., Melas, D., Foster, P. M., 1996. CRAMD – A database for the validation of models used in chemical risk assessment. Journal of Loss Prevention in the Process Industries, 9(6), 401–411.
Leclerc, H., Edberg, S., Pierzo, V., Delattre, J. M., 2000. Bacteriophages as indicators of enteric viruses and public health risk in groundwaters. Journal of Applied Microbiology, 88, 5–21.
Leclerc, H., Mossel, D. A. A., Edberg, S. C., Strijik, C. B., 2001. Advances in the bacteriology of the coliform group: their suitability as markers of microbial water safety. Annual Review of Microbiology, 55, 201–234.
Lerner, D. N., Barrett, M. H., 1996. Urban groundwater issues in the United Kingdom. Hydrogeology Journal, 4(1), 80–89.

Science Report Sewage Risks to Urban Groundwater 32
Lerner, D. N., Cronin, A. A., 2004. Mature industrial cities. In: Lerner, D. N. (ed). Urban Groundwater Pollution. A. A. Balkema, Lisse, Netherlands. IAH Publication 24, 109–130.
Lerner, D. N., Halliday, D., 1994. The impact of sewers on groundwater quality. In: Wilkinson, W. B. (ed), Groundwater Problems in Urban Areas. Thomas Telford Ltd, London, pp. 64–75.
Lerner, D. N., Thornton, S. F., Davison, R. M., 2000. The use of monitored natural attenuation as a cost-effective technique for groundwater restoration. In: Sililo, O. (ed), Groundwater: Past Achievements and Future Challenges, Pub Balkema, Rotterdam. pp. 41–47.
Lerner, D. N., Davison, R. M., Tait, N., 2004. Assessing the potential value of urban groundwater. In: Webb, B., Acreman, M., Maksimovic, C., Smithers, H., Kirby, C. (eds), Hydrology: Science and Practice for the 21st Century. Proceedings of the International Conference, Volume II, pp. 293–297.
Lester, J., Farrar, D. M., 1979. An Examination of the Defects Observed in Six Kilometres of Sewers. Transport and Road Research Laboratory. Supplementary Report 531.
Lucena, F., Duran, A. E., Moron, A., Calderon, E., Campos, C., Gantzer, C., Skraber, S., Jofre, J., 2004. Reduction of bacterial indicators and bacteriophages infecting faecal bacteria in primary and secondary wastewater. Journal of Applied Microbiology, 97, 1069–1976.
Maier, R. M., Pepper, I. L., Gerba, C. P., 2000. Environmental Microbiology. Academic Press, San Diego.
McKay, L., Cherry, J. A., Bales, R. C., Yahya, M. T., Gerba, C. P., 1993. A field example of bacteriophage as tracers of fracture flow. Environmental Science and Technology, 27, 1075–1079.
Morris, B. L., Darling, W. G., Cronin, A. A., Rueedi, J., Whitehead, E. J., Gooddy, D. C., 2006. Assessing the impact of modern recharge on a sandstone aquifer beneath a suburb of Doncaster, UK. Hydrogeology Journal, 14, 979–997.
OFWAT, 2000. Serviceability of the Water Mains and Sewer Networks in England and Wales. OFWAT Information Note 35A.
O'Reilly, M. P., Rosbrook, R. B., Cox, G. C., McCloskey, A., 1989. Analysis of Defects in 180km of Pipe Sewers in Southern Water Authority. Transport and Road Research Laboratory. Research Report 172.
Pieper, A. P., Ryan, J. N., Harvey, R. W., Amy, G. L., Illangasekare, T. H., Mtege, D. W., 1997. Transport and recovery of bacteriophage PRD1 in a sand and gravel aquifer: effect of sewage-derived organic matter. Environmental Science and Technology, 31(4), 1163–1170.
Pollock, D. W., 1989. Documentation of Computer Programs to Compute and Display Pathlines Using Results from US Geological Survey Modular Three-Dimensional Finite-Difference Groundwater Flow Model. US Geological Survey.
Powell, K. L., Taylor, R. G., Cronin, A. A., Barrett, M. H., Pedley, S., Sellwood, J., Trowsdale, S. A., Lerner, D. N., 2003. Microbial contamination of two urban sandstone aquifers in the UK. Water Research, 37(2), 339–352.
Powelson, D. K., Simpson, J. R., Gerba, C. P., 1990. Virus transport and survival in saturated and unsaturated flow through soil columns. Journal of Environmental Quality, 19(3), 396–401.
Prince, M., Atkinson, T. C., Barker, J. A., Wheeler, D., Monkhouse, R. A., 1992. A tracer study of the danger posed to a chalk aquifer by contaminated highway run-off. Proceedings of the Institution of Civil Engineers Water & Maritime Engineering, 96, 9–18.
Rushton, K. R., Bishop, T. J., 1993. Water Resource Study of Nottinghamshire Sherwood Sandstone Aquifer System of Eastern England: Mathematical Model of the Sherwood Sandstone Aquifer. University of Birmingham, Unpublished final report prepared for National Rivers Authority.

Science Report Sewage Risks to Urban Groundwater 33
Schijven, J. F., Hassanizadeh, S. M., 2000. Removal of viruses by soil passage: overview of modelling, processes and parameters. Critical Reviews in Environmental Science and Technology, 30(1), 49–127.
Schijven, J. F., Hoogenboezem, W., Hassanizadeh, S. M., Peters, J. H., 1999. Modelling removal of bacteriophages MS2 and PRD1 by dune infiltration at Castricum, the Netherlands. Water Resources Research, 35(4), 1101–1111.
Skraber, S., Gassilloud, B. and Gantzer, C. (2003). Comparison of Coliforms and Coliphages as Tools for Assessment of Viral Contamination in River Water. Applied and Environmental Microbiology, June 2004, p. 3644-3649, Vol. 70, No. 6
Sinton, L. W., Finlay, R. K., Pang, L., Scott, D. M., 1997. Transport of bacteria and bacteriophages in irrigated effluent and through an alluvial gravel aquifer. Water, Air and Soil Pollution, 98(1), 17–42.
Sinton, L. W., Noona., M. J., Finlay, R. K., Pang, L., Close, M. E., 2000. Transport and attenuation of bacteria and bacteriophages in an alluvial gravel aquifer. NZ J. Marine Freshwater Research, 34(29), 251–259.
Tait, N. G., Davison, R. M., Whittaker, J. J., Lerner, D. N., 2004. Borehole Optimisation System (BOS) – A GIS based risk analysis tool for optimising the use of urban groundwater. Environmental Modelling & Software, 19(12), 1111–1124.
Tait, N. G., Davison, R. M., Leharne, S. A. and Lerner, D. N., 2007. Borehole Optimisation System (BOS) – Assessing the potential value of urban groundwater in Nottingham. Environmental Modelling and Software, in press.
Taylor, R., Cronin, A., Pedley, S., Barker, J., Atkinson, T., 2004. The implications of groundwater velocity variations on microbial transport and wellhead protection – review of field evidence. FEMS Microbiology Ecology, 49, 17–26.
Toze, S., 1999. PCR and the detection of microbial pathogens in water and wastewater. Water Research, 33(17), 3545–3556.
USEPA, 1992. Guidelines for Water Reuse. United States Environmental Protection Agency.
WHO, 2000. Global Water Supply and Sanitation Assessment 2000 Report. World Health Organisation, Switzerland.
Woessner, W. W., Ball, P. N., Deborde, D. C., Troy, T. L., 2001. Virus transport in a sand and gravel aquifer under field pumping conditions. Ground Water, 39(6), 886–894.
Wyn-Jones, A. P., Sellwood, J., 2001. Enteric viruses in the aquatic environment. Journal of Applied Microbiology, 91(6), 945–962.
Yahya, M. T., Galsomies, L., Gerba, C. P., Bales, R. C., 1993. Survival of bacteriophages MS-2 and PRD-1 in groundwater. Water Science and Technology, 27(3–4), 409–412.
Yang, Y., Lerner, D. N., Barrett, H. M., Tellam, J. H., 1999. Quantification of groundwater recharge in the city of Nottingham, UK. Environmental Geology, 38(3), 183–198.
Yates, M. V., Gerba, C. P., Kelley, L. M., 1985. Virus persistence in groundwater. Applied and Environmental Microbiology, 49(4), 778–781.

Science Report Sewage Risks to Urban Groundwater 34
Glossary Adsorption Process by which micro-organisms are removed from bulk solution by
reversible and irreversible adhesion to the rock surfaces
Advection Movement of bulk flowing groundwater and its dissolved and suspended particles
Bacteria Single-celled organisms with sizes ranging from 0.2 to 10 µm
Bacteriophage A virus like micro-organism that infects only bacterial hosts.
Bimodal flow mechanisms
Process of modelling the flow of groundwater that takes into account both matrix and preferential flow transport mechanisms
Conceptual model
Simplification of reality that aims to identify the key processes that control and affect pollutant fate and transport
Coliphages Group of viruses that infect coliform bacteria host cells
E. coli Escherichia coli. Member of the faecal coliform bacteria considered to be specifically of faecal origin
Faecal coliforms Subset of the total coliform bacteria that ferment lactose at 45°C
FRNA coliphages Group of coliphages that specifically infect E. coli cells
Inactivation Process by which micro-organisms lose their infectious capacity
Mathematical model
Mathematical expression of the key processes that control the pollutant fate and transport
Matrix flow Relatively slow and even movement of water and solutes through the porous media
MODFLOW Well-respected and most widely used 3D groundwater flow modelling tool
MODPATH 3D particle-tracking model that computes the path a particle takes in a steady state or transient flow field over a given period of time
OFWAT Authority that regulates the water and sewerage industry in England and Wales
Pathogen Disease-causing micro-organisms
Preferential flow Uneven and often rapid movement of water and solutes through porous media
Sewage Water-borne wastes of a community collected in and discharged by sewers
Somatic coliphages
Group of coliphages that can infect all the total coliform bacterial cells
Total coliforms Group of gram-negative bacteria that ferment lactose at 35°C usually free-living in the environment, but are also normally present in water contaminated with faeces of warm-blooded animals
Validation Process of evaluating and testing the model for the purpose of refining, enhancing and building confidence in the model predictions
Virus Small, intracellular organisms with sizes ranging from 0.02 to 0.2 µm

Science Report Sewage Risks to Urban Groundwater 35
Abbreviations BOS Borehole Optimisation System cfu coliform forming units CZPM Catchment Zone Probability Model DWI Drinking Water Inspectorate DWS Drinking Water Standard EC European Commission GIS Geographical Information System MPRM Microbial Pollution Risk Model PDF Probability Density Function pfu particle forming units SEM Sewer Exfiltration Model USEPA United States Environmental Protection Agency WHO World Health Organisation

We are The Environment Agency. It's our job to look after your environment and make it a better place – for you, and for future generations.
Your environment is the air you breathe, the water you drink and the ground you walk on. Working with business, Government and society as a whole, we are making your environment cleaner and healthier.
The Environment Agency. Out there, making your environment a better place.
Published by: Environment Agency Rio House Waterside Drive, Aztec West Almondsbury, Bristol BS32 4UD Tel: 0870 8506506 Email: [email protected] www.environment-agency.gov.uk © Environment Agency All rights reserved. This document may be reproduced with prior permission of the Environment Agency.