science? ob=MImg& imagekey=B6TVP-4XVC4M5-1-1& cdi=5540...
87
Accepted Manuscript Cosmic-ray-driven electron-induced reactions of halogenated molecules adsorbed on ice surfaces: Implications for atmospheric ozone depletion Qing-Bin Lu PII: S0370-1573(09)00286-5 DOI: 10.1016/j.physrep.2009.12.002 Reference: PLREP 1608 To appear in: Physics Reports Accepted date: 26 November 2009 Please cite this article as: Q.-B. Lu, Cosmic-ray-driven electron-induced reactions of halogenated molecules adsorbed on ice surfaces: Implications for atmospheric ozone depletion, Physics Reports (2009), doi:10.1016/j.physrep.2009.12.002 This is a PDF file of an unedited manuscript that has been accepted for publication. As a service to our customers we are providing this early version of the manuscript. The manuscript will undergo copyediting, typesetting, and review of the resulting proof before it is published in its final form. Please note that during the production process errors may be discovered which could affect the content, and all legal disclaimers that apply to the journal pertain.
-
Upload
phungkhanh -
Category
Documents
-
view
214 -
download
0
Transcript of science? ob=MImg& imagekey=B6TVP-4XVC4M5-1-1& cdi=5540...

Accepted Manuscript
Cosmic-ray-driven electron-induced reactions of halogenated
molecules adsorbed on ice surfaces: Implications for atmospheric
ozone depletion
Qing-Bin Lu
PII: S0370-1573(09)00286-5
DOI: 10.1016/j.physrep.2009.12.002
Reference: PLREP 1608
To appear in: Physics Reports
Accepted date: 26 November 2009
Please cite this article as: Q.-B. Lu, Cosmic-ray-driven electron-induced reactions of
halogenated molecules adsorbed on ice surfaces: Implications for atmospheric ozone
depletion, Physics Reports (2009), doi:10.1016/j.physrep.2009.12.002
This is a PDF file of an unedited manuscript that has been accepted for publication. As a
service to our customers we are providing this early version of the manuscript. The manuscript
will undergo copyediting, typesetting, and review of the resulting proof before it is published in
its final form. Please note that during the production process errors may be discovered which
could affect the content, and all legal disclaimers that apply to the journal pertain.

AC
CE
PTE
DM
AN
US
CR
IPT
ACCEPTED MANUSCRIPT
– 1 –
Cosmic-Ray-Driven Electron-Induced Reactions of Halogenated Molecules
Adsorbed on Ice Surfaces: Implications for Atmospheric Ozone Depletion
Qing-Bin Lu*
Department of Physics and Astronomy and Departments of Biology and Chemistry, University
of Waterloo, Waterloo, ON, N2L 3G1, Canada
Abstract: The cosmic-ray driven electron-induced reaction of halogenated molecules
adsorbed on ice surfaces has been proposed as a new mechanism for the formation of the
polar ozone hole. Here, experimental findings of dissociative electron transfer reactions of
halogenated molecules on ice surfaces in electron-stimulated desorption, electron trapping
and femtosecond time-resolved laser spectroscopic measurements are reviewed. It is
followed by a review of the evidence from recent satellite observations of this new
mechanism for the Antarctic ozone hole, and all other possible physical mechanisms are
discussed. Moreover, new observations of the 11-year cyclic variations of both polar ozone
loss and stratospheric cooling and the seasonal variations of CFCs and CH4 in the polar
stratosphere are presented, and quantitative predictions of the Antarctic ozone hole in the
future are given. Finally, new observation of the effects of CFCs and cosmic-ray driven
ozone depletion on global climate change is also presented and discussed.
Keywords: cosmic rays (CRs), dissociative electron transfer (DET), chlorofluorocarbons
(CFCs), ice surfaces, ozone hole, climate change
PACS: 94.20.Wq, 82.30.Fi, 82.30.Lp, 34.80.Ht, 92.60.hd. 92.60.Ry
* E-mail: [email protected]

AC
CE
PTE
DM
AN
US
CR
IPT
ACCEPTED MANUSCRIPT
– 2 –
Contents
I. INTRODUCTION 3
II. COSMIC-RAY-DRIVEN ELECTRON REACTION MODEL VS PHOTOCHEMICAL
MODEL FOR OZONE DEPLETION 6A. Photochemical model 6 B. Cosmic-ray driven electron reaction (CRE) model 8 C. More justification of the cosmic-ray driven electron reaction model 10
III.LABORATORY FINDINGS OF DISSOCIATIVE ELECTRON TRANSFER
REACTIONS OF HALOGENATED MOLECULES ON ICE 11A. Electron-stimulated desorption measurements 11 B. Electron trapping measurements 19 C. Femtosecond time-resolved laser spectroscopic measurements 23 D. Other measurements 25
IV. SATELLITE OBSERVATIONS OF THE COSMIC-RAY DRIVEN ELECTRON
REACTION (CRE) MECHANISM 29A. Spatial correlation between cosmic rays and ozone depletion 29 B. Time correlation between cosmic rays and ozone depletion 29 C. Direct solar-cycle effect and cosmic-ray effect 31 D. Cosmic rays, PSCs and polar stratospheric temperature 32
V. NEW OBSERVATIONS 33A. Comparison of observed data with photochemical models 34 B. Confirmation of the 11-year cyclic polar ozone loss 35 C. Observation of 11-year cyclic polar stratospheric cooling 36 D. Seasonal variations of CFCs, N2O and CH4 37
VI. TOWARDS QUANTITATIVE UNDERSTANDING OF OZONE DEPLETION 39
VII. FUTURE TREND OF THE OZONE HOLE 40
VIII. EFFECTS OF CFCS AND CRE-DRIVEN OZONE DEPLETION ON GLOBAL
CLIMATE CHANGE 42
IX. CONCLUSIONS 45
Acknowledgments 49
References 49
Figures 58
I. INTRODUCTION

AC
CE
PTE
DM
AN
US
CR
IPT
ACCEPTED MANUSCRIPT
– 3 –
Electron-transfer reactions play an important role in many processes in physical, chemical and
biological systems [1-4] and planetary atmospheres [5-7]. Among electron-transfer reactions,
dissociative electron transfer (DET) of molecules is one of the most important processes.
Indeed, DET is a fundamental process involved in many areas of physics, chemistry, biology,
environment and biomedicine, e.g., in atomic collisions with molecules [8], surface
photochemistry [9, 10], atmospheric ozone depletion [11-17], electronic materials [18],
femtochemistry and femtobiology [19-23], activation of anticancer drugs [21-23], and molecular
pathways leading to DNA damage and cell death in the cellular (aqueous) environment [24].
In interactions of electrons with molecules, a well-known process is dissociative electron
attachment (DEA). DET is similar to DEA, but there are some important differences. DEA
occurs when a low-energy (0-20 eV) free, unbound electron resonantly attaches to a molecule to
form a transient anion state, which then dissociates into a neutral and an anionic fragment: e +
AB AB* A + B . The physical process of DEA has been comprehensively reviewed by
Schultz [25], Sanche [26] and Chutjian et al. [6], respectively. In contrast, DET occurs by rapid
electron transfer of a weakly-bound electron localized at an atom/molecule or in a polar medium
to a foreign molecule, forming a transient anion that then dissociates. For those molecules
having strong DEA resonances with free electrons at near zero eV in the gas phase, DET
reactions can effectively occur when these molecules are adsorbed on metal surfaces [9, 10],
polar ice surfaces [11-17] and in polar liquids [21-24, 27-29]. This is because the potential
energy curve of AB* is lowered by the polarization potential Ep of 1 2 eV to lie below that of
the neutral AB in the Franck-Condon (electron-transition) region. This review will focus on
experimental studies of DET reactions of halogenated molecules adsorbed on polar ice surfaces
or in polar liquids. Taking CF2Cl2 adsorbed on the H2O ice surface (Ep 1.3 eV [30]) as an

AC
CE
PTE
DM
AN
US
CR
IPT
ACCEPTED MANUSCRIPT
– 4 –
example, the DEA and DET processes are illustrated in Fig. 1. In contrast to the DEA process,
the lifetime of a weakly-bound trapped electron in polar media is orders of magnitudes longer
than that of a free electron in the gas phase or a quasi-free electron in nonpolar media and the
autodetachment of the AB* transient state once formed cannot occur in DET. These properties
can greatly enhance the capture probability of the electron and the dissociation probability of the
molecule in a DET reaction, as discussed recently [24, 29].
There is a long history of studying electron-induced reactions of halogenated molecules
including chlorofluorocarbons (CFCs, the major ozone-depleting molecules), starting from gas-
phase studies [31]. In particular, Illenberger et al. [32] first found in 1978-1979 that DEA of
CFC molecules to low-energy free electrons near zero eV is an extremely efficient process, e.g.,
.*)0(~ 22222 ClCFClClCFClCFeVe (1)
The above DEA reactions of CFCs are exothermic. The measured DEA cross section of gaseous
CF2Cl2 (Eq. (1)) at near 0eV is ~1x10 16 cm2, which is four orders of magnitude higher than the
photodissociation cross section [32]. Immediately, Peyerimhoff and co-workers [33, 34] made
the first theoretical studies of the DEAs of CFCs and pointed out that this process must be
considered as a mechanism for the destruction of CFCs and the ozone layer in the stratosphere.
In the stratosphere below 60 km, the major source producing electrons is the atmospheric
ionization by cosmic rays (CRs) [35, 36], which consist mainly of protons (90%) and alpha-
particles (9%) originated from deep space. Entering the atmosphere, the ionization of molecules
by CRs generates an enormous number of low energy secondary electrons. However, the
detected density of free electrons is very low, as most of the free electrons produced by CRs are

AC
CE
PTE
DM
AN
US
CR
IPT
ACCEPTED MANUSCRIPT
– 5 –
rapidly captured by stratospheric molecules (mainly O2) to produce negative ions (O2 ). Since
the electron transfer from O2 to CFCs is ineffective, the DEA/DET process was thought to be an
insignificant sink for CFCs in the general atmosphere [35, 36]. Although it was generally agreed
that this understanding of negative-ion chemistry in the stratosphere was rather speculative [35,
36], the DET process has been excluded in current atmospheric chemistry models [37]. As will
be reviewed below, however, a neglect of electron-induced reactions of halogenated molecules
as an efficient process for the destruction of the ozone layer may be premature.
Correct understanding of how ozone holes are formed and how that relates to climate change
is without doubt of great significance. The data from satellite, ground-based and balloon
measurements have confirmed that anthropogenic emissions of CFCs and
hydrochlorofluorocarbons (HCFCs) are related to stratospheric ozone loss, and the Montreal
Protocol has successfully phased out the production and consumption of these chemicals.
However, it is still required to obtain both correct and complete ozone depletion theory and
precise atmospheric measurements in order to put the Protocol on a firmer scientific ground [38,
39]. This review is organized as the following structure. The photochemical model for the
ozone hole, the cosmic-ray-driven electron-induced reaction mechanism (denoted as the “CRE”
model hereafter) and the more recent justification of the CRE mechanism are briefly reviewed in
Section II. It is followed by a review of laboratory findings of electron-induced reactions of
CFCs, HCFCs and other halogenated molecules adsorbed on polar ice surfaces or in polar liquids
in Section III. Section IV gives a review of the evidence from satellite data of the CRE model
for Antarctic ozone depletion, and all possible physical mechanisms rather than the CRE model
are discussed. New observations of the 11-year cyclic variations of both polar O3 loss and
stratospheric cooling, as well as the seasonal variations of CFCs and so-called trace gases (N2O

AC
CE
PTE
DM
AN
US
CR
IPT
ACCEPTED MANUSCRIPT
– 6 –
and CH4) in the polar stratosphere, are presented in Section V. Then, quantitative analyses of the
available O3 data from satellite and ground-based measurements in the Antarctic stratosphere in
1956-2008 are presented in Section VI. It follows by Section VII to give quantitative predictions
of the Antarctic O3 hole in 2009~2010 and its future trend towards the 21st century. Finally,
new observation of the co-effects of CFCs and CR-driven ozone loss on global climate change is
presented in Section VIII, ending with the conclusions in IX.
II. COSMIC-RAY-DRIVEN-ELECTRON-REACTION MODEL VS PHOTOCHEMICAL
MODEL FOR OZONE DEPLETION
A. Photochemical Model for Ozone Depletion
In 1974, Molina and Rowland [40] first proposed that chlorine atoms are produced by sunlight
photolysis of CFCs in the tropical upper stratosphere at ~40 km:
.222 ClCFClhClCF (2)
The resultant Cl atom then destroys ozone via the (Cl, ClO) reaction chain, similar to the
destruction of O3 via the (NO, NO2) reaction chain first proposed by Crutzen in 1971 [41].
However, the ozone hole has been observed in the lower stratosphere at ~18 km over the Poles in
each spring since the first discovery of the Antarctic ozone hole in 1985 [42]. A mixed
mechanism was subsequently proposed, which is composed of three major processes (see, e.g.,
refs. 43 and 44): (1) the photolysis of CFCs produces Cl and ClO that react with other
atmospheric molecules (CH4 and NO2) to generate inorganic chlorine species, HCl and ClONO2,

AC
CE
PTE
DM
AN
US
CR
IPT
ACCEPTED MANUSCRIPT
– 7 –
in the tropical upper stratosphere at the altitudes of ~40 km; (2) HCl and ClONO2 were then
transported to the lower polar stratosphere via air circulation; and (3) heterogeneous chemical
reactions of these inorganic compounds on ice surfaces occur in the lower polar stratosphere
(15-20 km) during winter:
)()()()( 322 sHNOgClgClONOsHCl (3)
(s, solid; g, gas). Step (3) converts the inactive chlorine compounds into photo-reactive species
(Cl2). In the winter lower polar stratosphere, a strong polar vortex isolates a continent-size body
of air, in which polar stratospheric clouds (PSCs) of several km in thickness form due to very
low temperatures [44, 45]. These PSCs consist of water ice or nitric acid/ice particles with a
major composition of H2O. In the photochemical model, Eq. (3) is thought to be the major
mechanism for the activation of inert halogenated compounds into photoactive halogens in PSCs
in the dark polar stratosphere during winter, a key step for the subsequent formation of the
springtime ozone hole [44, 45]. When sunlight returns in spring, Cl2 releases chlorine atoms to
destroy O3 in the polar stratosphere.
B. Cosmic-Ray-Driven-Electron-Reaction Model for Ozone Depletion (CRE)
The study of the implications of electron-induced reactions of halogenated molecules for
stratospheric ozone depletion has revived since the reporting of large enhancements in electron-
induced dissociations of CFCs by the presence of polar molecular ices in 1999 [11, 12]. The
original project aimed to study elastic and inelastic processes of low-energy ions transmitting

AC
CE
PTE
DM
AN
US
CR
IPT
ACCEPTED MANUSCRIPT
– 8 –
through ultrathin surface layers (Ar, Kr, Xe, H2O and NH3) [46]. Unexpectedly, Lu and Madey
observed that the anion (Cl and F ) yields in electron-stimulated desorption (ESD) of CFCs are
enhanced by up to four orders of magnitude when CFCs are coadsorbed with polar molecular ice
(H2O, NH3) on a Ru(0001) surface [11, 12]. To find a mechanism to explain the observed
results, Lu and Madey noticed a basic fact that an excess electron can become self-trapped
(solvated) in a polar medium. The solvated electron was first observed in liquid NH3 by Weyl in
1863 [47] and in liquid H2O by Boag and Hart about 100 years later [48]. The advent of
femtosecond (1fs=10 15 s) time-resolved laser spectroscopy in 1987 provided a new-level
understanding of the dynamics of electron solvation in water, as first studied by Migus et al.
[49]. By the end of 1990s, it became clear that prior to the formation of the equilibrium-state
solvated electron (esol ), the excess electron in bulk water is located at precursor states with finite
lifetimes less than 1 picosecond (1ps=10 12 s), the so-called prehydrated electron (epre ) [49-54].
And negatively charged water clusters [H2O]n (n=2-69) were also first observed by Haberland
and Bowen’s groups in 1980s-1990s [55, 56]. On the basis of these previous findings, Lu and
Madey [11, 12] proposed a dissociative electron transfer (DET) mechanism to explain their
observations of large anion-yield enhancements: secondary electrons from the metal are first
trapped in polar media and then transferred to CFCs that dissociate to form anion fragments.
Lu and Madey [12] also noticed the fact that polar stratosphere clouds consisting of ice
particles exist in the winter polar stratosphere, making it different from the general stratosphere.
Consequently, the CR-induced physics and chemistry of molecules in the winter polar
stratosphere can be drastically different from that in the general stratosphere without the
presence of polar stratosphere clouds. Inspired by the finding of Finlayson-Pitts and co-workers

AC
CE
PTE
DM
AN
US
CR
IPT
ACCEPTED MANUSCRIPT
– 9 –
[57] that anions can enhance the generation of reactive chlorine from sea salts in the atmosphere
in 1998, Lu and Madey [12] explored the implications of their finding of anionic (Cl )
enhancements for ozone depletion in the polar stratosphere. They proposed that the resultant Cl
ions can be converted to Cl atoms to destroy O3 molecules, or the reactions of Cl with
stratospheric species can result in the formation of photoactive Cl2, ClNO2 or OClO in the winter
polar stratosphere [12]. Upon photolysis in spring, these molecules release Cl atoms to destroy
O3 in the polar stratosphere. The last step is similar to the photochemical model described
previously.
In 2001, Lu and Sanche confirmed the DET reactions of halogenated molecules adsorbed on
ice film surfaces by studying the trapping of near zero eV electrons at presolvated surface states
and the transfer to CFCs or HCl adsorbed on ice surfaces [13]. They also studied the relevance
of the cosmic-ray driven DET reactions to CFC dissociation and ozone depletion in the
stratosphere [14]. Further, Lu [15] has recently shown strong evidence of the CRE mechanism
for polar ozone depletion from the satellite data over two 11-year CR cycles (1979-2007). The
CRE mechanism, as schematically shown in Fig. 2, has therefore been developed [12, 14, 15].
The CRE mechanism drastically differs from the photochemical model for stratospheric ozone
depletion. The latter assumes that the sunlight photolysis of CFCs in the upper tropical
stratosphere, air transport and the subsequent heterogeneous chemical reactions of transported
inorganic halogens on ice surfaces in PSCs are the three major processes for the activation of
halogenated compounds into photoactive halogens. In contrast, the CRE model believes that the
in-situ CR-driven electron-induced reaction of halogenated molecules including organic and
inorganic molecules (CFCs, HCl, ClONO2, etc) adsorbed or trapped at PSC ice in the winter
AC
CE
PTE
DM
AN
US
CR
IPT
ACCEPTED MANUSCRIPT
– 10 –
polar stratosphere is the key step to form the photoactive halogen species that then lead to the
springtime ozone hole.
C. More Justification of the Cosmic-Ray-Driven-Electron-Reaction Model
In 2000s, Researches on electron solvation dynamics and associated dissociative electron
transfer reactions of halogenated molecules have continued in water solution [21, 27-29, 58-62],
ice surface [63], ultrathin ice films [16, 17, 64-67] and H2O anionic clusters [68-73]. Prior to
2008, many experimental and theoretical studies gave very diverse lifetimes and physical natures
of epre states in liquid water [49-54, 58-62]. But Wang et al [28] have recently resolved that
epre states are electronically excited states and have lifetimes of ~200 and 500 fs after the
identification and removal of a coherent spike effect. The epre lifetime of ~500 fs is consistent
with the theoretical prediction by Rossky and Schnitker [50] and recovers the earlier result
observed by Long et al. [51]. The coherent spike effect has recently been found in other (many)
pump-probe spectroscopic measurements [74]. Earlier femtosecond time-resolved spectroscopic
studies by Wolf’s group [64] and Petek’s group [65] on thin amorphous ice films (a few
monolayers) on a metal or insulator substrate showed lifetimes of less than 1 ps for the
presolvated electrons. By first-principles molecular dynamics simulations of the ice surface at
the temperatures close to those found in PSCs (150-200 K), Baletto et al. [63] found very stable
surface-bound states for trapping electron at the ice surface due to the structural rearrangement
induced by an excess electron. They proposed that the surface molecular rearrangement leads to
an increase of the number of dangling OH bonds pointing towards the vacuum and to the
formation of an electrostatic barrier preventing the decay of the electron into the bulk solvated
state [63]. Most recently, interesting results were reported by Wolf, Bovensiepen and co-

AC
CE
PTE
DM
AN
US
CR
IPT
ACCEPTED MANUSCRIPT
– 11 –
workers [17, 67], who observed long-lived trapped electrons with a lifetime up to minutes at the
crystalline ice surface. They also performed first principle calculations, which lead to a
conclusion that the observed long-lived trapped electrons is due to electron trapping at pre-
existing structural defects on the surface of the crystalline ice [67]. The above-mentioned results
have provided a strong foundation for the CR-driven DET reaction mechanism of halogenated
molecules adsorbed/trapped at ice surfaces in PSCs. As mentioned above, DEAs of many Cl-,
Br- and I-containing molecules (particularly CFCs) are exothermic, and therefore DEAs of these
molecules can occur at zero eV electrons in the gas phase [31, 32]. The exothermic energies of
the DEA reactions on H2O ice or in liquid water will be enhanced by 1 2 eV due to the effect of
the polarization potential [30], as shown in Fig. 1. This leads to strong resonances of anion
states of Cl-, Br- and I-containing molecules with epre that is weakly-bound at 1.5 to 1.0 eV
[13, 16, 17, 21, 27-29]. Thus, quite effective resonant DET can occur for organic and inorganic
(ozone-depleting) halogenated molecules (CFCs, HCl, ClONO2, etc) on H2O ice, as
demonstrated in the experiments to be reviewed in next Sections.
III. LABORATORY FINDINGS OF DISSOCIATIVE ELECTRON TRANSFER
REACTIONS OF HALOGENATED MOLECULES ON ICE
A. Electron-stimulated desorption (ESD) measurements
To generate low-energy anions and study the physical processes in their transport through
surface overlayers [46], Lu and Madey [75] first studied anion formation in electron-stimulated
desorption (ESD) of CF2Cl2 adsorbed on a Ru(0001) surface with an incident electron beam at
hundreds of eV. They found that the anions (Cl and F ) were mainly generated by DEAs to
CF2Cl2 of low-energy secondary free electrons emitted from the metal substrate. Unexpectedly
they observed a striking effect that the yields of anions are enhanced by orders of magnitude

AC
CE
PTE
DM
AN
US
CR
IPT
ACCEPTED MANUSCRIPT
– 12 –
when CF2Cl2 is coadsorbed with ~ 1 monolayer of polar molecular ice (H2O, NH3) on the metal
exposed to an electron beam of 250 eV [11, 12]. The experiments were conducted in an
ultrahigh vacuum (UHV) chamber with a base pressure ~4 10 11 torr. A highly sensitive
electron stimulated desorption ion angular distribution (ESDIAD) detector with time-of-flight
(TOF) capability permits direct measurement of the total yield and the angular distribution of a
specific ion species [76]. The ESDIAD/TOF detector, as shown in Fig. 3, is composed of a set
of four high transparency planar grids of which all except the second are grounded, a array of
five microchannel plates, and a position sensitive resistive anode encoder (RAE). The RAE is
connected to a position analyzing computer to provide direct digital acquisition of two-
dimensional data. By pulsing the primary electron beam and gating the retarding potential at
grid G, one can obtain an extremely high detection efficiency for desorbing ions. In the
experiments of Lu and Madey, the electron beam size was ~1mm, the used electron current was
adjustable between 0.05 nA and 20 nA, depending on CF2Cl2 precoverage, and the collection
time for each data point was 5 seconds only, to avoid detector saturation and to minimize beam
damage [11]. For the observations of giant Cl enhancements up to 104 in the ESDIAD
measurements, low electron currents ( 1 nA) were used. The coverages of CF2Cl2 and polar
molecules were carefully determined from temperature programmed desorption (TPD) spectra,
where one monolayer (ML) of H2O refers to a bilayer with a density of ~1.0x10¹⁵
molecules.cm 2 and one ML of CF2Cl2 is defined as the coverage corresponding to the saturation
of the monolayer peak in TPD spectra, i.e., the onset of the multilayer peak [75].
The variations of the Cl yield versus H2O and NH3 film thickness for various CF2Cl2 pre-
coverages are reproduced as Fig. 4. In the case of H2O coadsorption, it is seen that for the lowest
CF2Cl2 coverages, the Cl yield increases greatly with the initial coadsorption, exhibits a

AC
CE
PTE
DM
AN
US
CR
IPT
ACCEPTED MANUSCRIPT
– 13 –
maximum enhancement by nearly two orders of magnitude at about one ML of H2O, and finally
decreases to zero intensity at ~4.0 ML H2O overlayer. With higher H2O thickness, the Cl yield
decreases, which is expected due to elastic and inelastic scattering as the desorbed ions pass
through the H2O film. Similar results were observed for the coadsorption of NH3, but the
enhancement is about two orders of magnitude larger than for H2O coadsorption: the maximum
Cl enhancement for 0.3 ML CF2Cl2 is a factor of ~3x10⁴. Also, F enhancements were
observed for either H2O or NH3 coadsorption, but the magnitude of enhancement for F is much
smaller than for Cl with an identical CF2Cl2 coverage [11, 12].
Similar anion enhancements were observed for ESD of 0.3 ML CF2Cl2 adsorbed on top of
H2O-precovered Ru surfaces with various H2O thickness [12]; the variation of the Cl desorption
yield is reproduced as Fig. 5. At the H2O coverage of ~1 ML, the Cl yield exhibits a maximum
of two orders of magnitude higher than that without the presence of H2O. With larger H2O
spacer thickness, the Cl yield decreases. This is due to the finite tunneling depth (2~4 ML) of
low-energy secondary electrons from the substrate through the ice film [77, 78]. The higher
desorbed Cl yield for CF2Cl2 adsorbed on top of a water-ice surface (Fig. 5) than for its
coadsorption with water on a metal substrate (Fig. 4) is due to a lower ion scattering loss
probability and a lower image-potential attraction (a higher desorption probability) on the water-
ice surface than on the metal substrate [12].
One has to consider the possible effects of the metal substrate on the observed anion
enhancements in the above ESD experiments. However, the F yield enhancements are much
smaller than those of the Cl yield, and much smaller F and Cl enhancements (less than one
order of magnitude) were observed when CF2Cl2 was coadsorbed with non-polar molecules such
as rare-gas molecules (Xe, Kr and Ar) on Ru [11, 79, 80]. These facts led to the conclusion that

AC
CE
PTE
DM
AN
US
CR
IPT
ACCEPTED MANUSCRIPT
– 14 –
the metal substrate could only play a minor role (such as through work-function-variation and
image-potential effects) in enhancing the anion yields by the presence of polar H2O/NH3 ice
[80].
Interestingly, Cowin and co-workers [81] observed electron-induced dissociation of CH3Cl on
Ni(111) under UV irradiation, though it was not clear whether the fragment of CH3 resulted from
the DEA of a low-energy photoexcited free electron or from the DET of a weakly-bound
subvacuum photoexcited electron from the metal. More interestingly, they also observed a
similar enhancement by ~50 times of the yield of the neutral CH3 fragment in photoreduction of
CH3Cl adsorbed on Ni(111) surface with the presence of ~1 ML H2O spacer layer [77]. The
CH3-yield enhancement then quickly decreased with increasing H2O thickness and was about
one order of magnitude lower at 5 ML H2O due to the limited tunneling depth (2~4 ML) of low-
energy electrons in ice. This is quite similar to the observed ESD Cl -yield enhancements shown
in Fig. 5, though the CH3Cl coverage was not given in ref. 77. Gilton et al. [77] attributed the
CH3-yield enhancement to a strong inelastic scattering interaction between the photoexcited
electrons and the H2O, compared with the monotonic and slow decrease of the CH3 signal with
increasing Xe spacer thickness. This interpretation without involving trapped electrons and
DET, however, cannot explain the observed much larger anion enhancements in electron-
induced dissociation of CF2Cl2 by the presence of NH3 than by H2O, since inelastic electron
scattering by NH3 (with a dipole moment of 1.47 D) is weaker than by H2O (1.84 D) [11].
In fact, polar NH3 has long been employed as a reagent gas to enhance the detection
sensitivity of organic and inorganic halogenated molecules in ammonia-enhanced anion mass
spectrometry though the role of NH3 was unknown there [82, 83]. And the solvation of electrons
generated by adding electron donors (alkali metals) into polar media such as liquid ammonia had

AC
CE
PTE
DM
AN
US
CR
IPT
ACCEPTED MANUSCRIPT
– 15 –
been adopted as an effective method for dehalogenation of environmentally hazardous
halogenated materials including CFCs. In the latter, halogen atoms were reduced to halogen ions
and dechlorination of CFCs was also observed to be much more efficient than defluorination [84,
85]. Realizing these observations, Lu and Madey [11, 12, 79, 80] proposed a dissociative
electron transfer mechanism to explain the observed anion enhancements in ESD of CFCs
adsorbed on polar ice surfaces. They proposed that secondary electrons with energies of nearly 0
eV, produced by bombardment of the metal substrate with high-energy (250 eV) electrons, are
injected and trapped in the polar molecular (H2O/NH3) layer; the giant anionic enhancements are
due to transfer of trapped electrons (et ) in polar ice to CFCs that then dissociate into Cl and a
neutral fragment. The DET process, e.g. for CF2Cl2, can be expressed as [11, 12, 79, 80]:
,)(/)(/ 2323 mtmt OHeNHeOnHmNHe (4)
.* 22222 ClCFClClCFClCFet (5)
In contrast to et in polar media, low-energy secondary electrons in nonpolar media (e.g., rare-
gas films) remain quasi-free and thus have extremely short residence times (lifetimes) in
femtoseconds, decaying quickly into the metallic substrate without transfer to CFCs. Therefore
the anionic enhancements via the DET mechanism in nonpolar media is very limited, in spite of
the fact that coadsorption of rare-gas atoms leads to a larger yield of secondary electrons from
the metal substrate [80]. Moreover, according to the DET mechanism, the anion enhancement
factor can be expressed as: =(D1+D2)/D1=1+ D2/D1, where D1 is the amount of CFC
molecules dissociated by DEA of low-energy free electrons from the metal and D2 the amount of
CFC molecules dissociated by DET of trapped electrons in ice. D1 is usually proportional to the

AC
CE
PTE
DM
AN
US
CR
IPT
ACCEPTED MANUSCRIPT
– 16 –
CFC coverage unless all secondary electrons are depleted (not the case under normal
experimental conditions). However, it should be noted that only a small percent of low-energy
free electrons become trapped electrons in the ice layer of ~1ML and they have a much longer
lifetime to react with CFC molecules. Thus, there is an upper limit for the D2 value: the
maximum value, (D2)max, is equal to the total number of trapped electrons, which depends on
specific experimental conditions. This will lead to a result that at very low CFC coverages, the
D2 is proportional to the CFC coverage; at high CFC coverages, D2=(D2)max. Consequently, the
anion enhancement factor should decrease with increasing CFC coverages at the intermediate
coverages and 1 (no enhancement) at high CFC coverages. This is in good agreement with
the observed data (Fig. 4) [11, 12, 79, 80].
Most of the Cl ions from the DET reaction in Eqs. (4) and (5) are trapped at the surface by
the image potential, as the desorption probability of Cl ions resulting from near 0 eV electrons
is extremely low (10 7 10 6) [9, 12]. The measurement to obtain a sufficient Cl signal has
therefore been a quite challenging task. Only a few groups in the worldwide have been able to
detect the extremely low Cl yields produced by DEAs/DETs of molecules with ~0 eV electrons
on metal surfaces. Polanyi and co-workers [9, 10] were the first to directly observe desorption of
Cl ions from photoinduced DETs of weakly-bound hot electrons (<0 eV) at a metallic substrate
to CCl4 and chloromethanes adsorbed on the surface. Fortunately, another system equipped with
an extremely sensitive ESDIAD/TOF detector (Fig. 3) [75, 76] was available in the system
operated by Lu in Dr. Madey’s laboratory at Rutgers in late 1990s. For detection of negative
ions with an extremely low yield, a pulsed gating technique must be applied to close the detector
when a large number of secondary electrons generated by primary electrons/photons arrive at the
detector, i.e., to open the detector just before the arrival of anions to be detected. This can avoid

AC
CE
PTE
DM
AN
US
CR
IPT
ACCEPTED MANUSCRIPT
– 17 –
over-warming (pre-saturation) at the detector when a high voltage is applied to achieve the
highest detection efficiency. The relatively unique facility at Rutgers allowed one to observe
true DET reactions of intact CFCs with low electron doses, avoiding the effects of their reaction
products and sample damage. Note that the DET cross sections of CF2Cl2 adsorbed on H2O ice,
after removing the possible effects of the metal substrate, was measured to be ~1x10 14 cm2,
which is six orders of magnitude higher than the photodissociation cross section (10 20 cm2) of
CF2Cl2 [12]. Thus, a very low electron dose must be used to make the measurements.
After the finding of Lu and Madey [11, 12], Langer et al. [86] reported no anion
enhancements for electron-induced reactions of CF2Cl2 with NH3 but their experimental
conditions were very different from those of Lu and Madey. In those gas-phase or cluster
experiments, two problems should be noted. First, the detection system of Langer et al was a
commercial quadrupole mass spectrometer (QMS) and did not have the capability to detect
desorbing Cl ions resulting from DEA/DET resonances at near 0 eV on a metal surface, even
for thick multilayers of adsorbed CF2Cl2 with a high electron current of 40-50 nA. Langer et al
thus concluded that “desorption at very low electron energies is not operative” [86]. Second,
detailed TPD spectra of CF2Cl2 adsorbed the surface were not recorded in those experiments,
which are often required to determine adsorbate coverages reliably.
The negative results of Langer et al [86] stimulated Solovev et al. [87] to revisit the ESD
experiments using both ESDIAD and higher-sensitivity QMS systems. The latter was modified
to have the TOF capability by using a pulsed electron beam and a pulsed detector gate. The
results of Solovev et al. [87] is reproduced as Fig. 6, which have substantially confirmed the
giant Cl enhancements by >103 times for submonolayers of CF2Cl2 co-adsorbed with NH3 on
Ru(0001), originally observed by Lu and Madey [11, 12]. Solovev et al. also observed some

AC
CE
PTE
DM
AN
US
CR
IPT
ACCEPTED MANUSCRIPT
– 18 –
differences: the Cl enhancements observed by the QMS detector, are significantly smaller those
with the ESDIAD detector, e.g., the Cl enhancement factor at 1 ML CF2Cl2 by 1.5 ML NH3
coadsorption decreased from 150~200 to less than 50. These differences were attributed to
technical origins such as mass resolution, background subtractions and different collection
angles for QMS and ESDIAD detectors [87]. Unfortunately, a key experimental difference was
not mentioned. The ESDIAD detector at Rutgers [75, 76, Fig. 3] has an extremely high
sensitivity, orders of magnitude higher than the QMS detector with a single channel electron
multiplier at Rutgers and probably in most commercial QMS systems. Thus, the required
electron dose with the ESDIAD detector is much lower than that required by a QMS. High
electron doses can cause significant damage to the sample, in particular when DET cross
sections of CF2Cl2 are greatly enhanced up to 10 14 10 13 cm2 by H2O and NH3 [11, 12]. For
those experiments, low electron doses 1x1012 cm2 are required to achieve reliable
measurements. Lu and Madey were aware of this critical condition, and hence low electron
currents ( 1 nA) and a short data correction time of only 5 s were used for detection of the
maximum Cl enhancements up to 104 in their ESDIAD experiments [11, 12, 79, 80]. Notably,
Solovev et al. [87] used the same facility with similar electron currents but a data collection time
of 60 s, one order higher than that used by Lu and Madey. This can reasonably explain the slight
differences in ESDIAD results: at high CF2Cl2 coverage (1 ML) the maximum Cl enhancement
by ~1 ML NH3 measured by Solovev et al. (Fig. 5b) is no less than that observed by Lu and
Madey (Fig. 4b), but at the lowest CF2Cl2 coverage (0.3 ML) a smaller maximum Cl
enhancement was measured by Solovev et al. The most likely origin is that for 0.3 ML CF2Cl2,
an electron current much larger than that for 1ML CF2Cl2 was required and a significant
decomposition of the CF2Cl2 coadsorbed with ~1 ML NH3 could not avoided even within a

AC
CE
PTE
DM
AN
US
CR
IPT
ACCEPTED MANUSCRIPT
– 19 –
single measurement (60 s) if the electron beam current was not reduced. Overall, it is not
surprising to observe smaller anion enhancements with a QMS than with an ESDIAD detector,
since the former required a much larger electron dose and tended to cause damage to the sample.
Remarkably, the advantage of these ESD experiments is the capability of directly measuring
the dissociation products (anions) from the DET reactions. On the other hand, it requires an
anion detector of an extremely high sensitivity, and cautions must be taken to remove the effects
of the metal substrate and the potential artificial effects mentioned above in order for reliable
determination of the absolute DET cross sections [80].
B. Electron trapping measurements
In 2000-2001, Lu and Sanche [13, 88-90] directly used a low-energy (0-10 eV) electron beam
reaching zero eV to examine the DET mechanism for large enhancements in dissociation of
halogenated molecules (CFCs, HCFCs and HCl, etc) adsorbed on ice films. As shown in Fig. 7,
a Kr spacer film of 10 ML was used to isolate any possible effects of the Pt substrate and to
facilitate the growth of a uniform H2O/NH3 film. In the experiments, electron trapping in a
dielectric film was measured by the low energy electron transmission (LEET) method [91]. A
magnetically collimated electron beam (0-10 eV) having an energy resolution of 40 meV is
produced by a trochoidal monochromator. A LEET spectrum records the electron current
transmitted through a dielectric film as a function of incident electron energy E, which has a
sharp onset at the vacuum level defined as zero eV. If electrons are trapped in the film with a
lifetime longer than the detection limit of ms, the onset curve shifts to a higher energy by V. An
electron trapping coefficient As(E) is defined as d( V)/dt at t=0. For charging by a submonolayer

AC
CE
PTE
DM
AN
US
CR
IPT
ACCEPTED MANUSCRIPT
– 20 –
of CF2Cl2 on the H2O or NH3 film surface, the electron-trapping cross section (E) is obtained
by [13, 88-90]
)((E)
(E)A2
2
1
1s
LLJ
o
oo
. (6)
Here, 0 is the surface density of electron-trapping molecules, J0 the incident electron density
and 0 the vacuum permittivity. 1 (1.91) and 2 (3.3 and 3.4, respectively, for H2O and NH3) are
the dielectric constants of the Kr and polar molecular films. L1=32.6 Å is the film thickness for
10 ML Kr and L2=13.0 and 11.7 Å for 5 ML H2O and 5 ML NH3, respectively. In the
experiments, the spectra of As(E) were measured for 0.1-0.2 ML halogenated molecules ( 0 is
estimated to be ~6x10¹³, 5.8x10¹³, 7.4x10¹³, 5.0x10¹³ and 1.2x10¹⁴ /cm2 for CF2Cl2, CFCl3,
CHF2Cl, CH3CF2Cl and HCl, respectively) condensed on a 10 ML Kr film with and without the
presence of a 5 ML H2O/NH3 layer. The latter has properties sufficiently close to the bulk ice,
and keeps the experimental error in measured trapping cross section (E) due to the uncertainty
in H2O/NH3 thickness (L2) negligible since L1/ 1>> L2/ 2 in Eq. (6).
Reproduced in Fig. 8(a) is As(E) for 0.1 ML CF2Cl2 adsorbed on a 10 ML Kr surface, from
which a trapping cross section =1.4x10 15 cm2 at nearly 0 eV was derived, which is about 14
times the DEA cross section in the gas phase. As shown in Fig. 8(b), in contrast, a DEA
resonance peaking at 0 eV with a cross section of =7.2x10 15 cm2 was observed for CFCl3,
which is slightly smaller than the gas-phase DEA cross section (~1x10 14 cm2), along with a
much weaker peak appearing around 6.0 eV [89]. The larger DEA cross section for CF2Cl2
adsorbed on the Kr surface than the gas-phase cross section has been well explained by the

AC
CE
PTE
DM
AN
US
CR
IPT
ACCEPTED MANUSCRIPT
– 21 –
condensed phase effects on the lifetime, decay channels and energy of anion resonances [13],
well described in the R-matrix model by Fabrikant [92, 93]. In contrast, the smaller DEA cross
section for CFCl3 adsorbed on the Kr surface than its gas-phase DEA cross section at zero eV
has been attributed to the reduction in nuclear wave function overlap between the neutral AB and
the anion AB* states in the Franck-Condon region [89].
Of special interest are the results of As(E) for 0.1 ML CF2Cl2 and CFCl3 condensed on 5ML
H2O predosed onto the 10 ML Kr surface, which are shown in Figs. 8(c) and 8(d), respectively.
Evidently, the presence of the polar molecular films leads to a complete quenching of DEA
resonances at electron energies larger than ~1.0 eV but increases the electron trapping cross
section near 0 eV. However, the trapping coefficient in Figs. 8(c) and 8(d) may include
contribution from long-lived electrons trapped in the pure H2O film [13]. After subtracting the
latter, a trapping cross section =1.3x10 14 cm2 at ~ 0 eV for 0.1 ML CF2Cl2 on 5 ML H2O was
obtained, which is about one order of magnitude larger than that on Kr or two orders higher than
the gaseous cross section [13]. Similarly, a trapping cross section of ~8.9x10 14 at ~ 0 eV for 0.1
ML CFCl3 on 5 ML H2O was measured, which is nearly one order higher than the gaseous cross
section [90].
The results of As(E) for 0.1 ML CHF2Cl (HCFC-22) and 0.1 ML CH3CF2Cl (HCFC-142b)
adsorbed onto the 10 ML Kr surface from Lu and Sanche [89] are reproduced as Figs. 9(a) and
9(b), respectively. From these As(E) values, the DEA cross sections for HCFC-22 and 142b
were measured to be ~4.2 10 16 cm2 broadly peaking at 0.78 eV and ~7.8 10 16 cm2 at 0.89 eV,
respectively, which are 2 to 3 orders of magnitude larger than their gaseous values. For HCFC-
22, there are also two small peaks at 4.7 eV and 8.0 eV. The results of As(E) obtained for 0.1
ML CHF2Cl and 0.1 ML CH3CF2Cl adsorbed on 5ML H2O predosed onto the 10 ML Kr surface

AC
CE
PTE
DM
AN
US
CR
IPT
ACCEPTED MANUSCRIPT
– 22 –
from Lu and Sanche [90] are reproduced in Figs. 9(c) and 9(d), respectively. The measured
trapping cross sections at ~ 0 eV are ~5.1x10 15 and ~4.9x10 15 cm2 for CHF2Cl and CH3CF2Cl
on H2O ice, respectively, which are approximately 3-4 orders of magnitudes larger than their
respective values in the gas phase.
Lu and Sanche [88] also measured the As(E) for HCl adsorbed on 10 ML Kr and on 5ML H2O
predosed onto 10 ML Kr, from which electron trapping cross sections =(1.1 0.3)x10 16 and
(4.0 1.2)x10 15 cm2 at ~0 eV were derived. Evidently, the presence of H2O greatly increases
electron trapping at ~0 eV. Similar DET reaction is expected for ClONO2, though it was not
done in the experiments. The reason is that ClONO2 has not only a strong DEA resonance at 0
eV but its dissociation is highly exothermic (by up to 2.1 eV) [94]. Thus, there is every reason to
predict that the DET of ClONO2 with electrons trapped in polar ice has the highest efficiency, no
less than those of CFCs.
It is also worth noting the following facts. (1) The condensed-phase effects lead to a
decrease of the DEA cross section at zero eV of CFCl3 (CCl4) adsorbed on a non-polar Kr film.
(2) For halogenated molecules (CFCs, HCFCs, HCl, etc.), except electron-trapping cross
sections at near 0 eV, the DEA resonances at electron energies 1 eV observed in the gas phase
and on the Kr surface are almost completely suppressed when they are adsorbed on the ice
surface. More significantly for HCFCs, the higher-energy sides of the DEA resonances at
electron energies 1 eV disappear when these molecules are adsorbed on H2O ice. This is even
clearer for CF4, which has a DEA resonance peak around 6.0 eV observed for CF4 adsorbed on
the Kr surface by Bass et al. [95], but the resonance completely disappears on the H2O ice
surface [90]. These observed results demonstrate that the H2O ice causes a quenching effect on
the DEA resonances above 1.0 eV. In striking contrast, the electron trapping cross sections of

AC
CE
PTE
DM
AN
US
CR
IPT
ACCEPTED MANUSCRIPT
– 23 –
these halogenated molecules at 0 eV are greatly enhanced by the presence of the H2O ice films.
It is evident that such enhancements cannot be explained by the above-mentioned condensed
phase effects observed for molecules adsorbed on non-polar Kr films. Instead, these results have
confirmed the DET mechanism expressed in Eqs. (4) and (5). The excess electrons near 0 eV are
rapidly thermalized and trapped in the polar H2O ice to become weakly-bound pre-solvated
electrons (epre ). During its lifetime, epre is effectively resonantly transferred to a halogenated
molecule that has an anion resonance in the energy range of epre ( 1.5 ~ 1.0 eV) (Fig. 1). Note
that the fully-solvated electrons with a binding energy of 3.2 eV in the H2O bulk can hardly
contribute to the DETs of halogenated molecules, as well demonstrated in the experiments in
liquid water [21, 27-29].
Strictly speaking, the above electron trapping measurements could not distinguish whether
the electron is trapped as the Cl fragment or a stabilized molecular ion (e.g., a CF2Cl2 ).
However, it has been pointed out that even for gaseous CFCs with DEA resonances near 0 eV,
the dissociation probability of the AB* transient state lies near unity once an electron is
attached [32]. This is most likely to be true for AB* states resulting from DETs of halogenated
molecules with epre in H2O, since their autodetachment cannot occur (see Fig. 1) [29]. And
desorption of Cl from the surface is negligible. Thus, the measured charges are approximately
equal to electrons trapped as Cl ions, i.e., approximately corresponds to the DEA/DET cross
section [13, 88-90]. The DET cross section of CF2Cl2 on H2O ice measured in electron trapping
experiments is very close to the value estimated from the ESD measurements. Thus, the low-
electron trapping experiments at 0-10 eV with an excellent energy resolution (40 meV) provided
an ideal complement to the ESD measurements, well confirming the DET mechanism.

AC
CE
PTE
DM
AN
US
CR
IPT
ACCEPTED MANUSCRIPT
– 24 –
C. Femtosecond time-resolved laser spectroscopic measurements
Real-time observation of the reaction transition state is the most direct method for observation of
molecular reactions and bond breaks, according to the seminal contributions of Nobel laureates
Drs. Polanyi and Zewail [96]. This came true with the advent of femtosecond time-resolved
laser spectroscopy, as demonstrated by the pioneering work of Zewail [97]. Using this
technique, Wang et al. [21, 27-29] have obtained direct, real-time observations of the
intermediate anion states (XdUs* and CCl4* ) of the DETs of epre with lifetimes of 200-500 fs
to Cl-, Br- and I-containing molecules, namely halopyrimidines (XdUs) and CCl4, in liquid
water/methanol. As shown in Fig. 10, the formation time of XdUs* just corresponds to the
lifetimes of epre , which are within 1.0 ps after the electron is generated by a fs laser pulse.
These results directly prove that the DET reactions occur with the pre-solvated electron, rather
than with the fully solvated electron, a notion held since 1970s.
With a different approach, Ryu et al. [16] and Bertin et al. [17] have also observed the DET
reactions of CFCs adsorbed on H2O ice on a metal substrate by monitoring the dynamics of
trapped electrons with fs time-resolved two-photon photoemission (2PPE) spectroscopy. As
shown in Fig. 11, Ryu et al. [16] showed that the lifetime of an electron photoexcited from a
metal substrate and trapped in the ice film is significantly decreased by co-adsorption of
submonolayer CFCl3, which was explained by DET of the “solvated” electron from the ice to
CFCl3. It should be noted that the transient electron species with a lifetime of 120 fs observed
by Ryu et al. is in a weakly-bound state at 1.2 eV below the vacuum level and is a pre-solvated
electron rather than a fully solvated electron that has a binding energy of ~3.2 eV [56]. As
reproduced in Fig. 12, similar results were recently observed by Bertin et al. [17] for CFCl3
adsorbed on the crystalline ice surface, but they observed long-lived trapped electrons with a
AC
CE
PTE
DM
AN
US
CR
IPT
ACCEPTED MANUSCRIPT
– 25 –
lifetime up to minutes, trapping at pre-existing structural defects on the surface of the crystalline
ice. The results of Bertin et al. indicated that DET of the trapped electrons from the ice to CFCl3
is highly efficient, since an extremely low CFCl3 coverage of only ~0.004 monolayer can
completely deplete all the trapped electrons generated in the ice under their experimental
conditions (Fig. 12). The observations by Bertin et al [17] are interesting, but it should also be
noted that such long-lived trapped electrons may not be unique to the crystalline ice surface.
Indeed, long-lived trapped electrons were also observed at the amorphous ice film deposited on
Kr at 20 K in the electron trapping experiments [13]. The 2 PPE experimental results by Ryu et
al. [16] and Bertin et al. [17] also agree with the observations of Lu and Madey [11, 12, 79, 80]
that the anionic-yield enhancement factor due to the DET process is strongly dependent on the
coverage of CFCs. Bertin et al. [17] also explore the implication of their results for photo-
enhanced DET reactions of CFCs in the lower polar stratosphere with the returning of sunlight in
spring. However, it should be noted that most of the CFC molecules have been depleted in the
lower polar stratosphere during winter, so have HCl and ClONO2 molecules; the concentrations
CFCs are very low in spring (see satellite data to be presented in Section V(D)). Nevertheless, it
will still be interesting to explore the possible effects of photo-assisted DET reactions of other
halogenated molecules (e.g., ClOOCl) on ozone loss in the spring polar stratosphere.
D. Other measurements
There are also other studies of electron induced reactions of condensed CF2Cl2 (CCl4) or the
CF2Cl2 (CCl4) / H2O ice mixtures deposited onto a metal surface [98-103]. However, refs. 98-
100 and others not cited here studied the dissociation electron attachments (DEAs) of pure CFCs
with free electron energies (0-20 eV) and are therefore beyond the scope of this review. In terms

AC
CE
PTE
DM
AN
US
CR
IPT
ACCEPTED MANUSCRIPT
– 26 –
of the X-ray photoelectron spectroscopy (XPS) and reflection absorption infrared spectroscopy
(RAIRS) studies of CCl4/H2O and CF2Cl2/H2O ice mixtures on Au by Fairbrother and co-
workers in 2002-2003 [101, 102], one has to be discerning in discussing the relevance of their
results to the DETs of CFCs adsorbed on H2O ice. In those studies, secondary electrons from a
metal (Au) were generated from a X-ray source (Mg K anode, 1253.6 eV) operating at 300 W
and 15 kV or from a high-current flood electron gun at 4 mA emission current and a 10 eV
extraction voltage. For the latter, a sample bias of +200 V was employed to accelerate the
kinetic energy of the incident electrons and increase the rate of chemical transformation in the
CCl4/H2O (ice) films. Their results showed a slow depletion of CCl4 or CF2Cl2 molecules
identified by RAIRS (C-Cl) and (C-F) peaks, respectively [101, 102]. For instance, about
10% of CF2Cl2 remained on the surface with extended exposure of the X-ray source by 500 min
[102]. The secondary electron current generated such a X-ray source is typically in the order of
A. These results implied no or little enhancements or even a decrease in the cross sections of
electron-induced reactions of the CFC/ice mixtures compared with the cross sections for pure
CFCs. It must be pointed out, however, that the thicknesses of the CCl4/H2O and CF2Cl2/H2O
films used in their XPS/RAIRS experiments were 300 Å (~100 ML H2O) and 60-70 Å (~20-23
ML H2O), respectively. Under the conditions, secondary electrons generated from the Au
substrate could hardly reach all CCl4/CF2Cl2 molecules, and it was not clear if the decomposition
of CFCs is dominated by the interaction with high-energy incident electrons / photons or with
low-energy secondary electrons. In fact, Fairbrother and co-workers [101] stated that “the same
chemical transformations (reaction products) were observed for CCl4/H2O (ice) films using the
X-ray source or the electron gun in the absence or presence of an applied bias voltage (+200)”.
If this observation was confirmed, then it would mean that no secondary electrons from the metal

AC
CE
PTE
DM
AN
US
CR
IPT
ACCEPTED MANUSCRIPT
– 27 –
were involved in the chemical transformation. The reason is that the secondary electron yield is
well known to be strongly dependent on the incident primary electron energy [104]. Indeed,
almost no secondary electron emission from a metal substrate could be observed for an incident
primary electron beam of 10 eV [80, 104], and the electron trapping cross section of ice at 10 eV
is nearly zero (see Figs. 8 and 9). Thus, when the flood electron gun was operated at 10 eV
without applying a bias voltage, essentially no secondary-electron-induced reactions (DEA/DET)
could occur at the pure CCl4 or CF2Cl2 layer or in the CCl4/ice or CF2Cl2/ice mixture. Overall,
these XPS/RAIRS studies of thick CFC/ice mixture films did not have the capability of obtaining
the quantitative DEA/DET cross section of CFCs [101, 102].
In 2004, Fairbrother’s group in collaboration with Madey’s group [103] also reported their
measurements of the DET cross sections of CFCs adsorbed on top of 5 ML H2O using
temperature programmed desorption (TPD). Unfortunately, however, their results were
essentially misinterpreted. With energy-undefined, yield-unknown secondary electrons
generated by the X-ray source or a defocused 180 eV electron source from a QMS filament,
these authors claimed obtained “direct” measurements of the absolute DET cross sections of
CCl4 or CF2Cl2 adsorbed on ice. Their measured dissociation rates of 1ML CF2Cl2 and 1 ML
CCl4 increased in an H2O (D2O) environment by ~2–3 times, which is not smaller than that
reported in literature [11, 12], as seen in Fig. 4(a). However, the maximum absolute cross
sections for decomposition of 0.25 ML CFCs adsorbed on top of 5 ML H2O, using 180 eV
incident electrons from the QMS filament, were measured to be 1.0 0.2 x10 15 cm2 for CF2Cl2
and 2.5 0.2 x10 15 cm2 for CCl4. The latter is even less than the reported DEA cross sections of
CCl4 at 0 eV in the gas phase (1.3 x10 14 cm2) [32] and adsorbed on Kr film (5 x10 15 cm2) [98].
The authors [103] attempted to compare their measured dissociation cross sections of CCl4 or

AC
CE
PTE
DM
AN
US
CR
IPT
ACCEPTED MANUSCRIPT
– 28 –
CF2Cl2 adsorbed on ice directly with those obtained by Lu and Madey in ESDIAD [11, 12] and
by Lu and Sanche in electron trapping experiments [13] reviewed above. Here, a serious and
obvious problem must be pointed out: these authors did not take into account the large loss of
low-energy secondary electrons in transmission from the metal substrate through 5 ML H2O to
the outmost CFC layer, as robustly seen in the previous experiments by Gilton et al. [77],
Chakarov and Kasemo [78] and Lu and Madey [12, see Fig. 5]. According to these previous
studies, the tunneling depth of low-energy secondary electrons in H2O ice is 3-4 ML [77, 78] and
the secondary-electron induced dissociation cross section of CF2Cl2 (CH3Cl) adsorbed on top of
5 ML H2O is about one order of magnitude lower than on 1 ML H2O [12, 77], as shown in Fig.
5. Thus, the Fairbrother Madey TPD experiment [103] would have given a maximum
dissociation cross section of 1.0 x10 14 cm2 for CF2Cl2 on 1 ML H2O ice if the attenuation of
secondary electrons in ice were taken into account. This value would then be identical to the
cross section of ~1x10 14 cm2 measured by ESDIAD of Cl from CF2Cl2 on 1 ML H2O ice with
250 eV incident electrons and of 1.3x10 14 cm2 measured by electron trapping with ~ 0 eV
electrons incident onto CF2Cl2 adsorbed on 5 ML H2O ice. Obviously, one cannot directly
compare the TPD result of CF2Cl2 adsorbed on 5 ML H2O ice using 180 eV incident electrons
with the electron trapping result using an incident electron beam reaching 0 eV. But the
discrepancy can be removed if the secondary electron flux reacting with CFCs is carefully
calibrated in the TPD experiments. However, it was inappropriate for the authors to claim that
their TPD gave more “direct” measurements of the absolute DET cross sections of CFCs
adsorbed on ice than the ESDIAD directly detecting the desorbing dissociation products (Cl and
F ) and the electron trapping measurements directly using zero eV incident electrons. In fact, it
is the CF2Cl (mass at 85) and CCl3 (mass at 117) species, rather than the intact CF2Cl2 and CCl4,
AC
CE
PTE
DM
AN
US
CR
IPT
ACCEPTED MANUSCRIPT
– 29 –
that were detected in the TPD measurements of CF2Cl2 and CCl4 [75, 103]. In a general case,
the TPD technique does not have the capability to distinguish the CF2Cl2 (CCl4) and its
dissociation product CF2Cl (CCl3) adsorbed on the surface.
In summary, there is every reason to conclude that the DET mechanism for halogenated
molecules adsorbed on polar molecular ice, originally proposed by Lu and Madey, has been well
observed in various laboratory measurements with different methods [11-14, 16, 17, 27-29, 87,
103] and supported by theoretical simulations [105, 106].
IV. SATELLITE OBSERVATIONS OF THE COSMIC-RAY-DRIVEN ELECTRON
REACTION MECHANISM
A. Spatial correlation between cosmic rays and ozone depletion
If the CR-driven electron reaction (CRE) mechanism plays a significant role in stratospheric
ozone depletion, then a correlation between ozone depletion and the CR intensity should be
observed. Due to the geomagnetic effect, the intensity of CRs is well known to be larger at
higher latitudes and has a maximum over the South and North Poles, and due to atmospheric
ionization, the electron production rate by CRs has a maximum at ~18 km above the ground. Lu
and Sanche [14] thus analyzed data of ozone and CRs obtained from field (satellite)
measurements and found that there is indeed a strong spatial correlation between polar ozone
loss and CR intensity in the Earth’s atmosphere with variations of latitude and altitude, as shown
in Fig. 13(a) and 13(b). The ozone hole is exactly located at the polar stratosphere at ~18 km,
where the ionization rate of CRs producing electrons shows a maximum.

AC
CE
PTE
DM
AN
US
CR
IPT
ACCEPTED MANUSCRIPT
– 30 –
B. Time correlation between cosmic rays and ozone depletion
Lu and Sanche [14] also showed a time correlation between the annual mean total O3 in the
southern hemisphere (at latitudes 0–65o S) and the CR intensity in the single CR cycle of 1981-
1992. However, it has been argued that no such a correlation would exist beyond one CR cycles
[107], or that this time correlation for total ozone in the low and mid-latitudes is only due to the
solar effect and no correlation between CRs and O3 loss in the polar region would exist [108,
109]. It was even argued that no further studies of the CR-driven mechanism for O3 depletion
should be motivated [109]. Facing these criticisms, Lu and co-workers [110, 111] pointed out
that the large fluctuation level (up to 20%) of the O3 data reported in refs. 107-109 did not allow
one to examine the effect of the CR intensity modulation (10%) on O3 depletion over 11-year
cycles, as recently demonstrated by Wang et al. [111]. Most recently, Lu [15] has shown that
there exist 11-year cyclic time correlations of the CR intensity not only with the annual mean
total O3 in the southern hemisphere (0-60o S) over two CR cycles but with total O3 in the spring
Antarctic ozone hole (60-90o S). The observed data from high-quality ozone datasets of NASA
satellites are updated in Figs. 14a and 14b, with the 2008 data included. These observed data
have provided strong evidence of the CRE mechanism for the polar ozone hole [15].
C. Direct solar cycle effect and cosmic-ray effect
Atmospheric researchers have attempted to include the so-called solar effect in modeling of the
polar O3 loss within the photochemical model, while conceding that it is complicate and difficult
to understand the O3 variation in recent years and predict the future trend [37]. Here, it should
be pointed out that this might be a pseudo-problem for at least two reasons. First, the direct solar
effect, in inverse phase with the CR effect, argues that the maximum solar UV irradiance

AC
CE
PTE
DM
AN
US
CR
IPT
ACCEPTED MANUSCRIPT
– 31 –
(corresponding to the lowest CR intensity) would result in the maximum O3 production via the
photolysis of O2 in the upper stratosphere. This effect predicted small annual O3 oscillations
( 1.5%) in the tropics and mid-latitudes but not in the polar region (especially in the lower polar
stratosphere) [37]. Second, the photochemical model would also predict that the maximum solar
intensity would produce the largest amount of active Cl to destroy O3.
Researchers have also proposed the direct cosmic ray effect, which attributes ozone loss to
the odd hydrogen (HOx) and odd nitrogen (NOy) species generated by CRs in the polar
stratosphere [112], similar to the production of NOy species from solar particle events proposed
by Crutzen [113]. The direct CR effect would predict an 11-year cyclic variation of total O3 in
the polar stratosphere in any season. There may exist other effects of charged particle
precipitation on O3 loss in the upper stratosphere [37]. However, solar particle events and
energetic electron precipitation are spontaneous frequent events without an 11-year cycle. Thus,
they have been ruled out as the possible mechanisms for the observed 11-year cyclic oscillation
in total O3 [15].
Even without the above reasoning, a direct way to examine the direct solar-cycle and CR-
cycle effects is to show the results of time-series total ozone in the summer polar stratosphere:
both effects would be most significant to be seen if they exist, while the CRE mechanism is not
effective due to the absence of PSCs.
D. Cosmic rays, PSCs and polar stratospheric temperature
There is also strong interest in studying the effects of CRs on cloud cover at low troposphere
( 3km) and PSCs in the lower polar stratosphere, following the first report of the correlation
between CRs and cloud cover by Svensmark and Friis-Christensen [114]. There are a number of

AC
CE
PTE
DM
AN
US
CR
IPT
ACCEPTED MANUSCRIPT
– 32 –
observational studies and model simulations to investigate the physical mechanism for the
correlation [115, 116]. The CR-cloud correlation has been reviewed by Carslaw et al. [117].
Since then, other researchers have reported both positive [118] and negative [119, 120] results
about the correlation. Similarly, researchers have also studied the possible effects of CRs on the
formation of PSCs [121, 122]. One modeling study indicated that strong solar proton events may
significantly enhance the formation of large nitric acid trihydrate particles and denitrification
[121], while the other showed that “moderate” (May 1990) but not stronger solar proton events
may increase aerosol content significantly and cause ozone “mini-hole” creation [122]. Most
recently, simulations by Pierce and Adams [123] showed that changes in cloud condensation
nuclei concentrations from changes in CRs during a CR cycle are two orders of magnitude too
small to account for the observed changes in cloud properties. They hence concluded that the
CR-cloud effect is too small to play a significant role in current climate change [123]. In
contrast, Svensmark et al. [124] showed the correlation between CRs and atmospheric aerosols
and clouds. Overall, the direct CR-cloud (PSC) correlation remains the subject of significant
controversies.
It should be emphasized that apart from the direct effects of CRs on PSCs, the decrease in
amount of atmospheric ozone can cause significant climatic effects [125-127]. Less ozone in the
stratosphere implies less absorption of solar and infra-red radiation there and hence a cooler
stratosphere. Thus, significant ozone loss in the spring polar stratosphere has a feedback on the
temperature there, which could in turn affect the PSC formation. Ramaswamy et al. [127]
reported the stratospheric cooling effect over 1979-2003, where the non-monotonic decrease in
lower stratospheric temperature was attributed to the effect of volcanic eruptions. So far,

AC
CE
PTE
DM
AN
US
CR
IPT
ACCEPTED MANUSCRIPT
– 33 –
however, no long-term time correlation between CR intensity and polar stratospheric
temperature during any 11-year cycle has been reported.
V. NEW OBSERVATIONS
In spite of the laboratory measurements and observations summarized in Sections III and IV, one
might still argue that the other effects mentioned above (solar effect, direct CR effect, and PSCs)
might be responsible for the observed correlations between CR intensity and polar ozone loss.
Alternatively, one might argue that that the variations of total column ozone measured by
satellites might not reflect the real ozone loss caused by ozone-depleting reactions. To make a
clear case, 3-month mean total ozone data in the summer and spring polar area from both NASA
satellites and BAS ground-station measurements over Antarctica in the period of 1979 to 2008
are presented and all possible mechanisms are discussed below. Furthermore, the time-series
polar stratospheric cooling as a result of O3 loss at an Antarctic station (Halley) from 1956 to
2008 (over 50 years) is also presented. These observations not only provide an important
examination of the time correlation between polar O3 loss and CR intensity but show the
significant impacts of CFCs and CRE-driven ozone depletion on stratospheric climate change.
Moreover, the seasonal variations of CFCs and so-called trace gases (N2O and CH4) in the polar
stratosphere will also be presented and discussed.
A. Comparison between observed data with photochemical model
Due to the Montreal Protocol, the total halogen level in the lower atmosphere was measured to
peak in 1994 and the equivalent effective stratospheric chlorine (EESC) over the Antarctica was
estimated to peak around 2000 with a given delay of 6( 3) years [37]. To reduce the O3 data

AC
CE
PTE
DM
AN
US
CR
IPT
ACCEPTED MANUSCRIPT
– 34 –
uncertainty, the time series 3-month average zonal-mean total O3 variations in the polar
stratosphere at latitudes (60 -90 S) in the months of the Antarctic ozone hole, namely October,
November and December from 1979-2008, obtained from NASA TOMS satellite (N7, M3, EP
and OMI) datasets, are presented here. Note that most of the daily average ozone data in
September in the NASA satellite datasets only cover the latitudes (0-80 S) and the September
monthly average ozone data are therefore not included. As shown in Fig. 15(a), the 3-month
average O3 data have a much lower fluctuation level than the October monthly data shown in
Fig. 14 [15]. The data show that the Antarctic O3 decreased drastically from the end of 1970s to
1990, following the significant rise of the halogen loading in the stratosphere. The large El
Chichón volcanic eruption in 1982 ejected a large amount of sulfur gases into the stratosphere,
leading to unusually large fluctuations of the O3 data in 1980s. From 1990 to the present, the
polar total O3 has clearly exhibited a cyclic oscillation with a periodicity of 11 years. In contrast,
the O3 results predicted by the photochemical model simulations are shown in Fig. 15(b), which
predict that the Antarctic springtime O3 would recover (increase) by 5% to 10% between 2000
and 2020 [37]. This prediction is clearly inconsistent with the observed data. More evidently,
several photochemical modeling calculations have predicted a minimum Antarctic ozone hole in
2008-2009, which is exactly opposite to the observed fact. In fact, essentially no changes in the
stratospheric O3 layer over the Equator, where sunlight is the strongest, have been observed over
the past decades (Fig. 13(a)).
B. Confirmation of the 11-year cyclic ozone loss over spring Antarctica
Fig. 16(a) plots the time series variations of both CR intensity and the 3-month average zonal-
mean total O3 in the springtime Antarctic stratosphere (60 -90 S) over 1979 to 2008 from

AC
CE
PTE
DM
AN
US
CR
IPT
ACCEPTED MANUSCRIPT
– 35 –
NASA satellite datasets. Indeed, the springtime O3 loss data clearly exhibit a pronounced time
correlation with the CR intensity variation over the 11-year cycles from 1990s (more precisely
from 1995) up to the present. Although the NASA satellite data have been widely used in ozone
research, it might as well show other measured data sources. Thus, time series 3-month
(September-November) mean springtime ozone data obtained from the Antarctic ground-station
measurements at Halley (75°35'S, 26°36'W) from 1979-2008 are shown in Fig. 16(b). A quite
similar 11-year cyclic variation of the springtime ozone at the Antarctic station from 1995 up to
the present is again observed. Thus, these data now clearly establish that the ozone loss in the
Antarctic hole indeed shows an 11-year cyclic variation following the oscillation of the CR
intensity. From 1995 up to the present, the variation of the EESC in the polar stratosphere has
been much milder, passing the plateau (Fig. 15(a)). Thus, the total ozone oscillation caused by
the variations of CR intensity has become most pronounced.
Fig. 16(c) shows the available 2-month average zonal mean O3 in the summer Antarctic
stratosphere (60 -90 S) and 3-month (January-March) mean summer ozone data at Halley over
1979 to 2008. In striking contrast to the spring (Oct-Dec or Sept-Nov) total ozone, no such time
correlation exists between the zonal-mean total O3 in the summer polar stratosphere and the CR
intensity variation. These observed data clearly rule out both the solar cycle effect and the
direct CR effect responsible for the observed 11-year cyclic total ozone variation.
As a matter of fact, the observation of pronounced 11-year cyclic oscillations of the total O3
in the polar ozone hole has forced one to conclude that the CR-driven mechanism must play a
dominant role in the polar zone loss [15]. The reason is that the oscillation amplitude of the CR
intensity in the 11-year CR cycles is well-known to be only ~10% of its median, so that the

AC
CE
PTE
DM
AN
US
CR
IPT
ACCEPTED MANUSCRIPT
– 36 –
oscillation amplitude of the resulting polar ozone loss would be too small to observe, unless the
CR-driven mechanism play the dominant role.
C. Observation of 11-year cyclic stratospheric cooling due to ozone loss
To distinguish the temperature variations induced directly by CRs and indirectly by the CR-
driven O3 loss and to show if the decrease in total O3 reflects real chemical O3 loss, the
temperatures at the lower Antarctic stratosphere (100 hPa) at Halley during the winters (June-
August, prior to the Antarctic O3 hole season), the later springs (November, after the O3 hole
peak) and the annuals over the past 50 years (1956-2008) are shown in Fig. 17. As shown in Fig.
17(a), the winter polar stratospheric temperature does not show a pronounced oscillation over
11-year CR cycles. In contrast, Fig. 17(b) shows that the polar stratospheric temperature in
November (just after the ozone-hole peak) exactly follows the total ozone there, showing strong
11-year cyclic variations. These strong oscillations are conveyed into the weaker oscillations in
annual mean polar total ozone and temperatures, as shown in Fig. 17(c). Note that the
temperature in the polar stratosphere prior to the ozone-hole season shows no significant time
correlation with the CR/solar intensity variation (Fig. 17a). This observation demonstrates that
neither the solar cycle effect nor the pure CR effect (without involving ozone loss) is responsible
for the present observation of 11-year cyclic stratospheric cooling.
Moreover, it is strikingly shown in the Fig. 18 that the lower stratospheric temperatures over
the Halley station in November and annual exhibit excellent linear dependences on total ozone
there over the past 50 and 30 years, respectively. Even the linear fits give very high correlation
coefficients R=0.94 and R=0.89, respectively, with the probability (that R is zero) P<0.0001.
These data (Figs. 17 and 18) clearly demonstrate that the long-term temperature change in the

AC
CE
PTE
DM
AN
US
CR
IPT
ACCEPTED MANUSCRIPT
– 37 –
lower polar stratosphere is solely dependent on the variation of total ozone; both exhibit
pronounced 11-year cyclic variations. This is clearly in contrast to the previous attribution of the
non-monotonic decrease in the stratospheric temperature to the effect of volcanic eruptions [127]
or to the effects of non-CFC greenhouse gases [37]. The present observations provide strong
evidence that the CRE-driven polar ozone loss results in a subsequent 11-year cyclic
stratospheric cooling. The stratospheric cooling will affect the polar stratospheric temperature
and associated formation of PSCs in the subsequent year. This could cause a feedback effect on
ozone depletion, as shown in the CRE modeling described in Section VI.
D. Seasonal variations of CFCs, N2O and CH4
In current content of atmospheric chemistry, “air descending” is attributed to be responsible for
the concentration decreases of CFCs and some photo-inactive “tracer” gases such as N2O and
CH4, and thus any physical/chemical processes for CFCs are excluded for the winter polar
stratosphere [37, 128]. However, two major problems with this assignment must be addressed.
First, one must make sure whether DEA/DET processes could occur for these so-called “trace”
molecules and whether the radicals resulted from the DEA/DET reactions of CFCs could react
with these “trace” molecules. For example, N2O has been used as the standard “trace” gas in
atmospheric chemistry because it is photo-inactive. This assignment would be valid only if there
were no physical or chemical processes leading to the loss of N2O in the polar stratosphere.
Unfortunately, just similar to CFCs, N2O is well-known to have strong DEA resonances at low
electron energies at 0.6 and 2.3 eV with an energy threshold of 0.21 eV in the gas phase [129,
130]. The later is expected to be 1.1 eV on the surface of H2O ice due to the polarization
potential of ~1.3 eV [30], and hence DET should occur for N2O on ice. Indeed, there is solid

AC
CE
PTE
DM
AN
US
CR
IPT
ACCEPTED MANUSCRIPT
– 38 –
evidence that DET of N2O can effectively occur with weakly bound electrons, e.g., photoexcited
subvacuum hot electrons [131], electrons from Cs-covered surfaces with work-functions of 1.7-
2.2 eV [132] or photoassisted Li atoms in the Li-N2O complex [133]. Even the latter study
showed the reaction of CH4 with O or O(1D) resulted from the DET of N2O, and similar
reactions might also occur with the DET products of chlorine-containing molecules (CFCs).
Nevertheless, it should also be noted that DET of weakly-bound electrons in PSC ice with CH4
itself is not expected to occur since CH4 does not have a DEA resonance at low electron energies
below 5 eV in the gas phase [134]. Thus, CH4 might be a better “trace” gas than N2O, though its
absolute inertness is not guaranteed for the above reason.
Second, the “compact” CFC-N2O correlation from the satellite or balloon data taken in
September has been used to support the photochemical model of ozone depletion. However, one
should note that September is in spring (rather than in winter), when the O3 hole has formed.
The result cannot be taken as the valid evidence to exclude the CR-driven electron reactions of
halogenated molecules in the polar stratosphere in winter. Here, the observed monthly average
CH4 data combining the data from both the Cryogenic Limb Array Etalon Spectrometer
(CLAES) and Halogen Occultation Experiment (HALOE) aboard the NASA Upper Atmosphere
Research Satellite (UARS) and spanning over the winters of 1992 1998, and the CF2Cl2 data
over the winter of 1992 from the CLAES are shown in Fig. 19. It can be clearly seen that until
the end of winter (August), the CH4 level significantly dropped at the higher polar stratosphere
above 20 km, but this did not occur in the lower Antarctic stratosphere below 20 km. This is
contrast to the CF2Cl2 level that decreased from ~320 in April to 200 pptv in August and 160
pptv in September. These data indicate that DET reactions of CFCs must have occurred in the
winter lower polar stratosphere where and when there is no sunlight. Just like stratospheric

AC
CE
PTE
DM
AN
US
CR
IPT
ACCEPTED MANUSCRIPT
– 39 –
cooling (Fig. 17), air descending (the CH4 level drop) in the lower polar stratosphere below 20
km in spring is a consequence, rather than a cause, of the spring ozone hole.
Atmospheric chemists have concerns about how CFCs and other halogenated molecules
could be adsorbed on ice particles in PSCs [128]. However, it is known to surface scientists that
although CFCs are not sticky to the static surfaces of H2O ice at the stratospheric temperature
under the vacuum condition, dynamical and other physical properties of ice surfaces under polar
stratospheric conditions can make a drastic difference, causing adsorption, diffusion and trapping
of molecules into ice. This subject was reviewed recently by Girardet and Toubin [135].
Experimental studies [136, 137] showed that the interactions of CF2Cl2 molecules with
crystalline and amorphous water films are rather complicated. Most recently, Souda [137]
concluded that the interactions of CF2Cl2 with ice surfaces are significantly different from that
with an inert (static) graphite substrate; CF2Cl2 molecules do not simply physisorb on the surface
of ice and might be incorporated into the bulk of the amorphous ice film at temperatures 57 K.
Further laboratory studies on the adsorption, diffusion and trapping of CFCs at ice surfaces
under the polar stratospheric conditions seem necessary.
VI. TOWARDS QUANTITATIVE UNDERSTANDING OF OZONE DEPLETION
The CRE mechanism states that in the winter polar stratosphere, the O3-depleting reactions
depend on halogen concentrations (EESC), the intensity I of CRs to produce electrons and the
amount of PSCs to trap the electrons [14, 15]. Thus, the CRE mechanism, taking the
stratospheric cooling caused by the preceding-year polar ozone loss into account, gives the
steady-state total ozone ([O3]i) in the Antarctic in a particular period in spring (i) as:

AC
CE
PTE
DM
AN
US
CR
IPT
ACCEPTED MANUSCRIPT
– 40 –
]1[][][ 1033 iiii EESCIIkOO , (7)
where [O3]0 is the total ozone in the polar stratosphere when EESC=0 ( 310 and 375 DU for the
October and 3-month (Oct-Dec) average zonal mean total O3), Ii the CR intensity in the ith year
and k a constant. In Eq. (7), it is simply assumed that the photolysis of halogens in the spring
polar stratosphere is not a limiting factor. With the measured CR intensities, it is strikingly
shown in Figs. 16(a), 16(b), 17(b) and 17(c) that Eq. (7) gives good fits to the observed ozone
data from 1950s to 2008. Indeed, we can see that the CRE model gives the maximum O3 losses
in 1987 and 1998, in agreement with the observed data. Remarkably, the simplified CRE model
expressed in Eq. (7) is by no means aimed to give a precise calculation of total ozone in the polar
stratosphere, but rather to give an approximate envelope of the long-term total ozone change.
Surprizingly, the fitted results demonstrate that the CRE model as the sole mechanism can
reproduce the observed data pretty well. In the earlier paper [15], a linear dependence of
monthly average zonal-mean total O3 on the CR intensity from 1990-2007 was fitted. But there
were severe limitations to the linear fitting: it could only give a poor fit to the observed data in a
short period of time (from 1990-2007), and could not give a good fit to the whole spectrum of
the observed data, particularly in the drastic O3-decreasing period of 1979-1990. This is
drastically different from the nearly quadratic dependence revealed in Eq. (7), which can now
give fairly good fits to all the observed data from 1950s to 2008.
VII. FUTURE TREND OF THE OZONE HOLE
The intensity of cosmic rays is still peaking in 2009, so we should expect to observe one of the
deepest ozone holes over the spring Antarctica in 2009~2010. With the measured I08=10132 for

AC
CE
PTE
DM
AN
US
CR
IPT
ACCEPTED MANUSCRIPT
– 41 –
2008, Eq.(7) gives the total ozone ratio [O3]08/[O3]0=59.2% in the spring Antarctic ozone hole,
which is very close to the observed value of 60.6% for 3-month (October-December) average
zonal-mean total ozone over the Antarctica (60-90 S) from NASA OMI satellite. With
I09=10455 as of June 30, 2009, Eq.(7) predicts a variation [O3]09/[O3]0 58.5% for the total O3 in
the spring Antarctic ozone hole in 2009. This value is therefore predicted to be nearly identical
to the lowest record of [O3]98/[O3]0=58.7% observed in 1998. Similarly, the CRE model will
predict the 3-month (October-December) average zonal-mean total O3 values over the Antarctica
(60-90 S) in 2009 to be 219 5 DU. Note that although the 2006 Antarctic ozone hole made a
record of ~181 DU in the October average zonal-mean total O3, the observed 3-month average
zonal-mean total O3 in 2006 was ~225 DU, lightly larger than ~220 DU observed in 1998 in the
NASA TOMS satellite data. Thus, we expect to see one of the deepest O3 holes in spring 2009,
which may also occur for spring 2010, depending on the CR-intensity variation and polar
meteorological conditions.
With the CRE mechanism, one should be able to predict the future trend of the ozone hole.
The intensity variation of CRs with an average periodicity of 11 years and its oscillation
amplitude of ~10% are well known. Thus, the time series CR intensity can be expressed as
,)](11
2sin[%101 00 iiII ii (8)
where Ii0 is the median CR intensity in an 11-year cycle. Note that Ii0 in recent CR cycles has an
increasing rate of ~2% per 11-year cycle. As shown in Fig. 20(a), the best fit to all the CR data
observed at the Antarctica (McMurdo) from 1960s-2009 yields Ii0=8800[1+2%(i-1979)/11]. The

AC
CE
PTE
DM
AN
US
CR
IPT
ACCEPTED MANUSCRIPT
– 42 –
estimated EESC data for the future are available from the WMO Report [37], as shown in Fig.
20(b). The theoretical results of total O3 in the spring Antarctic stratosphere for 1979-2060
given by Eqs. (7) and (8), with respect to [O3]0, are shown in Fig. 20(c). Interestingly, the
calculated data agree very well with the observed data, and a clear cyclic variation of O3 loss in
the Antarctic hole is predicted. The CRE model predicts another deepest O3 hole around 2020,
as shown in Fig. 20(c). Although atmospheric dynamics and meteorological conditions could
cause large total O3 fluctuations from year to year [37], a long-term trend of the polar O3 loss is
predictable.
The future trend of the O3 hole will depends on not only the halogen loading in the
stratosphere but the variation of CRs. According to the CRE mechanism expressed in Eq. (7),
the depletion of total ozone has a nearly quadratic dependence on the CR intensity Ii. If the
mean CR intensity keeps the same variation trend as in the past three CR cycles from 1965 to the
present and the EESC follows the decreasing trend currently projected by recent WMO Report
[37], then there will still be total ozone loss of approximately 25% by 2065 even when the EESC
drops to the 1980 value and of ~15% by 2100. This means that the complete recovery of the
Antarctic O3 hole would not occur even by the end of this century. This estimation certainly
depends on the variation trends of the CR intensity and stratospheric halogen concentrations.
VIII. EFFECTS OF CFCS AND CRE-DRIVEN OZONE DEPLETION ON GLOBAL
CLIMATE CHANGE
It is also interesting to note that CFCs and CRE-driven stratospheric ozone depletion can have
significant effects on not only stratospheric but global climate [138, 139]. There are two
opposing effects of stratospheric ozone loss: it causes less absorption of solar radiation there and

AC
CE
PTE
DM
AN
US
CR
IPT
ACCEPTED MANUSCRIPT
– 43 –
hence a cooler stratosphere but a warmer troposphere; the resulting colder stratosphere emits less
long-wave radiation downward, thus cooling the troposphere. It has been concluded that overall,
the cooling effect of ozone depletion dominates. The observed stratospheric ozone depletion
over the past two decades has caused a negative forcing of the surface-troposphere system of
about 0.15 ± 0.10 W/m² [139]. Moreover, ozone-depleting molecules (particularly CFCs)
themselves are also well-known greenhouse gases [138, 139]. The IPCC concludes that the
increases in concentrations of these chemicals have produced 0.33 ± 0.03 W/m² of radiative
forcing, representing about 13% of the total radiative forcing from increases in the
concentrations of well-mixed greenhouse gases [139]. However, these conclusions were based
on climate model simulations, rather than direct observations. Thus, direct observations of the
effects of CFCs and CR-driven ozone depletion on global climate may have far-reaching
significance.
Although the IPCC has concluded that CO2 is major culprit for surface global warming, it is
still the subject of great controversies. The data shown in Figs 17 and 18 indicate that CFCs and
CRE-driven ozone depletion strongly affect the climate in the polar region, while non-CFC
greenhouse gases play a negligible role. Furthermore, the severe polar ozone depletion also
substantially affects global ozone (60°S-60°N), especially in the mid-latitudes, where the air
mixes more readily with ozone-depleted air from the poles. The extent of the contribution of
polar ozone depletion to midlatitude ozone depletion is estimated to be about one-third in the
Northern Hemisphere and one-half in the Southern Hemisphere [37]. The larger contribution in
the Southern Hemisphere is due to the larger polar ozone depletion in the Antarctic relative to
the Arctic region. At present, the globe stratospheric ozone is about 4% below the pre-1980
average, while total ozone loss has reached 3% in the Northern Hemisphere and around 6% in

AC
CE
PTE
DM
AN
US
CR
IPT
ACCEPTED MANUSCRIPT
– 44 –
the Southern Hemisphere since 1980 [37]. Although a few percent depletion of global
stratospheric ozone may have a limited effect on global surface temperature, CFCs are well-
known effective greenhouse gases [138, 139]. It is therefore significant to have more careful
studies of the effects of CFCs and CRE-driven ozone depletion on global climate. For this
purpose, the southern hemisphere (SH), northern hemisphere (NH) and global surface
temperatures are plotted together with the EESC from 1850 to 2009 in Fig. 21. The EESC data
prior to 1970 were not measured [37] and were hence calculated by extrapolating the observed
data of 1970-1980, assuming an identical growth rate. Strikingly, it is shown that except the
short-period large fluctuations, the SH, NH and global surface temperatures did not rise
appreciably (within 0.1 oC) from 1850 to 1950, during which period CO2 was the dominant
greenhouse gas and increased linearly. In contrast, all of the surface temperatures started to
increase around 1950, when the EESC started to be significant. Since then, the surface
temperatures closely followed the variation trend of the EESC and increased by ~0.15 oC/decade
from 1950 to 2002~2005. Remarkably, the EESC has been estimated to peak in the stratosphere
around 2000 by assuming a delay of 6 years with a width of 3 years from the peak in 1994
measured at the surface [37]. Correspondingly, the observed SH, NH, global surface
temperatures have a turnover in 2002, 2005 and 2005, respectively, and have clearly decreased
by 0.22, 0.15 and 0.16 oC to 2008, respectively. In contrast, the CO2 level has kept increasing
with the highest rate [139]. Most strikingly, it is found that the observed global surface
temperature variations T (relative to the 1980 value) have an excellent linear dependence on the
EESC values (normalized to the 1980 value), as shown in Fig. 22(a). A relationship,
T= 0.31+0.30 EESC (oC) with a correlation coefficient R as high as 0.89 and the probability
(R=0) P<0.0001, is obtained from the linear fit. As shown in Fig. 22(b), moreover, the time-
AC
CE
PTE
DM
AN
US
CR
IPT
ACCEPTED MANUSCRIPT
– 45 –
series data also exhibit weak but visible 11-year cyclic oscillations in the surface temperatures,
following the 11-year CR cycles. These data strongly indicate that global temperature has been
dominantly controlled by the level of CFCs, modulated by the CR-driven ozone depletion over
the past century. There are two reasons for the observed faster SH temperature drops since
2002. First, the greenhouse effect of CFCs decreases due to the drops of CFC concentrations in
the stratosphere. Second, the observed enlarged ozone depletion in the Antarctic stratosphere
from 2002 up to the present due to the rising CR intensity [15] has led to enhanced cooling in the
surface. Both effects could lead to the rapid surface temperature decrease. The observed data
from 1850 up to the present, as shown in Figs. 21 and 22, seem to indicate that CFCs conspired
with CRs are the major culprits for not only atmospheric ozone depletion but global warming.
The CRE-driven ozone depletion is expected to decrease after 2010 due to the CR cycles, but the
EESC will keep decreasing, as shown in Fig. 22(b). If the above observation is confirmed, then
we expect to observe a continued decrease in global surface temperature—“global cooling”.
That is, global warming observed in the late 20th century may be reversed with the coming
decades. Indeed, global cooling may have started since 2002, based on the observed data shown
in Figs. 21 and 22. This could be very important to the Earth and humans in the 21st century. It
certainly deserves for further examinations and studies.
IX. CONCLUSIONS
Laboratory measurements have well demonstrated that electrons can effectively be trapped at ice
surfaces and greatly enhance dissociative-electron-transfer reactions of halogenated species
(inorganic and organic) adsorbed on the surfaces by orders of magnitude, compared with
corresponding gas-phase reactions. The experimental findings summarized in this study have

AC
CE
PTE
DM
AN
US
CR
IPT
ACCEPTED MANUSCRIPT
– 46 –
demonstrated three important features associated with these DET reactions: (1) ultrafast resonant
DET reactions of molecules with weakly-bound trapped electrons can occur; (2) the capture
probability of electrons by the molecules can be greatly enhanced due to the much longer
residence (life) times of electrons trapped in polar media than those of free electrons in the gas
phase and quasi-free electrons in non-polar media; and (3) once formed, the autodetachment of
the AB* transient state cannot occur, enhancing its dissociation probability. It has become clear
that these features lead to highly efficient DET reactions of halogenated molecules on ice.
It is a robust fact that there is the maximum ionization rate of cosmic rays to produce
electrons in the lower polar stratosphere at ~18 km, where ice particles in PSCs are well-known
to present in winter. And it is also well-known that CFCs and other halogenated molecules
(HCl, ClONO2, etc.) have high concentrations in the lower polar stratosphere in the beginning of
winter, which were observed to decrease greatly by the end of winter. A careful analysis of the
concentration variations of these halogenated molecules and CH4 over the seasons from the fall
to the spring indicates that the drops of these halogenated molecules in the winter polar
stratosphere below 20 km cannot be attributed to “air descending”, which actually becomes
significant only after the ozone hole has been formed in spring. Moreover, the observed ozone
data do not agree with the predictions from the standard photochemical models (Fig. 15). Since
it is dark (there is no sunlight) in the winter lower polar stratosphere and heterogeneous chemical
reactions cannot occur for CFCs and HCFCs on ice surfaces, it seems that the CR-driven
dissociative electron transfer reaction is the only mechanism for the reactions of these molecules
in the winter lower polar stratosphere at altitudes below 20 km, where the ozone hole evolves in
the spring. Although heterogeneous chemical reactions of ClONO2 with HCl on PSC ice are not

AC
CE
PTE
DM
AN
US
CR
IPT
ACCEPTED MANUSCRIPT
– 47 –
ruled out in the CRE model, the CR-driven dissociative-electron-transfer reaction of ClONO2 is
expected to be highly efficient, no less than those of CFCs, HCl and HCFCs.
Strong spatial and time correlations between CR intensity and polar ozone loss have now
been clearly established, and both the direct solar effect and the pure CR effect have been ruled
out for these correlations. Quantitative analyses of the 3-month average zonal mean ozone in the
springtime polar area from both NASA satellites and ground-station measurements over
Antarctica in the period of 1979 to 2008 have provided a reasonable proof of the CRE
mechanism. A simplified equation derived by the CRE mechanism reproduces not only an 11-
year cyclic variation of ozone loss but a similar cyclic stratospheric cooling in the polar lower
stratosphere from 1956 to 2008. These observed data do not agree with the predictions of the
standard photochemical model [37]. Without doubts, atmospheric dynamics and meteorological
conditions could influence the CRE-induced reactions and lead to significant fluctuations of total
ozone in the polar ozone hole in some years. However, it is reasonable to conclude that the CR-
driven DET is the dominant mechanism for activation of photo-inactive halogenated molecules
into reactive halogens in the winter lower polar stratosphere. And the observed satellite data
have demonstrated that the CRE mechanism plays the dominant role in forming the ozone hole
in the spring polar stratosphere.
Due to the increasing trend of the CR intensity, the recovery of the ozone hole may be
significantly delayed; the full recovery might not occur even by the end of this century. The
observations summarized in this study seem to indicate that researchers have to reconsider our
understanding of the formation of the Antarctic ozone hole. Mounting observations should
allow researchers to reach a consensus on the CRE model in the near future.

AC
CE
PTE
DM
AN
US
CR
IPT
ACCEPTED MANUSCRIPT
– 48 –
Moreover, this review has also shown that CRE-driven polar O3 loss leads to an 11-year
cyclic stratospheric cooling over the past 50 years. The observed data demonstrate that the long-
term change of polar stratospheric temperature over Antarctica depends solely on the variation of
total ozone, indicating that the effect of greenhouse gases plays a negligible role in the
stratospheric cooling over the past five decades. Most strikingly, it is also found that global
surface temperature change has an excellent linear dependence on the equivalent effective
stratospheric chlorine (EESC). And weak but visible 11-year cyclic oscillations in the surface
temperatures are also observed to follow the 11-year CR cycles. These observed data point to
the possibility that the global warming observed in the late 20th century was dominantly caused
by CFCs, modulated by CRE-driven ozone depletion. With the decreasing emission of CFCs
into atmosphere, global cooling may have started since 2002. These observations imply that
current climate models may underestimate the effects of CFCs and would have to be revised
seriously. This is likely a subject deserving to look at closely.
Finally, the DET mechanism addressed in this study may have fundamental and practical
significance in many multidisciplinary areas, no limit to the applications in biotechnology, e.g.,
for the analysis of human milk triacylglycerols [81] human blood [82] and proteins [140], in
disposal of environmentally hazardous halogenated materials [84, 85], and in the activation of
anticancer drugs [21-23] and the fundamental understandings of molecular pathways leading to
DNA damage and cell death relevant to aging, stroke and cancer and their treatments [24]. For
instance, it was recently found by Lu [23] that the DET reaction of cisplatin—the most widely
used drug for cancer treatment—with prehydrated electrons generated in a biological
environment can greatly enhance the therapeutic efficacy of cisplatin in combination with
ionizing radiation. The DET mechanism reviewed in this study sheds light on the principle for

AC
CE
PTE
DM
AN
US
CR
IPT
ACCEPTED MANUSCRIPT
– 49 –
these applications. Furthermore, the DET reaction mechanism involving electron trapping in
polar media (particularly H2O) may have far-reaching significance in biological and
environmental systems, in which water is the major constituent.
ACKNOWLEDGEMENTS
NASA satellite datasets were obtained from http://toms.gsfc.nasa.gov . The O3 data at Halley
were obtained from the BAS (http://www.antarctica.ac.uk/met/jds/ozone/), credited to Dr. J. D.
Shanklin. Cosmic ray data at McMurdo were obtained from the Bartol Research Institute,
supported by NSF grant ATM-0527878, http://neutronm.bartol.udel.edu. The CH4 and CF2Cl2
data in the stratosphere were obtained from the NASA Goddard Space Flight Center (GDFC)
CLAES and HALOE datasets. The southern hemisphere (SH), northern hemisphere (NH) and
global surface temperatures were obtained from the Climatic Research Unit of the School of
Environmental Sciences, University of East Anglia: the HadCRUT3 version, combined land and
marine temperature anomalies on a 5° by 5° grid-box basis
(http://www.cru.uea.ac.uk/cru/data/temperature/). The author thanks the above-mentioned teams
for making the data available. This work is supported by the Canadian Institutes of Health
Research (CIHR) and Natural Science and Engineering Research Council of Canada (NSERC).
REFERENCES
[1] R. A. Marcus, Rev. Mod. Phys. 65 (1993) 599 (Nobel Lecture).
[2] A. M. Kuznetsov, Charge Transfer in Physics, Chemistry and Biology (OPA, Amsterdam
B.V., 1995).

AC
CE
PTE
DM
AN
US
CR
IPT
ACCEPTED MANUSCRIPT
– 50 –
[3] X. Y. Zhu, Ann. Rev. Phys. Chem. 53 (2002) 221; C. D. Lindstrom and X. Y. Zhu, Chem.
Rev. 106 (2006) 4281.
[4] S. Larsson, J. Am. Chem. Soc. 103 (1981) 4034.
[5] R. E. Johnson, Energetic Charge-Particles Interactions with Atmospheres and Surfaces,
Physics and Chemistry in Space Planetology, Vol. 19 (Springer-Verlag, Berlin, 1990).
[6] A. Chutjian, A. Garscadden and J. M. Wadehra, Phys. Report 264 (1996) 393.
[7] B. M. Nestmann, S. V. K. Kumar and S. D. Peyerimhoff, Phys. Rev. A 71 (2005) 012705.
[8] R. N. Compton, in The role of Rydberg States in Spectroscopy and Photochemistry, edited by
C. Sándorfy, (Kluwer Academic Publishers, Netherlands, 1999) p419.
[9] St.-J. Dixon-Warren, E. T. Jensen and J. C. Polanyi, Phys. Rev. Lett. 67 (1991) 2395.
[10] St.-J. Dixon-Warren, E. T. Jensen and J. C. Polanyi, J. Chem. Phys. 98 (1993) 5938.
[11] Q.-B. Lu and T. E. Madey, Phys. Rev. Lett. 82 (1999) 4122.
[12] Q.-B. Lu and T. E. Madey, J. Chem. Phys.111 (1999) 2861.
[13] Q.-B. Lu and L. Sanche, Phys. Rev. B63 (2001) 153403.
[14] Q.-B. Lu and L. Sanche, Phys. Rev. Lett. 87 (2001) 078501.
[15] Q.-B. Lu, Phys. Rev. Lett. 102 (2009) 118501.
[16] S. Ryu, J. Chang, H. Kwon and S. K. Kim, J. Am. Chem. Soc. 128 (2006) 3500.
[17] M. Bertin, M. Meyer, J. Stähler, C. Gahl, M. Wolf and U. Bovensiepen, Faraday Discuss.
141 (2009) 293.
[18] N. Camillone, K. A. Khan, J. A. Yarmoff and R. M. Osgood, Phys. Rev. Lett. 87 (2001)
056101.
[19] P. Y. Cheng, D. P. Zhong and A. H. Zewail, J. Chem. Phys. 103 (1995) 5153.
[20] D. P. Zhong and A. H. Zewail, Proc. Natl. Acad. Sci. USA 96 (1999) 2602.
AC
CE
PTE
DM
AN
US
CR
IPT
ACCEPTED MANUSCRIPT
– 51 –
[21] C.-R. Wang and Q.-B. Lu, Angew. Chem. Intl. Ed. 46 (2007) 6316.
[22] Q.-B. Lu, S. Kalantari and C.-R. Wang, Mol. Pharmaceutics 4 (2007) 624.
[23] Q.-B. Lu, J. Med. Chem. 50 (2007) 2601.
[24] C.-R.Wang, J. Nguyen and Q.-B. Lu, J. Am. Chem. Soc. 131 (2009) 11320.
[25] G. J. Schulz, Rev. Mod. Phys. 45 (1973) 423.
[26] L. Sanche, Scanning Micros. 9 (1995) 619.
[27] C.-R. Wang, A. Hu and Q.-B. Lu, J. Chem. Phys. 124 (2006) 241102.
[28] C. R. Wang, T. Luo and Q.-B. Lu, Phys. Chem. Chem. Phys. 10 (2008) 4463.
[29] C.-R. Wang, K. Drew, T. Luo, M.-J. Lu and Q.-B. Lu, J. Chem. Phys. 128 (2008) 041102.
[30] Q.-B. Lu, A. D. Bass and L. Sanche, Phys. Rev. Lett. 88 (2002) 147601.
[31] L. G. Christophorou, D.L. McCorkle and A. A. Christodoulides, in Electron-Molecule
Interactions and Their Applications, Edited by L. G. Christophorou, Vol. 1 (Academic Press,
Orlando,1984), chap. 6.
[32] E. Illenberger, H.-U. Scheunemann and H. Baumgärtel, Ber. Bunsenges. Physik. Chem. 82
(1978) 1154; Chem. Phys. 37 (1979) 21.
[33] S. D. Peyerimhoff and R. J. Buenker, Chem. Phys. Lett. 65 (1979) 434.
[34] M. Lewerenz, B. Nestmann, P. J. Bruna and S. D. Peyerimhoff, J. Mol. Struct. 123 (1985)
329.
[35] D. Smith and N. G. Adams, Top. Curr. Chem. 89 (1980) 1.
[36] D. G. Torr, in The Photochemistry of Atmospheres, Edited by J. S. Levine, (Academic Press,
Orlando,1985), chap. 5.
AC
CE
PTE
DM
AN
US
CR
IPT
ACCEPTED MANUSCRIPT
– 52 –
[37] World Meteorological Organization (WMO) Scientific Assessment of Ozone Depletion:
2006, (Global Ozone Research and Monitoring Project-Report No. 50, Geneva, Switzerland,
2007).
[38] C. T. McElroy and P. F. Fogal, Atmos.-Ocean 46 (2008) 15.
[39] E. Dupuy, K. A. Walker, J. Kar, C. D. Boone, C. T. McElroy, P. F. Bernath, et al., Atmos.
Chem. Phys. 9 (2009) 287.
[40] M. J. Molina and F. S. Rowland, Nature 249 (1974) 810.
[41] P. J. Crutzen, J. Geophys. Res. 30 (1971) 7311.
[42] J. C. Farman, B. G. Gardiner, and J. D. Shanklin, Nature 315 (1985) 207.
[43] S. Solomon, Nature 347 (1990) 347.
[44] O. B. Toon and R. P. Turco, Sci. Am. 264 (1991) 68.
[45] G. P. Brasseur, J. J. Orlando and G. S. Tyndall, Ed., Atmospheric Chemistry and Global
Change, Oxford University Press (New York, 1999).
[46] M. Akbulut, N. J. Sack and T. E. Madey, Surf. Sci. Report 28 (1997) 177.
[47] W. Weyl, Ann. Phys. (Leipzig) 197 (1863) 601.
[48] J. W. Boag and E. J. Hart, Nature 197 (1963) 45.
[49] A. Migus, Y. Gauduel, J. L. Martin, and A. Antonetti, Phys. Rev. Lett. 58 (1987) 1559.
[50] P. J. Rossky and J. Schnitker, J. Phys. Chem. 92 (1988) 4277.
[51] F. H. Long, H. Lu and K. B. Eisenthal, Phys. Rev. Lett. 64(1990) 1469.
[52] T. Goulet, A. Bernas, C. Ferradini and J.-P. Jay-Gerin, Chem. Phys. Lett. 170 (1990) 492.
[53] E. Neria, A. Nitzan, R. N. Barnett and U. Landman, Phys. Rev. Lett. 67 (1991) 1011.
[54] C. Silva, P. K. Walhout, K.Yokoyama and P. F. Barbara, Phy. Rev. Lett. 80 (1998) 1086.
[55] M. Armbruster, H. Haberland and H.-G. Schindler, Phys. Rev. Lett. 47 (1981) 323.

AC
CE
PTE
DM
AN
US
CR
IPT
ACCEPTED MANUSCRIPT
– 53 –
[56] J. V. Coe, G. H. Lee, J. G. Eaton, S. T. Arnold, H. W. Sarkas, C. Ludewigt, H. Haberland,
D. R. Worsnop and K. H. Bowen, J. Chem. Phys. 92 (1990) 3980.
[57] K. W. Oum, M. J. Lakin, D. O. DeHaan, T. Brauers, and B. J. Finlayson-Pitts, Science 279
(1998) 74.
[58] R. Laenen, T. Roth and A. Laubereau, Phys. Rev. Lett. 85 (2000) 50.
[59] P. Kambhampati, D. H. Son, T. K. Kee and P. F. Barbara, J. Phys. Chem. A 106 (2002)
2374.
[60] M. S. Pshenichnikov, A. Baltuska and D. A. Wiersma, Chem. Phys. Lett. 389 (2004) 171.
[61] R. E. Larsen, M. J. Bedard-Hearn and B. J. Schwartz, J. Phys. Chem. B. 110 (2006) 20055.
[62] D. Borgis, P. J. Rossky and L. Turi, J. Chem. Phys. 127 (2007) 174508.
[63] F. Baletto, C. Cavazzoni and S. Scandolo, Phys. Rev. Lett. 95 (2005) 176801.
[64] C. Gahl, U. Bovensiepen, C. Frischkorn and M. Wolf, Phys. Rev. Lett. 89 (2002) 107402.
[65] K. Onda, B. Li, J. Zhao, K. D. Jordan, J. Yang and H. Petek, Science 308 (2005) 1154.
[66] M. Meyer, J. Stähler, D. O. Kusmierek, M. Wolf and U. Bovensiepen, Phys. Chem. Chem.
Phys. 10 (2008) 4932.
[67] U. Bovensiepen, C. Gahl, J. Stähler, M. Bockstedte, M. Meyer, F. Baletto, S. Scandolo, X.-
Y. Zhu, A. Rubio and M. Wolf, J. Phys. Chem. C 113 (2009) 979.
[68] A. E. Bragg, J. R. R. Verlet, A. Kammrath, O. Cheshnovsky and D. M. Neumark, Science
306 (2004) 669.
[69] D. H. Paik, I. R. Lee, D. S. Yang, J. S. Baskin and A. H. Zewail, Science 306 (2004) 672.
[70] J. R. R. Verlet, A. E. Bragg, A. Kammarath, O. Cheshnovsky and D. M. Neumark, Science
307 (2005) 93.
[71] L. Turi, W. S. Sheu and P. J. Rossky, Science 309 (2005) 914.

AC
CE
PTE
DM
AN
US
CR
IPT
ACCEPTED MANUSCRIPT
– 54 –
[72] T. Sommerfeld and K. D. Jordan, J. Am. Chem. Soc. 128 (2006) 5828.
[73] J. V. Coe, S. T. Arnold, J. G. Eaton, G. H. Lee and K. H. Bowen, J. Chem. Phys. 125
(2006) 014315.
[74] C. W. Luo, Y. T. Wang, F. W. Chen, H. C. Shih anf T. Kobayashi, Opt. Express 17 (2009)
11321.
[75] Q.-B. Lu, Z. Ma and T. E. Madey, Phys. Rev. B58 (1998) 16446.
[76] T. E. Madey, S. A. Joyce, A. L. Johnson and J. A. Yarmoff, in Desorption Induced by
Electronic Transitions DIET IV, edited by G. Betz and P. Varga, Springer Series in Surface
Sciences, Vol. 19 (Springer, Berlin, 1990) 176.
[77] T. L. Gilton, C. P. Dehnbostel and J. P. Cowin, J. Chem. Phys. 91 (1989) 1937.
[78] D. Chakarov and B. Kasemo, Phys. Rev. Lett. 81 (1998) 5181.
[79] Q.-B. Lu and T. E. Madey, Surf. Sci. 451 (2000) 238.
[80] Q.-B. Lu and T. E. Madey, J. Phys. Chem. B105 (2001) 2779.
[81] E. P. Marsh, T. L. Gilton, W. Meier, M. R. Schneider and J. P. Cowin, Phys. Rev. Lett. 61
(1988) 2725.
[82] J. G. Currie and H. Kallio, Lipids 28 (1993) 217.
[83] R. Chaler, R. Vilanova, M. Santiago-Silva, P. Fernandez, J. O. Grimalt, J. Chromatogr. A
823 (1998) 73.
[84] A. Oku, K. Kimura and M. Sato, Chem. Lett. (1988) 1789.
[85] K. Mackenzie, F.-D. Kopinke and M. Remmler, Chemosphere 33 (1996) 1495.
[86] J. Langer, S. Matt, M. Meinke, P. Tegeder, A. Stamatovic and E. Illenberger, J. Chem.
Phys. 113 (2000) 11063.
[87] S. Solovev, D. O. Kusmierek and T. E. Madey, J. Chem. Phys. 120 (2004) 968.
AC
CE
PTE
DM
AN
US
CR
IPT
ACCEPTED MANUSCRIPT
– 55 –
[88] Q.-B. Lu and L. Sanche, J. Chem. Phys. 115 (2001) 5711.
[89] Q.-B. Lu and L. Sanche, J. Chem. Phys. 119 (2003) 2658.
[90] Q.-B. Lu and L. Sanche, J. Chem. Phys. 120 (2004) 2434.
[91] R. Marsolais, M., Deschênes and L. Sanche, Rev. Sci. Instrum. 60 (1989) 2724.
[92] I. I. Fabrikant, J. Phys. B 27 (1994) 4325.
[93] I. I. Fabrikant, Phys. Rev. A76 (2007) 012902.
[94] J. M. Von Doren and J. McClellan, J. Chem. Phys. 105 (1996) 104.
[95] A. D. Bass, J. Gamache, L. Parenteau and L. Sanche, J. Phys. Chem. 99 (1995) 6123.
[96] J. C. Polanyi and A. H. Zewail, Acc. Chem. Res. 28 (1995) 119.
[97] A. H. Zewail, Angew. Chem. Int. Ed. 39 (2000) 2587 (Nobel Lecture).
[98] A. D. Bass, J. Gamache, P. Ayotte, and L. Sanche, J. Chem. Phys. 104 (1996) 4258.
[99] N. Nakayama, S. C. Wilson, L. E. Stadelmann, H. L. D. Lee, C. A. Cable and C. R.
Arumainayagam, J. Phys. Chem. B 108 (2004) 7950.
[100] A. D. Bass, C. R. Arumainayagam and L. Sanche, Int. J. Mass. Spectrom. 277 (2008) 251.
[101] A. J. Wagner, C. Vecitis and D. H. Fairbrother, J. Phys. Chem. B 106 (2002) 4432.
[102] C. C. Perry, G. M. Wolfe, A. J. Wagner, J. Torres, N. S. Faradzhev, T. E. Madey and D. H.
Fairbrother, J. Phys. Chem. B 107 (2003) 12740.
[103] N. S. Faradzhev, C. C. Perry, D. O. Kusmierek, D. H. Fairbrother and T. E. Madey, J.
Chem. Phys. 121 (2004) 8547.
[104] CRC Handbrook of Chemistry and Physics, 84th ed, edited by D. R. Lide (CRC Press,
Boston, 2003) p.12-131.
[105] H. Tachikawa, Phys. Chem. Chem. Phys. 10 (2008) 2200.
[106] H. Tachikawa and S. Abe, J. Chem. Phys. 126 (2007) 194310.

AC
CE
PTE
DM
AN
US
CR
IPT
ACCEPTED MANUSCRIPT
– 56 –
[107] P. K. Patra and M. Santhanam, Phys. Rev. Lett. 89 (2002) 219803.
[108] R. Müller, Phys. Rev. Lett. 91 (2003) 058502.
[109] R. Müller, J. Chem. Phys. 129 (2008) 027101.
[110] Q.-B. Lu and L. Sanche, Phys. Rev. Lett. 89 (2002) 219804.
[111] C.-R. Wang, K. Drew, T. Luo, M.-J. Lu and Q.-B. Lu, J. Chem. Phys. 129 (2008) 027102.
[112] M. A. Ruderman, H. M. Foley and J. W.Chamberlain, Science 192 (1976) 555.
[113] P. J. Crutzen, Science 189 (1975) 457.
[114] H. Svensmark and E. Friis-Christensen, J. Atmos. Sol.-Terr. Phys. 59 (1997) 1225.
[115] H. Svensmark, Phys. Rev. Lett. 81 (1998) 5027; N. D. Marsh and H. Svensmark, Phys.
Rev. Lett. 85 (2000) 5004.
[116] F. Q. Yu and R. P. Turco, J. Geophys. Res. 106 (2001) 4797.
[117] K. S. Carslaw, R. G. Harrison and J. Kirkby, Science 298 (2002) 1732.
[118] R. G. Harrison and D. B. Stephenson, Philos. T. R. Soc. A 462 (2006) 1221.
[119] B. Sun and R. S. Bradley, J. Geophys. Res. 107 (2002) 4211.
[120] J. E. Kristjánsson , C. W. Stjern, F. Stordal, A. M. Fjaeraa, G. Myhre and K. Jonasson,
Atmos. Chem. Phys. 8 (2008) 7373.
[121] F. Yu, Atmos. Chem. Phys. 4 (2004) 1037.
[122] E. A. Kasatkina1 and O. I. Shumilov, Annal. Geophys. 23 (2005) 675.
[123] J. R. Pierce and P. J. Adams, Geophys. Res. Lett. 36 (2009) L09820.
[124] H. Svensmark, T. Bondo and J. Svensmark, Geophys. Res. Lett. 36 (2009) L15101.
[125] V. Ramaswamy, M. D. Schwarzkopf and W. J.Randel, Nature 382 (1996) 616.
[126] N. P. Gillett and D. W. Thompson, Science 302 (2003) 273.

AC
CE
PTE
DM
AN
US
CR
IPT
ACCEPTED MANUSCRIPT
– 57 –
[127] V. Ramaswamy, M. D. Schwarzkopf, W. J. Randel, B. D. Santer, B. J. Soden and G. L.
Stenchikov, Science 311 (2006) 1138.
[128] N. R. P. Harris, J. C. Farman and D. W. Fahey, Phys. Rev. Lett. 89 (2002) 219801.
[129] J. M. Wareman, R. W. Fessenden and G. Barkale, J. Chem. Phys. 57 (1972) 2702.
[130] M. Allan and T. Skalicky, J. Phys. B 36 (2003 ) 3397.
[131] J. Kiss, D. Lennon, S. K. Jo and J. M. White, J. Phys. Chem. 95 (1991) 8054.
[132] A. Böttcher and T. Giessel, Surf. Sci. 408 (1998) 212.
[133] J. M. Parnis, L. E. Hoover, D. B. Pedersen and D. D. Paterson, J. Phys. Chem. 99 (1995)
13528.
[134] P. Rawat, V. S. Prabhudesai, M. A. Rahman, N. B. Ram and E. Krishnakumar, Int. J.
Mass. Spectrom. 277 (2008) 96.
[135] C. Girardet and C. Toubin, Surf. Sci. Rep. 44 (2001) 163.
[136] Q.-B. Lu, T. E. Madey, L. Parenteau, F. Weik and L. Sanche, Chem. Phys. Lett. 342
(2001) 1.
[137] R. Souda, J. Chem. Phys. 131 (2009) 164501.
[138] V. Ramanathan, L. Callis, R. Cess, J. Hansen, I. Isaksen, W. Kuhn, A. Lacis, F. Luther, J.
Mahlamn, R. Reck and M. Schlesinger, Rev. Geophys. 25 (1987) 1441.
[139] IPCC/TEAP 2005 Special Report on Safeguarding the Ozone Layer and the Global
Climate System: Issues Related to Hydrofluorocarbons and Perfluorocarbons (Summary for
Policy Makers).
[140] D. M. Good, M. Wirtala, G. C. McAlister and J. J., Coon, Mol. Cell. Proteomics 6 (2007)
1942.
AC
CE
PTE
DM
AN
US
CR
IPT
ACCEPTED MANUSCRIPT
– 58 –
Figure Captions
Figure 1. Potential energy curves for dissociative electron attachment (DEA) of a ~0 eV free
electron to CF2Cl2 in the gas (g) and for dissociative electron transfer (DET) of a weakly-bound
pre-solvated electron (epre ) to CF2Cl2 adsorbed on H2O ice surface (s). The potential energy
curves for the gas phase are constructed from gaseous thermodynamic data, while the curve of
CF2Cl2* adsorbed on H2O ice surface (s) is obtained with the polarization energy of ~1.3 eV
(see text).
Figure 2. Schematic diagram for the cosmic-ray driven electron reaction (CRE) mechanism of
ozone depletion: cosmic-ray radiation produces an electron in an ice particle in a polar
stratospheric cloud (PSC); the electron becomes a precursor (epre to the solvated electron. epre
breaks a halogenated molecule (CFC, HCFC, HCl or ClONO2, etc) to produce a Cl ion, which
either exists as a free ion or is converted to a Cl2 molecule by reacting with other species in a
PSC in the winter polar stratosphere [12, 14]. Then, the photodetachment of Cl or
photodissociation of Cl2 forms one or two Cl atoms that destroy O3 molecules via (Cl, ClO)
reaction cycles when sunlight returns in early spring.
Figure 3. ESDIAD detector with a time of flight (TOF) capability. The gate for the detector is
only open just before the desorbing negative ions arrive at the detector [46, 75, 76].
Figure 4. Relative Cl yields desorbing from 250 eV primary electrons incident onto various
amounts of CF2Cl2 covered Ru(0001) at ~25 K as a function of (a) H2O or (b) NH3 coverage,

AC
CE
PTE
DM
AN
US
CR
IPT
ACCEPTED MANUSCRIPT
– 59 –
where Cl yields are normalized to the initial value at zero H2O/NH3 coverage. Reprinted with
permission from [12]. Copyright 1999, the American Institute of Physics.
Figure 5. Relative Cl yields desorbing from 250 eV primary electrons incident onto 0.3 ML
CF2Cl2 adsorption on top of H2O-precovered Ru(0001) surfaces at ~25 K as a function of the
H2O spacer thickness. Reprinted with permission from [12]. Copyright 1999, the American
Institute of Physics. The dash-dot line is to extrapolate the Cl yield to the H2O spacer thickness
of 5 ML, which is at least one order of magnitude less than the maximum Cl yield at ~1 ML
H2O.
Figure 6. Relative Cl– yield for various CF2Cl2 precoverages as a function of NH3 coverage. The
data in each curve are normalized to the initial value at zero NH3 coverage. (a) Detected by QMS
and (b) Detected by ESDIAD. Reprinted with permission from [87]. Copyright 2004, the
American Institute of Physics.
Figure 7. Schematic diagram of the electron trapping experiment at ~20 K. A 10 monolayer
(ML) Kr film was first deposited onto the Pt substrate; 5 ML H2O was subsequently deposited on
the Kr film. Afterward, a submonolayer of electron attaching molecules is adsorbed on top of the
H2O film. The variation of the electrostatic potential at the film surface, caused by electron
trapping, is monitored by measuring the shift in the energy onset of electron transmission
through the film. Reprinted with permission from [90]. Copyright 2004, the American Institute
of Physics.
Figure 8. Electron trapping coefficient As as a function of electron energy for 0.1 ML CF2Cl2
and 0.1 ML CFCl3: (a) and (b) on 10 ML Kr; (c) and (d) on 5 ML H2O on 10 ML Kr at ~20 K.
(a) and (c) reprinted from [13]; (b) and (d) reprinted with permission from [90]. Copyright 2003,
the American Institute of Physics.
Figure 9. Electron trapping coefficient As as a function of electron energy for 0.1 ML CHF2Cl
and 0.1 ML CH3CF2Cl: (a) and (b) on 10 ML Kr; (c) and (d) on 5 ML H2O on 10 ML Kr at ~20
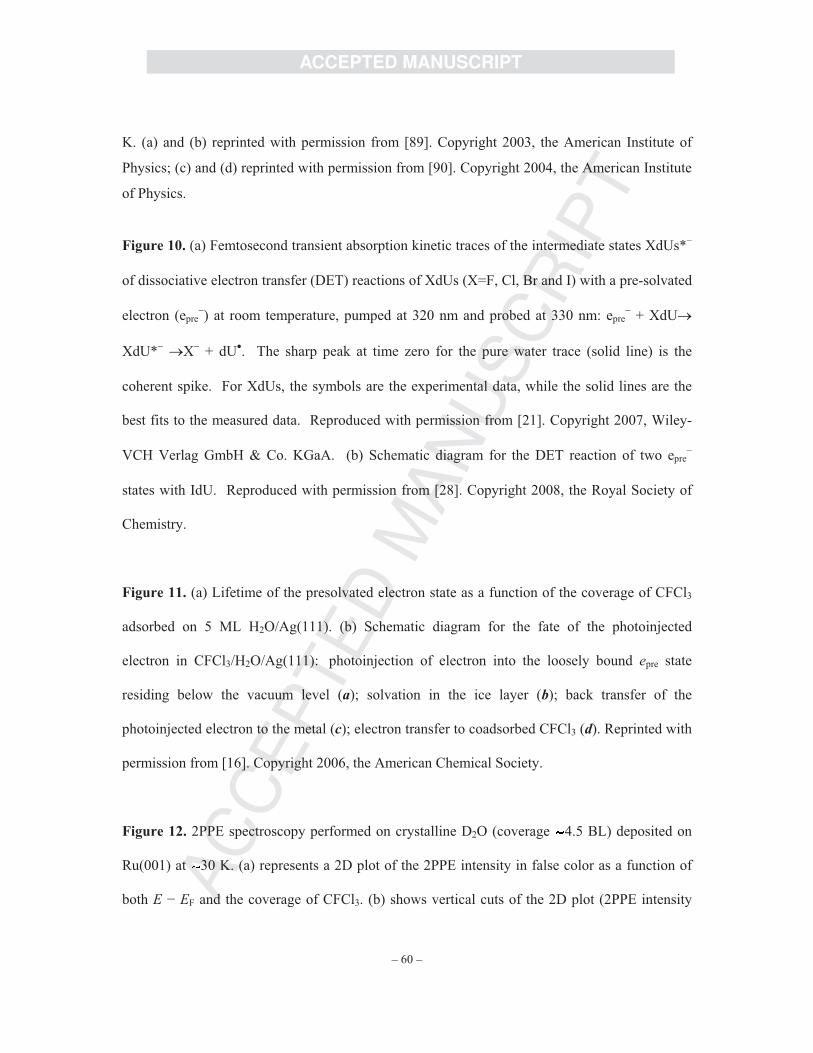
AC
CE
PTE
DM
AN
US
CR
IPT
ACCEPTED MANUSCRIPT
– 60 –
K. (a) and (b) reprinted with permission from [89]. Copyright 2003, the American Institute of
Physics; (c) and (d) reprinted with permission from [90]. Copyright 2004, the American Institute
of Physics.
Figure 10. (a) Femtosecond transient absorption kinetic traces of the intermediate states XdUs*
of dissociative electron transfer (DET) reactions of XdUs (X=F, Cl, Br and I) with a pre-solvated
electron (epre ) at room temperature, pumped at 320 nm and probed at 330 nm: epre + XdU
XdU* X + dU . The sharp peak at time zero for the pure water trace (solid line) is the
coherent spike. For XdUs, the symbols are the experimental data, while the solid lines are the
best fits to the measured data. Reproduced with permission from [21]. Copyright 2007, Wiley-
VCH Verlag GmbH & Co. KGaA. (b) Schematic diagram for the DET reaction of two epre
states with IdU. Reproduced with permission from [28]. Copyright 2008, the Royal Society of
Chemistry.
Figure 11. (a) Lifetime of the presolvated electron state as a function of the coverage of CFCl3
adsorbed on 5 ML H2O/Ag(111). (b) Schematic diagram for the fate of the photoinjected
electron in CFCl3/H2O/Ag(111): photoinjection of electron into the loosely bound epre state
residing below the vacuum level (a); solvation in the ice layer (b); back transfer of the
photoinjected electron to the metal (c); electron transfer to coadsorbed CFCl3 (d). Reprinted with
permission from [16]. Copyright 2006, the American Chemical Society.
Figure 12. 2PPE spectroscopy performed on crystalline D2O (coverage 4.5 BL) deposited on
Ru(001) at 30 K. (a) represents a 2D plot of the 2PPE intensity in false color as a function of
both E EF and the coverage of CFCl3. (b) shows vertical cuts of the 2D plot (2PPE intensity

AC
CE
PTE
DM
AN
US
CR
IPT
ACCEPTED MANUSCRIPT
– 61 –
versus E EF) for different CFCl3 coverages. The dashed spectrum is a 2PPE spectrum realized
on 4.5 BL of freshly deposited crystalline D2O before CFCl3 adsorption. Reprinted with
permission from [17]. Copyright 2009, the Royal Society of Chemistry.
Figure 13. (a) Cosmic-ray (CR) intensity and monthly mean total ozone in pre-ozone hole (Oct.
1979 for Antarctica and March 1979 for Arctic) and ozone hole period (dashed line for Oct.
1998 for Antarctica and March 1998 for Arctic) versus latitude. (b) Cosmic-ray ionization rate
and ozone loss versus altitude: the curve for the spring ozone hole over Syowa, Antarctica, was
obtained by subtracting the altitude distribution curve of pre-ozone hole from that of ozone-hole
period [14].
Figure 14. (a) Percentage variations of observed CR intensity and annual average zonal-mean
total ozone with latitudes 0-60 S; (b) Percentage variations of observed CR intensity and
monthly average zonal mean total ozone in October Antarctic with latitudes of 60-90 S during
the period of 1990-2008. The O3 data are relative to the value at 1992. Updated from Lu [15],
where the zonal mean total O3 data for October 2008 (upper triangle, green) was predicted.
Figure 15. (a) Percents of 3-month (October-December) average zonal mean total O3 over
Antarctica with latitudes of 60-90 S, normalized to [O3]0=375 DU, and the equivalent effective
stratospheric chlorine (EESC) over Antarctica during the period of 1979-2008. Observed O3 data
(solid circles) were obtained from NASA N7/M3/EP/OMI satellite datasets; the solid line
through the data points is a 3-point average smoothed curve to aid the eyes. The EESC data were
obtained from WMO Report [37]. (b) October Antarctic (60°S to 90°S) total column ozone

AC
CE
PTE
DM
AN
US
CR
IPT
ACCEPTED MANUSCRIPT
– 62 –
anomalies from various two-dimensional (2-D) and three-dimensional (3-D) coupled
(photo)chemistry-Climate Models (CCMs) (colored lines) [from Fig. 6-12 in ref. 37]. Note that
in (b) the vertical dash line in red corresponds to the year 2008, where several CCMs predicted a
minimum Antarctic ozone hole, which is exactly opposite to the observed data in (a).
Figure 16. (a) Percent of spring zonal-mean total ozone over Antarctica with latitudes of 60-90
S and cosmic ray (CR) intensity variation during the period of 1979-2008, as well as total ozone
variation given by the CRE model (Eq. 7 with k=2.1x10 9). The spring total ozone data are the
same as those in Fig. 15(a), while the CR data were obtained from the measurements at
McMurdo (77.9o S, 166.6o E). The upper triangle is the ozone data predicted by Eq. (7) for
2009. (b) Similar to (a), but the ozone data were obtained from the Antarctic Halley (75°35'S,
26°36'W) and averaged from September to November, normalized to [O3]0=300 DU; the
calculated ozone data were obtained by Eq. (7) with k=2.8x10 9. (c) The summer zonal-mean
total ozone (solid circles) at 60-90 S averaged from January and February and the summer
ozone data (solid triangles) at Halley averaged from January to March, normalized to [O3]0=320
DU. In (a)-(c), the fine solid lines through the data points are 3-point average smoothed curves
to aid the eyes.
Figure 17. Temperatures at the lower Antarctic stratosphere (100 hPa) and total ozone observed
at Halley (75°35' S, 26°36' W) from 1956 to 2008: (a) during the winter (June-August, prior to
the Antarctic ozone hole season), (b) the later spring (November, after the ozone hole peak) and
(c) annual mean. In (a), the data for the cosmic ray (CR) intensities at McMurdo (77.9o S, 166.6o
E) from 1969 to 2009 are also shown, while in (b) and (c), the total O3 data fitted by Eq. (7) with
AC
CE
PTE
DM
AN
US
CR
IPT
ACCEPTED MANUSCRIPT
– 63 –
the EESC values from WMO Report [37] are also shown. Note that no O3 data are shown in (a),
as they are not available in the winter Antarctic stations. A 3-point average smoothing was
applied to the observed ozone data in (b) and (c) and the temperature data in (a)-(c).
Figure 18. Temperatures at the lower Antarctic stratosphere (100 hPa) as a function of total
ozone observed at Halley (75°35' S, 26°36' W): (a) November data spanning from 1956 to 2008
(Fig. 17b) and (b) Annual data from 1979 to 2008 (Fig. 17 c). The solid lines are the linear fits
to the observed data, giving the correlation coefficients R=0.94 (a) and R=0.89 (b) and the
probability (that R is zero) P<0.0001.
Figure 19. (April, June, August, September) monthly mean CH4 level in ppmv combined
CLEAS and HALOE datasets on UARS, which are representative of the entire UARS record
(repeating seasonal cycles were fit through an over six year record from 1992 to 1998), and April
and August 1992 monthly mean CF2Cl2 level in pptv from CLEAS (only the 1992 data
available).
Figure 20. Future trends of (a) cosmic ray (CR) intensity, (b) the equivalent effective
stratospheric chlorine (EESC) and (c) total ozone over Antarctica with latitudes (60-90o S). The
future CR data in (a) were obtained by Eq. (8) through the best fit to all the observed data at
McMurdo from 1969 to 2009, while the EESC data in (b) were obtained from WMO Report
[37]. In (c), the observed total ozone (solid circles) from 1979 to 2008 are the same as those in
Fig. 15(a) and 16(a), while the calculated total ozone data (solid line) were obtained by Eq. (7)
with the CR curve in (a) and EESC curve in (b).

AC
CE
PTE
DM
AN
US
CR
IPT
ACCEPTED MANUSCRIPT
– 64 –
Figure 21. Variations of observed southern hemisphere (SH), northern hemisphere (NH) and
global surface temperatures and the normalized equivalent effective stratospheric chlorine
(EESC) from 1850 to 2008. The solid curves in black and red are the original observed data and
their 3-point average smoothing of surface temperatures, respectively. The EESC for SH, NH
and global stratospheres are respectively obtained with the assumed time delays =8, 9 and 9
years from the surface halogen peak at 1994.
Figure 22. (a) Global temperature variation ( T) versus normalized equivalent effective
stratospheric chlorine (EESC) with the data over 1970-2008, where T=T T80 (T80 is the
temperature in 1980) and the EESC values are normalized to its value in 1980; the solid line is
the linear fit to the observed data, giving T= 0.31+0.30 EESC (oC) with the correlation
coefficient R=0.89 and the probability (that R is zero) P<0.0001. (b) Time-series vvariations of
global surface temperature and cosmic-ray (CR) intensity over 1970-2008 and EESC from 1970
to 2050, relative to 1980; a 3-point average smoothing was applied to observed surface
temperature data. A global cooling is projected for the coming five decades.

AC
CE
PTE
DM
AN
US
CR
IPT
ACCEPTED MANUSCRIPT
– 65 –
En
erg
y (
eV
)
H2O Ice
R(C-Cl)
CF2Cl Cl (s)
CF2Cl2
CF2Cl Cl (g)Conduction band
epre
esol
-3
-2
-1
0
1
2
3 CF2Cl-Cl
DET
DEA
Lu, Physics Reports, Figure 1

AC
CE
PTE
DM
AN
US
CR
IPT
ACCEPTED MANUSCRIPT
– 66 –
Cosmic rays
epre
Polar stratospheric clouds
H2O
H2O
H2OCl
CFCs, HCl, ClONO2 Cl2Cl
Sunlight
Cl
Lu, Physics Reports, Figure 2
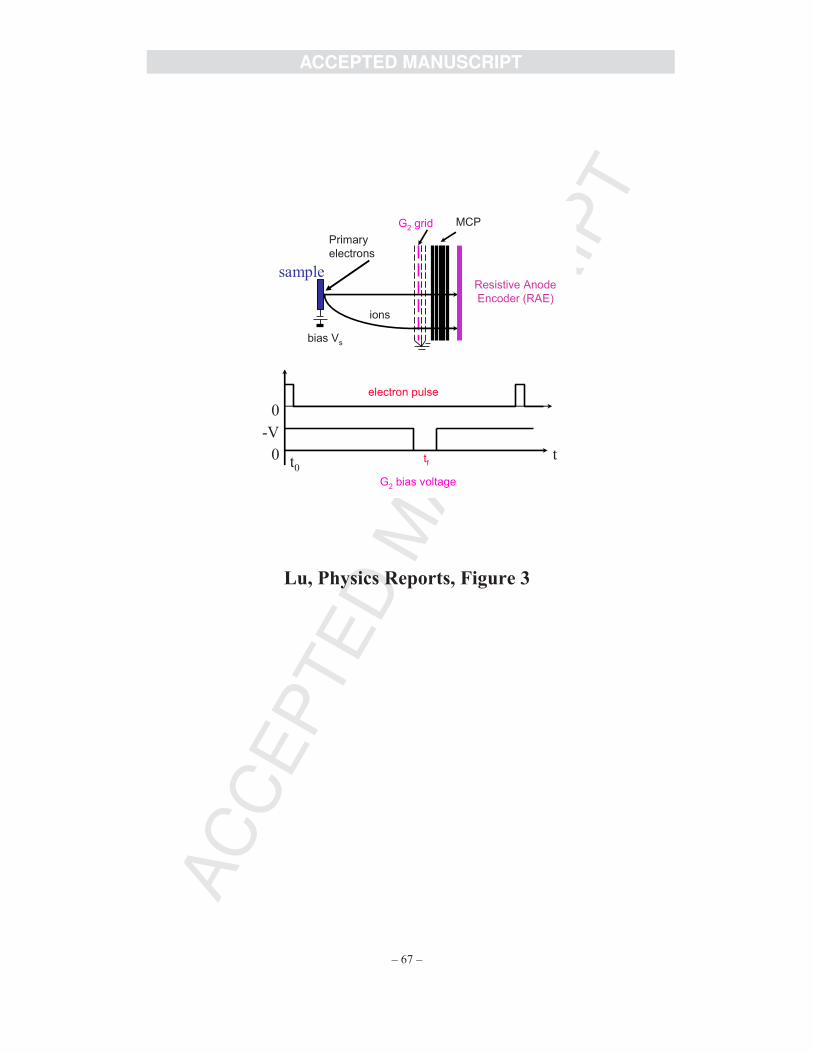
AC
CE
PTE
DM
AN
US
CR
IPT
ACCEPTED MANUSCRIPT
– 67 –
G2 bias voltage
Resistive Anode
Encoder (RAE)
G2 grid MCP
bias Vs
sample
t
0
-V
0 t0tf
electron pulse
ions
Primary
electrons
Lu, Physics Reports, Figure 3

AC
CE
PTE
DM
AN
US
CR
IPT
ACCEPTED MANUSCRIPT
– 68 –
0 2 4 6
10-1
100
101
102
0 2 4 6 8 10
10-1
101
103
105
(a)CF
2Cl
2 Coverage (ML)
0.3
0.5
0.8
1.0
H2O Coverage (ML)
Re
lative
ES
D C
l I
nte
nsity
CF2Cl
2 Coverage (ML)
(b)
NH3 Coverage (ML)
0.3
0.5
0.7
1.0
Lu, Physics Reports, Figure 4

AC
CE
PTE
DM
AN
US
CR
IPT
ACCEPTED MANUSCRIPT
– 69 –
0 1 2 3 4 5
100
101
102
103
0.3 ML CF2Cl
2/H
2O/Ru(0001)
Re
lative
ES
D C
l I
nte
nsity
H2O Thickness (ML)
Lu, Physics Reports, Figure 5

AC
CE
PTE
DM
AN
US
CR
IPT
ACCEPTED MANUSCRIPT
– 70 –
NH3 Coverage (ML)
Cl
Rela
tive Y
ield
1
10
100
10000.2 ML CF2Cl2
0.4 ML CF2Cl2
1 ML CF2Cl2
(a) QMS
0 1 2 3 4 5
NH3 Coverage (ML)
1
10
100
1000
0.1
0.3 ML CF2Cl2
1.7 ML CF2Cl2
1 ML CF2Cl2
(b) ESDIAD
0 1 2 3 4 5 6
Lu, Physics Reports, Figure 6

AC
CE
PTE
DM
AN
US
CR
IPT
ACCEPTED MANUSCRIPT
– 71 –
Electron attaching
molecules
Pt
Kr
H2O
L1
L2
Ele
ctr
ons
Electrometer
Cl
Lu, Physics Reports, Figure 7
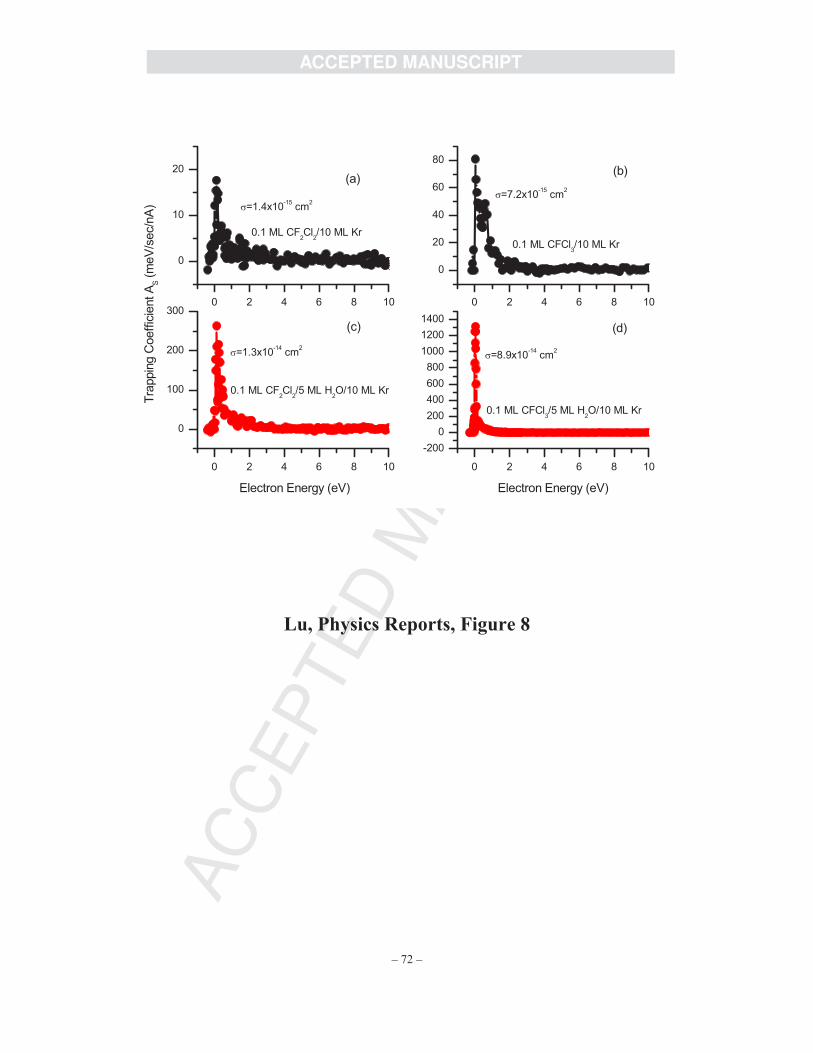
AC
CE
PTE
DM
AN
US
CR
IPT
ACCEPTED MANUSCRIPT
– 72 –
0 2 4 6 8 10
0
10
20
0 2 4 6 8 10
0
100
200
300
0 2 4 6 8 10
-200
0
200
400
600
800
1000
1200
1400
0 2 4 6 8 10
0
20
40
60
80
(a)
0.1 ML CFCl3/5 ML H
2O/10 ML Kr
0.1 ML CF2Cl
2/10 ML Kr
0.1 ML CF2Cl
2/5 ML H
2O/10 ML Kr
Tra
ppin
g C
oeff
icie
nt A
S (
meV
/sec/n
A)
=1.3x10⁻¹⁴
cm2
=1.4x10⁻¹⁵
cm2
(c)
Electron Energy (eV) Electron Energy (eV)
=8.9x10⁻¹⁴
cm2
=7.2x10⁻¹⁵
cm2
(d)
(b)
0.1 ML CFCl3/10 ML Kr
Lu, Physics Reports, Figure 8

AC
CE
PTE
DM
AN
US
CR
IPT
ACCEPTED MANUSCRIPT
– 73 –
0 2 4 6 8 10
0
40
80
120
160
-1 0 1 2 3 4 5
0
40
80
120
1600 2 4 6 8 10
0
2
4
6
0 2 4 6 8 10
0
2
4
6
8
Electron Energy (eV)
(c)
5.1x10⁻¹⁵
cm2
Ele
ctr
on
Tra
pp
ing
Co
eff
icie
nt
(mV
/se
c/n
A)
CHF2Cl on 5 ML H
2O/10 ML Kr
Electron Energy (eV)
(d)
4.9x10⁻¹⁵
cm2
CH3CF
2Cl
on 5 ML H2O/10 ML Kr
(a)4.2x10
-16 cm
2
CHF2Cl on 10 ML Kr
(b)7.8x10
-16 cm
2
CH3CF
2Cl on 10 ML Kr
Lu, Physics Reports, Figure 9

AC
CE
PTE
DM
AN
US
CR
IPT
ACCEPTED MANUSCRIPT
– 74 –
-2 0 2 4 6 8 10 12
0
2
4
XdU*
Probe-Pump Delay Time (ps)
Tra
nsie
nt
Ab
so
rb.
(x1
0-3)
3.6 mM IdU
25 mM BrdU
25 mM CldU
25 mM FdU
pure H2O
(a)
(b)
Conduction band
-3
-2
-1
0
1
Energ
y (
eV
)
H2O
R(dU-I)
epre 1 epre 2
ehyd
dU I
dU I
IdU
(b)
Lu, Physics Reports, Figure 10

AC
CE
PTE
DM
AN
US
CR
IPT
ACCEPTED MANUSCRIPT
– 75 –
0.0 0.1 0.2 0.3
80
90
100
110
120
(a)
Coverage (ML)
Lif
eti
me (
fs)
CFCl2+Cl
CFCl2+Cl(b)
Lu, Physics Reports, Figure 11

AC
CE
PTE
DM
AN
US
CR
IPT
ACCEPTED MANUSCRIPT
– 76 –
CFCl3 coverage ( 10-3 ML) E-EF (eV)
E-E
F(eV)
0 2 4 6 8 10 12
4.0
3.5
3.0
2.5
2.0
1.5
1.0
0.5
14 103
12
10
8
6
4
2
0
CFCl3/D2Ocryst/Ru(001)
h = 3.60 eV
0.5 1.0 1.5 2.0 2.5 3.0 3.5 4.0
CFCl3 coverage
( 10-3 ML)
0
3.0
6.0
9.0
12
2P
PE
-Inte
nsity
2P
PE
-Inte
nsity
(b)(a)
CFCl3 introduction
Lu, Physics Reports, Figure 12
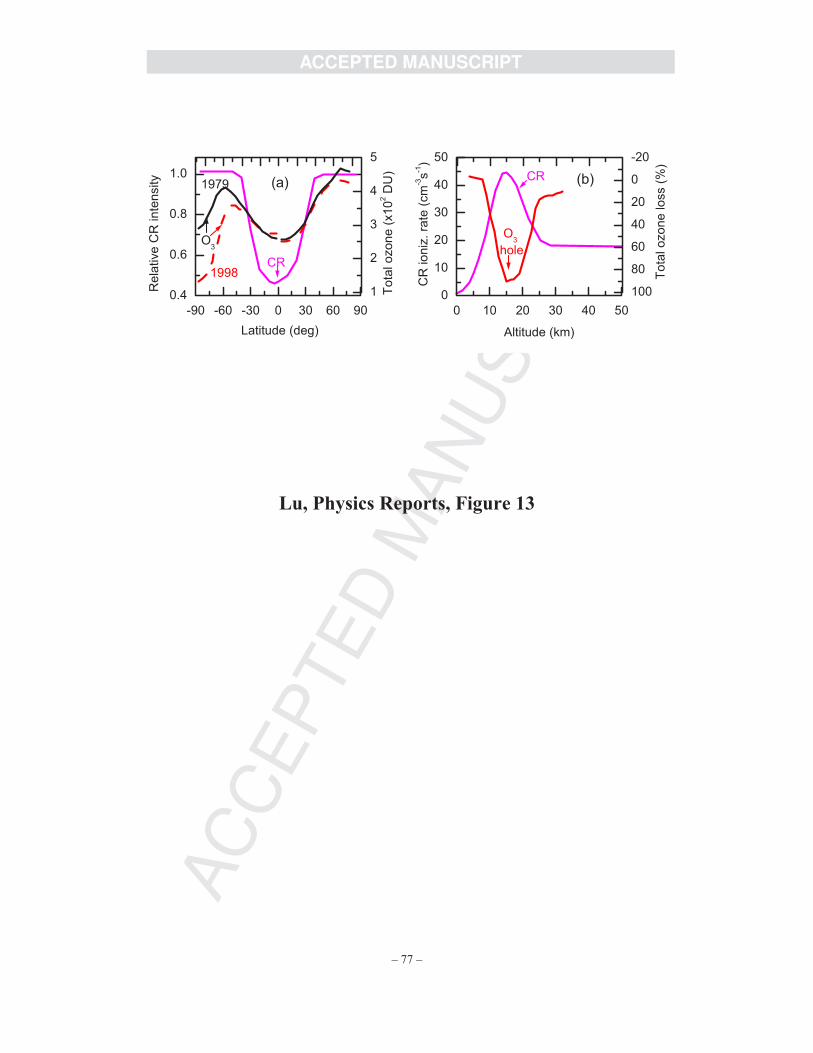
AC
CE
PTE
DM
AN
US
CR
IPT
ACCEPTED MANUSCRIPT
– 77 –
-90 -60 -30 0 30 60 90
0.4
0.6
0.8
1.0(a)
CR1998
1979
Latitude (deg)
Re
lative
CR
in
ten
sity
0 10 20 30 40 50
0
10
20
30
40
50
(b)
Altitude (km)
O3
hole
CR
CR
io
niz
. ra
te (
cm
-3s
-1)
100
80
60
40
20
0
-20
To
tal o
zo
ne
lo
ss (
%)
1
2
3
4
5
O3
To
tal o
zo
ne
(x1
02 D
U)
Lu, Physics Reports, Figure 13
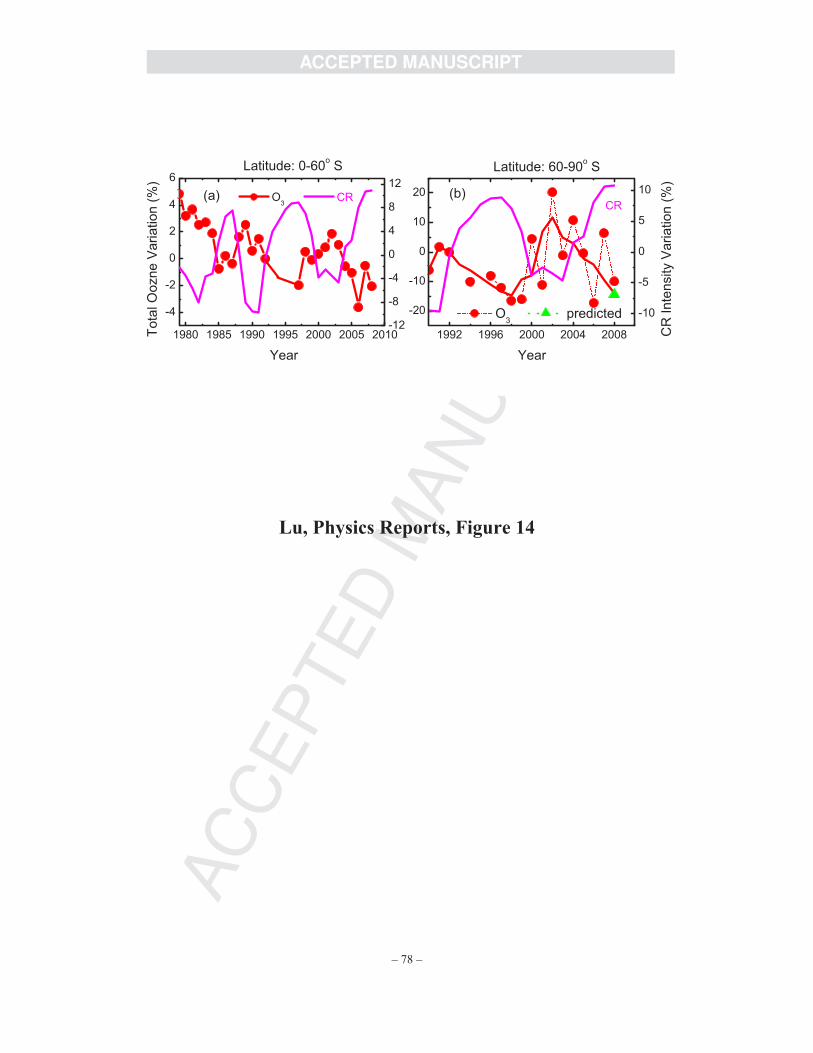
AC
CE
PTE
DM
AN
US
CR
IPT
ACCEPTED MANUSCRIPT
– 78 –
1992 1996 2000 2004 2008
-20
-10
0
10
20
-10
-5
0
5
10
1980 1985 1990 1995 2000 2005 2010
-4
-2
0
2
4
6
-12
-8
-4
0
4
8
12
O3 predicted
Year
CR
Latitude: 60-90o SLatitude: 0-60
o S
(b)
CR
In
ten
sity V
ari
atio
n (
%)
O3
Tota
l O
ozn
e V
ari
atio
n (
%)
Year
(a) CR
Lu, Physics Reports, Figure 14

AC
CE
PTE
DM
AN
US
CR
IPT
ACCEPTED MANUSCRIPT
– 79 –
1980 1985 1990 1995 2000 2005 2010
60
70
80
90
0.5
1.0
1.5
2.0
Year
(a) Observed O3 (60-90
o S, Oct-Dec)
Rela
tive T
ota
l O
zone (
%)
Norm
aliz
ed E
ES
CEESC
Year
(b) Photochemical models
Rela
tive
To
tal O
zo
ne
(%
)
1960 1980 2000 2020 2040 2060 2080 2100
20
10
0
-10
-20
-30
-40
-5060oS-90oS
Lu, Physics Reports, Figure 15

AC
CE
PTE
DM
AN
US
CR
IPT
ACCEPTED MANUSCRIPT
– 80 –
1980 1985 1990 1995 2000 2005 2010
80
90
100
60
70
80
90
0.8
1.0
1.2
50
60
70
80
90
0.8
1.0
1.2
0.8
1.0
1.2
CR
Year
Halley, Jan-Mar
60-90o S, Jan-Feb
(c) Summer O3
Rela
tive T
ota
l O
zon
e (
%)
(a) 60-90o S, Oct-Dec
CRE model
CRE model
CR
CR
(b) Halley, Sept-Nov
CR
Inte
nsity (
10
4 c
ounts
/hr)
Lu, Physics Reports, Figure 16

AC
CE
PTE
DM
AN
US
CR
IPT
ACCEPTED MANUSCRIPT
– 81 –
-82
-80
-78
-76
-72
-68
-64
-60
-56
-52
-48
150
200
250
300
350
400
200
225
250
275
300
325
8
9
10
11 Temp/Ozone at Halley
Temp
(b) November
After the O3 hole peak
Lo
we
r str
ato
sp
heri
c T
em
pera
ture
(0C
)
Temp
To
tal o
zo
ne
(D
U)
O3
O3 by CRE
1960 1970 1980 1990 2000 2010
-66
-64
-62
-60(c) Annual mean
Year
Temp
O3
O3 by CRE
(a) Jun-Aug
Before the O3 hole season
CR CR
in
ten
sity (
10
3 c
/hr)
Lu, Physics Reports, Figure 17

AC
CE
PTE
DM
AN
US
CR
IPT
ACCEPTED MANUSCRIPT
– 82 –
150 200 250 300 350 400
-75
-70
-65
-60
-55
-50
-45
200 220 240 260 280 300
-66
-64
-62
-60
(b) Halley, Annual
R=0.89
Total ozone (DU)
Lo
w S
tra
tosp
he
ric T
(oC
)
R=0.94
(a) Halley, November
Total ozone (DU)
Lu, Physics Reports, Figure 18

AC
CE
PTE
DM
AN
US
CR
IPT
ACCEPTED MANUSCRIPT
– 83 –
-80 -60 -40 -20
161820222426283032343638404244
1.31.2
1.11.0
0.9
0.8
0.7
0
1.4
0.5
0.4
1.5
0.30.2
-80 -60 -40 -20
161820222426283032343638404244
1.31.2
1.11.0
0.9
0.8
0.7
0.6
0.5
0.4
1.4 1.5
0.3
-80 -60 -40 -20 0
161820222426283032343638404244
1.31.21.1
1.00.9
0.8
0.7
0.6
0.5
0.4
1.4
0.3
1.5
-80 -60 -40 -20 0
161820222426283032343638404244
1.2
1.11.0
0.9
0.8
0.7
0.60.5
1.3
0.4
1.4
1.5
0.3
CH4 September 1992-1998
CH4 April 1992-1998 CH4 June 1992-1998
CH4 August 1992-1998
Altitu
de
(km
)A
ltitude
(km
)
Latitude (deg) Latitude (deg)
-80 -70 -60 -50 -40 -30 -20 -10
14161820222426283032343638404244
320
280240
200160
12080
360
40
400 440
400
-80 -70 -60 -50 -40 -30 -20 -10
161820222426283032343638404244
200
160
120
80
40
240
280
320
CF2Cl2 April 1992
CF2Cl2 August 1992
Latitude (deg)
Lu, Physics Reports, Figure 19

AC
CE
PTE
DM
AN
US
CR
IPT
ACCEPTED MANUSCRIPT
– 84 –
1980 2000 2020 2040 2060
60
70
80
90
100
1980 2000 2020 2040 2060
8
9
10
11
12
1980 2000 2020 2040 20600.5
1.0
1.5
2.0
2.5
(c) Measured Total Ozone
Predicted by CRE Model
Rela
tive T
ota
l O
zone (
%)
Year
(a) Measured CR Intensity
Fitted CR Intensity
CR
Inte
nsity
(10
3 c
/hr)
(b)
EESC normalized to 1980
Norm
aliz
ed E
ES
C
Lu, Physics Reports, Figure 20
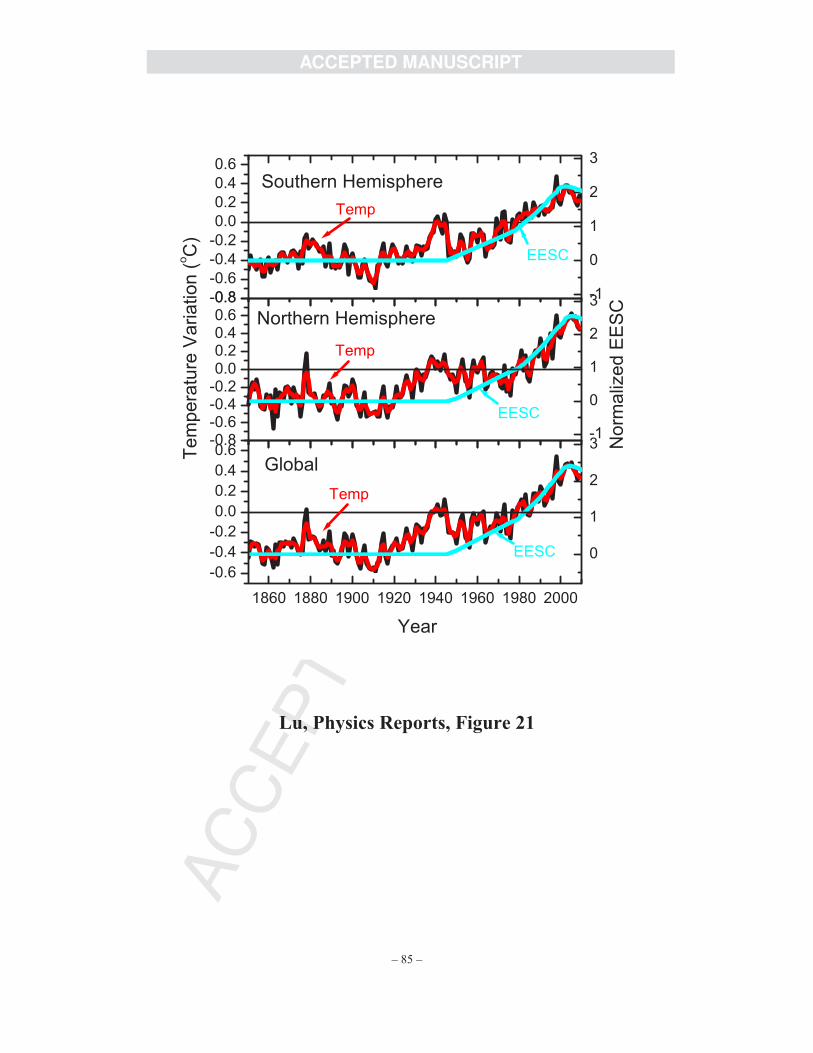
AC
CE
PTE
DM
AN
US
CR
IPT
ACCEPTED MANUSCRIPT
– 85 –
0
1
2
3
-0.8
-0.6
-0.4
-0.2
0.0
0.2
0.4
0.6
-1
0
1
2
3
-1
0
1
2
3
1860 1880 1900 1920 1940 1960 1980 2000
-0.6
-0.4
-0.2
0.0
0.2
0.4
0.6
Year
Te
mp
era
ture
Va
ria
tio
n (
oC
)
Temp
EESC
Global
Temp
Southern Hemisphere
EESC
No
rma
lize
d E
ES
C
-0.8-0.6-0.4-0.20.00.20.40.60.8
Temp
EESC
Northern Hemisphere
Lu, Physics Reports, Figure 21

AC
CE
PTE
DM
AN
US
CR
IPT
ACCEPTED MANUSCRIPT
– 86 –
1970 1980 1990 2000 2010 2020 2030 2040 2050
-0.4
-0.2
0.0
0.2
0.4
0.6
0.0
0.5
1.0
1.5
2.0
2.5
0.5 1.0 1.5 2.0 2.5
-0.4
-0.2
0.0
0.2
0.4
0.6
CR
/Glo
bal te
mp v
ariation
Year
Cosmic rays
Global temp No
rmaliz
ed E
ES
C
(b)
Global cooling
EESC
T= 0.31+0.30EESC
(a)
R=0.89
Normalized EESC
Glo
bal te
mp
varia
tio
n
T (
oC
)
Lu, Physics Reports, Figure 22