Science in the City: a Citizen Science Air Quality ... · "A revolution doesn't happen when a...
42
Science in the City: a Citizen Science Air Quality Monitoring Programme 1
Transcript of Science in the City: a Citizen Science Air Quality ... · "A revolution doesn't happen when a...

Science in the City: a Citizen Science Air Quality Monitoring Programme
1

Science in the City: a Citizen Science Air Quality Monitoring Programme
"A revolution doesn't happen when a society adopts new tools. It happens when society adopts new behaviours and most of that change I think is still in the future."
Clay Shirky
2
Science in the City: a Citizen Science Air Quality Monitoring Programme
Science in the City - Barbican Report
This report has been produced by Mapping for Change with the support of the City of London Corporation. It has been developed as part of a one year project led by Mapping for Change to engage local residents in the Barbican with the view to increase public understanding about air pollution, its causes, and effects and how concentrations vary both spatially and from day to day. It has been written by Louise Francis and Hannah Stockwell. Copies of this report can be obtained from the Mapping for Change website (Mappingforchange.org.uk). Text copyright Mapping for Change. This material is made available for public use subject to acknowledgement being made of the source and its availability on the Mapping for Change website.
Acknowledgements We would like to thank all of the community members who participated in this project, and whose work is used as examples here to help others learn how they can use a citizen science approach to monitor and map local air quality in their own community. We would like to acknowledge, in particular, Sarah Hudson, whose support as a local Barbican resident went above and beyond the cause.
All maps are ©2015 Microsoft Corporation © 2014 Nokia
3

Science in the City: a Citizen Science Air Quality Monitoring Programme
Contents
Science in the City - Barbican Report ......................................................................................... 3
Acknowledgements .................................................................................................................... 3
Summary .................................................................................................................................... 5
Introduction ............................................................................................................................... 6
Methods ..................................................................................................................................... 8
Qualitative Approach ............................................................................................................. 8
Quantitative Approach ........................................................................................................... 9
Results ...................................................................................................................................... 11
Residents’ perceptions ......................................................................................................... 11
Nitrogen Dioxide .................................................................................................................. 18
Particulates: PM2.5 ................................................................................................................ 25
Conclusion ................................................................................................................................ 31
Community Participation and Awareness ............................................................................ 31
What can we take from the findings? .................................................................................. 31
References ............................................................................................................................... 35
Appendix 1 ............................................................................................................................... 36
Appendix 2 ............................................................................................................................... 37
4

Science in the City: a Citizen Science Air Quality Monitoring Programme
Summary
In writing this report, the authors believe this to be the largest, community based, citizen science air quality monitoring project to be carried out in the UK over the course of a year.
Science in the City was initiated with the aim to increase public understanding about air pollution, its causes, and effects, amongst local residents, and how concentrations of different pollutants vary over space and time.
The project focused on two of the major ambient air pollutants, nitrogen dioxide (NO2) and particulates, both of which are considered harmful to health. This report describes the process with which residents in the Barbican Estate carried out an in-depth air quality monitoring survey using both low and medium technical approaches and then goes on to outline the preliminary findings.
In summary, the results found that nitrogen dioxide concentrations measured over the course of the year showed seasonal variations in line with measurements taken over previous years from local authority managed monitoring stations. A number of locations, such as Beech Street Tunnel and London Wall were found to have concentration levels in exceedance of the EU annual targets. The interior of the estate, however, proved to be less exposed to the same poor air quality as found at street level, although residents living in the towers overlooking Beech Street were still exposed to potentially harmful concentrations of pollutants, even up to a height in excess of sixty meters.
The project managed to kick-up a storm during the monitoring of particulates and residents were able to directly see the impact of the Saharan dust storm on local air quality conditions. A number of areas that are seen as key in trying to combat the City’s air pollution problem were put forward to The City of London Corporation for consideration, alongside actions that can be taken at an individual or community level.
5

Science in the City: a Citizen Science Air Quality Monitoring Programme
Introduction
Air pollution is a concern for everyone and is something that affects us all. We are all contributors to the problem to a greater or lesser extent; we can all take steps to improve the air we breathe and to reduce our personal exposure to poor air quality. The City of London has some of the highest levels of pollution in the country due to its location, at the heart of London, and the density of development. A number of studies have been carried out into the health effects of air pollution across all stages of life – from conception to old age; on specific pollutants; and on different health endpoints, such as mortality or cardiovascular disease. Mounting evidence suggests that air pollution contributes to the global burden of respiratory and allergic diseases, including asthma, chronic obstructive pulmonary disease, pneumonia, and possibly tuberculosis (Laumbach and Kipen, 2012). Various long and short-term studies also conclude that there is a positive association between poor air quality and mortality rates (Rückerl et al., 2011). Nitrogen dioxide (NO2) is one of the major air pollutants found in our cities and is largely attributed to the burning of fossil fuels (coal, natural gas and oil) and vehicle emissions. Industry and road transport are primary sources of these emissions across the UK. As an irritant gas, NO2 can damage cell membranes and proteins. High concentrations can produce airway inflammation (experienced as a cough, chest tightness and difficulty breathing) and may lead to narrowing of lung airways, particularly among people with pre-existing asthma. Particulates constitute another significant contributor to poor air quality which vary considerably in their composition, size, and source. They are made up of organic and inorganic substances present in the atmosphere as both liquids and solids and are classified based on particle size. There are three classifications of particulates; PM10 (particles less than 10 micrometeres in diameter), PM2.5 (particles less than 2.5 micrometres in diameter), and ultrafine (less than 100 nanometres in diameter). In urban areas the primary sources include diesel emissions, domestic solid fuel burning, construction activities and non-exhaust traffic emissions such as brake and tyre-wear. These particles are small enough to breathe in and can cause serious health problems, especially with the heart and lungs. Variation in both size and chemical composition of particulates may result in seasonal and geographic differences that pose different health risks (Rückerl et al., 2011). The size of particle is directly linked to the potential for causing health problems (Harrison et al., 2010). It is estimated that across London around 4,000 people each year have their lives cut short by being exposed to London’s air. The average percentage of deaths in each year attributable to human-made particulate pollution in England is 5.6%. However, in London this figure is much higher, at 9% in the City of London and 8.3% in Westminster (London Assembly, 2012).
6

Science in the City: a Citizen Science Air Quality Monitoring Programme
In response to the negative effects that air pollution has on human health, vegetation and ecosystems, the European Commission has set reduction targets for key pollutants for all its Member States. The current EU legislative framework governing air quality has its origins in the Air Quality Framework Directive of September 1996 (96/62/EC) (the Framework Directive). This includes an annual mean limit value for NO2 of 40µg/m3 which was to be met by 2010. The focus of legislation for PM2.5 is on limiting long-term exposure through the use of annual standards, coupled to a reduction of PM2.5 background concentration in urban areas across the UK over the period 2010-2020. The Directive also obliges Member States to meet a limit value of 25µg/m3 by 2015 and a limit value of 20µg/m3 by 2020 for PM2.5
The Directive has been introduced into the UK through the Air Quality Strategy for England, Scotland Wales and Northern Ireland 2011 and the Air Quality Standards Regulations 2010. The Strategy sets out the air quality issues facing the UK, the targets which the government has set, and policies that are in place to attempt to achieve those targets. Various measures have already been taken by the government at a national, regional and local level to improve the air we breathe, but more needs to be done. The UK is currently in breach of the European Ambient Air Quality Directive for NO2 and being the capital, London suffers some of the poorest air quality in the UK so it is pertinent that we take action.
Local authorities around the UK regularly monitor air quality to assess compliance with air quality objectives and to measure the effectiveness of plans and programmes to reduce levels of air pollution. However, the collection and analysis of data is a costly process. As such, the majority of monitoring undertaken by local authorities is limited to collecting data from a few static sites within their jurisdiction. These data are then extrapolated using complex models to infer what pollution levels are in areas where there is no data. Whilst this offers an indication of local air quality, it is unable to create an accurate picture at a scale which the public may relate to or find useful on a day-to-day basis, particularly if they are seeking to reduce their exposure to poor air quality.
To establish the variability of air quality at a smaller scale the City of London Corporation commissioned Science in the City, a twelve month project led by Mapping for Change. The aims of this project were to obtain a better understanding of hyper-local air quality conditions around the Barbican, a large residential estate within the busy Square Mile, and to raise awareness of local and wider air quality issues among the residents. A citizen science approach was adopted which enabled local residents, many of whom had not been involved in a project of this kind before, to carry out grassroots data collection. This approach also allowed participants to take some ownership of the problem and explore ways in which they could reduce their personal exposure to poor air quality.
The idea is that the community will benefit from a raised awareness about air quality issues and the health impacts of air pollution, and how they can take steps to reduce their personal exposure to airborne pollutants. Moving forward it is hoped that they will also benefit from the opportunity to voice support for increased local action.
7

Science in the City: a Citizen Science Air Quality Monitoring Programme
Methods
Qualitative Approach The project commenced in October 2013 with a launch meeting at the Barbican Estate. Residents were invited to attend through various channels including the Barbican Association email, word of mouth, flyers and promotion by Sarah Hudson – a very active member of the community with a particular interest in air pollution.
The meeting consisted of an introduction to the problem of air pollution in the City, current monitoring systems in place, the effects poor air quality might have on health, measures currently in place to reduce air pollution and why this project was important. The meeting also included informal workshops to identify which areas the residents felt were the most polluted (hotspots) so we could include these areas in the monitoring programme. Residents were also asked about what they felt could be done to reduce pollution.
Two further meetings were held throughout the project to feed back some results, maintain momentum and encourage discussion around the potential next steps. Group discussions during one of the meetings were centred on key areas for action that residents would like the City of London Corporation to take to improve local air quality.
To gain an insight into what residents felt about the City’s air quality two surveys were conducted; one at the start of the project and one at the end. These were in the form of semi-structured questionnaires so that both qualitative and quantitative data could be collected. The residents’ were asked about their perceptions of air quality and the sources of pollution around the Barbican, their understanding of the health impacts of poor air
Figure 1. Launch meeting with Barbican residents
8

Science in the City: a Citizen Science Air Quality Monitoring Programme
quality and whether taking part in the project had changed their opinions or their behaviour. The overall responses were collated and compared.
Quantitative Approach To gain an overall insight into air quality across the area, two types of monitoring were undertaken. Static diffusion tubes were used to measure NO2 and SidePak aerosol monitors to measure PM2.5. Volunteers were recruited through residents’ meetings to take part in both of these activities and training was provided.
To measure NO2, 69 sites were set up around the Barbican Estate and surrounding roads (site details can be found in Appendix 1). Forty-eight residents hosted diffusion tubes outside their properties, 7 of which hosted two tubes, and a further 14 were placed strategically to monitor ‘hotspots’ at street level, along the high-walks and in the interior of the estate where resident monitoring sites were absent, to maximize coverage (figure 2) .
Figure 2: A map of the Barbican showing the locations of the nitrogen dioxide monitoring sites
9

Science in the City: a Citizen Science Air Quality Monitoring Programme
The diffusion tubes are made from clear plastic, with a rubber stopper at each end. They are designed for the passive monitoring of gaseous airborne NO2. A steel mesh coated with a chemical called triethanolamine (TEA) is located at one end of the tube. This absorbs nitrogen from the air when the stopper at the other end of the tube is removed, allowing air in. Laboratory analysis provides the average concentration of the pollutant in the air over the period that the tube was exposed.
Once a suitable site had been selected, a tube was positioned vertically, using a bracket and tie to fix it in place, with the open end facing down (see figure 3). The start time and date were recorded along with the location and any details about the site that might provide additional context. The tube was left exposed for 4 weeks before being removed, re-capped and replaced with a new tube. The end time and date were recorded so that the exposure time, in hours, could be calculated. The tubes were collected and sent to the laboratory for analysis. All the data from the survey sheets was collated and recorded. This was repeated each month between October 2013 and September 2014. Each tube had a unique number identifier and barcode so data could be attributed to the individual site.
All results for nitrogen dioxide monitoring were digitised using an interactive community map, plotted on easy to interpret graphs and shared via email with the residents involved.
To measure PM2.5 twenty-one residents were trained to use the SidePak Aerosol Monitors in conjunction with a Garmin GPS device. The SidePak Aerosol Monitor uses a small motor to draw air in through an inlet pipe and out through the exhaust (figure 4). The monitor was set to record the number of airborne particles 2.5 micrometres in diameter and smaller, at a sampling rate 5 seconds. The Garmin GPS uses several satellites to establish and record its location every 10 seconds, allowing a journey to be plotted.
Figure 4: Sidepak Aerosol Monitor
Figure 3: Diffusion tube to measure NO2 in situ.
10

Science in the City: a Citizen Science Air Quality Monitoring Programme
Three kits were available for use and residents took turns to use the equipment to monitor their personal exposure to PM2.5 for up to a week. The routes and monitoring periods were selected by the resident so as to be more representative of their daily routines. These included static readings such as on the balcony outside their residence, journeys around the Barbican, their daily commute and several trips further afield. The equipment was charged up, switched on and calibrated prior to each use. Activity was recorded in a diary and readings from the Sidepak and Garmin were downloaded before each changeover. The GPS data was synchronised with the SidePak data using Time as the constant to match the two datasets. Journeys and PM2.5 readings were mapped and shared with the resident surveyor. Once annonymised the maps were shared with all the residents at a workshop and via the website.
Results
Residents’ perceptions One of the primary ‘hotspots’ identified by the local residents was Beech Street tunnel. This is a covered road running east to west underneath the estate and traffic flow is dense throughout the day. Car park entrance and exit sites are also situated within the tunnel. The vents, which circulate the air from the tunnel into the estate itself, were also a cause for concern. Other areas discussed were London Wall, largely because of the construction traffic from local development sites, Barbican underground station, and Silk Street and Fore Street due to idling taxis and coaches.
The residents’ perceptions of both air quality and the main sources of local pollution are shown in the figures below along with their most frequently used modes of transport. These responses were collected through questionnaires at the start and end of the project; 50 and 51 residents responded respectively.
Figure 5 shows that the most frequently used mode of transport was walking at 55% followed by the tube at 24%. Very few residents travelled by car, train or bicycle.
Residents were asked how they felt about air quality around the Barbican Estate and the responses, outlined in figure 6 show that at the start of the project 40% of residents felt it was often very poor and 20% always very bad, whereas 59% and 14%, respectively, felt this way at the end of the project. Only 7% believed air pollution was not really a problem at the start of the project and collectively, 4% felt it was either good or not really a problem at the end. Note, although every participant was asked this question on both questionnaires, 19 more responded on the second compared with the first so the results here may not be directly comparable.
11

Science in the City: a Citizen Science Air Quality Monitoring Programme
Participants were asked to select three the main sources of local pollution from a predefined list. Respondents initially cited buses, closely followed by taxis, as being the main sources of pollution; this switched to taxis being the main source by the end of the project; an increasing from19% to 26%. The biggest shift in opinion was the increase in taxis and decrease in delivery vehicles, both changing by 7%. Construction and demolition and private cars changed by 6%, with the latter increasing, and the former decreasing. It is worthwhile
Figure 6: Residents’ responses to their perceptions of air pollution around the Barbican Estate at the beginning and end of the project
Figure 5: Barbican residents’ response when asked which their main modes of transport were
12

Science in the City: a Citizen Science Air Quality Monitoring Programme
noting that residents were given the option to select up to three choices and there were approximately 50% more selections made in the second questionnaire compared with the first.
Data were taken from a traffic survey commissioned by The City of London Authority in 2012 and compared with the residents’ perceptions of pollution sources. As figure 8 shows, the largest proportion of traffic at all three sites were taxis, followed closely by cars which together accounted for around 50% of the total traffic. The traffic data are a count of the number of vehicles passing a point within a 12 hour period and do not take into account idling, speed or size of engine. Private cars were under-represented in the residents’ perceptions although by the end of the project more residents cited these as a potential source of pollution than they did at the beginning of the project.
Figure 7: Barbican residents’ response to their perceptions of the sources of air pollution
13

Science in the City: a Citizen Science Air Quality Monitoring Programme
Over 90% of respondents agreed that their understanding of the health impacts of air pollution had improved as a result of participating in the project, 8% of respondents said that they were already aware of the impacts poor air quality has on health before engaging in the project.
When asked if the project had made residents aware of any measures the local authority undertakes to monitor and improve air quality in the City, 92% agreed it had, however, only 23% felt ‘sufficiently’ informed about its work to reduce air pollution.
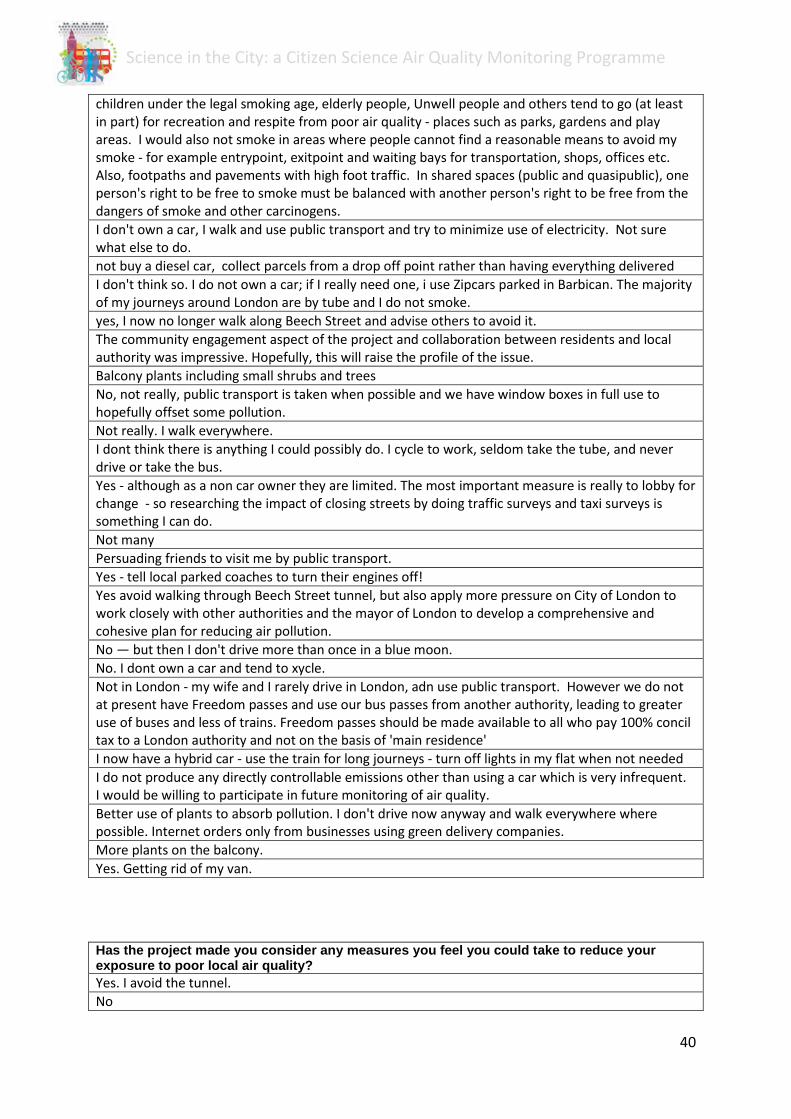
The various responses to questions regarding possible measures that could be taken to reduce exposure to air pollution can be found in Appendix 2. Eighty two percent of respondents agreed they would make changes to reduce their personal exposure to air pollution as a result of the project.
During one of the meetings a facilitated group discussion centred on key areas for action that residents would like the City of London Corporation to take to improve local air quality. Three key areas for action were identified and the issues raised are detailed in Tables 1 -3.
Figure 8: Results of a traffic survey conducted in October 2012 showing the proportion each vehicle type contributes to the total volume of traffic at three sites around the Barbican.
14

Science in the City: a Citizen Science Air Quality Monitoring Programme
A. Traffic restriction and control of polluting vehicles:
Table 1. Issues connected with traffic and vehicle control
Issue City Action Pedestrianisation of more streets in the City. Planners to consider options for
Beech Street and surrounding roads. Close Beech Street Tunnel to traffic, except for local access.
Planners to consider options for Beech Street and surrounding streets as part of the Barbican Area Strategy.
Stopping taxi’s cruising local streets by providing more taxi ranks in the area or promoting the use of the ‘Hailo’ app.
Air quality team to consider options in the Air Quality Strategy review.
Old polluting taxis to be banned from the City. Residents to undertake new taxi research to use as evidence to present to the GLA. Air quality team to consider options in the Air Quality Strategy review.
City of London to lobby the GLA to insist that catalytic convertors are retro-fitted on buses. This is a relatively low cost solution (£10k per vehicle) which could be made a requirement for anyone contracted to deliver bus services in the City. The converters have been fitted to approximately 600 buses out of the entire fleet of around. 8,000 buses operating in London so far. An interim measure until all buses are ‘clean’ could be to only allow clean buses on the most polluted/congested routes and use the ‘dirty’ buses on routes where there is less congestion – It was recognised that this would not be popular with residents in less congested areas!
City to continue to lobby GLA and Mayor's office.
Get better hybrid buses
City to continue to lobby GLA and Mayor's office.
The City to use its authority to ban or restrict the use of diesel vehicles on its streets. (Diesel has now been recognised as a carcinogen by the WHO and diesel emissions are acknowledged more far more harmful to heath than petrol.)
Air quality team to consider options in the Air Quality Strategy review.
City to use its authority to encourage the use of electric vehicles. The lack of charging points in the Square mile or on the Barbican Estate was raised as an issue. More electric charging points would encourage people to use electric cars.
Investigate the number of charging points in car parks.
15

Science in the City: a Citizen Science Air Quality Monitoring Programme
Issue City Action Intelligent traffic control – could re-phasing of traffic lights help reduce congestion and stationary vehicles with engines running? There is a SCOOT system in operation in the Beech Street tunnel - but this does not seem to be very effective.
Planners to review traffic management systems.
Freight consolidation at a site – using electric vehicles to distribute further. This will reduce the number of delivery vans and lorries. Some couriers now use bicycles, such as TNT and so this could be further encouraged.
Planners/air quality team to raise issue with Sustainability team who are investigating freight consolidation.
B. Green infrastructure
The beneficial effect of plants and trees, both as a physical barrier and through trapping particles in foliage, was suggested as a way of reducing the levels of pollution. Residents suggested the City should consider:
Table 2. Issues relates to green infrastructure
Issue City Action New development projects could incorporate planting e.g. green walls/roofs. Planting or installing green barriers on streets or existing buildings.
Planning guidelines already exist to encourage green roofs and walls. Air quality team to consider options in the Air Quality Strategy review.
More high walkways built Introduce more planting to reduce pollution, especially those plants known to be good air filters.
Resident Air quality champions to take up with City gardens team.
C. The control of emissions from construction sites
It was suggested that contractors who do not adhere to the regulations on pollution levels should be ‘named and shamed’ by publicising the monitoring data to make companies more accountable.
The City of London Corporation has a Code of Practice for demolition and construction sites. The requirements for controlling air pollution are based on guidance issued by the Greater London Authority. Large demolition and construction sites, particularly those located near to sensitive premises, are required to monitor air pollution and use the data to control emissions from the site through automatic alerts. Once an alert is received, the contractor will take action to mitigate the problem. The air quality data does not belong to the local authority. The City of London works closely with the industry to ensure that best practice is
16

Science in the City: a Citizen Science Air Quality Monitoring Programme
employed and strives to raise standards through its annual Considerate Contractor’s Environment Award and Sustainable City Award for Air Quality. Suggestions to improve the monitoring and its effects were:
Table 3. Issues related to the control of vehicle emissions from construction sites
Issue City Action As there is no regulatory enforcement activity could there be a requirement for contractors to pay for monitoring as part of Local Authority contracting. Spot checks could be effective – but the City of London lacks resources.
Air quality team to consider options in the Air Quality Strategy review.
Could residents be informed of high emission levels at monitored sites? Could this information be built in to the Air Quality Alerts app? This way, particularly polluted areas could be avoided.
Not possible to include in app but Air quality team to consider options in the Air Quality Strategy review.
17

Science in the City: a Citizen Science Air Quality Monitoring Programme
Nitrogen Dioxide External factors which effect on NO2 levels include meteorological conditions and traffic. Figure 9 shows the temperature range during the project’s monitoring period and figure 10 the rainfall for London. The Met Office states that the winter of 2013-14 was exceptionally stormy with heavy rainfall, spring and summer 2014 were close to the average and autumn was slightly warmer than average with rainfall slightly below average.
Figure 9: The daily temperature readings from Old Street weather station recording the mean average, low and high temperatures between October 2013 and September 2014. (Met Office, 2014)
Figure 10: The average monthly rainfall for London for the period 2010-2014 from Heathrow Airport weather station, taken from the Met Office data
18
0
20
40
60
80
100
120
140
160
180
Jan Feb Mar Apr May Jun Jul Aug Sep Oct Nov Dec
Rain
fall
(mm
)
Month
2010 2011 2012 2013 2014

Science in the City: a Citizen Science Air Quality Monitoring Programme
Figure 11 shows the average monthly traffic flow index for urban areas across Great Britain, where 100 is the annual average. The traffic is lowest in January and highest in September, October and November. This is a nationwide figure and not necessarily representative for the City of London. However, one might assume that the pattern shown in the nationwide traffic flow for December, April and August concurs with patterns seen within the City, during these key holiday periods. The different geographical scales used to monitor traffic flow compared with those used to measure nitrogen dioxide within the project makes it difficult to compare this national pattern with the local NO2 data collected. There are no long-term traffic data available on a local or regional scale over the monitoring period so it is difficult to draw any conclusions on the effect of traffic on NO2 concentrations within the Barbican Estate.
Of the 69 NO2 monitoring sites originally set up, sufficient data were only received from 65 due to tubes being removed and residents moving away or no longer being available to take part in the project. The monthly average readings of NO2 across all 65 monitoring sites were calculated and compared with the data collected by City of London Authority from their long-term background monitoring site at Speed House. Figure 12 shows that although the data from the project has in general recorded higher concentrations of NO2, apart from in December and January, it follows a similar pattern each year with the NO2 concentrations rising in winter and dropping in summer. It is worthwhile noting that the diffusion tube located at Speed House is in the centre of the Barbican estate, away from traffic, while the
Figure 11: The average daily urban traffic flow by month across Great Britain 2009-2013. 100 is the average. (Department for Transport, statistics, 2014)
19

Science in the City: a Citizen Science Air Quality Monitoring Programme
monitoring project includes a range of locations, including Beech Street and Aldersgate
Street, which have high levels of traffic.
Figure 13 shows the monthly average across the whole estate using data solely from this project. The blue horizontal line represents the EU annual mean limits. Five months out of the twelve monitored, April –August, showed levels below 40 µg/m3. November saw the highest monthly average at 52.15µg/m3. The lowest recordings were found in June. The average concentration for the whole estate over the period was 44.03µg/m3.
Figure 12: Monthly average readings of NO2 across the Barbican Estate for years 2011 – 2014 collected from long-term monitoring site by City of London and from local resident monitoring for 2013-14.
Figure 13: The monthly average reading of NO2 across the Barbican Estate Oct13 - Sept14. The dotted red box marks the time of Beech Street tunnel closure and the blue line indicates the EU target of 40µg/m3
Time of Beech Street closure EU annual average target
20

Science in the City: a Citizen Science Air Quality Monitoring Programme
The annual average reading for NO2 at each site monitored around the Barbican is shown in figure 14. The street level sites, highlighted in red, were all above the EU target, the highest being site 5 – Beech Street tunnel (figure 15), measuring an annual average of 94.89µg/m3, more than double (2.37) the annual limit. On the whole, the street level readings saw higher levels of NO2 than those within the estate. Site 8 (situated outside St Giles Church, within the estate interior) and 9 (situated behind the estate on Wood Street, opposite the junction with St Alphage Garden), however, saw their average levels of NO2 for the year fall below several sites located outside residents’ homes. Sites 1 -3; situated along the Barbican Highwalk, directly above Beech Tunnel, also saw relatively high levels of NO2. Measurements taken from Moorfields Highwalk (site 13), which is located a considerable distance from the tunnel, was, on average, between 5-18µg/m3 lower than those taken from the Highwalk above Beech Street. The second highest is site 6 where Aldersgate Street crosses Beech Street, measuring 85.39µg/m3, 2.13 times higher than the EU target. Thirty sites out of a total of 65 saw the average over the year fall within the EU limit value and 35 sites were higher meaning EU targets have not been met in almost 54% of the locations monitored.
Figure 14: The annual average reading of NO2 at each monitoring site in the Barbican between October 2013 and September 2014. Red bars show street level sites; site 5 is located in Beech Street tunnel and the blue line indicates the EU mean annual target of 40µg/m3
21

Science in the City: a Citizen Science Air Quality Monitoring Programme
Note: Site 71 – at London Wall and Noble Street - was only monitored for the last 6 months of the project. The first six months, no data were collected from this site and as seen in figure 14, these months included some of the highest monthly averages. Taking the data from all sites for only the final 6 months of the project, site 71 had the second highest monthly average after Site 6. The highest recording for site 71 was July which corresponded with when NO2 levels were lowest at Site 5.
Beech Street tunnel was closed to traffic from 21 June to 15 August and analysis on this approximate time interval i.e. the June and July readings which started 14 June and ended 14 August, showed that during that time NO2 levels were lower in 50 of the sites with the most pronounced decrease at site 5. When the tunnel reopened, the NO2 concentrations increased in the tunnel (site 5) and at all other sites except site 71 which showed a small decrease of 0.61µg/m3. Figure 16 highlights the difference in readings before, during and after the Beech Street tunnel closure, taking the average of two months for each time interval. Also of note is the similar drop in levels (figure 17) that were recorded at second monitoring site managed by the local authority, away from the Barbican, between June and August.
Figure 15: Images of diffusion tube at (left) Beech Street tunnel, Site 5 and (right) Beech Street Highwalk, Site 2.
22

Science in the City: a Citizen Science Air Quality Monitoring Programme
Figure 16: The average reading of NO2 at each monitoring site in the Barbican comparing before, during and after the Beech Street tunnel closure.
Figure 17: Running 24 hour mean concentrations of NO2 at The City Corporation background monitoring site; Sir John Cass School, Aldgate.
23

Science in the City: a Citizen Science Air Quality Monitoring Programme
Figure 18 shows a map highlighting the average reading over the whole year at each monitoring site. The blue dots denote NO2 concentrations below the EU target and the darkest red dots show that NO2 is at a level of at least twice the target amount. The map shows that the areas with the highest concentrations are those on or by the main roads. The pale pink dots show NO2 levels of between 40 and 60µg/m3. The majority of these are to the west, in particular at Lauderdale Tower which is situated at the intersection of Aldersgate and Beech Street. Six out of seven sites recorded NO2 levels between 40 and 60µg/m3 at Lauderdale Tower, whereas only four out of eight recorded similar levels at Shakespeare Tower, with the other four readings falling below 40µg/m3. Almost all the sites which overlook the gardens and lakes are below 40µg/m3.
Figure 18: Nitrogen dioxide annual mean at each monitoring site across the Barbican and height from street level
24

Science in the City: a Citizen Science Air Quality Monitoring Programme
Particulates: PM2.5
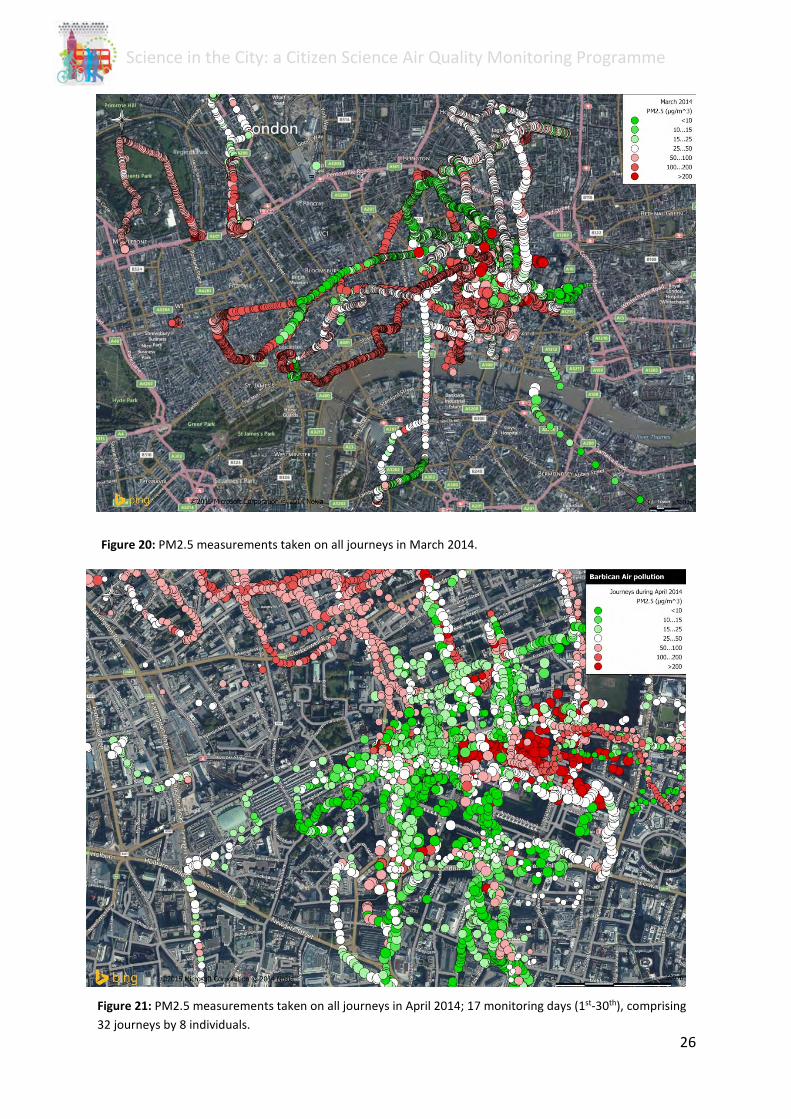
Monitoring for particulates took place between the months of February and May, 2014. Due to the methodology it is difficult to compare the data directly as variables include both location and time. Composite maps of all the journeys taken in each month from February to May 2014 are shown in figures 19 to 22 show. Where the points are bright red, PM2.5 is measured at 200µg/m3 or over, and green depicts measurements at the lowest end of the scale - less than 10µg/m3. Although data cannot be directly compared with EU standards, it is indicative and can be used to compare spatial and temporal variability over the monitoring period. Any point represented by one of the three shades of green indicates that the readings were less than 25µg/m3. Points with a colour ranging from white to red show readings over 25µg/m3. February was the month with the lowest levels measured and May had the least number of journeys recorded.
During the monitoring period the UK was subject to a dust storm blown in from the Sahara and this had an effect on PM2.5 levels between the end of March and beginning of April. Figure 23-24 shows the levels of PM2.5 that residents were exposed in the days leading up to, during (figure 25-28), and after (figure 29) this episode. It is clear to see the increase in PM2.5 by the number of red points displayed on the map and the decrease after with the 5th April showing mainly green points.
Figure 19: PM2.5 measurements taken on all journeys in February 2014, covering 10 monitoring days (16-28th), comprising seventeen journeys by four individuals.
25
Science in the City: a Citizen Science Air Quality Monitoring Programme
Figure 20: PM2.5 measurements taken on all journeys in March 2014.
Figure 21: PM2.5 measurements taken on all journeys in April 2014; 17 monitoring days (1st-30th), comprising 32 journeys by 8 individuals.
26

Science in the City: a Citizen Science Air Quality Monitoring Programme
Figure 22: PM2.5 measurements taken on 2 monitoring days (1st-2nd) during May, 2014, comprising 3 journeys by 2 individuals.
Figure 23: PM2.5 measurements taken on all journeys 24th March 2014, comprising 1 journey by 1 individual.
27

Science in the City: a Citizen Science Air Quality Monitoring Programme
Figure 24: PM2.5 measurements taken on all journeys on 25th March 2014, comprising 2 journeys by 2 individuals.
Figure 25: PM2.5 measurements taken on all journeys on 28th March 2014, comprising 2 journeys by 2 individuals. 28

Science in the City: a Citizen Science Air Quality Monitoring Programme
Figure 26: PM2.5 measurements taken on 29th March 2014; 1 journey by 1 individual.
Figure 27: PM2.5 measurements taken on all journeys 1st April 2014.
29

Science in the City: a Citizen Science Air Quality Monitoring Programme
Figure 29: PM2.5 measurements taken on journeys by 3 individuals on 4th April 2014.
Figure 28: PM2.5 measurements taken during one journey by one individual on 2nd April 2014.
30

Science in the City: a Citizen Science Air Quality Monitoring Programme
Conclusion
Community Participation and Awareness One of the primary aims of Science in the City was to increase public understanding about air pollution, its causes, and effects and how concentrations vary both spatially and from day to day. This was done by adopting a bottom-up citizen science approach to monitoring air quality, using simple methods and tools, to enable participation by those interested.
The level of participation and commitment of residents to conduct this study over a whole year is testament to not only the relative ease of the methodology but to their genuine concern about air quality within the City and willingness to engage in the wider discourse. Most of the residents involved (92%) had not previously taken part in any kind of environmental monitoring project and the majority (94%) said that they would be happy to participate in future projects of this kind. Not all of those who expressed an interest, or who attended meetings participated in either of the two monitoring exercises. However, those that did found it useful and most residents, directly involved or not, were happy with the way the project was carried out (92%).
The data gathered by the community provides a valuable insight into the temporal and spatial variability of air quality across the area. Where many residents initially felt the local air quality was either always very bad or often poor, the data gathered demonstrated that this is not always the case and the situation is not uniform across the area. In fact, by the end of the project a small percentage (2%) of residents felt that air quality was good at times. Less believed it was bad all, or sometimes, but a larger proportion of residents felt that it was still often quite bad.
The City of London Corporation has and continues to take steps to improve air quality across the Square Mile. At the end of 2014 they released a draft of their Air Quality Strategy 2015 – 2020 outlining the action and further measures to be undertaken up to 2015. Issues and ideas that were raised by residents during group discussions were invited to be fed into the consultation leading up to the development of this draft.
What can we take from the findings? Monitoring nitrogen dioxide over the course of the year shows that the EU target of 40µg/m3 is not currently being met. Although there was variation between months and across monitoring sites, the combined annual average for the area as a whole (44.03µg/m3) is still above the levels aimed for. Beech Street tunnel, which was identified by residents as a ‘hotspot’ before any monitoring took place, had the highest NO2 concentrations. Given that this road was closed to traffic for two of the monitoring months, the usual annual average is likely to be higher. There was no evidence to suggest that by closing Beech Street tunnel the
31

Science in the City: a Citizen Science Air Quality Monitoring Programme
diverted traffic increased pollution elsewhere within the monitoring area since most sites showed a decrease in NO2 levels over those two months. This decrease could however could be an artefact of the annual traffic flow reduction during the summer months, thus masking the effect of the potential increase in traffic on alternative routes. With no monthly traffic counts to quantify this, it is difficult to draw any conclusion on the effect the tunnel closure had on the surrounding area. Monitoring in London Wall; a potential diversion route during tunnel closures, took place over the last six months only so it’s difficult to see what influence, if any, the changes in traffic flow had. Needless to say, London Wall saw some of the highest levels over the latter part of the year. To assess whether a future closure of Beech Street would improve the local air quality without simply diverting the problem elsewhere, further investigation would be required covering a wider area and the diversion routes.
Nitrogen dioxide levels at some monitoring sites were more than twice the EU target, including Beech Street where the diffusion tube was attached to the bus stop (figure 15). Residents using this bus stop on a regular basis, may wait several minutes for a bus and are therefore potentially exposed to very high levels of NO2 which could be harmful to their health. Suggestions to combat this other than the extreme solution of closing the tunnel to traffic could include: residents using the next closest bus stop; lobbying Transport for London to introduce a real-time schedule tracker to the bus stop, which would allow residents and commuters to assess how long until the next bus is due and could reduce wait times; and improving ventilation in the tunnel. The current ventilation system is from the 1960s and may no longer be sufficient to cover the airflow demands. The City Corporation has committed to continue liaising with Greater London Authority and Transport for London over additional action to reduce emissions from buses and taxis.
Monitoring PM2.5 demonstrated the variability; day by day and from one location to another that is found in a relatively small area. This was heightened by the impact the Saharan dust storm had on the air quality for several days but by the 4th April, the concentration of PM2.5 had returned to previous background levels. This was an episode that affected large swathes of the UK and Europe, and although air quality within the Barbican was very poor during this episode, it was in fact temporary situation. The effect the dust storm had on the UK illustrates that local air quality is influenced not only by local and regional sources but also by transboundary pollution from continental Europe and beyond. Efforts are needed to reduce local and regional conentrations of PM2.5 from anthropogenic sources so that episodes such as these do not compound the local and regional problem even further. The problem of international sources of pollution is increasingly being acknowledged through various legislative vehicles, such as The National Emission Ceilings Directive (2001/81/EC) and the recent revision of the UNECE Convention on Long Range Transboundary Air Pollution’s Gothenburg Protocol, both of which aim to reduce transboundary transport of a number of air pollutants which affect the concentrations of background PM2.5 by setting limits on their emission from Member States.
32

Science in the City: a Citizen Science Air Quality Monitoring Programme
The City Corporation, in collaboration with King’s College, has developed a mobile application (CityAir) designed to alert users to high pollution events in London and give advice on simple actions Londoners can take to lower their emissions and their exposure in the city. We would recommend all residents with a smart phone make use of this app to increase awareness of local air pollution hotspots and episodes in order that these can be avoided when and where necessary. Taking alternative walking and cycling routes within the Barbican should also be something residents opt to do to reduce their exposure. The high-walks and areas within the estate interior had lower levels of nitrogen dioxide than found at street-level, in most cases. An exception to this was the Barbican High-walk, which, compared to the alternative option of Beech Tunnel, would still considerably reduce exposure to high levels of pollution if taken.
Residents’ perceptions of traffic sources did not tally completely with the traffic counts but should not be disregarded. The discrepancy from actual counts could be due to the observed behaviour of vehicles rather than the volume, in particular idling taxis and the size of engines. The Corporation of London already target vehicles within the Square Mile, not just taxis, which are difficult to deal with on rank. Signage is erected in areas of concern. Residents could potentially extend their community air quality map to log sites which appear problematic and encourage the local authority to erect signs where not yet present. As part of The Corporation of London’s awareness programme they encourage traffic wardens to speak to drivers who leave engines on and they will issue Fixed Penalty Notices to drivers who refuse to turn engines off when asked to do so. Demolition and construction sites and businesses are also targeted through the CityAir campaign where they are encouraged to introduce no idling policies for deliveries. The idea of consolidating deliveries and HGVs to avoid peak traffic times could also be investigated. As a result of this project, residents have already been talking to local businesses, under the CityAir programme, about how they can help improve local air quality.
Some residents have already decided to make changes to reduce their exposure and their contribution to air pollution. These include: ‘greening up’ their balconies with air-filtering plants; avoiding Beech Street tunnel and other hotspots; reducing their use of private transport and collecting parcels rather than having them delivered. As a direct result of the NO2 monitoring some residents have decided to only open the windows of their flat that face inwards into the Estate rather than a roadside window or avoid opening windows and vents at peak traffic times. This clearly demonstrates an increased awareness amongst residents and suggests that similar programmes would be worthwhile implementing across the City and beyond.
Various suggestions were made by residents to be considered by The City Corporation. These suggestions included: ‘Greening up’ the area with more trees, plants and living walls; close Beech Street tunnel to traffic; introduce penalties for idling taxis, delivery vehicles and buses; adjust the phasing of traffic lights to reduce congestion; improve the ventilation at
33

Science in the City: a Citizen Science Air Quality Monitoring Programme
Beech Street tunnel; only allow green buses; encourage the use of electric vehicles by promoting and installing more charging points in the area and extending the Ultra Low Emission Zone. The NO2 monitoring shows that pollution levels are high around the main roads and low by the gardens and lakes. This could support the idea of using plants as an air filter and that pedestrianisation or traffic control would reduce air pollution. Before any of these ideas could be implemented, they would warrant further research or setting up trials. Many ideas go beyond the scope and control of the local authority so would need wide consultation.
The project’s success was made possible by combining residents’ local knowledge and their commitment, with the technical knowledge and experience provided by Mapping for Change, and the genuine willingness on the part of The City of London Corporation. Local insights gave context to the monitoring programme making the data collected more relevant to those involved adding scientific evidence to the residents’ opinions giving strength to the voice of the community. The results of this project offer a valuable resource which can be used as a foundation to effect change and tackle the problem of poor air quality in the City of London.
34

Science in the City: a Citizen Science Air Quality Monitoring Programme
References
DEFRA, Nitrogen Dioxide in the United Kingdom. http://uk-air.defra.gov.uk/assets/documents/reports/cat11/1212141150_AQEG_Fine_Particulate_Matter_in_the_UK.pdf.
Harrison R.M., Giorio C., Beddows D.C., and Dall’Osto M. (2010). Size distribution of airborne particles controls outcomes of epidemiological studies. Sci. Total Environ., 409, 289-293.
Laumbach, R. J., & Kipen, H. M. (2012). Respiratory health effects of air pollution: update on biomass smoke and traffic pollution. Journal of allergy and clinical immunology, 129(1), 3-11.Nitrogen Dioxide in the United Kingdom (2004). Air Quality Expert Group.
London Assembly, (2012) Air pollution in London - issues paper. http://www.london.gov.uk/mayor-assembly/london-assembly/publications/air-pollution-london-issues-paper
Met Office, 2014 http://www.metoffice.gov.uk/climate/uk/summaries/2013/annual.
Rückerl, R., Schneider, A., Breitner, S., Cyrys, J., & Peters, A. (2011). Health effects of particulate air pollution: a review of epidemiological evidence. Inhalation toxicology, 23(10), 555-592.
Strak, M., Janssen, N. A., Godri, K. J., Gosens, I., Mudway, I. S., Cassee, F. R., ... & Hoek, G. (2012). Respiratory health effects of airborne particulate matter: the role of particle size, composition, and oxidative potential-The RAPTES project. Environmental health perspectives, 120(8), 1183-1189.
35

Science in the City: a Citizen Science Air Quality Monitoring Programme
Appendix 1 Site No.
Location Site No.
Location
1 Barbican High Walk Above Beech St tunnel
35 Willoughby House 5th floor
2 Barbican High Walk Above Beech St tunnel
36 Golden Ln 6th floor
3 Barbican High Walk Above Beech St tunnel
37 Shakespeare Tower 22nd floor
4 Beech St/Whitecross jct. 38 Shakespeare Tower 22nd floor 5 Beech St – bus stop 39 Inside flat 6 Aldersgate St /Beech St jct. 40 Aldersgate St 16th floor 7 Aldersgate St 41 Thomas More House 7th floor 8 St Giles Church 42 Mountjoy House - east 9 Wood St /St Alphage Gdn jct. 43 Thomas More Highwalk 5th floor –
north 10 Moor Ln/ jct Fore St 44 Thomas More Highwalk 6th floor –
south 11 Moor Ln 45 Defoe House South 12 Silk St 46 Seddon House facing Aldersgate St 13 Moorfields High Walk 47 Speed House on Silk St 14 Lauderdale Place 15th floor 48 Thomas More House - north level 2 15 Shakespeare Tower 34th floor 49 Thomas More House – south level 2 16 Ben Jonson House 4th floor 50 Moor Ln above car park ramp 17 Ben Jonson House 3rd floor 51 35th Floor Lauderdale Tower - east 18 Shakespeare Tower 6th floor 52 Shakespeare Tower 17th floor
northwest 19 Above Beech St/ Bridgewater St
1st floor 53 Defoe House 2nd floor above Beech St
ventilation 20 Fore St opp St Alphage 54 Seddon House east 21 Shakespeare Tower 17th floor 55 Silk St opp Milton St 1st floor 22 Beech St 13th floor balcony 56 Frobisher Crescent 8th floor 23 Fann St /Bunyan Court car park 57 Gilbert Bridge 9th floor 24 Lauderdale Tower 15th floor 58 Defoe House 3rd floor 25 Lauderdale Tower 11th floor 59 Defoe House overlooking garden 26 Cromwell Tower 29th floor 60 Cromwell Tower – west 28 Bunyan Court off Fann St 62 Beech St/ Bridgewater St 29 Lauderdale Tower 63 Lauderdale Place 2nd floor overlooking
parking 31 Fore St 64 Silk St 6th floor above car park
entrance 32 Internal Lake 8th floor 66 Gilbert House 3rd floor
36

Science in the City: a Citizen Science Air Quality Monitoring Programme
33 Andrewes House 68 Brandon Mews car park 34 Thomas More House 69 Shakespeare Tower 17th floor 70 Frobisher Crescent 8th floor 71 London Wall
Appendix 2
As a result of the project, do you have any ideas on what could be done to improve air quality within the Barbican or the City of London? Close the Barbican tunnel to traffic. Reduce traffic so it is not a pass through point for the rest of london Reduce the exposure of homes to pollution, so don't "punch holes" into the walls of the barbican or Beech Street tunnel to allow air pollution to leak more easily from roads to flats 1) Reduce number of taxis 2) Ensure that ALL buses are "green". 3) Reduce occasions when traffic diversions are directed through the Square Mile's residential area 4) Increase no. of electric car charging points and make sure they all work More green areas, more restrictions on heavy goods vehicles using certain streets, better ventilation in tunnels such as Beech Street tunnel. Close, or at the very least, significantly reduce traffic in the Beech St tunnel. Move as speedily as possible to banning polluting vehicles from the City. Consider the impact on long term traffic routes due to closure of main roads and streets because of the long term diversions due to the years of Crossrail construction. Close Beech Street. Would make surrounding areas more polluted. Encouraging non-polluting vehicles. On the spot fines for delivery vehicles who leave engines running. Suitable planting of trees within Barbican to absorb pollution. Emissions from office buildings are part of the problem - many pump out black oily smoke when firing up or maintaining their boilers. Much stricter controls on emissions from heating & air conditioning systems are needed Strongly trend towards the use of zero emissions vehicles such that in 10 years 100% of vehicle are zero emissions, and in 5 years all public transport and taxis are zero emission. And in 2 years the trend is well defined and actually started. Closing Beech Street to through traffic as many people walk through it daily. It was much cleaner and less noisier this summer when it was closed. Beech Street tunnel is an obvious "hot spot" for poor air quality and given the high numbers of pedestrians in the tunnel this area should be addressed as a matter of urgency, but as part of a wider strategy to avoid simply pushing the problem somewhere else. Move the meat market out of the City of London. Lorries from across UK and even beyond plus smaller distribution vans coming to Smithfield 5 days a week and sometimes idling with the engine on and often causing traffic congestion in the area CANNOT be conducive to reducing pollution. Too much new building going on, with its concomitant heavy traffic. The Beech Street tunnel traps fumes from vehicles using it, making people, such as myself with heart and breathing problems, limiting access as a thoroughfare. Restrict HGV's from entry into the City. Close Beech Street tunnel to vehicles. More pedestrian only zones. Pedestrianise the Beech street tunnel A) Adjusting the phase of the traffic lightsat the end of Beech Street tunnel to avoid long lines of traffic with their engines running. B) Install extractor fans into the tunnel Continue to increase the areas for pedestrations
37

Science in the City: a Citizen Science Air Quality Monitoring Programme
Within Barbican I think the City of London should focus on what might be done about Beech Street tunnel. Make Beech Street free from polluting traffic or improve the ventilation. More ultra low emission vehicles and promotion of walking and cycling for personal transport. ban traffic from Beech Street As discussed at workshops : - cleaner buses on beech street routes - taxis not to running engines when stopped - more trees, planting, and green spaces including living walls of plants - new planning permissions should insist on this. The City Corporation to use its influence to press the Mayor and central government to do more about the problem. Reduce number of diesel powered vehicles in the City, particularly heavy goods vehicles. Make business responsible for staggered delivery to avoid unnecessary congestion. Strictly enforce anti-polluting rules for engines on all vehicles to reduce the clouds of black smoke emitted from many and reduce nitrogen dioxide levels to within agreed EU environmental standards. Generally improve traffic flow management to reduce huge traffic queues caused by lack of appropriate of road works and inappropriate traffic light phasing. Both problems have been very evident in recent weeks during journeys from Kent and Essex back into the City at off-peak weekend times where travel times have been in many cases more than doubled without an other cause such as accidents or actual road maintenance. Ban diesel! Gradually pedestrianise more of the roads around the barbican, allowing vehicle access only for deliveries. Greater levels of pedestrianisation. Only by reducing traffic will levels go down - as was demonstrated by the closure of Beech Street during the summer. Greater efforts should be made to permanently close some streets. The City should also redouble its efforts to get TFL to be smarter about its bus routes and use the least polluting buses on routes with high concentrations of people - both residents and pedestrians in general. There also needs to be more active engagement with the taxi lobby to get greater use of ranks, better behaviour of taxis when parked - and to try and reduce the numbers plying for hire on the streets - by encouraging hailing using smart phone apps etc. More needs to be done to encourage the use of electric vehicles - with positive inducements such as reduced parking charges and electric charging points. Closing Beech Street tunnel to through traffic would be a great help to those of us who live above it, and who suffer the effects of really terrible pollution through the vents right next to our flats. Beyond that, making the City of London a diesel-free zone would be a great idea. Permanently reduce traffic in Beech St tunnel; put limits on diesel vehicles; reduce no. of construction sites More supervision of stationary vehicles with engines running(traffic wardens?) - particularly coaches,taxis and illegally parked cars with drivers waiting to collect someone and needing to move quickly if they see a warden.In a five minute walk each day to the station I tell at least four vehicles to turn off their engines. More communication with all coach companies making them aware of penalties. More pedestrianised areas. Encourage switch to non-diesel taxis, more hydrogen buses and give tax incentives to lorry or van drivers to switch to more fuel efficient vehicles. Pedestrianize more streets, especially in residential areas. A pedestrian Beech Street would be great! Stop HGV's travelling through the City. Restrict vehicles using Beech Street tunnel. Reduce construction work and replace building sites with more green places where workers and residents could relax during their lunchtimes and leisure hours, and children have somewhere to play, e.g. Fortune Park is full of parents and children every day of the week. Reduced traffic and reduced congestion Improve flow of traffic to reduce congestion eg promote more cycling and reduce traffic lights. 1 ULEZ should be supported but probably needs to be extended beyond the current congestion charge zone 2 Beech Street tunnel should be closed to motorised traffic 3 There should be large
38

Science in the City: a Citizen Science Air Quality Monitoring Programme
fines for vehicles running their engines when stopped for longer than a traffic light stay 4 Use of headlights in daylight should be banned - little evidence that it affects safety, but it increases fuel use, hence more pollution and more CO2 Have more pedestrian areas - give more details of the problems of pollution in leaflets and emails - bring forward dates set for banning taxis and other vehicles that cause pollution. A lot will depend on how well the City can enlist cooperation and coordination with the other London boroughs on air quality issues. Planting more trees and shrubs where possible in the City. I think that the delivery companies are going to have to find a way to collaborate on trips into central London. Traffic is now so heavy, journeys are slow and air unnecessarily polluted. In this day & age there should be more use of taxi calling/booking software to reduce taxis driving round. Also stricter cleaner exhaust requirements for older taxis & buses. ban on diesel engines perhaps as they are so much more polluting. 20 mph speed limit may help & buses are gradually becoming less polluting. More should perhaps be done to assess the effects of diesel fumes, which in some ways seem worse than petrol fumes. Stop taxis cruising. Buses & taxis to use clean means of propulsion. Reduce pollution in Beech Tunnel but not by extracting or blowing the pollution somewhere else. The sources of pollution need controlling, i.e. traffic fumes. This means less traffic, cleaner vehicles or fewer or no vehicles in the tunnel. To me the standout problem is taxis and the use of taxis. Beech Street is disgusting. Taxi after taxi sitting in a line with their engines on at peak time. 1. There are far to many old taxis on city roads. A few years ago I was asked by TfL to get rid of my van because its age meant it was a gross polluter. Fine. Why do I see taxis of the same age as my old van still on our roads? Stricter controls need to be put in place to take the older taxi fleet off the roads. 2. There needs to be a campaign to try and change people's use of taxis in the City. 3. A real commitment towards an emission free taxi fleet. I think I am right in saying it is supposed to be emission free by 2020. I don't get a sense it is going to happen. 4. When taxis are not on the move they should turn the engines off - especially in Beech Street. This should be policed. 5. Close Beech Street to traffic!! Has the project made you consider any measures you feel you could personally take to improve local air quality? No. I don't have a car and I ride a bike. No explore plants that could sequester pollution 1) Possible invest in an electric car, providing i was sure that the Barbican estate and London generally had enough working charging 2) Never use a taxi 3) Reduce building works in the Square Mile Yes. As I walk everywhere locally I now take less polluting routes. Avoid using car. As I don't drive and walking is my preferred mode of travel it is difficult to see what measures are available to me. I do not think there is much more I could personally do No. I don't have a car and mostly walk or use public transport. supporting electric buses in London Supporting bicycles and walking Yes. We recently sold our car and have gone car-free. No. I don't smoke or drive and I walk, or use public transport, to get anywhere. Yes Stay involved so that people affected by air pollution have a voice, are heard, and so that reasonable actions are taken to address the serious health and well being concerns arising from air pollution in the City of London. If I were a smoker, I would consider avoiding smoking in outdoor spaces where
39
Science in the City: a Citizen Science Air Quality Monitoring Programme
children under the legal smoking age, elderly people, Unwell people and others tend to go (at least in part) for recreation and respite from poor air quality - places such as parks, gardens and play areas. I would also not smoke in areas where people cannot find a reasonable means to avoid my smoke - for example entrypoint, exitpoint and waiting bays for transportation, shops, offices etc. Also, footpaths and pavements with high foot traffic. In shared spaces (public and quasipublic), one person's right to be free to smoke must be balanced with another person's right to be free from the dangers of smoke and other carcinogens. I don't own a car, I walk and use public transport and try to minimize use of electricity. Not sure what else to do. not buy a diesel car, collect parcels from a drop off point rather than having everything delivered I don't think so. I do not own a car; if I really need one, i use Zipcars parked in Barbican. The majority of my journeys around London are by tube and I do not smoke. yes, I now no longer walk along Beech Street and advise others to avoid it. The community engagement aspect of the project and collaboration between residents and local authority was impressive. Hopefully, this will raise the profile of the issue. Balcony plants including small shrubs and trees No, not really, public transport is taken when possible and we have window boxes in full use to hopefully offset some pollution. Not really. I walk everywhere. I dont think there is anything I could possibly do. I cycle to work, seldom take the tube, and never drive or take the bus. Yes - although as a non car owner they are limited. The most important measure is really to lobby for change - so researching the impact of closing streets by doing traffic surveys and taxi surveys is something I can do. Not many Persuading friends to visit me by public transport. Yes - tell local parked coaches to turn their engines off! Yes avoid walking through Beech Street tunnel, but also apply more pressure on City of London to work closely with other authorities and the mayor of London to develop a comprehensive and cohesive plan for reducing air pollution. No — but then I don't drive more than once in a blue moon. No. I dont own a car and tend to xycle. Not in London - my wife and I rarely drive in London, adn use public transport. However we do not at present have Freedom passes and use our bus passes from another authority, leading to greater use of buses and less of trains. Freedom passes should be made available to all who pay 100% concil tax to a London authority and not on the basis of 'main residence' I now have a hybrid car - use the train for long journeys - turn off lights in my flat when not needed I do not produce any directly controllable emissions other than using a car which is very infrequent. I would be willing to participate in future monitoring of air quality. Better use of plants to absorb pollution. I don't drive now anyway and walk everywhere where possible. Internet orders only from businesses using green delivery companies. More plants on the balcony. Yes. Getting rid of my van.
Has the project made you consider any measures you feel you could take to reduce your exposure to poor local air quality? Yes. I avoid the tunnel. No
40

Science in the City: a Citizen Science Air Quality Monitoring Programme
Pollution is generally beyond a person's control: this is mainly a public health matter, which the current Local Authorities are not sufficiently prioritising and tackling. Because of this the NHS is suffering as well as our lives are being demonstrably shortened. Avoid certain areas such as Beech Street Tunnel Avoid walking through areas of worst air pollution. Shut the air vents to the flat and continue to use information to refine walking routes. Use North Podium rather than Beech Street. At the moment North Podium is polluted by application of waterproofing chemicals in Beech Garden. Stay indoors? I definitely consider the best route when walking and try to avoid busy roads and junctions Yes. Preserve and *extend* the highwalks. The tragic destruction of highwalks throughout the the City has exposed people to both pollution and risk of death or injury from read traffic. To support the closure of Beech Street to through traffic because the pollution was considerably reduced when there was no through traffic Yes, I need to avoid walking in the Beech Street tunnel but this is difficult to do due to convenience. Similarly the main streets around the Victoria area where my office is situated suffer from very poor air quality due to heavy traffic congestion. This makes for a complex set of conflicting circumstances to take a walk over my lunch period for health benefits, but my only option is to walk in a heavily polluted environment. Yes. Given that the readings at the rear of the flat are much worse than those at the front, we've had the seals on the windows / doors checked and renewed Yes. Keep the windows facing Beech Street shut during times of traffic congestion. Don't walk near the curb, avoid Beech Street and rat-runs, and move away! I do all that I can to avoid walking through the Beech street tunnel and I have advised friends and visitors to do the same. I do not open windows in our flat during times of peak polution arising from traffic through the beech street tunnel. I cover my mouth with my shirt if I cannot avoid passing through the Beech Street tunnel, say on my way back Home from the gym, or when I pick up a package from the car park (I pity the staff who have to work down there with little protection from polution, so close to the busy tunnel), or when I dispose of household waste and recycling in the designated area along the tunnel (the disposal bay is effectively "in" the tunnel in terms of air quality). I avoid the Beech Street tunnel whenever possible No, I still have to walk to shops, station etc. consider where I walk I am more conscious of using routes away from traffic when I am walking. Avoid walking through beach street tunnel Staying indoors Opening only the back door walking on back streets helps, but see my comment below about long range transport. It would be a mistake to push the burden of exposure reduction on to the individual. The biggest reductions will come from large scale national/regional policies. walk different routes Taking traffic free routes when possible - and avoiding Beech Street Yes, wherever possible walking within the Barbican rather than on the external roadways. Yes, I avoid the Silk Street tunnel now! To keep cycling as air the study showed that commuting above ground but not in a vehicle exposes you to the least air pollution. Yes - I avoid the worst streets - and do not go running when air quality is particularly poor. I now actively avoid walking through Beech Street tunnel, which is so horrible and (often very) polluted I feel it is a serious health hazard. Reinforced my view of areas to avoid
41

Science in the City: a Citizen Science Air Quality Monitoring Programme
Not using the Beech St tunnel in the Barbican.Walking on the pavement as far away from the road as possible. In one way streets,walking the side away from exhaust pipes. Using parallel streets as much as possible when visiting busy streets like Oxford Street. Yes to avoid walking through Beech Street tunnel and walk on the inside of pavements to get away from exhausts as much as possible. Travel less by tube, and travel less on hazy days. Yes - avoid using the covered road as a pedestrian I have reduced my use of tube due to such poor air qualuty. Avoid walking in Beech Street tunnel, walk on highwalks instead walk through a park or garden when going shopping rather than a busy road or tunnel - use side streets for preference Nothing that I was not already doing previously. No walking in Beech Street. Though our bedroom windows back on to the air vents above the tunnel - so that is a problem. Keep bedroom windows closed and interior doors open so air comes from living room balcony door overlooking Thomas More garden. Try to improve my lung capacity through exercise Yes. Avoid known areas of high pollution and deep underground trains. Yes. I steer well clear of Beech Street especially at peak times and take back routes when walking
42