Science Implementation Strategy for the North American ... · • Support continuing quantitative...
83
1 2 3 4 5 6 7 8 9 10 11 12 13 14 Science Implementation Strategy for the North American Carbon Program Scott Denning, Ram Oren, David McGuire, Christopher Sabine, Scott Doney, Keith Paustian, Margaret Torn, Lisa Dilling, Linda Heath, Pieter Tans, Steven Wofsy, Robert Cook, Arlyn Andrews, Gregory Asner, John Baker, Peter Bakwin, Richard Birdsey, David Crisp, Kenneth Davis, Christopher Field, Christoph Gerbig, David Hollinger, Daniel Jacob, Beverly Law, John Lin, Hank Margolis, Greg Marland, Herman Mayeus, Chuck McClain, Brent McKee, Chip Miller, Steven Pawson, James Randerson, John Reilly, Steven Running, Scott Saleska, Robert Stallard, Eric Sundquist, Susan Ustin, Sashi Verma Prepared for the Carbon Cycle Science Steering Group and the Interagency Working Group on Carbon 15 Executive Summary 16 Poorly understood “sink” processes currently remove about half of global CO 2 17 emissions arising from the combustion of fossil fuels, but there is little reason to expect 18 these sinks to continue to operate unchanged over the coming decades. Uncertainties in 19 the future behavior of the carbon cycle are currently among the greatest sources of 20 uncertainty in climate over the next century, ranking with anthropogenic emissions and 21 imperfect understanding of the physical climate system. The study of the carbon cycle 22 involves scientists from many disciplines: terrestrial ecologists, oceanographers, energy 23 economists, and atmospheric scientists. 24 A broad community of scientists involved in the study of the carbon cycle has 25 conducted a multiyear process of scoping, prioritizing, and planning for a comprehensive 26 and rationalized program of interdisciplinary research in this area. Working with as many 27 as nine US agencies, the community produced A US Carbon Cycle Science Plan in 1999. 28 The plan reflects input of hundreds of prominent scientists and addresses three 29 fundamental questions: (1) What has happened to the carbon dioxide that has already 30 been emitted by human activities? (2) How do land management and land use, terrestrial 31 ecosystem and ocean dynamics, and other factors affect carbon sources and sinks over 32 time? and (3) What will be the future atmospheric carbon dioxide and methane 33 concentrations resulting from environmental changes, human actions, and past and future 34 emissions? The Strategic Plan for the Climate Change Science Program (USGCRP, 35 2003) envisions six research program elements to address these questions. The North 36 American Carbon Program (NACP) is one of the first of these six major elements 37 targeted for implementation planning and has been identified as a near-term priority 38 under the Climate Change Research Initiative. Here we present an Implementation 39 Strategy for the NACP, building on the already published NACP Science Plan (Wofsy 40 and Harriss, 2002). The construction of this document has involved significant 41 community input, including comments on an early draft presented to over 200 scientists 42 participating in the first NACP investigators workshop in May 2003.
Transcript of Science Implementation Strategy for the North American ... · • Support continuing quantitative...

12
3456789
1011
12
1314
Science Implementation Strategy for the North American Carbon Program
Scott Denning, Ram Oren, David McGuire, Christopher Sabine, Scott Doney, Keith Paustian, Margaret Torn, Lisa Dilling, Linda Heath, Pieter Tans, Steven Wofsy,
Robert Cook, Arlyn Andrews, Gregory Asner, John Baker, Peter Bakwin, Richard Birdsey, David Crisp, Kenneth Davis, Christopher Field, Christoph Gerbig,
David Hollinger, Daniel Jacob, Beverly Law, John Lin, Hank Margolis, Greg Marland, Herman Mayeus, Chuck McClain, Brent McKee, Chip Miller, Steven Pawson, James Randerson, John Reilly, Steven Running, Scott Saleska, Robert Stallard,
Eric Sundquist, Susan Ustin, Sashi Verma
Prepared for the Carbon Cycle Science Steering Group and the Interagency Working Group on Carbon
15 Executive Summary 16 Poorly understood “sink” processes currently remove about half of global CO2
17 emissions arising from the combustion of fossil fuels, but there is little reason to expect 18 these sinks to continue to operate unchanged over the coming decades. Uncertainties in 19 the future behavior of the carbon cycle are currently among the greatest sources of 20 uncertainty in climate over the next century, ranking with anthropogenic emissions and 21 imperfect understanding of the physical climate system. The study of the carbon cycle 22 involves scientists from many disciplines: terrestrial ecologists, oceanographers, energy 23 economists, and atmospheric scientists.
24 A broad community of scientists involved in the study of the carbon cycle has 25 conducted a multiyear process of scoping, prioritizing, and planning for a comprehensive 26 and rationalized program of interdisciplinary research in this area. Working with as many 27 as nine US agencies, the community produced A US Carbon Cycle Science Plan in 1999. 28 The plan reflects input of hundreds of prominent scientists and addresses three 29 fundamental questions: (1) What has happened to the carbon dioxide that has already 30 been emitted by human activities? (2) How do land management and land use, terrestrial 31 ecosystem and ocean dynamics, and other factors affect carbon sources and sinks over 32 time? and (3) What will be the future atmospheric carbon dioxide and methane 33 concentrations resulting from environmental changes, human actions, and past and future 34 emissions? The Strategic Plan for the Climate Change Science Program (USGCRP, 35 2003) envisions six research program elements to address these questions. The North 36 American Carbon Program (NACP) is one of the first of these six major elements 37 targeted for implementation planning and has been identified as a near-term priority 38 under the Climate Change Research Initiative. Here we present an Implementation 39 Strategy for the NACP, building on the already published NACP Science Plan (Wofsy 40 and Harriss, 2002). The construction of this document has involved significant 41 community input, including comments on an early draft presented to over 200 scientists 42 participating in the first NACP investigators workshop in May 2003.

1
2
345
67
89
1011
12131415
16171819202122232425262728293031323334353637383940
4142
NACP Science Implementation Strategy
The NACP is organized around four questions:
1. What is the carbon balance of North America and adjacent oceans? What are the geographic patterns of fluxes of CO2, CH4, and CO? How is the balance changing over time?(“Diagnosis”)
2. What processes control the sources and sinks of CO2, CH4, and CO, and how do the controls change with time?(“Attribution/Process”)
3. Are there potential surprises (could sources increase or sinks disappear)?(“Prediction”)
4. How can we enhance and manage long-lived carbon sinks ("sequestration"), and provide resources to support decision makers?(“Decision support”)
Research activities are recommended and prioritized within each major area to contribute to an integrated and well-tested system for understanding, monitoring, and predicting carbon fluxes over North America and adjacent ocean regions, and for providing timely and useful information to policymakers based on the results.
Major diagnostic studies are planned for 2005-2006 in which measurements of carbon storage on land and in the oceans and fluxes between reservoirs will be made in a coordinated series of experiments. Process-based models will be used in conjunction with remote sensing and other spatial data to estimate net carbon fluxes and storage across the continent at fine spatial and temporal resolution. These gridded estimates will be compared in detail to independent estimates made from observations of atmospheric trace gas concentrations and trajectories. Mismatches between top-down and bottom-up flux estimates will be used to improve diagnostic and predictive models through innovative techniques such as data assimilation (similar in theory to statistical methods used for weather forecasting). Several “intensive field experiments” will be conducted as part of the diagnostic research program, intended to test each element of the “model-data fusion” framework with multiply-constrained estimates of regional fluxes. After the intensive periods, the program will leave a network of systematic observations and analytical models in place that is optimally configured for continued monitoring of future carbon cycling over North America and adjacent ocean regions. Studies of the underlying processes that control carbon cycling are ongoing and more are planned in the next two years, leading to improved mechanistic models that will be used to produce maps of important carbon fluxes at high temporal and spatial resolution. Models developed and tested under the diagnosis and process elements of NACP will be used to improve prediction of future changes in the carbon cycle, and will continue to be evaluated against the ongoing diagnostic data. Data and models developed and tested under NACP will be used to provide decision support resources for policymakers, land managers, and other users of carbon cycle information. All elements of the program will be supported by an appropriate data management system designed to facilitate rapid and transparent exchange of large amounts of information from many disciplines.
Major elements of the diagnostic analysis of the carbon budget of North America will include:
2
1
234
567
89
1011
121314
15161718192021
222324
25
2627
2829
3031
32
3334
3536
37
38
NACP Science Implementation Strategy
• A hierarchical network of large-scale, distributed terrestrial measurements;
• Systematic compilation and analysis of new and existing remotely sensed imagery for use in models of carbon exchange at both land and ocean surfaces;
• Substantially improved fossil fuel emissions inventories with high resolution in time and space, and methods for evaluating these inventories using atmospheric measurements;
• An atmospheric observing system consisting of ground stations, aircraft and measurements from towers, ships and buoys;
• Estimates of hydrologic transfers of carbon over land, transformations in estuaries, and sequestration in sediments on land and in coastal oceans;
• Ocean measurements and modeling, both in the coastal zone and the open ocean, in coordination with the ocean carbon component of the Carbon Cycle Science Program (OCCC; Doney et al., 2004);
• Synthesis and integration activities organized into three interlocking strategies: Spatially-distributed modeling of carbon cycle processes using process-based models driven by many kinds of observations; top-down synthesis using inversion of variations in atmospheric trace gas composition and tracer transport models; and model-data fusion and data assimilation to produce optimal estimates of spatial and temporal variations that are consistent with observations and process understanding;
• Interdisciplinary intensive field campaigns designed to evaluate major components of the model-data fusion framework in limited domains in space and time for which all major fluxes can be measured by multiple techniques.
Major elements of the process-oriented research activities under NACP will include:
• Responses of terrestrial and marine ecosystems to changes in atmospheric CO2, tropospheric ozone, nitrogen deposition, and climate;
• Responses of terrestrial ecosystems to changes in disturbance regimes, forest management, and land use;
• Responses of terrestrial ecosystems to agricultural and range management;
• The impacts of lateral flows of carbon in surface water from land to fresh water and to coastal ocean environments;
• Responses of coastal marine ecosystems and sedimentation to eutrophication and other disturbances from human activity; and
• Human institutions and economics;
3

12
34
56
789
1011
1213
1415
16
1718
1920
21
22
2324
NACP Science Implementation Strategy
Major elements of the predictive modeling activities supported under NACP will include:
• Transfer of synthesized information from process studies into prognostic carbon-cycle models;
• Retrospective analyses to evaluate the spatial and temporal dynamics of disturbance regimes simulated by prognostic models;
• Evaluation of predictions of interannual variations with predictive models against continued monitoring using legacy observational networks and diagnostic model-data fusion systems;
• Development of scenarios of future changes in driving variables of prognostic models;
• Application and comparison of prognostic models to evaluate the sensitivity of carbon storage into the future; and
• Incorporation of prognostic models into coupled models of the climate system.
Major elements of the decision support resources to be provided by NACP will include analyses of:
• Economics and energy policy options for management of the carbon cycle given improved understanding, diagnosis, and prediction;
• Longevity of sinks;
• Scenario development for simulation of future climate;
• Assessment of sequestration options given best scientific evaluation of present and future behavior of carbon cycling.
4
1
23456
7
8
91011
1213
14
1516
17181920212223
24
25
26272829
303132
3334
35363738
NACP Science Implementation Strategy
Motivation The North American Carbon Program Science Plan (Wofsy and Harriss, 2002)
presents a phased plan for integrated interdisciplinary research on the carbon cycle, acting upon a principal recommendation of the US Carbon Cycle Science Plan (2000). The central objective of the NACP is to measure and understand the sources and sinks of CO2, CH4, and CO in North America and adjacent ocean regions.
Questions The NACP addresses the following scientific questions:
1. What is the carbon balance of North America and adjacent ocean basins? What are the geographic patterns of fluxes of CO2, CH4, and CO? How is the balance changing over time?
2. What processes control the sources and sinks of CO2, CH4, and CO, and how do the controls change with time?
3. Are there potential surprises (could sources increase or sinks disappear)?
4. How can we enhance and manage long-lived carbon sinks ("sequestration"), and provide resources to support decision makers?
The NACP is motivated by the need to inform policy decisions affecting emissions of CO2 and for the scientific community to provide optimal strategies for carbon sequestration through land management, direct burial, or other means. It will provide the scientific knowledge to assess, and potentially implement, sustainable carbon management. The NACP will provide the scientific basis for projecting future fluxes of CO2 and CH4 from North America and adjacent ocean regions in response to scenarios of climate, energy policy, and land-use.
Goals of the NACP The goals of the NACP are to:
• Develop quantitative scientific knowledge, robust observations, and models to determine emissions and uptake of CO2, CH4, and CO, changes in carbon stocks, and the factors regulating these processes, in North America and adjacent ocean basins;
• Develop the scientific basis to implement full carbon accounting, including natural and anthropogenic fluxes of CO2, CO, and CH4, on regional and continental scales;
• Support continuing quantitative measurements, models, and analysis methods that enable full carbon accounting;
• Develop, test, and exercise robust models for exploring scenarios that include, but are not limited to, the effects of variation in fossil fuel emissions, land use, and climate change on the future trajectories of atmospheric CO2, CO, and CH4.
5

12345678
9101112
NACP Science Implementation Strategy
The NACP is closely coordinated with other elements of US Carbon Cycle Research. The Program depends on expansion of the current networks of atmospheric concentration measurements and flux sites measuring vegetation-atmosphere exchange of CO2
(AmeriFlux network), enhanced inventories of carbon stocks, studies of CO2 fluxes over ocean basins adjacent to the continent (N. Atlantic, N. Pacific, and Arctic), measurements to partition emissions of CH4 among agricultural, combustion, fossil, and wetland sources, ecosystem process studies, and development of diagnostic and prognostic models.
The NACP will link to international programs pursuing complementary agendas in several regions. It will also foster inclusion of carbon in programs to assimilate global meteorological and environmental data, including data assimilation activities currently conducted by numerical weather prediction centers.
13 Overall Strategy for Synthesis and Integration 14 The NACP will involve systematic observations, intensive field campaigns, 15 manipulative experiments, diagnostic numerical modeling of carbon sources and sinks, 16 and syntheses of existing data sets. These activities are intended to support each other 17 through a rational strategy for integration to answer the four questions listed above. This 18 strategy is based on the premise that spatial and temporal heterogeneity of carbon sources 19 and sinks, and the need to attribute processes and develop useful predictive tools 20 precludes satisfactory closure through observations alone. Rather, observations and 21 simulation models of the processes that regulate the North American carbon budget must 22 be used in tandem. The strategy adopted under NACP is to structure modeling efforts and 23 observations so as to test every aspect of the models as thoroughly as possible. This 24 entails making sure that models predict relevant observable quantities, and that 25 observations are made of the parameters and variables that are most uncertain in models. 26 Three separate methods will be applied to synthesize models and data for estimating 27 continental scale carbon budgets under NACP: (1) “bottom-up” synthesis of surface, in– 28 situ, and remotely sensed data using models of source/sink processes; (2) “top-down” 29 synthesis of atmospheric carbon trace-gas data using numerical weather analyses and 30 inversion of transport models; and (3) model-data fusion of all available data (surface, 31 remotely sensed, and atmospheric) into process-based diagnostic models.
32
6

123456789
10
111213141516171819202122232425262728
293031
NACP Science Implementation Strategy
Figure 1: Integration strategy for NACP
The bottom-up synthesis will focus on mapping vegetation cover, soil properties, land-use, land management, land-use history, and disturbance history at the highest appropriate spatial and temporal resolutions using a combination of remote sensing, stratified in-situ sampling, and other geographic information. These data will be used to drive simulation models of sources and sinks, and the results will be compared in detail to independent observations of variables that represent key uncertainties in the models. Errors discovered during model evaluation will be used to improve the models, leading to improved estimates of gridded sources and sinks at high resolution. The advantage of the bottom-up synthesis is that it makes best use of process understanding and can therefore be used for scenario and decision support modeling.
The top-down synthesis will be performed using new observations of spatial and temporal variations of CO2, CO, and CH4 in the troposphere. These observations will consist of in-situ sampling using flasks, a new generation of continuous analyzers deployed on a network of tall towers, and frequent airborne sampling. High-quality trace gas concentration observations will also be made in conjunction with eddy covariance measurements, and may be made from buoys or ships in the coastal oceans when instrument issues are resolved. These data will augment the existing network of flask sampling in remote regions. The wealth of new trace gas data will be used for regional source and sink estimation using inversion of atmospheric transport. Meteorological data for these calculations will be generated using high-resolution reanalysis at the global scale, and will be used to generate regional cloud resolving transport simulations in support of intensive field campaigns. Monthly flux estimates for regions of approximately (500 km2) will be produced for detailed comparison with the more highly resolved process-based estimates. The advantage of the top-down synthesis is that it provides a set of independent flux estimates that are consistent with atmospheric mass balance. The disadvantages are that these estimates are only likely to be reliable at relatively coarse resolution and will not include inherent information about the processes that drive sources and sinks.
Discrepancies between independent top-down and bottom-up syntheses will be reconciled using data assimilation (or model-data fusion) techniques analogous to those used in weather analysis and forecasting. This analysis will involve identification of those
7
12345678
NACP Science Implementation Strategy
parameters in forward models of carbon source and sink processes that dominate the uncertainty in the gridded bottom-up flux estimates. These parameters will then be adjusted to produce optimum agreement with all available observations: remotely sensed imagery, forest, agricultural, and combustion inventories, eddy covariance fluxes, experimental manipulations, air-sea gas exchange, and atmospheric trace gas concentrations. The product of this analysis will be a set of high-resolution gridded model estimates of sources and sinks that are fully consistent with all available data and also with best understanding of the processes that produce them.
9 Phasing of NACP Research 10 The four motivating Questions posed by NACP are not intended to be addressed 11 sequentially. Rather, they form a framework under which many related and 12 complementary research activities will be organized. Nevertheless, due to the time and 13 resources required to design, deploy, and test an expanded network of observations and 14 the modeling and data management tools needed to interpret them, we envision that most 15 of the activities supported under NACP in the first two years will be devoted to Questions 16 1 and 2. This will lay the groundwork for more successful and falsifiable predictive 17 modeling and decision support resources. Research focused on addressing Questions 3 18 and 4 will certainly be an important outcome of the Program, and some activities must be 19 supported in the near term. An evolving shift in the relative weight of activities from 20 Questions 1 and 2 toward heavier emphasis on Questions 3 and 4 is expected over the 21 course of the program.
22 1. Question 1 (Diagnosis): What is the carbon balance 23 of North America and adjacent ocean basins? 24 What are the geographic patterns of fluxes of CO2, 25 CH4, and CO? What are the sources and sinks, and 26 how is the balance changing over time? 27 Measurements and diagnostic modeling of atmospheric, terrestrial, and oceanic 28 components are critical in determining the carbon balance of North America. Estimates 29 of carbon fluxes and stocks are needed to help understand processes at a regional and 30 continental scale, to help develop and test hypotheses, to provide inputs for models, and 31 to provide estimates for policy needs, such as reporting greenhouse gas emissions and 32 sinks to the United Nations Framework Convention for Climate Change. Answering 33 these questions will also entail working through scaling issues inherent in applying data 34 sets over areas that were not measured. Diagnosis of the regional carbon balance will 35 benefit from the coordination of existing resources and programs, as well as the 36 establishment of substantial new efforts including a hierarchical system of terrestrial 37 carbon observations across space and time scales; measurements of hydrologic carbon 38 transfers and storage; observations in the coastal zone and open ocean; remote sensing 39 and data management; process-based modeling and model evaluation; an atmospheric 40 observing system to support regional flux estimation by inverse modeling; and new 41 techniques for producing optimal highly resolved estimates of fluxes through model-data 42 fusion. Each of these elements is described below.
8

12
3456789
1011121314151617
18
NACP Science Implementation Strategy
1.1. A hierarchical approach for large-scale, distributed terrestrial measurements
NACP will implement diagnostic analysis of terrestrial carbon fluxes and pools at the resolution of remote sensing and other spatial data sets using well-tested models of the underlying processes involved. This analysis will require abundant data to test the models’ ability to quantitatively capture the processes, to estimate fluxes and stocks at larger scales, and to evaluate the results against independent observations. A four-tiered system of terrestrial carbon observations will therefore be refined and implemented. Three of the tiers, consisting of intensive measurement sites such as flux towers and LTERs, comprehensive measurements by plot sampling with large-scale inventory techniques, and spatially extensive measurements by remote sensing, are relatively well-developed for other purposes. These measurements will be integrated to help determine the North American carbon balance at regional scales. A new tier, Tier 2, must be deployed to link the other tiers together. The new network of sites is intended to provide carbon stock inventory data more frequently at a wider range of sites than the forest inventory system (Tier 3), and to facilitate scaling by assessment of the representativeness of intensively monitored sites (Tier 1).
Table 1. Hierarchical Terrestrial Observing System
Tier Type # sites frequency
4 Remote sensing and other spatial data > 107 10 days-annual
3 Forest inventory, natural resource inventory to detect trends and ensure representativeness
105 5-10 yr
2 New: frequent, moderate intensity, statistically stratified inventories intended to facilitate scaling
103 annual
1 Very intensive, local, process characterization (e.g., AmeriFlux, LTER)
102 continuous
19
20 1.1.1. Tier 1: Intensive local measurements of carbon stocks 21 and fluxes, with process characterization
22 Flux measurements. Flux towers measure the temporal dynamics of CO2, H2O and 23 energy, and other trace gas exchange for different biomes, disturbance classes, and 24 climatic regimes within and between regions. Data from these sites define the functional 25 relationships between carbon fluxes, disturbance, and environmental variables (soil 26 moisture, weather, sunlight, vegetation cover, season, time of day, etc.), providing the 27 capacity to parameterize and test biophysical models of C exchange. Diagnostic models 28 to be developed in the data assimilation activity require these biophysical models, with 29 accurate parameterizations representing real-time conditions of the vegetation and soils. 30 Flux towers and the accompanying biological measurements are critical to regional scale 31 analysis and understanding of dynamics of carbon storage and CO2, H2O, and energy 32 exchange. They provide ground-truth data for remote sensing observations, and
9

12345
6789
101112
1314151617
181920212223
24252627282930313233
34353637383940
41424344
NACP Science Implementation Strategy
information on the functional response of ecosystems to environmental forcing essential for interpreting aircraft and tall tower concentration measurements. By providing all-weather continuous measurements, data from flux towers augment and help to remove biases from weather-constrained data sets and augment weather data that are needed for input to real-time biophysical and biogeochemistry models.
Long-duration, consistent flux data are required for the NACP. The variations of net fluxes in response to environmental forcing (e.g. sunlight, temperature, soil moisture) provide the basis for the instantaneous partitioning of carbon and energy fluxes in land surface models. Climatic variations and large-scale disturbance history (ice storms, insects, and fires) contribute in a fundamental way to the flux integrals over longer periods – from years to decades. Thus long-term flux data for key sites provide some of the most critical constraints for the data fusion activity.
Flux towers will also serve as focal points for intensive ecological studies, providing case studies for full carbon accounting to be attempted in future inventories of above- and belowground carbon stocks. The proposed new Tier 2 sample clusters will provide a way to extend the representation of individual flux towers to a much larger array of vegetation conditions within climatic/soil/vegetation regimes.
A priority for the NACP is to maintain and strengthen the core AmeriFlux and Fluxnet-Canada programs with new measurements, enhanced quality controls, and improved information management systems, and to add new long-term representative sites that fill gaps in the existing structure. Because of the importance of carbon storage in ecosystems in mountainous terrain, projects to understand fluxes in complex terrain are also needed.
Enhancements needed at flux sites to address NACP objectives include accurate measurements of atmospheric CO2, CH4, and CO concentrations, traceable to world calibration standards, improved availability and quality control (calibration, documentation) of data, and redundancy in equipment. Adding a flux measurement capability to a research site with an otherwise strong, carbon-focused research program, such as LTER sites, could also prove desirable. Priority for precise CO2 concentration measurements should go to stations involved in the initial intensive experiments of the NACP, as well as sites around the periphery of North America. A limited number of flux sites should be augmented to make the full suite of core measurements recommended in the AmeriFlux science plan, including automated soil chamber systems.
Much of the landscape in some regions of North America is very heavily managed for residential and commercial development, yet ecosystem and carbon flux models typically don’t represent these landscapes. It will be necessary to add some studies in urban and suburban landscapes, to ensure that process models can capture variability in carbon fluxes and storage in these heavily managed ecosystems. These studies should be selected to span gradients in both climate (wet to dry and cold to warm) and management intensity urban/industrial to sparse suburban.
Clustering flux towers in geographical proximity but in different ecosystems and vegetation disturbance classes will provide an efficient mode for tower deployment in the NACP. Groups of sites should also be deployed along localized climatic gradients. A clustering approach will help delineate sub-regional variability and overall regional
10

123456
789
1011121314
151617181920
212223
NACP Science Implementation Strategy
exchange characteristics for linkage with the aircraft and tall-tower components and facilitate Tier 3 measurements. Fluxnet-Canada stations have already adopted this approach. The proposed NSF National Ecological Observatory Network (NEON) is based on such clusters and, if funded, could make a critical contribution to the NACP terrestrial observational infrastructure. Cluster sites along climatic, vegetation, and disturbance gradients in the Western region are a high priority.
New sites are needed in critical, under-sampled, natural and managed ecosystems, and in the region of the intensive field experiment. An analysis based on ecoregions of US stations (http://research.esd.ornl.gov/~hnw/networks/) found that the current AmeriFlux network effectively samples the “common” ecoregions of the US, but other ecoregions are underrepresented, particularly the southwest and Pacific Northwest where gradients of climate, vegetation and soils are strong. Gaps appear in the southwest and Pacific Northwest, including shrub-steppe lands (west Texas and New Mexico) and Juniper-Pinyon ecosystems (New Mexico, Arizona, and Utah).
Fluxnet-Canada sites represent many of the major forest and peatland types in the managed forest regions of Canada. Identified gaps for forest ecosystems include interior British Columbia montane cordillera and western Ontario mixed woodlands. Despite the vast carbon stocks in arctic and sub-arctic ecosystems, there are few flux measurement activities. Hydroelectric reservoirs and agricultural ecosystems are other high priority sites for Canadian flux studies.
Mexican ecosystems are poorly represented with only one flux site in desert near La Paz. This site represents a partnership between Mexican and US scientists, and the NACP should promote this model and seek to establish further sites in Mexico.
24 1.1.2. Tier 2: Statistically-stratified measurements at 25 intermediate scale and intensity
26 Forest inventories in both the U.S. and Canada employ a hierarchical monitoring 27 approach. Tier 1 is remote sensing of land cover and land use, providing indirect data on 28 ecosystem function at frequent intervals. Tier 2 is composed of field observations from 29 sample plots, including >170,000 permanent locations with limited measurements at 30 infrequent intervals, covering all forest types and conditions.
31 The NACP document developed the rationale for a measurement program at 32 intermediate scale (Tier 2) and intensity, to bridge the gap between infrequent but 33 extensive data of the inventory plots and intensive data from the limited number of study 34 sites in the AmeriFlux and LTER networks, which sample many mechanistically relevant 35 parameters often. Tier 2 will include the measurement parameters of Forest Inventory 36 plots plus additional measurements, with observations made at higher frequency. The 37 linkage provided by the Tier 2 will enable remote sensing and large scale, lower 38 frequency inventory data to be utilized in the quantitative analysis of the carbon cycle in 39 North America.
40 Tier 2 will be composed of small clusters of monitoring sites that represent 41 conditions over the landscape mosaic surrounding flux or process study sites. Roughly 42 ten Tier 2 sites may be necessary to investigate the full range of ecosystem conditions 43 and land-use surrounding a flux site, suggesting several hundred Tier 2 sites would be
11

123456
789
1011121314151617181920212223242526272829
303132333435363738394041
NACP Science Implementation Strategy
required. Measurements at Tier 2 sites will include key components of the carbon balance that will facilitate scaling, in time and space, of the intensive flux measurements to the larger landscape, including: (1) carbon stocks in, and fluxes from soils and coarse woody debris; (2) methane fluxes from peatlands, wetlands, and agricultural systems; (3) basic meteorological and site (soil, vegetation) parameters. Continuous meteorological data (including solar radiation, direct and diffuse) will be required for the cluster.
One or more pilot studies of statistical methods for making estimates from multi-tier observation systems will be very useful for designing an efficient Tier 2 network. Fluxnet-Canada currently uses a cluster approach where flux towers are set up for short periods of time on a range of disturbed ecosystems surrounding an existing tower. This approach could be adapted for the proposed NACP Tier 2 concept.
A workshop was held in June, 2003, by the USDA Forest Service, NIGEC, and the University of New Hampshire to begin to develop a common suite of measurements for application at condition sample sites (Tier 2) associated with the North American Carbon Program (NACP). The intent was to define terminology, develop guidelines for sample site selection, and develop consistent sampling protocols. The workshop was focused on forests, although experts in grasslands and agriculture also attended.
All participants expressed the concern that Tier 2 was crucial for many biomes, not just forests. Tier 2 locations needed to include a core plot design that would be used to link Tier 1 and Tier 3 sites and that would be used for testing models. Additional experiments should also be taken at the Tier 2 locations to provide process understanding about basic forest processes such as respiration, and responses to disturbances, management, or environmental changes. These Tier 2 process sites are discussed in more detail in Question 2.
Two projects are proceeding from the workshop. One group of scientists is further defining a list of important variables and measurement approaches to create a generic field manual. A second group of scientists are working on sample design and plot location issues. A draft of the generic field manual is expected by the end of 2003, along with a manuscript on plot location issues.1 Pilot studies are expected in 2004.
Cropland ecosystems are subject to a high degree of human intervention – hence management practices and land use history exert strong controls on carbon dynamics. Many croplands are characterized by high productivity and C assimilation rates and hence impart a strong signal on season C exchanges between the atmosphere and the land surface. However, biomass stocks are typically low (perennial crops) or entirely ephemeral (annual crops) so that the long term C balance is determined almost entirely by changes in soil carbon stocks. Weather (including seasonal distribution of temperature and precipitation and extreme events) and socioeconomic factors (commodity prices, government policy) are key short-term drivers that impact the interannual variability in C fluxes, while climate, soil properties, topography and landuse history are driving variables that express themselves in the regional distribution of crop species, productivity trends and C sink/source characteristics of soil C stocks.
1 For more information, contact Dr. Richard Birdsey, USDA Forest Service, [email protected]
12

123
456789
10
1112131415
16171819202122232425
2627282930313233
3435363738394041424344
NACP Science Implementation Strategy
As for other land cover/land use types, quantification of cropland C balance can be pursued using a hierarchical approach of different tiers as a function of scaling and type and intensity of measurements.
The National Resources Inventory (NRI) is a stratified two-stage area sample of over a million points across the United States and Caribbean that collects land use and resource data at 5-year intervals since 1982. Aggregate county statistics on crop yields and area, livestock and other economic data have been for dominant agricultural areas in the US by State Agricultural Statistics Services and by USDA’s National Agriculture Statistics Service (NASS) and similar data is collected across the US every 5 yrs in the Agricultural Census.
A Tier 2 level of data collection, analogous to forest inventory plots with periodic ground-based measures of productivity and C stocks, does not currently exist. Opportunities to develop this level, for example with additional data collection and sampling at a sub-set of NRI points, are apparent and could be considered as a priority area for USDA.
A Tier 2 level could be based on a combination of existing long-term agricultural field experiments, operated primarily by Land Grant Universities and USDA/ARS together with AmeriFlux sites in cropland systems. Additional sites, including eddy covariance towers and integrated process measurements (e.g. soil respiration, above and belowground productivity), strategically placed within major crop regions could provide the basic data to derive daily or hourly fluxes that will be required for interpretation of atmospheric data. Such sites should include key management treatments (e.g. tillage, fertilization, irrigation) and have well documented management histories. Close coordination of long-term experimental sites and flux monitoring locations operated by different agencies (DOE, USDA) and universities will be required.
Spatial and temporal integration, interpolation and interpretation of short- and long-term C dynamics can be accomplished using ecosystem carbon dynamics models (e.g. Century, CERE-DDSAT, DNDC, EPIC and others). These would utilize data developed in Tier 1 and Tier 2, together with validation and model refinement based on information from Tier 3 sites. The model output can be used in a bottom-up calculation of the carbon budget, and the model can be incorporated into the data assimilation/fusion framework, which effectively provides real-time adjustments to the parameters of the model to conform to observed concentrations and fluxes in cropland areas.
There are key limitations in existing agricultural data sources that if rectified would greatly increase their utility as driving variables for ecosystem-level models and bottom-up integration to regional and national scales. Many data on management practices important in cropland C balances, including tillage practices, fertilizer use and manure application are presently available as county-average statistics. For example, tillage practices compiled by the Conservation Tillage Information Center (CTIC) report county totals by crop type for different tillage methods (since 1989). However, the data do not directly relate to cropping systems as actually implemented on the landscape and thus, for example, cannot be used to differentiate for example intermittent use of no-till (e.g. no-till soybean followed by intensively tilled corn in a corn-soybean rotation) from continuous no-till. Analogous uncertainties exist for databases reporting fertilizer and
13
123456789
10111213
NACP Science Implementation Strategy
manure use, where typically county-aggregate amounts are reported, making it difficult or impossible to attribute practices to specific crops within a rotation. These issues could be addressed in a variety of ways including targeted surveys of practices in the context of multi-year management systems and/or by collecting additional information as part of the NRI program (which currently collects information on crop rotation but not on tillage, fertilization or manuring). Knowledge of the spatial distribution and management intensity of irrigated cropland could be enhanced using remote sensing (e.g. identification of center-pivot irrigation), together with compilation of existing irrigation well databases and information from water development projects that exist with state agencies but have not been compiled into forms application at the national level. Soil drainage is a key variable that affects the C balance of millions of hectares of aquic soils under intensive cropland management. Local level data on extent and time history of drainage practices exist but there are no national level compilations available at present.
14 1.1.3. Tier 3: Carbon accounting by measuring stocks of 15 organic matter over time: Forest Inventory Data
16 The Forest Inventory and Analysis (FIA) program of the US Forest Service started in 17 the 1930’s, with the mandate to determine the nation’s stock of merchantable timber 18 (FIA). Measurements have been made at 5-10 year intervals at more than 150,000 widely 19 dispersed ground sites, for a limited suite of parameters. A sub-sample (5000 “Forest 20 Health Monitoring” plots) has more intensive measurements including soil data, coarse 21 woody debris, understory vegetation, and other ecological variables. Inventory plots are 22 chosen randomly to capture the full variability of forest conditions, allowing them to 23 record disturbances such as fire or harvesting.
24 The FIA has been a cornerstone of the assessment of contributions by forest 25 ecosystems to the US carbon budget, despite the lack of full carbon accounting, gaps in 26 coverage, and other shortcomings. FIA data are extensive and cover a long period of 27 time. The data have been analyzed, extended and extrapolated (using models) to quantify 28 live and dead stocks of carbon in vegetation and soils, but uncertainties about ecosystem 29 components other than above-ground biomass remain regrettably large.
30 Canada is implementing a new format for its National Forest Inventory (NFI) that, 31 like the U.S. FIA, relies on a plot-based system of permanent observational units located 32 on a national grid. The Canadian system is designed to provide national data on status 33 and trends over time in direct support of the Criteria and Indicator processes (CCFM and 34 Montreal Process), and international initiatives including the Kyoto Protocol. The 35 Canadian system will consist of at least 20,000 sample photo plots of which 10% will be 36 randomly selected for ground sampling on rolling 10-year intervals. NFI parameters 37 relevant to the NACP include land cover, forest type, age and volume of trees, 38 disturbance activity, land use changes (reforestation, aforestation, and deforestation), 39 mortality, and total above ground biomass.
40 Remote sensing data will also be used to enhance the NFI to assess whether the 41 location of plots are skewed in any fashion, to assess the extent of change and the need to 42 revisit plots, to extend the inventory beyond the 1%, and to provide other area-based 43 parameters such as forest condition. A new project is underway to provide remote 44 sensing products to assist in the monitoring of the sustainable development of Canada’s
14
5
10
15
20
25
30
35
NACP Science Implementation Strategy
1 forests. The project, called Earth Observation for Sustainable Development of Forests 2 (EOSD2), is designed to provide complete (wall to wall) coverage of the forested area of 3 Canada with satellite data at regular intervals to produce land cover, biomass and change 4 products. The EOSD project will provide the satellite products required to enhance the
plot-based NFI design.
6 1.1.3.1. Improved Spatial Representation of the Inventories
7 Forest inventories in the U.S. include all “forest lands” as defined by the US Forest 8 Service, but there are major gaps including some “reserved” areas of the U.S.; lightly 9 sampled areas of the Intermountain West, the Pacific Coast and Alaska, developed lands
(urban and suburban), and large areas of public non-forest land (mostly grazing land in 11 the U.S. West). Large areas of Mexico have few or no field plots, and existing data are 12 largely inaccessible. Field sampling of biomass (live and dead) will be especially critical 13 in mountainous areas and other complex terrain (e.g. riparian forests) where eddy flux 14 measurements may not accurately represent ecosystem carbon fluxes. Although
enhancements to ongoing inventories are filling some of these gaps, it is unlikely that 16 these improvements in coverage will be fully implemented with repeated measurements 17 during the early stages of the NACP. Therefore an interim strategy is needed to increase 18 the use of current and historical remote sensing data to identify land cover status and 19 changes, coupled with selected new field measurements to estimate biomass and other
ecosystem C stocks and rates of change for under-sampled areas.
21 1.1.3.2. Enhanced Temporal Resolution of the Inventories
22 The goal of the NACP is to define the carbon budget of the continent seasonally and 23 annually. Ongoing conversion of the FIA and NFI systems to annual inventories on a 24 rolling basis will facilitate reporting of C flux on an annual basis, but in the interim
period the available data are a complicated mix of periodic and annual samples, 26 sometimes in different formats. Developing and applying advanced statistical techniques 27 to estimate annual changes in C stocks from sample panels of the forest inventory, based 28 on supplemental data used to estimate the major causes of variations in C flux 29 (productivity, mortality, harvest, and land use change), will be a challenge. It is a high
priority for implementation of the NACP.
31 1.1.3.3. Content enhancement of the Inventories 32 Data currently available for the US on-line may extend back about 20 years. Earlier 33 data are less available or unavailable except in aggregated form in publications. Data sets 34 that capture the history of land use, management, and disturbance are extremely
important, including information unavailable from FIA, such as fire statistics, outbreaks 36 of disease and insects, historical land use, and timber production. Concerted efforts are 37 needed to make the data from the US, Canada, and Mexico available in digital form in 38 compatible formats.
2 http://www.pfc.cfs.nrcan.gc.ca/eosd/
15

123456789
101112
131415
NACP Science Implementation Strategy
Inventory data should include a more complete set of ecosystem C stocks, including stumps, live and dead roots, mineral soil, litter, and coarse and fine woody debris. Comprehensive measurements of ecosystem C stocks and fluxes are available from a small number of intensive sites. Pilot efforts are underway to modify extensive inventories, but the FIA mandate remains focused on merchantable volume and, short of an act of Congress, will not provide full carbon accounting. The U.S. effort thus lags the program in Canada. Tier 3 data could fill in some content gaps in inventories, but there is really no substitute for the comprehensive documentation of key carbon stocks over extensive regions. An aggressive field campaign early in the NACP is required to collect data on poorly or rarely measured C pools, which would facilitate development of ecosystem carbon budgets and provide the information needed to assess the costs and frequency of collecting observations on the non-commercial carbon pools.
Particular attention must be given to consistent accounting for land use change to avoid spurious gains or loses of carbon as a result of accounting processes. Better coordination among agencies conducting land inventories will be necessary.
16 1.1.3.4. Model Development for Forest Inventory Analysis
17 In the US, a collection of statistical algorithms and estimation processes contained in 18 the model FORCARB are used to convert basic inventory data into estimates of carbon 19 stocks and fluxes for different ecosystem and wood product carbon pools. FORCARB 20 includes links to other kinds of models that represent ecosystem and economic processes 21 that affect carbon accounting. The reliability of these estimates, however, is limited by 22 the dearth of monitoring data for significant carbon stocks such as coarse woody debris 23 and soil organic matter. Additional developments are needed to provide data for these 24 stocks at low cost, and to improve estimates of the quantity of C in different ecosystem C 25 pools based on measurements taken at the extensive inventory plots, such as tree diameter 26 and height. Improved estimates of the movement of harvested agricultural and forest 27 products are needed both at the national scale (exports) and for regional studies in order 28 to match the land accounting with the atmospheric accounting for the same regions.
29 1.1.4. Tier 4: Spatially extensive mapping of land cover, 30 vegetation type, and ecosystem states
31 Tier 4 is a crucial component of the terrestrial observing system facilitating 32 estimation of carbon stocks and fluxes at large scales. Bottom-up integration from 33 networks of point measurements made under Tiers 1, 2, and 3 will require “wall-to-wall” 34 measurements of key variables such as land cover, disturbance history (including burned 35 areas, insect mortality, and hurricane damage), and vegetation state at high resolution 36 (Section 1.5). Ecosystem modeling using remotely sensed data will also allow direct 37 comparison of regional flux estimation using tested process-based models against top-38 down regional flux estimates based on atmospheric observations (Section 1.6).
39 1.1.4.1. Land-use Data
40 Agricultural data (crops planted, harvest statistics, irrigation, and fertilizer 41 application) will be collated and made available through the NACP data and information 42 system (Section 5). Analyses will be required to convert from county-level to spatial
16
1234567
NACP Science Implementation Strategy
grids appropriate for models, and for comparison and merging with remote sensing and other data streams. These data will be used in conjunction with other data streams to analyze gridded carbon storage and flux due to agriculture. Other information including historical harvests, thinning, burned areas, burn severities, and disease will be compiled and mapped across state and national borders, and will be made available for use in spatially-explicit models of forest succession and demographics. Historical changes in urban and suburban cover will also be collated.
8 1.1.4.2. Remote Sensing
9 Two major types of remote sensing observations are those that are primarily 10 sensitive to variation in vegetation physiological properties and others that resolve the 11 structural properties of ecosystems. Remote sensing of the ocean surface is also an 12 important component of the program, as it can provide both biogeochemical information 13 (e.g., estimates of chlorophyll concentrations to enable model calculation of NPP) and 14 physical parameters (e.g., temperature and wind speed to enable air-sea gas exchange 15 calculations).
16 Optical remote sensing provides routine measures of vegetation fractional 17 photosynthetically active radiation absorption (fPAR). Satellite metrics such as the 18 normalized difference vegetation index (NDVI) and enhanced vegetation index (EVI) 19 have been well studied and shown to be almost linearly related to fPAR over broad 20 spatial scales. Because of their sensitivity to vegetation greenness and fPAR, these 21 satellite indices provide a general track of canopy leaf area dynamics. Physiologically-22 based indices thus provide important spatial and temporal constraints over carbon flux 23 estimates in process models, such as in estimating carbon uptake via gross and net 24 primary production. Historical bi-weekly NDVI observations have been recompiled for 25 the period 1982-2002 from the NOAA Advanced Very High Resolution Radiometer 26 (AVHRR), and daily-to-weekly observations are highly available from the NASA 27 Moderate Resolution Imaging Spectrometer (MODIS) since 1999.
28 Many components of vegetation and ecosystem structure can also be measured with 29 optical remote sensing technologies, such as the lateral surface extent of vegetation 30 canopies and biological materials such as live and senescent vegetation. The surface 31 heterogeneity of these materials indicates the partitioning of many biogeochemical 32 processes central to the goals of the NACP, such as the fixation, decomposition, and 33 storage of carbon across continuously varying bioclimatic and topo-edaphic settings. 34 Land covers such as forest, grasslands, and urban areas can be readily estimated with 35 multi-spectral sensors at relatively high spatial resolution (e.g., Landsat).
36 Limited spectral resolution among multi-spectral sensors such as Landsat and 37 MODIS precludes detailed measurements of canopy structural and material properties 38 that quantitatively indicate changes in carbon storage and in biogeochemical processes. 39 Structural indicators of environmental phenomena such as desertification, woody 40 vegetation encroachment and thickening, forest thinning and dieback are also 41 underdetermined in standard multi-spectral remote sensing data. Technologies such as 42 hyperspectral, multi-angular, and active laser remote sensing are required to determine 43 the structural partitioning of ecosystem materials, but such imagery is unavailable as 44 “wall-to-wall” datasets. These more detailed products will employed to characterize
17

12
3456789
10111213
141516171819202122
2324252627
28
29
30
31
32
33
34
35
36
37
38
39
NACP Science Implementation Strategy
ecosystem structure and variability near intensively studied sites (Tiers 1 and 2), and to test model predictions of ecosystem structure based on spatially complete data.
Hyperspectral remote sensing provides accurate estimates of canopy extent among differing vegetation lifeforms and growthforms (e.g., shrubs, trees, forbs, and graminoids). Detailed spectral signatures provide quantitative measurements of live and senescent carbon pools on land, primarily in the form of fractional surface cover but also in volumetric content. Active LIDAR systems provide valuable information on canopy height and, for some sensors, crown vertical density profiles. Together, hyperspectral and LIDAR observations are the best combination of technologies for resolving the three-dimensional partitioning of aboveground carbon pools over the landscape. Airborne hyperspectral (AVIRIS) and LIDAR (LVIS) assets can be deployed in support of intensive observing campaigns. The spaceborne hyperspectral sensor EO-1 Hyperion will also offer a subset of the capabilities of AVIRIS, for a limited period of time.
At 1 km spatial resolution, computation of NEE using ecosystem models driven by MODIS imagery and climate data for North America entails about 24 million cells. The datasets required generally begin with definition of the continental landcover. The MODIS Landcover dataset defines 15 total classes of vegetated and unvegetated areas. More detailed classifications are possible, but most BGC models for continental implementation cannot define more than a limited number of biome physiologies. One improvement is the MODIS 500 m continuous fields of forest cover, basically a cover fraction of forests. These landcover datasets are recomputed annually so provide a first level of disturbance mapping.
A number of carbon balance relevant biophysical variables are also available continentally. MODIS generates leaf area index (LAI) and fraction of absorbed PAR (fPAR) data every 8 days. These time series datasets also implicitly quantify vegetation phenology and growing season. MODIS computes a daily terrestrial photosynthesis and infers maintenance respiration for an estimate of GPP that is reported every 8 days.
Critical, regularly available MODIS Land datasets:
• Yearly 1 km landcover
• 16-day 1 km snowcover
• 16 day, 1 km albedo and BRDF
• Daily 0.5 km surface reflectance
• Daily 1 km surface temperature
• 16-day, 0.5 km vegetation indices
• 8-day, 1 km surface evaporation resistance
• 8-day, LAI and FPAR
• 8-day, 1 km GPP
• 8-day 1 km fire activity
• 32-day 0.5 km forest cover continuous fields
18

5
10
15
20
25
30
35
40
NACP Science Implementation Strategy
1 All of these MODIS data will be available at the refresh rate time periods specified 2 for the entire North American continent. Some will be valuable inputs for land surface 3 meteorology, some for calculation of land surface carbon fluxes. The most relevant 4 carbon flux variable, the 8-day GPP, is computed daily by NASA, but not normally
distributed.
6 1.2. Quantification of combustion-derived CO2, CH4, and 7 CO 8 Fossil emissions are the dominant net source of CO2 in North America. Better 9 characterization and prediction of North America’s C balance will require more accurate
estimates of fossil emissions. In addition, the temporal and spatial variability in 11 emissions are important for regional atmospheric variation in carbon cycle gases. 12 Improving the accuracy of regional ecosystem C fluxes estimated by inversions of 13 atmospheric measurements will require more accurate estimates of fossil-fuel derived 14 emissions of these gases on fine spatial and temporal scales.
Emissions data from multiple sources could be assimilated to generate better 16 emissions estimates. The concentration and fingerprint of different carbon cycle gases 17 can provide important constraints on these emissions estimates. Below we describe 18 approaches to developing better emissions estimates and using chemical and isotopic 19 analysis to fingerprint fossil carbon sources.
The contribution from natural and anthropogenic biomass burning is also important 21 in some regions, but is not considered here. Estimates of the magnitude of human 22 transport of biologic materials (e.g. foodstuffs and forest products) from one place to 23 another would also be helpful in sorting out the flux component attributable to 24 interchanges with the atmosphere.
Improved fossil-fuel-based emission inventories for CO2, CO, and CH4 should be 26 constructed on spatial scales less than 50 km and with diurnal cycles within seasons, and 27 days-of-week. These inventories should be constructed using models developed from 28 the fields of energy use and from emissions inventories already in place for air quality 29 assessment. Large quantities of data are available from federal, state, local, and corporate
sources to estimate emissions at finer spatial and temporal scales than the national and 31 annual estimates now generally available. For spatial and temporal scales smaller than 32 state and month the contributions of large point sources become very important. It is 33 possible to construct models that capture typical patterns of emissions but detailed studies 34 and field campaigns at finer scales are going to require site-specific information on
operational details at large point sources. Models of energy consumption patterns should 36 be adequate for dispersed sources.
37 Improved emissions inventories and models must be used in atmospheric transport 38 models and the results compared in detail to multiple trace gas measurements. These 39 comparisons may be used to further improve the emissions models.
Atmospheric monitoring strategies should be developed to include a more complete 41 suite of measurements of CO2, CH4, and CO and of the isotopic signatures of each, and of 42 additional species that could provide “finger prints” of specific emission sources. These 43 fingerprint species would increase the leverage on separation of anthropogenic and
19
123456789
10
1112131415161718
NACP Science Implementation Strategy
biogenic exchange. Consistent with this, there is a need for more detailed data on the isotope signatures of major fuel groups and applications. The stable isotopic composition of natural gas from different regions (and the minor gas species found with it), for example, is variable and poorly characterized. To use C isotopes as a useful tracer is going to require more information on the spatial and temporal variation in the composition of fuels generally. Radiocarbon (14C) is a sensitive tracer for distinguishing fossil from biogenic carbon sources because of the large difference in 14C content. While biogenic sources range near D14C = 50-200‰ and atmospheric 14CO2 is currently 80‰, all fossil fuel C is radiocarbon dead (D14C = -1000‰) a difference that could resolve small contributions of fossil C to atmospheric concentrations.
Because the relative signal strengths from fossil fuel and biomass combustion versus other biogenic and aquatic sources and sinks will vary across regions and with technological and demographic development trends, the optimal observation strategy will likely change with space and time and with the desired resolution. A crucial aspect of both the inventory and tracer species work will be model-measurement inter-comparison studies to test methods and the adequacy of data. In particular, pilot studies should be conducted as part of intensive campaigns to provide information for the longer term monitoring program.
19 1.3. Ocean measurements 20 The ocean component of NACP is designed to collaborate with existing and 21 emerging programs to quantify the net sources and sinks of the marine components of 22 North America and the adjacent ocean basins. The network of ocean carbon observations 23 outlined will contribute to the NACP backbone of long-term observations. The ocean 24 component will also define the net effect of the marine system on the CO2 concentration 25 of the air exchanging with continental air masses. In the absence of this component, 26 inverse studies and data fusion results could be biased by unresolved CO2 fluxes in 27 coastal waters and adjacent open ocean basins.
28 Strategies for long-term ocean carbon observation networks have been described in 29 several documents over recent years (e.g. Bender et al., 2001). As a part of the Strategic 30 Plan for the Climate Change Science Program (USGSRP, 2003) these documents have 31 been synthesized into a comprehensive strategy for understanding the global ocean 32 carbon sink: Ocean Carbon and Climate Change (OCCC): An Implementation Strategy 33 for U.S. Ocean Carbon Cycle Science (Doney et al., 2000). There are obviously 34 significant overlaps between the global ocean carbon study and the NACP. These 35 overlaps are recognized and the respective plans are designed to complement each other 36 to provide a seamless integration of ocean, atmosphere and terrestrial carbon cycle 37 research in the U.S. and adjacent ocean basins.
38 Many of the detailed science recommendations described in the OCCC report are 39 directly applicable to NACP. This document does not attempt to repeat these same 40 details, but highlights areas that are particularly relevant to NACP. In some cases, the 41 oceanic studies required for the success of the NACP will be carried out independently by 42 NACP or as joint OCCC/NACP projects; this is particularly true for land-ocean 43 interactions and the continental margins. In other cases, OCCC will develop and share 44 with NACP targeted data products and scientific understanding relevant to NACP
20
123
45678
9
10
NACP Science Implementation Strategy
objectives. The two programs will coordinate on defining overall requirements (e.g., time/space frequency of sampling; measurement suite; coordination with OCCC observing system and field campaigns).
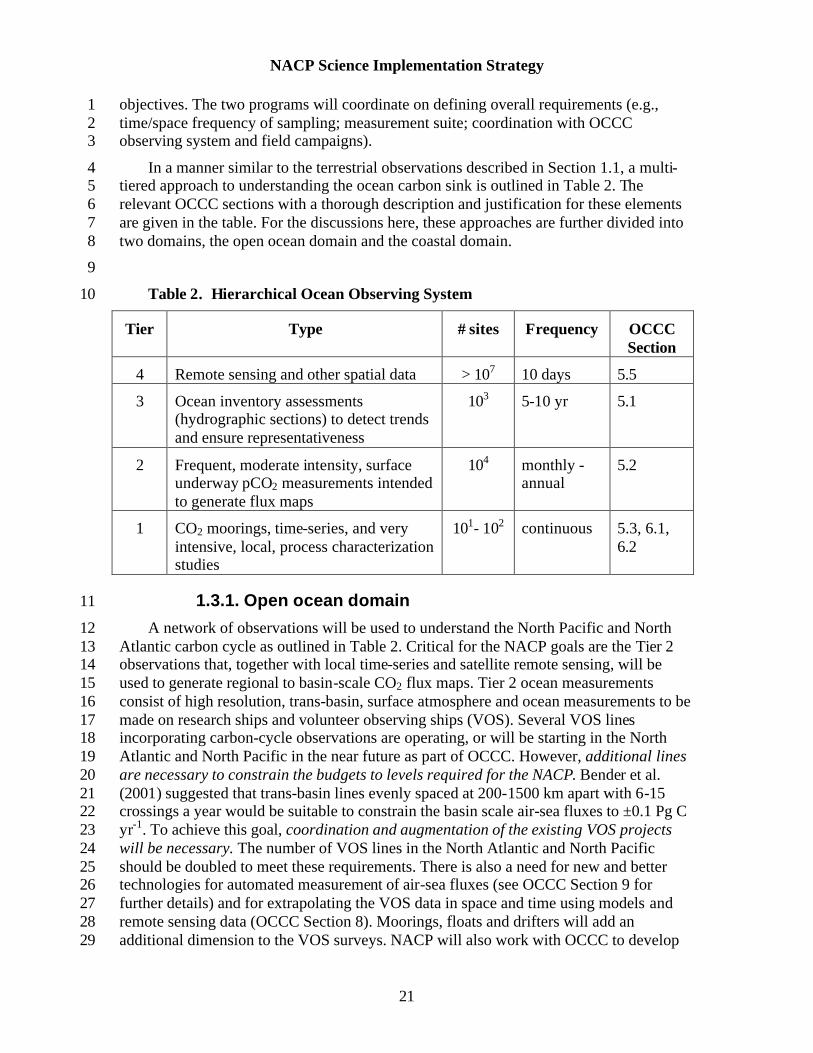
In a manner similar to the terrestrial observations described in Section 1.1, a multi-tiered approach to understanding the ocean carbon sink is outlined in Table 2. The relevant OCCC sections with a thorough description and justification for these elements are given in the table. For the discussions here, these approaches are further divided into two domains, the open ocean domain and the coastal domain.
Table 2. Hierarchical Ocean Observing System
Tier Type # sites Frequency OCCC Section
4 Remote sensing and other spatial data > 107 10 days 5.5
3 Ocean inventory assessments (hydrographic sections) to detect trends and ensure representativeness
103 5-10 yr 5.1
2 Frequent, moderate intensity, surface underway pCO2 measurements intended to generate flux maps
104 monthly -annual
5.2
1 CO2 moorings, time-series, and very intensive, local, process characterization studies
101- 102 continuous 5.3, 6.1, 6.2
11 1.3.1. Open ocean domain
12 A network of observations will be used to understand the North Pacific and North 13 Atlantic carbon cycle as outlined in Table 2. Critical for the NACP goals are the Tier 2 14 observations that, together with local time-series and satellite remote sensing, will be 15 used to generate regional to basin-scale CO2 flux maps. Tier 2 ocean measurements 16 consist of high resolution, trans-basin, surface atmosphere and ocean measurements to be 17 made on research ships and volunteer observing ships (VOS). Several VOS lines 18 incorporating carbon-cycle observations are operating, or will be starting in the North 19 Atlantic and North Pacific in the near future as part of OCCC. However, additional lines 20 are necessary to constrain the budgets to levels required for the NACP. Bender et al. 21 (2001) suggested that trans-basin lines evenly spaced at 200-1500 km apart with 6-15 22 crossings a year would be suitable to constrain the basin scale air-sea fluxes to ±0.1 Pg C 23 yr-1. To achieve this goal, coordination and augmentation of the existing VOS projects 24 will be necessary. The number of VOS lines in the North Atlantic and North Pacific 25 should be doubled to meet these requirements. There is also a need for new and better 26 technologies for automated measurement of air-sea fluxes (see OCCC Section 9 for 27 further details) and for extrapolating the VOS data in space and time using models and 28 remote sensing data (OCCC Section 8). Moorings, floats and drifters will add an 29 additional dimension to the VOS surveys. NACP will also work with OCCC to develop
21

12
3456789
101112131415161718192021
NACP Science Implementation Strategy
and coordinate the Tier 1, 3, and 4 measurements. Many of these measurement programs are already underway and are prepared to provide targeted data products to NACP.
The production of robust basin-scale flux maps is a complex exercise and a matter of great interest to both OCCC and NACP. Uncertainties associated with determining regional- to basin-scale oceanic CO2 fluxes are such that comparing different approaches is critical. These include interior and surface ocean measurements, atmospheric measurements, and global mass-balance. Oceanic and “top-down” atmospheric carbon cycle estimates have been compared in the past with generally consistent agreement on global to hemispheric, and decadal, scales. However, comparisons on basin/continental and interannual scales show considerable disagreement. Because of data and model limitations, the basin-scale ocean fluxes, the within-basin flux patterns, or both are fixed by prior assumptions and not allowed to change, leading to potentially large biases in the calculated fluxes. As atmospheric observations expand, particularly over the continents, the uncertainties on ocean flux estimates will become increasingly important to inverse calculations. Future calculations will require air-sea flux estimates from concurrent measurements rather than climatologies and a data-assimilation technique rather than a synthesis inversion. Both the OCCC and NACP programs will work closely together to develop the model-data fusion approaches necessary to develop the necessary flux maps. In particular, NACP can build upon scaling approaches developed for the terrestrial components that may be useful for ocean applications. See Section 8 of the OCCC report for further details.
22 1.3.2. Coastal ocean domain
23 Coastal ocean regions have relatively small area, but they are the active interface 24 between the terrestrial and marine environments. Coastal environments directly interact 25 with terrestrial air masses, and because of their sensitivity to changes in wind, river 26 runoff and anthropogenic inputs of nutrients, are likely to be very sensitive to climate 27 change. Carbon cycling on the continental margins is poorly understood and is under 28 sampled to the point that it is uncertain whether these regions are a net sink or a net 29 source of CO2 to the atmosphere. Some studies have suggested that the “continental shelf 30 pump” could be responsible for as much a 1 Pg C sink annually on a global basis. A few 31 studies like the NSF CoOP (Coastal Ocean Processes) and RiOMar (River-dominated 32 Ocean Margins) programs have examined, or will examine, locations along the North 33 American coast, but a coordinated large-scale coastal carbon exchange program is 34 necessary to address the goals of the NACP.
35 Specific objectives of the ocean margin studies are: better estimates of air-sea fluxes 36 and their impact on the CO2 concentrations of continental air masses, estimates of carbon 37 burial and export to the open ocean, elucidation of factors controlling the efficiency of 38 the solubility and biological pumps in coastal environments, quantification of the 39 influence of margin biogeochemical processes on the chemical composition of open 40 ocean surface waters, and the development of coupled physical biogeochemical models 41 for different types of continental margins. River-dominated margins and coastal 42 upwelling regions merit special attention due to their dominant role in coastal carbon 43 budgets. Riverine inputs of C and N into the coastal margins also needs to be monitored 44 at major North American rivers, including monthly transects from the shelf break up into
22
123456
789
1011121314
15161718192021222324252627
2829303132333435363738394041424344
NACP Science Implementation Strategy
the rivers to assess the magnitude of the "estuarine carbon traps". A parallel effort to evaluate the C and N losses from the terrestrial side should provide an important accounting of the lateral transfers of carbon and carbon relevant species. Scientific information gained from these studies will not only benefit the NACP, but will also directly feed into the OCCC research providing a continuum of carbon cycle studies from the terrestrial systems out to the open ocean.
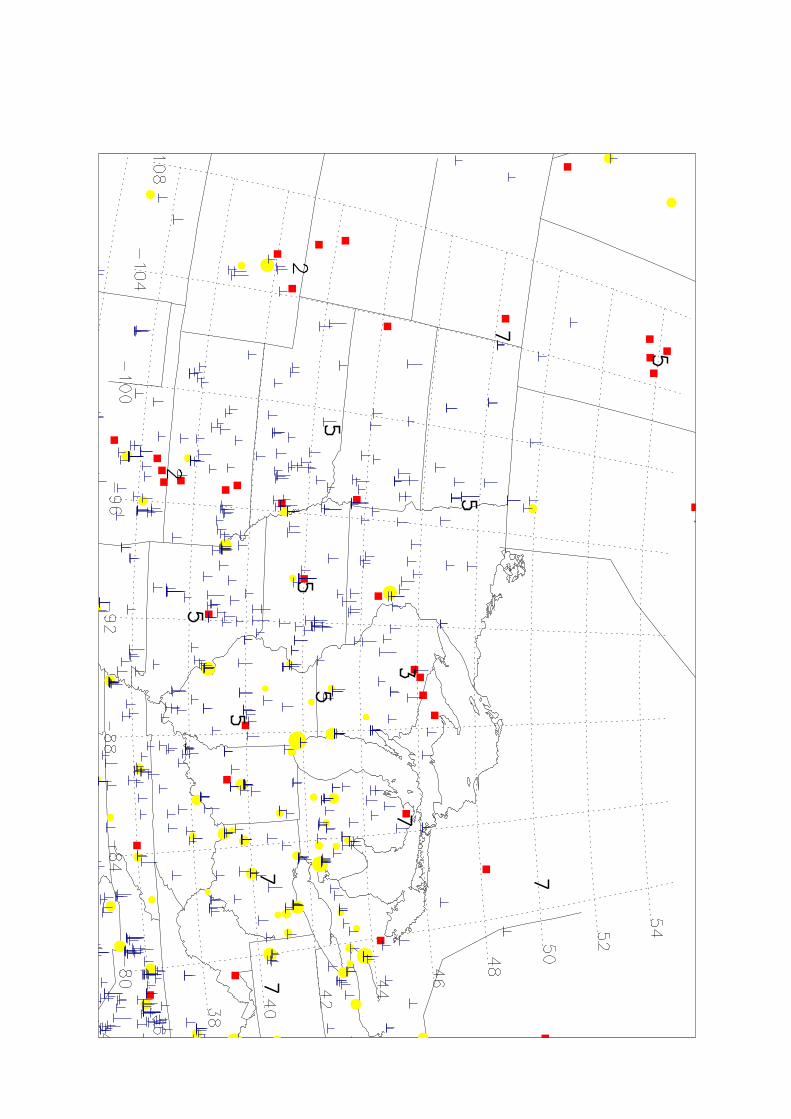
Coastal margin research will be conducted jointly with OCCC and will include all four tiers of observations as outlined in Table 2. The plan developed at the NACP workshop (NACP, 2002) envisions a backbone network of approximately 6-12 dedicated coastal sampling sites (Figure 2) along the eastern, western and Gulf of Mexico coasts of North America, to be outfitted with surface moorings making the Tier 1 time-series measurements needed for air-sea CO2 flux estimates, including high-quality atmospheric and ocean pCO2 measurements. The proposed number of coastal time-series represents a minimal coverage to investigate the range of biogeochemical marine provinces.
Cross-shelf surveys running past the mooring locations at monthly or shorter intervals will be used to assess on-shore/off-shore variability, and bi-weekly to monthly survey cruises will be run along the continental margins connecting the mooring sites to put the time-series measurements in a larger spatial context at the Tier 2 level. Given the current understanding of the complexity and variability of the coastal ocean and estuarine systems, however, it is important to recognize that the above proposed network is the initial setup and that eventually a customized sampling strategy will be needed to address regional fluxes, and leveraging current and future coastal projects. For example, it would be advantageous for the coastal moorings and ship tracks to be co-located with atmospheric sampling sites onshore. It is especially important to coordinate with programs, like NASA’s coastal program, that combine in situ observations with remote sensing to characterize regional environmental conditions at the time and space scales most relevant to the NACP (OCCC Section 5.5).
Intensive short-term coastal process studies are needed at a subset of the “backbone” network sites to better understand the ecosystem and carbon cycle dynamics of each region (OCCC Section 6.2). Each study will examine processes regulating photosynthesis, nutrient cycling, light limitation, carbon chemistry (organic and inorganic), nutrient remineralization, sediment burial, and onshore/offshore transport, etc. Five sites have been initially selected for intensive process studies on the continental shelves and near-shore regions: Chesapeake Bay/Mid-Atlantic Bight, Mississippi delta, western U.S., Bering Sea, and the South Atlantic Bight. These sites have differing controls on carbon cycling and air-sea exchange of CO2. The five intensive sites should if possible include continuous CO2 flux measurements (eddy correlation and/or gradient) from fixed platforms off the coast. These platforms will be used to address the significant concerns over the use of simple wind speed relationships to estimate gas transfer velocities in areas where limited fetch, large concentrations of surfactants, topographic and near surface turbulence effects impact fluxes (OCCC Section 6.3). Coastal ocean intensive studies may have to be spread out over several years, due to funding constraints. Nevertheless, five studies as proposed here represent the minimum necessary to make significant progress on constraining the coastal fluxes and effects on CO2 concentrations.
23

12
3456789
1011121314151617
181920212223242526272829
NACP Science Implementation Strategy
Figure 2. Proposed sampling domains for the coastal ocean component of NACP. The red dots show the locations of coastal time series, black solid lines indicate survey lines, and red transparent boxes indicate proposed process study sites.
Coastal measurements represent a substantial effort that will benefit, and will benefit from, complementary ongoing and planned coastal programs at several agencies. The time-series moorings can build upon existing and planned infrastructure. For example, CO2 moorings off the east and west coasts and the Gulf of Mexico could tie into proposed cabled observatories such as LEO-15 (New Jersey), MARS (Monterey Bay), Martha’s Vineyard Coastal Observatory (Massachusetts), and NEPTUNE (Washington). Coastal moorings, such as those deployed off of Monterey and in Santa Monica Bay, California, already have CO2 measurements and should be locations in the backbone network of coastal sites. Some of these sites may need only additional calibration activities to become fully integrated with the NACP network. It is also feasible to add biogeochemical sensors to buoys that are not primarily directed towards ocean research. As an example, NOAA, through the National Weather Service and National Data Buoy Center (NDBC http://www.ndbc.noaa.gov), maintains and provides real-time meteorological and surface ocean data from ~80 moored buoy stations in the Atlantic, Pacific, the Gulf of Mexico, and the Great Lakes, the majority in coastal environments.
Many of the remotely sensed Tier 4, oceanographic variables (e.g., SSH, SST, wind speed, ocean color) that are now routinely used in ocean carbon research are being transitioned from research data into operational products, much has been done for weather satellites. While this has the advantage of guaranteeing continuous measurements into the future, potentially critical issues arise as to whether the operational data will be suitable for development of coastal algorithms and long-term coastal studies. The community must continue to express their need for the development of improved algorithms for special case regions that are a large part of the NACP ocean component. Currently, only a limited number of carbon related products are produced routinely by instruments like SeaWiFS (chlorophyll-a) and MODIS (chlorophyll-a, primary production, and calcite). Of these, only chlorophyll-a has been extensively validated using post-launch comparisons with in situ data and very little work has been
24
123456789
10111213141516
NACP Science Implementation Strategy
done in coastal environments. A substantial level of effort is needed to verify and improve the calcite and primary production algorithms. Algorithms for other parameters such as color dissolved organic matter (CDOM) and POC are being developed but have not been the focus of a broad based validation effort. Site-specific algorithms for dissolved organic carbon (DOC) in river plumes, for instance, may be feasible as well, but require a diverse database of DOC and optical properties for algorithm evaluation. Ongoing dialogue between the remote sensing development and user communities is crucial to optimally utilize existing data and to guarantee high quality data records for the future.
The first step for developing a specific coastal ocean plan is to organize a cross-disciplinary NACP/OCCC workshop including coastal oceanographers currently working in the North American continental margins to outline the existing programs and opportunities for collaboration and to refine the needs of the NACP and OCCC and develop a detailed strategy for each region. There is also an immediate need to improve the technology for mooring based CO2 and related biogeochemical measurements (OCCC Section 9) and establish a few key test-bed locations.
17 1.4. The atmospheric observing system: Ground stations, 18 aircraft and tall and short tower measurements 19 Variations of concentration of atmospheric carbon gases in space and time constitute 20 an independent set of observations which reflect the distribution of surface exchanges of 21 these gases. NACP will develop and improve these observations as a valuable constraint 22 on spatially-explicit carbon cycle models (Section 1.5). The program will also develop an 23 analytical framework for estimation of regional surface fluxes from them using inverse 24 modeling and data assimilation (Section 1.6). Combination and juxtaposition of spatially-25 resolved flux estimates using process-based models and constraints from atmospheric 26 observations will allow finely resolved gridded products to be quantitatively evaluated, 27 and will improve estimates of carbon fluxes and stocks as well as their uncertainty.
28 Long-term measurements on tall towers and routine aircraft flights will provide 29 spatially and temporally resolved atmospheric data for the major carbon gases, CO2, CH4, 30 and CO. High priority is given to significantly upgrading and enhancing these 31 observations, and to include continental sites in the network of ground stations. 32 Measurement sites and protocols should be selected to enable strong constraints to be 33 placed on estimates of the annual net sources and sinks of CO2, CH4, and CO, with few 34 assumptions and minimal reliance on transport models. The development of the 35 observing system should be timed to satisfy the policy- driven need to provide 36 quantitative estimates of the annual net U.S. biospheric carbon source/sink. The selection 37 of new sites should enable rapid development of improvements to the resolution of 38 sources and sinks inferred from observations. Data from existing and new sites, and from 39 intensive measurement programs, should be used to guide and optimize network design.
40 Measurements of trace gases on towers and routine aircraft ascents are 41 complementary, and ideally should be sited together. Aircraft can probe the entire 42 tropospheric depth, but are limited to daytime, in good weather conditions. They are 43 relatively expensive to operate. Tower measurements are continuous and function in poor
25

12
3456
789
101112
13141516171819202122
23242526272829303132333435
3637383940414243
NACP Science Implementation Strategy
weather, but sample only the lowest levels of the atmosphere (up to 600 m AGL) at a fixed point.
The NACP anticipates a network of about 30 sites in North America where vertical profiles of trace gases and their isotopes would be measured at a frequency of up to every other day using small aircraft. This number was selected by consideration of the covariance length (~ 1000 km) for synoptic weather patterns that influence fluxes.
Implementation of the full network should be in phases, for several reasons: First, we do not know the optimal locations for these sites for assessment of carbon fluxes at regional scale. Modeling studies and analysis of atmospheric data are underway to help optimize network design. Second, current capabilities must be expanded to operate the full network. Third, an immediate assessment of the annual net carbon source or sink using a partial network would be extremely valuable for policy.
New aircraft sites and phasing: Table 3 lists existing (FY03) and new aircraft sites projected for the early phase-in period. In FY04 five sites along the continental margins will be added to measure the composition of air entering and leaving North America. New sites for FY04-05 will be determined using results of models, with weight given to supporting regional intensive studies (first in the mid west and/or southeast). Sampling frequency higher than normal will be needed for at least one year at several sites to help assess the optimal strategy. Flights over the existing Wisconsin tower will likewise increase to twice per week. Measurements at the Wisconsin site will also help improve model representations of atmospheric boundary layer (ABL) processes, in support of model-data fusion efforts.
The CO2 content of air flowing off the east coast of the continent reflects the signals from terrestrial exchange and fossil fuel sources. On the west coast, it is uncertain how much of plumes originating from major cities, agriculture, and terrestrial ecosystems are blocked from traveling into the continental interior by north-south mountain ranges, including the Cascades and Sierra Nevada. Vertical profile sites off shore, such as at Bermuda and Newfoundland, are expected to be useful to assess the mixing processes that redistribute continental ABL air into the marine atmosphere. Ground stations at these sites should be upgraded to continuous measurements of CO2, CH4, and CO. Quantitative assessment of mixing processes at the land-ocean margin and over the ocean will greatly strengthen the interpretation of existing multi-decadal CO2 records from marine ABL sites, and increase the value of planned new observations on ships and buoys. Another key location is in the southern US, such as over the NOAA/CMDL tower site in Moody, Texas, or the Southern Great Plains site of the DOE/ARM program in Oklahoma.
Small charter aircraft will be used to sample the atmosphere from the surface to 6-8 km. On each flight 12 flask samples will be filled for analysis of CO2, CH4, CO, H2, N2O and SF6 mixing ratios, and the 13C/12C and 18O/16O composition of CO2. Concentrations CO2, CO, and CH4 will be measured continuously, as soon as robust high precision analyzers become available. For CO2 this may happen in 2004. Measurements of other trace gases and aerosols may be added if instrumentation becomes available. Weekly samples are already being collected over several locations (Harvard Forest, WLEF-TV, ARM-SGP, Carr CO, others?).
26

123456789
10111213141516
171819202122232425262728293031
323334353637383940
NACP Science Implementation Strategy
New tall tower sites will be added in parallel with aircraft sampling sites. Currently, CO2 is measured accurately at tall towers in Wisconsin and Texas, and at a few AmeriFlux and Fluxnet-Canada sites (e.g. Harvard Forest in Massachusetts, WLEF-TV in Wisconsin, ARM-SGP in Oklahoma, Thompson, Manitoba, and Prince Albert, Saskatchewan). In FY04 measurements will be added at a tall tower site in Maine (as part of the NSF-sponsored COBRA-ME project) and in the southeast USA to complement the existing sites for measurements of large-scale gradients of trace gases in the continental ABL. In FY04-05 nine additional tall (400-600 m) towers (existing television towers) will be instrumented around the USA. Many will be located near aircraft profile sites. At each of the new tall tower sites a low-maintenance, relatively inexpensive system for long-term trace gas measurements will be installed. The observations will initially include continuous measurements of CO2 mixing ratios; measurements of CO and CH4 will be added when robust, high precision instrumentation becomes available. Flask samples will be automatically collected weekly or daily and sent to CMDL for analysis of CO2, CH4, CO, H2, N2O and SF6 mixing ratios, and the13C/12C and 18O/16O composition of CO2.
Accurate CO2 measurements at flux tower sites. Tall (400-600 m) transmitter towers may not exist in all locations where measurements are desired, and are very costly to construct. Accurate measurements of CO2 on many of the existing short (20 - 80 m) AmeriFlux and Fluxnet-Canada towers can provide wide spatial coverage at low cost. During strongly convective periods (typically afternoon), air near the surface is closely coupled to the ABL. Vertical gradients are small and can be estimated reliably using the surface fluxes being measured by these towers. Mixing ratios of CO2 measured at most AmeriFlux towers currently have insufficient accuracy relative to WMO standards (accuracy of 0.2 ppm or better is required), with a few exceptions. Modest effort is needed to calibrate AmeriFlux CO2 measurements accurately with standard reference materials traceable to the WMO Mole Fraction Scale. AmeriFlux sites should also institute additional quality checks such as using an “archive” gas tank at each site that would be measured once per day, and would therefore last many times longer than the site standard tanks (years). Sets of circulating standard tanks would provide further means to identify any offsets among sites.
The introduction of accurately calibrated CO2 measurements at these sites will fill in gaps in the tall tower network, especially to obtain concentration data where installation of measurements on tall towers will either not be available, or where it might be far in the future. Sites of special interest to provide boundary values for gas concentrations include Oregon and California, Florida, New Mexico/Arizona, and several stations of Fluxnet-Canada. A competition should be held to select flux tower sites for calibrated CO2 and CH4 concentration measurements, after which roughly one year would be required for the CO2 to come on line. Likely more time would be needed for CH4 depending on the method chosen for analysis.
27

--
--
--
--
----
----
----
----
--
NACP Science Implementation Strategy
1 Table 3. Summary of Aircraft Sites and Sampling Frequency
3 ## FY02 FY03 FY05 FY07 2 Sitea Sampling Frequency (days)
4 01 Harvard Forest, MAb 30 14 7 7 flux, cont. CO2
5 02 Carr, CO 7 7 7 76 03 Tofino, BC 0 7 7 7 flask (Estevan Point)7 04 Park Falls, WI 30 7 3.5 3.5 flux, flask, cont. CO2 (LEF)8 05 Fairbanks, AK 30 7 7 79 06 Trinidad Head, CA 0 7 7 7 CMDL observatory
10 07 Corpus Christi, TX 0 7 7 7 tower = Moody (WKT)11 08 Portsmouth, NH 0 3.5/7c 3.5 3.512 09 ARM-SGP, OK 7 3.5 3.5 3.5 flask; cont. CO2 in 2005 13 10 New Bern, NC 0 7 3.5 3.5 (tower = Grifton)14 11 Ames, IA 0 0 3.5 3.5 (tower)15 12 Bermuda 0 0 7 7 flask (BME, BMW)16 13 Mt. Vernon, IL 0 0 3.5 3.517 14 Devil’s Lake, ND 0 0 3.5 3.5 (tower)18 15 Alliance, NE 0 0 3.5 3.5 (tower)19 16 Mansfield, OH 0 0 3.5 3.5 (tower)20 17 Pellston, MI 0 0 3.5 3.5 (tower)21 18 Savanna, GA 0 0 3.5 3.522 19 St. Johns, NL 0 0 7 723 20 Barrow, AK 0 0 0 7 CMDL observatory (BRW)24 21 Nome, AK 0 0 0 725 22 Sitka, AK 0 0 0 726 23 San Diego, CA 0 0 0 7 Scripps Pier (SIO)27 24 Elko, NV 0 0 0 3.5 flask (UTA)28 25 Midland, TX 0 0 0 3.5 (tower)29 26 Las Cruces, NM 0 0 0 3.530 27 Morgan City, LA 0 0 0 731 28 El Dorado, AR 0 0 0 3.5 (tower = Jonesboro)32 29 Huntsville, AL 0 0 0 3.5 (tower = Selma)33 30 Chambersburg, PA 0 0 0 3.5 (tower)34 31 Lewistown, MT 0 0 0 3.5 (tower)35 32 Richland, WA 0 0 0 3.536 33 Yellow Knife, NT 0 0 0 3.537 34 Prince Albert, SKb 0 0 0 3.5 flux, cont. CO2 (BERMS)38 35 Thompson, MBb 0 0 0 3.5 flux, cont. CO2 (NOBS)39 36 Fraserdale, ON 0 0 0 3.5 flask, cont. CO2
40 37 Labrador City, NL 0 0 0 3.541 Notes:42 Italicized sites are in operation as of December 2002.43 aSite selection is subject to NACP Science Team planning44 bData specifications pending for inclusion of flux tower measurements in the global 45 data base46 cSample once or twice per week on alternate weeks
28

123456789
1011121314151617181920212223242526272829303132333435363738394041424344
NACP Science Implementation Strategy
Table 4. Tower and Surface Sampling Sites Expected to be in Place by FY05a
Height (m AGL)bSite
AmeriFlux Sites with Calibrated CO2 (current)c: Harvard Forest, MAd 30 Thompson, MBd 30 BERMS, SKd 30 ARM-SGP,OK 60
Tall Towers (TV, radio and, cellular)e: Moody, TXd 457 Park Falls, WId 396 Howland, MEf 120 Grifton, NC 500 Jonesboro, AR 500 Ames, IA 500 Champaign, IL 350 Devil’s Lake, ND 400 Lincoln, NE 500 Mansfield, OH 430 Selma, AL 480 Lewistown, MT 400 Columbia, SC 470
Flask Sites: Estevan Point, BCd surface (MBL) Fraserdale, ONd surface Trinidad Head, CAd surface (MBL) Point Arena, CAd surface (MBL) Wendover, UTd surface (desert) Key West, FLd surface (MBL) Bermudad surface (MBL) Niwot Ridge, COd mountain Barrow, AKd surface (MBL) ARM-Southern Great Plains, OKd 60
Notes: aSelection of new sites is subject to NACP Science Team planningbHeight of measurements, for future tower sites estimated based on available towers cAdditional AmeriFlux towers are expected to be instrumented for accurate CO2 by
FY05 dSites in operation in FY02 eApproximately 10 tall towers are planned to be instrumented by FY07 in addition to
those listed here fHowland site is funded under COBRA-ME (NSF) MBL = marine boundary layer
29

12345678
9101112131415161718
1920
2122
2324
252627
2829
303132
3334353637383940
4142
NACP Science Implementation Strategy
By mid-2007, NASA’s Orbiting Carbon Observatory (OCO) is expected to be in operation. This instrument will fly in a sun-synchronous polar orbit (approximately 1:15 PM local crossing time). It will estimate column mean CO2/O2 mixing ratio at approximately 50,000 locations across North America every day in narrow North-South strips approximately 2000 km apart. Calibration and evaluation of OCO data will take advantage of aircraft campaigns planned as a part of NACP. When OCO data become available, and have been robustly tested, they will be used in conjunction with tower- and aircraft-based in-situ sampling to improve the top-down carbon budgets (Section 1.6).
Atmospheric methane. Present in the atmosphere at much lower concentrations than CO2, CH4 is second only to CO2 as a greenhouse trace gas with predominantly anthropogenic sources. Its concentration has roughly tripled in the last several hundred years, but the rate of increase exhibits significant and poorly understood year-to-year variability. In addition to its radiative role, CH4 takes part in a variety of chemical reactions with other important gases (CO, O3) in the troposphere and stratosphere, making it a key species for understanding the global carbon cycle. Although CH4 and CO2 are intimately linked, sources and sinks of the gases differ. These differences must be taken into account during the design of an integrated research program such as the NACP.
Immediate research needs for better characterization of CH4 variability, sources, and sinks include:
• Establishment of an international calibration standard for CH4; support inter-calibration of isotopic measurements.
• Development of sampling/measurement protocols for characterizing wetland hydrologic regimes as they affect CH4 production and emissions.
• Identification of differences needed in CH4 sampling protocols compared to CO2 protocols; NACP site selection for tall towers and aircraft vertical profiles should take into account specific requirements for CH4 emissions.
• Identify specific sensor needs. Develop faster, lighter, cheaper, more robust sensors for unattended measurements of CH4 and CH4 isotopes.
• Establish continuous, high-frequency atmospheric CH4 concentration measurement site on the east coast of North America (equivalent to Cape Meares).
• Add continuous CH4 flux and ancillary measurements to two or more flux tower sites as soon as possible, to begin collection of coincident measurements of CO2 and CH4, and to begin acquisition of a long-term data set. Current AmeriFlux/Fluxnet-Canada wetland sites are Park Falls/WLEF and Lost Creek, Wisconsin; Mer Bleue Bog, Ontario; and (tentatively) Bleak Lake Bog, Alberta. Flux mapping (§3.2), network design studies (§2.1), and analysis and modeling of these tower data will guide deployment of future measurements.
• Ensure that additional species (e.g., CO, HCFCs) and isotopes (13C, 14C, D) are measured in large-scale concentration programs, and isotopic
30
5
10
15
20
25
30
35
40
NACP Science Implementation Strategy
1 measurements in flux programs, to better characterize CH4 source regions 2 (see §2.1). 13CH4 is measured at 13 CMDL stations.
3 • Evaluate the adequacy of the existing measurement network of floodplain 4 wells, wetland water table monitoring, and stream gages (geographic
distribution, sampling frequencies).
6 1.5. Bottom-up integration: Spatially-distributed modeling 7 of carbon source and sink processes 8 Several types of spatially-explicit simulation models of carbon sources and sinks will 9 be required to obtain budget closure over North America and allow comparison with
atmospheric mass balance. Fossil fuel combustion will be estimated from improved 11 inventory methods, and downscaled in space and time using energy consumption models 12 (e.g., by day of the week, heating and cooling requirements, and so forth). Forest fire 13 emissions will be estimated from remote sensing, land management reporting, and 14 combustion models. Models of carbon exchange between the atmosphere and terrestrial
ecosystems will have new emphasis on managed ecosystems (agriculture, forest 16 management, and urban/suburban landscapes). Ecosystem fluxes due to management, 17 disturbance history, and succession are crucial to diagnose because they drive the time 18 mean sources and sinks. Models of these processes will require detailed compilations of 19 land use and management history, irrigation, harvest, and so forth, and may run on long
time steps. Conversely, models of terrestrial photosynthesis, respiration, and 21 decomposition will be required to resolve temporal changes in fluxes on diurnal, 22 synoptic, seasonal, and interannual time scales that will dominate the atmospheric 23 variability. These models will be sensitive to weather drivers, remote sensing of the state 24 of vegetation, and hydrologic processes.
Under NACP, special emphasis will be placed on process-based modeling that 26 predicts observable quantities at multiple scales, to facilitate quantitative model 27 evaluation. Ecosystem flux models will be evaluated locally against eddy covariance data 28 collected at the network of flux towers. Models of ecosystem dynamics and carbon 29 storage in biomass, litter, soil carbon, and sediments will be evaluated against inventory
and distributed sampling data. Agricultural production and carbon storage models will be 31 evaluated against production statistics and extensive soil sampling. Fossil fuel emissions 32 inventories and downscaled flux estimates will be evaluated by intensive atmospheric 33 observing campaigns that measure multiple combustion gases. Gridded models of surface 34 exchanges will compute highly-resolved component fluxes from both managed and
unmanaged ecosystems, fires and other disturbances, fossil fuel emissions, lateral 36 hydrologic transfers and storage, and air-sea gas exchange. The output from these 37 component flux calculations will be used to drive atmospheric transport models at 38 appropriate resolution for quantitative evaluation against atmospheric observations. 39 Several of these detailed comparisons between component models and observations will
require intensive field campaigns to establish the reliability of the modeling and analysis 41 framework at regional scales (Section 1.7).
31

5
10
15
20
25
30
35
40
NACP Science Implementation Strategy
1 1.5.1. Additional observations to drive source/sink models
2 1.5.1.1. Weather and Climate Data
3 Weather and climate are important drivers for ecosystem physiology, surface water 4 hydrology, agricultural production, fire behavior, and fossil fuel combustion. In addition,
atmospheric inverse modeling techniques depend sensitively on accurate knowledge of 6 winds and cloud transport. Meteorological reanalysis will be performed by one or more 7 operational centers (ECMWF, NCEP, and NASA) during the NACP, to produce gridded 8 weather analyses for the globe. Current products are available on a 1º grid every six 9 hours. The resolution of these analyses is projected to improve to 0.5 º in 2004 and 0.25 º
by 2006. Higher time resolution is desirable to support trace gas transport inversions 11 (Section 1.6), and specialized high-resolution analyses using mesoscale models will be 12 driven from these global products with NACP support. These data will be among the 13 most voluminous information products within NACP, and pose special challenges for 14 data management and availability.
Three distinct sets of meteorological data will be required: (1) surface data required 16 to drive physiological models of ecosystem carbon flux; (2) three-dimensional transport 17 fields (winds, turbulence, and cloud mass fluxes) needed for tracer transport inversions; 18 and (3) cloud-resolving analyses of specific cases in support of NACP intensives. Surface 19 weather products can be generated by assimilation of atmospheric data into mesoscale
models at about 10 km resolution and saved hourly. This is likely sufficient for winds and 21 humidity, but radiation and precipitation will need to be downscaled further, especially in 22 complex terrain. This could be accomplished using weather radar, high-resolution digital 23 topography, and satellite imagery. Hourly rainfall rates derived from NEXRAD radar are 24 already available at 4 km over 96% of the continental USA. Gaps in the radar coverage
could be filled using GOES infrared imagery. Temperatures and radiation could be 26 adjusted for elevation, slope and aspect using high-resolution topographic data to deliver 27 1 km hourly weather commensurate with vegetation imagery. Production of three-28 dimensional transport fields required for inverse modeling at this resolution would be 29 computationally prohibitive, but will be feasible at 10 km resolution using mesoscale
models. Cloud resolving simulations of limited domains could be produced using grid 31 nesting for periods of NACP intensives.
32 1.5.1.2. Emissions Inventories and Temporal Behavior
33 Fossil fuel emissions are currently documented at state and annual levels, with 34 estimates for a mean seasonal cycle within the US. A concerted effort will be required to
refine these estimates to finer spatial scales, and to document interannual variability. 36 These estimates will also be downscaled in space and time using energy consumption 37 models. For example, emissions due to residential and commercial heating and cooling 38 will be scaled according to weather, and vehicle emissions will be greater on weekdays 39 than weekends. These downscaled estimates will be needed to drive atmospheric trace
gas calculations and source attribution studies.
32

1
23456789
10
11121314151617181920212223242526
2728293031323334353637
383940
41
42
NACP Science Implementation Strategy
1.5.2. Terrestrial ecosystem modeling
Understanding the processes responsible for carbon sources and sinks in terrestrial ecosystems, as embodied by rigorously evaluated quantitative models, will be among the most important contributions of the NACP. These models will enable source/sink attribution and prediction of future changes in the carbon cycle, which can never be achieved by observations alone. The key contributions of NACP in this area will be focused on evaluating models with new data products and on the extension of the models for prediction of a maximum number of observable quantities, in an ecologically self-consistent framework. The integration of observations and model simulations will enable a new degree of model-data fusion.
Estimation of daily terrestrial net ecosystem exchange (NEE) for North America is now possible with currently available datasets. In general, two methodologies are required: (1) a terrestrial biogeochemistry simulation that after initialization would require only daily meteorology to simulate NEE and the carbon balance components of photosynthesis and respiration; and (2) a computation driven by remote sensing that would regularly image the continental land surface but operate simpler models of daily GPP and NPP. Past modeling studies such as VEMAP have already provided first estimates of continental NEE and some interannual trends, but represent essentially potential vegetation conditions, not existing vegetation cover. Although such models may be initialized with satellite derived leaf area index, they then simulate hypothetical trajectories of vegetation dynamics. Remote sensing regularly quantifies land surface reflectances, so immediately can record major disturbance events, vegetation structure, and seasonal phenology. Biogeochemical modeling can compute all components of the carbon balance, but cannot maintain a realistic representation of the changing landscape. A data assimilation approach will be required to optimally integrate these two capabilities (Section 1.6).
Land surface biophysical modeling at an hourly or shorter time step will be required to provide uninterrupted, spatially complete estimates of surface carbon fluxes to compare against atmospheric data. Such models must first accurately compute energy and water balances under all vegetation and climatic regimes represented on the continent. The model then must compute hourly carbon fluxes (photosynthetic uptake and autotrophic and heterotrophic respiration emissions of CO2). Critical controls that nutrients exert on the carbon cycle processes must be represented. Currently the best space/time tradeoff for terrestrial BGC modeling at full continental scales is daily at 10 km resolution, or hourly at 50 km resolution. For quantitative comparison to atmospheric observations, resolution must be improved to hourly at <10 km. This will be possible by 2004.
In order to initiate terrestrial BGC simulations, a number of key ecosystem conditions must be quantified for each grid cell of the continent. The input initialization data include:
• Current vegetation type
• Annual landcover change
33

12
3
4
5
6789
101112
13
141516171819202122
232425262728
293031323334
NACP Science Implementation Strategy
• soil physical (water/thermal capacities, texture) and chemical characteristics (nitrogen phosphorus pools in organic matter)
• digital topography
• soil, stem and leaf C and N pools
• stand age distribution, and disturbance regime
These data must reflect realistic disturbance and land use history of land surface for NEE estimates to be adequate for terrestrial CO2 exchange calculations. The size of the soil C and N pools and forest stem C directly influences the magnitude of autotrophic and heterotrophic respiration computed and so impacts the accuracy of the final CO2 balance considerably. In many cases this will determine whether the time-mean computed CO2 flux is a source or a sink.
Specific activities for the NACP will include:
Development of capability for prediction (i.e., down-scaling) of carbon fluxes on a <10 km grid, including effects of soils, climate, land use history, land management, nutrient deposition, fires, pollution, herbivory, and invasive species. This will include development and evaluation of necessary contemporary data from remote sensing and climate models. Historical contributions of land use change and climate variation to carbon flux will also be evaluated using simulation models with inputs of reconstructed land use trajectories and interannual variation in climate. Topographically defined gradients in microclimate and hydrologic routing are also represented in gridded models.
Comparison of hourly, seasonal, interannual, and multi-decadal dynamics of the terrestrial carbon system (pools and fluxes in biomass and soil), which control net ecosystem exchange of carbon (NEE) with the atmosphere, with intensive-site measurements and inventory data across North America, will be addressed using statistically designed stratification (Tiers 1, 2, and 3 of the terrestrial observing network, Section 1.1).
In support of the longer-term NACP goal of model-data fusion, these models will be enhanced to utilize observations at multiple spatial and temporal scales for model parameterization. These observations will include both in-situ biometric, physiological, and biogeochemical measurements at locations selected by statistical design, and spatially extensive measurements made from remote sensing of spectral properties, height structure, and hydrology.
35 1.5.2.1. Time Mean Source/Sink/Storage in Forests and Grasslands
36 Finely gridded imagery, soils data, land-cover, land-use, and historical land 37 management data (e.g., harvest, fire, disease) will be used to drive forest succession and 38 ecosystem dynamics models which predict current source/sink status and storage of 39 carbon in above and belowground reservoirs, including litter and soil carbon. These 40 model predictions will be compared in detail to forest inventory data collected over past 41 decades to evaluate their performance in terms of height, diameter, and biomass.
34

5
10
15
20
25
30
35
40
NACP Science Implementation Strategy
1 Analyses of soil and litter carbon storage will be evaluated against data collected at Tier 2 2 sites.
3 1.5.2.2. Sources, Sinks, and Storage due to Agriculture
4 Agricultural data (crops planted, harvest statistics, irrigation, and fertilizer application) will be collated and made available. Analyses will be required to convert
6 from county-level to spatial grids appropriate for models, and for comparison and 7 merging with remote sensing and other data streams. These data will be used in crop 8 models to predict plant growth and carbon fluxes on subdiurnal time scales. Carbon flux 9 estimates form the models will be compared to measured fluxes using eddy covariance
methods. Total growing season carbon storage will be evaluated using crop inventory 11 data. Compatible comparisons between the models and the observations will require the 12 models to predict both crop yields and carbon storage.
13 1.5.2.3. Ecophysiology: Diurnal, Seasonal, and Interannual Variations 14 in Fluxes of Carbon, Water, and Energy
Simulation models of surface fluxes of radiation, momentum, heat, water, and carbon 16 will be driven by highly resolved analyzed weather, land cover classification, soil texture, 17 vegetation characteristics, and land-use. Models using different approaches to scale from 18 leaf to canopy to pixel will be employed. The purpose of these simulations is to produce 19 spatially explicit analyses of photosynthesis and ecosystem respiration that can be
integrated to regional scales. Model parameters will therefore be specified from data that 21 are available everywhere, not from local site measurements (e.g., soil carbon or 22 micrometeorology) that would not be available at continental scale.
23 Simulated fluxes will be evaluated locally at sites where eddy covariance 24 measurements are available, across a range of ecosystem types, land-use types, and other
environmental gradients. Evaluation of the models against local measurements will 26 include diurnal, seasonal, and interannual variability and responses to climate variations 27 and other environmental forcing. Highly resolved surface fluxes produced by these 28 models will be prescribed as a lower boundary condition to atmospheric transport 29 models, which will then be used to simulate variations in trace gas concentration in the
atmosphere. Simulated trace gas concentrations (CO2, CO, and CH4) will be compared in 31 detail to atmospheric observations made from continuous analyzers on towers and from 32 aircraft.
33 1.5.2.4. Urban and Suburban Landscapes
34 In addition to emissions from fuel combustion and fluxes due to land management such as agriculture, humans have substantially modified vegetation and soils in urban and
36 suburban landscapes. In wetter climates, these modifications typically involve forest 37 clearing and nutrient additions, whereas in drier climates they involve irrigation and 38 replacement of native grasses with trees and shrubs. In all areas, hard paved surfaces and 39 buildings have altered the hydrologic cycle and thermal energy regime. Models which
treat the carbon balance of these anthropogenic landscapes will be developed. They will 41 be driven by detailed geographic information regarding land cover and land use, by 42 analyzed weather, and by vegetation characteristics derived from aircraft and satellite
35
5
10
15
20
25
30
35
40
NACP Science Implementation Strategy
1 imagery at high resolution. They will predict both storage (biomass, soil carbon, etc) and 2 fluxes (photosynthesis and ecosystem respiration). Evaluation will include carbon storage 3 in wood, herbaceous vegetation, and soils (against Tier 2 sampling) as well as fluxes 4 (against eddy covariance data).
1.5.3. Carbon emission by fires
6 Continental-scale datasets of burned area will be compiled as a part of the NACP 7 across agency, state, and national borders. Field studies and remote sensing analyses will 8 provide ancillary information about fire severity and fuel consumption within burn 9 perimeters as a function of vegetation type, climate, and soil characteristics. Efforts will
be made to compile spatially explicit maps of burned area over the last 4 decades at a 11 continental scale, and where available, over longer time periods but with limited spatial 12 resolution. This information will be used for two purposes: 1) on decadal timescales as 13 means to spin up ecosystem models used to predict contemporary and future carbon sinks 14 and 2) on a daily basis over the NACP period as a means to provide bottom up estimates
of CO2, CO, and CH4 emissions from fires that are contributing to flask, tower, and 16 aircraft observations.
17 Models of fire emissions will require detailed information about local climate at the 18 time of the fire, and accurate estimates of aboveground and surface carbon pools, 19 including the carbon content of soil organic layers. Consumption of fuels at the soil
surface and their moisture status critically determine emission factors of CO and CH4. 21 Uncertainties associated with these emission factors limit the effectiveness of top down 22 constraints on fire emissions obtained from aircraft and flask observations. Reducing 23 these uncertainties will be a key NACP objective that will link field measurements, 24 analysis of aircraft and flask data, and ecosystem modeling. On longer timescales, the
combustion completeness of surface fuels also controls the establishment of species 26 within the burn perimeter (via controls on local moisture and energy balance). Ultimately 27 the severity of a burn event has important consequences for the long-term (decadal) 28 trajectory of carbon accumulation.
29 1.5.4. Hydrologic transfers and storage of carbon
Hydrologic modeling will be linked with ecosystem models described above, and 31 will include soil moisture, drainage, runoff, and hydraulic routing at appropriate spatial 32 resolution. These models will be driven by analyzed weather, topography, land use, 33 vegetation data specified from remote sensing, and other data. Predictions of runoff and 34 streamflow will be evaluated against gauged streams and rivers and reservoir levels at
multiple spatial scales. The models will include sediment transport, with particular 36 reference to carbon, dissolved inorganic and organic carbon, alkalinity, and nutrient 37 transport in surface water and deposition in sediments and coastal oceans. These 38 predictions will be evaluated against data collected by national hydrologic and water 39 quality networks as described above (Section 1.1.5).
1.5.5. Fossil fuel emissions downscaling in space and time
41 State or county-level inventories of fossil fuel emissions will be downscaled using 42 emission models driven by weather data, statistics of power and industrial plant usage
36

1234567
NACP Science Implementation Strategy
and locations, population density, vehicular traffic and other data. The goal is to provide gridded emissions estimates on a daily or subdiurnal basis commensurate with the < 10 km flux analyses from ecosystem and agricultural models. Emissions of CO2, CO, and CH4 will be estimated, and these will be prescribed as boundary fluxes in atmospheric transport models. The models will be evaluated against observations of trace gas concentration made from continuous analyzers on towers and near the surface, and from aircraft.
8 1.5.6. Ocean carbon modeling
9 The NACP modeling effort will be designed to assimilate the ocean carbon 10 observations and estimate regional sources and sinks for carbon. The quantification of 11 open-ocean and coastal carbon fluxes will involve a hierarchical approach (OCCC 12 Section 8), with widely distributed, representative sets of observations that provide a 13 foundation for satellite and model-based interpolations of oceanic CO2 fluxes over a 14 range of space and time-scales. Prognostic models will include ocean GCMs with scales 15 as small as a few kilometers, to resolve details of the very near-shore circulation, and also 16 basin-scale coarse resolution models. These models will be run either separately or using 17 rapidly advanced embedding.
18 Inverse modeling will be investigated as an independent way to estimate basin-scale 19 fluxes from changes in ocean inventory and other observations. Information obtained 20 from process studies will be used to constrain ecosystem models to evaluate the relative 21 contribution of various processes to the observed variability in air-sea flux and to assess 22 the vulnerability of various processes to anthropogenic forcing.
23 1.5.7. Atmospheric modeling
24 Simulation of the concentration of atmospheric carbon gases (CO2, CO, and CH4) 25 will provide a link between the process-based modeling of surface fluxes and the 26 atmospheric observations. This link is crucial because atmospheric concentrations reflect 27 integrated surface fluxes at larger spatial scales than can be measured in-situ. Comparison 28 of simulated concentrations with atmospheric observations is the only opportunity for 29 quantitative evaluation of both process models and their upscaling using remote sensing 30 and other spatial data products.
31 • NACP will require modeling efforts to produce simulations of continuous 32 atmospheric concentrations of CO2, CO, and CH4 over North America and 33 adjacent oceans at 0.25º (lat/long) or better resolution, and to compare these 34 simulations with atmospheric observations .
35 Substantial effort will be required to coordinate with operational centers to obtain 36 support of trace gas transport calculations and field experiments, using meteorological 37 forecast and analysis products. The grid sizes in operational global data assimilation 38 systems and forecast models are expected to improve to 0.5º by 2004 (~50 km), and to 39 0.25º (~25 km) by 2006. But the accuracy of transport calculations depends on the spatial 40 and temporal resolution of the underlying model and the accuracy of archived 41 meteorological data. Also, detailed information must be reported for transport fluxes 42 through clouds and in the planetary boundary layer, as well as on the larger scales. Loss
37

123
4567
89
1011121314
15161718192021
222324
NACP Science Implementation Strategy
of mass conservation through re-gridding or through the data assimilation process must be minimal. NACP analyses will require higher spatial and temporal resolution, more complete output, and better fidelity of archived data than currently available.
• NACP agencies and scientists will work with operational centers (NOAA NCEP, NASA GMAO, and ECMWF) to support archival of full meteorological analyses on hourly time steps, rather than the aggregated archives currently provided, and to improve accuracy of the assimilated product.
Intensive field experiments planned under NACP will require meteorological analyses at much higher resolution than is feasible in operational forecast models.
• NACP will require nested simulations of field intensives using cloud-resolving meteorological models driven by high-resolution global analyses. These models will include simulation of atmospheric CO2 and CO, and may include other gases and aerosols as well. They must meet even more rigorous constraints on mass conservation and reporting of sub-grid-scale mass fluxes.
Data collected during NACP will include climatological characterization of vertical structure of many trace gases, and very high-resolution characterization during intensive campaigns. Data from intensives will also be modeled at cloud-resolving scales, and simulations and analyses will be archived and made available for later research. These data will be very valuable to ongoing efforts by meteorologists to improve parameterized processes such as cumulus convection and boundary-layer entrainment in meteorological and climate models.
• In conjunction with major existing programs funded elsewhere, NACP will require efforts to improve transport-relevant meteorological process modeling in forecast, analysis, and climate models.
25 1.6. Top-down integration: Inverse modeling and model-26 data fusion
27 1.6.1. Inverse modeling from atmospheric observations 28 using tracer transport simulation
29 Inverse modeling refers to the estimation of area- and time-averaged fluxes over a 30 large area from variations in trace gas concentration using information obtained by 31 atmospheric transport modeling. In general, these techniques involve calculating a 32 “response function" or “influence function” which quantitatively relates surface fluxes at 33 each surface location to trace gas concentrations. The advantages of inverse modeling 34 over process-based bottom up integration include inherently larger coverage of the 35 relevant observations in space and time, and the prospect for completely independent 36 constraint on regional fluxes. The main disadvantage of these methods is that they 37 produce no information about the processes controlling regional carbon fluxes. They are 38 therefore unsuitable for source/sink attribution or for prediction.
39 There are at least three techniques being developed for atmospheric inverse modeling 40 at regional scales: (1) mass-balance techniques based on PBL budgeting (e.g. using data 41 from tall towers) or Lagrangian sampling; (2) synthesis inversion using prespecified
38
1234567
8
910111213141516171819
2021222324
252627
NACP Science Implementation Strategy
space/time patterns of fluxes or receptor-oriented modeling; and (3) estimation based on variational assimilation using adjoint or ensemble modeling. Each of these techniques is relevant to interpret NACP data, and each requires further development and testing before deployment. Each of these methods leverages the large existing global network of in-situ flask sampling, mostly deployed in the remote marine boundary layer. Details of observing configurations for NACP will best be determined following thorough experimentation and network optimization with synthetic data.
NACP requires the following enabling activities as soon as possible:
• Development, demonstration (with realistic synthetic data), and evaluation of inverse techniques for estimation of monthly CO2 exchange on a 100 km grid from a suite of atmospheric observations including continuous analyzers, periodic airborne sampling, and the existing global flask network. Evaluations must include a realistic treatment of important sources of error (model transport, representativeness, measurements), and quantitative estimation of uncertainty in the retrieved fluxes. They may also include novel data sources such as satellite retrievals and multiple trace gases. Traditional “synthesis inversion” methods will likely be inadequate to achieve this level of resolution. Adjoint, variational, and Kalman filter approaches can provide quantitative estimates of fluxes and uncertainty on arbitrarily fine model grids.
• Observing system simulation and network optimization experiments with several competing methods to assist in prioritization and site selection for NACP observing resources. These experiments should seek optimal strategies for deployment of a network of 10 to 50 new continuous analyzers and weekly aircraft profiles in addition to the existing network.
• Development, demonstration, and evaluation of competing methods for hourly to daily estimation of CO2 fluxes and their uncertainty on a 10 km grid using nested mesoscale models during NACP intensives.
28 1.6.2. Model-data fusion: Data assimilation into coupled 29 models of the North American Carbon Cycle
30 An alternative to the bottom-up integration using process-based models or top-down 31 integration using atmospheric inversions is an ambitious generalization of inverse 32 modeling that will involve the use of many different streams of observations to constrain 33 parameters in process-based models. Like atmospheric inversion, this approach involves 34 formal statistical estimation of model parameters by minimizing a cost function that 35 quantifies the mismatch between model predictions and observations. The advantage of 36 this approach over bottom-up or top-down integration is that it leverages the information 37 content of the atmospheric observations to produce process-based gridded flux estimates 38 that are self-consistent but also optimally consistent with many different types of data 39 (remote sensing, eddy covariance fluxes, forest inventory, atmospheric composition, 40 weather, etc). The principal disadvantage is that these methods are only now being 41 developed and are unlikely to be mature until later in the decade.
42 The goal of integration of top-down with bottom-up constraint is to provide finely 43 gridded (1-km) flux estimates for North America that explicitly represent all relevant
39
1234567
89
10111213141516171819202122
NACP Science Implementation Strategy
carbon cycle processes (fossil fuel emissions, forest management, agriculture, fires, CO2
and nutrient fertilization, responses to climate variability, etc), yet which are optimally consistent with all available observations. Quantitative estimates of the time- and space-varying uncertainty in these fluxes will also be produced by the assimilation system. These time-varying gridded data products will form the basis for future reporting on carbon budgeting, and will form a strong context for testing predictive modeling of the carbon cycle.
Research activities supported under NACP will include the development of variational or other methods for simultaneous assimilation into models such those described in Section 1.4 of data collected by aircraft and satellites (vegetation properties, meteorology, sea-surface temperature, ocean color, CO2, CO, other trace gases and aerosols), flux towers (ecosystem fluxes of heat, water, momentum, and CO2), in-situ measurements of atmospheric composition, forest biometry, physiology, and agricultural production, fossil fuel combustion, and soil biogeochemistry. Key to the success of these methods will be identification of parameters in process-based models that dominate the uncertainty in flux estimates. These parameters will be targeted for optimization through the assimilation process. Atmospheric and ocean carbon data assimilation techniques are already maturing, and efforts at assimilation of eddy covariance and forest inventory data into terrestrial ecosystem models are underway. The challenge will be to produce a coupled modeling system of carbon fluxes, storage, and transport processes that can assimilate a full suite of carbon observations to produce optimal analyses of fluxes and their uncertainties.
23 1.7. Interdisciplinary intensive field campaigns
24 1.7.1. Overview of NACP intensive field experiments
25 Intensive, interdisciplinary field experiments of limited duration provide 26 opportunities to measure a large number of parameters at high frequency and/or over 27 larger spatial scales, much more intensively than is practical for routine measurements or 28 process studies. A major recommendation of the North American Carbon Plan is to 29 conduct a series of intensive field experiments that will advance our understanding of the 30 carbon budget. The goals of such experiments are to:
31 1) Develop regional-scale, process-level understanding of important aspects of 32 the carbon budget needed to support annual to decadal forecasts of the carbon 33 balance over regional to continental areas, including implications of changes 34 in climate, land use, and carbon management;
35 2) Guide the development of a long-term observing network and the methods of 36 analysis needed to convert those observations into operational accounting of 37 regional and continental carbon budgets;
38 3) Evaluate techniques and infrastructure required to upscale process-based 39 models (Section 1.5) and downscale atmospheric observations (Section 1.6) 40 to produce estimates of regional carbon balance with quantifiable uncertainty. 41
40

123
4
5
67
89
10
1112
131415161718
192021
22232425
2627282930
3132333435
3637383940
NACP Science Implementation Strategy
To reach these goals, the field experiments must purposefully integrate multiple methods of studying the carbon cycle. The following elements are likely to be included:
• Carbon stock accounting based on inventories on land and in the sea;
• Carbon flux measurements using chambers, towers, ships, buoys, and aircraft;
• Carbon accounting based on atmospheric mixing ratio measurements made from towers, ships, coastal moorings, aircraft, and eventually satellites;
• Model studies synthesizing aircraft and satellite observations of the land surface, land and ocean survey data, surface and aircraft flux and mixing ratio measurements, and understanding of biogeochemical processes and climate;
• Regional accounting of fossil fuel use.
These multiple methods cannot comprehensively overlap in time and space, but they can be orchestrated to provide complementary information. All elements of the experiments are essential, because each quantifies one or more critical components of the budget that are obscure or invisible to other approaches. Validation of the full carbon accounting, based on data/model fusion using the full portfolio of approaches, is a major challenge representing a major goal for the intensive component of the NACP.
The field experiments will quantify the carbon cycle over seasonal and annual time scales, complemented by associated studies targeted on processes and stocks that are important on the time scale of decades to centuries:
Annual intensive studies will aim to develop verifiable measures of net annual carbon fluxes over regions large enough to allow aggregation to continental scale, but small enough to distinguish variability in carbon dynamics due to regional climate and ecosystem differences.
Seasonal studies will focus on determining gross fluxes (net seasonal fluxes, respiration, and photosynthesis) to test understanding of the responses of ecosystem carbon dynamics to environmental forcing over broad oceanic and land biomes. Comparing modeled carbon fluxes to observations provides tests for our understanding of underlying physical, chemical and biological processes.
Stock inventories and process studies will emphasize stocks and fluxes with the potential to dominate the carbon cycle on time scales of decades to centuries. Intensive studies will focus on soil carbon, woody encroachment, and implications of nitrogen fertilization on land. For the oceans, the emphasis will be on implications of river inflows, changing ocean dynamics, and climatic variability.
Observations of interannual variability provided by the long-term monitoring network will provide context for the intensive studies and will aid in distinguishing the impacts of climate and short-term disturbance (e.g. violent storms, insect outbreaks or disease), while spatial variability observed during the intensive phases elucidate the importance of ecosystem type, land use, and disturbance (fire, wind) history.
41
1
23456
78
9
10
1112
1314
1516
17181920212223242526
2728293031323334353637
38
394041
NACP Science Implementation Strategy
1.7.2. Strategy and motivation
The scientific questions, the study locations, and the operational approach used for the interdisciplinary, intensive field experiments will be defined in workshops dedicated to developing the experiment plan for each major intensive study. Key topics that need to be addressed in the short term, and that are likely to yield unique insights when addressed with the interdisciplinary approach of the intensives, include:
• Integration of atmospheric tall-tower measurements with broader-scale atmospheric patterns and surface processes
• Quantifying night-time exchanges with eddy flux systems
• Assessing seasonal to annual carbon fluxes in mountainous regions
• Integrating land management (e.g. forestry, agriculture, or urbanization) into the NACP framework
• Integrating large-scale disturbance (e.g. wildfire, pests, disease, or invasive species) into the NACP framework
• Understanding the fate of carbon transported from the land to aquatic and marine ecosystems, including sediments in lakes, rivers, and the ocean.
In order to design the intensive field studies, a workshop aimed at formulating a set of testable hypotheses to guide mission planning for the first intensives, and selection of appropriate measurements, should occur as soon as possible. The experimental design will extend the framework developed during prior and ongoing interdisciplinary field programs (e.g., ABLE, FIFE, IHOP, BOREAS, LBA and COBRA). Some aspects of the intensive experiments will be spatially defined, but others will be continental in scale. NACP intensive field activities can begin in 2004 by adding carbon-focused elements to currently planned carbon cycle and tropospheric chemistry activities (e.g., COBRA-ME, INTEX). The first coordinated ground, ocean and atmospheric phase of dedicated NACP intensive experiments should occur in 2005.
Theory teams including scientists from terrestrial ecology, chemical and biological oceanography, remote sensing, atmospheric transport and chemistry, data assimilation, and operational weather forecasting will play an important role in the design and execution of the intensives. In the planning stages, numerical models are needed to formulate testable hypothesis and for designing effective measurement strategies. This activity should begin as soon as possible. During the experiments, the theory team should be involved in real-time operations, ranging from flight planning to model-data comparisons. Regular meetings of the entire science team (instrument scientists and theory team) during the field experiments will provide a forum for discussing preliminary results so that plans can evolve as needed to address discrepancies and gaps in understanding.
1.7.3. Land measurements in the NACP intensives
The intensives will take advantage of a broad range of land-based techniques, ranging from regional inventories to leaf-level gas exchange. It is critical for the land measurements in the intensives to insure comprehensive treatment of all relevant carbon
42

123456789
1011121314
1516
1718192021
NACP Science Implementation Strategy
pools and fluxes. Quantifying the profile of soil carbon with depth or the transport of carbon in eroded sediments may be as important as crop or forest primary production. The imperative for comprehensive coverage also extends to the anthropogenic sector, where it will be important to quantify carbon fluxes associated with harvesting of forests and crops, soil disturbance, combustion, and deliberate sequestration. It will also be critical to have an accurate estimate of carbon transported into and out of a region by commerce (“overland carbon flows”). Carbon fluxes from fossil fuel combustion will need to be quantified for all sectors of society, as will fluxes from cement manufacture and curing. CH4 fluxes from landfills and intensive agriculture are major components of the methane budget, and may be significant in the carbon cycle in some locations. It is also critical to quantify fluxes from both natural and anthropogenic disturbances. The nature of the important disturbances will vary with time and location, with fires, insects, storms, pathogens, erosion, and processes like draining wetlands or highway construction contributing in some settings.
Enhanced coverage of regions targeted for intensive field campaigns by eddy covariance and atmospheric constituent monitoring will be required.
The land measurements in the intensives will also need to make progress on separating biogeochemical from direct anthropogenic forcing of carbon fluxes. Fluxes forced by climate, elevated CO2, nitrogen deposition, and biome shifts need to be separated from and quantified independently of fluxes associated with changes in land use and carbon management.
22 1.7.4. Ocean measurements in the NACP intensives
23 Intensive ocean measurements in coastal regions will be part of combined land/ocean 24 intensives in the NACP. The goals will be to characterize ocean-atmosphere fluxes of 25 CO2 and O2, understand the structure of the marine boundary layer and the exchanges of 26 tracers between the marine PBL, the adjacent continental surface, and the free 27 troposphere. Studies of the carbon budgets of coastal waters will focus on mineralization 28 rates for terrigenous organic matter, the roles of turbidity and nutrients in regulating 29 carbon uptake, and developing remote sensing algorithms for turbid waters. An example 30 of a combined ocean and land intensive is the Western region study discussed below.
31 1.7.5. Atmospheric measurements in the NACP intensives
32 A mix of sampling platforms will be selected for the intensive field experiments that 33 can accommodate a wide variety of instruments and will include various aircraft that 34 collectively are capable of sampling the entire depth of the troposphere. The 35 experimental design will include Lagrangian flights, which will sample a single air-mass 36 repeatedly as it moves across the continent, perhaps using more than one aircraft, and 37 Eulerian flights, which will include repeated profiles and cross-sections over a few key 38 regions, for example, in the vicinity of a tall tower. Survey flights to measure 39 continental-scale variability will also be an important part of the strategy. Measurements 40 of the major carbon gases CO2, CH4, and CO will be common to all in situ payloads, as 41 well as accurate measurements of water vapor, pressure, temperature, and winds. 42 Additional species such as O3, isotopes, CFCs, SF6, nitrogen and sulfur compounds, as 43 well as aerosol size distributions, compositions and optical properties will be measured
43
123456789
NACP Science Implementation Strategy
on some payloads, providing insight into air mass history and chemical information that will aid in separating contributions of various carbon sources. Remote sensing instruments, including passive radiometers and LIDARs will be needed to provide information about surface properties and atmospheric composition. Through coordination with ground-based terrestrial and ocean measurement programs, the intensive aircraft measurements will also provide insight into processes responsible for transporting carbon within and among land and marine reservoirs. An important component of this cross-disciplinary strategy will be the deployment of airborne remote sensing instruments.
10 1.7.6. Remote sensing measurements in the NACP 11 intensives
12 Datasets from both in situ and remote sensing instruments will be essential for 13 developing and testing algorithms for remote sensing instruments. The intensive 14 measurements will provide the basic information needed for optimal use of remotely 15 sensed data for atmospheric concentrations, including: statistical characterization of 16 concentration distributions, representation errors, relative importance of near-field and 17 far-field source for observed variance, layering in the atmosphere, etc. For example, the 18 datasets from NACP intensives will be particularly important for developing algorithms 19 and designing the validation program for the planned Orbiting Carbon Observatory 20 (OCO), the first sensor specifically designed to measure atmospheric CO2 concentrations 21 from space. Flights will also help to understand measurements from upward looking 22 spectrometers that will be deployed by the OCO team as a part of the long-term CO2
23 observing network. Aircraft and shipboard data coordinated with overpasses of the 24 SeaWifs and MODIS sensors on the Terra and Aqua satellites could be used to evaluate 25 experimental algorithms for retrieving solar radiation, colored dissolved organic matter, 26 or solar-induced fluorescence. Underflights of Aura, Aqua, and Envisat satellites will 27 help validate trace gas measurements from those platforms.
28 1.7.7. Proposed conceptual designs for the NACP intensives
29 Federal agencies solicited and received six “white papers” outlining concepts for 30 NACP intensives, and have selected a first campaign for the summer of 2005. This will 31 involve forward spatially-explicit modeling of carbon fluxes and stocks and fates of 32 organic matter associated with agricultural production in the Midwest. Models will be 33 constrained locally by intensive process studies and flux measurements, and regionally 34 with agricultural inventories. Regional fluxes will also be estimated quantitatively from 35 an enhanced network of tower and airborne atmospheric sampling and inversion of 36 mesoscale transport models. The conceptual design of this experiment is outlined in 37 Appendix B.
38 Future NACP intensives have also been suggested. A series of white papers 39 submitted to federal agencies is available at http://www.carboncyclescience.gov.
44

12
3
456789
101112131415
16
NACP Science Implementation Strategy
2. Question 2 (Process/Attribution): What controls the sources and sinks of CO2, CH4, CO, and how do these controls change with time?
Controls over sources and sinks of CO2 are operating through processes that determine the temporal dynamics of carbon (C) transfer among pools within the biosphere, and ultimately between the biosphere, atmosphere, and hydrosphere. The processes controlling the rate of C transfer, including the dynamics of social and economic systems that influence the rate of fossil fuel combustion and land use, must be described and quantified at a range of temporal and spatial scales through monitoring studies and manipulation experiments. The ultimate goal (i.e., expected products) of these studies and experiments is to contribute knowledge and data for developing, testing, and applying diagnostic and prognostic models in methodologies designed to operationally estimate the current dynamics of carbon in North America and adjacent ocean regions (Question 1), and (2) for predicting and managing the trajectory of carbon storage in North America and adjacent ocean regions (Questions 3 & 4).
Figure 3. Processes controlling carbon exchange with the atmosphere over North America have very strong human management drivers. These managed carbon processes will be a major focus of NACP.
17 Controls over C transfer among pools are sensitive to both insipient and acute 18 perturbations. Insipient perturbations include a progressive change in the mean and 19 extremes of forcing variables, such as atmospheric CO2 and O3 concentrations, climate, 20 or increase in the system vulnerability to a relatively constant pressure, e.g., increased 21 sensitivity of ecosystems to nitrogen (N) deposition as the soil approaches N saturation. 22 Acute perturbation, which could increase in frequency and spatial extent as the climate 23 changes, reflects the effect on C transfer of such events as hurricanes, floods, ice storms, 24 insect outbreaks, diseases, and fire. Some of these events are influenced by management 25 regimes (e.g., fire suppression). Management, for example through forestry, agriculture 26 and range management practices, and through policies on land use, can exert a large 27 influence on C transfer among the biosphere pools, and between the atmosphere and 28 biosphere. Processes controlling the horizontal transfer of carbon from land into surface 29 waters, the movement, transformation, and deposition of carbon in surface waters, and
45

12
3456789
1011
NACP Science Implementation Strategy
the fate of carbon as it moves from surface waters to coastal and oceanic ecosystems need to be understood for closing the carbon budget at a regional scale.
Below we discuss process-based research issues that should be addressed for making progress better progress on questions 2 through 4 of the North American Carbon Program. These issues include understanding controls over (1) fossil fuel combustion, (2) responses of ecosystems to changes in atmospheric CO2, tropospheric O3, N deposition, and climate, (3) responses to changes in disturbance regimes (storms, floods, insects, diseases, fire), forest management, and land use, (4) responses to agriculture and range management, (5) responses of carbon as it moves from land to surface waters, moves in surface waters, and moves from surface waters to coastal and oceanic ecosystems.
12 2.1. Responses of terrestrial ecosystems to changes in 13 atmospheric CO2, tropospheric O3, N deposition, and 14 climate 15 In recent years, two important trends have emerged among studies designed to 16 understand responses to changes in atmospheric chemistry, N deposition, and climate: (1) 17 a shift from research primarily describing responses to manipulations towards research 18 targeted at understanding processes that control responses to manipulations, and (2) a 19 change from investigations of single species responses to investigations of ecosystems 20 and communities (e.g., FACE experiments). The move from largely descriptive to 21 process-based studies has been largely driven by the large variation observed in responses 22 within and among species, and among experimental conditions. This move has been 23 accompanied by more multi-factorial experiments, attempting to account for other 24 variables, and for the interaction effects of manipulated variables with naturally varying 25 environmental conditions. The incentive to study ecosystems and assemblages is the 26 realization that processes operating at these scales tend to buffer or amplify responses of 27 their components. This is more readily observed when studies last long enough to include 28 typical variations in weather conditions, and to allow coarse-scale ecosystem 29 adjustments. While the shifts in research emphases have resulted in experiments that are 30 producing useful knowledge and data for incorporation into diagnostic and prognostic 31 models, the synthesis of current understanding into models has not yet occurred. In 32 addition, there is a need for a new generation of ecosystem-level experiments that are 33 conducted with common protocols along gradients of environmental variation (e.g., 34 gradients of tropospheric O3, N deposition, and climate). Thus, research should focus on 35 (1) synthesizing current understanding into models, and (2) conducting manipulation 36 experiments with common protocols that span broad environmental gradients.
37 Synthesis of current understanding into models. The current generation of models 38 that are to be used for diagnostic and prognostic purposes in the NACP needs to be 39 evaluated in the context of state-of-the-art manipulation experiments that have been and 40 being conducted. Manipulation experiments have produced data for evaluating short-41 and long-term responses of models to elevated CO2 (FACE, open-top chambers, whole 42 tree chambers), temperature elevation (heating cables, greenhouses, overhead heaters), 43 water manipulations (amendments, rainout shelters), nutrient additions, and O3
44 manipulations. Models should be applied in a fashion that mimics the design of these
46

123
456789
101112131415161718192021222324
252627282930313233
NACP Science Implementation Strategy
experiments and model-data mismatches should be diagnosed as a basis for transferring understanding to the models. The implications of model modifications should be evaluated at a spectrum of temporal and spatial scales.
Implementation of manipulation experiments with common protocols that span broad environmental gradients. While much progress has been made through manipulation experiments to understand controls over whole ecosystem responses to environmental change, the responses of different experiments can be difficult to reconcile because it is difficult to determine whether differences in responses represent interactions with different environmental variables or represent differences in experimental protocols. There has been much progress in understanding the artifacts of different manipulation technologies, and the experience with manipulation experiments is now mature enough to conduct manipulation experiments with common protocols that span broad environmental gradients. The focus of these experiments should be to understand how responses to manipulations change as environmental conditions change. North America has several gradients that span variation in climate, N deposition, and tropospheric O3, and these gradients can provide opportunities for conducting these experiments along transects that follow these gradients. Because the most useful information from these experiments is provided once they have been running for several years, it is important that these experiments be set up soon so that their results can inform predictive modeling and management of the carbon cycle. It is particularly important that these experiments be located in regions where we have good reason to believe that responses to the manipulations will reveal vulnerabilities of carbon storage, e.g., responses to the thawing of permafrost in boreal and arctic North America, to N saturation in northeast US and southeast Canada, or to high levels of tropospheric O3 in southeast US.
A standard protocol for manipulations involving elevated CO2 such as FACE must be developed, so that the results of these experiments can be applied to the underlying environmental gradients (e.g., in N deposition and climate). (1) existing FACE experiments must continue for a long enough time to quantify the dynamics in the response (e.g., due to different time constants in the C and N response dynamics, as we uncover at the Duke FACE), and (2) FACE and other types of CO2 enrichment experiments should be imposed over the "natural" gradients in O3, N, and climate. Not all experiments must be FACE type; less costly approaches should be used depending on the questions asked, and where ecosystem type and climate permit.
34 2.2. Methane sources and sinks 35 North American sources of CH4 are dominated by those from the United States, 36 largely as a consequence of its higher population and greater per capita energy usage. 37 The relative contribution from different sources varies between countries. In the U.S., 38 emissions from anthropogenic sources are estimated to be roughly triple those from 39 wetlands, the major natural source, and while in Canada, wetlands dominate emissions, 40 making up roughly two thirds of the total. Overall emissions from Mexico are estimated 41 to be relatively low, with releases associated with the production and use of natural gas 42 making up the largest single source type rather than landfills as in the U.S. It is important 43 to note that current emission estimates are snapshots of sources that may have 44 considerable, but seldom calculated, uncertainties. Moving estimates beyond the
47

12
3456789
1011
12131415161718192021
2223242526
272829303132333435
363738
39
NACP Science Implementation Strategy
snapshot level to one of dynamic modeling, capable of including variability in controlling factors, is one of the primary goals of the NACP.
North American CH4 sources can be grouped into three general categories based on the types of variables that control emissions and the types of data that are currently used to calculate emissions. These are:
1) Anthropogenic sources related to economic output (energy, livestock) that are commonly estimated using emission factors and inventory-type accounting;
2) Anthropogenic sources related to the waste stream (landfills, livestock manure) that are estimated from waste stream inventories and production/oxidation models; and
3) Primarily biogenic sources (wetlands, rice) that are estimated using environmental data and process models.
Research activities to characterize and better understand methane emissions and losses will include the following:
Improved process modeling of CH4 emissions through combined modeling and field measurement activities at scales that capture locally unresolved flux variations in space and time. Address both the biogeochemistry of CH4 production/oxidation and wetland hydrology (distributed watershed impacts, inundation extent and duration, and shallow submerged water tables). Improve process-based model capabilities to predict sensitivities (particularly nonlinearities) of CH4 flux to variations in key controlling factors. This will bring together local process-based understanding with larger-scale atmospheric flux maps and inverse approaches.
Evaluation of national wetlands inventories (Canada, U.S., and Mexico) for completeness, for their classification suitability for wetland/CH4 process modeling, for the adequacy of spatial scales, and for the frequency of updating. Ensure that appropriate wetland classifications are incorporated into future national and continental land-cover database development.
Development of a coherent, continent-wide dataset for determining CH4 emissions from landfills and wastewater treatment. Emissions inventories are now based on per capita waste production, human population distribution, and waste management practice. To tie these emissions to the actual sources (landfills and wastewater treatment facilities) will require organization and evaluation of existing data on location, size, and activity of these facilities, and perhaps collection of additional information. Patterns of waste management are changing rapidly, so these data will require frequent updates (<5 yr). Closed landfills could be a significant, but declining, source; rough estimates of their emissions should be made.
Organization of available databases on confined animal feeding operations and the natural gas distribution network for CH4 emission analysis, and evaluate their adequacy.
48

12
3456789
1011121314151617181920212223
2425262728293031323334353637383940
NACP Science Implementation Strategy
2.3. Responses to changes in disturbance regime, forest management, and land use
Enhancement of understanding from chronosequence studies. For diagnostic and prognostic models to adequately simulate the carbon dynamics of North America, they need to be evaluated in the context of studies that have examined the short-term and long-term responses of carbon storage to disturbances, forest management, and land use. Short-term responses include immediate losses of vegetation and soil carbon to disturbance, e.g., emissions of carbon in fires or the loss of vegetation carbon to wood products. Long-term responses include changes in vegetation and soil carbon after disturbance or a change in land use, e.g., the changes in carbon pools after agricultural abandonment. Because responses of carbon storage may occur on the time scale of decades to centuries, there are very few longitudinal studies that have completely tracked the temporal response of ecosystem carbon dynamics to changes in disturbance regimes, forest management, and land use. Instead, there has been a reliance on chronosequence studies that examine a snap-shot of ecosystem carbon storage along a sequence of stand ages to infer how carbon storage changes through time. True chronosequences are rare because of the difficulties in controlling for variables other than stand age. There is a need to (1) synthesize current understanding from available chronosequence studies, and (2) identify the needs for new chronosequence studies. In addition to documenting how carbon storage changes in on-going and new chronosequence studies, studies should be conducted to understand why carbon storage is changing. Controls over fluxes should be evaluated by the complementary use of biometric studies, eddy covariance techniques, and isotope studies.
Improvements in understanding the controls over disturbance regimes, forest management, and land use. Prediction and management of carbon storage responses requires an ability to predict how disturbance regimes, forest management, and land use will change in the future. Both environmental factors and socio-economic factors influence these issues. For example, fire disturbance depends substantially on climate, an environmental factor, and fuel, which has largely been influenced by human fire suppression in some parts of the US. Forest management and land use are substantially influenced by environmental factors (e.g., droughts), and economics (e.g., timber prices). Environmental and socio-economic controls are important to understand in the context of policies that may be implemented to influence carbon storage. Progress on understanding environmental and socio-economic controls over disturbance regimes, forest management, and land use has largely been limited to case studies, and there is a need to synthesize understanding from case studies into regional scale models that are evaluated in retrospective studies. The testing of these models in a retrospective fashion will allow them to be used for scenario generation. The scenarios can then be modified by alternative policies to evaluate how the implementation of policy decisions may influence future carbon storage in North America.
41 2.4. Responses to agricultural and range management 42 The US land surface is about 1/3 forest, 1/3 rangeland, ~28% crop land and pasture, 43 and 5% urban and other developed areas. Accurate carbon budgets must account for 44 fluxes to/from all of these land types, and reflect changes in land use and land cover that
49
12
3456789
1011121314151617181920
21222324252627282930
3132333435
36373839404142434445
NACP Science Implementation Strategy
occur in response to social and economic factors (currently ~400,000 ha of crop land are converted annually to other uses).
Croplands. Rates and magnitudes of carbon exchange between the land surface and atmosphere are estimated by integrating detailed land use data from remote sensing, calculations of biomass accumulation in crop and grasslands from remotely sensed reflectance data coupled with the output of physiologically-based crop growth and yield models, and application of a linked model to simulate the fate or partitioning of assimilated carbon. The model output can be used in a bottom-up calculation of the carbon budget (Section 1.4), and the model can be incorporated into the data assimilation/fusion framework (Section 1.5), which effectively provides real-time adjustments to the parameters of the model to conform to observed concentrations and fluxes in cropland areas. Biophysical models for agricultural land are based on data for land use and crop/biomass production collected in extensive crop surveys by State Agricultural Statistics Services and by USDA’s National Agriculture Statistics Service (NASS). The data are aggregated by county or Agricultural Statistics District. The procedure accounts for removal or export of carbon from the landscape as required for a geo-referenced carbon budget, i.e. what might be measured by a program of atmospheric observations. Changing land use/land cover (for all land uses) at regional and national scales can be validated by comparison with the National Resources Inventory (NRI) developed by USDA’s Natural Resources Conservation Service.
Eddy covariance towers strategically placed within major crop regions could provide the basic data to derive daily or hourly fluxes that will be required for interpretation of atmospheric data. Existing AmeriFlux and ARS tower sites will be leveraged in this effort, such as the flux tower arrays recently established on corn and soybean fields near Ames, IA. Soil and plant samples required for calibration of carbon contents and ground-truth measurements of soil respiration rates, leaf area index (predicted by MODIS 250-m data and required for certain crop growth and yield models), and other key parameters will be obtained and analyzed by staff at laboratories associated with flux sites and at St. Paul, MN, and Madison, WI. Close coordination of flux monitoring networks operated by different agencies (DOE, USDA) and university sites will be required.
Use of moderate and high spatial resolution aircraft (e.g., AVIRIS, LVIS) and satellite (e.g., MODIS, Landsat) remote sensing data to monitor land uses and areas planted to specific crops provides a critical GIS layer, which facilitates relating crop data output to soils data and results from other components of the project, such as tower and aircraft flux measurements, and spatial integration of model output.
Grasslands and arid lands. Productivities in grasslands and arid lands vary widely due to extreme interannual variability in precipitation, unless moderated by inputs of fertilizer and/or water. Annual flux data show that rangeland may function as a carbon sink or source at different times, depending upon precipitation and other weather events. Net carbon exchange of grasslands and arid rangelands can be directly related to absorbed photosynthetically active radiation (APAR) determined from meteorological and MODIS (or SPOT) data, conditioned by tower flux data for representative sites. Environmental data layers, including soils data from the US STATSGO database, will quantify the environmental drivers of rangeland CO2 flux and be used to develop robust algorithms for predicting fluxes. It should be possible to map net carbon uptake or loss at
50

123
456789
1011
NACP Science Implementation Strategy
1-km resolution or better based on remote sensing, combined with the tower flux and crop data. Satellite driven estimates of GPP and NPP will be particularly valuable in complex terrain where eddy flux measurements have advection errors.
Urban and suburban land. Urban and suburban lands occupy only a few percent of the North American land surface but are expanding relatively quickly. Recent studies of carbon storage by urban trees suggest that C sequestration rates on these lands may be several times higher per tree than in intact forests. Urban sites typically experience higher temperatures, elevated levels of atmospheric CO2, wider spacing of stems, and higher pollutant levels than forest sites and thus may be useful surrogates for future conditions. On going USDA-FS studies of urban C sequestration and NSF urban LTER studies will contribute towards understanding C storage in these lands.
12 2.5. Responses of carbon as it moves from land to 13 surface waters, moves in surface waters, and moves 14 from surface waters to coastal and oceanic 15 ecosystems. 16 Water is the largest natural conveyer of carbon, nutrients, and sediments across the 17 landscape to the ocean, and subaqueous burial of organic matter in sediments is the 18 definitive natural long-term mode of organic-carbon storage in the geologic record. 19 Wind transport is of secondary importance, but deserves consideration. The river-borne 20 mass movement of carbon (1 to 2 Gt C yr-1), while small compared to biosphere-21 atmosphere exchange (on the order of 50 Gt C yr-1), is nevertheless comparable to 22 perceived imbalances in the carbon cycle. The present dynamics of water and sediment 23 movement in North America are strongly influenced by our current glacial-interglacial 24 transition (last 21,000 years), immigrations of humans onto the continent and 25 concomitant land modification (12,000, then 500 years), and the development of major 26 agricultural, hydrologic, and infrastructural engineering (rapid acceleration over the last 27 500 years). For the current North American budgets of water, sediment, and associated 28 carbon, we can list sources and sinks and we can measure fluxes, but because of the 29 numerous levels of rapid temporal change, we cannot easily evaluate the future state of 30 the system.
31 The physics, chemistry, and biology of carbon storage on land are quite different 32 from the ocean. Land is discussed first, followed by the land-ocean interface.
33 2.5.1. Hydrologic transfers and transformations of carbon
34 A singular complexity in working with the coupled carbon, water, nutrient, and 35 sediment cycles is our inability to use remote sensing to characterize most of the 36 sedimentary sinks or to evaluate mass movement of sediment and carbon across the 37 landscape.
38 Our characterizations of carbon sources and sinks associated with deposition of 39 colluvium, alluvium, and lacustrine sediments and soils are limited by our ability to 40 identify and map these deposits. At the scale of the conterminous United States, this is a 41 daunting task. There are, for example, almost 70,000 reservoirs, and at least a 42 comparable number of natural lakes, ponds, and wetlands. There may be as many as 107
51
123456789
10111213141516171819202122
2324252627282930313233343536
37
38394041424344
NACP Science Implementation Strategy
km of alluvial channels. More than half the sediment and carbon eroded from landscapes may be stored in upland colluvial and alluvial deposits, yet the scale of these deposits is smaller than the resolution of most geospatial data, and the vegetation that covers them is often virtually identical to that of the surrounding erosive landscapes. Moreover, the rates of sediment and carbon deposition in these deposits can only be estimated by careful on-site field work. Likewise, while the areas of alluvium, lakes, and reservoirs in large river basins can be measured from maps, rates of deposition can only be assessed with careful fieldwork, using surveys from boats and trucks. The same can be said of deltaic and coastal marine deposits.
Evaluation of the mass movement of material through river systems requires direct measurement at gaged cross sections and cannot be done remotely. These gaged cross sections are expensive to maintain and sample. Water in the channels of most larger rivers is not well-mixed across the channel, and sediment is never vertically well-mixed. A single measurement of mass transport through a channel cross section requires the collection of water samples across the entire channel. Recent technologies (notably Teflon nozzles that admit water at the velocity of the surrounding flow into a Teflon bag) allow collection and analysis of a single, “integrated” sample that is both uncontaminated and representative. Furthermore, much for the transport of sediment and nutrients is during flood events, often during a few days per year, per decade, or per century. Such events are obscured by storm clouds and in headwater regions are best sampled with automated systems. Ideally in the future we would have denser measurement networks and emphasis on event sampling.
The limitations placed on sampling and remote sensing have pushed landscape-scale studies of hydrologic and geomorphic processes in the direction of coupling physically based models to observation-based hydrologic networks. These models are now assembled using Geographic Information Systems (GIS). Hydrologic models are at considerably higher stages of development than are models of chemical transport or of sediment erosion, transport, deposition, and remobilization. These models are based on high-resolution (30 m nationwide, finer locally) digital-elevation models (DEM) of topography and GIS compilations of other landscape data, such as geology, soil, land cover, land-use, and more. The hydrologic models can be driven by data from real weather. Wide varieties of physical and biological process are incorporated into the model. This forms the hydrologic framework for modeling the transport of chemicals or sediment. The transport models are so complex that while most modelers acknowledge the physical, chemical, and biological processes that drive mass transport and transformation, their models are largely empirical in detail.
Recommendations:
(1) As a research community, we need to measure carbon storage and transport on entire regional landscapes so as to include features such as large-river floodplains, wetlands, lakes, agriculture, and urbanization. A possible option would involve detailed assessments at the sites used for process-based studies (described under Question 1) and the development of GIS-based tools to use available DEM and geospatial data to extrapolate sediment storage over larger regions.
52
123456
789
1011
12131415
1617181920212223242526272829
30313233343536373839404142434445
NACP Science Implementation Strategy
(2) We need to sustain, if not augment, measurement networks for fluvial mass transport. The premier National steam gage network is operated by the US Geological Survey. The USGS operates about 7,000 stream gages to measure water discharge. In addition, about 600 of these are water-quality stations. Many of the water-quality stations include sediment, carbon, and nutrients in their suite of measurements
(3) We need to quantify the transformations of inorganic and organic carbon in river estuaries, the final step in land-ocean exchange. This includes measuring the net autotrophic versus heterotrophic balance of the systems, local air-sea exchange, sedimentation and burial, and lateral exchange with the coastal oceans.
A large portion of the gages and water-quality stations are funded through federal, state, and local partners, who may not be funding measurements need by the NACP. A water-quality site requires tens of thousands of dollars per year to fund gage calibration, sampling, and analysis.
Of the USGS water-quality stations, many are part of federally funded research- or assessment-based programs and could be integrated into the NACP. These are: NAWQA (National Water Quality Assessment - Assesses the occurrence, distribution, and fate of chemical contaminants in water, bottom sediments, and the tissues of living things, to understand and monitor changes in the quality of our Nation's freshwater resources -NAWQA uses a multi-year campaign style to assess meso-scale river basins). NASQAN (National Stream Quality Accounting Network - provides ongoing characterization of the concentrations and flux of sediment and chemicals in the Nation's largest rivers -NASQAN uses fixed sites and campaigns, such as a current study of carbon in the Yukon system). HBN (Hydrologic Benchmark Network, established in 1963 to provide long-term measurements of streamflow and water quality in areas that are minimally affected by human activities). WEBB (Water, Energy, and Biogeochemical Budget sites -designed for process-level research into five headwater regions). Notably, NAWQA, NASQAN, and HBN do not have adequate funding for intensive, event-based sampling.
Riverine carbon is a mix of soil carbon eroded from uplands and autochthonous carbon produced within water bodies by plants. Presently, more of this carbon is being stored in sediment because of accelerated erosion and autochthonous carbon generated by river-borne artificial fertilizers. It is estimated that today, on the order of 90 percent of sediment eroded from North American uplands never reaches the ocean. Landscape position and spatial scale have major effects on the style of sediment and carbon storage. In upland landscapes, storage is on hillslopes as colluvium and as alluvium in small channels. This sediment and associated carbon are repeatedly stored and mobilized on its way to long-term storage. For higher-order channels in larger river systems, alluvial and lacustrine storage becomes more important. When rivers enter the ocean, deltaic systems and coastal sedimentation store almost all the remaining sediment and an unknown amount of the associated carbon. If substantial eroded soil carbon is buried with the sediment, and if it is replaced by new photosynthetic carbon at the site of erosion, then sedimentary storage of eroded soil carbon can be a significant carbon sink. This carbon storage will be enhanced by autochthonous production and burial of carbon induced by artificial fertilizers transported into wetlands, lakes, and coastal waters. Thus, the
53

12
3456789
101112131415
16171819202122232425
262728293031323334353637
3839404142
4344
NACP Science Implementation Strategy
sedimentary carbon cycle represents a formidable potential carbon sink on North America and in surrounding coastal waters.
Agricultural and hydrologic engineering has dramatically altered the interactions between water and landscape and is among the largest transformations of mass movement wrought by technology. Styles and patterns of erosion, transport, and deposition in engineered landscapes often bear little resemblance to those in the preceding natural landscapes, thus changing rates of runoff and erosion. Water is stored, mined, and diverted to irrigate formally dry soils. Land clearing, tillage, terracing, and tiling have completely changed interaction between precipitation and soils in wetter landscapes. The storage of water in reservoirs for irrigation, human consumption, power generation, risk management, and navigation has greatly increased water residence times in the terrestrial environment, enhancing sediment storage on land and autochthonous production of carbon, which is, in turn enhanced, by inputs of artificial fertilizers. The straightening of rivers and the construction of levee systems and revetment has utterly altered the interaction between large rivers and adjacent alluvial landscapes.
At this juncture, we can summarize the possible sources and sinks for river-borne carbon, and we understand in isolation and in the abstract many of the physical, chemical, and biological processes that act in an ensemble to control the lateral transfer of carbon off a landscape by water and wind. The interaction of these processes on a landscape is, however, complex and often surprising in its details. For the entire 20th Century, to characterize these interactions, researchers looked for relationships in field data, guided by simplified physical and chemical models and principals (conservation laws, for example). The empirical "rules of thumb" so identified have, in turn, been reformulated for use in models, such as the Universal Soil Loss Equation (USLE), or the Manning's N of river channel hydraulics.
Virtually all aspects of the erosion (detachment), transport, deposition, and remobilization of clay-size sediment are still speculative and treated with empirical models. Even in advanced models, such as the hillslope erosion and deposition model WEPP developed by and for the USDA, show large and systematic under and over predictions on the sites where the model was developed. And, we still lack a mechanistic understanding of the source of this error. Site-based, processes-level studies must consider features of several scales. Small catchment research sites that are part of the research watersheds run under the auspices of NSF-LTER, USGS-WEBB, USDA-USFS, and USDA-ARS represent ideal headwater areas. None of these are suitable for studying the dynamics of large-river features such as floodplains. Thus we need additional sites to study characteristic features of larger rivers, such as swaths of floodplain, large wetlands, lakes, reservoirs, and deltas.
Models of hydrology and hydrologic mobilization, transport, and deposition must be coupled to models of soil carbon and to models of autochthonous carbon production in water bodies. To facilitate testing, the coupled models should be designed to predict dissolved and solid loads in rivers and to track a suite of isotopes (C-12, 13, 14, N-14, 15, Cs-137, Pb-210).
Techniques must be refined for going from the field scale (sub-meter) to the geospatial data-scale (30-meter). Basically, even where models have become quite
54

12345
6789
10111213141516
1718192021222324252627282930313233
NACP Science Implementation Strategy
sophisticated (such as WEPP), we cannot use currently available satellite data or digital elevation data to resolve the detailed shape of hillslope, natural vegetation, or day-to-day agricultural cropping practices needed to implement these models on a regional basis. Confounding this further, the meteorological data needed to drive these models (such as Radar-derived precipitation) are only available on a much coarser grid (kilometers).
Coastal ocean carbon cycling is substantially impacted by terrigenous material arriving in rivers. Documenting and understanding the processes that control carbon sources and sinks in coastal oceans will require studies of the transport of both dissolved and particulate organic material in rivers, and the fluxes of these constituents into the marine environment. Transformation of these materials in estuaries (both by sedimentation and by biological cycling) may contribute to either sources or sinks in these areas. Nutrient runoff from agricultural regions leads to very high rates of delivery of nutrients to some coastal zones. Severe eutrophication in the Gulf of Mexico has resulted from nutrient deposition by the Mississippi River, for example, which has dramatically altered the carbon cycle of this region. Impacts on air-sea exchange of CO2
are unknown, but must be studied as part of the source attribution component of NACP.
The increase in riverine inputs of N (and P) due to eutrophication and the decrease in Si inputs, due to retention, can affect the ratio of nutrients available to the phytoplankton community, thereby altering the food web of RiOMar environments. For example, the frequency of diatom blooms has decreased and dinoflagellates and gelatinous species have become more important offshore of the Danube river. Diatoms play a critical role in the sequestration of CO2 from the atmosphere via the “biological pump”. There has been a significant increase in the amount of organic carbon transported from land and stored in coastal zone sediments, due primarily to fossil fuel CO2 emissions to the atmosphere, changes in land-use practices, and sewage discharges. In addition, increases in the riverine inputs of nutrients (nitrogen and phosphorus) from land may be driving the trophic state of associated coastal zones toward net production and storage (autotrophy), thereby increasing the potential role of river-ocean margins as a sink for atmospheric CO2. The direction of future change in net ecosystem production in the coastal zone strongly depends on changes in the relative magnitudes of organic carbon and nutrient fluxes to the coastal zone via rivers. The ultimate fate of organic carbon in river-ocean margins (burial or export) strongly depends on the biogeochemical response to changes in riverine input, which are driven by human alterations within the drainage basin.
34 2.6. Ocean measurements and models 35 A network of ocean measurements and coordinated modeling will contribute to the 36 NACP backbone of long-term observations. The ocean component is designed to 37 leverage existing programs to define the net effect of the marine system on the CO2
38 concentration of the air exchanging with continental air masses. In the absence of this 39 component, inverse studies and data fusion results could be biased by unresolved CO2 40 fluxes in coastal waters and adjacent open ocean basins.
41 As discussed in detail in the OCCC report (Doney et al., 2004), many basic aspects 42 of the ocean carbon system are inadequately understood, directly impacting our ability to 43 make realistic future projections and or assess potential carbon management scenarios. 44 The report describes a series of targeted, mid-sized multi-disciplinary process studies that
55

123456
789
10111213141516171819
NACP Science Implementation Strategy
are directly linked to existing and proposed open-ocean and continental margin time-series stations in the Atlantic and Pacific oceans. Particularly relevant to NACP are the studies on the responses of upper-ocean ecosystems and air-sea CO2 fluxes to inter-annual climate variability (OCCC Section 6.1); land-ocean exchange and carbon cycling in the coastal ocean and along continental margins (OCCC Section 6.2); and the mechanisms of air-sea gas exchange (OCCC Section 6.3).
Focused research on improving forward or prognostic models is also required in order to improve future climate projections and to develop a better fundamental understanding of the ocean carbon system at a mechanistic level (Doney, 1999). This work should occur hand in hand with process studies and diagnostic studies. Significant expansions of the current large-scale ocean carbon modeling effort is required, with particular emphasis on developing more sophisticated ecosystem components and incorporating more realistic coastal and continental margin dynamics into basin and global simulations. Because of the high temporal/spatial variability and unique biogeochemical processes of the coastal environment, the latter objective likely will require a variety of techniques including multi-scale model embedding. Close collaboration between the field and modeling communities is required during the planning stages for individual process studies to ensure that the appropriate information is collected to improve and evaluate ocean numerical models.
20 2.7. Human institutions and economics 21 Human activities are major controls on the sources and sinks of CO2, CH4, and CO. 22 The effect of land use change and management has already been discussed above in 23 Sections 2.2, 2.3, and 2.4. In this section we focus on energy choices, technological 24 development, economic development, consumer preference and other human dimensions 25 that have a major impact on the growth rate of CO2 in the atmosphere. Choices of energy 26 sources, for example, have a major influence on the growth rate of CO2 in the 27 atmosphere. It was not until humans began using fossil fuels for a source of energy in a 28 major way that the rise of CO2 in the atmosphere became a concern. Uncertainties in the 29 human activities portion of the carbon cycle dwarf uncertainties in other components of 30 the carbon cycle (IPCC 2001). For the NACP to be able to predict the future evolution of 31 carbon sources and sinks, therefore, we must understand the major human processes 32 affecting the carbon cycle. Some of this research agenda is likely outside the scope of the 33 NACP, and may be conducted through other venues, but this topic area cannot be ignored 34 if we hope to understand the most important drivers of change in the carbon cycle.
35 2.7.1. Social and economic forces
36 There is a need to understand some of the driving forces that affect fossil energy 37 consumption and therefore the growth rate of CO2 in the atmosphere, such as sources of 38 “endogenous” technological change, intended and unintended effects of past policies, and 39 the causes of rapid changes in human activities and lifestyles. This might be facilitated 40 by developing good historical records, as well as development of new indicators that can 41 facilitate analysis of various development paths for carbon intensity over North America.
56

1
234567
8
910111213141516
1718
19202122232425262728293031
32
3334353637
NACP Science Implementation Strategy
2.7.2. Technological change
There is a great deal of emphasis in the U.S. companion program to the Climate Change Science Program, the Climate Change Technology Program, on developing new technologies for carbon sequestration and energy sources. In particular, programs are being conducted in alternate fuels, hydrogen, renewable energy, energy efficiency, etc. The impact of these technological advances on the future evolution of carbon emissions over North America is not known.
2.7.3. Institutional action
Many corporations and U.S. local and state governments are changing their approach to include awareness of carbon emissions in their business or policy strategy. In addition, the government of Canada has committed to an extensive program of greenhouse gas reduction research and application. The effects of corporate and public sector policy changes on the evolution of carbon emissions over North America are not fully understood, and could be major factors in the future. The “reverse” type of research is also needed: identifying the policy changes required to achieve a given outcome rather than only analyzing the likely results emanating from a policy.
2.7.4. Socio-economic aspects of land use change and management
In order to understand the controls on changes in carbon stocks and fluxes on land, we must understand the dynamics of land owner choices in management of land, including economic drivers, influence of international trade pressures, Federal, State and local regulations, and national incentive programs. Synthetic study of policy, institutional structures, economic leverage points, and cultural characteristics of different regions of North America is fundamental to determining contemporary fluxes of carbon today. The development of appropriate temporal and spatial scales for analysis is necessary. In addition, focus on the “slow” human dimensions variables such as long term effects from land management policies needs consideration. Development of human dimensions data to support analysis of land use management practices in different regions of North America (Section 2.2 and 2.3) is needed. Finally, identification of historical patterns of cultural characteristics that affected carbon and land use management over the past 300 years, such as pioneer settlement incentives, is needed.
2.7.5. Integration
As with biogeochemical components of the carbon cycle, there is a need for integrated understanding of how economic, social, and technological forces interact to affect the carbon cycle. Economic drivers of land use and management, for example, also affect settlement patterns and transportation choices, and therefore have a host of impacts on carbon exchange.
57

12
3
456789
101112131415
16
1718192021222324252627282930
313233343536373839404142
NACP Science Implementation Strategy
3. Question 3 (Prediction): Are there potential surprises (could sources increase or sinks disappear)?
A major challenge to projection of potential scenarios of future climate and management of the carbon cycle is the unknown future trajectories of current carbon sources and sinks. Many of the currently operating terrestrial sink mechanisms (e.g., forest regrowth, nutrient deposition, and boreal warming) are expected to saturate in coming decades, and some may even lead to new sources of greenhouse gases. The accelerated development and improvement of process-based models of carbon fluxes and storage (under Question 2) and the deployment of a comprehensive observation and analysis framework for diagnosis of the changing carbon cycle (Question 1) provides an opportunity for substantial improvement of our ability to project future changes. NACP will support prognostic studies of carbon cycle dynamics, and by integration of these activities with those described above, will allow unprecedented opportunities for model evaluation and quantification of uncertainty.
3.1. Greenhouse gas emissions The level of greenhouse gas emissions from fossil fuel combustion depends on a
complex set of interrelated technology, energy demand, and economic/social/policy factors. Technology factors include the efficiency of fossil fuel combustion technologies in use; capital vintage and turnover rates for fossil fuel combustion technologies; replacement, retrofit, and alternative technologies currently available; and the rate of development and adoption of advanced technologies. Energy demand is the amount of energy required by a given population to fulfill its desire for specific energy services such as lighting, heating, mobility, etc. Energy demand is influenced by overall population, population age distribution, the level of affluence of the population, consumption patterns, level of urbanization, and climate and weather. Economic, social, and political factors include regulation of fossil fuel combustion facilities and technologies, subsidies or other means of financial support for fossil fuel combustion facilities and technologies, lack of economic or regulatory support for non-fossil fuel combustion technologies, and degree of emphasis on efficient supply of energy services.
There has been much research and analysis on these issues, and a wide variety of techniques and models exist that are used to estimate the effect of specific factors, to project future fuel use and emissions, and to understand the mechanisms through which fuel use or emissions can be altered. Forecasting remains uncertain and a large measure of this uncertainty may be irreducible, although improvements in data and application of appropriate modeling and estimation methods can reduce the range of estimates in the literature. In particular, much of the previous efforts have been a scales too fine (local, daily air pollution analysis) or too coarse (monthly-annual national or global inventories) for NACP applications. Therefore, an immediate need is to find and assimilate data at appropriate scales. A major challenge is simply the timely availability of data on fossil fuels use and greenhouse gas emissions at suitably detailed sector and spatial level. In modeling, a major research effort is needed to better integrate the technical, economic,
58

12
345678
NACP Science Implementation Strategy
policy and social factors that influence greenhouse gas emissions in an appropriate modeling framework.
Improved data on emissions and policy evaluations, combined with adequate tools to address climate change, will help to (1) characterize the various factors that affect fossil fuel combustion and related greenhouse gas emissions; (2) project fossil emissions as function of climate variability; (3) create a set of fossil emissions scenarios as a function of the (socio-politico-economic) driving factors outlined above; and (4) improve estimates of current year fossil emissions.
9 3.2. Rivers and coastal oceans 10 Large but poorly quantified amounts of carbon are currently stored in shallow marine 11 sediments as methane hydrates. Some research has suggested that a warming climate may 12 make these deposits unstable. Geological and paleoclimatic evidence suggests that 13 destabilization of these compounds has been linked to episodes of rapid global warming 14 in the distant past. The potential for positive feedback between climate and the release of 15 methane from methane hydrates points to the need for more research on this potential 16 climate “surprise.” Important research questions include: How much methane is actually 17 stored in such sediments? Where is it? What changes in the temperature and pressure of 18 the water are required to destabilize methane hydrates? How likely are these changes to 19 actually occur, and when?
20 Many of the terrestrial sedimentary carbon sinks are developed in depressions within 21 a young landscape formed during the last glacial-interglacial transition. As sediments 22 accumulate, many of the smaller depressions, such as small reservoirs, ponds, and 23 wetlands will fill. Moreover, about half of the wetlands in the conterminous United 24 States have been eliminated by draining or by flooding behind dams. The future 25 evolution of carbon stored in these ephemeral settings is presently unclear and requires 26 modeling.
27 The behavior of many hydrologic systems is marked by dynamics that appears to be 28 predictable over some range of conditions. Outside this range of conditions, the dynamic 29 behavior can be so markedly different that the "rules of thumb" or models derived from 30 familiar behavior fail to predict the salient features of this new behavior. Many of the 31 numerous interactions and feedbacks are highly nonlinear, and the thresholds between 32 dynamic states of a hydrologic system can be quite difficult to discern.
33 Typically the thresholds that may affect the dynamic state of a hydrologic system are 34 recognized through comparative studies among many watersheds. The study of any 35 single smaller watershed seeks to identify those processes and phenomena that 36 predominate in controlling the behavior of watersheds for some range of conditions 37 (climate, substrate, land cover, etc.). The comparison serves to identify conditions in 38 which the controlling processes are different and why. A comparison among small 39 watersheds is inadequate because of scale-related thresholds that make it a challenge infer 40 the hydrologic response of larger watersheds from smaller ones.
41 Given a history of major land-cover change, hydrologic engineering, and presumed 42 future changes in climate and weather, a thorough understanding of the thresholds that 43 mark changes in hydrologic responses in watersheds is essential. Monitoring networks
59
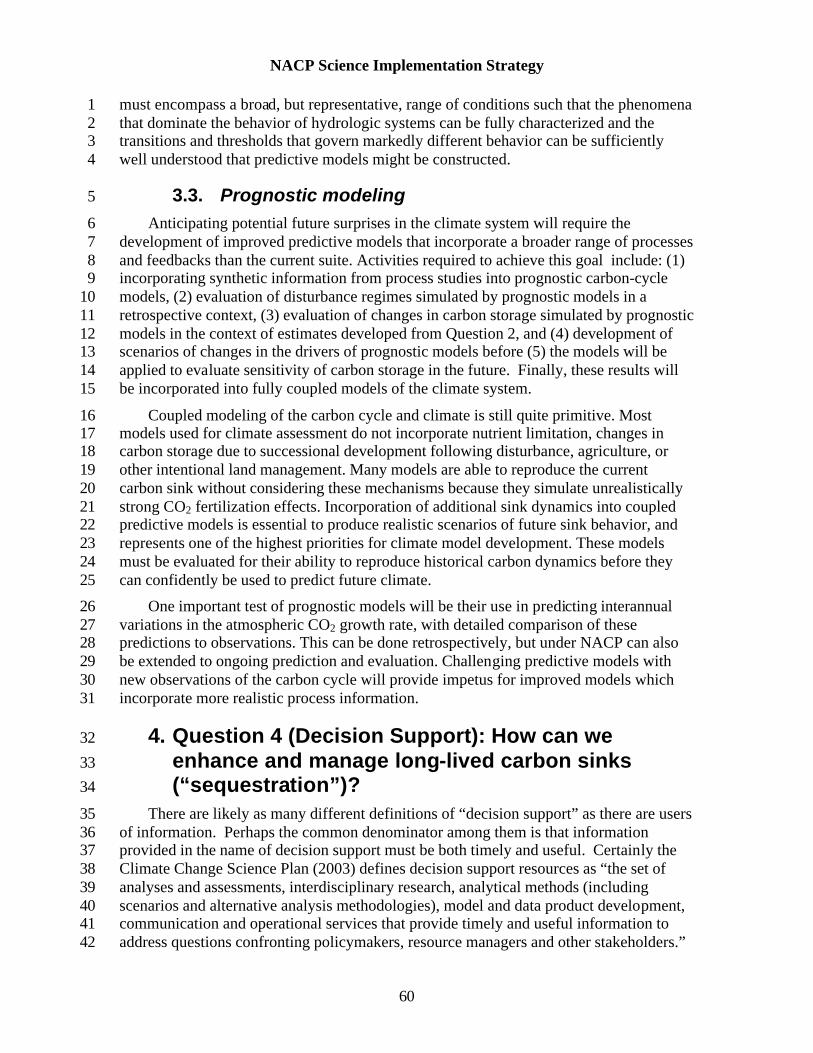
5
10
15
20
25
30
35
40
NACP Science Implementation Strategy
1 must encompass a broad, but representative, range of conditions such that the phenomena 2 that dominate the behavior of hydrologic systems can be fully characterized and the 3 transitions and thresholds that govern markedly different behavior can be sufficiently 4 well understood that predictive models might be constructed.
3.3. Prognostic modeling 6 Anticipating potential future surprises in the climate system will require the 7 development of improved predictive models that incorporate a broader range of processes 8 and feedbacks than the current suite. Activities required to achieve this goal include: (1) 9 incorporating synthetic information from process studies into prognostic carbon-cycle
models, (2) evaluation of disturbance regimes simulated by prognostic models in a 11 retrospective context, (3) evaluation of changes in carbon storage simulated by prognostic 12 models in the context of estimates developed from Question 2, and (4) development of 13 scenarios of changes in the drivers of prognostic models before (5) the models will be 14 applied to evaluate sensitivity of carbon storage in the future. Finally, these results will
be incorporated into fully coupled models of the climate system.
16 Coupled modeling of the carbon cycle and climate is still quite primitive. Most 17 models used for climate assessment do not incorporate nutrient limitation, changes in 18 carbon storage due to successional development following disturbance, agriculture, or 19 other intentional land management. Many models are able to reproduce the current
carbon sink without considering these mechanisms because they simulate unrealistically 21 strong CO2 fertilization effects. Incorporation of additional sink dynamics into coupled 22 predictive models is essential to produce realistic scenarios of future sink behavior, and 23 represents one of the highest priorities for climate model development. These models 24 must be evaluated for their ability to reproduce historical carbon dynamics before they
can confidently be used to predict future climate.
26 One important test of prognostic models will be their use in predicting interannual 27 variations in the atmospheric CO2 growth rate, with detailed comparison of these 28 predictions to observations. This can be done retrospectively, but under NACP can also 29 be extended to ongoing prediction and evaluation. Challenging predictive models with
new observations of the carbon cycle will provide impetus for improved models which 31 incorporate more realistic process information.
32 4. Question 4 (Decision Support): How can we 33 enhance and manage long-lived carbon sinks 34 (“sequestration”)?
There are likely as many different definitions of “decision support” as there are users 36 of information. Perhaps the common denominator among them is that information 37 provided in the name of decision support must be both timely and useful. Certainly the 38 Climate Change Science Plan (2003) defines decision support resources as “the set of 39 analyses and assessments, interdisciplinary research, analytical methods (including
scenarios and alternative analysis methodologies), model and data product development, 41 communication and operational services that provide timely and useful information to 42 address questions confronting policymakers, resource managers and other stakeholders.”
60

123
456789
10111213141516
17181920212223
2425262728293031323334353637
NACP Science Implementation Strategy
It is only a subset of scientific information that may be relevant to decision making, but for that category of endeavor careful attention must be paid to the interface between the two.
In order for information to be timely and useful beyond just through serendipity, information providers must be knowledgeable about the stakeholders and issues that they are hoping to inform. They must understand who the decision makers are, at what scale they operate, and how their decision process works. Without this knowledge, the information produced may have relevance, but be largely unusable simply because it is not delivered at the proper time, or presented in an unfamiliar or irrelevant format.
The research agenda for how the North American Carbon Program (NACP) can support decision making in enhancing and managing long-lived carbon sinks (e.g. sequestration) is still largely unexplored. A great deal of research on sequestration is underway under the auspices of the Climate Change Technology Program, the technologically-focused companion to the Climate Change Science Plan. The Department of Energy and the Department of Agriculture are leading the way on investigating terrestrial, geologic and oceanic sequestration options.
There is, however, a whole suite of research questions that interface the issues germane to carbon cycle science and those germane to technologically-driven carbon sequestration. These include questions regarding social and economic factors, land use change and management, longevity of sinks, scenario development, and assessment of sequestration options. These are issues that affect the future evolution of greenhouse gases in the atmosphere, evolution of carbon sinks on land and in the ocean, and consideration of our technological options.
Beyond studying the scientific issues that NACP might feel are important to consider for decision support, there is a whole interrelated branch of inquiry that is necessary for effective decision research. Understanding why people make the decisions that they do in various sectors and how those decisions in turn affect carbon budgets and the evolution of the carbon cycle is the first step. As a next step, research must be undertaken to understand who might use information emerging from the NACP and how their decision processes work. This approach, which centers working across disciplines and engaging policy makers, resource managers and other stakeholders, is outside the realm of traditional carbon cycle science. The Climate Change Science Strategic Plan (USGCRP, 2003) has placed an emphasis on decision support, which will most likely involve an integration of effort between science element such as carbon cycle and the Decision Support element. We therefore propose to develop a strategy for decision support within the NACP that will need to interface with other elements of the CCSP, such as Decision Support as well as the Climate Change Technology Program.
38 4.1. Social and economic factors 39 Given that carbon sequestration would add to the cost of providing energy, it is not 40 likely that energy providers will engage in large-scale carbon sequestration projects 41 without a financial incentive. This incentive could come from a number of venues; 42 consumer pressure, state or federal price signals, competition, etc. Understanding the 43 options for carbon sequestration therefore includes evaluating the relative effectiveness of
61

1234
56789
10
NACP Science Implementation Strategy
these incentives, the social environment, and policy climate under which business will be operating in the future. Pilot voluntary markets have been implemented which will trade “credits” for carbon sequestration according to certain criteria—monitoring and following the evolution of these markets is a ripe area for research.
Carbon sequestration has already encountered some social resistance in the form of objection to a pilot ocean sequestration study off the coast of Hawaii. Some of the social factors to be studied include acceptance of carbon sequestration, whether geologic, oceanic or terrestrial. Environmental effects are also a key part of this research agenda. There are also some potentially positive economic and social interactions between carbon sequestration and biodiversity conservation in the terrestrial component.
11 4.2. Land use policy 12 Independent of energy policy in the United States, incentives are being implemented 13 to encourage various land use management regimes (such as conservation tillage) which 14 will have significant impacts on carbon sequestration on land. It is important to 15 understand how effective such incentives are at storing carbon, and for long land would 16 have to be managed in this manner in order to keep the carbon sequestered.
17 Future trends in land use and management for agriculture and forestry systems will 18 critically affect atmospheric greenhouse gas (GHG) concentrations over the next 30-50 19 years, with important implications for regional and global climate. Among the feedbacks 20 that characterize such coupled natural and human systems, land use and land use changes 21 can in turn be affected by climatic change as well as by socio-economic trends and 22 population dynamics. In the complex chain of events from population pressures on land 23 use, to land pressures on the regional and global environment, policy may also intervene, 24 by setting standards for local water and air quality, or by developing rules for greenhouse 25 gas emission limitations and/or trading of sequestered carbon. Interdisciplinary modeling 26 efforts are thus needed to: a) improve the biophysical understanding of processes and 27 their linkages at many temporal and spatial scales; and b) integrate and project realistic 28 and consistent environmental and socio-economic scenarios that can inform decision-29 making.
30 Research bullets:
31 • Enhance existing dynamic ecological zones models, projecting spatially explicit, 32 biophysically based agricultural and forestry land use and production, to include 33 measures of land-based GHG emissions/sequestration potentials, as a function of 34 land management.
35 • Assess realistic current and future land-use change scenarios, for example by 36 linking the ecosystem models to multi-regional and multi-sectoral models of the 37 economy for a given region of interest, to include things such trade-offs between 38 agro-forestry production and other sectoral needs (energy demand, rural/urban 39 development, water availability and use, etc.).
40 • Use linked models to analyze policy alternatives for land-based sectors, regionally detailed and over the next 30-50 years, focusing on the following research and policy questions: What happens to projected land use change under the
41 42
62
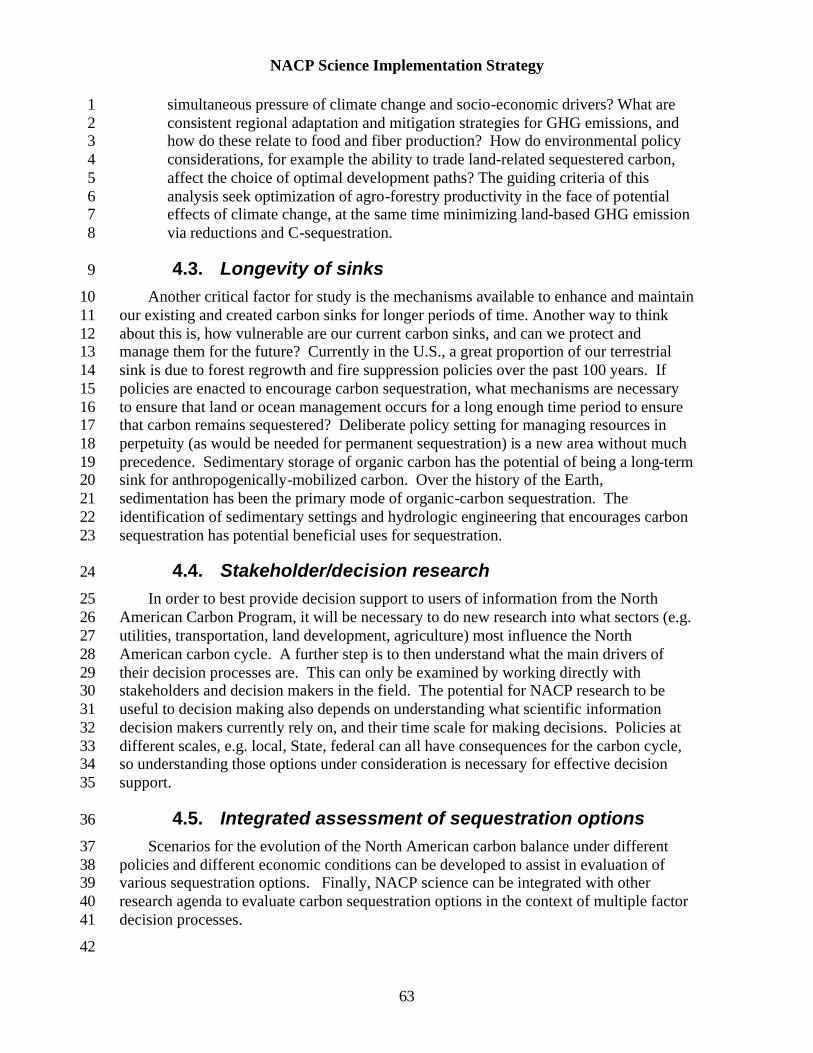
12345678
NACP Science Implementation Strategy
simultaneous pressure of climate change and socio-economic drivers? What are consistent regional adaptation and mitigation strategies for GHG emissions, and how do these relate to food and fiber production? How do environmental policy considerations, for example the ability to trade land-related sequestered carbon, affect the choice of optimal development paths? The guiding criteria of this analysis seek optimization of agro-forestry productivity in the face of potential effects of climate change, at the same time minimizing land-based GHG emission via reductions and C-sequestration.
9 4.3. Longevity of sinks 10 Another critical factor for study is the mechanisms available to enhance and maintain 11 our existing and created carbon sinks for longer periods of time. Another way to think 12 about this is, how vulnerable are our current carbon sinks, and can we protect and 13 manage them for the future? Currently in the U.S., a great proportion of our terrestrial 14 sink is due to forest regrowth and fire suppression policies over the past 100 years. If 15 policies are enacted to encourage carbon sequestration, what mechanisms are necessary 16 to ensure that land or ocean management occurs for a long enough time period to ensure 17 that carbon remains sequestered? Deliberate policy setting for managing resources in 18 perpetuity (as would be needed for permanent sequestration) is a new area without much 19 precedence. Sedimentary storage of organic carbon has the potential of being a long-term 20 sink for anthropogenically-mobilized carbon. Over the history of the Earth, 21 sedimentation has been the primary mode of organic-carbon sequestration. The 22 identification of sedimentary settings and hydrologic engineering that encourages carbon 23 sequestration has potential beneficial uses for sequestration.
24 4.4. Stakeholder/decision research 25 In order to best provide decision support to users of information from the North 26 American Carbon Program, it will be necessary to do new research into what sectors (e.g. 27 utilities, transportation, land development, agriculture) most influence the North 28 American carbon cycle. A further step is to then understand what the main drivers of 29 their decision processes are. This can only be examined by working directly with 30 stakeholders and decision makers in the field. The potential for NACP research to be 31 useful to decision making also depends on understanding what scientific information 32 decision makers currently rely on, and their time scale for making decisions. Policies at 33 different scales, e.g. local, State, federal can all have consequences for the carbon cycle, 34 so understanding those options under consideration is necessary for effective decision 35 support.
36 4.5. Integrated assessment of sequestration options 37 Scenarios for the evolution of the North American carbon balance under different 38 policies and different economic conditions can be developed to assist in evaluation of 39 various sequestration options. Finally, NACP science can be integrated with other 40 research agenda to evaluate carbon sequestration options in the context of multiple factor 41 decision processes.
42
63

1
23456
78
91011
1213
141516
171819
202122
232425262728293031
32
33343536
NACP Science Implementation Strategy
5. Data and information management for the NACP The previous sections describe a strategy for a highly integrated interdisciplinary
research program for understanding, monitoring, and predicting carbon fluxes over North America and adjacent ocean regions. At the heart of this strategy is an integrated data and information management system that enables researchers to access, understand, use, and analyze large volumes of diverse data at multiple temporal and spatial scales.
The data required to address the NACP research questions will come from a number of sources and will be used for a wide array of activities:
• data from major diagnostic studies in which measurements of carbon storage on land and in the oceans and fluxes between reservoirs will be made in a coordinated series of experiments
• data from process studies on controls of carbon cycling will be used to improve mechanistic models
• data from process-based models will be used in conjunction with remote sensing and other spatial data to estimate net carbon fluxes and storage across the continent at fine spatial and temporal resolution
• data from diagnosis and process models will be used to improve prediction of future changes in the carbon cycle, and will continue to be evaluated against the ongoing diagnostic data
• data produced under NACP will be used along with prognostic models to provide decision support resources for policymakers, land managers, and other users of carbon cycle information.
Many of the required data streams exist today, but are not produced consistently at the time and space resolution needed, and the data are not assembled into an integrated set for data fusion (Wofsy and Harriss, 2002). Systems are in place for handling many of these existing data streams, and the NACP data and information management system should build on these systems to meet the needs of NACP. Innovative new methods such as data assimilation and model-data fusion will require an integrated, responsive, and flexible data management system for NACP. The challenge for the data and information system is to facilitate the rapid and transparent exchange of large amounts of information from many disciplines.
5.1 Data policy Managing and integrating data for NACP requires an overarching data policy that
provides open access to environmental data for North America in a timely manner. The policy needs to be established and approved by U.S., Canada, and Mexico, and will cover the types of issues presented in the text box below.
64
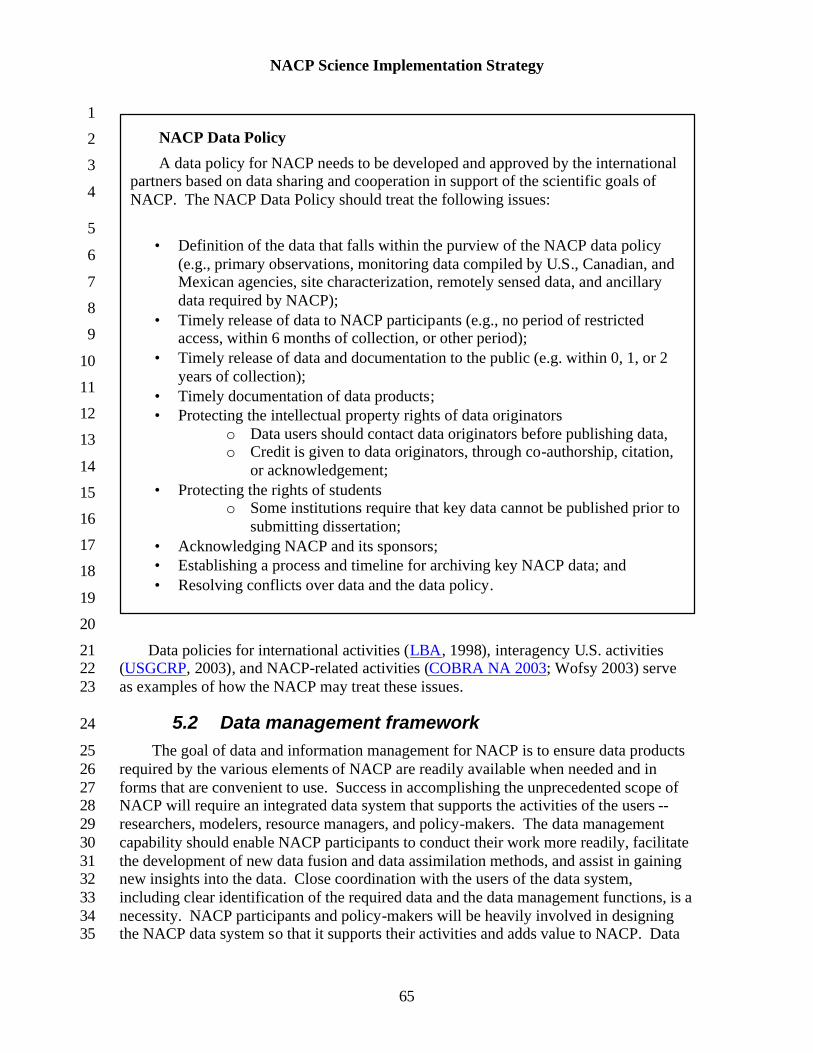
1
2
3
4
5
6
7
8
9
10
11
12
13
14
15
16
17
18
19
20
212223
24
2526272829303132333435
NACP Science Implementation Strategy
NACP Data Policy
A data policy for NACP needs to be developed and approved by the international partners based on data sharing and cooperation in support of the scientific goals of NACP. The NACP Data Policy should treat the following issues:
• Definition of the data that falls within the purview of the NACP data policy (e.g., primary observations, monitoring data compiled by U.S., Canadian, and Mexican agencies, site characterization, remotely sensed data, and ancillary data required by NACP);
• Timely release of data to NACP participants (e.g., no period of restricted access, within 6 months of collection, or other period);
• Timely release of data and documentation to the public (e.g. within 0, 1, or 2 years of collection);
• Timely documentation of data products; • Protecting the intellectual property rights of data originators
o Data users should contact data originators before publishing data, o Credit is given to data originators, through co-authorship, citation,
or acknowledgement; • Protecting the rights of students
o Some institutions require that key data cannot be published prior to submitting dissertation;
• Acknowledging NACP and its sponsors; • Establishing a process and timeline for archiving key NACP data; and • Resolving conflicts over data and the data policy.
Data policies for international activities (LBA, 1998), interagency U.S. activities (USGCRP, 2003), and NACP-related activities (COBRA NA 2003; Wofsy 2003) serve as examples of how the NACP may treat these issues.
5.2 Data management framework The goal of data and information management for NACP is to ensure data products
required by the various elements of NACP are readily available when needed and in forms that are convenient to use. Success in accomplishing the unprecedented scope of NACP will require an integrated data system that supports the activities of the users --researchers, modelers, resource managers, and policy-makers. The data management capability should enable NACP participants to conduct their work more readily, facilitate the development of new data fusion and data assimilation methods, and assist in gaining new insights into the data. Close coordination with the users of the data system, including clear identification of the required data and the data management functions, is a necessity. NACP participants and policy-makers will be heavily involved in designing the NACP data system so that it supports their activities and adds value to NACP. Data
65

12
34567
89
10111213
1415161718192021222324
252627
NACP Science Implementation Strategy
managers will be an integral part of the team leading NACP, to ensure that the data system is responsive to the Program’s changing needs.
A dedicated and central NACP data management group will coordinate data activities with the NACP participants and manage the data system. The NACP data management group will rely heavily on existing data systems of agencies contributing North American observations to the program, but there will be additional data functions that the NACP participants will require.
A data workshop is scheduled in 2004 to identify the data management functions required by NACP participants and to plan the data and information management system. Among the topics the workshop will consider are acquisition, distribution, and sharing of key data; centralized access to NACP data; standards for data and documentation; quality assurance reviews; tools to facilitate data acquisition, visualization, and analysis; data processing; and preparation of value-added data products.
When multiple groups need data products, there may be advantages for the NACP data management group to assemble value-added products. For example, concerted efforts may be needed to make land surface and climate data from the US, Canada, and Mexico available in a consistent grid and common projection; the data workshop needs to evaluate who prepares those products. For other data products with limited demand (e.g., custom input data for a specific model), it may be more appropriate for individual research groups to prepare the data. New data assimilation and data fusion methods for analysis of the carbon cycle on a continental scale will generate large volumes of fine temporal and spatial resolution data. The workshop participants need to evaluate who will perform these new analyses and how the large volume of data produced by these methods will be handled.
The data system should be flexible, because NACP data requirements and the data system will to evolve to meet changing carbon cycle research and advances in computer technologies.
28 5.3 Data required for NACP 29 In order to serve the end-users of NACP data, the program needs to identify the 30 major data components required. With the data requirements established, NACP can 31 design an appropriate approach for data management. The data required and produced to 32 achieve the NACP objectives are highly diverse and include data from the following: 33 model input and output, monitoring networks, intensive field studies, airborne 34 measurements, remote sensing products, and value-added products. One of the main 35 challenges for data management is handling the anticipated large volume of coast-to-36 coast high spatial and temporal resolution data produced by the data assimilation 37 methods.
38 Tables 5 – 11 provide an initial assessment of the data required for NACP, based on 39 current state of carbon cycle science and the Terrestrial Carbon Observations Program 40 (Cihlar et al., 2001). The data tables are not simply an inventory of existing data, but 41 rather an evolving list of the critical data required to meet the goals of NACP.
42
66
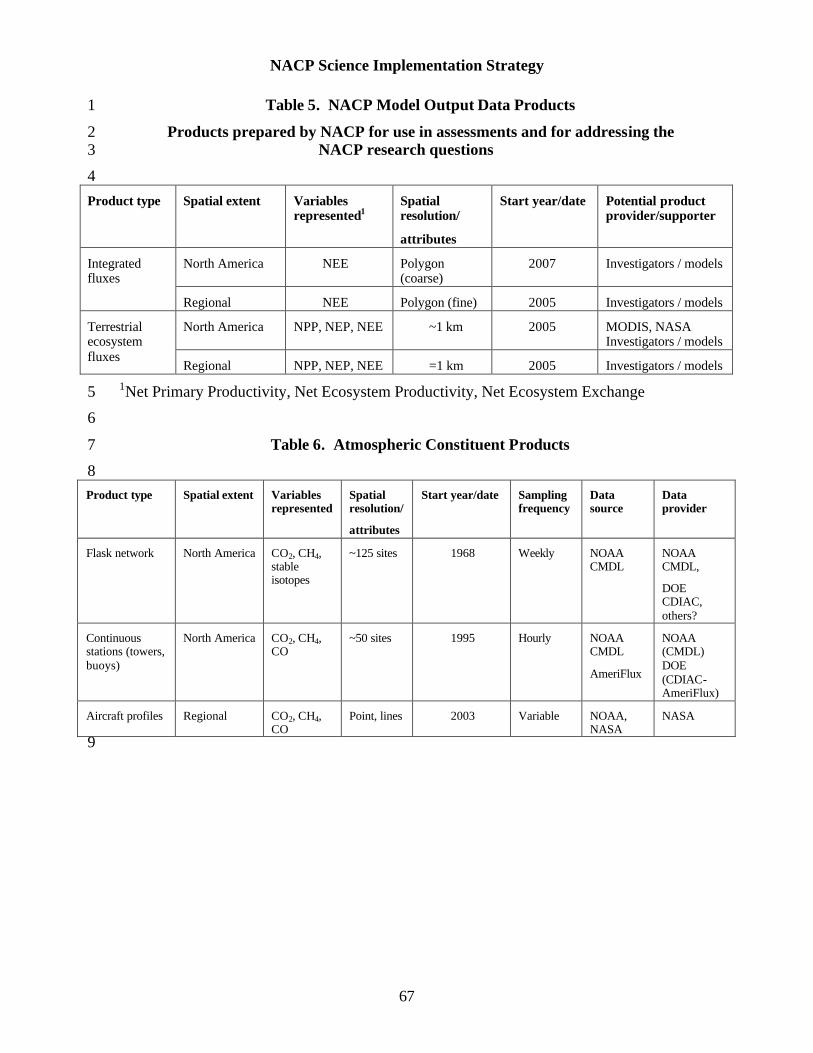
NACP Science Implementation Strategy
1 Table 5. NACP Model Output Data Products
2 Products prepared by NACP for use in assessments and for addressing the 3 NACP research questions
4 Product type Spatial extent Variables
represented1 Spatial resolution/
attributes
Start year/date Potential product provider/supporter
Integrated fluxes
North America NEE Polygon (coarse)
2007 Investigators / models
Regional NEE Polygon (fine) 2005 Investigators / models
Terrestrial ecosystem fluxes
North America NPP, NEP, NEE ~1 km 2005 MODIS, NASA Investigators / models
Regional NPP, NEP, NEE =1 km 2005 Investigators / models
5 1Net Primary Productivity, Net Ecosystem Productivity, Net Ecosystem Exchange
6
7 Table 6. Atmospheric Constituent Products
8
Product type Spatial extent Variables represented
Spatial resolution/
attributes
Start year/date Sampling frequency
Data source
Data provider
Flask network North America CO2, CH4, stable isotopes
~125 sites 1968 Weekly NOAA CMDL
NOAA CMDL,
DOE CDIAC, others?
Continuous stations (towers, buoys)
North America CO2, CH4, CO
~50 sites 1995 Hourly NOAA CMDL
AmeriFlux
NOAA (CMDL) DOE (CDIAC-AmeriFlux)
Aircraft profiles
9
Regional CO2, CH4, CO
Point, lines 2003 Variable NOAA, NASA
NASA
67

NACP Science Implementation Strategy
1 Table 7. Flux Data Products
2 Product type Spatial extent Variables
represented Spatial resolution/
attributes
Start year/date Sampling frequency
Data source Data provider
Flux tower network
(Eddy covariance)
Continental CO2 flux Sites
(<~1 km)
~1992 Half-hourly and coarser
AmeriFlux DOE CDIAC -AmeriFlux
Flux tower network
(Eddy covariance)
East-West Transect in Southern Canada
CO2 flux (half -hourly and coarser)
Half-hourly and coarser
Fluxnet-Canada
Fluxnet-Canada,
ORNL DAAC
Flux tower network
(Bowen Ratio)
Western U.S. CO2 flux Sites (12 in western U.S.)
~1996 Half-hourly and coarser
Rangeland Flux Network
USDA-Rangeland Flux
ORNL DAAC
Flux tower network
(Bowen Ratio)
U.S. CO2 flux Sites (expanding Rangeland Network to 42 in U.S.
2004? Half-hourly and coarser
AgriFlux USDA / ARS
Net Primary Productivity
Continental Photosyn./ Primary Productivity
1 km, Sin Projection
2000 8-day and coarser
MODIS (NASA)
LP DAAC
Fossil fuel emissions
North America CO2, CO, CH4, isotopes
10 km Ongoing Monthly, with synoptic and diurnal cycles
investigators DOE CDIAC
Fire occurrence
North America 1 km 1999 Daily
MODIS NASA
NASA
Fire extent North America Area burned 1 km 1999 Daily
MODIS NASA
NASA
Fire emissions North America CO2 flux 1 km 2000 Daily
Investigators NASA
1Uncertainties and improved spatial and temporal resolution required
68
3

NACP Science Implementation Strategy
1 Table 8. Land Cover/Use Products
2
3
4
5 Table 9. Data Required for Diagnostic and Prognostic Models
6
Product type/name Spatial extent Variables represented
Spatial resolution/
attributes
Start year/date Data
source
Data provider
Land cover North America Cover type ~30 m Landsat, AVIRIS TM
NASA
Land cover coarse North America Cover type £ 1 km MODIS, VIIRS
NASA
Land use (present and history; including management)
North America Land use £ 1 km 5-year intervals beginning in 1982 for agricultural use
Land cover, other products
USDA
Various
Land cover change North America Land cover change
< 1 km Annual MODIS, AVIRIS, VIIRS
NASA
USDA
Vegetation structure/biomass
North America, strategic sampling
Volume, Biomass
< 50 m Annual, Intermittent
AVIRIS, LVIS
NASA
Product type/name Spatial extent Variables represented
Spatial resolution
Start year/date Sampling frequency
Data
source
Data provider
LAI / fPAR Continental LAI / fPAR £ 1 km 2000 8-day MODIS, MISR, VIIRS
NASA
Solar radiation Continental PAR
Direct beam
Diffuse
1 km 2000 Hourly CERES,
+geostationary
NASA
Climate / Meteorology
Continental Precipitation (liquid, solid)
Temperature Relative humidity
Wind speed
5 km 2005 Hourly NASA, ECMWF, NOAA-NCEP
Mesoscale assimilation and terrain-based downscaling
NASA, ECMWF, NOAA-NCEP
7
69

NACP Science Implementation Strategy
1 Table 10. Carbon Inventory Products
2
Product type Spatial extent Variables represented
Spatial resolution/
attributes
Start year/date
Data
source
Data provider
Above ground biomass Continental Above ground biomass
Stem and leaf C and N pools
Plot-scale
Intermittent
FIA, agricultural NACP
NFI
USDA
Canada
Soil carbon stocks Continental Carbon content
=10km grid 2003-4 FAO soil map, SOTER
FAO, SOTER
Regional Carbon content
=10 km 2003 U.S., Canada
U.S., Canada, Mexico agencies
3
4
5 Table 11. Input Data Required for Modeling
6
Product type Spatial extent Variables represented
Spatial resolution/
attributes
Start year/date Data
source
Data provider
Ecosystem attributes Continental Evaluation data for models and products
Sites
(<~1 km)
<2001 LTER, ILER
GTNet
National, regional networks, ORNL DAAC
Soil map Continental Texture
Water holding capacity
Soil carbon, nitrogen, organic N and P
Thermal capacities
1:5M map Existing FAO, campaigns
SOTER, U.S., Canada, Mexico
DEM Continental Topography =0.1km Existing Various USGS
Water flow Continental River discharge
Sites, integrating watersheds
USGS USGS
Forest attributes Continental Stand age distribution and disturbance regime
<10 – 50 km
70
1
23456
789
10
1112
1314151617
18192021
222324252627
2829
30313233
343536
37383940
NACP Science Implementation Strategy
6. References Bender, M., S. Doney, R.A. Feely, I. Fung, N. Gruber, D.E. Harrison, R. Keeling,
J.K. Moore, J. Sarmiento, E. Sarachik, B. Stephens, T. Takahashi, P. Tans, and R. Wanninkhof (2002) A large-scale CO2 observing plan: In situ oceans and atmosphere (LSCOP). NOAA OAR Special Report, 201 pp. Available online: http://www.ogp.noaa.gov/mpe/gcc/co2/observingplan/toc.htm
Cihlar, J., S. Denning, R. Francey, R. Gommes, M. Heimann, P. Kabat, R. Olson, R. Scholes, J. Townshend, J. Tschirley, R. Valentini, D. Wickland (2001) Implementation Plan for the Terrestrial and Atmospheric Carbon Observation Initiative (TCO). Global Terrestrial Observing System, unpublished report.
Doney, S.C. (1999) Major challenges confronting marine biogeochemical modeling. Global Biogeochem. Cycles 13 (3): 705-714.
Doney, S.C., R. Anderson, J. Bishop, K. Caldeira, C. Carlson, M.-E. Carr, R. Feely, M. Hood, C. Hopkinson, R. Jahnke, D. Karl, J. Kleypas, C. Lee, R. Letelier, C. McClain, C. Sabine, J. Sarmiento, B. Stephens, and R. Weller, 2004: Ocean Carbon and Climate Change (OCCC): An Implementation Strategy for U. S. Ocean Carbon Cycle Science, UCAR, Boulder, CO, 104pp.
Hargrove, W. W. and F. M. Hoffman (2002) Representativeness and Network Site Analysis Based on Quantitative Ecoregions, Oak Ridge National Laboratory, Environmental Sciences Division, Oak Ridge, TN. Available on-line: http://research.esd.ornl.gov/~hnw/networks/
IPCC (2001) Climate Change 2001: The Scientific Basis. A Contribution of Working Group I to the Third Assessment Report of the Intergovernmental Panel on Climate Change [Houghton, J.T., Y. Ding, D.J. Griggs, M. Noguer, P.J. van der Linden, X. Dai, K. Maskell, and C.A. Johnson (eds.)]. Cambridge University Press, Cambridge, United Kingdom and New York, NY, USA, 881 pp. Available online: http://www.grida.no/climate/ipcc_tar/wg1/index.htm
LBA Data and Publication Policy (1998) NASA, Goddard Space Flight Center, Greenbelt, MD. Available on-line http://www.lbaeco.org/lbaeco/data/data_poldoc.htm
USGCRP (2003) Strategic Plan for the U.S. Climate Change Science Program A Report by the Climate Change Science Program and the Subcommittee on Global Change Research, Washington, DC: US Global Change Research Program. Available on-line http://www.climatescience.gov/Library/stratplan2003/final/default.htm
Wofsy, S.C. (2003) COBRA North America 2003 Data Policy (Provisional), Harvard University, Cambridge, MA. Available on-line http://www.fas.harvard.edu/~cobra/data_policy.html
Wofsy, S.C. and R.C. Harriss (2002) The North American Carbon Program (NACP), Report of the NACP Committee of the U.S. Carbon Cycle Science Program. Washington, DC: US Global Change Research Program. Available on-line http://www.esig.ucar.edu/nacp/
71
5
10
15
20
25
30
35
NACP Science Implementation Strategy
1
2 Appendix A: NACP-Relevant Research Activities in 3 Canada and Mexico 4
The US and Canada have inventory programs for their forest lands. Mexico has completed a pilot 6 inventory in one province. This appendix describes the inventories and a summary of the 7 available variables. All inventories involve a remote sensing phase and a ground-based phase.
8 Natural Resources Canada/Canadian Forest Service – National Forest Inventory (NFI)
9 The federal government is responsible for the compilation of a National Forest Inventory (NFI3). Canada’s current national inventory is a periodic compilation of
11 existing inventory from across the country. While the current approach has many 12 advantages, it lacks information on the nature and rate of changes to the resource, and 13 does not permit projections or forecasts. Being a compilation of inventories of different 14 dates, collected to varying standards, the current national forest inventory cannot reflect
the current state of the forests and therefore cannot be used as a satisfactory baseline for 16 monitoring change.
17 To address these weaknesses and to meet new demands, the Canadian Forest 18 Inventory Committee (a group of inventory professionals from federal, provincial and 19 territorial governments and industry) has developed a new approach for the NFI. Instead
of a periodic compilation of existing information from across the country the CFIC 21 decided on a plot-based system of permanent observational units located on a national 22 grid. The new plot-based NFI design will collect accurate and timely information on the 23 extent and state of Canada’s forests to establish the baseline of where the forests are and 24 how they are changing over time. A core design (Natural Resources Canada, 1999) has
been developed with the following essential elements:
26 • A network of sampling points across the population;
27 • Stratification of the sampling points by terrestrial Ecozone (Ecological 28 Stratification Working Group, 1994), with varying sampling intensity among 29 the strata;
• Estimation of most area attributes from remote sensing sources (photo plots) on a 31 primary (large) sample;
32 • Estimation of species diversity, wood volumes and other desired data from a 33 (small) ground-based subsample;
34 • Estimation of changes from repeated measurements of all samples.
The new inventory will cover all of Canada. All potential sample locations reside on 36 a countrywide 4 x 4 km network. Each province and territory will decide on a ‘best
3 http://www.pfc.cfs.nrcan.gc.ca/monitoring/inventory/
72

123456789
101112
131415161718192021222324
NACP Science Implementation Strategy
design’ that will include samples located on a subset of the NFI sample locations (selected either randomly or systematically), or by a different yet statistically valid design. To provide reliable area statistics, the objective is to survey a minimum of 1% of Canada’s land mass. A 1% sample translates into a nominal design of 2 x 2 km photo plots located on a 20 x 20 km network, resulting in approximately 20 000 sample photo plots for Canada. The 2 x 2 km plot will be identified on conventional, mid-scale, aerial photography, and will be delineated and interpreted in full according to land cover classes and other forest stand attributes. Satellite and aircraft digital imagery will be used as a surrogate for aerial photography to provide attribute data for areas otherwise not covered by photo or ground plots (e.g., Canada’s north). The flexibility of the design allows the sampling to be more intense to achieve regional objectives, or less intense for non-forested or remote areas, such as Canada’s north.
The new NFI design also calls for a minimum of 50 forested ground plots per Ecozone. There will be no field samples established in the three non-treed, Arctic Ecozones. The ground samples will, in most cases, be located at the centre point of the photo plot. Approximately 10% of the photo-plot locations will be selected at random for ground sampling. Measurements of the ground plots will be synchronized, to the best extent possible, with the interpretation of photo plots. Attributes and data collected in ground plots will complement and enhance the attributes and data from the photo plots. The ground plots will also contain information that is not normally collected in forest inventories, such as litter and soil carbon data. Auxiliary NFI attributes related to both photo and ground plots will be collected from management records, other data sources, and mapped information. Table 1 provides a list of the NFI attributes.
73
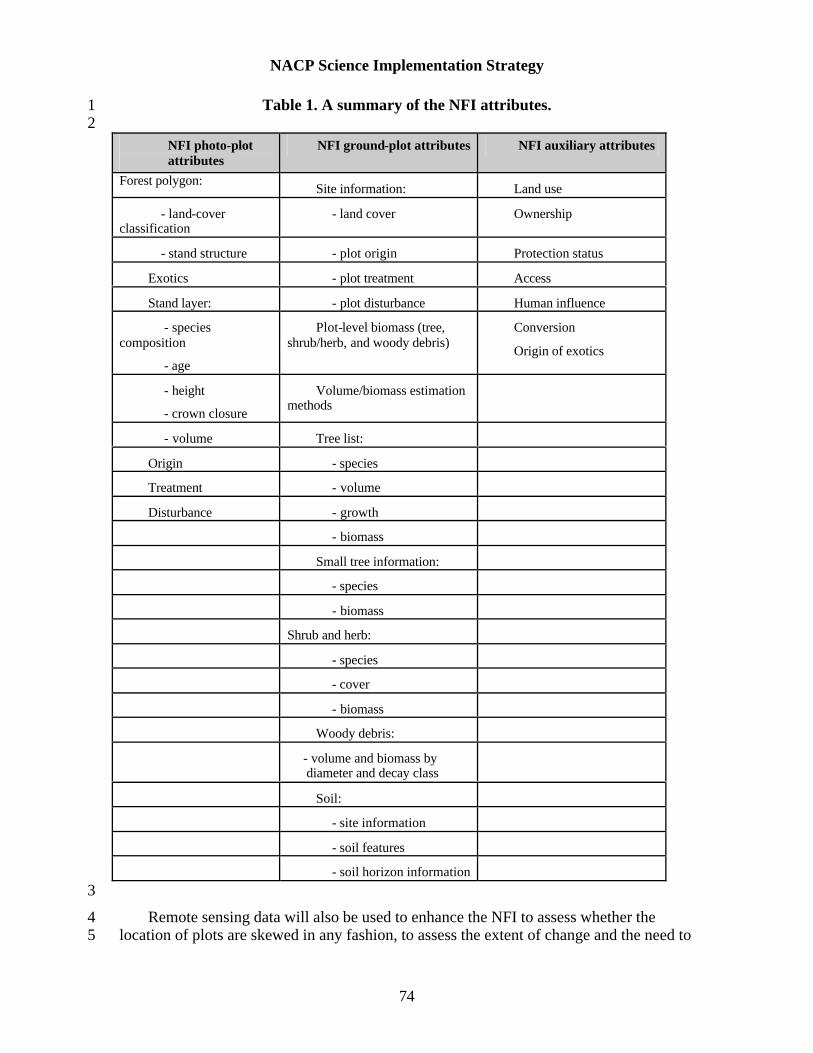
NACP Science Implementation Strategy
1 Table 1. A summary of the NFI attributes.2
NFI photo-plot attributes
NFI ground-plot attributes NFI auxiliary attributes
Forest polygon: Site information: Land use
- land-cover classification
- land cover Ownership
- stand structure - plot origin Protection status
Exotics - plot treatment Access
Stand layer: - plot disturbance Human influence
- species composition
- age
Plot-level biomass (tree, shrub/herb, and woody debris)
Conversion
Origin of exotics
- height
- crown closure
Volume/biomass estimation methods
- volume Tree list:
Origin - species
Treatment - volume
Disturbance - growth
- biomass
Small tree information:
- species
- biomass
Shrub and herb:
- species
- cover
- biomass
Woody debris:
- volume and biomass by diameter and decay class
Soil:
- site information
- soil features
- soil horizon information 3
5 location of plots are skewed in any fashion, to assess the extent of change and the need to 4 Remote sensing data will also be used to enhance the NFI to assess whether the
74

12345678
910111213
1415161718192021
22
232425
26272829
303132333435363738
39
NACP Science Implementation Strategy
revisit plots, to extend the inventory beyond the 1%, and to provide other area-based parameters such as forest condition. A new project is underway to provide remote sensing products to assist in the monitoring of the sustainable development of Canada’s forests. The project, called Earth Observation for Sustainable Development of Forests (EOSD4), is designed to provide complete (wall to wall) coverage of the forested area of Canada with satellite data at regular intervals to produce land cover, biomass and change products. The EOSD project will provide the satellite products required to enhance the plot-based NFI design.
The NFI will be ongoing. Change will be estimated from repeated sampling of photo and ground plots. The intent is to sample the entire country within the next five years and to spread the re-measurement over a ten-year period covering 10% of the area each year in a statistically defensible manner. Each subsequent re-measurement will be spread over subsequent ten-year periods.
Canada’s National Forest Inventory is an interagency partnership. The Canadian Forest Service, under the guidance of the CFIC, coordinates NFI activities. Through the interagency arrangement, the provincial and territorial partners develop their designs and provide data. The federal government’s role is to develop the standards, procedures, and infrastructure, and to conduct the analysis and reporting. The NFI is being implemented through bilateral agreements between the federal government and the partner provinces or territories. The field implementation has begun in a number of jurisdictions, and agreements are being finalized with the expectation that the remaining jurisdictions will begin implementation this year.
(This section on Canada written by Mark Gillis)
Natural Resources Canada (1999) A plot-based national forest inventory design for Canada: an interagency partnership project. http://www.pfc.forestry.ca/monitoring/inventory/canfi/docs/design2_e.pdf, August 22, 2003.
Pilot Project for Inventorying and Monitoring Ecosystems Resources, States of Jalisco and Colima, Mexico
The pilot study covers two southwestern states of approximately 9 million hectares. The sample design includes primary and secondary sampling units. The primary sampling unit measures 90 m X 90 m on a side and consists of nine 30 m X 30 m secondary sampling units. Each SSU is the size of a pixel on a Landsat TM image. PSU locations are permanent. Six of the SSUs will be measured. Subplots will be located in the SSUs to measure trees, herbaceous plants, shrubs, down dead wood, and soils. The variables are compatible with those used by the USDA Forest Service and the Canadian inventory system. A detailed description of the sampling design can be found in Programa de Desarrollo Forestal de Jalisco (2002).
--will add list of variables and more details
4 http://www.pfc.cfs.nrcan.gc.ca/eosd/
75

NACP Science Implementation Strategy
1 Programa de Desarrollo Forestal de Jalisco (2002) Pilot project for inventorying and 2 monitoring ecosystems resources. Technical Document 35. Guadalajara, Mexico. 130 pp. 3 [Chapters are repeated in Spanish and English.]45 Concluding paragraph about using these inventories for carbon
76

12
3
4
5
6
789
1011
1213141516171819202122232425262728
29
3031
32333435
3637383940
NACP Science Implementation Strategy
Appendix B: White Paper for Mid-Continent NACP Intensive Campaign in 2005
White paper author: Pieter Tans
A. Scientific goals
As scientists we are expected to provide answers to the three major questions (not repeated here) posed in the NACP plan (Wofsy and Harris, 2002, p. 2). The answers have to be robust enough to inform policy in the near future. Uncertainty estimates need to be well defined and scientifically defensible. This is a formidable task and we are not being given a whole lot of time in the President’s Carbon Cycle Science Plan.
The primary issue of both the magnitude and the possible mechanisms of the northern hemisphere terrestrial carbon sink have remained unsettled for well over a decade. Typically, “bottom up” estimates based on ecosystem models and/or inventories have tended to come up with magnitudes for the sink substantially smaller than what we deduce from “top-down” inverse models used to interpret atmospheric concentration patterns, at least when the evidence is not mixed through the use of “prior estimates”. As long as these different approaches independently produce quite divergent answers, we can have no real confidence in any of the estimates. Thus far, atmospheric data have always been too sparse to be conclusive on a regional or even continental scale, and they have additionally been hampered by atmospheric model shortcomings. From the other side, it has proven very hard to sufficiently verify the scaling up of local measurements using models, or to validate satellite-based estimates for large regions. To make progress the different approaches need to be confronted in a region and at a time where we can maximize the information content and credibility of each method, so that the independent approaches can be assessed. Multiple models will be applied to both the top-down and bottom-up data sets. Needed areas of improvement will then be apparent, and we will be in a much better position to see how the approaches can strengthen each other.
Goal 1. Develop optimized sampling schemes for field and atmospheric measurements to efficiently monitor regional carbon stocks and fluxes.
Goal 2. Use “top-down” approaches to provide a region-level estimate of net carbon fluxes during short periods (weeks) with an accuracy of 10% by increasing spatial and temporal coverage of atmospheric measurements and by enabling improvements in the parameterization of transport/mixing processes in the lower atmosphere.
Goal 3. Use a variety of “bottom up” techniques to provide daily to annual estimates of carbon stocks and fluxes over a region by improving process model structure and parameterization. A hierarchy of field and remote sensing observations should be used for model testing, development of data assimilation techniques, and model parameterization.
77

12
345
6
NACP Science Implementation Strategy
Goal 4. Compare the top-down and bottom-up approaches and iteratively improve the independent approaches on daily to annual time scales.
Goal 5. Produce “carbon stocks and flux maps” at various levels of spatial and temporal detail, and compare the results of the top-down and bottom-up approaches to diagnose methods.
7 B. Place and time
8 The center of the North American continent, the Midwest agricultural belt in the 9 northern U.S. and Canada, is a large region in which the daunting complexities and the
10 small-scale variability of ecosystems, soils, microclimates, topography, land use and land 11 use history, are perhaps a bit more manageable. The area of the campaign will be eastern 12 South Dakota, eastern Nebraska, eastern Kansas, northern Missouri, Iowa, southern 13 Minnesota, southern Wisconsin, and Illinois (Figure 1). The difficulties of interpreting 14 atmospheric measurements with transport models are minimized over flat terrain. The 15 area is covered by the NOAA wind profiler network 16 (http://www.profiler.noaa.gov/jsp/profiler.jsp), which provides hourly wind velocities 17 from 500 m above the surface to 16 km altitude. The area is also a significant portion of 18 the most intensively farmed region of the continent, with relatively low population 19 density, but with several concentrated metropolitan centers. Crop growth models making 20 use of satellite imagery have been applied to a part of Iowa, and have been compared to 21 end-of-season yield statistics. Daily estimates of evapotranspiration are already routinely 22 available for a large part of the area (http://www.soils.wisc.edu/wimnext/water.html), 23 although they need to be evaluated with flux measurements. In the Carbon Sequestration 24 Rural Appraisal, carried out in Iowa, it was estimated that on cropland under no-till the 25 net annual carbon uptake is about 0.6 ton C/ha/year, and on land in the Conservation 26 Reserve Program about 1.3 ton C/ha/year. The highest participation in the CRP occurs in 27 the area straddling the state border with Missouri.
28 There will be an intensive during the peak season of CO2 uptake (July) and in the fall 29 when CO2 respiration continues but most plant photosynthesis has ceased (October-30 November). In July the leaf cover is fairly uniform between corn and soybeans, which 31 avoids non-linearity effects in averaging over remote sensing pixels. The campaign will 32 be embedded both in space and time within a long-term observing system that is being 33 developed to detect net annual sources/sinks. For example, ecosystem process models 34 will require at least a year of meteorological driver data for the full year of the intensive 35 to “spin-up” the model to equilibrium and to calculate stocks. Other field data (e.g. 36 inventories) for estimating stocks in bottom-up approaches are only available for 5-10 37 year means.
38
39 C. Requirements
40 1. Long-term atmospheric monitoring. Species concentrations in the atmospheric 41 boundary layer tend to be offset from those in the free troposphere as they “integrate” the 42 effect of sources/sinks over large regions to varying degrees. There is significantly more
78
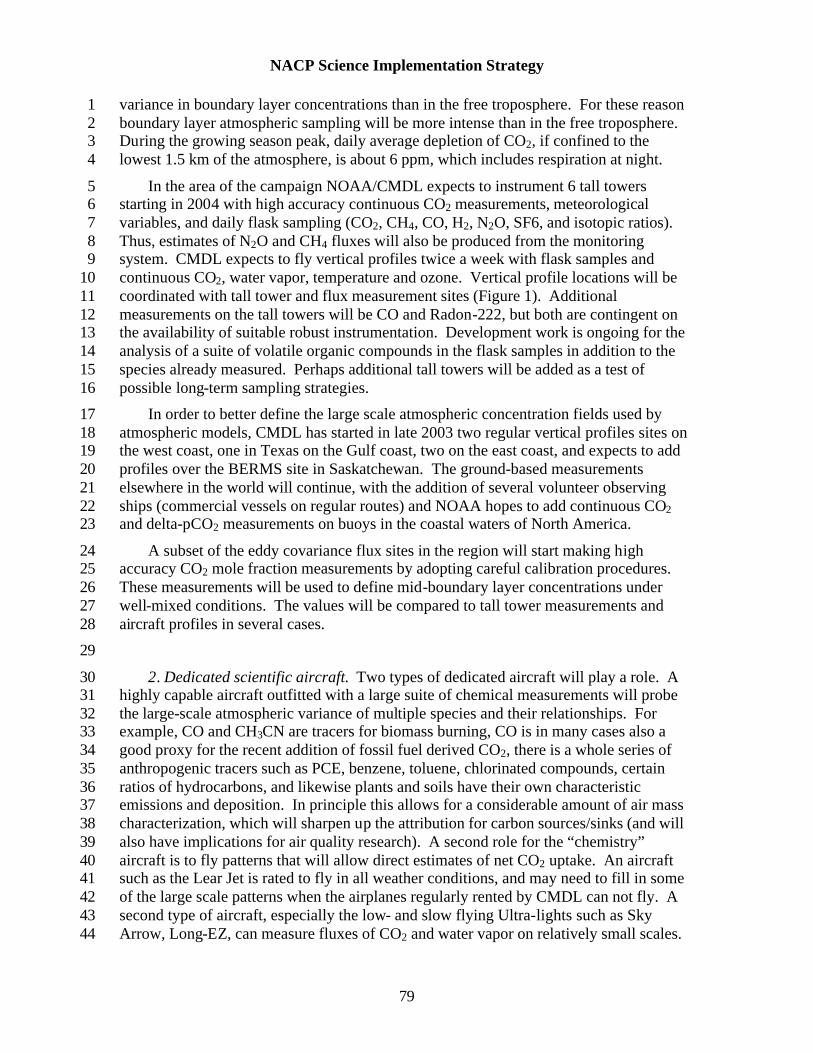
1234
56789
10111213141516
17181920212223
2425262728
29
303132333435363738394041424344
NACP Science Implementation Strategy
variance in boundary layer concentrations than in the free troposphere. For these reason boundary layer atmospheric sampling will be more intense than in the free troposphere. During the growing season peak, daily average depletion of CO2, if confined to the lowest 1.5 km of the atmosphere, is about 6 ppm, which includes respiration at night.
In the area of the campaign NOAA/CMDL expects to instrument 6 tall towers starting in 2004 with high accuracy continuous CO2 measurements, meteorological variables, and daily flask sampling (CO2, CH4, CO, H2, N2O, SF6, and isotopic ratios). Thus, estimates of N2O and CH4 fluxes will also be produced from the monitoring system. CMDL expects to fly vertical profiles twice a week with flask samples and continuous CO2, water vapor, temperature and ozone. Vertical profile locations will be coordinated with tall tower and flux measurement sites (Figure 1). Additional measurements on the tall towers will be CO and Radon-222, but both are contingent on the availability of suitable robust instrumentation. Development work is ongoing for the analysis of a suite of volatile organic compounds in the flask samples in addition to the species already measured. Perhaps additional tall towers will be added as a test of possible long-term sampling strategies.
In order to better define the large scale atmospheric concentration fields used by atmospheric models, CMDL has started in late 2003 two regular vertical profiles sites on the west coast, one in Texas on the Gulf coast, two on the east coast, and expects to add profiles over the BERMS site in Saskatchewan. The ground-based measurements elsewhere in the world will continue, with the addition of several volunteer observing ships (commercial vessels on regular routes) and NOAA hopes to add continuous CO2 and delta-pCO2 measurements on buoys in the coastal waters of North America.
A subset of the eddy covariance flux sites in the region will start making high accuracy CO2 mole fraction measurements by adopting careful calibration procedures. These measurements will be used to define mid-boundary layer concentrations under well-mixed conditions. The values will be compared to tall tower measurements and aircraft profiles in several cases.
2. Dedicated scientific aircraft. Two types of dedicated aircraft will play a role. A highly capable aircraft outfitted with a large suite of chemical measurements will probe the large-scale atmospheric variance of multiple species and their relationships. For example, CO and CH3CN are tracers for biomass burning, CO is in many cases also a good proxy for the recent addition of fossil fuel derived CO2, there is a whole series of anthropogenic tracers such as PCE, benzene, toluene, chlorinated compounds, certain ratios of hydrocarbons, and likewise plants and soils have their own characteristic emissions and deposition. In principle this allows for a considerable amount of air mass characterization, which will sharpen up the attribution for carbon sources/sinks (and will also have implications for air quality research). A second role for the “chemistry” aircraft is to fly patterns that will allow direct estimates of net CO2 uptake. An aircraft such as the Lear Jet is rated to fly in all weather conditions, and may need to fill in some of the large scale patterns when the airplanes regularly rented by CMDL can not fly. A second type of aircraft, especially the low- and slow flying Ultra-lights such as Sky Arrow, Long-EZ, can measure fluxes of CO2 and water vapor on relatively small scales.
79
12
3
456789
1011
12
1314151617181920
2122232425262728293031
32
333435363738394041
42
NACP Science Implementation Strategy
These results will be compared with flux measurement sites, crop model predictions and estimated patterns of evapotranspiration.
3. Biological measurements at intensive sites. Measurements at flux sites and other intensive sites should be made to develop biometric estimates of annual NEP, to estimate carbon stocks in soils to 1 m depth (labile and recalcitrant pools) and live and dead biomass, and to provide model parameters for the major biomes. Key variables for model parameters include leaf area index (summer maximum, timing of phenological changes), leaf and fine root C:N, litter quality, percent of leaf N in Rubisco, maximum stomatal conductance, leaf mass per unit leaf area (LMA), and others yet to be defined by the modeling community.
4. Long-term biological measurements at sites intermediate to inventories and intensive sites. The purpose of this level of intensity is to improve spatial representativeness of a limited set of more easily measured variables, such as aboveground biomass, tree height, leaf area index, and cover type. It will be coupled with remote sensing and modeling to reduce uncertainty in annual estimates of net carbon flux for geographic regions and land classes. Bottom-up models have difficulties incorporating site history effects on the spin-up to current carbon pools, thus carbon stocks in major components are needed for model improvement and data assimilation.
Soil respiration is a vital component of carbon fluxes, and is not easily accessible to observation from space. It is being measured at eddy covariance sites and with closed and open chamber methods. A possible strategy would be to measure CO2 at three depths within the soil, at ground level, just above the canopy, and at three heights up to 20 m. This could provide the capacity for continuous, robust measurements at a larger number of sites. It should be tested at an AmeriFlux site and an automated soil chamber site. If satisfactory, such systems could be placed at existing sites of the USDA Soil Climate Analysis Network and a subset of the benchmark sites (see below). The systems should operate throughout the year, helping to separate root respiration from soil respiration. The measurements at different depths help determine the site of root heterotrophic activity to assist in model development.
5. Inventories of carbon stocks. Benchmark permanent soil quality (low frequency) monitoring sites will, with sufficient spatial density, be able to detect 5-10 year trends in soil organic carbon that could result from changing management practices or other causes. They will be representative of the various soil types, climate, management regimes, and vegetation classes. Instrumentation and measurement techniques will be standardized for comparisons between sites. The grid setup will build on presently available long-term sites such as LTER and university and federal research stations. The latter sites have a wealth of long-term crop and soils data and in some cases ecosystem process data as well. Data from the new sites should greatly improve existing inventories.
80

123456789
10111213141516171819202122232425262728
29303132
33
3435363738394041424344
45
NACP Science Implementation Strategy
6. Bottom-up models. Some examples of the type of modeling approaches that will be necessary are given here. A crop growth model was run during the SMEX02 soil moisture investigation in Iowa. Inputs were detailed LANDSAT vegetation classification, MODIS 8-day composite reflectance, soil physical and chemical properties available from the STATSGO database, initial soil moisture status, and weather and climate data. Measured yields on selected fields were used to calibrate model yield parameters, and at the Walnut Creek Watershed crop yields have been compared with cumulative eddy covariance and soil flux measurements. A different type of model, the Century soil organic matter model uses databases for climate, soil properties, topography, and land use history, has crop growth and water submodels, predicts yields to estimate residue input to the soil, and predicts carbon and nitrogen in various soil compartments. The Atmosphere-Land Exchange Inverse (ALEXI) model uses GOES data, vegetation cover from satellites, and weather data (temperature, pressure, humidity) to estimate fluxes of sensible heat and water vapor on a daily basis. Visible in the resulting evapotranspiration maps are patterns that are coherent over large areas, sometimes as elongated bands more than a thousand km long and a few hundred km wide. When integrated with a canopy resistance model, daily predictions of carbon assimilation can be made. This approach has been developed furthest for crop systems. Coupling ALEXI with a Disaggregation approach (DisALEXI) using satellites with higher spatial resolution (Landsat, MODIS, ASTER) could provide real-time calibration of ALEXI using surface flux measurements by eddy covariance or gradient methods. Thus ground-based measurements could be integrated directly into large-scale flux estimates. In yet another possible approach, BIOME-BGC has been used to estimate daily GPP, NPP, and evapotranspiration, based in part on MODIS observations. Thus far it has been mostly applied to forested land, and more recently to grassland. A model such as SiB-2 simulates stomatal conductance, and thus the latent heat flux and the partitioning between latent and sensible heat fluxes, which has a significant influence on atmospheric dynamics. At the same time it provides GPP.
To the east and to the north of the intensive are extensive grassland and forested areas respectively. The atmospheric data will register the impact of those areas. Modeling of those ecosystems, including the use of flux measurements, maximizes use of the data gathered in the campaign and likely improves the results for cropland areas.
7. Transport models. Needed for converting observed concentration patterns into source estimates are atmospheric transport models. Assimilated meteorological data at the highest resolution available from weather forecast models will be essential. Important current weaknesses are convective mixing, detailed land surface description including the physiological response of vegetation, mixing and stability of the nocturnal boundary layer, (lack of) conservation of tracer mass, representation and impact of cloud systems. The meteorological fields and mixing schemes will be used to calculate the transport of species in global models, high-resolution regional models, and in nested models (e.g. MM5, RAMS, TM5), all run in inverse mode. Receptor models such as STILT also use assimilated meteorological data, and they provide yet another way to estimate sources.
81

123456
7
89
101112131415161718192021
22
23
242526272829
NACP Science Implementation Strategy
8. Land use and history. The Landsat Thematic Mapper has been in use since 1982, and can give a comprehensive picture for the last two decades. USDA Forest Service inventory data for forests (FIA), county level data from the National Resource Inventory and the USDA National Agricultural Statistics Service can be used for data before 1982, and as a crosscheck of the Landsat data. MODIS data also give a comprehensive view of current land use, but there are only a few classes.
9. Fossil fuel inventory. Data for fossil fuel use need to be separated by type (coal, oil, and natural gas), and algorithms need to be developed to disaggregate their use into more detailed spatial and temporal patterns, including large point sources such as power plants. It may help that in the area of the intensive campaign the population density is relatively low, and that there are some very concentrated metropolitan areas nearby (Minneapolis/St. Paul, Chicago, St. Louis, Kansas City). This will give opportunities for verification of the use algorithms, chemical signatures, and perhaps even the magnitude of the emissions. The large fossil fuel component will have to be quantitatively accounted for when annual estimates of carbon sequestration/loss are made for a region. In addition, since September 2000 there is an ongoing geological sequestration project whereby CO2 from a synfuels plant in Beulah, N. Dakota, is injected into the Weyburn oil field in south eastern Saskatchewan. Every day, the emissions equivalent of 100,000 people is injected into the 180 km2 oil field. If there are significant leaks they would be detectable in the amount of CO2 and possibly its isotopic signature.
Figure 1. U.S. upper Midwest and southern Canada. Yellow dots: metropolitan areas; red squares: eddy covariance flux measurement sites; blue: TV and FM towers taller than 800 ft and up to 2000 ft, with length of vertical line indicating height of tower; numerals 2, 3, 5, 7 indicating the (possible) location of frequent vertical profiles by aircraft, existing before 2002, starting in 2003, etc. [See next page.]
82