Science-Driven Visualization Research Challenges 9 Nov 2004 SC2004 – Pittsburgh PA Wes Bethel with...
76
Science-Driven Visualization Science-Driven Visualization Research Challenges Research Challenges 9 Nov 2004 9 Nov 2004 SC2004 – Pittsburgh PA SC2004 – Pittsburgh PA Wes Bethel Wes Bethel with help from Friends at with help from Friends at Lawrence Berkeley National Laboratory Lawrence Berkeley National Laboratory vis.lbl.gov vis.lbl.gov
-
Upload
braeden-farmer -
Category
Documents
-
view
213 -
download
0
Transcript of Science-Driven Visualization Research Challenges 9 Nov 2004 SC2004 – Pittsburgh PA Wes Bethel with...
Science-Driven VisualizationScience-Driven VisualizationResearch ChallengesResearch Challenges
9 Nov 20049 Nov 2004SC2004 – Pittsburgh PASC2004 – Pittsburgh PA
Wes BethelWes Bethelwith help from Friends atwith help from Friends at
Lawrence Berkeley National LaboratoryLawrence Berkeley National Laboratoryvis.lbl.govvis.lbl.gov

OutlineOutline
• Science-driven Visualization Challenges.Science-driven Visualization Challenges.• LBNL Visualization ResearchLBNL Visualization Research
• Remote, Distributed and High Performance Visualization.
• Domain-specific solutions for scientific research.
• Computer Science research.
• Conclusion and Future DirectionsConclusion and Future Directions

OutlineOutline
• Science-driven Visualization Challenges.Science-driven Visualization Challenges.
• LBNL Visualization ResearchLBNL Visualization Research• Remote, Distributed and High Performance
Visualization – Introduction and Approach.
• Domain-specific solutions for scientific research.
• Computer Science research.
• Conclusion and Future DirectionsConclusion and Future Directions

Science-Drive Visualization Challenges – Outline Science-Drive Visualization Challenges – Outline
• Role of visualization in science, and what Role of visualization in science, and what users really want?users really want?
• Challenges of user needs.Challenges of user needs.
• What efforts targeted at meeting those What efforts targeted at meeting those needs?needs?
• Is the current approach meeting user Is the current approach meeting user needs?needs?

Role of Visualization in ScienceRole of Visualization in Science
An instrument to “see An instrument to “see data” that is data” that is otherwise unseeable.otherwise unseeable.
A vehicle to A vehicle to communicate communicate findings and results.findings and results.
Plays an integral part of Plays an integral part of the scientific process the scientific process and scientific and scientific workflows.workflows.
Something doesn’t “look right” in this picture – what happened?

Introduction – The Scientific Process and WorkflowsIntroduction – The Scientific Process and Workflows
Hypothesize – Hypothesize – experiment/test – refine.experiment/test – refine.
Workflows are the Workflows are the sequence of tasks in sequence of tasks in the scientific process.the scientific process.
Visualization serves as Visualization serves as the “instrument” to aid the “instrument” to aid in “seeing results” at in “seeing results” at each stage in the each stage in the workflow.workflow.

What Do (Science) Users Need?What Do (Science) Users Need?
• Easy to use software.Easy to use software.
• That is free (and works).That is free (and works).
• That is supported.That is supported.
• Help learning/using/applying the software to Help learning/using/applying the software to their problem. their problem.
• New visualization capabilities for their problem.New visualization capabilities for their problem.
• Support for remote and distributed operations, Support for remote and distributed operations, capacity to analyze large and complex data.capacity to analyze large and complex data.

Challenges of User NeedsChallenges of User Needs
• For many modern computational science projects, For many modern computational science projects, there exists no “canned” visualization solution. Tools there exists no “canned” visualization solution. Tools and technology must be created.and technology must be created.
• Such efforts require expertise in a wide range of Such efforts require expertise in a wide range of specialties: computer science, software engineering, specialties: computer science, software engineering, cognitive science, people skills, etc.cognitive science, people skills, etc.
• Creating such tools requires close and ongoing effort Creating such tools requires close and ongoing effort between researchers of many disciplines.between researchers of many disciplines.
• Few, if any, “standards” to help provide a stable Few, if any, “standards” to help provide a stable environment for visualization.environment for visualization.
Science-Drive Visualization Research Problem StatementScience-Drive Visualization Research Problem Statement
• Trend is towards remote and distributed Trend is towards remote and distributed data analysis and visualization.data analysis and visualization.
• Domain-specific solutions required.Domain-specific solutions required.
• Such solutions are inherently Such solutions are inherently multidisciplinary and extremely complex.multidisciplinary and extremely complex.

Efforts Targeted at Meeting Science NeedsEfforts Targeted at Meeting Science Needs
• Individual P.I. Funded to perform some visualization Individual P.I. Funded to perform some visualization research.research.• A fraction of a P.I. and a graduate student.
• Publish a research paper, might release a research prototype of their software (or might not).
• Their reward is the technical publication.
• Institutional visualization support.Institutional visualization support.• NERSC, ASCI/Views, etc.
• Missing: large, program-wide coordination of activities.Missing: large, program-wide coordination of activities.

Does the Current Approach Work?Does the Current Approach Work?

Does the Current Approach Work?Does the Current Approach Work?
Sloan Digital Sky Sloan Digital Sky Survey PortalSurvey Portal
• Interface and Interface and operations operations tailored to tailored to astronomy astronomy community.community.

Does the Current Approach Work?Does the Current Approach Work?
• Generally, no:Generally, no:• Duplication of effort across disparate programs.
• Little impetus to share work, to leverage others work.
• What’s Missing?What’s Missing?• Critical visualization infrastructure: community-centric data models,
fungible visualization technology that can be shared and reused across program areas.
• Program-wide emphasis upon coordinated visualization activities.
• Requires conscious engineering – coordinated activities will not “emerge” from many small visualization projects.

OutlineOutline
• Science-driven Visualization Challenges.Science-driven Visualization Challenges.
• LBNL Visualization ResearchLBNL Visualization Research• Remote, Distributed and High Performance
Visualization – Introduction and Approach.
• Domain-specific solutions for scientific research.
• Computer Science research.
• Conclusion and Future DirectionsConclusion and Future Directions

LBNL Visualization Research – Outline LBNL Visualization Research – Outline
• The LBNL Visualization Research Vision.The LBNL Visualization Research Vision.
• The Research Strategy and Tactics.The Research Strategy and Tactics.
• Near-term and long-term goals.Near-term and long-term goals.
• Results:Results:• Domain-specific solutions.
• Remote and Distributed visualization research results.
• Computer Science Research.

LBNL Visualization Research VisionLBNL Visualization Research Vision
Shaky City Data Caches HPC Resources
Sensor Nets
Simulations
STM
HandheldDevicesDr Jane
Collaborators

Problem Statement – Repeated Problem Statement – Repeated
• Trend is towards remote and distributed Trend is towards remote and distributed data analysis and visualization.data analysis and visualization.
• Domain-specific solutions required.Domain-specific solutions required.
• Such solutions are inherently Such solutions are inherently multidisciplinary and extremely complex.multidisciplinary and extremely complex.

Research Challenges for Remote and Distributed VisualizationResearch Challenges for Remote and Distributed Visualization
• Community-centric data models, Community-centric data models, component interfaces, execution component interfaces, execution frameworks.frameworks.
• Visualization algorithms, delivery Visualization algorithms, delivery mechanisms.mechanisms.
• Effective and simplified use of parallel and Effective and simplified use of parallel and distributed resources.distributed resources.

LBNL Visualization Research StrategyLBNL Visualization Research Strategy
• Map the canonical visualization pipeline Map the canonical visualization pipeline into remote & distributed use model.into remote & distributed use model.
Shaky City Data Caches HPC Resources
Sensor Nets
Simulations
STM
HandheldDevices
Dr Jane
Collaborators

LBNL Visualization Research TacticsLBNL Visualization Research Tactics
• Close relationships with DOE science Close relationships with DOE science projects to deliver domain-specific (useful) projects to deliver domain-specific (useful) technologies.technologies.
• Research advances on the visualization Research advances on the visualization pipeline to realize the dream of “vis pipeline to realize the dream of “vis anywhere, anytime, by anybody.”anywhere, anytime, by anybody.”
• Fundamental CS research to complement Fundamental CS research to complement visualization research.visualization research.

LBNL Visualization Research Tactics LBNL Visualization Research Tactics
• Components encapsulate algorithms, Components encapsulate algorithms, frameworks marshal data and mediate frameworks marshal data and mediate execution (see HECRTF).execution (see HECRTF).
• Bottom-up: focus on specific application-Bottom-up: focus on specific application-driven projects. E.g., Accelerator SciDAC.driven projects. E.g., Accelerator SciDAC.

LBNL Visualization Research TacticsLBNL Visualization Research Tactics
• Distributed and parallel architectures offer Distributed and parallel architectures offer new algorithmic opportunities (Visapult).new algorithmic opportunities (Visapult).
• Interaction methodology important for Interaction methodology important for large data exploration, cuts across data large data exploration, cuts across data management, visualization, applications.management, visualization, applications.
• Delivery mechanisms are “the handles” Delivery mechanisms are “the handles” provided to the user to guide data provided to the user to guide data exploration and analysis.exploration and analysis.

OutlineOutline
• Science-driven Visualization Challenges.Science-driven Visualization Challenges.
• LBNL Visualization ResearchLBNL Visualization Research• Remote, Distributed and High Performance
Visualization – Introduction and Approach.
• Domain-specific solutions for scientific research.
• Computer Science research.
• Conclusion and Future DirectionsConclusion and Future Directions

Domain-Specific SolutionsDomain-Specific Solutions
• 2121stst Century Accelerator Modeling Century Accelerator Modeling (SciDAC)(SciDAC)
• Center for Extended MHD (SciDAC)Center for Extended MHD (SciDAC)• Protein Structure PredictionProtein Structure Prediction

Accelerator Simulation VisualizationAccelerator Simulation Visualization
• Data: time-varying, 6D, multi-species.Data: time-varying, 6D, multi-species.
• Typical visualization: scatter plots of one Typical visualization: scatter plots of one dimension against another. E.g., x-dimension against another. E.g., x-position vs. x-phase.position vs. x-phase.
• Need: ability to explore, to subset, to Need: ability to explore, to subset, to visually comprehend science.visually comprehend science.
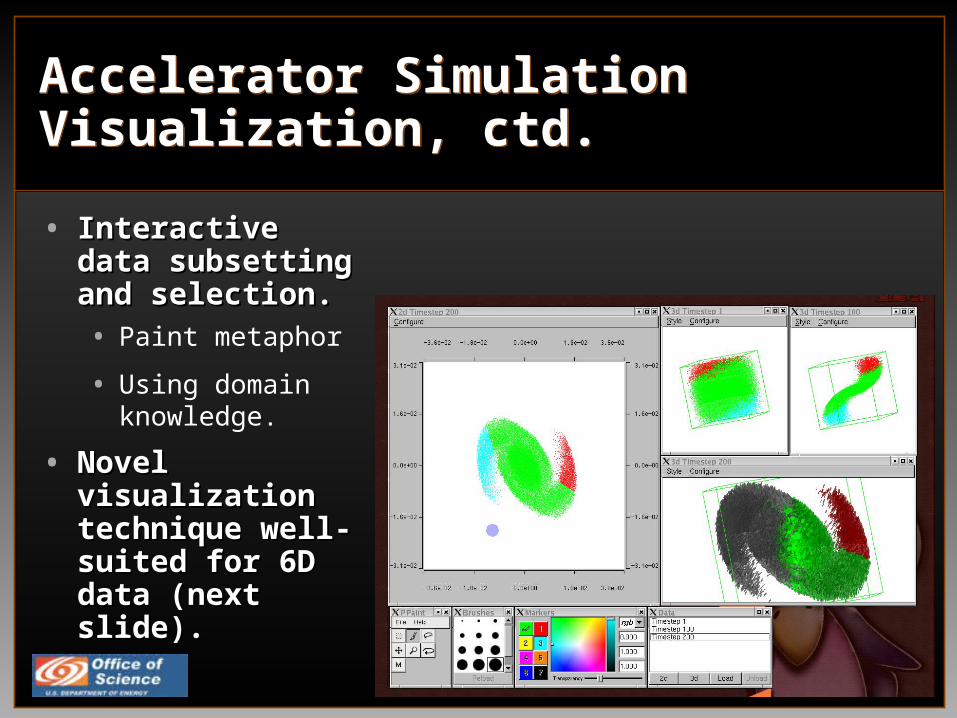
Accelerator Simulation Visualization, ctd.Accelerator Simulation Visualization, ctd.
• Interactive data Interactive data subsetting and subsetting and selection.selection.• Paint metaphor
• Using domain knowledge.
• Novel visualization Novel visualization technique well-technique well-suited for 6D data suited for 6D data (next slide).(next slide).

Accelerator Simulation Visualization, ctd.Accelerator Simulation Visualization, ctd.
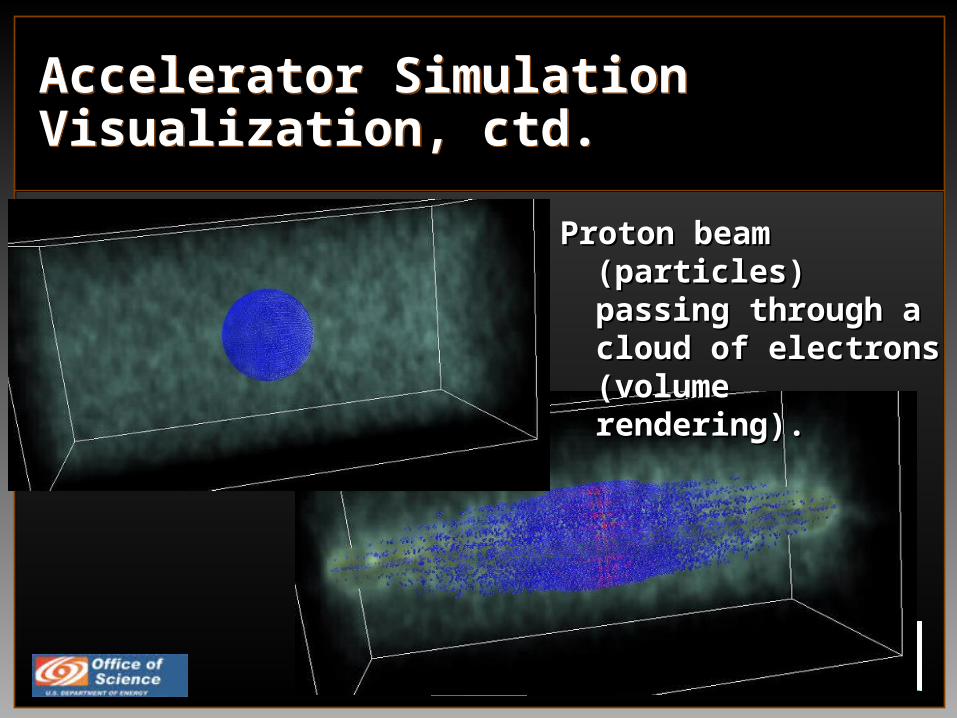
Accelerator Simulation Visualization, ctd.Accelerator Simulation Visualization, ctd.
Proton beam (particles) Proton beam (particles) passing through a passing through a cloud of electrons cloud of electrons (volume rendering).(volume rendering).
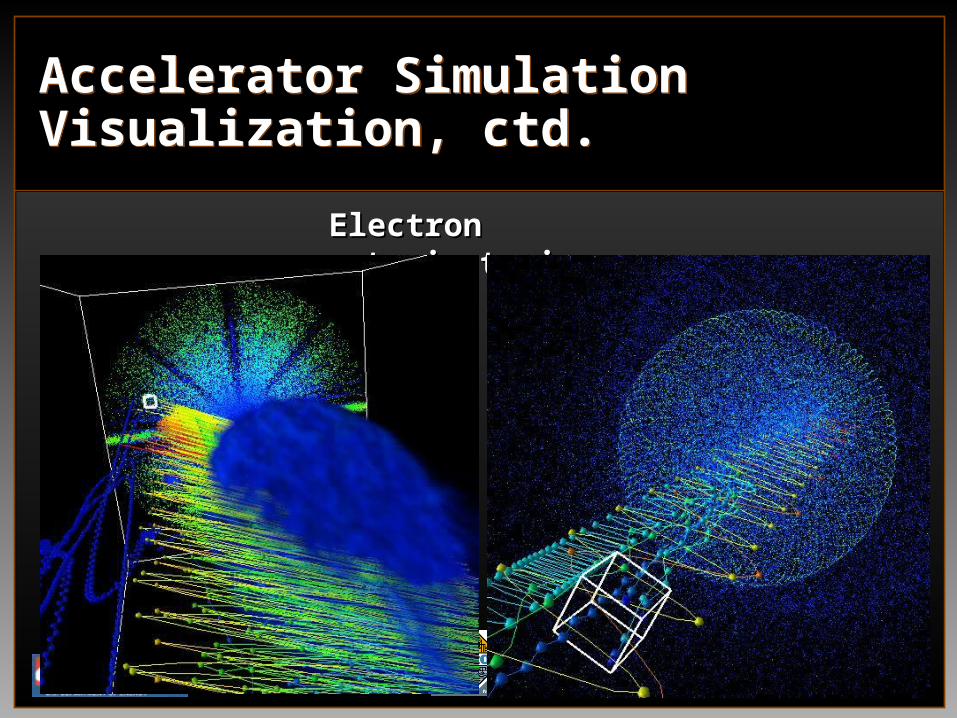
Accelerator Simulation Visualization, ctd.Accelerator Simulation Visualization, ctd.
Electron trajectoriesElectron trajectories

Accelerator Modeling: Remote and High Performance Visual AnalysisAccelerator Modeling: Remote and High Performance Visual Analysis
• User-requested User-requested domain-specific domain-specific tool for browsing tool for browsing data.data.
• Distributed, Distributed, pipelined pipelined architecture to architecture to scale with scale with increasing data increasing data sizes.sizes.
workstationRemote data
storage
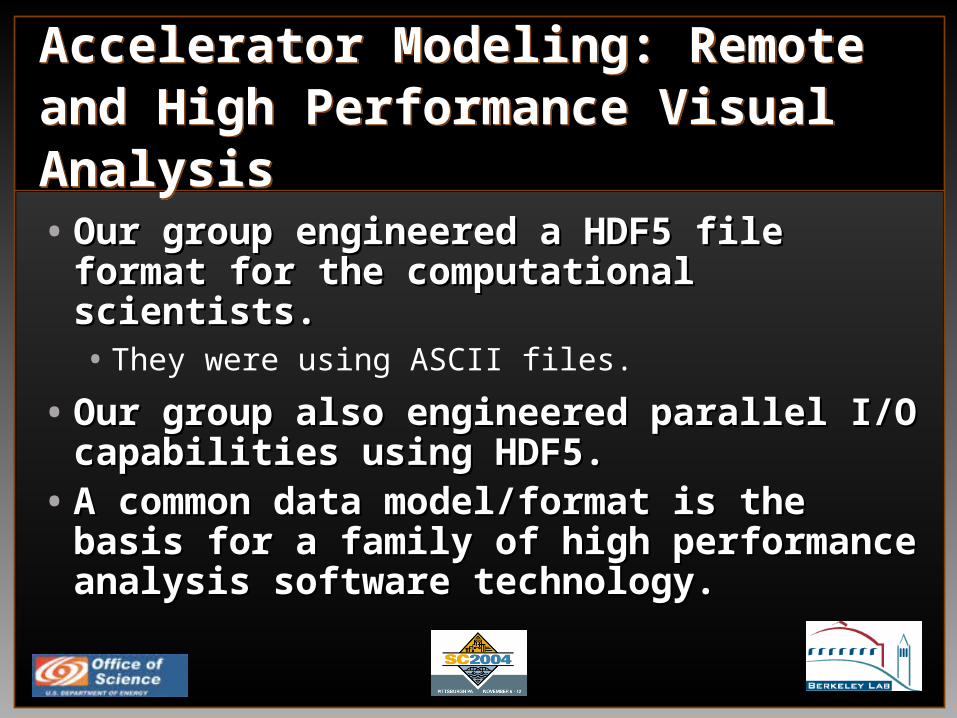
Accelerator Modeling: Remote and High Performance Visual AnalysisAccelerator Modeling: Remote and High Performance Visual Analysis
• Our group engineered a HDF5 file format Our group engineered a HDF5 file format for the computational scientists.for the computational scientists.• They were using ASCII files.
• Our group also engineered parallel I/O Our group also engineered parallel I/O capabilities using HDF5.capabilities using HDF5.
• A common data model/format is the basis A common data model/format is the basis for a family of high performance analysis for a family of high performance analysis software technology.software technology.

Accelerator Modeling Visualization: ConclusionAccelerator Modeling Visualization: Conclusion
• Close interaction with scientists resulted in Close interaction with scientists resulted in domain-specific technologies as well as new domain-specific technologies as well as new visualization research.visualization research.
• The “unglamorous work” of data The “unglamorous work” of data models/formats and I/O is the underpinning models/formats and I/O is the underpinning for the much of the project.for the much of the project.
• We are in a good position to move forward We are in a good position to move forward with additional tools based upon a with additional tools based upon a community-centric data model.community-centric data model.
Remote Visualization of Fusion Simulation ResultsRemote Visualization of Fusion Simulation Results
Problems: Problems: • Simulations run at centralized supercomputing
facilities generate large, complex data.
• Analysis to be performed by remotely located scientists.
• Science teams are themselves geographically distributed, and have requested some form of collaborative investigation/visualization.

Remote Visualization of Fusion Simulation ResultsRemote Visualization of Fusion Simulation Results
Approach:Approach:• Use high performance, parallel resources located
“close to” the data.
• Where plausible, retain the high performance rendering capabilities of desktop workstations.
• Partition the visualization pipeline (more later) across sites in multiple ways. Which works best?
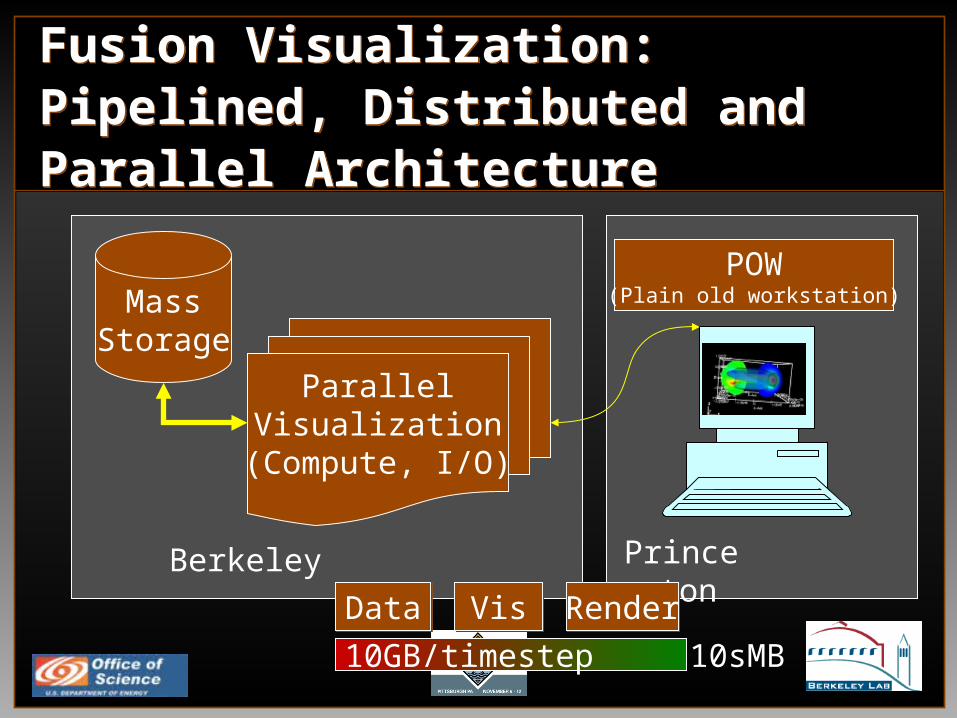
Fusion Visualization: Pipelined, Distributed and Parallel ArchitectureFusion Visualization: Pipelined, Distributed and Parallel Architecture
MassStorage
ParallelVisualization
(Compute, I/O)
POW(Plain old workstation)
PrincetonBerkeley
DataData VisVis RenderRender
10GB/timestep 10sMB

Fusion Visualization: Pipelined, Distributed and Parallel ArchitectureFusion Visualization: Pipelined, Distributed and Parallel Architecture
• High capacity I/O and compute High capacity I/O and compute located “near” large data source.located “near” large data source.

Collaborative VisualizationCollaborative Visualization
• Rapid inspection of data too Rapid inspection of data too large to move:large to move:
• Saves having to transfer 100s of Saves having to transfer 100s of GB across country.GB across country.
• Multiple simultaneous Multiple simultaneous participants (roundtable model).participants (roundtable model).
EscherEscherEnsight
Server-of-ServersEnsight
Server-of-ServersPPPLPPPL
Ensight ClientEnsight Client
PPPLPPPL
Ensight ClientEnsight Client
LBLLBL
Ensight ClientEnsight ClientDataData VisVis RenderRender
10GB/timestep 10sMB

Remote Fusion Simulation Visualization – Sending ImagesRemote Fusion Simulation Visualization – Sending Images
• ~50fps 800x600, 24-bpp~50fps 800x600, 24-bpp• Over 100BaseT, low latency connection
(LAN)
• Freely running image generator – only framebuffer contents sent; no mouse events, etc.
• Frame rate relatively insensitive to compression algorithm, as long as some compression is used.
• 4-5fps “full screen interactive 4-5fps “full screen interactive application”application”• 100BaseT Ethernet, 50ms latency (WAN
between LBNL – PPPL)
• Interactive application.
DataData VisVis RenderRender
10GB/timestep 10sMB

4-5fps “not unexpected”4-5fps “not unexpected”
• 50 ms one-way latency is 100ms RTT50 ms one-way latency is 100ms RTT
• Maximum possible frame rate: 10fpsMaximum possible frame rate: 10fps
• Add in more latency due to fb reads, detect and Add in more latency due to fb reads, detect and package mouse events, etc. package mouse events, etc.
• Conclusion: latency is a killer.Conclusion: latency is a killer.

Frame Rate Limit Due to Latency:1000/2*latencyMS.
Frame Rate Limit Due to Latency:1000/2*latencyMS.
Time
50ms 50ms
A B C/A B
A – user drags the mouse, mouse event sent to server.B – “instantaneous” frame render, grab, compress, send and
receipt by client.C – client decompresses, displays image, grabs next mouse
event, etc.

Fusion Visualization: ConclusionsFusion Visualization: Conclusions
• Using high capacity visualization Using high capacity visualization resources located “close to” the source resources located “close to” the source data for remote use appears promising.data for remote use appears promising.
• Different approaches, each with Different approaches, each with advantages and disadvantages.advantages and disadvantages.
• Functional results: good.Functional results: good.
• Performance results: mixed. Performance results: mixed.

Protein Structure Prediction OutlineProtein Structure Prediction Outline
• Problem Description.Problem Description.
• Approaches to help solve an NP-hard Approaches to help solve an NP-hard problem: problem: • Better initial configurations.
• Visualization and intervention to guide optimizations.
Protein Structure PredictionProtein Structure Prediction
ChallengesChallenges• Protein structure prediction is difficult (NP-hard) – it
is one of the grand challenges in computational biology.
• Visualization and interactive techniques can accelerate the process.
• No “off-the-shelf” technologies exist – they must be created.
Protein Structure Prediction, ctd.Protein Structure Prediction, ctd.
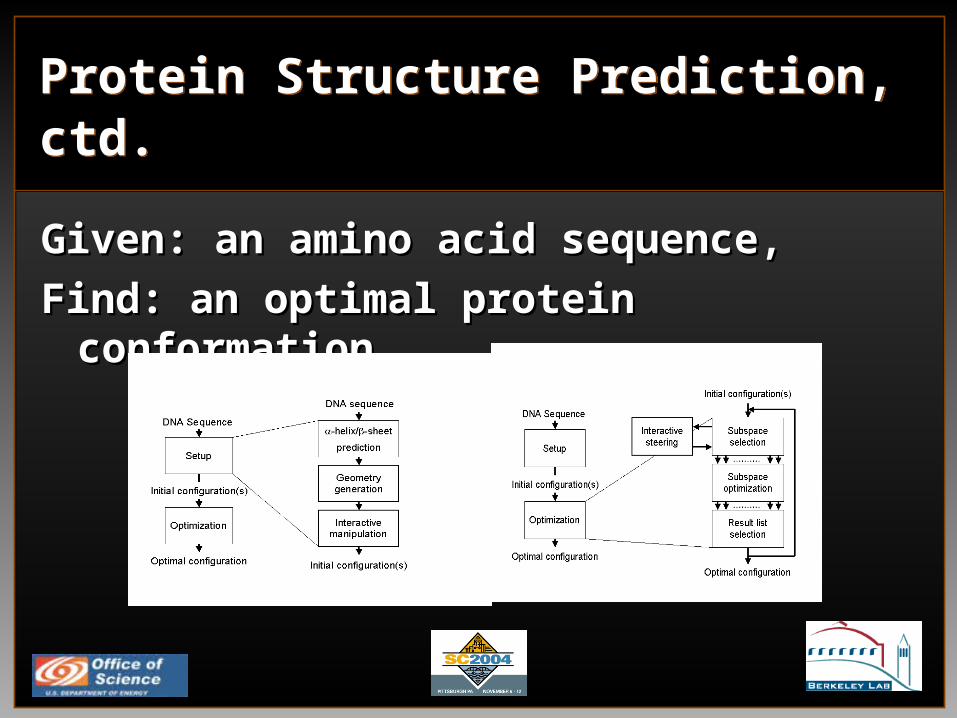
Given: an amino acid sequence,Given: an amino acid sequence,
Find: an optimal protein conformation.Find: an optimal protein conformation.

Protein Structure Prediction, ctd.Protein Structure Prediction, ctd.
Problem: Problem: what is the what is the minimal-energy structure of minimal-energy structure of a sequence of amino acids?a sequence of amino acids?
Solution: Solution: Nature knows, but Nature knows, but computing an answer is NP-computing an answer is NP-hard (not solvable).hard (not solvable).
Approach: Approach: Human-guided Human-guided setup, computer-aided setup, computer-aided energy optimization and energy optimization and minimization.minimization.
Conf: 99999999999999999999999999999999999 Pred: HHHHHHHCCCEEEEEEECCCEEEEEEEECCCCCCC AA: FKQYANDNGVDGVWTYDDATKTFTVTEMVTEVPVA

Protein Structure Prediction, ctd.Protein Structure Prediction, ctd.

Protein Structure Prediction, ctd.Protein Structure Prediction, ctd.
Optimization and Optimization and computational computational steeringsteering
Initial configurations Initial configurations used as “seed used as “seed points” for points” for optimization.optimization.
Intermediate results – Intermediate results – the “search tree” – the “search tree” – is displayed for is displayed for inspection.inspection.
A human may intervene A human may intervene in the optimization.in the optimization.
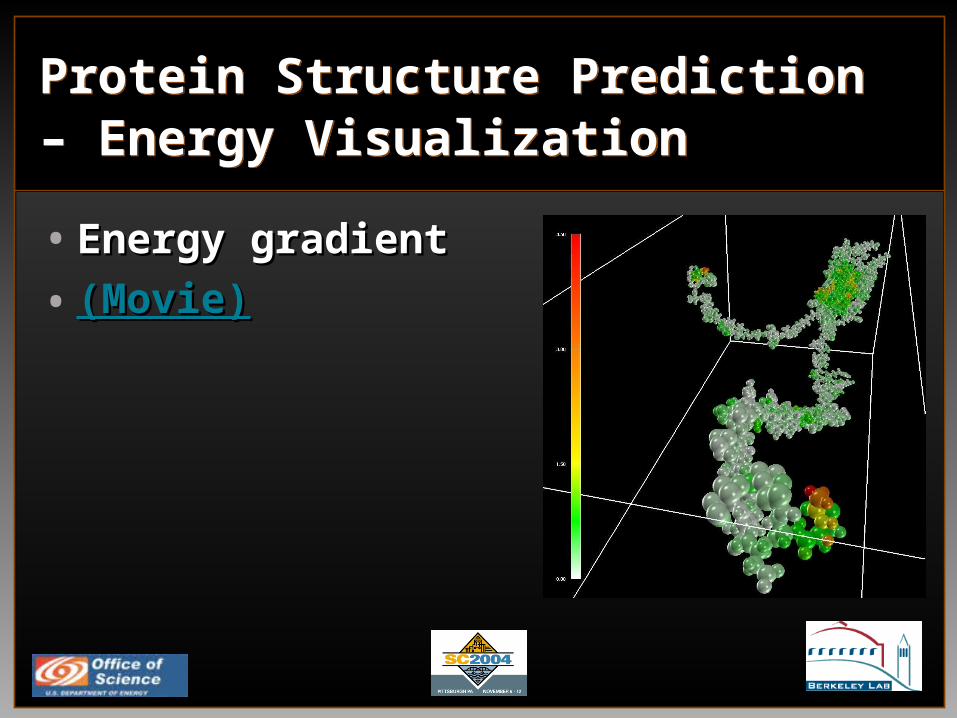
Protein Structure Prediction – Energy VisualizationProtein Structure Prediction – Energy Visualization
• Energy gradientEnergy gradient
• (Movie)(Movie)

Protein Structure Prediction – Energy VisualizationProtein Structure Prediction – Energy Visualization
• Movie

Protein Structure Prediction – ConclusionProtein Structure Prediction – Conclusion
• Increased scientific capacity and Increased scientific capacity and capability.capability.• CASP4 2000 – days; CASP6 2004 – hours.
• New scientific opportunities:New scientific opportunities:• Multiple molecule interactions – drug design.
• Visualization impact:Visualization impact:• Best Application Paper award, IEEE Visualization
2003.

OutlineOutline
• Science-driven Visualization Challenges.Science-driven Visualization Challenges.
• LBNL Visualization ResearchLBNL Visualization Research• Remote, Distributed and High Performance
Visualization – Introduction and Approach.
• Domain-specific solutions for scientific research.
• Computer Science research.
• Conclusion and Future DirectionsConclusion and Future Directions
Computer Science/Visualization Research - OutlineComputer Science/Visualization Research - Outline
• Research Challenges.Research Challenges.
• Query-based visualization.Query-based visualization.
• Desktop delivery R&D.Desktop delivery R&D.
• Remote and distributed visualization Remote and distributed visualization pipeline optimization.pipeline optimization.

Fundamental Remote and Distributed
Visualization Research Challenges
Fundamental Remote and Distributed
Visualization Research Challenges
• Fungible technologies for creating visualization Fungible technologies for creating visualization
applications.applications.
• Components, data/application adapters, vis-centric network
transport, resource discovery/allocation, dynamic application
construction, decoupling UI from vis/analysis “engine,”
decoupling execution control from component architecture.
• Community-centric data models.Community-centric data models.
• Multi-resolution and progressive analysis/vis.Multi-resolution and progressive analysis/vis.

Fundamental Remote and Distributed
Visualization Research Challenges,
ctd.
Fundamental Remote and Distributed
Visualization Research Challenges,
ctd.• More interactions with other communities: More interactions with other communities:
science applications, data management and data science applications, data management and data
analysis.analysis.
• Long-term deployment and maintenance Long-term deployment and maintenance
strategy.strategy.
• Community and programmatic focus on Community and programmatic focus on
technology interoperability.technology interoperability.

Query-Driven Visualization (Dex)Query-Driven Visualization (Dex)
• Combine Visualization Combine Visualization with SDM technology to with SDM technology to accelerate visualization accelerate visualization and analysis.and analysis.
• Select data based upon Select data based upon boolean queries.boolean queries.
• Only visualize/analyze Only visualize/analyze data that meets query data that meets query criteria.criteria.

Remote Desktop Delivery – Thin
Client
Remote Desktop Delivery – Thin
Client
• QuickTime VRQuickTime VR• Panorama Movies
• Object Movies• Two axis, time-varying.
• QTVR:QTVR:• Industry standard
• Freely available players (except Linux!).
• LBNL ContributionLBNL Contribution• Object-movie encoder.
• Current research – multi-resolution-capable.

Visualization Pipeline OptimizationVisualization Pipeline Optimization
• Context: many heterogeneous, distributed Context: many heterogeneous, distributed
resources.resources.
• Goal: user wants to take advantage of Goal: user wants to take advantage of
distributed resources to solve a problem.distributed resources to solve a problem.
• Problem(s): need to select a set of resources to Problem(s): need to select a set of resources to
meet the task at hand.meet the task at hand.

Visualization Pipeline OptimizationVisualization Pipeline Optimization
• Problem: component placement on Problem: component placement on distributed resources changes as a distributed resources changes as a function of both performance target and function of both performance target and specific data.specific data.
• Problem: distributed applications Problem: distributed applications launched “by hand,” resource placement launched “by hand,” resource placement performed “by hand.”performed “by hand.”
Performance Modeling and Pipeline OptimizationPerformance Modeling and Pipeline Optimization
• Approach: model performance of Approach: model performance of individual components, optimize individual components, optimize placement as a function of performance placement as a function of performance target.target.
• Goal: automate the process of placing Goal: automate the process of placing components on distribute resources.components on distribute resources.
• Results: quadratic order algorithm, high Results: quadratic order algorithm, high degree of accuracy.degree of accuracy.

Performance Modeling and Pipeline OptimizationPerformance Modeling and Pipeline Optimization
• Render RemoteRender Remote• Move images:
• setenv DISPLAY• SGI’s Vizserver
• Data too big to move.
• Render LocalRender Local• Move data
• ftp, scp• Logistical
networking
• Hybrid approachesHybrid approaches• Move “vis results” for
local rendering
• CEI’s Ensight, Visapult
Data Visualization DisplayRender
Data Visualization DisplayRender
Data Visualization DisplayRender
Your WorkstationNERSC

Pipeline Optimization – User ViewPipeline Optimization – User View
• Goal: simplify use of distributed Goal: simplify use of distributed visualization resources.visualization resources.
Shaky City Data Caches HPC Resources
Sensor Nets
Simulations
STM
HandheldDevices
Dr Jane
Collaborators

Visualization Pipeline Optimization – OverviewVisualization Pipeline Optimization – Overview
• Obtain/derive performance measurements Obtain/derive performance measurements for pipeline components.for pipeline components.
• Automatically select placement of tasks on Automatically select placement of tasks on distributed resources to meet performance distributed resources to meet performance objectives.objectives.

Performance Modeling and Pipeline OptimizationPerformance Modeling and Pipeline Optimization
• Single workflow:Single workflow:• Reader -> Isosurface -> Render
• Reader performance: Reader performance: • Function of:
• Data Size• Machine constant
• Treader (nv) = nv * Creader

Performance Modeling and Pipeline OptimizationPerformance Modeling and Pipeline Optimization
• Render Performance:Render Performance:• Function of:
• Number of triangles,
• Machine constant.
• Trender = nt * Crender + Treadback

Performance Modeling and Pipeline OptimizationPerformance Modeling and Pipeline Optimization
• Isosurface Performance:Isosurface Performance:• Function of:
• Data set size,
• Number of triangles generated (determined by combination of dataset and isocontour level).
• Dominated number of triangles generated!
• Tiso(nt,nv) = nv * Cbase + nt * Ciso

Performance Modeling and Pipeline OptimizationPerformance Modeling and Pipeline Optimization
• Precompute Precompute histogram of histogram of data values.data values.
• Use histogram to Use histogram to estimate number estimate number of triangles as a of triangles as a function of iso function of iso level.level.
Performance Modeling and Pipeline OptimizationPerformance Modeling and Pipeline Optimization
• Performance targets:Performance targets:• Optimize for interactive transformation.
• Optimize for changing isocontour level.
• Optimize for data throughput.

Performance Modeling and Pipeline OptimizationPerformance Modeling and Pipeline Optimization
• Pipeline Configurations:Pipeline Configurations:• Render local – send data to workstation.
• Render remote – send images to workstation.
• Hybrid – send triangles to workstation.

Performance Modeling and Pipeline OptimizationPerformance Modeling and Pipeline Optimization
• Optimize placement Optimize placement using Djikstra’s using Djikstra’s shortest path shortest path algorithm.algorithm.
• Edge weights Edge weights assigned based assigned based upon performance upon performance target.target.
• Low-cost algorithm:Low-cost algorithm:O(E + VlogV)

Performance Modeling and Pipeline Optimization - ConclusionsPerformance Modeling and Pipeline Optimization - Conclusions
• ““Microbenchmarks” to estimate individual Microbenchmarks” to estimate individual component performance.component performance.• Per-dataset statistics can be precomputed and saved with the
dataset.
• Quadratic-order workflow-to-resource placement Quadratic-order workflow-to-resource placement algorithm.algorithm.
• Optimizes pipeline performance for an specific Optimizes pipeline performance for an specific interaction target – relieves users from task of interaction target – relieves users from task of manual resource selection.manual resource selection.

OutlineOutline
• Science-driven Visualization Challenges.Science-driven Visualization Challenges.
• LBNL Visualization ResearchLBNL Visualization Research• Remote, Distributed and High Performance
Visualization – Introduction and Approach.
• Domain-specific solutions for scientific research.
• Computer Science research.
• Conclusion and Future DirectionsConclusion and Future Directions

ConclusionsConclusions
• Close collaboration with applications Close collaboration with applications produces usable, focused visualization produces usable, focused visualization technologies.technologies.
• Such collaborations are long-term Such collaborations are long-term relationships.relationships.• How to formalize and sustain such relationships?

ConclusionsConclusions
• Component-based development holds Component-based development holds much promise (see HECRTF).much promise (see HECRTF).
• Underpinnings:Underpinnings:• Community-centric data models.
• Interactive, parallel, distributed execution framework.

ConclusionsConclusions
• Opportunity to move towards technology sharing Opportunity to move towards technology sharing and reuse, especially for visualization and reuse, especially for visualization community.community.
• Produce usable, long-lived visualization Produce usable, long-lived visualization technology for applications.technology for applications.
• Need for cross-program bridges – one form is Need for cross-program bridges – one form is stable infrastructure underpinnings based upon stable infrastructure underpinnings based upon common component interfaces and community common component interfaces and community centric data models. centric data models.

SummarySummary
LBNL has a world-class Visualization R&D LBNL has a world-class Visualization R&D program that has a balanced and effective program that has a balanced and effective having an emphasis upon remote, distributed having an emphasis upon remote, distributed and high performance visualization, and meeting and high performance visualization, and meeting the needs of science.the needs of science.
Visit us on the web at http://vis.lbl.gov/Visit us on the web at http://vis.lbl.gov/
This work was supported by the Director, Office of Science, of the This work was supported by the Director, Office of Science, of the
U.S. Department of Energy under Contract No. DE-AC03-76SF00098.U.S. Department of Energy under Contract No. DE-AC03-76SF00098.

The EndThe End