Science and Engineering Indicators 2016 - NSF · First university natural sciences and engineering...
102
2 | 1 National Science Board | Science & Engineering Indicators 2016 Chapter 2. Higher Education in Science and Engineering Table of Contents Highlights ...................................................................................................................................... 2-4 Characteristics of the U.S. Higher Education System .................................................................... 2-4 Undergraduate Education, Enrollment, and Degrees ..................................................................... 2-5 Graduate Education, Enrollment, and Degrees ............................................................................. 2-6 International S&E Higher Education ............................................................................................ 2-7 Introduction .................................................................................................................................. 2-9 Chapter Overview .................................................................................................................... 2-9 Chapter Organization ............................................................................................................... 2-9 The U.S. Higher Education System ............................................................................................... 2-10 Institutions Providing S&E Education ........................................................................................ 2-10 Trends in Higher Education Expenditures and Revenues .............................................................. 2-20 Financing Higher Education ..................................................................................................... 2-29 Undergraduate Education, Enrollment, and Degrees in the United States ..................................... 2-39 Undergraduate Enrollment in the United States .......................................................................... 2-39 Undergraduate Degree Awards ................................................................................................ 2-50 Graduate Education, Enrollment, and Degrees in the United States .............................................. 2-58 Graduate Enrollment by Field .................................................................................................. 2-58 S&E Master's Degrees ............................................................................................................ 2-61 S&E Doctoral Degrees ............................................................................................................ 2-65 International S&E Higher Education ............................................................................................. 2-80 Higher Education Expenditures ................................................................................................ 2-80 Educational Attainment ........................................................................................................... 2-81 First University Degrees in S&E Fields ....................................................................................... 2-83 S&E First University Degrees by Sex ......................................................................................... 2-85 Global Comparison of S&E Doctoral Degrees .............................................................................. 2-86 Global Student Mobility ........................................................................................................... 2-88 Conclusion ................................................................................................................................... 2-95 Glossary ....................................................................................................................................... 2-96 References ................................................................................................................................... 2-97 List of Sidebars Carnegie Classification of Academic Institutions .................................................................................. 2-11 Attrition in STEM Fields .................................................................................................................... 2-43 Retention of Women in Computer Sciences Programs ........................................................................... 2-53 Trends in Higher Education in Asia .................................................................................................... 2-80 List of Tables Table 2-1. Degree-granting institutions, by control and highest degree awarded: 2013–14 ....................... 2-10 Table 2-2. Degree awards, by degree level and institutional control: 2013 .............................................. 2-11
Transcript of Science and Engineering Indicators 2016 - NSF · First university natural sciences and engineering...
2 | 1National Science Board | Science & Engineering Indicators 2016
Chapter 2.
Higher Education in Science andEngineering
Table of Contents
Highlights ...................................................................................................................................... 2-4Characteristics of the U.S. Higher Education System .................................................................... 2-4Undergraduate Education, Enrollment, and Degrees ..................................................................... 2-5Graduate Education, Enrollment, and Degrees ............................................................................. 2-6International S&E Higher Education ............................................................................................ 2-7
Introduction .................................................................................................................................. 2-9Chapter Overview .................................................................................................................... 2-9Chapter Organization ............................................................................................................... 2-9
The U.S. Higher Education System ............................................................................................... 2-10Institutions Providing S&E Education ........................................................................................ 2-10Trends in Higher Education Expenditures and Revenues .............................................................. 2-20Financing Higher Education ..................................................................................................... 2-29
Undergraduate Education, Enrollment, and Degrees in the United States ..................................... 2-39Undergraduate Enrollment in the United States .......................................................................... 2-39Undergraduate Degree Awards ................................................................................................ 2-50
Graduate Education, Enrollment, and Degrees in the United States .............................................. 2-58Graduate Enrollment by Field .................................................................................................. 2-58S&E Master's Degrees ............................................................................................................ 2-61S&E Doctoral Degrees ............................................................................................................ 2-65
International S&E Higher Education ............................................................................................. 2-80Higher Education Expenditures ................................................................................................ 2-80Educational Attainment ........................................................................................................... 2-81First University Degrees in S&E Fields ....................................................................................... 2-83S&E First University Degrees by Sex ......................................................................................... 2-85Global Comparison of S&E Doctoral Degrees .............................................................................. 2-86Global Student Mobility ........................................................................................................... 2-88
Conclusion ................................................................................................................................... 2-95Glossary ....................................................................................................................................... 2-96References ................................................................................................................................... 2-97
List of Sidebars
Carnegie Classification of Academic Institutions .................................................................................. 2-11Attrition in STEM Fields .................................................................................................................... 2-43Retention of Women in Computer Sciences Programs ........................................................................... 2-53Trends in Higher Education in Asia .................................................................................................... 2-80
List of Tables
Table 2-1. Degree-granting institutions, by control and highest degree awarded: 2013–14 ....................... 2-10Table 2-2. Degree awards, by degree level and institutional control: 2013 .............................................. 2-11
2 | 2National Science Board | Science & Engineering Indicators 2016
Table 2-3. U.S. citizen and permanent resident S&E doctorate recipients whose baccalaureate origin is a highHispanic enrollment institution, by ethnicity and race: 2009–13 ............................................................ 2-13Table 2-4. U.S. citizen and permanent resident S&E doctorate recipients whose baccalaureate origin is an HBCU,by ethnicity and race: 2009–13 ........................................................................................................ 2-13Table 2-5. U.S. citizen and permanent resident S&E doctorate recipients who reported earning college creditfrom a community or 2-year college, by ethnicity and race: 2009–13 ..................................................... 2-14Table 2-6. Community college attendance among recent recipients of S&E degrees, by sex, race, ethnicity,citizenship status, and parents' education level: 2013 .......................................................................... 2-15Table 2-7. Enrollment in Title IV institutions, by distance education enrollment status, control, and level ofinstitution: Fall 2012 ....................................................................................................................... 2-18Table 2-8. Net tuition and fees for full-time undergraduate students by institutional control: 2009–10 through2014–15 ........................................................................................................................................ 2-29Table 2-9. Net tuition and fees for dependent undergraduates attending college or university full time for a fullyear, by family income quartiles, type of institution, and Carnegie classification: 1999–2000 and 2011–12 .... 2-30Table 2-10. Primary support mechanisms for S&E doctorate recipients, by 2010 Carnegie classification ofdoctorate-granting institution: 2013 .................................................................................................. 2-36Table 2-11. International students enrolled in U.S. higher education institutions, by broad field and academiclevel: 2008–14 ............................................................................................................................... 2-49Table 2-12. Median number of years from entering graduate school to receipt of S&E doctorate, by 2010Carnegie classification of doctorate-granting institution: 1998–2013 ...................................................... 2-66Table 2-13. Recipients of U.S. S&E doctorates on temporary visas, by country/economy of origin: 1993–2013 .. 2-72Table 2-14. Asian recipients of U.S. S&E doctorates on temporary visas, by field and country/economy of origin:1993–2013 .................................................................................................................................... 2-72Table 2-15. European recipients of U.S. S&E doctorates on temporary visas, by field and region/country oforigin: 1993–2013 .......................................................................................................................... 2-74Table 2-16. North American, South American, and Middle Eastern recipients of U.S. S&E doctorates, by field andregion/country of origin: 1993–2013 ................................................................................................. 2-78
List of Figures
Figure 2-1. Selected average revenues and expenditures at public very high research universities: 1987–2012 .. 2-22Figure 2-2. Average expenditures per FTE on research at public and private very high research universities:1987–2012 .................................................................................................................................... 2-23Figure 2-3. Average expenditures per FTE on instruction at public and private very high research universities:1987–2012 .................................................................................................................................... 2-24Figure 2-4. Selected average revenues and expenditures at public 4-year and other postsecondary institutions:1987–2012 .................................................................................................................................... 2-26Figure 2-5. Selected average revenues and expenditures at community colleges: 1987–2012 ................... 2-28Figure 2-6. Full-time S&E graduate students, by field and mechanism of primary support: 2013 ................ 2-33Figure 2-7. Full-time S&E graduate students with primary support from federal government, by field: 2013 ... 2-34Figure 2-8. Full-time S&E graduate students, by source of primary support: 1998–2013 ........................... 2-35Figure 2-9. Share of full-time undergraduate enrollment among U.S. citizens and permanent residents, by raceand ethnicity: 2000–13 .................................................................................................................... 2-40Figure 2-10. Freshmen intending S&E major, by race and ethnicity: 1998–2014 ...................................... 2-42Figure 2-11. Engineering: Freshmen intentions and degrees, by sex ...................................................... 2-44Figure 2-12. Engineering: Freshmen intentions and degrees, by race and ethnicity .................................. 2-45Figure 2-13. Natural sciences: Freshmen intentions and degrees, by sex ................................................ 2-46Figure 2-14. Natural sciences: Freshmen intentions and degrees, by race and ethnicity ............................ 2-47

2 | 3National Science Board | Science & Engineering Indicators 2016
Figure 2-15. S&E bachelor’s degrees, by field: 2000–13 ....................................................................... 2-52Figure 2-16. Women's share of S&E bachelor's degrees, by field: 2000–13 ............................................. 2-54Figure 2-17. Share of S&E bachelor’s degrees among U.S. citizens and permanent residents, by race andethnicity: 2000–13 .......................................................................................................................... 2-56Figure 2-18. S&E master's degrees, by field: 2000–13 ......................................................................... 2-62Figure 2-19. S&E master’s degrees, by sex of recipient: 2000–13 .......................................................... 2-63Figure 2-20. S&E master’s degrees, by race, ethnicity, and citizenship: 2000–13 ..................................... 2-64Figure 2-21. S&E doctoral degrees earned in U.S. universities, by field: 2000–13 .................................... 2-66Figure 2-22. S&E doctoral degrees earned by U.S. citizen and permanent resident underrepresented minorities,by race and ethnicity: 2000–13 ........................................................................................................ 2-70Figure 2-23. S&E doctoral degrees, by sex, race, ethnicity, and citizenship: 2000–13 ............................... 2-71Figure 2-24. U.S. S&E doctoral degree recipients, by selected Asian country/economy of origin: 1993–2013 .. 2-74Figure 2-25. U.S. S&E doctoral degree recipients, by selected Western European country: 1993–2013 ....... 2-76Figure 2-26. U.S. S&E doctoral degree recipients from Europe, by region: 1993–2013 .............................. 2-77Figure 2-27. U.S. S&E doctoral degree recipients from Canada, Mexico, and Brazil: 1993–2013 ................. 2-78Figure 2-28. Attainment of tertiary-type A and advanced research programs, by country and age group: 2012 .. 2-82Figure 2-29. First university natural sciences and engineering degrees, by selected country: 2000–12 ....... 2-85Figure 2-30. Natural sciences and engineering doctoral degrees, by selected country: 2000–12 ................. 2-87Figure 2-31. Internationally mobile students enrolled in tertiary education, by selected country: 2013 ....... 2-91

Chapter 2. Higher Education in Science and Engineering
2 | 4National Science Board | Science & Engineering Indicators 2016
Highlights
Characteristics of the U.S. Higher Education System
Doctorate-granting institutions with very high research activity, although few, are the leadingproducers of S&E degrees at the bachelor’s, master’s, and doctoral levels, but other types ofinstitutions are also important in educating S&E graduates.
In 2013, doctorate-granting institutions with very high research activity awarded 73% of doctoraldegrees, 41% of master’s degrees, and 37% of bachelor’s degrees in S&E fields.Master’s colleges and universities awarded 29% of all S&E bachelor’s degrees and 26% of all S&Emaster’s degrees in 2013.About 30% of Hispanic S&E doctorate recipients who earned their doctorates between 2009 and 2013 hadobtained their baccalaureate credential at a high Hispanic enrollment institution, and 25% of black S&Edoctorate recipients who received their doctorates in the same period had obtained their baccalaureatedegree at a historically black college or university.Nearly one in five U.S. citizens or permanent residents who received an S&E doctoral degree from 2009to 2013 had earned some college credit from a community or 2-year college.
Higher education spending and revenue patterns and trends underwent substantial changes over thelast two decades.
Between 1987 and 2012, average revenue per full-time equivalent (FTE) student from net tuition atpublic very high research universities nearly tripled, whereas state and local appropriations fell by nearly40%.Although tuition remained lower at public very high research universities than at their privatecounterparts, average revenue from student tuition increased more rapidly at public institutions.In public very high research universities, revenues from federal appropriations, grants, and contracts perFTE student grew by nearly 80% between 1987 and 2012, and research expenditures per FTE studentgrew by 75% in the same period. In private very high research universities, revenues from federalappropriations, grants, and contracts per FTE student grew by 60%, and research expenditures per FTEincreased by 90%.Between 2008 and 2010, expanding enrollment in community colleges, coupled with reductions in stateand local appropriations, contributed to a 10% reduction in instructional spending per FTE student.Instructional spending per FTE student continued to decline in 2011 but increased in 2012, with a largerdrop in enrollment as the U.S. economy improved.
Between 2009–10 and 2014–15, estimated average net tuition and fees paid by full-timeundergraduate students in public 4-year colleges increased by about 50% after adjusting forinflation.
Undergraduate debt varies by type of institution and state. Among recent recipients of S&E bachelor’sdegrees, the level of undergraduate debt is somewhat higher for degree holders in the life sciences and inthe social and related sciences, but overall it does not vary much by major.Levels of debt of doctorate recipients vary by field. In S&E fields, high levels of graduate debt were mostcommon among doctorate recipients in the social sciences, psychology, and the medical and other healthsciences.

Chapter 2. Higher Education in Science and Engineering
2 | 5National Science Board | Science & Engineering Indicators 2016
At the time of doctoral degree conferral, 45% of 2013 S&E doctorate recipients had debt related to theirundergraduate or graduate education.
Undergraduate Education, Enrollment, and Degrees
Undergraduate enrollment in U.S. higher education rose from 13.3 million in 2000 to 17.7 million in2013. The largest increases coincided with the two economic downturns in 2000–02 and 2008–10,continuing a well-established pattern seen in earlier economic downturns. Enrollment peaked at18.3 million in 2010 but has since declined.
Associate’s colleges enroll the largest number of students, followed by master’s colleges and universitiesand doctorate-granting institutions with very high research activity.Increased enrollment in higher education is projected to come mainly from minority groups, particularlyHispanics.
The number of S&E bachelor’s degrees has risen steadily over the past 13 years, reaching a newpeak of more than 615,000 in 2013. The proportion of all bachelor’s degrees awarded in S&E relativeto degrees in all fields has remained stable at about 32% during this period.
All S&E fields experienced increases in the numbers of bachelor’s degrees awarded in 2013, includingcomputer sciences, which had declined sharply in the mid-2000s and had remained flat through 2009.Women have earned about 57% of all bachelor’s degrees and about half of all S&E bachelor’s degreessince the late 1990s. Men earn the majority of bachelor’s degrees in engineering, computer sciences,mathematics and statistics, and physics, and women earn the majority in the biological, agricultural, andsocial sciences and in psychology.Between 2000 and 2013, the proportion of S&E bachelor’s degrees relative to degrees in all fieldsawarded to women remained flat. During this period, it declined in computer sciences, mathematics,physics, engineering, and economics.
The racial and ethnic composition of those earning S&E bachelor’s degrees is changing, reflectingboth population changes and increases in college attendance by members of minority groups.
For all racial and ethnic groups, the total number of bachelor’s degrees earned, the number of S&Ebachelor’s degrees earned, and the number of bachelor’s degrees in most broad S&E fields haveincreased since 2000.Between 2000 and 2013, the share of bachelor’s degrees awarded to Hispanics among U.S. citizens andpermanent residents increased from 7% to 11%, both in S&E and in all fields combined, and remainedsteady at about 1% for American Indians and Alaska Natives. In the same period, the share of bachelor’sdegrees awarded to blacks remained stable at 9% in S&E fields but increased from 9% to 10% in allfields.
The number of international undergraduate students in the United States increased by more than50% between fall 2008 and fall 2014.
The number of international undergraduate students grew considerably between fall 2011 and fall 2012.Between fall 2012 and fall 2014, the numbers continued to increase but at a somewhat slower rate.Between fall 2013 and fall 2014, the largest increases in international students enrolled in S&E fields werein computer sciences, mathematics, engineering, and the physical sciences.

Chapter 2. Higher Education in Science and Engineering
2 | 6National Science Board | Science & Engineering Indicators 2016
In fall 2014, China, Saudi Arabia, and South Korea were the top countries sending undergraduates to theUnited States, both in S&E and in non-S&E fields.
At the bachelor’s level, attrition from science, technology, engineering, and mathematics (STEM)majors (i.e., mathematics, physical sciences, biological and life sciences, computer and informationsciences, engineering and engineering technologies, and science technologies) was lower than inmany non-STEM fields.
About half of the beginning bachelor’s degree students who declared these STEM majors between 2003and 2009 had either left school altogether by spring 2009 (20%) or left STEM for another field (28%).Bachelor’s degree students in the humanities, education, and health sciences had higher attrition rates(56%–62%) than students in STEM fields (48%), in the social and behavioral sciences (45%), and inbusiness (50%).At the associate’s level, attrition was higher than at the bachelor’s level (69%) and was similar in STEMand non-STEM fields.
Graduate Education, Enrollment, and Degrees
Graduate enrollment in S&E increased from about 493,000 to more than 615,000 between 2000 and2013.
Graduate enrollment grew in most S&E fields, with particularly strong growth in engineering and in thebiological and social sciences.Women continued to enroll at disproportionately low rates in engineering (24%), computer sciences(26%), physical sciences (33%), and economics (37%).In 2013, underrepresented minority students (blacks, Hispanics, and American Indians and AlaskaNatives) made up 12% of all students enrolled in graduate S&E programs. Asians and Pacific Islandersrepresented 6%, and whites represented 44%. Temporary residents accounted for almost one-third ofgraduate S&E enrollment.
In 2013, the federal government was the primary source of financial support for 17% of full-timeS&E graduate students, the lowest proportion since at least 1998.
The recent decline in the share of S&E graduate students with federal financial support was especiallypronounced in the biological sciences (from 35% in 1998 to 29% in 2013) and in the physical sciences(from 35% in 1998 to 28% in 2013).In 2013, the federal government funded 60% of S&E graduate students with traineeships, 48% of thosewith research assistantships, and 23% of those with fellowships.Graduate students in the biological sciences, the physical sciences, and engineering received relativelymore federal financial support than those in computer sciences, mathematics and statistics, medical andother health sciences, psychology, and social sciences.
Between fall 2013 and fall 2014, the number of international graduate students increased by 18% inS&E fields and by 6% in non-S&E fields.
A larger proportion of international graduate students than international undergraduate students enrolledin S&E. More than 6 out of 10 international graduate students in the United States in fall 2014 wereenrolled in S&E fields, compared with almost 4 in 10 international undergraduates.

Chapter 2. Higher Education in Science and Engineering
2 | 7National Science Board | Science & Engineering Indicators 2016
Between fall 2013 and fall 2014, the number of international graduate students enrolled in S&E fieldsincreased most in computer sciences and engineering.In fall 2014, more than two-thirds of the international S&E graduate students in the United States camefrom China and India.
Master’s degrees awarded in S&E fields increased from about 96,000 in 2000 to about 166,000 in2013. In this period, the growth of S&E degrees at the master’s level (73%) was higher than growthat the bachelor’s (54%) and doctoral levels (47%).
The number of master’s degrees awarded in engineering in 2013 was the highest in the last 14 years. Thenumber of master’s degrees in computer sciences awarded in 2013 surpassed its peak in 2004.Increases occurred in most major S&E fields, with the largest in engineering, psychology, and politicalsciences and public administration.The number and percentage of master’s degrees awarded to women in most major S&E fields haveincreased since 2000.The number of S&E master’s degrees awarded increased for all racial and ethnic groups from 2000 to2013. While the proportion of degrees earned by blacks and Hispanics increased, that of Asians andPacific Islanders and American Indians and Alaska Natives remained flat, and that of whites decreased.
In 2013, U.S. academic institutions awarded about 39,000 S&E doctorates (excluding other healthsciences).
The number of S&E doctorates conferred annually by U.S. universities increased steadily from 2002 to2008 then flattened and declined slightly in 2010 but has been growing since then.Among fields that award large numbers of doctorates, the biggest increases in degrees awarded between2000 and 2013 were in engineering (76%) and in the biological sciences (57%).
Students on temporary visas continue to earn high proportions of U.S. S&E doctorates, including themajority of degrees in some fields. They also earned large shares of the master’s degrees in S&Efields.
In 2013, international students earned 57% of all engineering doctorates, 56% of all economicsdoctorates, 53% of all computer sciences doctorates, and 44% of all physics doctorates. Their overallshare of S&E degrees was 37%.After steep growth from 2002 to 2008, the number of temporary residents earning S&E doctoral degreesdeclined through 2010 but has been growing since then.
International S&E Higher Education
In 2012, more than 6 million first university degrees were awarded in S&E worldwide. Students inChina earned about 23%, those in the European Union earned about 12%, and those in the UnitedStates earned about 9% of these degrees.
Between 2000 and 2012, the number of S&E first university degrees awarded in China, Taiwan, Germany,Turkey, and Mexico at least doubled. It rose more slowly (by about 50%) in Australia, the United States,and Poland, and declined in France, Japan, and Spain.S&E degrees continue to account for about one-third of all bachelor’s degrees awarded in the UnitedStates. In Japan, nearly 6 out of 10 first degrees were awarded in S&E fields in 2012; in China, nearlyhalf.
Chapter 2. Higher Education in Science and Engineering
2 | 8National Science Board | Science & Engineering Indicators 2016
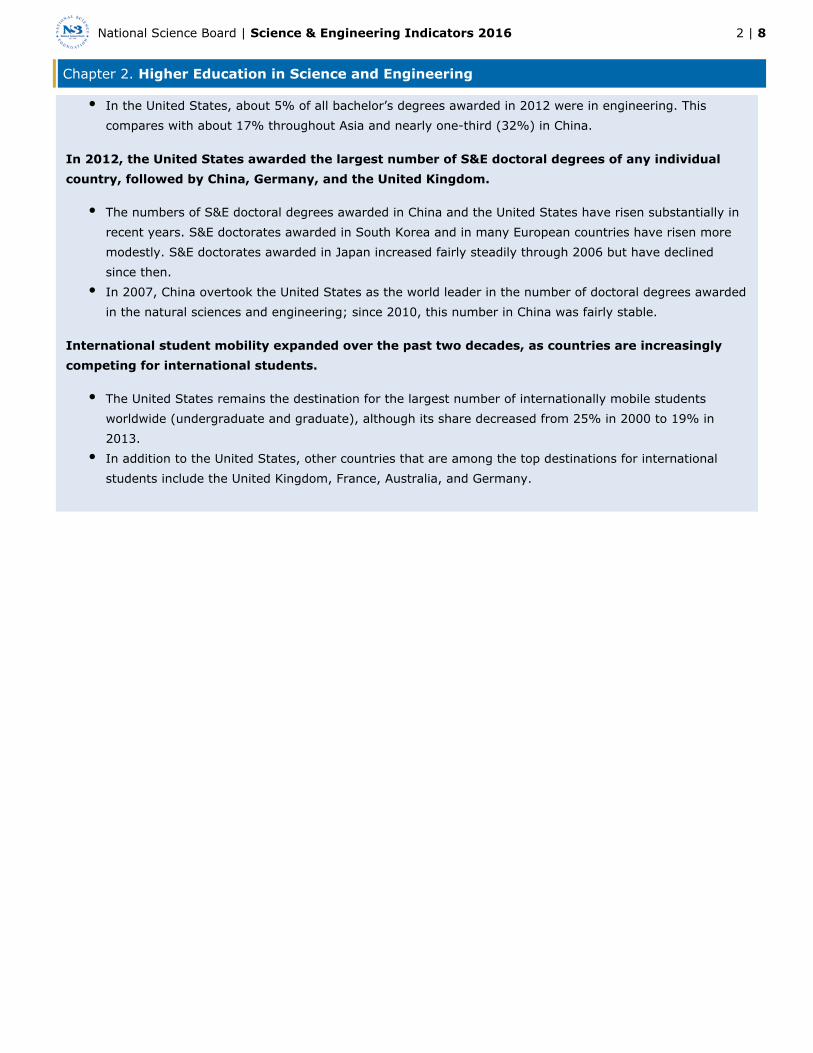
In the United States, about 5% of all bachelor’s degrees awarded in 2012 were in engineering. Thiscompares with about 17% throughout Asia and nearly one-third (32%) in China.
In 2012, the United States awarded the largest number of S&E doctoral degrees of any individualcountry, followed by China, Germany, and the United Kingdom.
The numbers of S&E doctoral degrees awarded in China and the United States have risen substantially inrecent years. S&E doctorates awarded in South Korea and in many European countries have risen moremodestly. S&E doctorates awarded in Japan increased fairly steadily through 2006 but have declinedsince then.In 2007, China overtook the United States as the world leader in the number of doctoral degrees awardedin the natural sciences and engineering; since 2010, this number in China was fairly stable.
International student mobility expanded over the past two decades, as countries are increasinglycompeting for international students.
The United States remains the destination for the largest number of internationally mobile studentsworldwide (undergraduate and graduate), although its share decreased from 25% in 2000 to 19% in2013.In addition to the United States, other countries that are among the top destinations for internationalstudents include the United Kingdom, France, Australia, and Germany.

Chapter 2. Higher Education in Science and Engineering
2 | 9National Science Board | Science & Engineering Indicators 2016
Introduction
Chapter Overview
Higher education develops human capital; builds the knowledge base through research and knowledgedevelopment; and disseminates, uses, and maintains knowledge (OECD 2008). S&E higher education provides theadvanced skills needed for a competitive workforce and, particularly in the case of graduate-level S&E education,the research capability necessary for innovation. This chapter focuses on the development of human capital throughhigher education.
Indicators presented in this chapter are discussed in the context of national and global developments, includingchanging demographics, increasing international student mobility, and increasing global competition in highereducation. The composition of the U.S. college-age population is becoming more diverse as the Asian and Hispanicshares of the population increase. During the latest economic downturn, public institutions of higher educationfaced unique pressures from a combination of increasing enrollments and tight state budgets. Private institutionslikewise experienced financial challenges stemming from declining incomes and the effects of stock marketfluctuations on endowment growth. Technology has enabled very rapid growth in the delivery of online courses; theconsequences of these changes are not well understood.
Over the past decade and a half, governments around the globe have increasingly regarded higher education as anessential national resource. Although the United States has historically been a world leader in providing broadaccess to higher education and in attracting international students, many other countries are providing expandededucational access to their own populations and attracting growing numbers of international students.Nevertheless, increases in international students contributed to most of the growth in overall S&E graduateenrollment in the United States in recent years. Following a decline in the number of international students comingto the United States after 11 September 2001, international student enrollment in S&E has recovered.
Chapter Organization
This chapter begins with an overview of the characteristics of U.S. higher education institutions that provideinstruction in S&E, followed by a discussion of characteristics of U.S. undergraduate and graduate education.[i]Trends are discussed by field and demographic group, with attention to the flow of international students into theUnited States by country of origin. Various international higher education indicators include comparative S&Edegree production in several world regions and measures of the growing dependence of industrialized countries oninternational S&E students.
The data in this chapter come from a variety of federal and nonfederal sources, primarily surveys conducted by theNational Science Foundation’s (NSF’s) National Center for Science and Engineering Statistics (NCSES) and theNational Center for Education Statistics (NCES) at the U.S. Department of Education. Data also come frominternational organizations, such as the Organisation for Economic Co-operation and Development (OECD) and theUnited Nations Educational, Scientific and Cultural Organization (UNESCO) Institute for Statistics (UIS), as well asindividual countries. Most of the data in this chapter are from censuses of the population—for example, all studentsreceiving degrees from U.S. academic institutions—and are not subject to sampling variability.
Data on postdoctoral scientists and engineers are included in chapters 3 and 5. Data on stay rates of doctoraterecipients are included in chapter 3.

Chapter 2. Higher Education in Science and Engineering
2 | 10National Science Board | Science & Engineering Indicators 2016
The U.S. Higher Education System
Higher education in S&E produces an educated S&E workforce and an informed citizenry. It has also receivedincreased attention as an important component of U.S. economic competitiveness. In his 24 February 2009 addressto a joint session of Congress, President Barack Obama called for every American to commit to at least 1 year ofeducation or career training after completing high school. A 2012 report by the President’s Council of Advisors onScience and Technology (PCAST 2012) states that economic forecasts point to a need to increase the proportion ofcollege graduates going into the natural sciences and engineering over the next decade. This section discusses thecharacteristics of U.S. higher education institutions providing S&E education and the financing of higher education.
Institutions Providing S&E Education
The U.S. higher education system consists of a large number of diverse academic institutions that vary in theirmissions, learning environments, selectivity levels, religious affiliations, types of students served, types of degreesoffered, and sectors (public, private nonprofit, or private for-profit) (Kena et al. 2014). There were approximately4,700 postsecondary degree-granting institutions in the United States in the 2013–14 academic year. Of these,64% offered bachelor’s or higher degrees, 30% offered only associate’s degrees, and 6% offered degrees that wereat least 2-year but less than 4-year as the highest degree awarded ( ). More than half of the institutionsTable 2-1offering bachelor’s degrees or above are private nonprofit, 23% are public, and 25% are private for-profit. Themajority of the institutions granting associate’s degrees are public (53%) or private for-profit (42%) ( ).Table 2-1In 2013, U.S. academic institutions awarded nearly 3.7 million associate’s, bachelor’s, master’s, and doctoral
degrees; 25% of the degrees were in S&E (Appendix Table 2-1). Public institutions produce a larger share of[i]
bachelor’s and higher-level degrees than private institutions. In 2013, public institutions awarded 63% of allbachelor’s and doctoral degrees awarded in the United States and 46% of the master’s degrees awarded (Table
).2-2
[i] For a crosswalk between the Classification of Instructional Programs codes and the academic fields in enrollmentand completion tables, see https://webcaspar.nsf.gov/Help/dataMapHelpDisplay.jsp?subHeader=DataSourceBySubject&type=DS&abbr=DEGS&noHeader=1&JS=No, accessed16 June 2015.
Table 2-1Degree-granting institutions, by control and highest degree awarded:2013–14
Highest degree awardedAll degree-granting
institutionsPublic
Privatenonprofit
Privatefor-profit
Total 4,724 1,625 1,675 1,424
Associate's degree 1,410 743 80 587
At least 2 years but less than 4 years 275 191 8 76
Bachelor's degree or above 3,039 691 1,587 761
SOURCE: U.S. Department of Education, National Center for Education Statistics, Integrated Postsecondary Education Data System, Institutional Characteristics component, 2013–14.

Chapter 2. Higher Education in Science and Engineering
2 | 11National Science Board | Science & Engineering Indicators 2016
Science and Engineering Indicators 2016
Table 2-2 Degree awards, by degree level and institutional control: 2013
Degree awards Total Public Private nonprofit Private for-profit
Bachelor's 1,861,034 1,171,656 547,408 141,970
Master's 756,975 347,706 330,990 78,279
Doctorate 64,887 41,021 20,308 3,558
SOURCES: National Center for Education Statistics, Integrated Postsecondary Education Data System, Completions Survey; National Science Foundation, National Center for Science and Engineering Statistics, WebCASPAR
database, http://webcaspar.nsf.gov.
Science and Engineering Indicators 2016
Although few in number, doctorate-granting institutions with very high research activity are the leading producersof S&E degrees at the bachelor’s, master’s, and doctoral levels. In 2013, these research institutions awarded 73%of doctoral degrees, 41% of master’s degrees, and 37% of bachelor’s degrees in S&E fields (Appendix Table 2-1) (see sidebar, ). Master’s colleges and universities awarded anotherCarnegie Classification of Academic Institutions29% of S&E bachelor’s degrees and 25% of S&E master’s degrees in 2013.
Carnegie Classification of Academic Institutions
The Carnegie Classification of Institutions of Higher Education is widely used in higher education research tocharacterize and control for differences in academic institutions.
The 2010 classification update retains the structure adopted in 2005. It includes 4,634 institutions, 483 ofwhich were added after the 2005 update. More than three-quarters of the new institutions (77%) are fromthe private for-profit sector, 19% are from the private nonprofit sector, and 4% are from the public sector.
The Carnegie classification categorizes academic institutions primarily on the basis of highest degreeconferred, level of degree production, and research activity.* In this report, several Carnegie categorieshave been aggregated for statistical purposes. The characteristics of those aggregated groups are asfollows:
Doctorate-granting universities include institutions that award at least 20 doctoral degrees per year.They include three subgroups based on level of research activity: very high research activity (108institutions), high research activity (99 institutions), and doctoral/research universities (90institutions). Because doctorate-granting institutions with very high research activity are central toS&E education and research, data on these institutions are reported separately.Master’s colleges and universities include the 724 institutions that award at least 50 master’sdegrees and fewer than 20 doctoral degrees per year.Baccalaureate colleges include the 810 institutions at which baccalaureate degrees represent at least10% of all undergraduate degrees and that award fewer than 50 master’s degrees or 20 doctoraldegrees per year.Associate’s colleges include the 1,920 institutions at which all degrees awarded are associate’sdegrees or at which bachelor’s degrees account for less than 10% of all undergraduate degrees.

Chapter 2. Higher Education in Science and Engineering
2 | 12National Science Board | Science & Engineering Indicators 2016
Special-focus institutions are the 851 institutions at which at least 75% of degrees are concentratedin a single field or a set of related fields (e.g., medical schools and medical centers, schools ofengineering, schools of business and management).Tribal colleges are the 32 colleges and universities that are members of the American Indian HigherEducation Consortium.
* Research activity is based on two indexes (aggregate level of research and per capita research activity)derived from a principal components analysis of data on research and development expenditures, S&Eresearch staff, and field of doctoral degree. See http://carnegieclassifications.iu.edu/ for more informationon the classification system and on the methodology used in defining the categories.
Baccalaureate colleges were the source of relatively few S&E bachelor’s degrees (11%) (Appendix Table 2-1), butthey produce a larger proportion of future S&E doctorate recipients (14%) (NSF/NCSES 2013). When adjusted bythe number of bachelor’s degrees awarded in all fields, baccalaureate colleges as a group yield more future S&Edoctorates per 100 bachelor’s degrees awarded than all other types of institutions except very high researchuniversities (NSF/NCSES 2008, 2013).
Minority-serving academic institutions enroll a substantial fraction of underrepresented minority undergraduates
(NSF/NCSES 2015c). In 2012, historically black colleges and universities (HBCUs) awarded 18% of the 50,000[ii]
S&E bachelor’s degrees earned by black U.S. citizens and permanent residents, and high Hispanic enrollmentinstitutions (HHEs) awarded about 34% of the 58,000 S&E bachelor’s degrees earned by Hispanics. However, theproportion of blacks earning S&E bachelor’s degrees from HBCUs and the proportion of Hispanics earning S&Ebachelor’s degrees from HHEs have both declined in the recent past. Tribal colleges, which mainly offer 2-yeardegrees, account for about 2% of S&E bachelor’s degrees awarded to American Indians; this proportion has been
fairly stable over time.[iii]
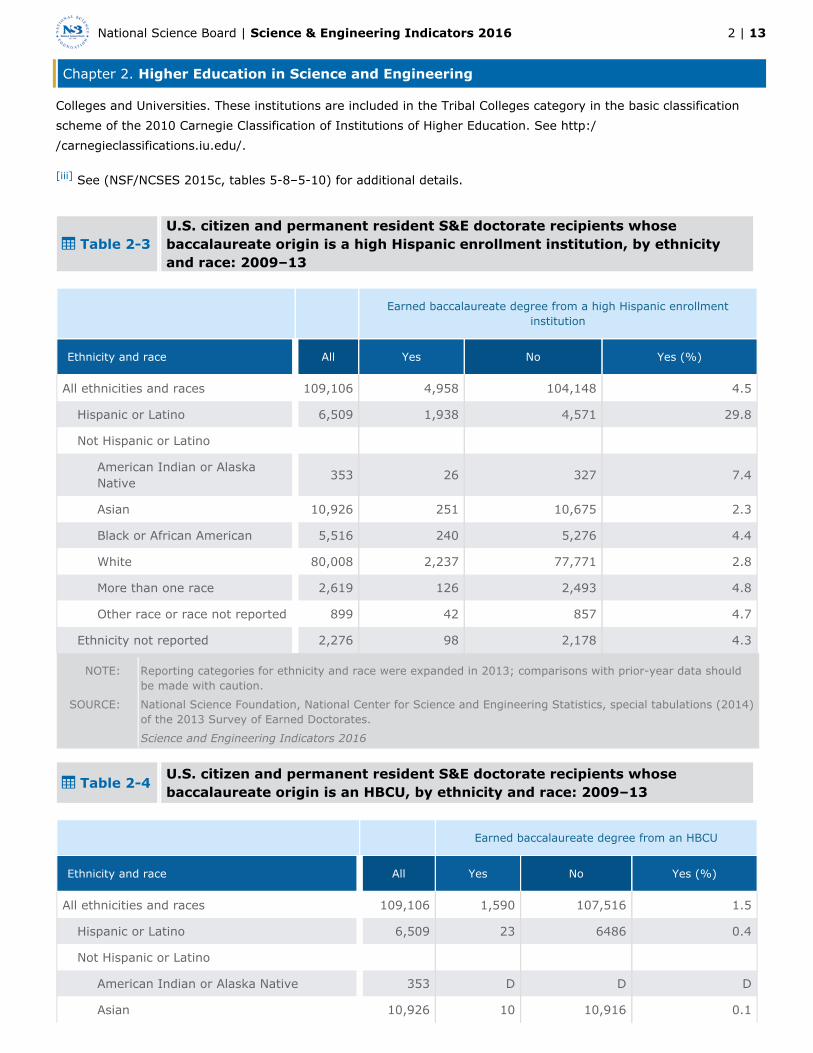
HHEs and HBCUs also play an important role in training Hispanic and black students for doctoral-level study in S&Efields. Of Hispanics who earned an S&E doctorate between 2009 and 2013, about 30% had obtained theirbaccalaureate credential at an HHE ( ). Similarly, 25% of black S&E doctorate recipients had obtainedTable 2-3their baccalaureate degree at an HBCU during the same period ( ), making HBCUs the second-largestTable 2-4contributor of black S&E doctorate recipients, behind only institutions with very high research activity (NSF/NCSES2013).
[ii] Minority-serving academic institutions include historically black colleges and universities (HBCUs), high Hispanicenrollment institutions (HHEs), and tribal colleges. HBCUs are listed by the White House Initiative on HistoricallyBlack Colleges and Universities. The Higher Education Act of 1965, as amended, defines an HBCU as “anyhistorically black college or university that was established prior to 1964, whose principal mission was, and is, theeducation of black Americans, and that is accredited by a nationally recognized accrediting agency or associationdetermined by the Secretary [of Education] to be a reliable authority as to the quality of training offered or is,according to such an agency or association, making reasonable progress toward accreditation.” HHEs are thosepublic and private non-profit institutions whose undergraduate, full-time equivalent student enrollment is at least25% Hispanic, according to fall 2011 data in the IPEDS, directed by the National Center for Education Statistics.Tribal colleges are fully accredited academic institutions on a list maintained by the White House Initiative on Tribal
Chapter 2. Higher Education in Science and Engineering
2 | 13National Science Board | Science & Engineering Indicators 2016
Colleges and Universities. These institutions are included in the Tribal Colleges category in the basic classificationscheme of the 2010 Carnegie Classification of Institutions of Higher Education. See http://carnegieclassifications.iu.edu/.
[iii] See (NSF/NCSES 2015c, tables 5-8–5-10) for additional details.
Table 2-3U.S. citizen and permanent resident S&E doctorate recipients whosebaccalaureate origin is a high Hispanic enrollment institution, by ethnicityand race: 2009–13
Earned baccalaureate degree from a high Hispanic enrollment
institution
Ethnicity and race All Yes No Yes (%)
All ethnicities and races 109,106 4,958 104,148 4.5
Hispanic or Latino 6,509 1,938 4,571 29.8
Not Hispanic or Latino
American Indian or AlaskaNative
353 26 327 7.4
Asian 10,926 251 10,675 2.3
Black or African American 5,516 240 5,276 4.4
White 80,008 2,237 77,771 2.8
More than one race 2,619 126 2,493 4.8
Other race or race not reported 899 42 857 4.7
Ethnicity not reported 2,276 98 2,178 4.3
NOTE: Reporting categories for ethnicity and race were expanded in 2013; comparisons with prior-year data shouldbe made with caution.
SOURCE: National Science Foundation, National Center for Science and Engineering Statistics, special tabulations (2014)of the 2013 Survey of Earned Doctorates.
Science and Engineering Indicators 2016
Table 2-4U.S. citizen and permanent resident S&E doctorate recipients whosebaccalaureate origin is an HBCU, by ethnicity and race: 2009–13
Earned baccalaureate degree from an HBCU
Ethnicity and race All Yes No Yes (%)
All ethnicities and races 109,106 1,590 107,516 1.5
Hispanic or Latino 6,509 23 6486 0.4
Not Hispanic or Latino
American Indian or Alaska Native 353 D D D
Asian 10,926 10 10,916 0.1

Chapter 2. Higher Education in Science and Engineering
2 | 14National Science Board | Science & Engineering Indicators 2016
Earned baccalaureate degree from an HBCU
Ethnicity and race All Yes No Yes (%)
Black or African American 5,516 1,389 4,127 25.2
White 80,008 87 79,921 0.1
More than one race 2,619 42 2,577 1.6
Other race or race not reported 899 D D D
Ethnicity not reported 2,276 30 2246 1.3
D = suppressed to avoid disclosure of confidential information.
HBCU = historically black college or university.
NOTE: Reporting categories for ethnicity and race were expanded in 2013; comparisons with prior-year data shouldbe made with caution.
SOURCE: National Science Foundation, National Center for Science and Engineering Statistics, special tabulations (2014)of the 2013 Survey of Earned Doctorates.
Science and Engineering Indicators 2016
Community Colleges
Community colleges (also known as public 2-year colleges or associate’s colleges) play a key role in increasingaccess to higher education for all citizens. These institutions serve diverse groups of students and offer a moreaffordable means of participating in postsecondary education. Community colleges are important in preparingstudents to enter the workforce with certificates or associate’s degrees or to transition to 4-year colleges oruniversities, often before receiving a 2-year degree. Community colleges tend to be closely connected with localbusinesses, community organizations, and government, so they can be more responsive to local workforce needs(Olson and Labov 2012).
In the 2013–14 academic year, there were nearly 950 community colleges in the United States, enrolling 6.6million students, or nearly one-third of all postsecondary students (NCES 2015). More than 6 out of 10 communitycollege students were enrolled part time. With the economic recession between 2007 and 2010, enrollment incommunity colleges increased by about 910,000 students; however, it has declined by nearly 600,000 between2010 and 2013 as the labor market improved (Knapp, Kelly-Reid, and Ginder 2009, 2011; Ginder, Kelly-Reid, andMann 2014).
Community colleges play a significant role in the education of individuals who go on to acquire advanced S&Edegrees. About 18% of recent (2009–13) U.S. citizen and permanent resident S&E doctorate holders reportedearning some college credit from a community or 2-year college ( ). According to 2013 data from theTable 2-5National Survey of College Graduates (NSCG), 47% of all recent S&E graduates had done some coursework in a
community college, similar to the proportion in 2003 (48%). Recent S&E bachelor’s degree earners reported[iv]
slightly higher levels of community college course taking than did recent S&E master’s degree holders (49% versus39%). Graduates in the physical sciences and engineering were less likely than those in the biological and socialsciences to have attended a community college.
[iv] For the 2003 NSCG, recent graduates include those who received their most recent degree between 1 July 1994and 30 June 1999; for the 2013 NSCG, recent graduates include those who received their most recent degree in the5 years between 1 July 2006 and 30 June 2011.

Chapter 2. Higher Education in Science and Engineering
2 | 15National Science Board | Science & Engineering Indicators 2016
Table 2-5U.S. citizen and permanent resident S&E doctorate recipients who reportedearning college credit from a community or 2-year college, by ethnicity andrace: 2009–13
Earned college credit from a community or 2-year college
Ethnicity and race All Yes No Yes (%)
All ethnicities and races 107,376 19,774 87,602 18.4
Hispanic or Latino 6,306 1,375 4,931 21.8
Not Hispanic or Latino
American Indian or Alaska Native 347 112 235 32.3
Asian 11,003 1,393 9,610 12.7
Black or African American 5,433 981 4,452 18.1
White 79,407 14,918 64,489 18.8
More than one race 2,606 559 2,047 21.5
Other race or race not reported 857 201 656 23.5
Ethnicity not reported 1,417 235 1,182 16.6
NOTES: Includes only respondents to the community college question. Reporting categories for ethnicity and race wereexpanded in 2013; comparisons with prior-year data should be made with caution.
SOURCE: National Science Foundation, National Center for Science and Engineering Statistics, special tabulations (2014)of the 2013 Survey of Earned Doctorates.
Science and Engineering Indicators 2016
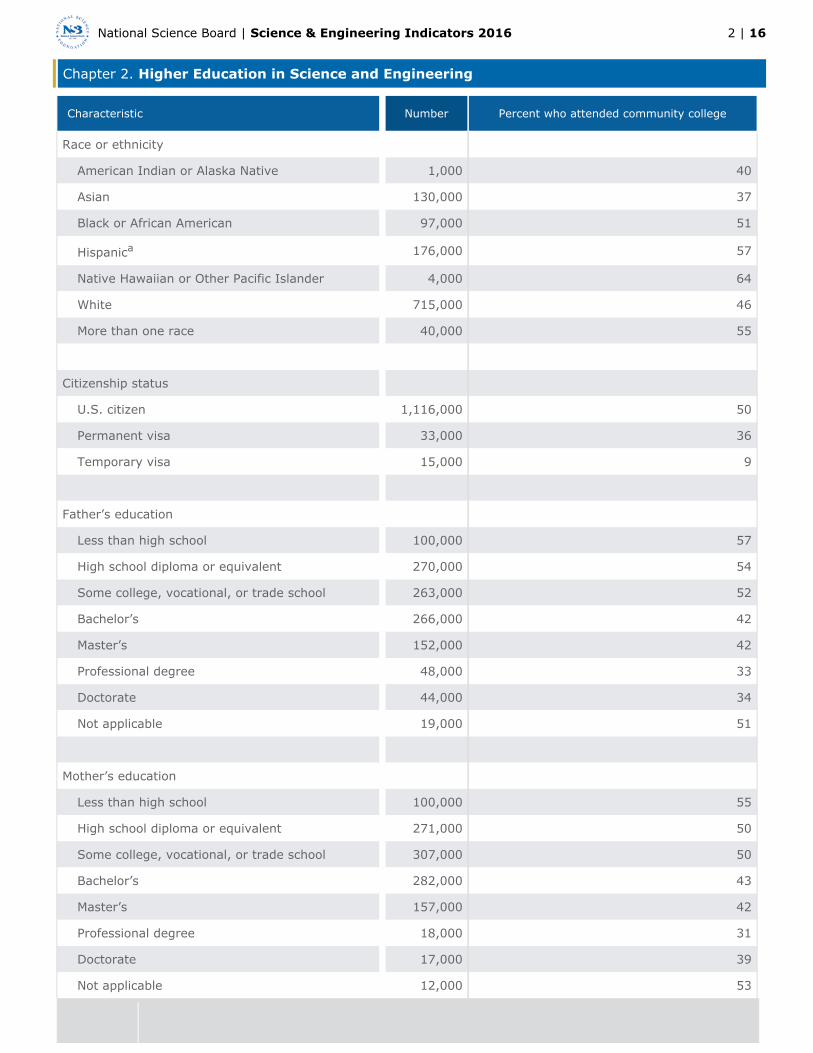
In 2013, recent female S&E bachelor’s and master’s degree recipients were more likely than their malecounterparts to have attended a community college ( ). Attendance levels as measured by the proportionTable 2-6who attended community college were highest among U.S. citizens, followed by permanent visa holders, and weremuch lower among temporary visa holders. Among racial and ethnic groups, the proportion attending communitycollege was highest among Hispanics and lowest among Asians. Attendance at the community college level fell withrising parental education level, illustrating the special access function of these institutions.
Table 2-6Community college attendance among recent recipients of S&E degrees, bysex, race, ethnicity, citizenship status, and parents' education level: 2013
Characteristic Number Percent who attended community college
All recent S&E degree recipients 1,164,000 47
Sex
Female 579,000 50
Male 585,000 44
Chapter 2. Higher Education in Science and Engineering
2 | 16National Science Board | Science & Engineering Indicators 2016
Characteristic Number Percent who attended community college
Race or ethnicity
American Indian or Alaska Native 1,000 40
Asian 130,000 37
Black or African American 97,000 51
Hispanica 176,000 57
Native Hawaiian or Other Pacific Islander 4,000 64
White 715,000 46
More than one race 40,000 55
Citizenship status
U.S. citizen 1,116,000 50
Permanent visa 33,000 36
Temporary visa 15,000 9
Father’s education
Less than high school 100,000 57
High school diploma or equivalent 270,000 54
Some college, vocational, or trade school 263,000 52
Bachelor’s 266,000 42
Master’s 152,000 42
Professional degree 48,000 33
Doctorate 44,000 34
Not applicable 19,000 51
Mother’s education
Less than high school 100,000 55
High school diploma or equivalent 271,000 50
Some college, vocational, or trade school 307,000 50
Bachelor’s 282,000 43
Master’s 157,000 42
Professional degree 18,000 31
Doctorate 17,000 39
Not applicable 12,000 53

Chapter 2. Higher Education in Science and Engineering
2 | 17National Science Board | Science & Engineering Indicators 2016
a Hispanic may be any race. American Indian or Alaska Native, Asian, black or African American, NativeHawaiian or Other Pacific Islander, white, and more than one race refer to individuals who are not of Hispanicorigin.
NOTES: Recent S&E degree recipients are those who earned their bachelor's or master's degrees between 1 July 2006 and 30 June 2011. Data are rounded to the nearest 1,000.
SOURCE: National Science Foundation, National Center for Science and Engineering Statistics, special tabulations (2015)of the 2013 National Survey of College Graduates.
Science and Engineering Indicators 2016
About one in four of the recent S&E graduates who indicated attending a community college reported doing so afterhigh school but before ever enrolling in a 4-year college or university or while enrolled in college but beforereceiving a bachelor’s degree. About one in three used a community college as a bridge between high school andcollege enrollment in dual enrollment. Another one-third attended a community college after receiving their firstbachelor’s degree. One in 10 reported taking courses in a community college after leaving a 4-year college without
receiving their first bachelor’s degree.[iv]
The most prevalent reason for attending a community college among recent recipients of S&E bachelor’s andmaster’s degrees was to earn credits toward a bachelor’s degree (31%). Other reasons mentioned includedfinancial reasons (13%); to prepare for college to increase the chance of acceptance at a 4-year institution (12%);to earn credits while still completing high school (10%); to complete an associate’s degree (8%); to gain furtherskills or knowledge in their academic or occupational fields (8%); to facilitate a change in their academic oroccupational fields (7%); for leisure or personal interest (5%); to increase opportunities for promotion,
advancement, or higher salary (2%); and for other reasons (5%).[v]
For-Profit Institutions
In 2013–14, more than 1,400 degree-granting institutions in the United States operated on a for-profit basis; 53%of these were 4-year institutions ( ). Over the last 10 years, the number of degree-granting, for-profitTable 2-1institutions has grown by nearly 67% (NCES 2015). For-profit institutions enroll considerably fewer students thanpublic institutions, particularly at the 2-year level; in 2013, nearly 6.9 million students were enrolled in community
colleges, compared with 155,000 students enrolled in 2-year, for-profit institutions. For-profit institutions play a[vi]
disproportionate role in the education of blacks, who are more likely than other racial or ethnic groups to enroll inprivate for-profit academic institutions (NSF/NCSES 2015c). Although the number of degrees awarded by for-profitinstitutions nearly quadrupled between 2000 and 2013, the upward trend has recently stopped. Enrollment infor-profit institutions has declined by about 16% since 2010, and the number of degrees they awarded in 2013 was4% lower than in the previous year (Appendix Table 2-2).
[iv] Special tabulation from the 2013 NSCG.
[v] Special tabulation from the 2013 NSCG.
[vi] Special tabulation from the Integrated Science and Engineering Resources Data System (WebCASPAR) database(12 December 2014 run).
In 2013, for-profit academic institutions awarded between 2% and 6% of S&E degrees at the bachelor’s, master’s,and doctoral levels, as well as 25% of S&E degrees at the associate’s level (Appendix Table 2-1 and Appendix Table2-2). Computer sciences accounted for 74% of the associate’s degrees and 47% of the bachelor’s degrees awardedby for-profit institutions in S&E fields in 2013 (Appendix Table 2-3). For-profit institutions awarded fewer S&E

Chapter 2. Higher Education in Science and Engineering
2 | 18National Science Board | Science & Engineering Indicators 2016
master’s and doctoral degrees than associate’s and bachelor’s degrees. At the master’s level, S&E degrees weremainly in psychology, social sciences, and computer sciences; at the doctoral level, they were almost exclusively inpsychology and social sciences. In 2013, degrees in psychology represented nearly 41% of the master’s and 74%of the doctoral degrees awarded by for-profit institutions in S&E fields. Degrees in social sciences accounted for32% of the master’s and 18% of the doctoral degrees awarded in S&E fields.
Online and Distance Education
Online and distance education enable institutions of higher education to reach a wider audience by expandingaccess for students in remote locations while providing greater flexibility for students who face time constraints,physical impairments, responsibility to care for dependents, and similar challenges. Distance education has beenaround for more than 100 years (Perna et al. 2014), whereas online education is a relatively new phenomenon.
Online enrollment has grown substantially in recent years. According to a report by Allen and Seaman (2014),between fall 2011 and fall 2012, the number of students taking at least one online course increased by nearly412,000 to 7.1 million. According to Integrated Postsecondary Education Data System (IPEDS) 2012 Fall Enrollmentsurvey data, 13% of all students in 4-year Title IV institutions (i.e., institutions that participate in federal financialaid programs) were enrolled exclusively in distance education courses, and another 13% were enrolled in distanceeducation and regular on-campus courses; however, about 74% of these students were not enrolled in any distance
education course at all ( ) (Ginder 2014). Exclusive enrollment in distance education courses wasTable 2-7 [vii]
considerably higher at private for-profit 4-year institutions than at either 2- or 4-year public or private nonprofitinstitutions or at private for-profit 2-year institutions. Enrollment in some distance education courses was highest atpublic institutions. Exclusive enrollment in distance education courses was higher at the graduate level than at theundergraduate level, whereas enrollment in some distance education courses was higher at the undergraduate levelrather than the graduate level.
[vii] In 2011–12, IPEDS began asking institutions whether they were exclusively a distance education institution(i.e., whether all of their programs were offered via distance education, defined as “education that uses one ormore technologies to deliver instruction to students who are separated from the instructor and to support regularand substantive interaction between the students and the instructor synchronously or asynchronously”). A distanceeducation course is a course in which the instructional content is delivered exclusively via distance education. Adistance education program is a program for which all the required coursework for program completion can becompleted via distance education courses. Examinations, orientation, and practical experience components ofcourses or programs are not considered instructional content. For more details, see the IPEDS online glossary athttp://nces.ed.gov/ipeds/glossary/.
Table 2-7Enrollment in Title IV institutions, by distance education enrollment status,control, and level of institution: Fall 2012
(Percent)
Institutional control andlevel
All(number)
Exclusively distanceeducation courses
Some distanceeducation courses
No distanceeducation courses
Total enrollment
Number 21,147,055 2,642,158 2,809,942 15,694,955
Percent 100 13.3 13.0 74.2

Chapter 2. Higher Education in Science and Engineering
2 | 19National Science Board | Science & Engineering Indicators 2016
Institutional control andlevel
All(number)
Exclusively distanceeducation courses
Some distanceeducation courses
No distanceeducation courses
Degree level
Undergraduate 18,236,340 11.0 14.2 74.9
Degree/certificate-seeking
16,225,545 11.1 15.2 73.7
Non-degree/certificate-seeking
1,623,082 11.9 7.0 81.1
Graduate 2,910,715 22.0 7.8 70.2
Control and level ofinstitution
Public
2-year 6,845,174 9.8 17.3 72.9
4-year 8,092,727 7.1 15.1 77.8
Private nonprofit
2-year 47,524 1.7 4.6 93.7
4-year 3,916,356 11.9 6.6 81.5
Private for-profit
2-year 413,377 5.3 4.8 90.0
4-year 1,470,191 61.3 8.3 30.4
Institutional category
All degree-granting 20,642,819 12.8 13.6 73.6
Allnon-degree-granting
504,236 0.7 0.8 98.5
NOTE: Title IV institutions are those with a written agreement with the Secretary of Education that allows theinstitution to participate in any of the Title IV federal student financial assistance programs.
SOURCES: U.S. Department of Education, National Center for Education Statistics (NCES), Integrated PostsecondaryEducation Data System, Fall 2012, Fall Enrollment Component; NCES, 2014, and Enrollment in DistanceEducation Courses, by State: Fall 2012. NCES 2014-023. Washington DC. http://nces.ed.gov/pubs2014/2014023.pdf. Accessed 3 February 2015.
Science and Engineering Indicators 2016
Allen and Seaman’s most recent survey of academic leaders revealed that 90% of them believe that it is “likely” or“very likely” that a majority of all higher education students will take at least one online course within 5 years

Chapter 2. Higher Education in Science and Engineering
2 | 20National Science Board | Science & Engineering Indicators 2016
(Allen and Seaman 2014). The survey also showed that a very small segment of higher education institutions (5%)are experimenting with massive open online courses (MOOCs). Doctoral research institutions were much more likelythan other types of institutions to offer a MOOC.
MOOCs can provide broad access to higher education for free or at a very low cost. Through their online platforms,MOOCs also have the potential to collect massive amounts of information that can be used to conduct experimentalresearch on how people learn and to identify online practices that improve learning (ED/OET 2013).
Nationally representative data on MOOCs are not available. However, research conducted on the first 17 online
courses offered by HarvardX and MITx on the edX platform reveals that completion rates were low (Ho et al. 2014).
Out of more than 840,000 registrants in these courses, 5% earned certificates of completion, but 4% explored[viii]
more than half of the content of the course without receiving their certification, and 54% accessed less than half ofthe course content. Ho and colleagues (2014) point out that open online registration in a MOOC is different fromenrollment in traditional courses because students can enroll at no monetary cost and with a small timecommitment. Others emphasize that many students register for MOOCs to explore the course material and do notintend to complete the courses in which they enroll. The low overall completion rates do not take into accountstudents’ intentions (Ho et al. 2014).
Online education companies offering MOOCs have recently expanded their offerings to certificate programs. Forinstance, Coursera began to offer courses in its fee-based Signature Track with a variety of specializations, most ofwhich are in practical fields such as project management, cloud computing, and data mining (Kolowich 2014).Udacity partnered with AT&T to offer “nanodegrees” that teach students a specific set of skills that can be clearlyapplied to a job; AT&T accepts the nanodegrees as a credential for entry-level jobs and has reserved 100internships for its graduates (Porter 2014). The Georgia Institute of Technology, in collaboration with Udacity andAT&T, began to offer an online master’s program in computer science, which combines MOOC-like course videosand assessments with a support system that works directly with students. The university’s goal is to create amaster’s degree program that is just as rigorous as the one offered on campus but at a much lower cost.
Changing modes of online education are prompting questions about how the use of this technology will affect thehigher education sector. In particular, it is not yet clear how many students can sustain commitment to learning inthe absence of more personal contact and to what extent the growing access to higher education facilitated byMOOCs will translate into learning and, in the long run, to higher levels of educational achievement.
[viii] HarvardX and MITx are “collaborative institutional efforts between Harvard University and MIT to enhancecampus-based education, advance educational research, and increase access to online learning opportunitiesworldwide” (Ho et al. 2014).
Trends in Higher Education Expenditures and Revenues
Higher education spending and revenue patterns changed substantially over the last two decades, in trends thatintensified during the economic downturn of the late 2000s. Although all types of higher education institutions facedcompeting demands in a stringent budget environment, each type faced unique challenges. Through 2010,increases in the number of students seeking an affordable college education compounded the challenges created bytight budgets. Despite declines in enrollment in 2011–13 (Appendix Table 2-4), these challenges have remained.This section shows trends in inflation-adjusted average spending and revenue per full-time equivalent (FTE) student
from 1987 to 2012, based on data from the Delta Cost Project.[i] [ii]

Chapter 2. Higher Education in Science and Engineering
2 | 21National Science Board | Science & Engineering Indicators 2016
Very High Research Universities—Public and Private Institutions
Net tuition and federal appropriations, grants, and contracts are two large sources of revenues centrally involved
with education for both public and private very high research institutions (Appendix Table 2-5). For public[iii]
institutions, state and local appropriations are also critical, supplying an amount of revenue similar to either of theother two sources (nearly $8,500 per FTE in 2012); in contrast, they are a small source of revenue for their privatecounterparts (about $400 per FTE in 2012). Much more important for private institutions are private and affiliated
gifts, investment returns, and endowment income, which are usually the largest sources of revenue other than[iv]
that from hospitals and other independent operations.[v]
State and local appropriations for public very high research universities have declined since 1987, with aparticularly steep drop between 2008 and 2012 ( ). This decline coincided with a compensating increaseFigure 2-1in net tuition. In 1987, average state appropriations per FTE at public very high research institutions were morethan three times the amount of net tuition ($13,800 versus $4,000). By 2012, however, appropriations haddropped to almost $8,500 per FTE, whereas net tuition had increased from about $4,000 to about $11,100 per FTE(Appendix Table 2-5). This change represents a shift in tuition burden from state and local governments toindividual students and their families. Starting at a higher level, net tuition at private very high researchuniversities also increased during this period. The increase, from almost $17,000 to almost $25,000, wasproportionally much smaller.
[i] FTE enrollments are derived from the “Enrollment by Race/Ethnicity” section of the IPEDS Fall Enrollment survey.The FTE of an institution’s part-time enrollment is estimated by multiplying part-time enrollment by factors thatvary by control and level of institution and level of student; the estimated FTE of part-time enrollment is thenadded to the institution’s FTE. This formula is used by the U.S. Department of Education to produce the FTEenrollment data published annually in the .Digest of Education Statistics
[ii] For the definition of “net tuition revenue,” see “Glossary.” Definitions of standard expense categories areavailable in the Data Dictionary at http://www.deltacostproject.org/delta-cost-project-database, and an explanationof revenue sources is available at http://www.deltacostproject.org/sites/default/files/products/Revenue_Trends_Production.pdf.
[iii] Another large source of revenue for very high research institutions is “hospitals, independent operations, andother sources,” which includes revenue generated by hospitals operated by the institution and revenuesindependent of or unrelated to instruction, research, or public services.
[iv] Investment returns include both realized and unrealized gains and losses. Institutions report the change in thevalue of their investment account, which is the reason behind the negative values under this category in AppendixTable 2-5. So investment returns may not always represent revenue for the institution.
[v] In 2012, income from private and affiliated gifts, investment returns, and endowment income at private veryhigh research institutions was $37,000 per FTE compared with $25,000 in income from net tuition and $28,000 inincome from federal appropriations (appendix table 2-5).

Chapter 2. Higher Education in Science and Engineering
2 | 22National Science Board | Science & Engineering Indicators 2016
Figure 2-1
Selected average revenues and expenditures at public very high research universities: 1987–2012
NOTE: Data are per full-time equivalent.
SOURCE: IPEDS Analytics: Delta Cost Project Database, 1987–2012, special tabulations (2015).
Science and Engineering Indicators 2016
Revenue from federal appropriations, grants, and contracts, the source used for most research expenditures, ishighest at the most research-intensive universities (Appendix Table 2-5). Between 1987 and 2012, revenue per FTEfrom these funds increased at public and private very high research institutions. At the public universities, thesefunds increased by 78%, reaching a level similar to the state and local appropriations (about $8,700). At privatevery high research institutions, the funds increased by about 60% in this 25-year period.
Research and instruction are the two largest core education expenditures at public and private very high researchuniversities. Between 1987 and 2012, research expenditures per FTE increased substantially at both types ofinstitutions—by 90% at private universities and by 75% at their public counterparts ( ; Appendix TableFigure 2-22-6). See chapter 5 section Academic R&D, by Public and Private Institutions for greater deatil on universityresearch spending.

Chapter 2. Higher Education in Science and Engineering
2 | 23National Science Board | Science & Engineering Indicators 2016
Figure 2-2
Average expenditures per FTE on research at public and private very high research universities:1987–2012
FTE = full-time equivalent.
SOURCE: IPEDS Analytics: Delta Cost Project Database, 1987–2012, special tabulations (2015).
Science and Engineering Indicators 2016
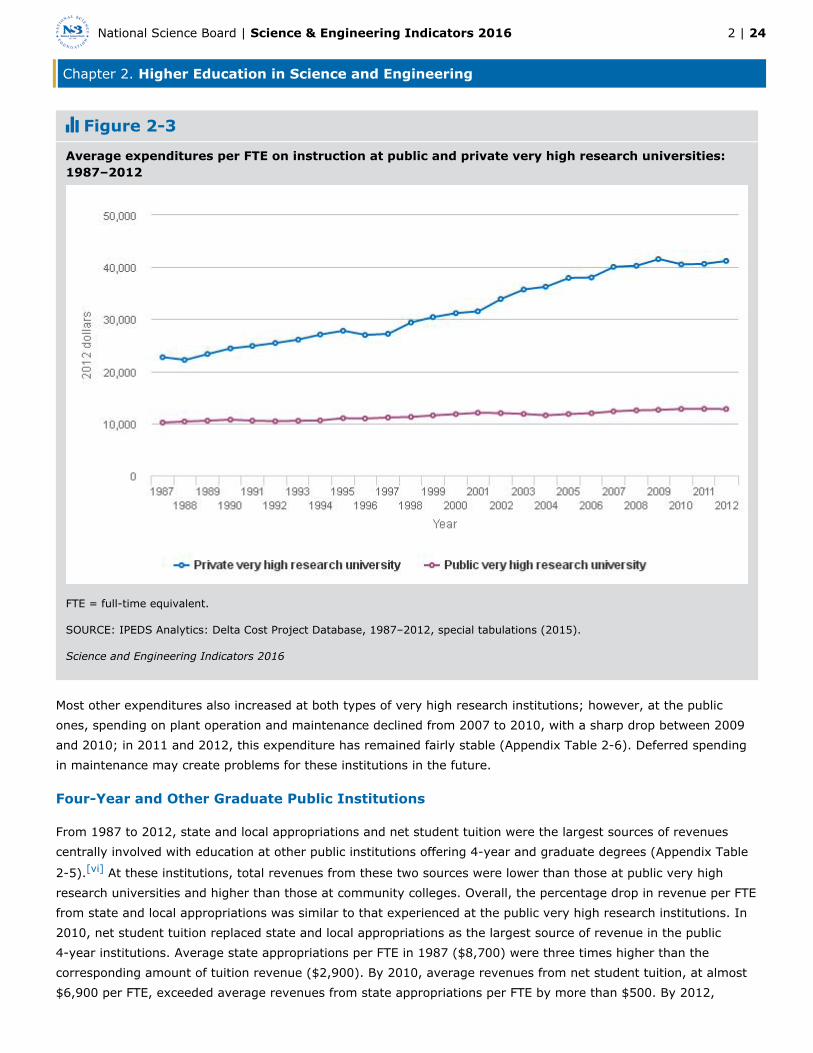
Instructional spending per FTE followed a pattern similar to that of research expenditures. It was much higher atprivate very high research institutions than at their public counterparts, and it increased at a higher rate. In thelate 1980s and early 1990s, instructional spending at private very high research universities was slightly more thandouble that of the public universities. By the mid-2000s, it was more than triple ( ).Figure 2-3
Chapter 2. Higher Education in Science and Engineering
2 | 24National Science Board | Science & Engineering Indicators 2016
Figure 2-3
Average expenditures per FTE on instruction at public and private very high research universities:1987–2012
FTE = full-time equivalent.
SOURCE: IPEDS Analytics: Delta Cost Project Database, 1987–2012, special tabulations (2015).
Science and Engineering Indicators 2016
Most other expenditures also increased at both types of very high research institutions; however, at the publicones, spending on plant operation and maintenance declined from 2007 to 2010, with a sharp drop between 2009and 2010; in 2011 and 2012, this expenditure has remained fairly stable (Appendix Table 2-6). Deferred spendingin maintenance may create problems for these institutions in the future.
Four-Year and Other Graduate Public Institutions
From 1987 to 2012, state and local appropriations and net student tuition were the largest sources of revenuescentrally involved with education at other public institutions offering 4-year and graduate degrees (Appendix Table
2-5). At these institutions, total revenues from these two sources were lower than those at public very high[vi]
research universities and higher than those at community colleges. Overall, the percentage drop in revenue per FTEfrom state and local appropriations was similar to that experienced at the public very high research institutions. In2010, net student tuition replaced state and local appropriations as the largest source of revenue in the public4-year institutions. Average state appropriations per FTE in 1987 ($8,700) were three times higher than thecorresponding amount of tuition revenue ($2,900). By 2010, average revenues from net student tuition, at almost$6,900 per FTE, exceeded average revenues from state appropriations per FTE by more than $500. By 2012,

Chapter 2. Higher Education in Science and Engineering
2 | 25National Science Board | Science & Engineering Indicators 2016
average revenues from net tuition increased even further, to more than $1,600 over the average revenues fromstate appropriations ( ). As in the case of public very high research institutions, this change represents aFigure 2-4shift in tuition burden from state and local governments to individual students and their families.
[vi] The 4-year and graduate institutions category includes the following 2010 Carnegie institution types:doctorate-granting universities—high research activity, doctoral/research universities, master’s colleges anduniversities, and baccalaureate colleges. The data in this section correspond to the public institutions.

Chapter 2. Higher Education in Science and Engineering
2 | 26National Science Board | Science & Engineering Indicators 2016
Figure 2-4
Selected average revenues and expenditures at public 4-year and other postsecondary institutions:1987–2012
NOTES: Average expenditures and revenues are per full-time equivalent. Four-year and other postsecondary institutionsinclude doctorate-granting universities—high research activity, doctoral/research universities, master’s colleges anduniversities, and baccalaureate colleges, according to the 2005 Carnegie Classification of Institutions of Higher Education.
SOURCE: IPEDS Analytics: Delta Cost Project Database, 1987–2012, special tabulations (2015).
Science and Engineering Indicators 2016
Spending on instruction at these institutions has been at least three times as high as almost all the other standardexpense categories. It increased from an average of nearly $6,100 per FTE in 1987 to about $7,000 per FTE in2012 (Appendix Table 2-6). Other expenditures represented much smaller shares of total spending; most of theseexpenditures increased. Spending on plant operation and maintenance fell by 6% over the 25-year period, with asteep decline from 2009 to 2010 (18%).
Community Colleges
Revenues and expenditures are much lower for community colleges than for other public institutions of higher
education. As in the other institutions, the main sources of revenue at community colleges are state and local[vii]
appropriations and net student tuition (Appendix Table 2-5). In 2012, average revenues from state and localappropriations at community colleges were about $5,700 per FTE, compared with $8,500 at public very highresearch institutions; average revenues from net tuition were about $3,700 per FTE, compared with about $11,100at public very high research institutions. Unlike other public institutions, revenue from state and localappropriations at community colleges still exceeded net tuition revenue in 2012.

Chapter 2. Higher Education in Science and Engineering
2 | 27National Science Board | Science & Engineering Indicators 2016
Between 1987 and 2012, revenues from state and local appropriations at community colleges decreased from anaverage of $7,100 per FTE to $5,700 per FTE, with a steep drop from 2008 to 2010 ( ). During thisFigure 2-525-year period, as state support declined, revenues from net tuition more than doubled. In 1987, revenues fromstate and local appropriations represented 64% of total revenues at community colleges, and tuition accounted for15%. By 2012, state and local appropriations had dropped to 46% of total revenues, whereas the proportion ofrevenues from tuition doubled to 30%.
[vii] Community colleges are the public “associate’s colleges” in the 2010 Carnegie Classification of Institutions ofHigher Education.
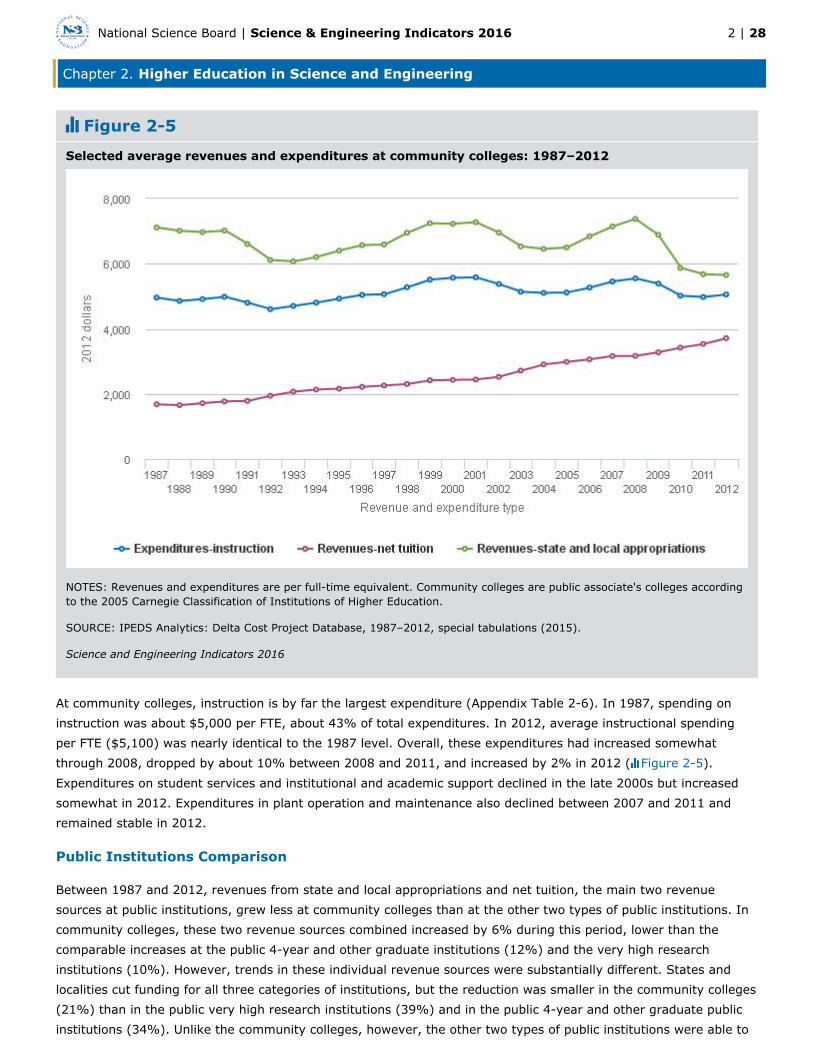
Chapter 2. Higher Education in Science and Engineering
2 | 28National Science Board | Science & Engineering Indicators 2016
Figure 2-5
Selected average revenues and expenditures at community colleges: 1987–2012
NOTES: Revenues and expenditures are per full-time equivalent. Community colleges are public associate's colleges accordingto the 2005 Carnegie Classification of Institutions of Higher Education.
SOURCE: IPEDS Analytics: Delta Cost Project Database, 1987–2012, special tabulations (2015).
Science and Engineering Indicators 2016
At community colleges, instruction is by far the largest expenditure (Appendix Table 2-6). In 1987, spending oninstruction was about $5,000 per FTE, about 43% of total expenditures. In 2012, average instructional spendingper FTE ($5,100) was nearly identical to the 1987 level. Overall, these expenditures had increased somewhatthrough 2008, dropped by about 10% between 2008 and 2011, and increased by 2% in 2012 ( ).Figure 2-5Expenditures on student services and institutional and academic support declined in the late 2000s but increasedsomewhat in 2012. Expenditures in plant operation and maintenance also declined between 2007 and 2011 andremained stable in 2012.
Public Institutions Comparison
Between 1987 and 2012, revenues from state and local appropriations and net tuition, the main two revenuesources at public institutions, grew less at community colleges than at the other two types of public institutions. Incommunity colleges, these two revenue sources combined increased by 6% during this period, lower than thecomparable increases at the public 4-year and other graduate institutions (12%) and the very high researchinstitutions (10%). However, trends in these individual revenue sources were substantially different. States andlocalities cut funding for all three categories of institutions, but the reduction was smaller in the community colleges(21%) than in the public very high research institutions (39%) and in the public 4-year and other graduate publicinstitutions (34%). Unlike the community colleges, however, the other two types of public institutions were able to

Chapter 2. Higher Education in Science and Engineering
2 | 29National Science Board | Science & Engineering Indicators 2016
increase revenues from net tuition to a greater extent. FTE net tuition revenues increased by 175% at the publicvery high research universities and by 152% at the 4-year and other graduate public institutions, compared with121% at community colleges (Appendix Table 2-5).
Expenditures for instruction followed a different pattern. They rose most rapidly at the public very high researchinstitutions (26%), where there was pressure to keep faculty salaries (a major component of instructionalexpenses) competitive with those of their private counterparts, which spent more on instruction to begin with andwere increasing these expenses at an even more rapid rate (82%) (Appendix Table 2-6). At community colleges,
FTE instructional expenses were essentially the same at the end of the period as they were at the beginning; in[viii]
4-year and other graduate institutions, they fell somewhere in between. Overall, during this period, communitycolleges had more limited resources and less flexibility to draw on alternate revenue sources to support theirinstructional expenses. Despite the decline in enrollment in fall 2011 and fall 2012, average expenditures ininstruction did not change much in these last 2 years (see section, Undergraduate Enrollment in the United States).
[viii] The proportion of U.S.-trained doctorate holders employed at community colleges in adjunct positions grewfrom 12% in 1993 to 27% in 2013, according to estimates from the Survey of Doctorate Recipients. This suggeststhat one of the ways community colleges may have reined in expenses during this period was to increase theirreliance on adjuncts.
Financing Higher Education
Cost of Higher Education
Affordability and access to U.S. higher education institutions are continuing concerns (Sullivan et al. 2012; GAO2014). According to the College Board, between 2009–10 and 2014–15, the estimated average net tuition and fees(i.e., the published prices minus grant aid and tax benefits) paid by full-time undergraduate students in public4-year colleges increased by about 50% in constant 2014 U.S. dollars (College Board 2014a). Net prices at theseinstitutions had increased considerably between 2009–10 and 2012–13 but declined slightly in the last 2 years. Atprivate nonprofit institutions, net tuition and fees in 2014–15 were 3% lower than in 2009–10, although theyincreased by 4% in the last year. At public 2-year colleges, net tuition and fees have declined overall; since2009–10, on average, students enrolled full time have received enough funding through federal and other sourcesto cover tuition, fees, and other expenses (–$1,740 net tuition in 2014–15) ( ) (College Board 2014a).Table 2-8Despite large percentage tuition increases in public institutions, they are still more affordable than their privatecounterparts.
Table 2-8Net tuition and fees for full-time undergraduate students by institutionalcontrol: 2009–10 through 2014–15
(2014 U.S. dollars)
Institutional control 2009–10 2010–11 2011–12 2012–13 2013–14 2014–15a
Public 2-year -1,240 -1,680 -1,610 -1,540 -1,780 -1,740
Public 4-yearb 2,030 2,140 2,960 3,150 2,950 3,030
Private nonprofit 4-year 12,730 12,010 11,910 12,120 11,860 12,360
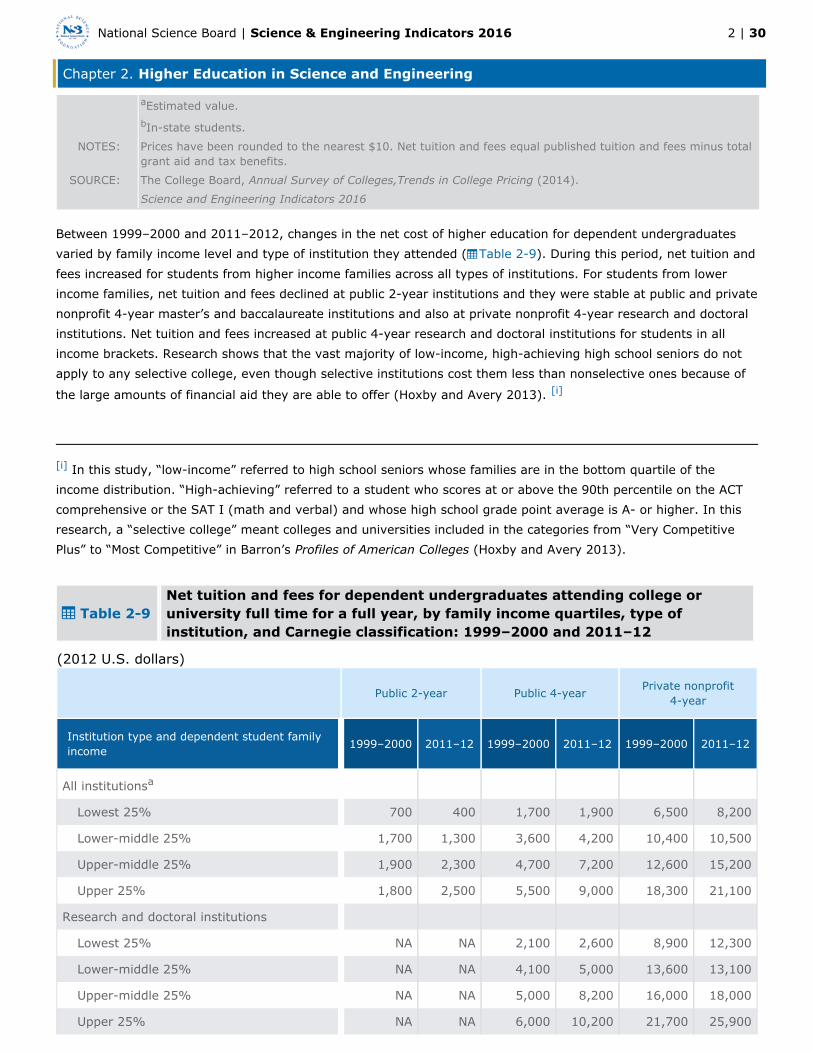
Chapter 2. Higher Education in Science and Engineering
2 | 30National Science Board | Science & Engineering Indicators 2016
aEstimated value.bIn-state students.
NOTES: Prices have been rounded to the nearest $10. Net tuition and fees equal published tuition and fees minus totalgrant aid and tax benefits.
SOURCE: The College Board, (2014).Annual Survey of Colleges,Trends in College Pricing
Science and Engineering Indicators 2016
Between 1999–2000 and 2011–2012, changes in the net cost of higher education for dependent undergraduatesvaried by family income level and type of institution they attended ( ). During this period, net tuition andTable 2-9fees increased for students from higher income families across all types of institutions. For students from lowerincome families, net tuition and fees declined at public 2-year institutions and they were stable at public and privatenonprofit 4-year master’s and baccalaureate institutions and also at private nonprofit 4-year research and doctoralinstitutions. Net tuition and fees increased at public 4-year research and doctoral institutions for students in allincome brackets. Research shows that the vast majority of low-income, high-achieving high school seniors do notapply to any selective college, even though selective institutions cost them less than nonselective ones because of
the large amounts of financial aid they are able to offer (Hoxby and Avery 2013). [i]
[i] In this study, “low-income” referred to high school seniors whose families are in the bottom quartile of theincome distribution. “High-achieving” referred to a student who scores at or above the 90th percentile on the ACTcomprehensive or the SAT I (math and verbal) and whose high school grade point average is A- or higher. In thisresearch, a “selective college” meant colleges and universities included in the categories from “Very CompetitivePlus” to “Most Competitive” in Barron’s (Hoxby and Avery 2013).Profiles of American Colleges
Table 2-9Net tuition and fees for dependent undergraduates attending college oruniversity full time for a full year, by family income quartiles, type ofinstitution, and Carnegie classification: 1999–2000 and 2011–12
(2012 U.S. dollars)
Public 2-year Public 4-yearPrivate nonprofit
4-year
Institution type and dependent student familyincome
1999–2000 2011–12 1999–2000 2011–12 1999–2000 2011–12
All institutionsa
Lowest 25% 700 400 1,700 1,900 6,500 8,200
Lower-middle 25% 1,700 1,300 3,600 4,200 10,400 10,500
Upper-middle 25% 1,900 2,300 4,700 7,200 12,600 15,200
Upper 25% 1,800 2,500 5,500 9,000 18,300 21,100
Research and doctoral institutions
Lowest 25% NA NA 2,100 2,600 8,900 12,300
Lower-middle 25% NA NA 4,100 5,000 13,600 13,100
Upper-middle 25% NA NA 5,000 8,200 16,000 18,000
Upper 25% NA NA 6,000 10,200 21,700 25,900

Chapter 2. Higher Education in Science and Engineering
2 | 31National Science Board | Science & Engineering Indicators 2016
Public 2-year Public 4-year Private nonprofit4-year
Institution type and dependent student familyincome
1999–2000 2011–12 1999–2000 2011–12 1999–2000 2011–12
Master's and baccalaureate institutions
Lowest 25% NA NA 1,300 1,200 5,400 6,500
Lower-middle 25% NA NA 2,900 3,400 9,100 9,600
Upper-middle 25% NA NA 4,300 6,100 11,000 13,800
Upper 25% NA NA 4,400 7,100 15,700 18,600
NA = not available.a Includes all degree-granting institutions: associate's, master's, baccalaureate, research and doctoral, andspecial focus and other institutions.
NOTES: Full-time status for the purposes of financial aid eligibility was based on 12 credit hours, unless the awardinginstitution employed a different standard. Data are rounded to the nearest 100. Not all changes observed overtime are statistically significant.
SOURCE: U.S. Department of Education, National Center for Educational Statistics, 1999–2000 and 2011–12 NationalPostsecondary Student Aid Study, 1999–2000 and 2011–12.
Science and Engineering Indicators 2016
Undergraduate Financial Support Patterns and Debt
Financial Support for Undergraduate Education. With rising tuition, students increasingly rely on financial aidto fund their education. Financial aid for undergraduate students comes mainly in the form of student loans (federaland nonfederal), grants (federal, state, institutional, and private), and tuition tax credits. A financial aid package
may contain one or more of these kinds of support. In the 2013–14 academic year, federal loans constituted[ii]
33% of the $185 billion in student aid that undergraduate students received, down from 37% in 2003–04, followedby federal grants (24%, up from 18%), institutional grants (20%, up from 17%), education tax benefits (8%versus 5%), private and employer grants (6%, the same proportion in 2003–04 and in 2013–14), state grants (5%versus 7%), and federal work-study programs (about 1% in both of those years) (College Board 2014b). Accordingto the latest data available from the NCES National Postsecondary Student Aid Study, a higher proportion ofundergraduates in private for-profit institutions (90%) and in private nonprofit 4-year institutions (86%) than thosein public 4-year (74%) or public 2-year (57%) institutions received some type of financial aid. Undergraduates inprivate for-profit and private nonprofit institutions were also more likely to incur student loans (75% and 62%)
than those in public 4-year institutions (50%) and public 2-year institutions (18%) (Ifill and Shaw 2013).[iii]
Undergraduate Debt. Among recent graduates with S&E bachelor’s degrees, the level of undergraduate debt doesnot vary much by undergraduate major, although it is somewhat higher for recent recipients of life sciences and
social and related sciences bachelor’s degrees. Levels of debt vary to a greater extent by type of institution and[iv]
state. The extent of undergraduate indebtedness of students from public colleges and universities is almost as highas that for students from private nonprofit universities (about 60% at graduation). The level of debt differs,however: $25,600 per borrower for those graduating from a public institution and $31,200 for those graduatingfrom private nonprofits. Students who attend private for-profit institutions are more likely to borrow, and to borrowlarger amounts, than those who attend public and private nonprofit institutions (College Board 2014b).
Chapter 2. Higher Education in Science and Engineering
2 | 32National Science Board | Science & Engineering Indicators 2016
Levels of debt varied widely by state. Average debt for 2013 graduates of public 4-year colleges and universitiesranged from $18,065 in Utah to $34,170 in New Hampshire. Average debt for graduates of private nonprofitcolleges and universities ranged from $9,757 in Alaska to $36,300 in Connecticut (Institute for College Access &Success, College InSight 2014). Cost of living may account for some of the differences by state.
Graduate Financial Support Patterns and Debt
Financial Support for S&E Graduate Education. In 2013, nearly 40% of all S&E graduate students wereprimarily self-supporting (i.e., they rely primarily on loans, their own funds, or family funds for financial support)(Appendix Table 2-7). The other 60% receive primary financial support from a variety of sources, including thefederal government, universities, employers, nonprofit organizations, and foreign governments. The proportion ofS&E graduate students who are self-supporting has been gradually increasing in the last 15 years, from aboutone-third in 1998 to 38% in 2013. The growth in self-supporting students is related to increasing enrollment ofgraduate students on temporary visas, who are mostly self-supporting (NSF/NCSES 2015b; IIE 2014).
Sources of funding include federal agency support, nonfederal support, and self-support. Nonfederal supportincludes state funds, particularly in the large public university systems; these funds are affected by the condition ofoverall state budgets. Support mechanisms include research assistantships (RAs), teaching assistantships (TAs),fellowships, and traineeships. Most graduate students, especially those who pursue doctoral degrees, are supportedby more than one source or mechanism during their time in graduate school, and some receive support fromseveral different sources and mechanisms in any given academic year.
Other than self-support, over time RAs have been the most prevalent primary mechanism of financial support forfull-time S&E graduate students (Appendix Table 2-7). In 2013, 25% of full-time S&E graduate students weresupported primarily by RAs, 19% primarily by TAs, and 12% primarily by fellowships or traineeships (AppendixTable 2-7).
Primary mechanisms of support differ widely by S&E field of study ( ; Appendix Table 2-8). In fall 2013,Figure 2-6full-time students in physical sciences were financially supported mainly through TAs (40%) and RAs (37%). RAswere also important in agricultural sciences (49%); earth, atmospheric, and ocean sciences (36%); biologicalsciences (36%); and engineering (34%; in particular, in materials and chemical engineering). In mathematics,nearly half (49%) of the full-time students were supported primarily through TAs, and 26% were self-supported.Full-time students in computer sciences and the social and behavioral sciences were mainly self-supported (56%and 47%, respectively). About 20% of full-time students in computer sciences received an RA, and 13% had a TA;21% of those in the social and behavioral sciences had a TA, and only 11% received an RA. Students in medical
and other health sciences were mainly self-supported (60%).[v]
[ii] Data for 2013–14 are preliminary (College Board 2014b).
[iii] These percentages include students whose financial aid package included student loans in combination withgrants or other student aid, as well as those who only had student loans.
[iv] Based on a special tabulation of the 2013 NSCG. A recent graduate is a respondent who received his or hermost recent bachelor’s degree between 1 July 2006 and 30 June 2011.
[v] The NSF/NCSES Survey of Graduate Students and Postdoctorates in Science and Engineering does not collectseparate data for the master’s and the doctoral level. For data on the primary source of financial support ofdoctorate recipients by broad field of study, see Appendix Table 2-13.

Chapter 2. Higher Education in Science and Engineering
2 | 33National Science Board | Science & Engineering Indicators 2016
Figure 2-6
Full-time S&E graduate students, by field and mechanism of primary support: 2013
NOTE: Self-support includes any loans (including federal) and support from personal or family financial contributions.
SOURCE: National Science Foundation, National Center for Science and Engineering Statistics, special tabulations (2014) ofthe 2013 Survey of Graduate Students and Postdoctorates in Science and Engineering.
Science and Engineering Indicators 2016
The federal government plays a substantial role in supporting S&E graduate students in some fields but a smallerrole in others. Federal financial support for graduate education reaches a larger proportion of students in thebiological sciences; the physical sciences; the earth, atmospheric, and ocean sciences; and engineering. Lowerproportions of students in computer sciences, mathematics and statistics, medical and other health sciences,psychology, and the social sciences receive federal support ( ). Appendix Table 2-9 provides detailedFigure 2-7information by field and mechanism.
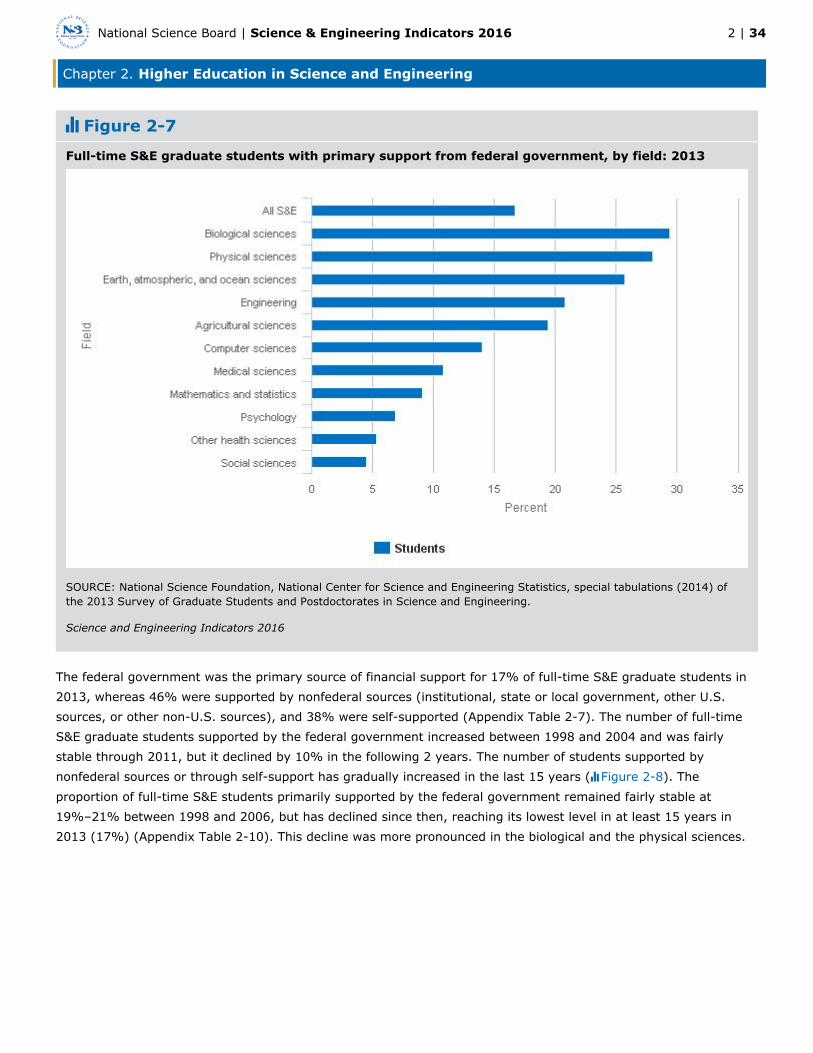
Chapter 2. Higher Education in Science and Engineering
2 | 34National Science Board | Science & Engineering Indicators 2016
Figure 2-7
Full-time S&E graduate students with primary support from federal government, by field: 2013
SOURCE: National Science Foundation, National Center for Science and Engineering Statistics, special tabulations (2014) ofthe 2013 Survey of Graduate Students and Postdoctorates in Science and Engineering.
Science and Engineering Indicators 2016
The federal government was the primary source of financial support for 17% of full-time S&E graduate students in2013, whereas 46% were supported by nonfederal sources (institutional, state or local government, other U.S.sources, or other non-U.S. sources), and 38% were self-supported (Appendix Table 2-7). The number of full-timeS&E graduate students supported by the federal government increased between 1998 and 2004 and was fairlystable through 2011, but it declined by 10% in the following 2 years. The number of students supported bynonfederal sources or through self-support has gradually increased in the last 15 years ( ). TheFigure 2-8proportion of full-time S&E students primarily supported by the federal government remained fairly stable at19%–21% between 1998 and 2006, but has declined since then, reaching its lowest level in at least 15 years in2013 (17%) (Appendix Table 2-10). This decline was more pronounced in the biological and the physical sciences.

Chapter 2. Higher Education in Science and Engineering
2 | 35National Science Board | Science & Engineering Indicators 2016
Figure 2-8
Full-time S&E graduate students, by source of primary support: 1998–2013
NOTES: Self-support includes any loans (including federal) and support from personal or family financial contributions. In2007, the survey was redesigned to improve reporting. In this figure, "2007" shows data as collected in 2007. Because ofmethodological changes, counts should be used with caution for trend analysis. See http://www.nsf.gov/statistics/nsf10307/for more detail. S&E excludes fields that were collected in this survey starting in 2007 (architecture, communication, andfamily and consumer sciences/human sciences) that are not included in other tables in this report from other data sources.
SOURCE: National Science Foundation, National Center for Science and Engineering Statistics, special tabulations (2014) ofthe 2013 Survey of Graduate Students and Postdoctorates in Science and Engineering.
Science and Engineering Indicators 2016
For some mechanisms of support, the federal role is fairly large. In 2013, the federal government funded 60% ofS&E graduate students who were on traineeships, 48% of those with RAs, and 23% of those with fellowships(Appendix Table 2-9).
Most federal financial support for graduate education is in the form of RAs funded through grants to universities foracademic research. RAs are the primary mechanism of support for 72% of federally supported full-time S&Egraduate students. Fellowships and traineeships are the means of funding for 21% of the federally funded full-timeS&E graduate students. For students supported through nonfederal sources in 2013, TAs (i.e., institutional funds)were the most prominent mechanism (40%), followed by RAs (29%) (Appendix Table 2-7).
The National Institutes of Health (NIH) and NSF support most of the full-time S&E graduate students whoseprimary support comes from the federal government, followed by the U.S. Department of Defense (DOD) (AppendixTable 2-11). In 2013, NIH supported about 22,000 S&E graduate students, NSF about 23,000, and DOD about8,000. Trends in federal agency support of graduate students show considerable increases from 1998 to 2013 inthe proportion of students funded by NSF, from 21% to 30% (Appendix Table 2-11). NSF supported nearly 57% of

Chapter 2. Higher Education in Science and Engineering
2 | 36National Science Board | Science & Engineering Indicators 2016
students in computer sciences or mathematics whose primary support comes from the federal government; 49% ofthose in earth, atmospheric, and ocean sciences; 40% of those in the physical sciences; and 36% of those inengineering overall (about 46% of those in chemical engineering and 44% of those in electrical engineering)(Appendix Table 2-12). The proportion of students funded by NIH increased from 29% to 33% between 1998 and2008 but has since decreased to 29%. In 2013, NIH funded about 71% of such students in the biological sciences,56% of those in the medical sciences, and 38% of those in psychology. The proportion of graduate studentssupported by DOD decreased slightly between 1998 and 2013. In 2013, DOD supported 44% of the S&E graduatestudents in aerospace engineering, 33% of those in industrial engineering, 29% of those in electrical engineering,and 21%-23% of those in materials and mechanical engineering and in computer sciences.
For doctoral degree students, notable differences exist in primary support mechanisms by type ofdoctorate-granting institution ( ). In 2013, RAs were the primary support mechanism for S&E doctorateTable 2-10recipients from research universities (i.e., doctorate-granting institutions with very high research activity, whichreceive the most federal funding, as well as those with high research activity). For those from medical schools,which are heavily funded by NIH, fellowships or traineeships accounted for the main mechanism of support.Students at less research-intensive universities relied mostly on personal funds.
Table 2-10Primary support mechanisms for S&E doctorate recipients, by 2010Carnegie classification of doctorate-granting institution: 2013
MechanismAll
institutions
Researchuniversities—very
high researchactivity
Researchuniversities—highresearch activity
Doctoral/researchuniversities
Medicalschools
andmedicalcenters
Other/notclassified
Doctoraterecipients(number)
39,334 29,415 6,409 1,468 1,250 792
Allmechanisms
100.0 100.0 100.0 100.0 100.0 100.0
Fellowshiportraineeship
19.8 21.5 12.7 10.7 32.6 11.5
Grant 6.5 6.9 3.3 3.1 19.1 4.5
Teachingassistantship
16.5 16.7 21.8 8.0 1.0 8.0
Researchassistantship
33.8 36.8 30.7 12.2 19.0 11.0
Personal 9.0 5.7 14.3 41.5 9.1 28.2
Other 3.8 3.3 5.3 7.1 5.4 4.8
Unknown 10.5 9.2 11.9 17.4 13.8 32.1
NOTES: Personal support mechanisms include personal savings, other personal earnings, other family earnings orsavings, and loans. Research assistantships include research assistantships and other assistantships.Traineeships include internships and residencies. Other support mechanisms include employer reimbursementor assistance, foreign support, and other sources. Percentages may not add to total because of rounding.
SOURCE: National Science Foundation, National Center for Science and Engineering Statistics, special tabulations (2014)of the 2013 Survey of Earned Doctorates.
Chapter 2. Higher Education in Science and Engineering
2 | 37National Science Board | Science & Engineering Indicators 2016
Science and Engineering Indicators 2016
Notable differences also exist in primary support mechanisms for doctoral degree students by sex, race andethnicity, and citizenship (Appendix Table 2-13). In 2011–13, among U.S. citizens and permanent residents, maleS&E doctorate recipients were more likely than their female peers to be supported by RAs (31% compared with23%). Female S&E doctorate recipients were more likely than their male counterparts to receive fellowships ortraineeships (28% versus 24%) and to support themselves from personal sources (18% versus 11%). Also, Asianswere more likely than any other racial or ethnic group to have primary RA support (32%), followed by whites(28%). Compared with other racial and ethnic groups, Hispanic, black, and American Indian or Alaska Nativedoctorate recipients depended more on fellowships or traineeships (34%, 35%, and 44%, respectively), and blacksand American Indians or Alaska Natives were more likely to use personal sources (25% and 20%, respectively).S&E doctorate recipients on temporary visas were more likely to have an RA (51%) than their U.S. citizen andpermanent resident peers (27%); this is has been a long-standing pattern.
To some extent, the sex, citizenship, and racial and ethnic differences in types of support mechanisms are relatedto differences in field of study. White and Asian men, as well as international doctoral degree students, are morelikely than white and Asian women, along with underrepresented minority students of both sexes, to receivedoctorates in engineering and physical sciences, fields that are largely supported by RAs. In turn, women andunderrepresented minorities are more likely to receive doctorates in social sciences and psychology, in whichself-support is prevalent. However, differences in type of support by sex, race and ethnicity, or citizenship largelyremain after accounting for these doctoral field patterns (Appendix Table 2-13).
Graduate Debt. At the time of doctoral degree conferral, 45% of 2013 S&E doctorate recipients have debt relatedto their undergraduate or graduate education. In 2013, 30% of S&E doctorate recipients reported havingundergraduate debt, 33% reported having graduate debt, and 45% had undergraduate and graduate debt. Forsome S&E doctorate recipients, debt levels were high, especially for graduate debt: 5% reported more than$40,000 of undergraduate debt, 13% reported more than $40,000 of graduate debt, and 21% reported more than$40,000 in cumulative undergraduate and graduate debt (Appendix Table 2-14).
Levels of debt vary widely by doctoral field. A higher percentage of doctorate recipients in non-S&E fields (52%)than those in S&E fields (33%) reported graduate debt. In 2013, within S&E, high levels of graduate debt weremost common among doctorate recipients in the social sciences, psychology, and the medical and other healthsciences. The proportion of doctorate recipients in these fields who reported graduate debt has increased since
2003. Psychology doctorate recipients were most likely to report having graduate debt and high levels of debt.[vi]
In 2013, 26% of psychology doctoral degree recipients reported graduate debt of more than $70,000 (Appendix[vii]
Table 2-14). Doctorate recipients in mathematics and computer sciences were the least likely to report graduatedebt.
Men and women differed little in level of undergraduate debt, but women were more likely to have accumulatedhigher graduate debt. U.S. doctorate holders accumulated more debt than temporary visa holders. Blacks,Hispanics, and American Indians and Alaska Natives had higher levels of graduate debt than whites, evenaccounting for differences in field of doctorate (NSF/NCSES 2015a).
[vi] For the proportions corresponding to the 2003 Survey of Earned Doctorates, please see NSB 2006, AppendixTable 2-23 at http://nsf.gov/statistics/seind06/append/c2/at02-23.pdf.

Chapter 2. Higher Education in Science and Engineering
2 | 38National Science Board | Science & Engineering Indicators 2016
[vii] Clinical psychology programs and programs that emphasize professional practice (professional schools andPsyD programs) are associated with higher debt, but even in the more research-focused subfields of psychology,lower percentages of doctorate recipients were debt free, and higher percentages had higher levels of debt, thanthose in other S&E fields. For information on debt levels of clinical versus nonclinical psychology doctorates in1993–96, see (NSF 00-321) at http:/Psychology Doctorate Recipients: How Much Financial Debt at Graduation?/www.nsf.gov/statistics/issuebrf/sib00321.htm. Accessed 5 October 2015.
Chapter 2. Higher Education in Science and Engineering
2 | 39National Science Board | Science & Engineering Indicators 2016
Undergraduate Education, Enrollment, and Degrees in the United States
Undergraduate education in S&E courses prepares students majoring in S&E for the workforce. It also preparesnonmajors to become knowledgeable citizens with a basic understanding of science and mathematics concepts. Thissection includes indicators related to enrollment by type of institution, field, and demographic characteristics;intentions to major in S&E fields; and recent trends in the number of earned S&E degrees.
Undergraduate Enrollment in the United States
Overall Undergraduate Enrollment
Enrollment in U.S. institutions of higher education at all levels rose from 15.5 million students in fall 2000 to 20.6million in fall 2013, with two main periods of high growth—between 2000 and 2002 and between 2007 and 2010,continuing a pattern of rising enrollments when there are downturns in the economy. Undergraduate enrollmenttypically represents about 86% of all postsecondary enrollment (Appendix Table 2-4).
Undergraduate enrollment peaked at 18.3 million in 2010 but has declined to 17.7 million in 2013. As in previousyears, the types of institutions enrolling the largest numbers of students at the undergraduate level in 2013 wereassociate’s colleges (7.7 million, 43% of all undergraduates enrolled), master’s colleges/universities (3.7 million,21%), and doctorate-granting universities with very high research activity (2.1 million, 12%). Between 2000 and2013, undergraduate enrollment increased by 62% at doctoral/research universities, by 37% at master’s colleges,by 34% at associate’s colleges, and by 27% at baccalaureate colleges (Appendix Table 2-4). (see sidebar,
for definitions of the types of academic institutions.),Carnegie Classification of Academic Institutions
Between 2000 and 2013, the share of Hispanics enrolled full time in undergraduate programs among U.S. citizensand permanent residents increased from 11% to 16%, and the share of blacks increased from 11% to 13%. Theshares of Asians or Pacific Islanders and of American Indians or Alaska Natives remained stable at 6% and 1%,respectively. The share of whites declined from 68% to 56% in the same period ( ).Figure 2-9

Chapter 2. Higher Education in Science and Engineering
2 | 40National Science Board | Science & Engineering Indicators 2016
Figure 2-9
Share of full-time undergraduate enrollment among U.S. citizens and permanent residents, by raceand ethnicity: 2000–13
URM = underrepresented minorities (black, Hispanic, and American Indian or Alaska Native).
NOTES: Hispanic may be any race. American Indian or Alaska Native, Asian or Pacific Islander, black, and white refer toindividuals who are not of Hispanic origin. Percentages do not add to total because data do not include individuals who did notreport their race and ethnicity.
SOURCES: National Center for Education Statistics, Integrated Postsecondary Education Data System, Fall Enrollment Survey;National Science Foundation, National Center for Science and Engineering Statistics, WebCASPAR database, http://webcaspar.nsf.gov.
Science and Engineering Indicators 2016
According to the latest Census Bureau projections, increased enrollment in higher education is projected to comemainly from minority groups, particularly Hispanics. The latest Census Bureau projections report that the number ofcollege-age individuals (ages 20–24) is expected to decline between 2015 and 2020 but increase in the longer termto 24.0 million by 2060 (Appendix Table 2-15). The short-term decline in this segment of the population is mostlydue to a drop in the number of non-Hispanic whites, which is projected overall to continue to fall through 2060, anda decline in the population of non-Hispanic blacks between 2015 and 2035. The populations of 20–24-year-oldHispanics and of Asians who are not Hispanic are expected to increase continuously between 2015 and 2060. Theproportion of Asians in this age group is expected to increase from 5% to 9%. The proportion of Hispanics in thisage group is expected to grow from 22% in 2015 to 32% in 2060. This increase may result in a larger number ofacademic institutions becoming high Hispanic enrollment and also in considerable increases in the overall
enrollment in community colleges, as nearly half of all Hispanic undergraduates are enrolled in community colleges.[i]

Chapter 2. Higher Education in Science and Engineering
2 | 41National Science Board | Science & Engineering Indicators 2016
Undergraduate Enrollment in S&E
Freshmen intentions to major in S&E. Since 1971, the annual The American Freshman: National Norms survey,administered by the Higher Education Research Institute at the University of California, Los Angeles, has asked
freshmen at a large number of universities and colleges about their intended majors. Data show that up until[ii]
2007, about one-third of all freshmen planned to study S&E; this proportion gradually rose to 45% by 2014.Increases in the proportion of freshmen planning to major in biological and agricultural sciences and in engineeringaccount for most of this growth. In 2014, about 14% of freshmen intended to major in the biological andagricultural sciences (up from about 9% in 2007), and a similar proportion intended to major in engineering (upfrom about 8% in 2007). About 14% planned to major in engineering; 10% in the social and behavioral sciences;5% in mathematics, statistics, or computer sciences; and 3% in the physical sciences (Appendix Table 2-16). Thepercentage of all freshmen intending to major in mathematics, statistics, or computer sciences declined for morethan 10 years since the late 1990s, but has increased since 2011.
In 2014, more than half of Asian American or Asian freshmen reported that they intended to major in S&E;proportions were lower for Hispanic or Latino freshmen (45%) and lower still for whites and blacks (40% each) andfor American Indian or Alaska Native (30%) freshmen ( ). Since the late 1990s, the proportionsFigure 2-10intending to major in S&E increased in all racial and ethnic groups except in the American Indian or Alaska Native
group.[iii]
[i] Special tabulation from the IPEDS Fall Enrollment survey, available at https://ncsesdata.nsf.gov/webcaspar/.
[ii] For details on the methodology of this survey and its limitations, please see appendix A of the annual report The, published by the Cooperative Institutional Research Program at theAmerican Freshman: National Norms Fall 2014
Higher Education Research Institute at the University of California, Los Angeles (http://www.heri.ucla.edu/monographs/TheAmericanFreshman2014.pdf). These data are subject to sampling error. Information on estimatedstandard errors can be found in appendix D. Data reported here are significant at the 0.05 level.
[iii] Data for racial and ethnic groups are for U.S. citizens and permanent residents only.

Chapter 2. Higher Education in Science and Engineering
2 | 42National Science Board | Science & Engineering Indicators 2016
Figure 2-10
Freshmen intending S&E major, by race and ethnicity: 1998–2014
NOTE: In 2001, Native Hawaiian or Pacific Islander was added as a category under Asian American or Asian.
SOURCE: Higher Education Research Institute, University of California, Los Angeles, special tabulations (2015) of TheAmerican Freshman: National Norms.
Science and Engineering Indicators 2016
Among whites, Asians, and Hispanics, the proportions planning to major in S&E were higher for men than forwomen (Appendix Table 2-16). A higher proportion of Asian American or Asian freshmen than of those from otherracial and ethnic groups planned to major in the natural sciences and engineering, and higher proportions of blacksand Hispanics or Latinos intended to major in the social and behavioral sciences.
There has been growing concern about the ability to produce and retain science, technology, engineering, andmathematics (STEM) talent in the United States (PCAST 2012). Some students start undergraduate programs anddo not complete their degrees, or they complete their degrees but switch majors (see sidebar, Attrition in STEM
).Fields
Generally, the percentages of students earning bachelor’s degrees in specific S&E fields are similar to thepercentages planning to major in those fields, with the exception of engineering and social and behavioral sciences.(See the Undergraduate Degree Awards and Appendix Table 2-17 and Appendix Table 2-18 for trends in bachelor’sdegrees; see the section on “Persistence and Retention in Undergraduate Education [S&E versus Non-S&E Fields]”in [NSB 2012] for a discussion of longitudinal data on undergraduate attrition in S&E.) For both sexes and all racialand ethnic groups, the percentage of students earning bachelor’s degrees in engineering is smaller than thepercentage planning to major in it ( and ). The percentage earning bachelor’s degrees inFigure 2-11 Figure 2-12social and behavioral sciences in 2013 (16%) (Appendix Table 2-17) is larger than the percentage that planned to

Chapter 2. Higher Education in Science and Engineering
2 | 43National Science Board | Science & Engineering Indicators 2016
major in those fields as freshmen 6 years earlier (10%) (Appendix Table 2-16). For women, Asians, blacks, andHispanics, the proportion earning bachelor’s degrees in the natural sciences is smaller than the proportion thatbegins college planning to major in these fields ( and ).Figure 2-13 Figure 2-14
Attrition in STEM Fields
The retention of undergraduate students with declared science, technology, engineering, and mathematics(STEM) majors has become a policy focus. In 2014, nearly 45% of incoming freshmen intended to major inS&E, and just over 1 in 10 of these freshmen indicated that there was “a very good chance” that theywould change their major down the road (Eagan et al. 2014). During their undergraduate years, several ofthese students switch to other majors—for a variety of reasons—but are essentially replaced by studentswithout declared majors or majors in non-STEM fields (for detailed data on field-switching from STEM,non-STEM fields, and undeclared majors, see [ ]).Table (NSB 2012) 2-9
These broad relationships provide no information about the specific paths and factors that make studentsdeclare, enter, and leave an S&E major and earn STEM degrees. To provide more insight into thesequestions, the National Center for Education Statistics followed the 2003–04 college cohort through 2009and examined potential factors underlying STEM attrition (Chen and Soldner 2013). The study focused onidentifying the factors related to attrition from STEM fields and did not include students who switched fromnon-STEM fields into STEM fields, or those who had not initially declared a major but later decided to majorin a STEM field. The study’s STEM definition included engineering and science technologies together withengineering, information sciences together with computer sciences, and excluded all social and behavioralscience fields. Appropriate statistical controls were applied throughout the study.
About half of the beginning bachelor’s degree students who declared STEM majors during any of theseyears had either left college altogether by 2009 (20%) or left STEM for another field (28%). Attrition wasparticularly high among computer and information sciences majors and among associate’s degree students.Overall, however, attrition from STEM majors was lower than in most other fields. For bachelor’s andassociate’s students who declared STEM majors, taking fewer STEM courses in the first year, choosing lessdemanding mathematics courses in the first year, and performing poorly in STEM classes relative tonon-STEM classes were factors associated with an increased probability of switching out of STEM majors.For bachelor’s degree students, withdrawing or failing STEM courses was associated with an increasedprobability of switching out of STEM majors.
With regard to students leaving STEM fields by dropping out of college, overall college performance and thelevel of success in STEM courses was critical. Bachelor’s and associate’s STEM entrants who earned a lowcollege grade point average and accumulated a large number of incompletes in STEM courses dropped outof college at higher rates. For associate’s degree students, being less successful in STEM courses than innon-STEM courses was also a factor for dropping out of college.
Beginning bachelor’s degree students starting at private nonprofit 4-year colleges were less likely thanthose starting at public 4-year institutions to abandon STEM majors by switching to another field. Inaddition, students from selective colleges were less likely to leave college than their counterparts whostarted at nonselective institutions.

Chapter 2. Higher Education in Science and Engineering
2 | 44National Science Board | Science & Engineering Indicators 2016
Figure 2-11
Engineering: Freshmen intentions and degrees, by sex
NOTE: Degrees do not reflect the same student cohort.
SOURCES: Higher Education Research Institute, University of California, Los Angeles, special tabulations (2015) of TheAmerican Freshman: National Norms; National Center for Education Statistics, Integrated Postsecondary Education DataSystem, Completions Survey, 2013; National Science Foundation, National Center for Science and Engineering Statistics,WebCASPAR database, http://webcaspar.nsf.gov.
Science and Engineering Indicators 2016
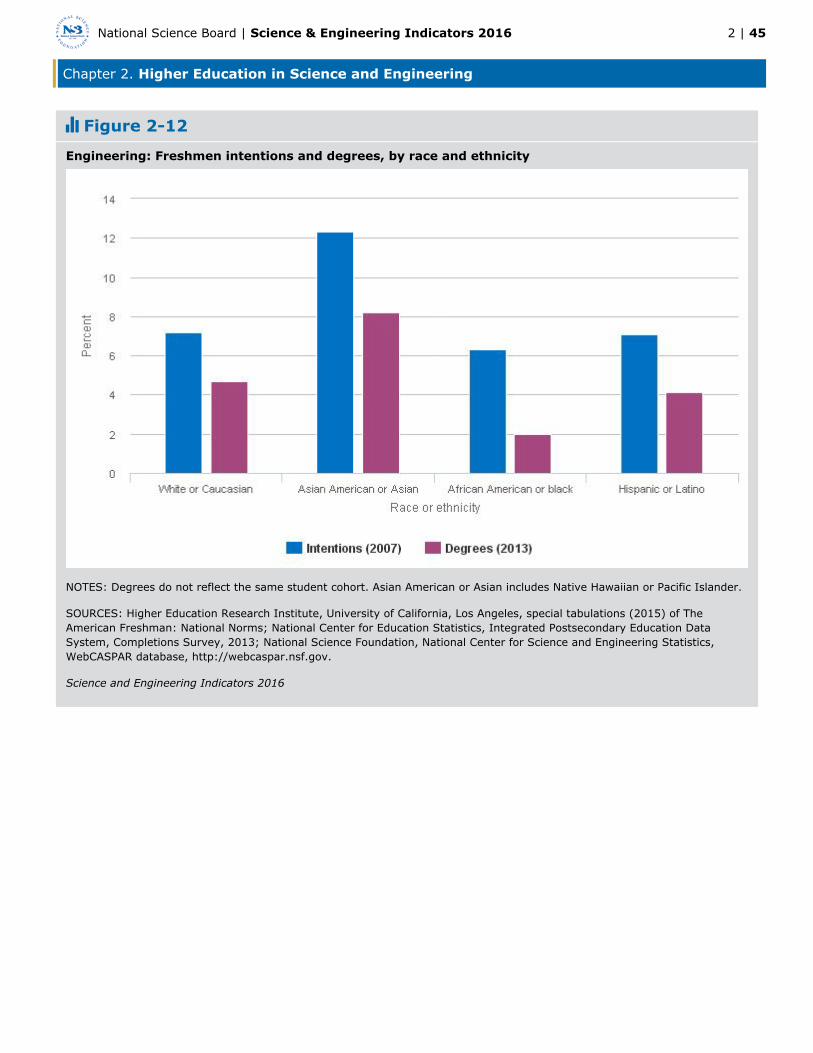
Chapter 2. Higher Education in Science and Engineering
2 | 45National Science Board | Science & Engineering Indicators 2016
Figure 2-12
Engineering: Freshmen intentions and degrees, by race and ethnicity
NOTES: Degrees do not reflect the same student cohort. Asian American or Asian includes Native Hawaiian or Pacific Islander.
SOURCES: Higher Education Research Institute, University of California, Los Angeles, special tabulations (2015) of TheAmerican Freshman: National Norms; National Center for Education Statistics, Integrated Postsecondary Education DataSystem, Completions Survey, 2013; National Science Foundation, National Center for Science and Engineering Statistics,WebCASPAR database, http://webcaspar.nsf.gov.
Science and Engineering Indicators 2016

Chapter 2. Higher Education in Science and Engineering
2 | 46National Science Board | Science & Engineering Indicators 2016
Figure 2-13
Natural sciences: Freshmen intentions and degrees, by sex
NOTE: Degrees do not reflect the same student cohort.
SOURCES: Higher Education Research Institute, University of California, Los Angeles, special tabulations (2015) of TheAmerican Freshman: National Norms; National Center for Education Statistics, Integrated Postsecondary Education DataSystem, Completions Survey, 2013; National Science Foundation, National Center for Science and Engineering Statistics,WebCASPAR database, http://webcaspar.nsf.gov.
Science and Engineering Indicators 2016
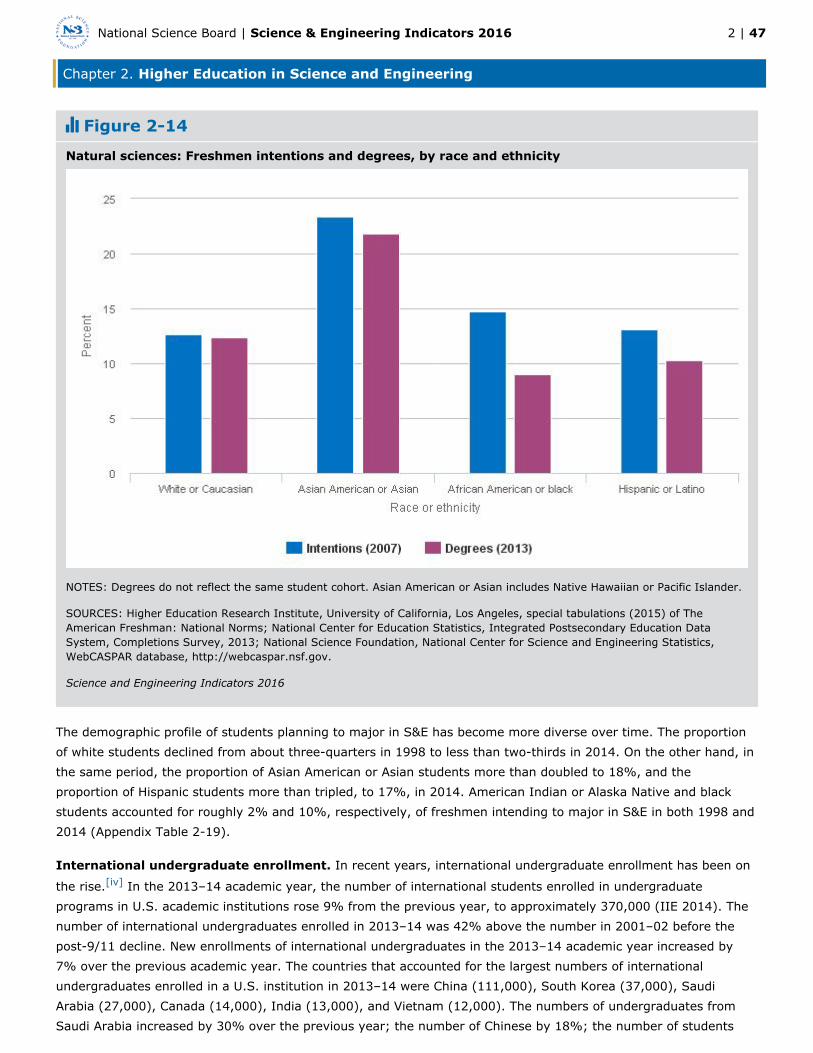
Chapter 2. Higher Education in Science and Engineering
2 | 47National Science Board | Science & Engineering Indicators 2016
Figure 2-14
Natural sciences: Freshmen intentions and degrees, by race and ethnicity
NOTES: Degrees do not reflect the same student cohort. Asian American or Asian includes Native Hawaiian or Pacific Islander.
SOURCES: Higher Education Research Institute, University of California, Los Angeles, special tabulations (2015) of TheAmerican Freshman: National Norms; National Center for Education Statistics, Integrated Postsecondary Education DataSystem, Completions Survey, 2013; National Science Foundation, National Center for Science and Engineering Statistics,WebCASPAR database, http://webcaspar.nsf.gov.
Science and Engineering Indicators 2016
The demographic profile of students planning to major in S&E has become more diverse over time. The proportionof white students declined from about three-quarters in 1998 to less than two-thirds in 2014. On the other hand, inthe same period, the proportion of Asian American or Asian students more than doubled to 18%, and theproportion of Hispanic students more than tripled, to 17%, in 2014. American Indian or Alaska Native and blackstudents accounted for roughly 2% and 10%, respectively, of freshmen intending to major in S&E in both 1998 and2014 (Appendix Table 2-19).
International undergraduate enrollment. In recent years, international undergraduate enrollment has been on
the rise. In the 2013–14 academic year, the number of international students enrolled in undergraduate[iv]
programs in U.S. academic institutions rose 9% from the previous year, to approximately 370,000 (IIE 2014). Thenumber of international undergraduates enrolled in 2013–14 was 42% above the number in 2001–02 before thepost-9/11 decline. New enrollments of international undergraduates in the 2013–14 academic year increased by7% over the previous academic year. The countries that accounted for the largest numbers of internationalundergraduates enrolled in a U.S. institution in 2013–14 were China (111,000), South Korea (37,000), SaudiArabia (27,000), Canada (14,000), India (13,000), and Vietnam (12,000). The numbers of undergraduates fromSaudi Arabia increased by 30% over the previous year; the number of Chinese by 18%; the number of students
Chapter 2. Higher Education in Science and Engineering
2 | 48National Science Board | Science & Engineering Indicators 2016
from the United Kingdom by 11%; from Brazil, by 9%; and from Indonesia, 8%. The numbers of South Korean,Taiwanese, and Indian undergraduates decreased by 3%, 2%, and 1%, respectively. In 2013–14, among allinternational students (undergraduate and graduate), the number of those studying mathematics and computersciences increased by 18% over the preceding year, the number of those studying engineering increased by 10%,and the number of those studying social sciences increased by 7%. The number of those studying physical and lifesciences grew by 2% (IIE 2014).
More recent data from the Student and Exchange Visitor Information System (SEVIS) at the Department ofHomeland Security show a substantial increase in international undergraduate enrollment in the United States
between November 2013 and November 2014 ( ; Appendix Table 2-20). This increase reflects aTable 2-11 [v]
larger influx of international students in the United States, and because of the way these data are collected, theincrease may also reflect a larger portion of international students staying in the United States to pursue another
degree. The increase in international enrollment was higher in S&E (14%) than in non-S&E fields (7%). A[vi]
growing proportion of foreign undergraduates enrolled come to study in S&E fields, from 29% in 2008 to 37% in2014. Within S&E, the largest increases were in engineering and computer sciences. The top five countries of originof international S&E undergraduate students in fall 2014 (China, Saudi Arabia, South Korea, India, and Kuwait)were similar to those in the preceding year (Appendix Table 2-20). In 2014, the proportion of undergraduatestudents enrolled in S&E fields was 50% or higher among students from Kuwait, Oman, Malaysia, India, Nepal, and
Nigeria. Between 2008 and 2011, international S&E enrollment at the undergraduate level increased each year[vii]
by about 6%–10%, with the growth rate spiking in 2012 (21%). In the last 2 years, the growth rate was lower butremained high (12% in 2013 and 14% in 2014) ( ). About 45% of the growth in internationalTable 2-11undergraduate enrollment in the last year, both in S&E and non-S&E fields, is accounted for by the increase in thenumber of students from China.
[iv] The data in this section come from the Institute of International Education (IIE) and the Student and ExchangeVisitor Information System (SEVIS). IIE conducts an annual survey of about 3,000 accredited U.S. higher educationinstitutions. In this survey, an is defined as anyone studying at an institution of higherinternational studenteducation in the United States on a temporary visa that allows academic coursework, primarily F and J visas. SEVIScollects administrative data, including the numbers of all international students enrolled in colleges and universitiesin the United States.
[v] The figures include active foreign national students on F-1 visas in the SEVIS database, excluding thoseparticipating in optional practical training (OPT). Students with F visas have the option of working in the UnitedStates by engaging in OPT, temporary employment directly related to the student’s major area of study, eitherduring or after completion of the degree program. Students can apply for 12 months of OPT at each level ofeducation. Starting in 2008, students in certain STEM fields became eligible for an additional 17 months of OPT. Thenumber of students in OPT varies according to labor market conditions. According to data from SEVIS, the numberof students with F-1 visas in OPT declined sharply between November 2010 and November 2011 and rose back upsteeply by November 2012 (68,510 in November 2010, 22,820 in November 2011, and 80,680 in November 2012).
[vi] For example, an international student who is about to earn a bachelor’s degree and stays in the United States topursue a graduate degree would remain in the SEVIS database. It is not possible to determine the extent to whichinternational students stay to pursue another degree because of the way the data are collected.

Chapter 2. Higher Education in Science and Engineering
2 | 49National Science Board | Science & Engineering Indicators 2016
[vii] These data include international students pursuing both bachelor’s and associate’s degrees. Comparable datafor U.S. citizen and permanent resident students do not exist. However, the proportion of S&E associate’s andbachelor’s degree awards earned by U.S. citizens and permanent residents is considerably lower.
Table 2-11International students enrolled in U.S. higher education institutions, bybroad field and academic level: 2008–14
Field and level 2008 2009 2010 2011 2012 2013 2014
All fields
All levels 526,570 525,680 537,650 574,360 635,650 676,280 750,360
Undergraduate 266,320 272,980 284,770 297,950 351,030 373,740 407,810
Graduate 260,260 252,710 252,890 276,400 284,620 302,540 342,540
S&E fields
All levels 229,010 229,230 235,990 260,280 280,020 307,480 358,100
Undergraduate 76,780 81,110 87,590 96,400 116,640 130,990 149,090
Graduate 152,230 148,120 148,400 163,880 163,390 176,490 209,020
Non-S&E fields
All levels 297,560 296,460 301,670 314,080 355,630 368,810 392,250
Undergraduate 189,530 191,870 197,180 201,560 234,390 242,750 258,730
Graduate 108,030 104,590 104,490 112,520 121,240 126,060 133,530
NOTES: Data include active foreign national students on F-1 visas and exclude those on optional practical training.Undergraduate level includes associate’s and bachelor’s degrees; graduate level includes master’s and doctoraldegrees. Numbers are rounded to the nearest 10. Detail may not add to total because of rounding.
SOURCE: U.S. Department of Homeland Security, U.S. Immigration and Customs Enforcement, special tabulations(2014) of the Student and Exchange Visitor Information System database.
Science and Engineering Indicators 2016
Engineering enrollment. For the most part, students do not declare majors until their sophomore year. Becauseof this, undergraduate enrollment data for domestic students are not available by field. However, engineering is anexception. Engineering programs generally require students to declare a major or an intent to major in the firstyear of college, so engineering enrollment data can serve as an early indicator of both future undergraduateengineering degrees and student interest in engineering careers. The Engineering Workforce Commissionadministers an annual fall survey that tracks enrollment in undergraduate and graduate engineering programs(EWC 2014).
Undergraduate engineering enrollment was flat in the late 1990s, increased from 2000 to 2003, declined slightlythrough 2006, rose steadily to a peak of 544,000 in 2012, and declined slightly to 542,000 in 2013 (Appendix Table2-21). The number of undergraduate engineering students increased by 34% between 2006 and 2013. Full-timefreshman enrollment followed a similar pattern, reaching 131,000 in 2012, the highest since 1982, but decliningslightly in 2013. These trends correspond with declines in the college-age population through the mid-1990s,particularly the drop in white 20–24-year-olds, who account for the majority of engineering students (NSF/NCSES2015c).

Chapter 2. Higher Education in Science and Engineering
2 | 50National Science Board | Science & Engineering Indicators 2016
Enrollment by disability status. According to the most recent available estimates, 11% of undergraduate
students reported a disability in 2012 (NSF/NCSES 2015c). Undergraduates with disabilities were older than[viii]
those without disabilities and were somewhat more likely to attend a 2-year institution. About one in fourundergraduates with a disability was in an S&E field, a similar proportion among undergraduates withoutdisabilities, and there were no major differences in field distribution at the broad field level.
[viii] See (NSF/NCSES 2015c, tables 2-6 and 2-7; ).Figure 1-E
Undergraduate Degree Awards
The number of undergraduate degrees awarded by U.S. academic institutions has been increasing over the pasttwo decades in S&E and non-S&E fields. According to projections from the U.S. Department of Education, thesetrends are expected to continue at least through 2022 (Hussar and Bailey 2014).
S&E Associate’s Degrees
Community colleges often are an important and relatively inexpensive gateway for students entering highereducation. Associate’s degrees, largely offered by 2-year programs at community colleges, are the terminal degreefor some, but others continue their education at 4-year colleges or universities and subsequently earn higherdegrees. About 18% of recent S&E bachelor’s degree holders in 2013—those who had earned their degree between
academic years 2006–07 and 2010–11—had previously earned an associate’s degree. Many who transfer to[i]
baccalaureate-granting institutions do not earn associate’s degrees before transferring; they may be able to
transfer credit for specific courses.[ii]
In 2013, 86,000 out of more than 1 million associate’s degrees were in S&E fields. S&E associate’s degrees from alltypes of academic institutions have been rising continuously since 2000, after a steep decline between 2003 and2007. The overall trend mirrors the pattern of computer sciences, which account for a large portion of S&E
associate’s degrees and peaked in 2003, declined through 2007, and increased through 2012.[iii]
The number of associate’s degrees in S&E technologies, not included in S&E degree totals because of their appliedfocus, has nearly doubled since 2000. In 2013, nearly 157,000 associate’s degrees were in S&E technologies.Associate’s degrees in these fields accounted for 15% of all associate’s degrees in 2013; this proportion has rangedbetween 13% and 16% since 2000. Nearly three-quarters of the associate’s degrees in S&E technologies are inhealth technologies, and close to one-quarter are in engineering technologies. The proportion of associate’s degreesin engineering technologies, however, has declined from 48% of all S&E technologies degrees in 2000 to 24% in2013 (or from 7% of all associate’s degrees to 4%), whereas the proportion of associate’s degrees in healthtechnologies has increased from 50% in 2000 to 74% in 2013 (or from 7% of all associate’s degrees to 11%).
Women have earned between 60% and 62% of all associate’s degrees awarded between 2000 and 2013 (AppendixTable 2-22). The proportion of women earning S&E associate’s degrees, however, declined from 48% in 2000 to43% in 2013. Most of the decline is attributable to a decrease in women’s share of computer sciences associate’sdegrees, which dropped continuously from 42% in 2000 to 21% in 2013.
Students from underrepresented minority groups (blacks, Hispanics, and American Indians and Alaska Natives)earn a higher proportion of associate’s degrees than of bachelor’s or more advanced degrees, both in S&E fields
and in all fields. (See the “S&E Bachelor’s Degrees by Race and Ethnicity” and “S&E Doctoral Degrees by Race[iv]

Chapter 2. Higher Education in Science and Engineering
2 | 51National Science Board | Science & Engineering Indicators 2016
and Ethnicity” sections.) In 2013, underrepresented minorities earned 31% of S&E associate’s degrees—more thanone-third of all associate’s degrees in social and behavioral sciences and biological sciences; about 30% of those inphysical sciences, mathematics, and computer sciences; and 24% of those in engineering (Appendix Table 2-23).
S&E Bachelor’s Degrees
The baccalaureate is the most prevalent S&E degree, accounting for nearly 70% of all S&E degrees awarded. S&Ebachelor’s degrees have consistently accounted for roughly one-third of all bachelor’s degrees for at least the past15 years. The number of S&E bachelor’s degrees awarded rose steadily from about 400,000 in 2000 to more than
615,000 in 2013 (Appendix Table 2-17).[v]
In the last decade, the number of bachelor’s degrees awarded increased fairly consistently, although to differentextents, in all S&E fields. The exception was computer sciences, where the number increased sharply from 2000 to2004, dropped as sharply through 2009, but increased again since then ( ; Appendix Table 2-17).Figure 2-15
[i] Based on a special tabulation of the 2013 NSCG. A recent graduate is a respondent who received his or her mostrecent degree between 1 July 2006 and 30 June 2011.
[ii] Some credentials in the form of certificates take up to a year or less to complete. The most recent research onlicenses and certification from the U.S. Census Bureau’s Survey of Income and Program Participation shows that thevast majority of these types of credentials are in health care, education, and trades; business/financemanagement; legal/social services; and other non-S&E fields. Only 2% of the licenses and certifications are in S&E,specifically in computer sciences (Ewert and Kominski 2014).
[iii] Data on degree completion from the NCES were obtained from WebCASPAR ( ). Datahttps://webcaspar.nsf.gov/uploaded in WebCASPAR correspond to NCES provisional data, which undergo all NCES data quality controlprocedures and are imputed for nonresponding institutions. These data are used by NCES in its First Look(Provisional Data) publications.
[iv] Data for racial and ethnic groups are for U.S. citizens and permanent residents only.
[v] Data on degree completion from NCES were obtained from WebCASPAR ( ). Datahttps://webcaspar.nsf.gov/uploaded in WebCASPAR correspond to NCES provisional data, which undergo all NCES data quality controlprocedures and are imputed for nonresponding institutions. These data are used by NCES in its First Look(Provisional Data) publications.

Chapter 2. Higher Education in Science and Engineering
2 | 52National Science Board | Science & Engineering Indicators 2016
Figure 2-15
S&E bachelor’s degrees, by field: 2000–13
NOTE: Physical sciences include earth, atmospheric, and ocean sciences.
SOURCES: National Center for Education Statistics, Integrated Postsecondary Education Data System, Completions Survey;National Science Foundation, National Center for Science and Engineering Statistics, WebCASPAR database, http://webcaspar.nsf.gov.
Science and Engineering Indicators 2016
S&E bachelor’s degrees by sex. Since 1982, women have outnumbered men in undergraduate education. Theyhave earned relatively constant fractions of all bachelor’s and S&E bachelor’s degrees for several years. Since thelate 1990s, women have earned about 57% of all bachelor’s degrees and about half of all S&E bachelor’s degrees.Among U.S. citizens and permanent residents, women also earn about half of all S&E bachelor’s degrees (NSF/NCSES 2015c).
Men and women tend to study different fields; these tendencies are also observed at the master’s and doctorallevels, as will be seen below and in the workforce data in chapter 3. In 2013, men earned the vast majority ofbachelor’s degrees awarded in engineering, computer sciences, and physics and more than half of the degrees inmathematics and statistics. Women earned half or more of the bachelor’s degrees in psychology, biologicalsciences, agricultural sciences, and all the broad fields within social sciences except for economics (Appendix Table2-17).
Since 2000, changes have not followed a consistent pattern. The share of bachelor’s degrees awarded to womendeclined in computer sciences (by 10%) (see sidebar, ),Retention of Women in Computer Sciences Programsmathematics and statistics (by 5%), physics (by 3%), and engineering (by 1%) ( ; Appendix TableFigure 2-162-17). Fields in which the proportion of bachelor’s degrees awarded to women grew during this period include

Chapter 2. Higher Education in Science and Engineering
2 | 53National Science Board | Science & Engineering Indicators 2016
atmospheric sciences (by 10%); agricultural sciences (by 7%); anthropology (by 4%); and astronomy, area andethnic studies, and political science and public administration (by 2% each) (Appendix Table 2-17).
Retention of Women in Computer Sciences Programs
In the last two decades, the proportion of women earning bachelor’s degrees in computer sciences hasdeclined from 28% to 18% (NSF/NCSES 2015c), even though the proportion of freshmen women declaringa computer sciences major when first enrolled in a 4-year institution has remained stable (at about 20% inrecent years).* Several studies have attempted to identify possible factors that affect retention of womenin computer sciences departments (Margolis and Fisher 2002; Cohoon and Aspray 2006). One nationwidestudy concluded that departmental environment had measurable consequences on the gender compositionof enrolled students and the likelihood that women who declared a computer science major would remain in
the program at rates comparable to their male classmates (Cohoon 2006). The study statistically†
controlled for a range of characteristics across the programs under study that are likely to affect retention,including size, highest degree level offered, geographic location, and administrative type of institution.
The study concluded that the most important factor was the ability to rely on same-sex peer support,measured by the proportion of enrolled women. Findings from focus group research suggested that womenpreferred to ask questions and get help from female classmates. Women’s retention rates were higher indepartments with higher proportions of female students, suggesting greater ease in drawing on the supportof same-sex peers. In addition, three factors related to faculty characteristics were important. Broad facultyencouragement of women to persist in this male-dominated field was important, as was faculty mentoring ifit aimed explicitly at overcoming underrepresentation. Faculty concern over insufficient staffing—especiallyprevalent in public institutions in the post dot-com boom period—was related to higher female attrition.Finally, high demand from faculty (e.g., expectation of long hours of study, extensive homeworkassignments, and limited extracurricular activities) was related to lower rates of women’s attrition.
Recent nationally representative data on factors that are important for retention are not available.However, some computer science departments have shown success in increasing recruitment and retentionof women. For example, the computer science department at Harvey Mudd College has succeeded inincreasing the proportion of women computer science majors from 12% in 2005 to around 35% to 40% inrecent years, as had the Carnegie Mellon University computer science department in the early 2000s. Thestrategies implemented included, but were not limited to, expanding the required first-year computerscience courses to include social impacts of computer science and creative, real-world applications;providing summer research opportunities for women after their first year; and increasing the number ofwomen computer science faculty members (DuBow et al. 2012; Miller 2014).
* Special tabulations, Beginning Postsecondary Students Longitudinal Study, Second Follow-up (BPS:96/01and BPS:04/09)
†The study first conducted interviews and focus groups at 18 undergraduate computer science departmentsthat varied by region, institution type, highest degree granted, reputation, and sex composition. The resultsof the focus groups were then used to design a survey of faculty and chairs in 209 largest or most highlyranked computer science departments in the United States. The study relied on official enrollment anddisposition data to calculate attrition rates of males and females.
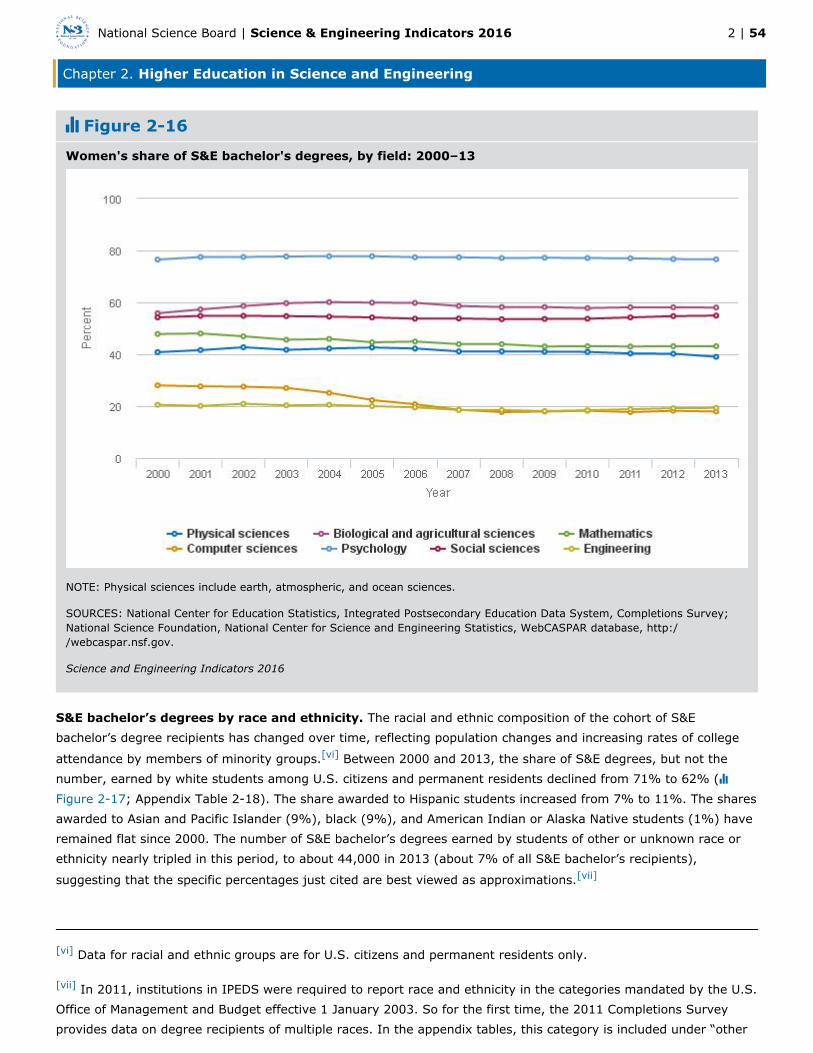
Chapter 2. Higher Education in Science and Engineering
2 | 54National Science Board | Science & Engineering Indicators 2016
Figure 2-16
Women's share of S&E bachelor's degrees, by field: 2000–13
NOTE: Physical sciences include earth, atmospheric, and ocean sciences.
SOURCES: National Center for Education Statistics, Integrated Postsecondary Education Data System, Completions Survey;National Science Foundation, National Center for Science and Engineering Statistics, WebCASPAR database, http://webcaspar.nsf.gov.
Science and Engineering Indicators 2016
S&E bachelor’s degrees by race and ethnicity. The racial and ethnic composition of the cohort of S&Ebachelor’s degree recipients has changed over time, reflecting population changes and increasing rates of college
attendance by members of minority groups. Between 2000 and 2013, the share of S&E degrees, but not the[vi]
number, earned by white students among U.S. citizens and permanent residents declined from 71% to 62% (; Appendix Table 2-18). The share awarded to Hispanic students increased from 7% to 11%. The sharesFigure 2-17
awarded to Asian and Pacific Islander (9%), black (9%), and American Indian or Alaska Native students (1%) haveremained flat since 2000. The number of S&E bachelor’s degrees earned by students of other or unknown race orethnicity nearly tripled in this period, to about 44,000 in 2013 (about 7% of all S&E bachelor’s recipients),
suggesting that the specific percentages just cited are best viewed as approximations.[vii]
[vi] Data for racial and ethnic groups are for U.S. citizens and permanent residents only.
[vii] In 2011, institutions in IPEDS were required to report race and ethnicity in the categories mandated by the U.S.Office of Management and Budget effective 1 January 2003. So for the first time, the 2011 Completions Surveyprovides data on degree recipients of multiple races. In the appendix tables, this category is included under “other

Chapter 2. Higher Education in Science and Engineering
2 | 55National Science Board | Science & Engineering Indicators 2016
or unknown race or ethnicity” because institutions were not required to update the race and ethnicity data ofindividuals who were already in the system; therefore, the number is likely to be an undercount. Of the 44,159 S&Ebachelor’s degrees earned by individuals in the “other or unknown race or ethnicity” category, 12,149 are ofmultiple race (special tabulations from WebCASPAR).

Chapter 2. Higher Education in Science and Engineering
2 | 56National Science Board | Science & Engineering Indicators 2016
Figure 2-17
Share of S&E bachelor’s degrees among U.S. citizens and permanent residents, by race and ethnicity:2000–13
URM = underrepresented minorities (black, Hispanic, and American Indian or Alaska Native).
NOTES: Hispanic may be any race. American Indian or Alaska Native, Asian or Pacific Islander, black, and white refer toindividuals who are not of Hispanic origin. Percentages do not add to 100% because data do not include individuals who didnot report their race and ethnicity.
SOURCES: National Center for Education Statistics, Integrated Postsecondary Education Data System, Completions Survey;National Science Foundation, National Center for Science and Engineering Statistics, WebCASPAR database, http://webcaspar.nsf. gov.
Science and Engineering Indicators 2016
The gap in educational attainment at the bachelor’s level between young minorities and whites continues to bewide, despite considerable progress for underrepresented minority groups over the past two decades. From 1980 to2014, the percentage of the population ages 25–29 with bachelor’s or higher degrees changed from 12% to 22%for blacks, 8% to 15% for Hispanics, and 25% to 41% for whites (NCES 2015). Continuing differences incompletion of S&E bachelor’s degrees reflect lower rates of high school completion, college enrollment, and collegepersistence and attainment by blacks, Hispanics, and American Indians and Alaska Natives. (For information onimmediate post–high school college enrollment rates, see the Transition to Higher Education section in chapter 1.)
Among those who do graduate from college, blacks, Hispanics, and American Indians and Alaska Natives are aboutas likely as whites to earn bachelor’s degrees in S&E fields. Asians or Pacific Islanders are far more likely to earn anS&E bachelor’s degree than any other group. S&E degrees make up almost half of all degrees for Asians and Pacific
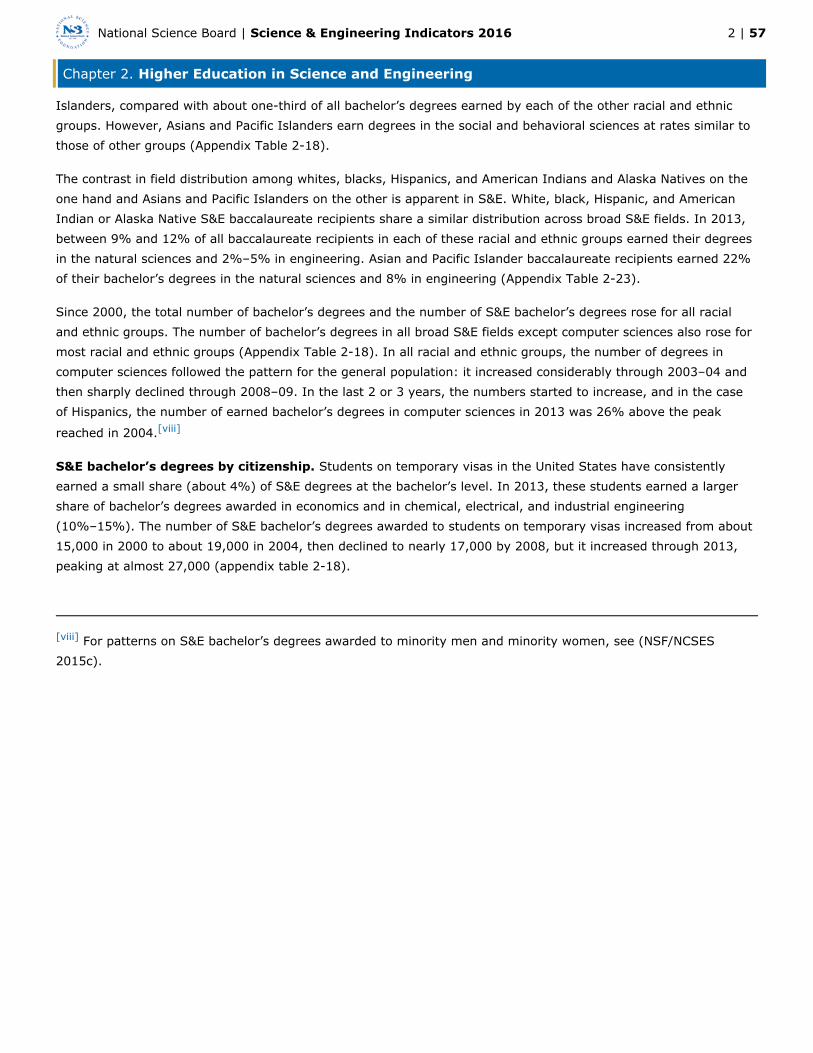
Chapter 2. Higher Education in Science and Engineering
2 | 57National Science Board | Science & Engineering Indicators 2016
Islanders, compared with about one-third of all bachelor’s degrees earned by each of the other racial and ethnicgroups. However, Asians and Pacific Islanders earn degrees in the social and behavioral sciences at rates similar tothose of other groups (Appendix Table 2-18).
The contrast in field distribution among whites, blacks, Hispanics, and American Indians and Alaska Natives on theone hand and Asians and Pacific Islanders on the other is apparent in S&E. White, black, Hispanic, and AmericanIndian or Alaska Native S&E baccalaureate recipients share a similar distribution across broad S&E fields. In 2013,between 9% and 12% of all baccalaureate recipients in each of these racial and ethnic groups earned their degreesin the natural sciences and 2%–5% in engineering. Asian and Pacific Islander baccalaureate recipients earned 22%of their bachelor’s degrees in the natural sciences and 8% in engineering (Appendix Table 2-23).
Since 2000, the total number of bachelor’s degrees and the number of S&E bachelor’s degrees rose for all racialand ethnic groups. The number of bachelor’s degrees in all broad S&E fields except computer sciences also rose formost racial and ethnic groups (Appendix Table 2-18). In all racial and ethnic groups, the number of degrees incomputer sciences followed the pattern for the general population: it increased considerably through 2003–04 andthen sharply declined through 2008–09. In the last 2 or 3 years, the numbers started to increase, and in the caseof Hispanics, the number of earned bachelor’s degrees in computer sciences in 2013 was 26% above the peak
reached in 2004.[viii]
S&E bachelor’s degrees by citizenship. Students on temporary visas in the United States have consistentlyearned a small share (about 4%) of S&E degrees at the bachelor’s level. In 2013, these students earned a largershare of bachelor’s degrees awarded in economics and in chemical, electrical, and industrial engineering(10%–15%). The number of S&E bachelor’s degrees awarded to students on temporary visas increased from about15,000 in 2000 to about 19,000 in 2004, then declined to nearly 17,000 by 2008, but it increased through 2013,peaking at almost 27,000 (appendix table 2-18).
[viii] For patterns on S&E bachelor’s degrees awarded to minority men and minority women, see (NSF/NCSES2015c).

Chapter 2. Higher Education in Science and Engineering
2 | 58National Science Board | Science & Engineering Indicators 2016
Graduate Education, Enrollment, and Degrees in the United States
Graduate education in S&E contributes to global competitiveness, producing the highly skilled workers of the futureand the research needed for a knowledge-based economy. This section includes indicators related to U.S. graduateenrollment; recent trends in the number of advanced degrees in S&E fields; and the participation by women,minorities, and international students in graduate education in U.S. academic institutions.
Graduate Enrollment by Field
S&E graduate enrollment in the United States increased by 25% between 2000 and 2013, to more than 615,000
(Appendix Table 2-24). Most of the growth occurred in the 2000s; since 2008, graduate enrollment in S&E has[i]
been fairly stable. In the period between 2000 and 2013, graduate enrollment grew considerably in most S&Efields, particularly in engineering and in the biological sciences, where enrollment has reached record numbers andrisen faster than enrollment for all S&E fields. Three-quarters of the graduate students in engineering were enrolled
full time in 2013, up from 69% in 2000.[ii]
Enrollment has also grown in the social sciences (where most of the growth is accounted for by the increase ofgraduate enrollment in political science and public administration). Graduate enrollment in computer sciences grewrapidly in the early 2000s, then decreased through 2006, but it has generally increased since then.
The number of full-time students enrolled for the first time in S&E graduate departments is an indicator ofdeveloping trends. First-time, full-time graduate enrollees are typically students pursuing a master’s or a doctoraldegree right after or within about a year after earning their undergraduate degrees. This indicator can be sensitiveto economic conditions; for example, high unemployment tends to lead to an increase in first-time, full-timegraduate enrollment. Despite some drops in first-time, full-time enrollment in engineering and computer sciences inthe early to mid-2000s, this indicator has increased fairly steadily in most broad S&E fields. In 2013, the number offirst-time, full-time S&E graduate students reached a new peak in both of these fields (Appendix Table 2-25).
Graduate Enrollment by Sex
In 2013, 45% of the S&E graduate students enrolled in the United States were women (Appendix Table 2-24). Theproportions of female graduate students enrolled in S&E differed considerably by field, with the lowest proportionsin engineering, computer sciences, and physical sciences (particularly in physics). Women constituted the majorityof graduate students in psychology, medical and other health sciences, biological sciences, and social sciences, andthey represented half or close to half of graduate students in agricultural sciences and earth, atmospheric, andocean sciences. Among the social sciences, economics has an unusually low proportion of women. Between 2000and 2013, the proportion of women enrolled increased in most broad S&E fields except for computer sciences andmathematics. The proportion of women enrolled in graduate programs in computer sciences peaked in 2000 anddeclined through 2011 but increased slightly in the last 2 years. In mathematics and statistics, the proportion ofwomen peaked in 2000 and has declined slightly and gradually since then.
Graduate Enrollment of Underrepresented Groups
In 2013, among U.S. citizens and permanent residents, underrepresented minority students (blacks, Hispanics, andAmerican Indians and Alaska Natives) accounted for 18% of students enrolled in graduate S&E programs (Appendix
Table 2-26). The proportion of underrepresented minorities was highest in psychology and the social sciences[iii]
(23%), medical and other health sciences (20%), and computer sciences (16%); it was lowest in the earth,atmospheric, and ocean sciences (9%) and in the physical sciences (11%). Between 2000 and 2013, the proportion

Chapter 2. Higher Education in Science and Engineering
2 | 59National Science Board | Science & Engineering Indicators 2016
of underrepresented minorities enrolled has increased in all broad S&E fields, particularly in computer sciences andpsychology.
In 2013, whites accounted for about 64% of S&E graduate enrollment among U.S. citizens and permanentresidents. They constituted a larger proportion of graduate students enrolled in agricultural sciences and in earth,atmospheric, and ocean sciences (about 80%) and a smaller proportion of those enrolled in computer sciences andsocial sciences (about 60%). The proportions of whites in other fields fell in between. Over time, however, theproportion of whites among graduates enrolled in S&E has declined in all broad S&E fields except for computersciences, where the proportion of whites has been fairly stable.
Asians and Pacific Islanders accounted for 9% of S&E graduate enrollment among U.S. citizens and permanentresidents in 2013, with larger proportions in computer sciences (15%), engineering (13%), and the biological andmedical sciences (about 11% each), as well as a lower proportion in the agricultural sciences (4%); earth,atmospheric, and ocean sciences (4%); psychology (5%); and the social sciences (6%). Between 2000 and 2013,the proportion of Asians and Pacific Islanders enrolled increased slightly in most broad fields, but it declined incomputer sciences (from 21% in 2000 to 15% in 2013).
About 20% of graduate students reporting a disability were enrolled in S&E fields. About 60% of those enrolled inS&E fields and reporting a disability were women, and about 90% were 24 years old or older (NSF/NCSES 2015c).
Graduate Enrollment of International Students
In recent years, enrollment of international students in S&E fields has been on the rise while overall graduateenrollment has remained flat (NSF/NCSES 2014). In 2013, nearly 200,000 international students on temporaryvisas were enrolled in S&E graduate programs (Appendix Table 2-26). The concentration of international enrollment
was highest in computer sciences, engineering, physical sciences, mathematics and statistics, and economics.[iv]
After a post-9/11 decline, the numbers of first-time, full-time international graduate students enrolled increasedmore or less consistently in most broad fields through 2013 (Appendix Table 2-25). Declines and subsequentincreases in number were concentrated in engineering and computer sciences, the fields heavily favored byinternational students. Between 2000 and 2013, international students’ share of first-time, full-time S&E graduateenrollment increased in most broad fields, except for the physical sciences (from 43% to 38%), the biologicalsciences (from 24% to 21%), and the social sciences (from 29% to 27%).
According to data collected by IIE, the overall number of international graduate students in all fields increased by6% from academic years 2012–13 to 2013–14 (IIE 2014). The number of international graduate students enrollingfor the first time in a U.S. institution in fall 2013 increased by 8%. China, India, South Korea, Canada, SaudiArabia, and Taiwan were the top originating locations for international graduate students, similar to the leadinginternational sources of undergraduate enrollment.
More recent data from SEVIS show an overall 13% increase in international graduate students from November
2013 to November 2014 in all fields ( ; Appendix Table 2-27). As stated previously, this increaseTable 2-11 [v]
reflects a larger influx of international students in the United States, and because of the way these data arecollected, the increase may also reflect a larger portion of international students staying in the United States to
pursue another degree. In 2014, 61% of all international students in graduate programs at U.S. institutions were[vi]
enrolled in S&E fields. Between fall 2013 and fall 2014, the number of international graduate students enrolled inS&E fields increased most in computer sciences and engineering, with both combined accounting for more than75% of the total increase in international enrollment in this period. The top sending locations were India and China,accounting for 68% of the international S&E graduate students in the United States in late 2014, followed by Iran,

Chapter 2. Higher Education in Science and Engineering
2 | 60National Science Board | Science & Engineering Indicators 2016
South Korea, Saudi Arabia, and Taiwan. More than 8 in 10 graduate students from Iran were enrolled in an S&Efield, particularly in engineering. Graduate students from South Korea, Saudi Arabia, and Taiwan sent largernumbers of graduate students who enrolled in non-S&E than in S&E fields.
[i] The Survey of Graduate Students and Postdoctorates in Science and Engineering (GSS) was redesigned in 2007.Because of methodological changes, the data collected from 2007 through 2010 are not strictly comparable withthose collected before 2007. As a result, care should be used when assessing trends within the GSS data.Throughout the appendix tables in this chapter, “2007new” reports the data as collected in 2007, and “2007old”provides the data as they would have been collected in 2006. In addition, between 2008 and 2010, the surveyconducted a more rigorous follow-up with institutions regarding the exclusion of practitioner-oriented graduatedegree programs. Some or all of the declines in psychology and other health fields in 2008–10 are likely due to thisincreased effort to exclude practitioner-oriented graduate degree programs rather than changes in actualenrollments. Care should therefore be used when examining long-term trends. Because of this methodologicalchange, in this section, “S&E” excludes psychology and other health fields. For a detailed discussion on the surveyredesign, please see (NSF/SRS 2007, appendix A, “Technical Notes”).
[ii] Special tabulation from the Graduate Student and Postdoctorates in Science and Engineering, available at https: (10 August 2015).//ncsesdata.nsf.gov/webcaspar/
[iii] For patterns on S&E graduate degrees awarded to minority men and minority women, see (NSF/NCSES 2015c).
[iv] See (NSF/NCSES 2015c) for more detail on enrollment of international students by sex.
[v] The data include active foreign national students on F-1 visas in the SEVIS database, excluding those on OPT(temporary employment directly related to the student’s major area of study either during or after completing thedegree program). See note 32.
[vi] For example, an international student who is about to earn a master’s degree and stays in the United States topursue a doctoral degree would remain in the SEVIS database. It is not possible to determine the extent to whichinternational students stay to pursue another degree because of the way the data are collected.
Table 2-11International students enrolled in U.S. higher education institutions, bybroad field and academic level: 2008–14
Field and level 2008 2009 2010 2011 2012 2013 2014
All fields
All levels 526,570 525,680 537,650 574,360 635,650 676,280 750,360
Undergraduate 266,320 272,980 284,770 297,950 351,030 373,740 407,810
Graduate 260,260 252,710 252,890 276,400 284,620 302,540 342,540
S&E fields
All levels 229,010 229,230 235,990 260,280 280,020 307,480 358,100
Undergraduate 76,780 81,110 87,590 96,400 116,640 130,990 149,090
Graduate 152,230 148,120 148,400 163,880 163,390 176,490 209,020

Chapter 2. Higher Education in Science and Engineering
2 | 61National Science Board | Science & Engineering Indicators 2016
Field and level 2008 2009 2010 2011 2012 2013 2014
Non-S&E fields
All levels 297,560 296,460 301,670 314,080 355,630 368,810 392,250
Undergraduate 189,530 191,870 197,180 201,560 234,390 242,750 258,730
Graduate 108,030 104,590 104,490 112,520 121,240 126,060 133,530
NOTES: Data include active foreign national students on F-1 visas and exclude those on optional practical training.Undergraduate level includes associate’s and bachelor’s degrees; graduate level includes master’s and doctoraldegrees. Numbers are rounded to the nearest 10. Detail may not add to total because of rounding.
SOURCE: U.S. Department of Homeland Security, U.S. Immigration and Customs Enforcement, special tabulations(2014) of the Student and Exchange Visitor Information System database.
Science and Engineering Indicators 2016
S&E Master's Degrees
Master’s degrees awarded in S&E fields increased from about 96,000 in 2000 to about 166,000 in 2013, with
growth concentrated in two periods, 2002–04 and 2007–13 (Appendix Table 2-28). Increases occurred in all[i]
major science fields. Master’s degrees awarded in engineering and computer sciences declined between 2004 and2007, but they have since increased. The number of master’s degrees awarded in engineering and in computersciences in 2013 was the highest in the last 14 years ( ). During this period, growth was largest inFigure 2-18engineering, psychology, and the social sciences (particularly in political science and public administration)(Appendix Table 2-28). In some fields, such as engineering and geosciences, a master’s degree can fully preparestudents for an established career track. In other fields, master’s degrees primarily mark a step toward doctoraldegrees.
[i] Data on degree completion from NCES were obtained from WebCASPAR ( ). Datahttps://webcaspar.nsf.gov/uploaded in WebCASPAR correspond to NCES provisional data, which undergo all NCES data quality controlprocedures and are imputed for nonresponding institutions. These data are used by NCES in its First Look(Provisional Data) publications.

Chapter 2. Higher Education in Science and Engineering
2 | 62National Science Board | Science & Engineering Indicators 2016
Figure 2-18
S&E master's degrees, by field: 2000–13
NOTE: Physical sciences include earth, atmospheric, and ocean sciences.
SOURCES: National Center for Education Statistics, Integrated Postsecondary Education Data System, Completions Survey;National Science Foundation, National Center for Science and Engineering Statistics, WebCASPAR database, http://webcaspar.nsf.gov.
Science and Engineering Indicators 2016
Professional Science Master’s (PSM) programs, which stress interdisciplinary training, are a relatively new directionin graduate education. PSM degrees provide advanced training in an S&E field beyond the bachelor’s degree levelwhile also developing administrative and business skills that are valued by employers, such as leadership, projectmanagement, teamwork, and communication (for details on PSM degrees, see [NSB 2014:2–30]). As of April 2015,there were 334 PSM programs and 157 PSM-affiliated institutions (PSM 2015).
S&E Master’s Degrees by Sex
The number of S&E master’s degrees earned by both men and women rose between 2000 and 2013 (Figure 2-19). In 2000, women earned 43% of all S&E master’s degrees; by 2013, they earned 46% (Appendix Table 2-28).Among U.S. citizens and permanent residents, women earned nearly half of all S&E master’s degrees. However,among temporary residents, women earned slightly more than one-third of all S&E master’s degrees (NSF/NCSES2015c).
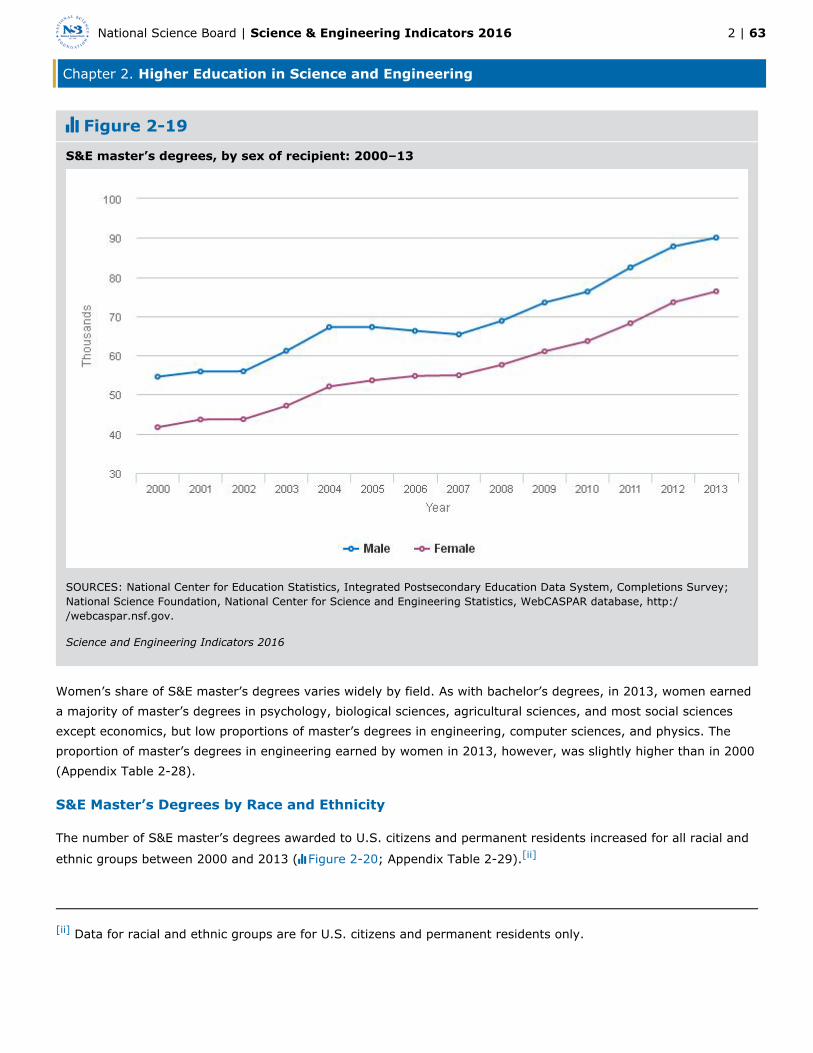
Chapter 2. Higher Education in Science and Engineering
2 | 63National Science Board | Science & Engineering Indicators 2016
Figure 2-19
S&E master’s degrees, by sex of recipient: 2000–13
SOURCES: National Center for Education Statistics, Integrated Postsecondary Education Data System, Completions Survey;National Science Foundation, National Center for Science and Engineering Statistics, WebCASPAR database, http://webcaspar.nsf.gov.
Science and Engineering Indicators 2016
Women’s share of S&E master’s degrees varies widely by field. As with bachelor’s degrees, in 2013, women earneda majority of master’s degrees in psychology, biological sciences, agricultural sciences, and most social sciencesexcept economics, but low proportions of master’s degrees in engineering, computer sciences, and physics. Theproportion of master’s degrees in engineering earned by women in 2013, however, was slightly higher than in 2000(Appendix Table 2-28).
S&E Master’s Degrees by Race and Ethnicity
The number of S&E master’s degrees awarded to U.S. citizens and permanent residents increased for all racial and
ethnic groups between 2000 and 2013 ( ; Appendix Table 2-29).Figure 2-20 [ii]
[ii] Data for racial and ethnic groups are for U.S. citizens and permanent residents only.

Chapter 2. Higher Education in Science and Engineering
2 | 64National Science Board | Science & Engineering Indicators 2016
Figure 2-20
S&E master’s degrees, by race, ethnicity, and citizenship: 2000–13
NOTES: Data on race and ethnicity include U.S. citizens and permanent residents. Hispanic may be any race. American Indianor Alaska Native, Asian or Pacific Islander, black or African American, and white refer to individuals who are not of Hispanicorigin.
SOURCES: National Center for Education Statistics, Integrated Postsecondary Education Data System, Completions Survey;National Science Foundation, National Center for Science and Engineering Statistics, WebCASPAR database, http://webcaspar.nsf.gov.
Science and Engineering Indicators 2016
The proportion of U.S. S&E master’s degrees earned by underrepresented racial and ethnic minorities increasedfrom 14% to 19% between 2000 and 2013; that earned by whites fell from 70% to 60%. The trends are not verydifferent from those found in the data on bachelor’s degree awards among racial and ethnic groups. Blacksaccounted for 11% of S&E master’s degree recipients in 2013, up from 8% in 2000; Hispanics accounted for 8%,up from 5%; and American Indians and Alaska Natives accounted for 0.5%, similar to the proportion in 2000. The
proportion of Asian and Pacific Islander S&E recipients also remained flat in this period.[iii]
S&E Master’s Degrees by Citizenship
The number of international master’s students who earned an S&E degree increased from nearly 25,000 in 2000 to43,000 in 2013. International students make up a much higher proportion of S&E master’s degree recipients thanof bachelor’s or associate’s degree recipients. In 2013, international students earned more than one-quarter of S&Emaster’s degrees. Their degrees were heavily concentrated in computer sciences, economics, and engineering,

Chapter 2. Higher Education in Science and Engineering
2 | 65National Science Board | Science & Engineering Indicators 2016
where they received more than 4 out of 10 of all master’s degrees awarded in 2013 (Appendix Table 2-29). Withinengineering, students on temporary visas earned more than half of the master’s degrees in electrical and chemicalengineering.
The number of S&E master’s degrees awarded to students on temporary visas reached its highest point in a decadein 2013 (43,000), after a sharp decline between 2004 and 2007. Most of the drop during this period was accountedfor by decreasing numbers of temporary residents in the computer sciences and engineering fields, but in bothfields, numbers rebounded by more than 50% in the following years.
[iii] For patterns on S&E master’s degrees awarded to minority men and minority women, see (NSF/NCSES 2015c).
S&E Doctoral Degrees
Doctoral education in the United States generates new knowledge by closely linking specialized education andhands-on research experience. The results are important for the society as a whole and for U.S. competitiveness ina global knowledge-based economy. Doctoral education prepares a new generation of researchers in academia,industry, government, and nonprofits, as well as a highly skilled workforce for other sectors of the economy.Decades-long participation of large and growing numbers of temporary visa holders attests to the attractiveness ofthis model.
The number of S&E doctorates (excluding those in other health sciences ) conferred annually by U.S. universities[i]
increased steadily between 2002 and 2008, declined through 2010, and increased by 14% through 2013, to nearly
39,000 (Appendix Table 2-30). The growth in the number of S&E doctorates between 2000 and 2013 occurred[ii]
among U.S. citizens and permanent residents as well as temporary visa holders. The largest increases in S&Edoctorates were in engineering and the biological sciences ( ).Figure 2-21
[i] Other health sciences include the fields of nursing; rehabilitation and therapeutic professions; and other health,professional, and related clinical sciences.
[ii] Data on degree completion from NCES were obtained from WebCASPAR (https://webcaspar.nsf.gov/). Datauploaded in WebCASPAR correspond to NCES provisional data, which undergo all NCES data quality controlprocedures and are imputed for nonresponding institutions. These data are used by NCES in its First Look(Provisional Data) publications.

Chapter 2. Higher Education in Science and Engineering
2 | 66National Science Board | Science & Engineering Indicators 2016
Figure 2-21
S&E doctoral degrees earned in U.S. universities, by field: 2000–13
NOTES: Physical sciences include earth, atmospheric, and ocean sciences. Data differ from doctoral degree data in other tablesand figures in this report that are based on the National Science Foundation Survey of Earned Doctorates and that refer toresearch doctorates only. Greatest differences are in psychology and medical sciences.
SOURCES: National Center for Education Statistics, Integrated Postsecondary Education Data System, Completions Survey;National Science Foundation, National Center for Science and Engineering Statistics, WebCASPAR database, http://webcaspar.nsf.gov.
Science and Engineering Indicators 2016
Time to Doctoral Degree Completion
The time required to earn a doctoral degree and the success rates of those entering doctoral programs are concernsfor those pursuing a degree, the universities awarding the degree, and the agencies and organizations fundingdoctoral study. Longer times to degree mean lost earnings and a higher risk of attrition. Time to degree (asmeasured by time from graduate school entry to doctorate receipt) increased through the mid-1990s but has sincedecreased in all S&E fields from 7.7 to 6.9 years (Appendix Table 2-31). The physical sciences and mathematicshad the shortest time to degree, whereas the social sciences and medical and other health sciences had thelongest.
Time to degree varied among institution types (see sidebar, ).Carnegie Classification of Academic InstitutionsTime to degree was shortest at research universities with very high research activity (6.7 years in 2013, down from7.2 years in 1998). Doctorate recipients at medical schools also finished quickly (6.7 years in 2013). Time to degreewas longer at universities that were less strongly oriented toward research ( ).Table 2-12
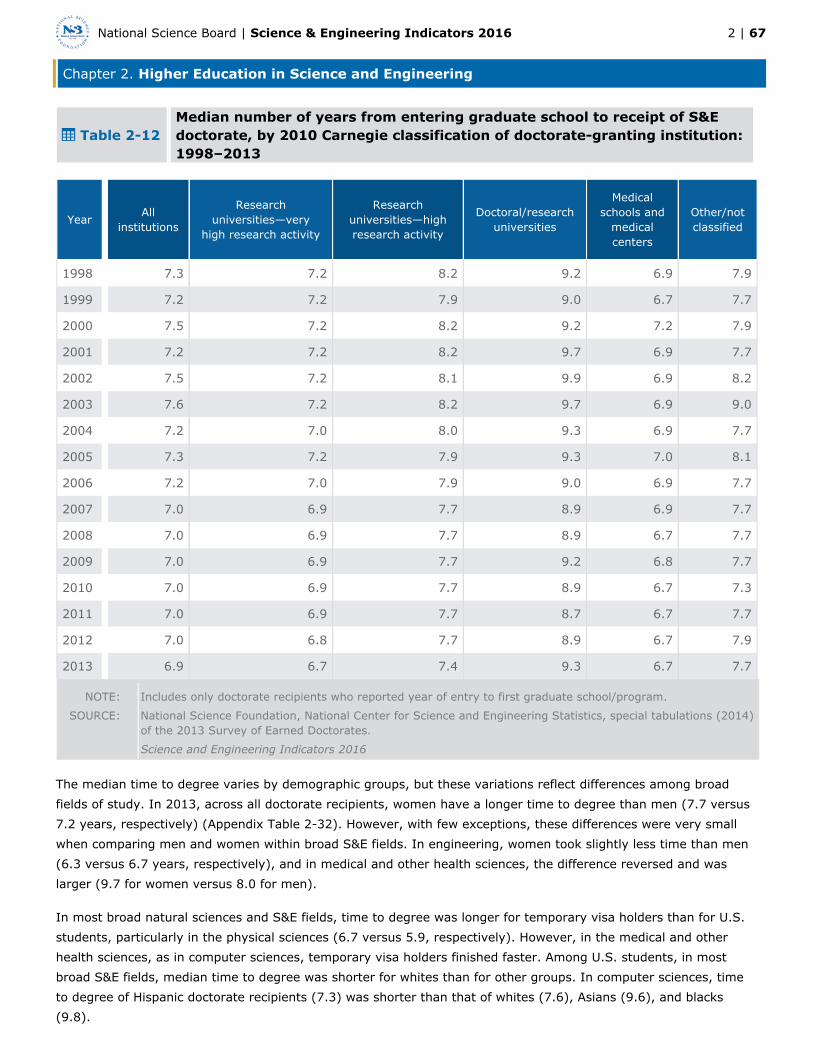
Chapter 2. Higher Education in Science and Engineering
2 | 67National Science Board | Science & Engineering Indicators 2016
Table 2-12Median number of years from entering graduate school to receipt of S&Edoctorate, by 2010 Carnegie classification of doctorate-granting institution:1998–2013
Year Allinstitutions
Researchuniversities—very
high research activity
Researchuniversities—highresearch activity
Doctoral/researchuniversities
Medicalschools and
medicalcenters
Other/notclassified
1998 7.3 7.2 8.2 9.2 6.9 7.9
1999 7.2 7.2 7.9 9.0 6.7 7.7
2000 7.5 7.2 8.2 9.2 7.2 7.9
2001 7.2 7.2 8.2 9.7 6.9 7.7
2002 7.5 7.2 8.1 9.9 6.9 8.2
2003 7.6 7.2 8.2 9.7 6.9 9.0
2004 7.2 7.0 8.0 9.3 6.9 7.7
2005 7.3 7.2 7.9 9.3 7.0 8.1
2006 7.2 7.0 7.9 9.0 6.9 7.7
2007 7.0 6.9 7.7 8.9 6.9 7.7
2008 7.0 6.9 7.7 8.9 6.7 7.7
2009 7.0 6.9 7.7 9.2 6.8 7.7
2010 7.0 6.9 7.7 8.9 6.7 7.3
2011 7.0 6.9 7.7 8.7 6.7 7.7
2012 7.0 6.8 7.7 8.9 6.7 7.9
2013 6.9 6.7 7.4 9.3 6.7 7.7
NOTE: Includes only doctorate recipients who reported year of entry to first graduate school/program.
SOURCE: National Science Foundation, National Center for Science and Engineering Statistics, special tabulations (2014)of the 2013 Survey of Earned Doctorates.
Science and Engineering Indicators 2016
The median time to degree varies by demographic groups, but these variations reflect differences among broadfields of study. In 2013, across all doctorate recipients, women have a longer time to degree than men (7.7 versus7.2 years, respectively) (Appendix Table 2-32). However, with few exceptions, these differences were very smallwhen comparing men and women within broad S&E fields. In engineering, women took slightly less time than men(6.3 versus 6.7 years, respectively), and in medical and other health sciences, the difference reversed and waslarger (9.7 for women versus 8.0 for men).
In most broad natural sciences and S&E fields, time to degree was longer for temporary visa holders than for U.S.students, particularly in the physical sciences (6.7 versus 5.9, respectively). However, in the medical and otherhealth sciences, as in computer sciences, temporary visa holders finished faster. Among U.S. students, in mostbroad S&E fields, median time to degree was shorter for whites than for other groups. In computer sciences, timeto degree of Hispanic doctorate recipients (7.3) was shorter than that of whites (7.6), Asians (9.6), and blacks(9.8).
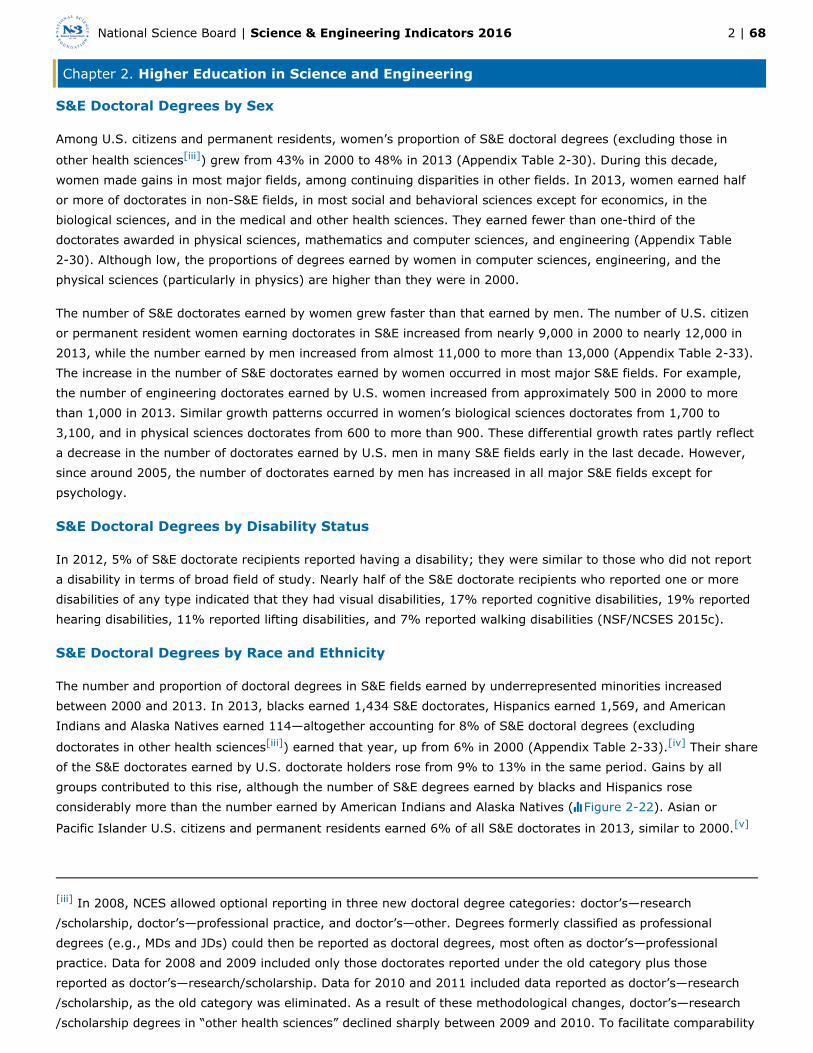
Chapter 2. Higher Education in Science and Engineering
2 | 68National Science Board | Science & Engineering Indicators 2016
S&E Doctoral Degrees by Sex
Among U.S. citizens and permanent residents, women’s proportion of S&E doctoral degrees (excluding those in
other health sciences ) grew from 43% in 2000 to 48% in 2013 (Appendix Table 2-30). During this decade,[iii]
women made gains in most major fields, among continuing disparities in other fields. In 2013, women earned halfor more of doctorates in non-S&E fields, in most social and behavioral sciences except for economics, in thebiological sciences, and in the medical and other health sciences. They earned fewer than one-third of thedoctorates awarded in physical sciences, mathematics and computer sciences, and engineering (Appendix Table2-30). Although low, the proportions of degrees earned by women in computer sciences, engineering, and thephysical sciences (particularly in physics) are higher than they were in 2000.
The number of S&E doctorates earned by women grew faster than that earned by men. The number of U.S. citizenor permanent resident women earning doctorates in S&E increased from nearly 9,000 in 2000 to nearly 12,000 in2013, while the number earned by men increased from almost 11,000 to more than 13,000 (Appendix Table 2-33).The increase in the number of S&E doctorates earned by women occurred in most major S&E fields. For example,the number of engineering doctorates earned by U.S. women increased from approximately 500 in 2000 to morethan 1,000 in 2013. Similar growth patterns occurred in women’s biological sciences doctorates from 1,700 to3,100, and in physical sciences doctorates from 600 to more than 900. These differential growth rates partly reflecta decrease in the number of doctorates earned by U.S. men in many S&E fields early in the last decade. However,since around 2005, the number of doctorates earned by men has increased in all major S&E fields except forpsychology.
S&E Doctoral Degrees by Disability Status
In 2012, 5% of S&E doctorate recipients reported having a disability; they were similar to those who did not reporta disability in terms of broad field of study. Nearly half of the S&E doctorate recipients who reported one or moredisabilities of any type indicated that they had visual disabilities, 17% reported cognitive disabilities, 19% reportedhearing disabilities, 11% reported lifting disabilities, and 7% reported walking disabilities (NSF/NCSES 2015c).
S&E Doctoral Degrees by Race and Ethnicity
The number and proportion of doctoral degrees in S&E fields earned by underrepresented minorities increasedbetween 2000 and 2013. In 2013, blacks earned 1,434 S&E doctorates, Hispanics earned 1,569, and AmericanIndians and Alaska Natives earned 114—altogether accounting for 8% of S&E doctoral degrees (excluding
doctorates in other health sciences ) earned that year, up from 6% in 2000 (Appendix Table 2-33). Their share[iii] [iv]
of the S&E doctorates earned by U.S. doctorate holders rose from 9% to 13% in the same period. Gains by allgroups contributed to this rise, although the number of S&E degrees earned by blacks and Hispanics roseconsiderably more than the number earned by American Indians and Alaska Natives ( ). Asian orFigure 2-22
Pacific Islander U.S. citizens and permanent residents earned 6% of all S&E doctorates in 2013, similar to 2000.[v]
[iii] In 2008, NCES allowed optional reporting in three new doctoral degree categories: doctor’s—research/scholarship, doctor’s—professional practice, and doctor’s—other. Degrees formerly classified as professionaldegrees (e.g., MDs and JDs) could then be reported as doctoral degrees, most often as doctor’s—professionalpractice. Data for 2008 and 2009 included only those doctorates reported under the old category plus thosereported as doctor’s—research/scholarship. Data for 2010 and 2011 included data reported as doctor’s—research/scholarship, as the old category was eliminated. As a result of these methodological changes, doctor’s—research/scholarship degrees in “other health sciences” declined sharply between 2009 and 2010. To facilitate comparability

Chapter 2. Higher Education in Science and Engineering
2 | 69National Science Board | Science & Engineering Indicators 2016
over time, “S&E” excludes “other health sciences” throughout the sections “S&E Doctoral Degrees,” “DoctoralDegrees by Sex,” and “Doctoral Degrees by Race and Ethnicity.”
[iv] For the corresponding proportion in the 1990s, see (NSB 2008).
[v] For patterns on S&E doctorates awarded to minority men and minority women, see (NSF/NCSES 2015c).
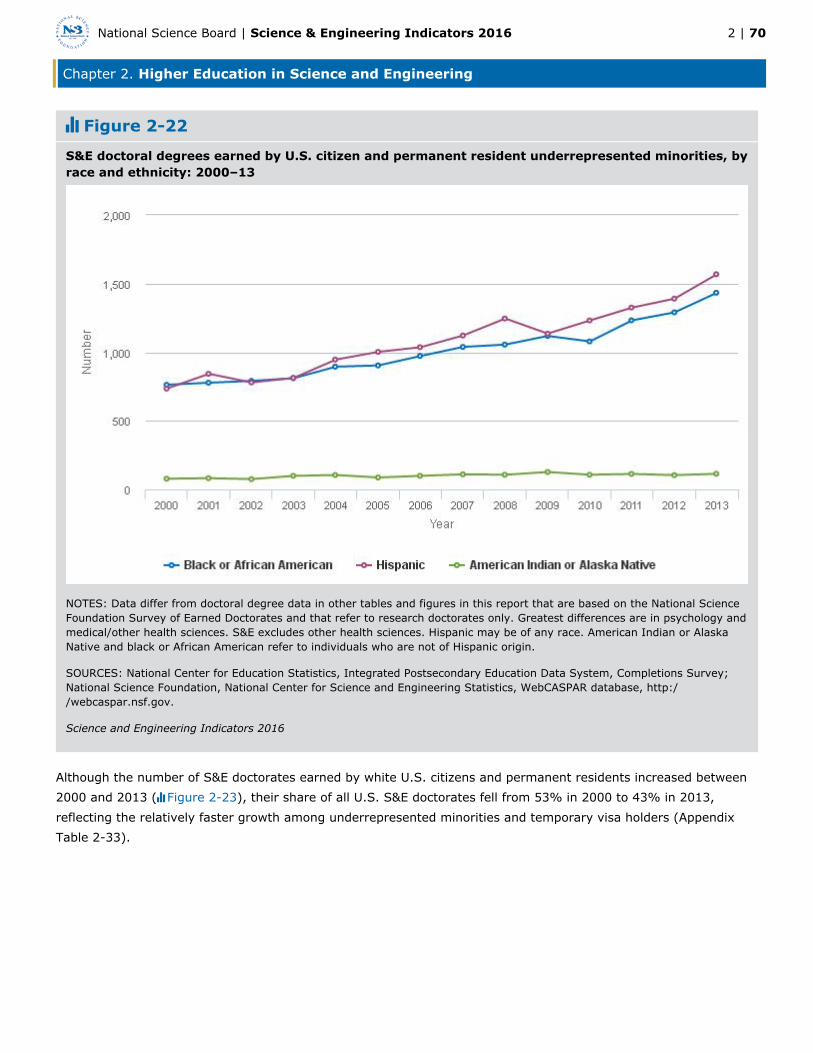
Chapter 2. Higher Education in Science and Engineering
2 | 70National Science Board | Science & Engineering Indicators 2016
Figure 2-22
S&E doctoral degrees earned by U.S. citizen and permanent resident underrepresented minorities, byrace and ethnicity: 2000–13
NOTES: Data differ from doctoral degree data in other tables and figures in this report that are based on the National ScienceFoundation Survey of Earned Doctorates and that refer to research doctorates only. Greatest differences are in psychology andmedical/other health sciences. S&E excludes other health sciences. Hispanic may be of any race. American Indian or AlaskaNative and black or African American refer to individuals who are not of Hispanic origin.
SOURCES: National Center for Education Statistics, Integrated Postsecondary Education Data System, Completions Survey;National Science Foundation, National Center for Science and Engineering Statistics, WebCASPAR database, http://webcaspar.nsf.gov.
Science and Engineering Indicators 2016
Although the number of S&E doctorates earned by white U.S. citizens and permanent residents increased between2000 and 2013 ( ), their share of all U.S. S&E doctorates fell from 53% in 2000 to 43% in 2013,Figure 2-23reflecting the relatively faster growth among underrepresented minorities and temporary visa holders (AppendixTable 2-33).

Chapter 2. Higher Education in Science and Engineering
2 | 71National Science Board | Science & Engineering Indicators 2016
Figure 2-23
S&E doctoral degrees, by sex, race, ethnicity, and citizenship: 2000–13
NOTES: Minority includes American Indian or Alaska Native, Asian or Pacific Islander, black or African American, and Hispanic.Data differ from doctoral degree data in other tables and figures in this report that are based on the National ScienceFoundation Survey of Earned Doctorates and that refer to research doctorates only. Greatest differences are in psychology andmedical/other health sciences. S&E excludes other health sciences.
SOURCES: National Center for Education Statistics, Integrated Postsecondary Education Data System, Completions Survey;National Science Foundation, National Center for Science and Engineering Statistics, WebCASPAR database, http://webcaspar.nsf.gov. See appendix tables 2-30 and 2-33.
Science and Engineering Indicators 2016
International S&E Doctorate Recipients
Temporary residents earned more than 14,000 S&E doctorates in 2013, up from about 8,000 in 2000. Internationalstudents on temporary visas earned a larger proportion of doctoral degrees than master’s, bachelor’s, or associate’sdegrees (Appendix Table 2-33, Appendix Table 2-29, Appendix Table 2-18, and Appendix Table 2-23, respectively).The temporary residents’ share of S&E doctorates rose from 31% in 2000 to 37% in 2013. In some fields, thesestudents earned even larger shares of doctoral degrees. In 2013, they earned half or more of doctoral degreesawarded in engineering, computer sciences, and economics. They earned relatively lower proportions of doctoraldegrees in some S&E fields—for example, 27% in biological sciences, 25% in medical sciences, 6% in psychology,and between 12% and 22% in most social sciences (except economics) (Appendix Table 2-33).
Countries and Economies of Origin

Chapter 2. Higher Education in Science and Engineering
2 | 72National Science Board | Science & Engineering Indicators 2016
In the two decades since 1993, U.S. universities have awarded almost 210,000 S&E doctorates to temporary visaholders. Over that period, the top 10 countries and economies of origin accounted for 70% of all internationalrecipients of these degrees ( ). Six out of those top 10 locations are in Asia.Table 2-13
Table 2-13Recipients of U.S. S&E doctorates on temporary visas, by country/economyof origin: 1993–2013
Country/economy Number Percent
All recipients on temporary visas 208,861 100.0
Top 10 total 145,232 69.5
China 55,760 26.7
India 27,655 13.2
South Korea 20,899 10.0
Taiwan 14,184 6.8
Canada 6,160 2.9
Turkey 6,110 2.9
Thailand 4,346 2.1
Japan 3,497 1.7
Mexico 3,419 1.6
Germany 3,202 1.5
All others 63,629 30.5
NOTE: Data include non-U.S. citizens with unknown visa status.
SOURCE: National Science Foundation, National Center for Science and Engineering Statistics, special tabulations (2014)of the 2013 Survey of Earned Doctorates.
Science and Engineering Indicators 2016
Asia. From 1993 to 2013, students from four Asian locations (China, India, South Korea, and Taiwan, in descendingorder) earned more than half of all U.S. S&E doctoral degrees awarded to international students (119,000 of209,000)—exceeding students from Europe (25,000) more than fourfold. By itself, China accounted for more thanone-quarter of all these S&E doctorates (56,000), followed by India (28,000), South Korea (21,000), and Taiwan(14,000). Most of these degrees were awarded in engineering, biological sciences, and physical sciences (Table
). A larger proportion of South Korean and Taiwanese doctorate recipients (exceeding 20%) than Chinese and2-14Indian (approaching 10%) earned a doctorate in a non-S&E field.
Table 2-14Asian recipients of U.S. S&E doctorates on temporary visas, by field andcountry/economy of origin: 1993–2013
Field Asia China India South Korea Taiwan
All fields 157,823 59,798 30,182 26,740 17,981
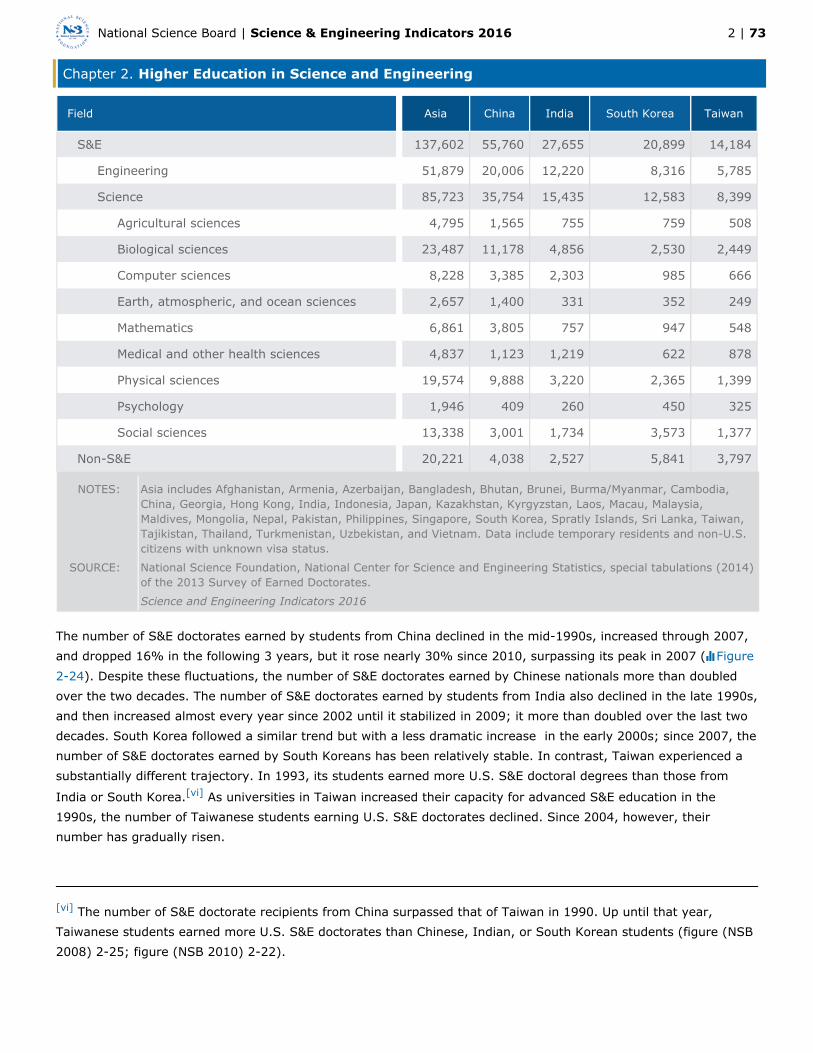
Chapter 2. Higher Education in Science and Engineering
2 | 73National Science Board | Science & Engineering Indicators 2016
Field Asia China India South Korea Taiwan
S&E 137,602 55,760 27,655 20,899 14,184
Engineering 51,879 20,006 12,220 8,316 5,785
Science 85,723 35,754 15,435 12,583 8,399
Agricultural sciences 4,795 1,565 755 759 508
Biological sciences 23,487 11,178 4,856 2,530 2,449
Computer sciences 8,228 3,385 2,303 985 666
Earth, atmospheric, and ocean sciences 2,657 1,400 331 352 249
Mathematics 6,861 3,805 757 947 548
Medical and other health sciences 4,837 1,123 1,219 622 878
Physical sciences 19,574 9,888 3,220 2,365 1,399
Psychology 1,946 409 260 450 325
Social sciences 13,338 3,001 1,734 3,573 1,377
Non-S&E 20,221 4,038 2,527 5,841 3,797
NOTES: Asia includes Afghanistan, Armenia, Azerbaijan, Bangladesh, Bhutan, Brunei, Burma/Myanmar, Cambodia,China, Georgia, Hong Kong, India, Indonesia, Japan, Kazakhstan, Kyrgyzstan, Laos, Macau, Malaysia,Maldives, Mongolia, Nepal, Pakistan, Philippines, Singapore, South Korea, Spratly Islands, Sri Lanka, Taiwan,Tajikistan, Thailand, Turkmenistan, Uzbekistan, and Vietnam. Data include temporary residents and non-U.S.citizens with unknown visa status.
SOURCE: National Science Foundation, National Center for Science and Engineering Statistics, special tabulations (2014)of the 2013 Survey of Earned Doctorates.
Science and Engineering Indicators 2016
The number of S&E doctorates earned by students from China declined in the mid-1990s, increased through 2007,and dropped 16% in the following 3 years, but it rose nearly 30% since 2010, surpassing its peak in 2007 (Figure
). Despite these fluctuations, the number of S&E doctorates earned by Chinese nationals more than doubled2-24over the two decades. The number of S&E doctorates earned by students from India also declined in the late 1990s,and then increased almost every year since 2002 until it stabilized in 2009; it more than doubled over the last twodecades. South Korea followed a similar trend but with a less dramatic increase in the early 2000s; since 2007, thenumber of S&E doctorates earned by South Koreans has been relatively stable. In contrast, Taiwan experienced asubstantially different trajectory. In 1993, its students earned more U.S. S&E doctoral degrees than those from
India or South Korea. As universities in Taiwan increased their capacity for advanced S&E education in the[vi]
1990s, the number of Taiwanese students earning U.S. S&E doctorates declined. Since 2004, however, theirnumber has gradually risen.
[vi] The number of S&E doctorate recipients from China surpassed that of Taiwan in 1990. Up until that year,Taiwanese students earned more U.S. S&E doctorates than Chinese, Indian, or South Korean students (figure (NSB2008) 2-25; figure (NSB 2010) 2-22).

Chapter 2. Higher Education in Science and Engineering
2 | 74National Science Board | Science & Engineering Indicators 2016
Figure 2-24
U.S. S&E doctoral degree recipients, by selected Asian country/economy of origin: 1993–2013
NOTE: Degree recipients include temporary residents and non-U.S. citizens with unknown visa status.
SOURCE: National Science Foundation, National Center for Science and Engineering Statistics, special tabulations (2014) ofthe 2013 Survey of Earned Doctorates.
Science and Engineering Indicators 2016
Europe. European students earned far fewer U.S. S&E doctorates than Asian students between 1993 and 2013—acombined number broadly comparable with doctorates earned by students from India—and they tended to focusless on engineering than did their Asian counterparts ( and ). European countries whoseTable 2-14 Table 2-15students earned the largest number of U.S. S&E doctorates from 1993 to 2013 were Germany, Russia, Greece,Italy, Romania, France, and the United Kingdom, in that order. Trends in doctorate recipients from individualWestern European countries vary widely ( ). The number of Central and Eastern European studentsFigure 2-25earning S&E doctorates at U.S. universities nearly quadrupled between 1993 and 2013, to 390. Although theirnumbers almost reached the Western Europe total between 2005 and 2007, they have declined since then (Figure
). A higher proportion of doctorate recipients from Russia, Romania, and Greece than from the United2-26Kingdom, France, Italy, and Germany earned their doctorates in S&E. Russian and Romanian doctorate recipientswere more likely than those from Western European countries to earn their doctorates in mathematics and physicalsciences, and Greek and French doctorate recipients were more likely to earn doctoral degrees in engineering (
).Table 2-15
Table 2-15European recipients of U.S. S&E doctorates on temporary visas, by field andregion/country of origin: 1993–2013
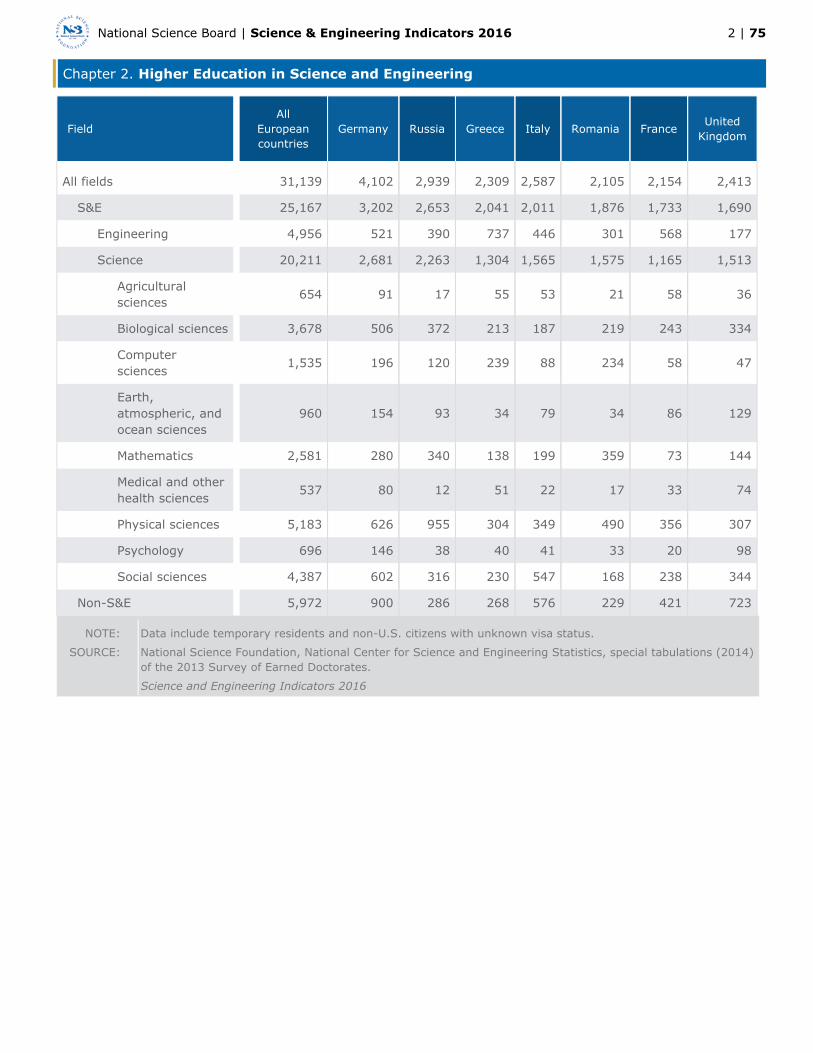
Chapter 2. Higher Education in Science and Engineering
2 | 75National Science Board | Science & Engineering Indicators 2016
FieldAll
Europeancountries
Germany Russia Greece Italy Romania FranceUnited
Kingdom
All fields 31,139 4,102 2,939 2,309 2,587 2,105 2,154 2,413
S&E 25,167 3,202 2,653 2,041 2,011 1,876 1,733 1,690
Engineering 4,956 521 390 737 446 301 568 177
Science 20,211 2,681 2,263 1,304 1,565 1,575 1,165 1,513
Agriculturalsciences
654 91 17 55 53 21 58 36
Biological sciences 3,678 506 372 213 187 219 243 334
Computersciences
1,535 196 120 239 88 234 58 47
Earth,atmospheric, andocean sciences
960 154 93 34 79 34 86 129
Mathematics 2,581 280 340 138 199 359 73 144
Medical and otherhealth sciences
537 80 12 51 22 17 33 74
Physical sciences 5,183 626 955 304 349 490 356 307
Psychology 696 146 38 40 41 33 20 98
Social sciences 4,387 602 316 230 547 168 238 344
Non-S&E 5,972 900 286 268 576 229 421 723
NOTE: Data include temporary residents and non-U.S. citizens with unknown visa status.
SOURCE: National Science Foundation, National Center for Science and Engineering Statistics, special tabulations (2014)of the 2013 Survey of Earned Doctorates.
Science and Engineering Indicators 2016

Chapter 2. Higher Education in Science and Engineering
2 | 76National Science Board | Science & Engineering Indicators 2016
Figure 2-25
U.S. S&E doctoral degree recipients, by selected Western European country: 1993–2013
NOTE: Degree recipients include temporary residents and non-U.S. citizens with unknown visa status.
SOURCE: National Science Foundation, National Center for Science and Engineering Statistics, special tabulations (2014) ofthe 2013 Survey of Earned Doctorates.
Science and Engineering Indicators 2016

Chapter 2. Higher Education in Science and Engineering
2 | 77National Science Board | Science & Engineering Indicators 2016
Figure 2-26
U.S. S&E doctoral degree recipients from Europe, by region: 1993–2013
NOTES: Degree recipients include temporary residents and non-U.S. citizens with unknown visa status. Western Europeincludes Andorra, Austria, Belgium, France, Germany, Greece, Ireland, Italy, Liechtenstein, Luxembourg, Malta, Monaco,Netherlands, Portugal, San Marino, Spain, Switzerland, and United Kingdom. Central and Eastern Europe includes Albania,Belarus, Bosnia-Herzegovina, Bulgaria, Croatia, Czech Republic, Estonia, Hungary, Kosovo, Latvia, Lithuania, Macedonia,Moldova, Montenegro, Poland, Romania, Russia, Serbia, Slovakia, Slovenia, and Ukraine. Scandinavia includes Denmark,Finland, Iceland, Norway, and Sweden.
SOURCE: National Science Foundation, National Center for Science and Engineering Statistics, special tabulations (2014) ofthe 2013 Survey of Earned Doctorates.
Science and Engineering Indicators 2016
The Americas. Despite the proximity of Canada and Mexico to the United States, the shares of U.S. S&E doctoraldegrees awarded to residents of these countries were small compared with those awarded to students from Asiaand Europe. The number of U.S. doctoral S&E degrees earned by students from Canada increased from about 230in 1993 to 390 in 2009, but it has mostly declined in the last 4 years. The overall numbers of doctoral degreerecipients from Mexico and Brazil peaked earlier (2003 and 1996, respectively) and have been relatively stable inrecent years ( ).Figure 2-27

Chapter 2. Higher Education in Science and Engineering
2 | 78National Science Board | Science & Engineering Indicators 2016
Figure 2-27
U.S. S&E doctoral degree recipients from Canada, Mexico, and Brazil: 1993–2013
NOTE: Degree recipients include temporary residents and non-U.S. citizens with unknown visa status.
SOURCE: National Science Foundation, National Center for Science and Engineering Statistics, special tabulations (2014) ofthe 2013 Survey of Earned Doctorates.
Science and Engineering Indicators 2016
A higher proportion of Mexican and Brazilian students earned U.S. doctorates in S&E fields than the comparableproportion for Canadians ( ). In particular, higher proportions of Mexican and Brazilian students thanTable 2-16Canadian students received U.S. doctoral degrees in engineering and agricultural sciences.
Table 2-16North American, South American, and Middle Eastern recipients of U.S. S&Edoctorates, by field and region/country of origin: 1993–2013
North and South Americaa Middle Eastb
FieldAll
countriesCanada Mexico Brazil
Allcountries
Turkey Iran Jordan
All fields 24,518 8,994 3,989 3,503 17,558 7,242 2,560 1,790
S&E 19,076 6,160 3,419 2,924 14,440 6,110 2,450 1,551
Engineering 4,047 958 852 687 6,498 2,704 1,645 678
Science 15,029 5,202 2,567 2,237 7,942 3,406 805 873
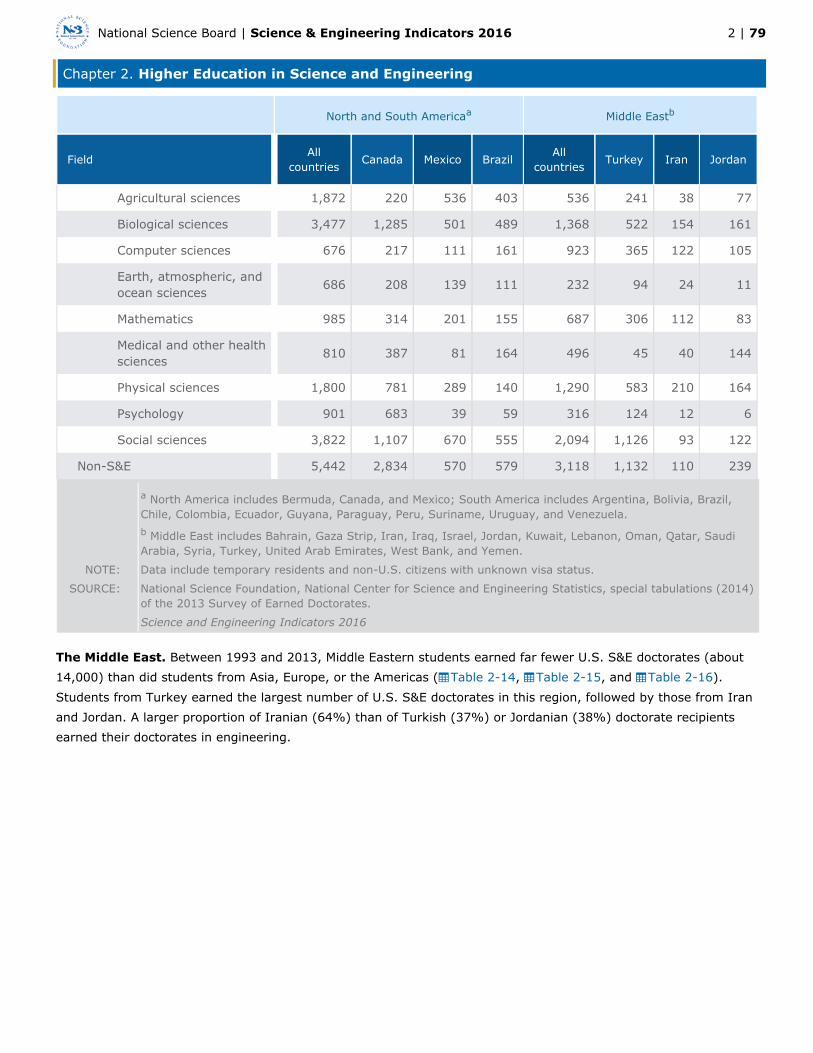
Chapter 2. Higher Education in Science and Engineering
2 | 79National Science Board | Science & Engineering Indicators 2016
North and South Americaa Middle Eastb
FieldAll
countriesCanada Mexico Brazil
Allcountries
Turkey Iran Jordan
Agricultural sciences 1,872 220 536 403 536 241 38 77
Biological sciences 3,477 1,285 501 489 1,368 522 154 161
Computer sciences 676 217 111 161 923 365 122 105
Earth, atmospheric, andocean sciences
686 208 139 111 232 94 24 11
Mathematics 985 314 201 155 687 306 112 83
Medical and other healthsciences
810 387 81 164 496 45 40 144
Physical sciences 1,800 781 289 140 1,290 583 210 164
Psychology 901 683 39 59 316 124 12 6
Social sciences 3,822 1,107 670 555 2,094 1,126 93 122
Non-S&E 5,442 2,834 570 579 3,118 1,132 110 239
a North America includes Bermuda, Canada, and Mexico; South America includes Argentina, Bolivia, Brazil,Chile, Colombia, Ecuador, Guyana, Paraguay, Peru, Suriname, Uruguay, and Venezuela.b Middle East includes Bahrain, Gaza Strip, Iran, Iraq, Israel, Jordan, Kuwait, Lebanon, Oman, Qatar, SaudiArabia, Syria, Turkey, United Arab Emirates, West Bank, and Yemen.
NOTE: Data include temporary residents and non-U.S. citizens with unknown visa status.
SOURCE: National Science Foundation, National Center for Science and Engineering Statistics, special tabulations (2014)of the 2013 Survey of Earned Doctorates.
Science and Engineering Indicators 2016
The Middle East. Between 1993 and 2013, Middle Eastern students earned far fewer U.S. S&E doctorates (about14,000) than did students from Asia, Europe, or the Americas ( , , and ).Table 2-14 Table 2-15 Table 2-16Students from Turkey earned the largest number of U.S. S&E doctorates in this region, followed by those from Iranand Jordan. A larger proportion of Iranian (64%) than of Turkish (37%) or Jordanian (38%) doctorate recipientsearned their doctorates in engineering.

Chapter 2. Higher Education in Science and Engineering
2 | 80National Science Board | Science & Engineering Indicators 2016
International S&E Higher Education
In the 1990s, many countries, coming to view an educated population and workforce as a valuable nationalresource, expanded their higher education systems and eased access to higher education. At the same time, flowsof students worldwide increased, often reflecting government incentives and programs. More recently, severalcountries have adopted policies to encourage the return of students who studied abroad, to attract internationalstudents, or both. As the world becomes more interconnected, students who enroll in tertiary (postsecondary)institutions outside their own countries have opportunities to expand their knowledge of other societies andlanguages and improve their employability in globalized labor markets.
Higher Education Expenditures
One indicator of the importance of higher education is the percentage of a nation’s resources devoted to it asmeasured by the ratio of expenditures on tertiary education institutions to gross domestic product (GDP). Thisindicator varies widely among members of the OECD, an intergovernmental group of developed economies. Onlyabout one-third of OECD members spend more than the average of 1.6% of a nation’s GDP on tertiary educationinstitutions, and only Canada, the United States, South Korea, and Chile spend more than 2%. According to themost recently available data from the OECD, in 2011, Canada spent the highest proportion of GDP on tertiaryeducation institutions compared with all other OECD countries, followed by the United States, South Korea, andChile (Appendix Table 2-34). Between 2000 and 2011, U.S. expenditures on tertiary education as a percentage ofGDP were 60% higher than the OECD average and about 90% higher than the European Union (EU; see Glossaryfor member countries) average. Between 2000 and 2011, expenditures on tertiary education institutions as apercentage of GDP rose in most OECD countries, particularly in the United States, New Zealand, Turkey, the CzechRepublic, Canada, and Estonia, as well as Russia. In the United Kingdom, expenditures on tertiary educationinstitutions as a proportion of GDP rose between 2000 and 2009, but declined between 2009 and 2011.
Higher education financing data are not always fully comparable across different nations. They can vary betweencountries for reasons unrelated to actual expenditures, such as differences in measurement, types and levels ofgovernment funding included, types and levels of education included, and the prevalence of public versus privateinstitutions. According to an international database compiled by the Program for Research on Private HigherEducation at the State University of New York at Albany (2011), the United States and Japan have long-standingprivate higher education sectors, and Western Europe has an almost completely public higher education sector.Eastern and Central Europe and several African countries have recently seen growth in private higher education. Inmost countries in Latin America, more than half of all higher education institutions are private. In Asia, manygovernments have encouraged the expansion of private higher education as one of the strategies to deal with highenrollment growth (see sidebar, ). In 2011, about 80% of the students in SouthTrends in Higher Education in AsiaKorea and Japan and 60%–64% of the students in Singapore, the Philippines, Nepal, Indonesia, and Cambodiawere enrolled in private institutions (UNESCO/UIS 2014).
Trends in Higher Education in Asia
Enrollment in higher education across Asia has grown considerably in the last two decades as a result ofhigher secondary school participation rates and a higher demand for an educated workforce in Asia’sincreasingly knowledge-oriented economies. According to a 2014 report by the United Nations Educational,Scientific and Cultural Organization Institute for Statistics (UNESCO/UIS 2014), to adapt to this enrollmentgrowth, higher education systems had to “expand out” by building more campuses and universities. At the

Chapter 2. Higher Education in Science and Engineering
2 | 81National Science Board | Science & Engineering Indicators 2016
same time, higher education systems had to “expand up” by introducing new graduate programs to prepareand train qualified professors and researchers.
This expansion created a financial challenge for many governments. Their strategies for addressing thischallenge include, for example, shifting some of the cost to students and their families by introducing feesor fee-based courses; encouraging public universities to find private funding; increasing the use of onlineinstruction; and encouraging the expansion of private higher education, including the establishment ofbranch campuses of foreign universities.
In some Asian countries, this expansion also affected the quality of education because there were notenough qualified instructors to satisfy the demand. At the same time, increasing numbers of studentsmeant heavier teaching loads, so student-instructor ratios also increased. For example, between 2000 and2011, the student-instructor ratio increased in Bangladesh, Cambodia, China, Indonesia, Laos, Macau, andVietnam. In the same period, however, the student-instructor ratio declined considerably in Thailand,Myanmar, South Korea, and Malaysia.
Many universities in Asia compete to obtain high placements in international university rankings. Highrankings may influence public resource allocation and bring more government investment to topuniversities. High rankings may also attract more international students and thus increase revenues bothfor the university and the country where these students enroll. Publication rates in top-tier journals are akey component of these rankings, which implies that the competition for high rankings may put pressure onfaculty to publish at top-tier international journals and in turn may affect teaching quality.
At the same time governments in Asia were trying to expand graduate education to meet the demand foruniversity instructors, they also began to promote university-based research. University research istypically done at the graduate level, so expanding graduate education is viewed as a means to advanceinnovation and increase national competitiveness.
Educational Attainment
Higher education in the United States expanded greatly after World War II. As a result, the U.S. population led theworld in educational attainment for several decades. Because of this, the United States offered clear advantages forfirms whose work would benefit from the availability of a highly educated workforce. In the 1990s, however, manycountries in Europe and Asia began to expand their higher education systems. Some of them have now surpassedthe United States in the attainment of bachelor’s degrees or higher in their younger cohorts. Over time, theexpansion of higher education elsewhere has substantially diminished the U.S. educational advantage.
Although the United States continues to be among those countries with the highest percentage of the populationages 25–64 with a bachelor’s degree or higher, several other countries have surpassed the United States in the
percentage of the younger population (ages 25–34) with a bachelor’s degree or higher ( ).Figure 2-28 [i]
[i] These data are based on national labor force surveys and are subject to sampling error; therefore, smalldifferences between countries may not be meaningful. The standard error for the U.S. percentage of25–64-year-olds with a bachelor’s or higher degree is roughly 0.1, and the standard error for the U.S. percentageof 25–34-year-olds with a bachelor’s or higher degree is roughly 0.4.
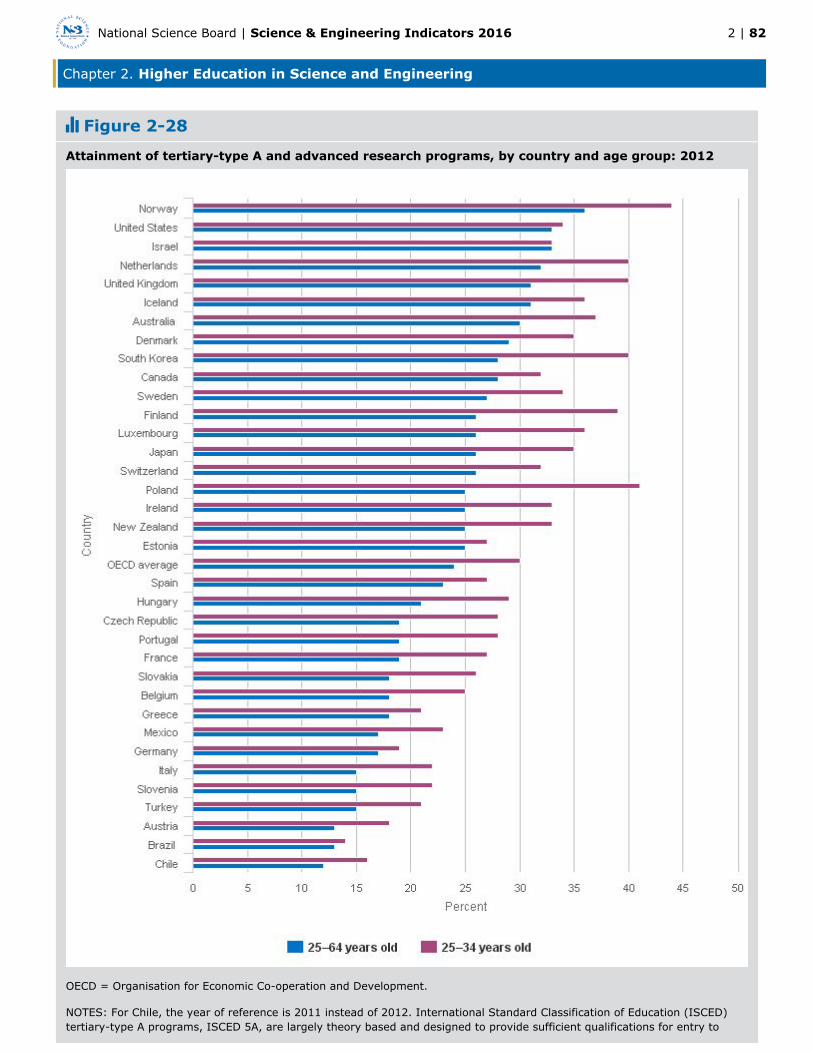
Chapter 2. Higher Education in Science and Engineering
2 | 82National Science Board | Science & Engineering Indicators 2016
Figure 2-28
Attainment of tertiary-type A and advanced research programs, by country and age group: 2012
OECD = Organisation for Economic Co-operation and Development.
NOTES: For Chile, the year of reference is 2011 instead of 2012. International Standard Classification of Education (ISCED)tertiary-type A programs, ISCED 5A, are largely theory based and designed to provide sufficient qualifications for entry to

Chapter 2. Higher Education in Science and Engineering
2 | 83National Science Board | Science & Engineering Indicators 2016
advanced research programs and professions with high-skill requirements such as medicine, dentistry, or architecture andhave a minimum duration of 3 years’ full-time equivalent, although they typically last 4 years or longer. In the United States,they correspond to bachelor’s and master’s degrees. Advanced research programs are tertiary programs leading directly toaward of an advanced research qualification (e.g., doctorate).
SOURCE: OECD, (2014).Education at a Glance 2014: OECD Indicators
Science and Engineering Indicators 2016
First University Degrees in S&E Fields
More than 20 million students worldwide earned first university degrees (see Glossary) in 2012, with over 6 millionof these in S&E fields (Appendix Table 2-35). These worldwide totals include only countries for which relativelyrecent data are available (primarily countries in Asia, Europe, and the Americas) and are therefore underestimates.Asian universities accounted for nearly 4 million of the world’s S&E first university degrees in 2012, close to half ofthem in engineering. Students across Europe (including Eastern Europe and Russia) earned more than 1 million
S&E first university degrees (nearly one-third of them in engineering), and students in North America earned[i]
nearly 800,000 such degrees in 2012 (20% in engineering).
In several countries and economies around the world, the proportion of first university degrees in S&E fields washigher than in the United States. Nearly half or more of all first university degrees in China were in S&E fields,compared with about one-third in the United States. National differences in engineering degrees largely account foroverall differences in the proportion of S&E degrees, given that the disparity was especially large in engineering.However, differences in the taxonomies and quality of engineering programs and level of reporting detail acrosscountries make comparisons problematic. For example, according to Wadhwa and colleagues (2007), in China inthe mid-2000s, the term “engineer” had no standard definition and did not translate well into different dialects, sothe reports sent to the Ministry of Education from different Chinese provinces did not count degrees consistently. Inthe late 1990s, the Chinese government implemented top-down policy changes to increase enrollment inengineering. However, the total number of technical schools and the corresponding numbers of teachers and staffdeclined, which meant that degree awards were achieved by increasing class sizes and student-to-teacher ratios,leading to a decline in academic programs’ quality.
China has traditionally awarded a large proportion of its first university degrees in engineering, although thepercentage declined from 43% in 2000 to 32% in 2012 (Appendix Table 2-36). Other places with a high proportionof engineering degrees are Singapore, Taiwan, Iran, South Korea, Indonesia, Japan, Finland, Mexico, and Colombia(Appendix Table 2-35). In the United States, about 5% of all bachelor’s degrees are in engineering. About 12% ofall bachelor’s degrees awarded in the United States and worldwide are in the natural sciences (physical, biological,computer, and agricultural sciences, as well as mathematics and statistics).
The number of S&E first university degrees awarded in China, Taiwan, Germany, Turkey, and Mexico doubled ormore than doubled between 2000 and 2012. During this period, such degrees awarded in Australia grew by about
two-thirds; those awarded in the United States and Poland increased by nearly 50%. S&E first university degrees[ii]
awarded in France, Japan, and Spain declined by 24%, 10% and 3%, respectively. Growth in natural sciences andengineering degrees in China accounted for most of the country’s increase in S&E first university degrees; about1.3 million, up more than 300% from 2000 to 2012 ( ; Appendix Table 2-36).Figure 2-29

Chapter 2. Higher Education in Science and Engineering
2 | 84National Science Board | Science & Engineering Indicators 2016
[i] For OECD countries, engineering includes “engineering and engineering trades” (International StandardClassification of Education [ISCED] 52), which is more specific than the code available in previous publications:“engineering, manufacturing, and construction” (ISC 5).
[ii] Comparison for Australia covers the 2000–11 period.
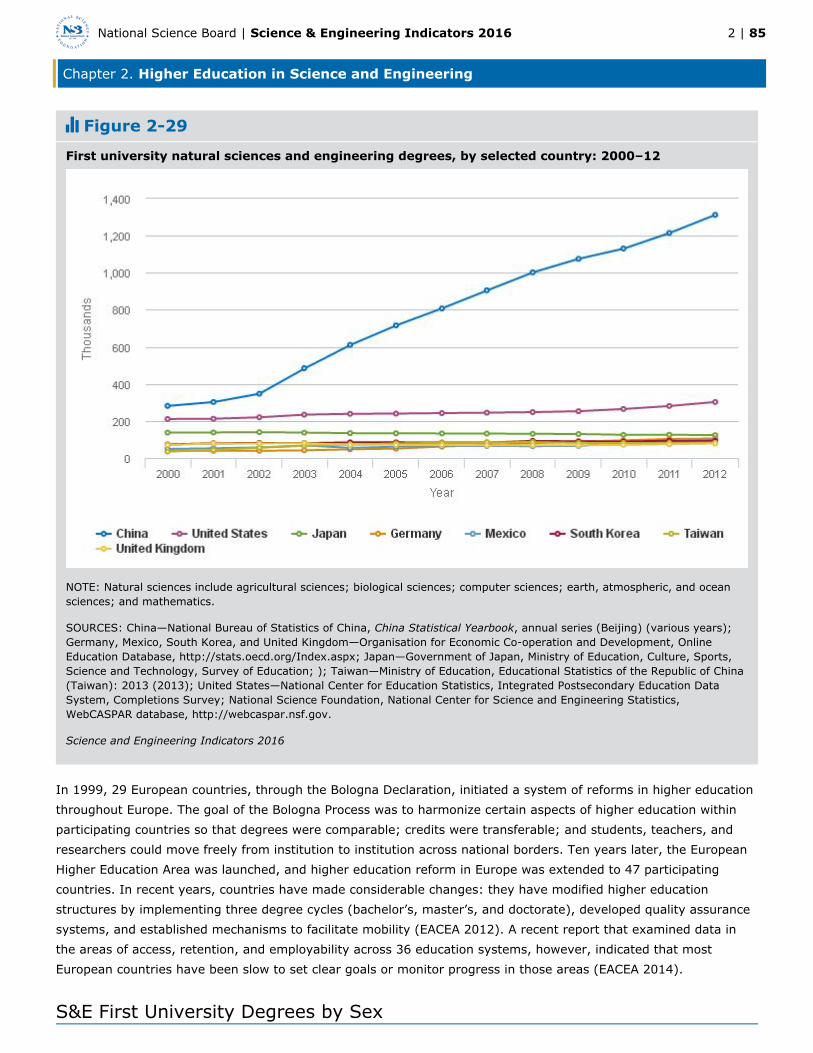
Chapter 2. Higher Education in Science and Engineering
2 | 85National Science Board | Science & Engineering Indicators 2016
Figure 2-29
First university natural sciences and engineering degrees, by selected country: 2000–12
NOTE: Natural sciences include agricultural sciences; biological sciences; computer sciences; earth, atmospheric, and oceansciences; and mathematics.
SOURCES: China—National Bureau of Statistics of China, , annual series (Beijing) (various years);China Statistical YearbookGermany, Mexico, South Korea, and United Kingdom—Organisation for Economic Co-operation and Development, OnlineEducation Database, http://stats.oecd.org/Index.aspx; Japan—Government of Japan, Ministry of Education, Culture, Sports,Science and Technology, Survey of Education; ); Taiwan—Ministry of Education, Educational Statistics of the Republic of China(Taiwan): 2013 (2013); United States—National Center for Education Statistics, Integrated Postsecondary Education DataSystem, Completions Survey; National Science Foundation, National Center for Science and Engineering Statistics,WebCASPAR database, http://webcaspar.nsf.gov.
Science and Engineering Indicators 2016
In 1999, 29 European countries, through the Bologna Declaration, initiated a system of reforms in higher educationthroughout Europe. The goal of the Bologna Process was to harmonize certain aspects of higher education withinparticipating countries so that degrees were comparable; credits were transferable; and students, teachers, andresearchers could move freely from institution to institution across national borders. Ten years later, the EuropeanHigher Education Area was launched, and higher education reform in Europe was extended to 47 participatingcountries. In recent years, countries have made considerable changes: they have modified higher educationstructures by implementing three degree cycles (bachelor’s, master’s, and doctorate), developed quality assurancesystems, and established mechanisms to facilitate mobility (EACEA 2012). A recent report that examined data inthe areas of access, retention, and employability across 36 education systems, however, indicated that mostEuropean countries have been slow to set clear goals or monitor progress in those areas (EACEA 2014).
S&E First University Degrees by Sex
Chapter 2. Higher Education in Science and Engineering
2 | 86National Science Board | Science & Engineering Indicators 2016
Women earned half or more of first university degrees in S&E in many countries around the world in 2012,including the United States and several smaller countries. Most large countries in Europe are not far behind, withmore than 40% of S&E first university degrees earned by women. In the Middle East, women earned nearly half ormore of the S&E first university degrees in most countries in the region, except for Iraq. In several Asian countries,women generally earn about one-third or fewer of the first university degrees awarded in S&E fields. For example,in Taiwan, women earn 26% of the S&E first university degrees; in Japan, 28%; and in South Korea, 30%(Appendix Table 2-37).
In Canada, the United States, and many smaller countries, more than half of the S&E first university degreesearned by women were in the social and behavioral sciences. In contrast, in Singapore and Colombia, about half ofthe S&E first university degrees earned by women were in engineering, much higher proportions than in the UnitedStates or most countries in Europe. Other countries with relatively high proportion of women earning first universitydegrees in engineering include South Korea (31% of their S&E first university degrees), Malaysia (31%), Iran(30%), Taiwan (28%), Finland (28%), and India (27%),
Global Comparison of S&E Doctoral Degrees
Nearly 200,000 S&E doctoral degrees were awarded worldwide in 2012. The United States awarded the largest[i]
number of S&E doctoral degrees of any country (about 35,000), followed by China (about 32,000), India (about14,000), Germany (about 12,000), the United Kingdom (about 11,000), and France (about 8,000) (Appendix Table2-38). About 60,000 S&E doctoral degrees were earned in the EU.
The number of S&E doctoral degrees awarded in China rose steeply between 2000 and 2009 and has leveled offsince then. Although the rise was steeper in China, the trend was similar to the recent trend in doctoral productionin the United States (Appendix Table 2-39 and Appendix Table 2-40). In 2007, China surpassed the United Statesas the world’s largest producer of natural sciences and engineering doctoral degrees ( ). The highFigure 2-30growth of graduate education in China has been the result of large government investments in higher educationover the last 20 years, intended to establish world-class universities in this country. Project 211 and Project 985are examples of programs launched by the Chinese government in the mid-1990s to establish and strengtheninstitutions of higher education and key fields of study as a national priority (Lixu 2004) (see sidebar, Trends in
).Higher Education in Asia
[i] In international degree comparisons, S&E does not include medical or other health fields. This is becauseinternational sources cannot separate the MD degrees from degrees in the health fields, and the MDs areprofessional or practitioner degrees, not research degrees.
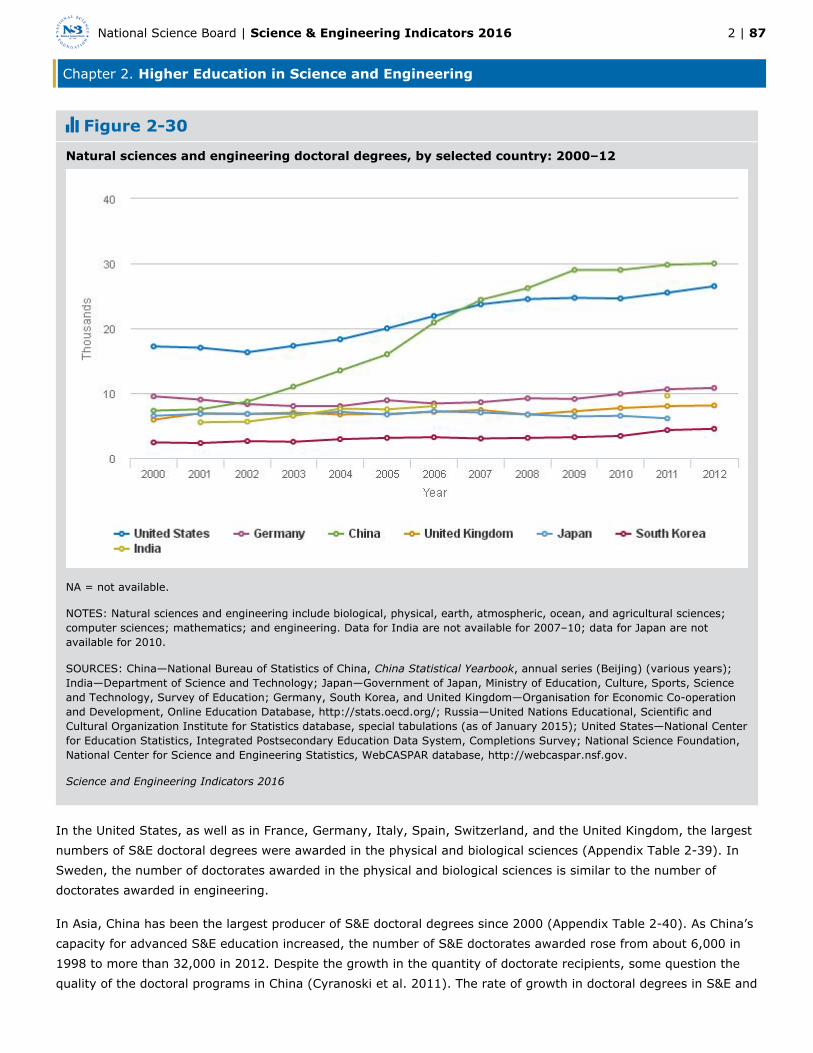
Chapter 2. Higher Education in Science and Engineering
2 | 87National Science Board | Science & Engineering Indicators 2016
Figure 2-30
Natural sciences and engineering doctoral degrees, by selected country: 2000–12
NA = not available.
NOTES: Natural sciences and engineering include biological, physical, earth, atmospheric, ocean, and agricultural sciences;computer sciences; mathematics; and engineering. Data for India are not available for 2007–10; data for Japan are notavailable for 2010.
SOURCES: China—National Bureau of Statistics of China, , annual series (Beijing) (various years);China Statistical YearbookIndia—Department of Science and Technology; Japan—Government of Japan, Ministry of Education, Culture, Sports, Scienceand Technology, Survey of Education; Germany, South Korea, and United Kingdom—Organisation for Economic Co-operationand Development, Online Education Database, http://stats.oecd.org/; Russia—United Nations Educational, Scientific andCultural Organization Institute for Statistics database, special tabulations (as of January 2015); United States—National Centerfor Education Statistics, Integrated Postsecondary Education Data System, Completions Survey; National Science Foundation,National Center for Science and Engineering Statistics, WebCASPAR database, http://webcaspar.nsf.gov.
Science and Engineering Indicators 2016
In the United States, as well as in France, Germany, Italy, Spain, Switzerland, and the United Kingdom, the largestnumbers of S&E doctoral degrees were awarded in the physical and biological sciences (Appendix Table 2-39). InSweden, the number of doctorates awarded in the physical and biological sciences is similar to the number ofdoctorates awarded in engineering.
In Asia, China has been the largest producer of S&E doctoral degrees since 2000 (Appendix Table 2-40). As China’scapacity for advanced S&E education increased, the number of S&E doctorates awarded rose from about 6,000 in1998 to more than 32,000 in 2012. Despite the growth in the quantity of doctorate recipients, some question thequality of the doctoral programs in China (Cyranoski et al. 2011). The rate of growth in doctoral degrees in S&E and
Chapter 2. Higher Education in Science and Engineering
2 | 88National Science Board | Science & Engineering Indicators 2016
in all fields has slowed in 2010 (Appendix Table 2-40), after an announcement by the Chinese Ministry of Educationindicating that China would begin to limit admissions to doctoral programs and focus more on quality of graduates(Mooney 2007).
Between 1998 and 2012 (2011 in the case of India), the number of S&E doctorates awarded in India, South Korea,and Taiwan more than doubled; in Japan, the numbers rose consistently through 2006 but declined through 2011(the most recent data available). In China, Japan, South Korea, and Taiwan, more than half of S&E doctorates wereawarded in engineering. In India, 40% of the S&E doctorates were awarded in the physical and biological sciencesand 31% in the social and behavioral sciences (Appendix Table 2-40).
Women earned 41% of S&E doctoral degrees awarded in the United States in 2012, about the same percentage
earned by women in Canada and the EU (Appendix Table 2-41). Women earned more than half of S&E doctoral[ii]
degrees in Norway, Portugal, Latvia, Lithuania, and Ukraine but less than 20% of those in South Korea and Taiwan.
[ii] In the United States, women earned nearly half of the S&E doctoral degrees awarded to U.S. citizens andpermanent residents in 2012 (Appendix Table 2-30).
Global Student Mobility
Governments around the world have increasingly come to regard movement toward a knowledge-based economyas key to economic progress. Realizing that this requires a well-trained workforce, they have invested in upgradingand expanding their higher education systems and broadening participation in them. In most instances,government spending underwrites these initiatives. Recent investments by several governments to send largenumbers of their students to study abroad are a strategy for workforce and economic development. Examplesinclude the Brazil Scientific Mobility Program (also known as Science without Borders), launched officially in July
2011, which provides scholarships to Brazilian students to study in STEM fields in universities in the United States.
Similarly, the government of Saudi Arabia has invested considerably in a scholarship program launched in 2005[i]
that has supported study abroad programs for more than 100,000 Saudi students throughout the world, at anestimated cost of at least $5 billion since the program’s inception (Knickmeyer 2012). In 2013, the Mexicangovernment announced its Proyecta 100,000 program, which plans to send 100,000 students to study in the UnitedStates by 2018 (Lloyd 2014). The Chinese government has established the China Scholarship Council, a nonprofitaffiliated with the Ministry of Education whose goal is to provide financial assistance to Chinese citizens to studyabroad, as well as to foreign citizens to study in China (China Scholarship Council 2015).
Students have become more internationally mobile in the past two decades, and countries are increasinglycompeting for them. According to data from the OECD, the number of internationally mobile students who pursued
a higher education degree more than doubled between 2000 and 2012, to 4.5 million (OECD 2014). In general,[ii]
students migrate from developing countries to the more developed countries and from Europe and Asia to theUnited States. However, a few countries have emerged as regional hubs for certain geographic regions—forexample, Australia, China, and South Korea for East Asia and South Africa for sub-Saharan Africa (UNESCO 2009;Bhandari, Belyavina, and Gutierrez 2011). In addition, several countries have set targets for increasing thenumbers of international students they host; among these are Jordan (which plans to host 100,000 students by2020), Singapore (150,000 by 2015), Japan (300,000 by 2025), and China (500,000 by 2020) (Bhandari andBelyavina 2012).
Chapter 2. Higher Education in Science and Engineering
2 | 89National Science Board | Science & Engineering Indicators 2016
Some students migrate temporarily for education, whereas others remain abroad permanently after completingtheir studies. Some factors influencing the decision to seek a degree abroad include the policies of the countries oforigin regarding sponsoring their citizens’ studies abroad, the tuition fee policies of the countries of destination, thefinancial support the countries of destination offer to international students, the cost of living and exchange ratesthat affect the cost of international education, and the perceived value of obtaining a foreign credential. Thelong-term return on investment from international education also depends on how international degrees arerecognized by the labor market in the country of origin (OECD 2010). For host countries, enrolling internationalstudents can help raise revenues from higher education and can be part of a larger strategy to attract highly skilledworkers, particularly as demographic changes in many developed countries cause their own populations ofcollege-age students to decrease (OECD 2012) (Appendix Table 2-42).
In recent years, many countries have expanded their provision of transnational education. One growing trend is theestablishment of branch campuses: offshore programs established by higher education institutions in foreigncountries. For local students, branch campuses provide the opportunity to earn degrees from foreign universitieswithout leaving their home countries. For the institution venturing into a new country, meeting enrollment andfinancial goals without diluting quality standards is often a challenge. Branch campuses that bring in faculty fromother countries can also fulfill some of the demand for highly qualified instructors that cannot be met by localhigher education institutions (UNESCO/UIS 2014).
According to the State University of New York at Albany’s Cross-Border Education Research Team (C-BERT) (Kinserand Lane 2015), a clearinghouse of information and research on transnational education, as of May 2015, therewere 235 international branch campuses in operation and 23 with plans to open. C-BERT defines a branch campusas “an entity that is owned, at least in part, by a foreign education provider; is operated in the name of the foreignprovider; engages in at least some face-to-face teaching; and provides access to an entire academic program thatleads to a credential awarded by the foreign education provider.” There were a total of 32 exporting countries (i.e.,home countries of the institutions establishing branch campuses) and 73 importing countries (i.e., host countriesfor branch campuses). The largest exporters of branch campuses, in order of the number of branch campusesestablished, were the United States (83 branch campuses), the United Kingdom (34), Russia (20), Australia (17),and France (16). The largest importers of branch campuses, in order of the number of branch campuses theyhosted, were the United Arab Emirates (33 branch campuses), China (28), Singapore (14), Qatar (11), andMalaysia (9). In some cases, branch campuses are a part of what countries designate as an international “educationhub.” Although there is no agreed-upon definition of “education hub,” the term conveys the existence ofcross-national education and research activities within a designated region. Examples of education hubs includeQatar, the United Arab Emirates, Abu Dhabi, Hong Kong, Malaysia, Singapore, and Botswana (Knight 2014; Kinserand Lane 2015).
More internationally mobile students (both undergraduate and graduate) go to the United States than to any othercountry ( ). Other top destinations for international students include the United Kingdom (10%)Figure 2-31Australia (6%), France (6%), and Germany (5%). Together with the United States, these countries receive abouthalf of all internationally mobile students worldwide. Although the United States remains the destination for thelargest number of internationally mobile students worldwide, its share in all fields has declined from 25% in 2000 to19% in 2013 (OECD 2014).
[i] This initiative is part of a broader effort from the Brazilian government to grant 100,000 scholarships to the beststudents to study abroad at the top universities around the world (IIE 2015a).

Chapter 2. Higher Education in Science and Engineering
2 | 90National Science Board | Science & Engineering Indicators 2016
[ii] Internationally mobile students are those who have crossed a national or territorial border for the purposes ofeducation and are now enrolled outside their country of origin. This concept is different from “foreign students,”which are those who are not citizens of the country where they are enrolled, but may, in some cases, be long-termresidents or have been born in the country (OECD 2012).

Chapter 2. Higher Education in Science and Engineering
2 | 91National Science Board | Science & Engineering Indicators 2016
Figure 2-31
Internationally mobile students enrolled in tertiary education, by selected country: 2013
NOTE: Data are based on the number of students who have crossed a national border and moved to another country with theobjective of studying (i.e., mobile students).

Chapter 2. Higher Education in Science and Engineering
2 | 92National Science Board | Science & Engineering Indicators 2016
SOURCE: United Nations Educational, Scientific and Cultural Organization Institute for Statistics database, special tabulations(2015).
Science and Engineering Indicators 2016
In the United States, international students are a small proportion (about 4%) of students enrolled in highereducation (including both undergraduate and graduate levels); this proportion is higher at the graduate level. Inother countries, the proportion of international students is much higher. Australia, with a much smaller highereducation system than the United States, has a higher percentage of international students in tertiary-type Aprograms (19%) but a lower share (6%) of international students worldwide. Other countries with relatively highpercentages of international students in tertiary-type A programs include the United Kingdom (18%), Austria
(17%), Switzerland (17%), and New Zealand (13%). In Switzerland, more than 50% of doctoral students are[iii]
international students, and in the United Kingdom, more than 41% of them are international students. Severalother countries, including Belgium, New Zealand, Australia, the United States, Sweden, Canada, and Ireland haverelatively high percentages (more than 20%) of doctoral students who are internationally mobile (OECD 2014).
Since the late 1990s, the United Kingdom has been actively working to improve its position in internationaleducation, by recruiting international students to study in the country and by expanding its provision oftransnational education (British Council 2015; UKCISA 2013). Between 1995 and 2014, international studentenrollment in S&E fields in the United Kingdom increased by nearly 51,000 international students at theundergraduate level and by close to 55,000 at the graduate level (Appendix Table 2-43), but the proportion ofinternational students is much higher at the graduate than at the undergraduate level. For example, in 2013–14,international students were 14% of all undergraduates in the United Kingdom (an increase from 9% in 1994–95),compared with 48% at the graduate level (an increase from 29% in 1994–95). At the graduate level, internationalstudents accounted for 60% of graduate students in engineering and 56% in mathematics and computer sciences.Students from China accounted for most of the increase in international student enrollment, both at the graduateand the undergraduate levels. However, the number of undergraduate students from India, Hong Kong, Cyprus,and Nigeria, as well as the number of graduate students from Nigeria, India, Italy, Saudi Arabia, the United States,and Germany also increased considerably (Appendix Table 2-43).
In the context of slowing student enrollment in Japan, in 2008, the government announced plans to tripleinternational enrollment within 12 years (McNeil 2008, 2010). Although Japan succeeded in increasing itsenrollment of international students between 2004 and 2014 (in S&E and in all fields), growth has slowedconsiderably in the last 4 years (Appendix Table 2-44; appendix table [NSB 2012] 2-41; appendix table [NSB 2014]2-45), perhaps caused in part by the March 2011 earthquake and tsunami (McNeil 2012). In 2014, nearly 70,000international students were enrolled in S&E programs in Japanese universities, similar to the preceding 4 years andup from 57,000 in 2004. The number of international students in Japan was larger at the undergraduate than at thegraduate level; however, international students accounted for a smaller proportion of students at theundergraduate than at the graduate level in 2014 (3% of undergraduate and 17% of graduate S&E students). Thevast majority of the international students were from Asian countries. In 2014, Chinese students accounted for65% of the international S&E undergraduate students and 56% of the international S&E graduate students inJapan. South Koreans were 18% of the international undergraduates and 7% of the international graduatestudents. Vietnam, Malaysia, Indonesia, Thailand, Taiwan, and Nepal were among the top 10 locations of origin forboth undergraduates and graduate students (Appendix Table 2-44).
International students in Canada constitute a larger share of enrollment at the graduate than at the undergraduatelevel (Appendix Table 2-45). The proportion of international enrollment in Canadian universities has been growing,from 6% in 2002 to 8% in 2012 at the undergraduate level and from 20% to 24% at the graduate level. In 2012,
Chapter 2. Higher Education in Science and Engineering
2 | 93National Science Board | Science & Engineering Indicators 2016
at the undergraduate and graduate levels, the highest percentages of international S&E students were inmathematics and computer sciences and in engineering. At the undergraduate level, China was the top country oforigin of international S&E students in Canada, accounting for 22% of international undergraduate students,followed by France and the United States (11% and 9%, respectively). The proportion of internationalundergraduate S&E students in Canada from China and France increased considerably between 2002 and 2012,while the proportion of students from the United States declined. At the graduate level, the top country of origin ofinternational S&E students was also China (15%), followed by Iran and France (13% and 11%, respectively). Theproportion of international graduate students from China declined, and the proportion of those from France and theUnited States remained stable. The proportion of Iranian S&E graduate students studying in Canada grew from 3%in 2002 to 13% in 2012; growth was higher in the natural sciences and in engineering.
Although the United States hosts the largest number of international students worldwide, U.S. students constitute arelatively small share of international students worldwide. About 70,000 U.S. students (in all fields) were reportedas international students by OECD and OECD partner countries in 2012, far fewer than the number of internationalstudents from China, India, South Korea, Germany, Turkey, or France. The main destinations of U.S. students werethe United Kingdom (16,600), Canada (9,600), Germany (4,300), France (3,900), New Zealand (3,200), andAustralia (2,900)—mostly English-speaking OECD countries (OECD 2014). Given the relatively low number of U.S.students who study abroad and the importance of international experience in a globalized world, in 2014, IIEestablished Generation Study Abroad. This 5-year initiative has the goal to increase the number of U.S. studentsstudying abroad, in credit and degree programs, to 600,000 by 2019 (IIE 2015b).
Nearly 290,000 U.S. university students enrolled in study abroad programs in the 2012–13 academic year (creditmobility—see Glossary), a 2% increase from the preceding year but an 88% rise from 2000–01 (IIE 2014). Nearly40% were enrolled in programs during the summer term; about one-third enrolled in programs lasting onesemester, 15% in short-term programs lasting up to 8 weeks, 3% for the academic or the calendar year, and therest for one or two quarters or a month. Nearly three-quarters were undergraduates, primarily juniors and seniors;about 8% were master’s students, and 1% were doctoral students. Nearly two-thirds of the U.S. students studyingabroad were women, and more than three-quarters were white. Nearly 40% were studying in S&E fields: 22% insocial sciences, 9% in physical or life sciences, 4% in engineering, 2% in mathematics or computer sciences, and1% in agricultural sciences; these proportions have been stable since 2000–01. The leading destinations for studyabroad programs in the 2012–13 academic year were the United Kingdom, Italy, and Spain, followed by France andChina.
According to a recent study conducted by IIE and Project Atlas (Belyavina, Li, and Bhandari 2013), in 2011–12,nearly 47,000 U.S. students were enrolled in academic degree programs in the 14 countries represented (degree
mobility—see Glossary). The most frequent host countries for U.S. students pursuing degrees abroad were the[iv]
United Kingdom (17,000), Canada (9,000), France (4,000), and Germany (4,000). Most students were enrolled inundergraduate or master’s degree programs (42% each), followed by doctoral programs (16%). Almost two-thirdsof these students studied in anglophone countries; the top destination was the United Kingdom. Humanities, socialsciences, business and management, and physical and life sciences were the most popular broad fields of study forstudents pursuing a degree abroad.
[iii] Luxembourg has a very high proportion of international students enrolled in tertiary-type A programs (34%)mostly because of the high level of integration with neighboring countries (OECD 2014).

Chapter 2. Higher Education in Science and Engineering
2 | 94National Science Board | Science & Engineering Indicators 2016
[iv] The 14 countries represented in the study were Australia, Canada, China, Denmark, France, Germany, Ireland,Japan, Malaysia, New Zealand, the Netherlands, Spain, Sweden, and the United Kingdom.

Chapter 2. Higher Education in Science and Engineering
2 | 95National Science Board | Science & Engineering Indicators 2016
Conclusion
S&E higher education in the United States is attracting growing numbers of students. The number of associate’s,bachelor’s, master’s, and doctoral degrees awarded in all fields and in S&E fields continues to rise, having reachednew peaks in 2013. Most of the growth in undergraduate S&E education occurred in science fields, particularly inthe social and behavioral sciences and in the biological sciences. In engineering, bachelor’s degrees have increasedconsistently for the last 10 years and have surpassed the record high numbers attained in the mid-1980s; graduateenrollment in engineering has reached record numbers. Computer sciences degree awards have increasedcontinuously since 2009, after a steep decline in the mid- to late 2000s. The number of master’s and doctoraldegrees awarded grew in all major S&E fields. In the last decade, growth in doctoral degrees awarded occurredmostly in the natural sciences and engineering fields.
Community colleges play a key role in increasing access to higher education for all citizens. Many U.S. citizen andpermanent resident degree holders report earning college credit from a community college. Nearly half of Hispanicundergraduates are enrolled in them. The expected demographic growth in number of Hispanic students between20 and 24 years of age will affect community colleges and HHEs.
Over the last two decades, higher education spending and revenue patterns and trends have undergone substantialchanges, which intensified during the recent economic downturn. Public institutions faced competing demands in atight budget environment, caught between declining state appropriations and the need to maintain educationalquality and access. Despite the decline in enrollment in 2011–12, net tuition per FTE student continued to increasewith the decrease in revenues from state and local appropriations in public institutions, so challenges remain.
International student enrollment in S&E has recovered since the post-9/11 decline. In recent years, internationalstudent enrollment has increased considerably at the undergraduate and graduate levels, in both S&E and non-S&Efields.
Globalization of higher education continues to expand. Universities in several other countries have expanded theirenrollment of international S&E students. The United States continues to attract the largest number and fraction ofinternationally mobile students worldwide, although its share of international students in all fields has decreased inrecent years.
Higher education is undergoing rapid transformation. The growth of distance and online education through MOOCsand similar innovations expands access to knowledge and has the potential to decrease the cost of some degrees,at the same time as pressures have been increasing to reduce rising costs. However, it is too early to assesswhether MOOCs will be widely adopted by different types of institutions, whether increased access will beaccompanied by increased learning, and what consequences distance and online innovations will bring to the highereducation landscape.

Chapter 2. Higher Education in Science and Engineering
2 | 96National Science Board | Science & Engineering Indicators 2016
Glossary
Baccalaureate-origin institution: The college or university from which an S&E doctorate recipient earned abachelor’s degree.
Credit mobility: Temporary tertiary education within the framework of enrollment in a tertiary education programat a home institution (usually) for the purpose of gaining academic credit (i.e., credit that will be recognized in thathome institution). It is mostly used for study, but it can also take other forms, such as traineeships.
Degree mobility: The physical crossing of a national border to enroll in a degree program at the tertiary level inthe country of destination. The degree program would require the students’ presence for the majority of coursestaught.
European Union (EU): As of September 2015, the EU comprised 28 member nations: Austria, Belgium, Bulgaria,Croatia, Cyprus, Czech Republic, Denmark, Estonia, Finland, France, Germany, Greece, Hungary, Ireland, Italy,Latvia, Lithuania, Luxembourg, Malta, the Netherlands, Poland, Portugal, Romania, Slovakia, Slovenia, Spain,Sweden, and the United Kingdom. Unless otherwise noted, Organisation for Economic Co-operation andDevelopment data on the EU include all of these 28 members.
First university degree: A terminal undergraduate degree program; these degrees are classified as “level 5A firstuniversity degree” in the International Standard Classification of Education, which is developed by UNESCO,although individual countries use different names for the first terminal degree (e.g., in Italy, corso di Laurea diplomin Germany, in France, and in the United States and in Asian countries).licence bachelor’s degree
Internationally mobile students: Students who have crossed a national or territorial border for purposes ofeducation and are now enrolled outside their countries of origin. This term refers to degree mobility in datacollected by UNESCO/UIS, OECD, and Eurostat and excludes students who travel for credit mobility.
Natural sciences: Include agricultural; biological; computer; earth, atmospheric, and ocean; and physical sciencesand mathematics.
Net price: The published price of an undergraduate college education minus the average grant aid and tax benefitsthat students receive.
Net tuition revenue: Total revenue from tuition and fees (including grant and loan aid used by students to paytuition); excludes institutional student aid that is applied to tuition and fees.
Tertiary-type A programs: Higher education programs that are largely theory based and designed to providesufficient qualifications for entry to advanced research programs and to professions with high skill requirements,such as medicine, dentistry, or architecture. These programs have a minimum duration of 3 years, although theytypically last 4 or more years and correspond to bachelor’s or master’s degrees in the United States.
Tertiary-type B programs: Higher education programs that focus on practical, technical, or occupational skills fordirect entry into the labor market and have a minimum duration of 2 years. These programs correspond toassociate’s degree programs in the United States.
Underrepresented minorities: Blacks, Hispanics, and American Indians and Alaska Natives are considered to beunderrepresented minorities in S&E.

Chapter 2. Higher Education in Science and Engineering
2 | 97National Science Board | Science & Engineering Indicators 2016
References
Allen IE, Seaman J. 2014. Grade change: Tracking online education in the United States. http://www.onlinelearningsurvey.com/reports/gradechange.pdf. Accessed 17 June 2015.
Belyavina R, Li J, Bhandari R. 2013. New frontiers: U.S. students pursuing degrees abroad: A 2-year analysis of keydestinations and fields of study. http://www.iie.org/Research-and-Publications/Publications-and-Reports/IIE-Bookstore/New-Frontiers. Accessed 16 June 2015.
Bhandari R, Belyavina R. 2012. Global student mobility: Trends and new directions. International Higher Education66(Winter):14–15.
Bhandari R, Belyavina R, Gutierrez R, editors. 2011. Student Mobility and the Internationalization of Higher. 1st ed. New York, NY: Institute of InternationalEducation: National Policies and Strategies from Six World Regions
Education. http://www.iie.org/Research-and-Publications/Publications-and-Reports/IIE-Bookstore/Project-Atlas-2011. Accessed 17 June 2015.
British Council. 2015. The Prime Minister’s initiative for international education. http://webarchive.nationalarchives.gov.uk/+/http:/www.dius.gov.uk/dius_international/education/prime_ministers_initiative. Accessed 10 March 2015.
Chen X, Soldner M. 2013. STEM Attrition: College Students’ Paths into and out of STEM Fields. Statistical Analysis. NCES 2014-001. U.S. Department of Education. Washington, DC: National Center for Education StatisticsReport
(NCES). http://nces.ed.gov/pubs2014/2014001rev.pdf. Accessed 16 June 2015.
China Scholarship Council. 2015. About us: China Scholarship Council. http://en.csc.edu.cn/About/c309df7fb3fa40b3a179a7ad93f11988.shtml. Accessed 15 May 2015.
Cohoon JM. 2006. Just get over it or just get on with it: Retaining women in undergraduate computing. CohoonInJM, Aspray W, editors, , pp. 205–37.Women in Information Technology: Research on UnderrepresentationCambridge, MA: MIT Press.
Cohoon JM, Aspray W, editors. 2006. .Women in Information Technology: Research on UnderrepresentationCambridge, MA: MIT Press.
College Board. 2014a. Trends in college pricing: 2014. http://trends.collegeboard.org/college-pricing. Accessed 20February 2015.
College Board. 2014b. Trends in student aid: 2014. http://trends.collegeboard.org/student-aid. Accessed 20February 2015.
Cyranoski D, Gilbert N, Ledford H, Nayar A, Yahia M. 2011. The PhD factory. 472:276–9.Nature
DuBow W, Litzler E, Biggers M, Erlinger M. 2012. Implementing evidence-based practices makes a difference infemale undergraduate enrollments. In Proceedings of the 43rd ACM Technical Symposium on Computer Science
479–80.Education
Eagan K, Stolzenberg EB, Ramirez JJ, Aragon MC, Suchard MR, Hurtado S. 2014. The American Freshman: National. Los Angeles, CA: Higher Education Research Institute, UCLA.Norms Fall 2014
Chapter 2. Higher Education in Science and Engineering
2 | 98National Science Board | Science & Engineering Indicators 2016
Education, Audiovisual and Culture Executive Agency (EACEA), Eurydice, Eurostat, Eurostudent. 2012. TheEuropean higher education area in 2012: Bologna Process implementation report. Brussels, Belgium: EACEA P9Eurydice. http://www.ehea.info/Uploads/(1)/Bologna%20Process%20Implementation%20Report.pdf. Accessed 16June 2015.
Education, Audiovisual and Culture Executive Agency (EACEA), Eurydice. 2014. Modernisation of higher education inEurope: Access, retention and employability 2014. Eurydice report. Luxembourg: Publications Office of theEuropean Union. http://eacea.ec.europa.eu/education/eurydice/documents/thematic_reports/165EN.pdf. Accessed22 June 2015.
Engineering Workforce Commission (EWC). 2014. . Washington,Engineering & Technology Enrollments, Fall 2013DC: American Association of Engineering Societies.
Ewert S, Kominski R. 2014. Measuring alternative educational credentials: 2012. U.S. Department of Commerce,Economics and Statistics Administration, U.S. Census Bureau. http://www.census.gov/prod/2014pubs/p70-138.pdf.Accessed 17 June 2015.
Ginder S. 2014. Web tables: Enrollment in distance education courses, by state: Fall 2012. U.S. Department ofEducation. NCES 2014-023. Washington, DC: National Center for Education Statistics (NCES).
Ginder SA, Kelly-Reid JE, Mann FB. 2014. Enrollment in Postsecondary Institutions, Fall 2013; Financial Statistics, First Look (Provisional Data). NCESFiscal Year 2013; and Employees in Postsecondary Institutions, Fall 2013.
2015-012. U.S. Department of Education. Washington, DC: National Center for Education Statistics (NCES).
Ho AD, Reich J, Nesterko SO, Seaton DT, Mullaney T, Waldo J, Chuang I. 2014. HarvardX and MITx: The first yearof open online courses, fall 2012-summer 2013. http://papers.ssrn.com/sol3/papers.cfm?abstract_id=2381263.Accessed 24 February 2015.
Hoxby C, Avery C. 2013. The missing “one-offs”: The hidden supply of high-achieving, low-income students. Spring 2013. http://www.brookings.edu/~/media/projects/bpeaBrookings Papers on Economic Activity
/spring-2013/2013a_hoxby.pdf. Accessed 9 March 2015.
Hussar WJ, Bailey TM. 2014. . NCES 2014-051. U.S. Department ofProjections of Education Statistics to 2022Education. Washington, DC: National Center for Education Statistics (NCES).
Ifill N, Shaw S. 2013. Web tables: Undergraduate financial aid estimates by type of institution in 2011-12. NCES2014-169. U.S. Department of Education. Washington DC: National Center for Education Statistics (NCES). http://nces.ed.gov/pubsearch/pubsinfo.asp?pubid=2014169. Accessed 23 January 2015.
Institute for College Access & Success, College InSight. 2014. http://college-insight.org/#explore/go&h=7fa4d1b802454bcc5bc5e80c433621eb. Accessed 22 June 2015.
Institute of International Education (IIE). 2014. Open doors 2014: A report on international education exchange.http://www.iie.org/opendoors. Accessed 13 October 2013.
Institute of International Education (IIE). 2015a. Ciência: Brazil Scientific Mobility Program. http://www.iie.org/Programs/Brazil-Scientific-Mobility. Accessed 18 May 2015.
Institute of International Education (IIE). 2015b. Generation Study Abroad. http://www.iie.org/Programs/Generation-Study-Abroad. Accessed 2 March 2015.
Chapter 2. Higher Education in Science and Engineering
2 | 99National Science Board | Science & Engineering Indicators 2016
Kena G, Aud A, Johnson F, Wang X, Zhang J, Rathbun A, Flicker-Wilkinson S, Kristapovich P. 2014. The Condition of. NCES 2014-083. U.S. Department of Education. Washington, DC: National Center for EducationEducation 2014
Statistics (NCES).
Kinser K, Lane JE. Branch campus listing. Albany, NY: Cross-Border Education Research Team (C-BERT).2015.http://www.globalhighered.org/branchcampuses.php. Accessed 8 June 2015.
Knapp LG, Kelly-Reid JE, Ginder SA. 2009. Enrollment in Postsecondary Institutions, Fall 2007; Graduation Rates,. NCES 2009-155. U.S. Department of Education.2001 & 2004 Cohorts; and Financial Statistics, Fiscal Year 2007
Washington, DC: National Center for Education Statistics (NCES).
Knapp LG, Kelly-Reid JE, Ginder SA. 2011. Enrollment in Postsecondary Institutions, Fall 2009; Graduation Rates, NCES 2011-230. U.S. Department of Education.2003 & 2006 Cohorts; and Financial Statistics, Fiscal Year 2009.
Washington, DC: National Center for Education Statistics (NCES).
Knickmeyer E. 2012. Saudi students flood in as U.S. reopens door. November 8. http:/Wall Street Journal/www.wsj.com/articles/SB10001424052702304830704577492450467667154. Accessed 8 March 2015.
Knight J, editor. 2014. . Dordrecht,International Education Hubs: Student, Talent, Knowledge-Innovation ModelsHeidelberg, New York, London: Springer.
Kolowich S. 2014. Coursera expands its MOOC certificate program. October 15. http:/Chronicle of Higher Education/chronicle.com/blogs/wiredcampus/coursera-expands-its-mooc-certificate-program/54915. Accessed 4 March 2015.
Lixu L. 2004. China’s higher education reform 1998–2003: A summary. 5(1):14–22.Asia Pacific Education Reviewhttp://files.eric.ed.gov/fulltext/EJ720523.pdf. Accessed 20 May 2015.
Lloyd M. 2014. Mexico gets serious about R&D. June 13.Chronicle of Higher Education
Margolis J, Fisher A. 2002. . Cambridge, MA; London, England: MITUnlocking the Clubhouse: Women in ComputingPress.
McNeil D. 2008. Japan announces plan to enroll more foreign students. July 29.Chronicle of Higher Education
McNeil D. 2010. Japan’s globalization project stalls as some criticize focus on elite universities. Chronicle of Higher September 8.Education
McNeil D. 2012. Foreign-student numbers start to recover in Japan, one year after the disaster. Chronicle of Higher April 3.Education
Miller CC. 2014. Some universities crack code in drawing women to computer science. July 17.New York Times
Mooney P. 2007. China limits growth of universities February 9.. Chronicle of Higher Education
National Center for Education Statistics (NCES). 2015 . U.S. Department of Education.. Digest of Education StatisticsWashington, DC: Author. https://nces.ed.gov/programs/digest/current_tables.asp. Accessed 19 June 2015.
National Science Board (NSB). 2006. Two volumes (vol. 1, NSB 06-01;Science and Engineering Indicators 2006.vol. 2, NSB 06-01A). Arlington, VA: National Science Foundation. Available at http://www.nsf.gov/statistics/seind06/.

Chapter 2. Higher Education in Science and Engineering
2 | 100National Science Board | Science & Engineering Indicators 2016
National Science Board (NSB). 2008. Two volumes (vol. 1, NSB 08-01;Science and Engineering Indicators 2008.vol. 2, NSB 08-01A). Arlington, VA: National Science Foundation. Available at http://www.nsf.gov/statistics/seind08/.
National Science Board (NSB). 2010. NSB 10-01. Arlington, VA: NationalScience and Engineering Indicators 2010.Science Foundation. Available at http://www.nsf.gov/statistics/seind10/.
National Science Board (NSB). 2012. NSB 12-01. Arlington, VA: NationalScience and Engineering Indicators 2012.Science Foundation. Available at http://www.nsf.gov/statistics/seind12/.
National Science Board (NSB). 2014. NSB 14-01. Arlington, VA: NationalScience and Engineering Indicators 2014.Science Foundation. Available at http://www.nsf.gov/statistics/seind14/.
National Science Foundation, Division of Science Resources Studies (NSF/SRS). 2000. Psychology Doctorate Issue Brief NSF 00-321. Arlington, VA. Available at http:/Recipients: How Much Financial Debt at Graduation?
/www.nsf.gov/statistics/issuebrf/sib00321.htm. Accessed 17 February 2015.
National Science Foundation, Division of Science Resources Statistics (NSF/SRS). 2007. Graduate Students and Detailed Statistical Tables NSF 10-307. Arlington, VA.Postdoctorates in Science and Engineering: Fall 2007.
Available at http://www.nsf.gov/statistics/nsf10307/pdf/nsf10307.pdf. Accessed 22 June 2015.
National Science Foundation, National Center for Science and Engineering Statistics (NSF/NCSES). 2008. InfoBrief NSF 08-311. Arlington, VA. Available at http:/Baccalaureate Origins of S&E Doctorate Recipients.
/www.nsf.gov/statistics/infbrief/nsf08311/. Accessed 17 January 2015.
National Science Foundation, National Center for Science and Engineering Statistics (NSF/NCSES). 2013. InfoBrief NSF 13-323. Arlington, VA. Available atBaccalaureate Origins of U.S.-Trained S&E Doctorate Recipients.
http://www.nsf.gov/statistics/infbrief/nsf13323/. Accessed 20 January 2015.
National Science Foundation, National Center for Science and Engineering Statistics (NSF/NCSES). 2014. Foreign.Graduate Enrollment in Science and Engineering Continues to Rise While Overall Graduate Enrollment Remains Flat
InfoBrief NSF 14-313. Arlington, VA. Available at http://nsf.gov/statistics/infbrief/nsf14313/. Accessed 16 June2015.
National Science Foundation, National Center for Science and Engineering Statistics (NSF/NCSES). 2015a. Special Report NSF 15-304. http://nsf.gov/statistics/sed/2013Doctorate Recipients from U.S. Universities: 2015.
/start.cfm.
National Science Foundation, National Center for Science and Engineering Statistics (NSF/NCSES). 2015b. Full-TimeGraduate Enrollment in Science and Engineering Rose in 2013, Fueled by a Large Increase in Foreign Graduate
. NSF 15-318. Arlington, VA. Available at http://nsf.gov/statistics/2015/nsf15318/. Accessed 14 MayEnrollment2015.
National Science Foundation, National Center for Science and Engineering Statistics (NSF/NCSES). 2015c. Women, Special Report NSF 15-311. Arlington,Minorities, and Persons with Disabilities in Science and Engineering: 2015.
VA. Available at http://www.nsf.gov/statistics/wmpd/. Accessed 25 February 2015.
Olson S, Labov JB, rapporteurs. 2012. Community Colleges in the Evolving STEM Education Landscape: Summary. National Research Council and National Academy of Engineering. Washington, DC: The Nationalof a Summit
Academies Press. http://www.nap.edu/catalog.php?record_id=13399. Accessed 11 June 2015.

Chapter 2. Higher Education in Science and Engineering
2 | 101National Science Board | Science & Engineering Indicators 2016
Organisation for Economic Co-operation and Development (OECD). 2008. Paris,Education at a Glance: 2008.France. http://www.oecd.org/education/skills-beyond-school/41284038.pdf. Accessed 25 June 2013.
Organisation for Economic Co-operation and Development (OECD). 2010. Paris,Education at a Glance: 2010.France. http://www.oecd.org/education/skills-beyond-school/45926093.pdf. Accessed 25 June 2013.
Organisation for Economic Co-operation and Development (OECD). 2012. . Paris,Education at a Glance: 2012France. http://www.uis.unesco.org/Education/Documents/oecd-eag-2012-en.pdf. Accessed 25 June 2013.
Organisation for Economic Co-operation and Development (OECD). 2014. . Paris,Education at a Glance: 2014France. http://www.oecd.org/edu/Education-at-a-Glance-2014.pdf. Accessed 3 March 2015.
Perna LW, Ruby A, Boruch RF, Wang N, Scull J, Ahmad S, Evans C. 2014. Moving through MOOCs: Understandingthe progression of users in massive open online courses. 43(9):421–32.Educational Researcher
Porter E. 2014. A smart way to skip college in pursuit of a job. June 17.New York Times
President’s Council of Advisors on Science and Technology (PCAST). 2012. Report to the President: Engage toExcel: Producing One Million Additional College Graduates with Degrees in Science, Technology, Engineering, and
http://www.whitehouse.gov/sites/default/files/microsites/ostpMathematics./pcast-engage-to-excel-final_2-25-12.pdf. Accessed 21 October 2013.
Professional Science Master’s (PSM). 2015. http://www.sciencemasters.com. Accessed 14 May 2015.
Program for Research on Private Higher Education. 2011. Europe’s private and public higher education shares(2002-2009). http://www.albany.edu/dept/eaps/prophe/data/International_Data/Europe's%20Private%20and%20Public%20Higher%20Education%20Shares(2002-2009)-Updated%20March%202011.doc.Accessed 22 June 2015.
Sullivan TA, Mackie C, Massy WF, Sinha E. 2012. Improving Measurement of Productivity in Higher Education: Panel. Washington, DC: The Nationalon Measuring Higher Education Productivity: Conceptual Framework and Data Needs
Academies Press, National Research Council. http://www.nap.edu/download.php?record_id=13417#. Accessed 17June 2015.
United Nations Educational, Scientific and Cultural Organization (UNESCO). 2009. Global Education Digest 2009: http://unesdoc.unesco.org/images/0018/001832/183249e.pdf.Comparing Education Statistics Across the World.
Accessed 12 March 2015.
United Nations Educational, Scientific and Cultural Organization, Institute for Statistics (UNESCO/UIS). 2014. .Higher Education in Asia: Expanding Out, Expanding Up: The Rise of Graduate Education and University Research
Montreal, Quebec, Canada: Author. http://www.uis.unesco.org/Library/Documents/higher-education-asia-graduate-university-research-2014-en.pdf. Accessed 21 May 2015.
UK Council for International Student Affairs (UKCISA). 2013. Policy, research & statistics. http://www.ukcisa.org.uk/pmi. Accessed 21 October 2013.
U.S. Department of Education, Office of Educational Technology (ED/OET). 2013. Expanding evidence approachesfor learning in a digital world. Washington, DC.
U.S. Government Accountability Office (GAO). 2014. State funding trends and policies on affordability.GAO-15-151. Washington, DC.

Chapter 2. Higher Education in Science and Engineering
2 | 102National Science Board | Science & Engineering Indicators 2016
Wadhwa V, Gereffi G, Rissing B, Ong G. 2007. Where the engineers are. http://ssrn.com/abstract=1015843.Accessed 10 June 2013.