
SCHROOTEN et al.: Forecasted Maritime Shipping … · hind the standards for emissions from road...
70
SCHROOTEN et al.: Forecasted Maritime Shipping Emissions for Belgium with … 71 The IMO regulation results in a reduction of merely 1 % of the NO X emissions of main engines in the year 2010. The total reduction of 55 % in SO 2 emissions is due to both the IMO and EU regula- tions: - a decrease of the sulphur content for heavy fuel oil; - a decrease of the sulphur content for fuels used at berth, which also implies a switch from heavy fuel oil to diesel oil for vessels at berth built after 1984. The switch form heavy fuel oil to diesel oil for vessels at berth results for the auxiliaries in a large emission reduction (33 %) for PM and small emission reductions for CO 2 (5 %), NO X (5 %), CO (4 %) and HC (4 %). 7 CONCLUSIONS The transformation of the activity data for historical years into the activity based emission model for maritime shipping is a time consuming job. The activity based emission model however, makes is possible to forecast the emissions from sea-going vessels for the near future by taking into ac- count various legislations. The technological evolution of sea-going vessels is slower than that of other transport modes. An increase in activity between 2004 and 2010 offsets the technological improvements for most pollut- ants. CO 2 emissions increase with 2 - 9 % between 2004 and 2010. The IMO and EU legislation have the largest effect on the SO 2 emissions. A decrease of 50 -53 % between 2004 and 2010 was calculated in the current legislation scenario. The IMO regulation has only a small reducing effect on the total NO X emissions of sea-going vessels in the year 2010. ACKNOWLEDGMENTS The paper is based on the “MOnitoring Programme on air pollution from SEA-going vessels (MOPSEA)” research project, commissioned by the Belgian Science Policy under the SPSDII pro- gramme. VITO performed this study in cooperation with Resource Analysis. REFERENCES DG Environment, 2005: Key assumptions for subsequent calculation of mid and long term green gas emis- sion scenario's in Belgium. Federal Public Service of Public Health, Food Chain Safety and Environment - DG Environment, VITO-ECONOTEC, Belgium, 63 pp. EC, 2002: Commission launches strategy to reduce air pollution from ships IP/02/1719. European Commis- sion, Brussels, Belgium. EC, 2005: Official journal of the European union: Directive 2005/33/EC of the European parliament and of the council of 6 July 2005 amending Directive 1999/32/EC. European Commission, Brussels, Belgium. EMS, 2003: AVV, TNO-MEP, RIZA, MARIN, CE-Delft, Haskoning, Emissieregistratie en –Monitoring Scheepvaart, DGG, the Netherlands. ENTEC, 2002: Quantification of emissions from ships associated with ship movements between ports in the European Community. ENTEC Limited, Final report for the European Commission, England, 48 pp. ENTEC, 2005: Service Contract on Ship Emissions: Assignment, Abatement and Market-based Instruments. ENTEC Limited, Final report for the European Commission, England, 513 pp. IMO, 2005: http://www.acidrain.org/pages/policy/sub6_4.asp IPCC, 1997: Greenhouse gas inventory reference manual (IPCC 1996 Revised Guidelines for national greenhouse gas inventories, Volume 3). France. MEET, 1999: Methodology for calculating transport emissions and energy consumption, Transport re- search. Fourth Framework Programme, Strategic Research, DG VII, ISBN 92-828-6785-4, Luxembourg, 362 pp. TRENDS, 2003: Calculation of Indicators of Environmental Pressure caused by Transport, European Commission, Luxembourg, 91 pp.
Transcript of SCHROOTEN et al.: Forecasted Maritime Shipping … · hind the standards for emissions from road...

SCHROOTEN et al.: Forecasted Maritime Shipping Emissions for Belgium with … 71
The IMO regulation results in a reduction of merely 1 % of the NOX emissions of main engines in the year 2010. The total reduction of 55 % in SO2 emissions is due to both the IMO and EU regula-tions:- a decrease of the sulphur content for heavy fuel oil; - a decrease of the sulphur content for fuels used at berth, which also implies a switch from heavy
fuel oil to diesel oil for vessels at berth built after 1984. The switch form heavy fuel oil to diesel oil for vessels at berth results for the auxiliaries in a large emission reduction (33 %) for PM and small emission reductions for CO2 (5 %), NOX (5 %), CO (4 %) and HC (4 %).
7 CONCLUSIONS
The transformation of the activity data for historical years into the activity based emission model for maritime shipping is a time consuming job. The activity based emission model however, makes is possible to forecast the emissions from sea-going vessels for the near future by taking into ac-count various legislations.
The technological evolution of sea-going vessels is slower than that of other transport modes. An increase in activity between 2004 and 2010 offsets the technological improvements for most pollut-ants. CO2 emissions increase with 2 - 9 % between 2004 and 2010. The IMO and EU legislation have the largest effect on the SO2 emissions. A decrease of 50 -53 % between 2004 and 2010 was calculated in the current legislation scenario. The IMO regulation has only a small reducing effect on the total NOX emissions of sea-going vessels in the year 2010.
ACKNOWLEDGMENTS
The paper is based on the “MOnitoring Programme on air pollution from SEA-going vessels (MOPSEA)” research project, commissioned by the Belgian Science Policy under the SPSDII pro-gramme. VITO performed this study in cooperation with Resource Analysis.
REFERENCES
DG Environment, 2005: Key assumptions for subsequent calculation of mid and long term green gas emis-sion scenario's in Belgium. Federal Public Service of Public Health, Food Chain Safety and Environment - DG Environment, VITO-ECONOTEC, Belgium, 63 pp.
EC, 2002: Commission launches strategy to reduce air pollution from ships IP/02/1719. European Commis-sion, Brussels, Belgium.
EC, 2005: Official journal of the European union: Directive 2005/33/EC of the European parliament and of the council of 6 July 2005 amending Directive 1999/32/EC. European Commission, Brussels, Belgium.
EMS, 2003: AVV, TNO-MEP, RIZA, MARIN, CE-Delft, Haskoning, Emissieregistratie en –Monitoring Scheepvaart, DGG, the Netherlands.
ENTEC, 2002: Quantification of emissions from ships associated with ship movements between ports in the European Community. ENTEC Limited, Final report for the European Commission, England, 48 pp.
ENTEC, 2005: Service Contract on Ship Emissions: Assignment, Abatement and Market-based Instruments.ENTEC Limited, Final report for the European Commission, England, 513 pp.
IMO, 2005: http://www.acidrain.org/pages/policy/sub6_4.asp IPCC, 1997: Greenhouse gas inventory reference manual (IPCC 1996 Revised Guidelines for national
greenhouse gas inventories, Volume 3). France. MEET, 1999: Methodology for calculating transport emissions and energy consumption, Transport re-
search. Fourth Framework Programme, Strategic Research, DG VII, ISBN 92-828-6785-4, Luxembourg, 362 pp.
TRENDS, 2003: Calculation of Indicators of Environmental Pressure caused by Transport, European Commission, Luxembourg, 91 pp.
72 Proceedings of the TAC-Conference, June 26 to 29, 2006, Oxford, UK
Measurement method for emissions from inland navigation
A. Kraai*, A. Hensen, G.P.A. Kos, H.P.J. de Wilde Energy research Centre of the Netherlands, the Netherlands
J.H. Duyzer, H. Westtrate, J.C.Th. Hollander The Netherlands Organisation for Applied Scientific Research TNO, the Netherlands
Keywords: Ship emissions, emission factor, NOx, PM
ABSTRACT: Transport over water is more efficient and cleaner than transport over land. But the standards for exhaust gas emissions from diesel engines from inland vessels lag 5 to 10 years be-hind the standards for emissions from road transport. With unchanged policy, this will result in more nitrogen oxides and particle matter to the transport performance (in kilometres) for inland vessels than for trucks.
However, the emissions from the inland navigation are based on only a few experiments with a few vessels whereas the emissions from road transport are much better known.
This measurement method is based on remote measurement of the exhaust plumes from vessels that pass by on a canal/river. In a two-day campaign, 20 km east of Rotterdam, emissions from about 150 ships were obtained. The gasses, which were measured are CO2, NO, NO2. For particulate mat-ter, total particle numbers and particle size distribution were determined. High time resolution made it possible to see the different ship passages. The observed plumes for NOx and particles were linked to those observed for CO2. The latter is linked to the amount of diesel used and to the engine power. In this way we obtained an average emission factor for NOx of 11±4 g NOx/kWh (n=132 vessels).
The same procedure was used for particle numbers. For particle mass the uncertainty is signifi-cantly larger but the measurements seem to indicate that ships are slightly cleaner than expected. The average emission factor was in the range of 0.1-0.3 g/kWh.
These experiments can give a better understanding of the ship emissions and may facilitate effective policy on reduction of emissions from inland shipping
1 INTRODUCTION
Cargo transport by inland navigation will be more important in Europe in the future. Navigation is considered to be a durable option for long and middle-long distances compared to cargo trucks (Schilperoord, 2004).
Because of the current policy in the Netherlands, NOx emissions from mobile sources are de-creasing, but this is mostly through cleaner techniques for road traffic. The use of these techniques in sea and inland navigation takes more time, also because ship engines can last for 25 years. The contribution of these sources is increasing both in absolute sense and relatively compared to road traffic emissions. NOx-data from the central bureau of statistics (CBS) in the Netherlands for the years 1990-2003 show decrease of NOx for total of mobile sources, but an increase for inland navi-gation and total navigation (Fig. 1). The emission factors are relatively uncertain, because these are based on scarce data from a limited number of experiments that were not specific for the Dutch fleet (Klein et al., 2004).
* Corresponding author: Aline Kraai, Energy research Centre of the Netherlands, P.O.Box 1, 1755 ZG, Petten, The Netherlands. Email: [email protected]

KRAAI et al.: Measurement method for emissions from inland navigation 73
At this moment, with the available emission data and with measurement techniques used so far, it is difficult to quantity the total emission of the total Dutch fleet. CBS calculates the emission from vessel kilometres. These are transformed with an assumed average speed into sailinghours to calculate kilowatt-hour (Klein, 2004). Emission ceilings for NOx emissions from inland vessels vary between 9.3 and 13 g/kWh, depending on the engine rotations (Schilperoord, 2004). The emis-sion factors which are registrated in the Netherlands are between 8 and 16 g NOx/kWh and 0.3 and 0.6 g PM/kWh (Oonk et al., 2003)
Figure 1. NOx emissions for the total mobile sources in millions of kg (left axis) by CBS, the Netherlands for the years 1990-2003. The right axis shows the percentage of the total navigation (including sea navigation) and the inland navigation against the total mobile sources emissions.
2 MEASUREMENT METHOD
The exhaust gas of diesel engines in vessels is a mix of gasses and particles among which are car-bon dioxide (CO2), nitrogen oxides (NOx), particulate matter (PM) and sulphur dioxide (SO2). Once in the atmosphere the emitted gasses and particles are carried along with the wind in a (smoke) plume. 2.1 Plume measurements Emission meaurements for vessels are possible at the lee side of the wind using high time resolution instruments that analyse the gasses or particles in the air. In this experiment a mobile van was used to house of all the instruments. (Fig. 2).
Ambient air was analysed using a chemiluminescence NO/NOx analyzer (Eco-physics CLD 700 AL), a CO2/H2O analyzer (Licor Li-6262), and a pulsed Fluorescence SO2 analyzer (Thermo Elec-tron Model 43A). These systems used a 2 m ¼ inch inlet hose that was flushed at 7 l/minute. NOxcalibration took place in the lab after the experiments. The CO2 monitor was calibrated each day be-fore and after the experiments using N2 for zero calibration and 450 ppm CO2 in an N2/O2 mixture.
A range of different instruments were used to measure particulate matter. A PM10-TEOM (model 1400) was used to obtain PM mass data. This instrument is to slow to enable measurements of individual plumes but the whole day timeseries was used to determine a proper conversion factor for the optical particle instruments into mass level. A Condensation Particle Counter (TSI-3022A)
74 KRAAI et al.: Measurement method for emissions from inland navigation
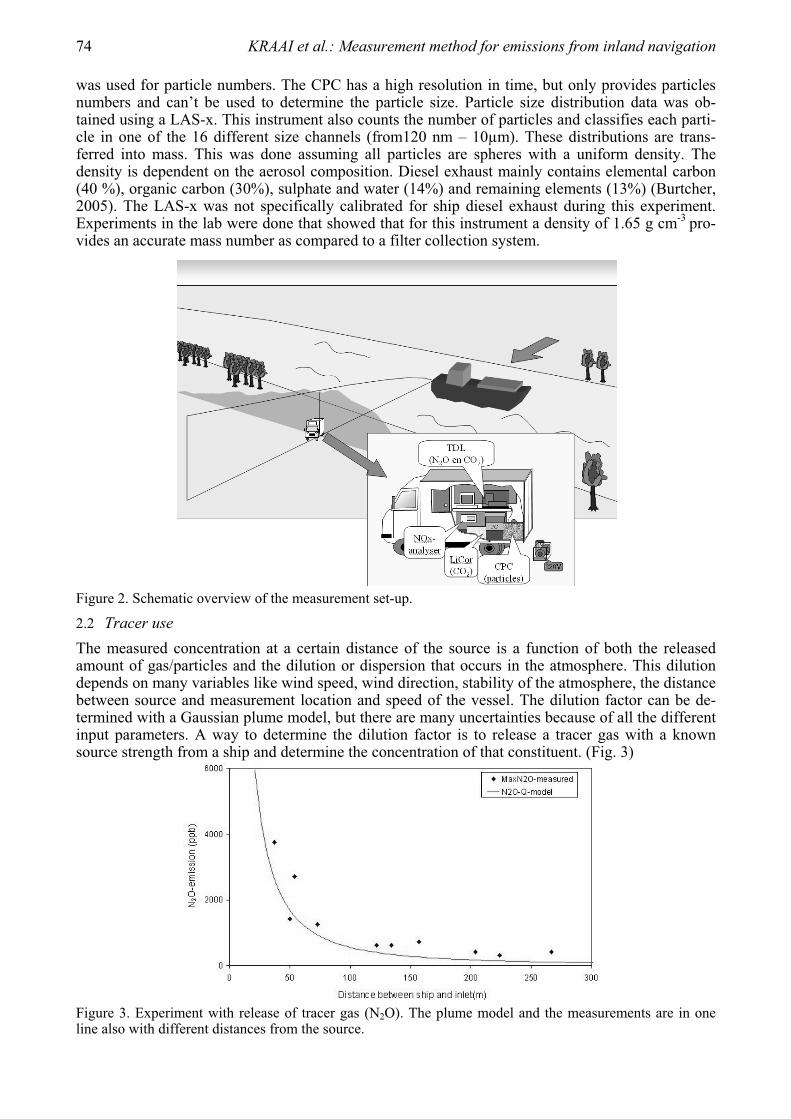
was used for particle numbers. The CPC has a high resolution in time, but only provides particles numbers and can’t be used to determine the particle size. Particle size distribution data was ob-tained using a LAS-x. This instrument also counts the number of particles and classifies each parti-cle in one of the 16 different size channels (from120 nm – 10μm). These distributions are trans-ferred into mass. This was done assuming all particles are spheres with a uniform density. The density is dependent on the aerosol composition. Diesel exhaust mainly contains elemental carbon (40 %), organic carbon (30%), sulphate and water (14%) and remaining elements (13%) (Burtcher, 2005). The LAS-x was not specifically calibrated for ship diesel exhaust during this experiment. Experiments in the lab were done that showed that for this instrument a density of 1.65 g cm-3 pro-vides an accurate mass number as compared to a filter collection system.
Figure 2. Schematic overview of the measurement set-up.
2.2 Tracer use The measured concentration at a certain distance of the source is a function of both the released amount of gas/particles and the dilution or dispersion that occurs in the atmosphere. This dilution depends on many variables like wind speed, wind direction, stability of the atmosphere, the distance between source and measurement location and speed of the vessel. The dilution factor can be de-termined with a Gaussian plume model, but there are many uncertainties because of all the different input parameters. A way to determine the dilution factor is to release a tracer gas with a known source strength from a ship and determine the concentration of that constituent. (Fig. 3)
Figure 3. Experiment with release of tracer gas (N2O). The plume model and the measurements are in one line also with different distances from the source.

KRAAI et al.: Measurement method for emissions from inland navigation 75
In this experiment the CO2 released from the ship itself was used as tracer. Doing so the absolute quantity of the emitted gas is not obtained but the emission factor can be still be determined. The measured concentration equals the emission multiplied with an unknown dilution factor. Dividing
two equations for two components eliminated the dilution factor and provides: The concentration measurements are used to obtain the concentration ratio in the plume. This is done by integration of the concentration above the background level. The integrated values for NOxand CO2 are divided to obtain a gNOx/gCO2 emission factor. Since the emission standards are de-fined used in gNOx per kWh. The CO2 emission is transferred into the amount of fuel used. With the carbon fraction in diesel and the combustion value of diesel this provides a conversion factor of 73.3 g CO2 MJ-1. Finally the emission factor is obtained assuming an engine efficiency of 38% (Schilperoord, 2004) for the ship engines.
3 RESULTS
Two projects were done on inland navigation. On 18 march 2005 at the Amsterdam-Rijn canal and on 6 and 7 February 2006 at the Dordtse Kil, a river east of Rotterdam. The distance between source and inlet to the instruments was between 25 and 200 m. On a single day about 100 ships pass by and 60 to 70 ships were analysed. At the measurement location a typical plume passage lasts for about 40 seconds per ship. A time series obtained with several passing vessels shows how the dif-ferent components increase simultaneously when a ship is passing. (Fig. 4) The difference in con-centration peaks height is caused either by difference in emissions or difference in dilution. The correlation between peak levels of CO2 and NOx or particles counts is good.
Figure 4. Time series with a set of passing vessels. Simultaneous concentration peaks occur for the different components. The concentrations of the gasses CO2 and NOx are shown in the lower part of the graph and par-ticle counts in the upper graph.
22 EmissionCOEmissionNO
ionCOConcentrationNOConcentrat xx

76 KRAAI et al.: Measurement method for emissions from inland navigation
3.1 NOx
The emission factors obtained with the method described here provided a consistent dataset. Table 1 gives the statistics for the measurements at the Dordtse Kil, the data is also shown Figure 5. The average emission factor for NOx is in the expected range.
Table 1. Statistics of emission factors for NOx in g/kWh
g NOx/kWh Average 10.7 Median 10.7 Standard deviation 3.6 Relative standard deviation 33% Plume counts 132
Figure 5. Emission factors of NOx and PM (measured with LAS-x and Osiris)
3.2 PMFigure 5 shows the emission factors of particulate matter that were obtained. These are all low emissions compared to what is used in the Netherlands until now. An example of the size distribu-tion obtained on a single day is shown in Figure 6. The patterns show an average particle size dis-tribution for 25 plumes both using the data in the plume and in the background data in between these plumes. The difference of these two distributions represents the PM added to the background level by the plume. About 80 % of this mass is below1 m with the peak around 0.5 m.
Figure 6. The particle size distribution downwind of the river in and outside a set of 25 plumes as measured with the LASx.

KRAAI et al.: Measurement method for emissions from inland navigation 77
During part of the measurements we uses an inlet to the LAS-x was relatively long (1 m steel tube), this might have caused an underestimation of the emission level. The average emission factor was in the range of 0.1-0.3 g PM/kWh.
4 DISCUSSION AND CONCLUSIONS
This method provides emission factors for a large number of vessels per day especially as compared to tailpipe measurements. Another advantage of this method is that the emission factors of the fleet can be determined in a realistic situation in stead of a laboratory setting. The flexibility of a moving laboratory enables experiments on various locations and eventually also the evaluation of actual ex-posure levels for people living close to the waterways.
The use of CO2 as internal tracer works well. This means that that the emission factor of the ves-sels can be determined directly instead of indirect using a atmospheric transport model. The model is still needed when an absolute emission of NOx is required.
The emission factors of NOx obtained with this plume method had an average level of 11±4 g NOx/kWh was obtained (n= 136). The range in the emission factors obtained was relatively small which results a 95% confidence level of 0.7 for the average emission factor. This factor is within the range of the emission factors used by the as the Dutch emission registration.
The particle size distribution for ship emissions peaks below 1 m. An instrument that can detect smaller particles compared to the LAS-x used here (below 120 nm) would be an advantage for the next measurements to evaluate the mass in the plume below this size level. According to Burtcher (2005) the particle emissions of (car) diesels have an average diameter from 60-100 nm that is nearly independent from motor type or running circumstances. These small particles might add 10-20% to the mass. This cannot explain why the emission factors measured for PM during these ex-periments were about 5 times below the level used in the emission inventory. This difference was larger than expected even is we assume our data has an uncertainty of a factor of 2. For this reason experiments are still ongoing with a focus on additional experiments that can narrow down the un-certainty in the PM emission levels.
ACKNOWLEDGEMENTS
Initial development of this method was funded by the Netherlands Ministry of Housing Spatial planning and the Environment. Further development and the measurement campaign along the Dordtse Kil were funded by the ministry of Ministry of Transport, Public Works and Water Man-agement. We acknowledge our colleagues Alex Vermeulen, Pim van der Bulk and Theo Schrijver for software logistics and technical support respectively.
REFERENCES
Burtscher, H., 2005: Physical characterization of particulate emissions from diesel engines: a review. Journal of Aerosol Science, vol. 37, pp. 896-932.
Germanischer Lloyd, 2001: Erarbeitung von verfahren zur emitllung der luftschadstoffemissionen von in be-trieb befindlichen Binnenschaffsmotoren.
Klein, J., R. van den Brink, A. Hoen, J. Hulskotte, N. van Duynhoven, E. van de Burgwal, D. Broekhuizen, 2004: Methoden voor de berekening van emissies door mobiele bronnen in Nederland t.b.v. emissiemonitor, jaarcijfers 2001 en ramingen 2002.
Oonk, J.A., J. Hulskotte, R. Koch, G. Kuipers, J. van Ling, 2003: Emissiefactoren voor de binnenscheepvaart TNO-MEP Rapport R2003/437.
Schilperoord, H.A., 2004: Environmental Performance of inland shipping. www.royalhaskoning.com CBS: http://statline.cbs.nl

78 Proceedings of the TAC-Conference, June 26 to 29, 2006, Oxford, UK
Particle Emissions from Ship Engines: Emission Properties and Transformation in the Marine Boundary Layer
A. Petzold*, B. Weinzierl, M. Fiebig, M. Lichtenstern DLR-Institute of Atmospheric Physics, Oberpfaffenhofen, Germany
P. Lauer MAN Diesel SE, Augsburg, Germany
C. Gurk Max-Planck-Insitute for Chemistry, Mainz, Germany
K. Franke University of Bremen, Bremen, Germany
E. Weingartner Paul Scherrer Institute, Villigen PSI, Switzerland
Keywords: Ship Emissions, Combustion, Marine Aerosol, Marine Boundary Layer
ABSTRACT: In the framework of a combined effort ship emission studies were conducted in 2004. Detailed aerosol microphysics and chemistry was measured in the raw exhaust gas of a single-cylinder test bed engine. The emission studies were complemented by airborne aerosol transforma-tion studies in the marine boundary layer using the DLR aircraft Falcon 20 E-5. In this experiment a single plume of a large container ship was extensively investigated. Observations from emission studies and plume studies combined with a Gaussian plume dispersion model yield a consistent pic-ture of particle transformation processes from emission from a ship engine to atmospheric process-ing in the marine boundary layer during plume expansion. The results are used for the determina-tion of emission indices of particulate matter from ships and for the estimation of life times of ship exhaust particles in the marine boundary layer.
1 INTRODUCTION
Currently, gaseous and particulate matter emissions from ship engines are gaining increasing atten-tion because of possible environmental and climate impacts (Eyring et al., 2005a, b). Emitted spe-cies can considerably influence the atmospheric composition and in particular the ozone chemistry in the troposphere (Endresen et al., 2003). As for any combustion source, ship engine exhaust also contains particulate matter. Ship engine exhaust particles are composed of combustion aerosol par-ticles consisting of elemental and organic carbon, sulphate and ash (Petzold et al., 2004), and of volatile particles forming outside the combustion process in the expanding plume.
Elemental or black carbon (BC) is the most efficient particulate absorber of atmospheric solar radiation and has therefore a strong impact on the atmospheric radiation balance. Additionally, combustion particles can act as nuclei for the formation of cloud droplets and affect by that means the life cycle and radiative properties of marine stratus clouds at the top of the marine boundary layer (Durkee et al., 2000).
In particular the emission of particles and their fate in the marine environment are however widely unknown. Until today, observations reported mainly bulk aerosol properties like mass con-centrations (Cooper, 2003), while detailed chemical analyses and aerosol microphysical data are missing.
In the framework of a combined effort, ship emission studies were conducted in 2004 as part of the European Integrated Project HERCULES (High Efficiency R&D on Combustion with Ultra
* Corresponding author: Andreas Petzold, DLR Institute of Atmospheric Physics, Oberpfaffenhofen, 82205 Wessling, Germany Email: [email protected].

PETZOLD et al.: Particle Emissions from Ship Engines: Emission Properties and Trans... 79
Low Emissions for Ships). Detailed aerosol microphysics and chemistry were measured in the ex-haust gas of a single-cylinder test bed engine, which was operated at various load conditions, run-ning on fuel with a sulphur content of 3.45 wt.-%.
The emission studies were complemented by airborne aerosol transformation studies in the ma-rine boundary layer as part of the ICARTT-ITOP (Intercontinental Transport of Ozone and Precur-sors) experiment in 2004. Research flights using the DLR aircraft Falcon 20 E-5 were conducted in the English Channel and in a single plume of a large container ship.
2 METHODS AND RESULTS
On board of the DLR research aircraft Falcon, a comprehensive set of instruments was operated for measuring aerosol microphysical properties of both the secondary volatile aerosol, the primary combustion aerosol and trace gases H2O, NO, NOx, O3, CO, CO2, and SO2. The excess CO2, or
CO2 respectively, was calculated from the total CO2 time series by subtracting the average back-ground value from the full CO2 signal. Since there is no additional source for CO2 in the vicinity of the investigated ship plume, the value of CO2 is a very good indicator for combustion emissions. Using a calculated value of 40000 ppm CO2 in the raw exhaust gas of the investigated vessel, the plume dilution can be determined from CO2.
Figure 1 shows the flight track of the aircraft during the plume study in the exhaust of the con-tainer ship. The colour of the symbols represents the black carbon mass concentration in the plume. Close to the source, CO2 exceeded a value of 10 ppm, ranging up to > 100 ppm. Simultaneously, the BC mass concentration reached values of close to 10 μg m -3, while the Condensation Particle Counters (TSI 3760A) were above their upper detection limit of 20,000 cm -3.
The plume encounters observed during the Single Plume Study are shown in Figure 2. The strength of the plume event was rated according to the CO2 measured above the background signal (excess CO2, CO2 ).
The analysis of the measured DMA size distributions in the fresh plume yielded a count median diameter of the combustion particles of 70 nm. Comparable data from emission studies yield a count median diameter of 52 nm. For aged plumes the count median diameter of the combustion particle mode was found at approx. 100 nm. These values reflect a considerable size shift in the par-ticle size distribution by coagulation during the plume expansion from exhaust conditions to an aged plume embedded in the marine boundary layer.
Figure 1. Tracks of the source ship and the research aircraft Falcon during the Single Plume Study; symbol colours represent Black Carbon mass concentrations in the plume.
80 PETZOLD et al.: Particle Emissions from Ship Engines: Emission Properties and Trans...
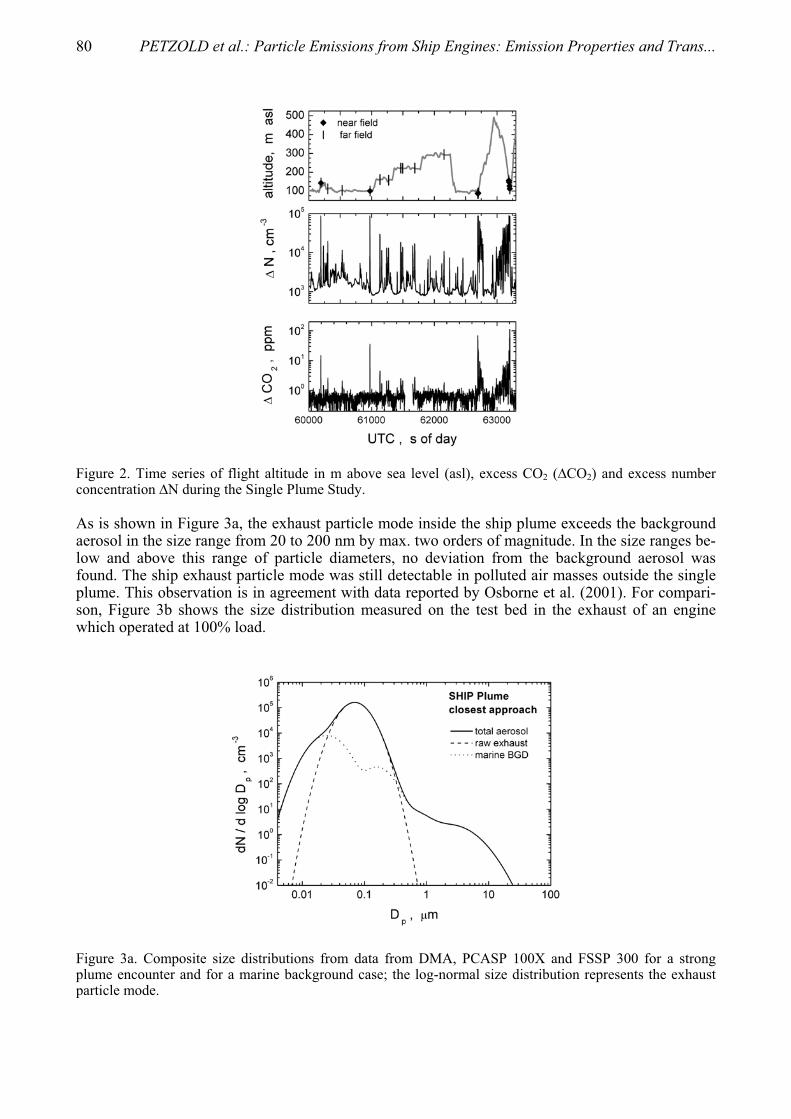
Figure 2. Time series of flight altitude in m above sea level (asl), excess CO2 ( CO2) and excess number concentration N during the Single Plume Study.
As is shown in Figure 3a, the exhaust particle mode inside the ship plume exceeds the background aerosol in the size range from 20 to 200 nm by max. two orders of magnitude. In the size ranges be-low and above this range of particle diameters, no deviation from the background aerosol was found. The ship exhaust particle mode was still detectable in polluted air masses outside the single plume. This observation is in agreement with data reported by Osborne et al. (2001). For compari-son, Figure 3b shows the size distribution measured on the test bed in the exhaust of an engine which operated at 100% load.
Figure 3a. Composite size distributions from data from DMA, PCASP 100X and FSSP 300 for a strong plume encounter and for a marine background case; the log-normal size distribution represents the exhaust particle mode.

PETZOLD et al.: Particle Emissions from Ship Engines: Emission Properties and Trans... 81
Figure 3b. Size distributions of raw particle emissions measured in the test bed studies.
The plume age during the Single Plume Study was calculated from trajectory analyses of the ship plume with respect to the aircraft flight track and from the geometrical distance from the probing aircraft to the source ship at the time of emission. The CO2 data measured during the Single Plume Study were then used for the determination of the plume diffusion coefficients according to the plume dispersion model of Glasow et al. (2003). Glasow et al. report best estimates for horizontal and vertical diffusion coefficients of 0.75 and 0.6, while a plume model fitted to the CO2 measure-ments yields values of 0.74 and 0.7. When using CO2 as an indicator for the plume age, plume ob-servations extended from very young plumes in the Single Plume Study (t 60 s) to well aged plumes in the English Channel (t 10,000 s).
Comparing Figures 3a and 3b, a strong mode of particles with diameters around 10 nm is visible in the raw exhaust data (Figure 3b) while only very few particles are observed in the young plume (Figure 3a). A detailed analysis yielded a ratio N (D > 4 nm) / N (D > 10 nm) of 1.25 at plume ages of about 600 s while this ratio decreased to 1.0 +/- 0.1 after about 100 s. Hence nucleation mode particles are expected to live no longer than about 1 h.
Assuming an estimated precision of 0.2 ppm for the determination of CO2, the CO2 signature of a ship plume becomes indistinguishable from the CO2 background after about 10 h. This value can be used as an average ship plume life time when plume dispersion is the only active dilution process. As soon as turbulent mixing comes into play the life time can be much shorter.
3 CONCLUSIONS
The adapted Glasow plume dispersion model in combination with the observations from emission studies and plume studies yields a consistent picture of particle transformation processes from emission from a ship engine to atmospheric processing in the marine boundary layer during plume expansion:
- Black carbon mass and CO2 are well correlated for emission and young plume conditions. - Extensive transformation of particle size distribution properties from exhaust to aged plume ob-
served: count median diameter of the size distributions shifts from 52 nm (raw exhaust) to 70 nm (young plume) and to approx. 100 nm (aged plume).
- Strong nucleation particle mode in raw exhaust; nucleation mode is almost completely depleted in the single plume far field (plume age > 10 3 s).
- High abundance of volatile Aitken mode particles in raw exhaust, increased fraction of volatile particles in ship plumes is still visible at plume ages > 10 4 s.
- Ship plume reaches top of MBL after approx. 1000 s, earliest onset of ship track effects. - CO2 plume signature disappears latest after approx. 10 h.

82 PETZOLD et al.: Particle Emissions from Ship Engines: Emission Properties and Trans...
A detailed analysis of the SHIP Plume Study is under way. Quantitative results on emission factors in terms of mass and number and particle life times will be reported soon in a publication in prepa-ration for Atmospheric Chemistry and Physics.
REFERENCES
Capaldo, K., Corbett, J.J., Kasibhatla, P., Fischbeck, P.S. and Pandis, S.N., 1999: Effects of ship emissions on sulfur cycling and radiative climate forcing over the ocean, Nature, 400, 743-746.
Cooper, D.A., 2003: Exhaust emissions from ships at berth, Atmos. Environ., 37, 3817-3830. Durkee, P.A., K.J. Noone, and R,T, Bluth, 2000: The Monterey Area ship track experiment, J. Atmos. Sci-
ences, 57, 2523-2541. Endresen, Ø., E. Sørgård , J.K. Sundet, S. B. Dalsøren, I.S.A. Isaksen, T. F. Berglen, and G. Gravir, 2003:
Emission from international sea transportation and environmental impact, J. Geophys. Res. 108, 4560, doi:10.1029/2002JD002898.
Eyring V., H. W. Köhler, J. van Aardenne, A. Lauer , 2005a: Emissions from international shipping: 1. The last 50 years, J. Geophys. Res., 110, D17305, doi:10.1029/2004JD005619.
Eyring V., H. W. Köhler, A. Lauer, B. Lemper, 2005b: Emissions from international shipping: 2. Impact of future technologies on scenarios until 2050, J. Geophys. Res., 110, D17306, doi:10.1029/2004JD005620.
Osborne, S.O., et al., 2001: Modification of the aerosol size distribution within exhaust plumes produced by diesel-powered ships, J. Geophys. Res., 106, 9827-9842.
Petzold, A., et al., 2004: Particle emissions from ship engines, J. Aerosol Sci., Abstracts of the European Aerosol Conference, S1095-S1096.
Von Glasow, R., et al., 2003: Modelling the chemical effects of ship exhaust in the cloud-free marine bound-ary layer, Atmos. Chem. Phys., 3, 233-250.
Part of this work was funded by the EC within the I.P. HERCULES under Contract No. TIP3-CT-2003-506676. The collaboration of the MAERSK shipping company during the SHIP Plume Study is gratefully acknowledged.

Proceedings of the TAC-Conference, June 26 to 29, 2006, Oxford, UK 83
Aircraft-based Trace Gas Measurements in a Primary European Ship Corridor
H. Schlager*, R. Baumann, M. Lichtenstern, A. Petzold DLR-Institut für Physik der Atmosphäre, Oberpfaffenhofen, Germany
F. Arnold, M. Speidel Max-Planck-Institut für Kernphysik, Heidelberg, Germany
C. Gurk, H. Fischer Max-Planck-Institut für Chemie, Mainz, Germany
Keywords: ship emissions, ship exhaust plumes, nitrogen oxides, sulphur dioxide
ABSTRACT: Aircraft measurements of gaseous ship emissions were performed in the vicinity of the heavily travelled ship lanes through the English Channel and in the exhaust trail of a major sea-going container ship. In the single ship plume experiment the concentration and dilution of major emissions (CO2, NO, NOy, SO2) were measured up to a distance to the source ship and plume age of 25 km and 1650 s, respectively. Emission factors for NOx and SO2 were determined from individual plume encounters. The inferred NOx emission indices compare well with calculated emission indi-ces from the engine emission model of the manufacturer. The deduced SO2 emission indices from the SO2 enhancements in the plume are smaller than calculated emission indices bases on the ana-lysed sulphur content in the fuel sample. However, the difference is still within the estimated error limits for the SO2 emissions factor measurements. A survey flight in the ship corridor through the English Channel revealed the presence of a multitude of ship plumes aged between 0.5 and several hours. Many of the observed concentration enhancements in the ship corridor are due to the super-position of several plumes with different ages.
1 INTRODUCTION
Shipping represents a major element of international transportation. Combustion from ships pro-duces gaseous species and aerosols that contribute to anthropogenic pollution and climate change (e.g. Corbett and Fischbeck, 1997, Lawrence and Crutzen, 1999, Endresen et al., 2003). A number of model studies have been performed to investigate the local, regional and global impact of gase-ous ship emissions on photochemistry (Capaldo et al. 1999, Lawrence and Crutzen 1999, Kasib-hatla et al. 2000, Davis et al. 2001, Glasow et al. 2002, Endresen et al. 2003, Song et al. 2003). These studies revealed that photochemical and heterogeneous processes in the ship exhaust plumes and the ship corridors are important but not well parameterized in the chemistry transport models. Experimental data to investigate these processes, however, are very sparse. Chen et al. (2005) per-formed aircraft measurements in the exhaust trail of two ships off the coast of California in 2002 and found that models underestimate NOx and SO2 losses and largely overestimate HNO3 abun-dances in the plumes. Recently, Williams et al. (2005) reported observations in exhaust plumes of several small marine ships off the coast of New England performed on board the research vessel Ron Brown in summer 2004. Here we report on first aircraft measurements in a major European ship traffic corridor including detailed observations in the exhaust trail of a large container ship. The objectives of these investigations are to provide data for analysis of plume dilution and mixing, determination of ship emission factors, and validation of plume box and chemistry transport mod-els. This paper presents the measurements of chemical compounds, observations of particulate ship emissions are described in the proceedings contribution of Petzold et al. (this issue).
* Corresponding author: Hans Schlager, DLR-Institut für Physik der Atmosphäre, Oberpfaffenhofen, D-82224 Wessling, Germany. Email: [email protected]
84 SCHLAGER et al.: Aircraft-based Trace Gas Measurements in a Primary European Ship ...
2 EXPERIMENT
The measurements were performed on 23 and 30 July 2004 as part of the DLR research program Transport and Environment. The DLR research aircraft Falcon was used based from Creil in north-ern France. The objective of the flight on 23 July 2004 was to survey the English Channel at the western exit and search for corridor effects of ship emissions. The English Channel is one of the most travelled ship corridors in the world. About 500 ships per day use the east- and westbound shipping lanes in the English Channel. The objective of the flight on 30 July 2004 was to sample the exhaust trail of a designated source ship, a very large container ship. The sampling of the con-tainer ship plume was performed off the coast of north-western France near 48.2°N/ 6,5°W. Infor-mation on the operating conditions of the ship and the engine as well as a sample of the fuel burnt were provided by the ship operator.
Measurements presented here include CO2, NO, NOy, O3 and SO2. A NDIR absorption spec-trometer was used for fast CO2 measurements (modified LI-COR 6262) with an accuracy of ±0.8 ppmv for a time resolution of 1 s. (Fischer et al., 2002). NO and NOy were detected using chemilu-minescence technique (Schlager et al., 1997, Ziereis et al., 1999). Individual NOy compounds were catalytically reduced to NO on the surface of a heated gold converter with addition of CO. The inlet tube for air sampling was oriented rearward and heated to 30°C to avoid sampling of NOy in parti-cles and adsorption of nitric acid on the wall of the sampling tube, respectively. The accuracy of the NO and NO measurements is 8 and 15 % for a time resolution of 1 s. Detection of O3 was by UV absorption technique (Thermo Electron Corporation, Model 49) with an accuracy of 5 % for a time resolution of 5 s. SO2 was measured using an ion trap mass spectrometer and chemical ionization technique (Speidel et al. 2006).
3 RESULTS
3.1 Individual plume measurements Figures 1 shows the route of the container ship and the Falcon flight track during the exhaust trail measurements on 30 July 2004. The detailed sampling of the plume was performed between 16.30 – 17.30 UTC at flight levels between 93 and 266 m asl. The wind direction was east/southeast with a mean wind velocity of 2.5 ms-1. Besides the exhaust plume of the container ship additional plumes were present of other ships cruising west (downwind) of the container ship on similar routes.
Table 1 summarises the observations during ten successful plume penetrations. Given are the measured enhancements of mixing ratios of CO2, NO, and NOy in the plume. Also included is time, altitude, and estimated plume age for each encounter. NO and NOy values are missing for the en-counters at small plume ages due to concentrations in the plume outside the measurement range of the instruments. A device for dilution of the sample air prior to detection was not used during these first measurements of ship plumes.
Figure 2 (right panel) shows the measured peak mixing ratios of CO2, NO, and NOy for the plume encounters as a function of plume age. After a plume age of 1000 s the exhaust plume is di-luted by a factor of 3.5 · 10-5 considering the initial CO2 mixing ratio at the engine exit of 40.000 ppmv. Observed NOy/ CO2 ratios versus plume age are shown in the right panel of Figure 2. The NOy/ CO2 ratios for the plume encounters #6 and #10 agree within error estimates with the initial NOx/CO2 ratio at the engine exit indicating no NOy loss for plume ages up to 1300 s for the mete-orological conditions in the boundary layer during the measurements. The NOy/ CO2 ratio of plume encounter #3 is slightly smaller than the initial NOx/CO2 ratio at the engine exit suggesting onset of reactive nitrogen loss.
3.2 Ship traffic corridor measurements Figure 3 depicts the Falcon flight track on 23 July 2004. The flight section in the ship corridor was from Brest (48.5°N, 4.2°W) to the northwest (50°N, 7°W) at a constant altitude of 200 m asl. Figure 4 shows observed mixing ratios of NOy, NO, SO2, and CO2 along the Falcon flight track in the ship

SCHLAGER et al.: Aircraft-based Trace Gas Measurements in a Primary European Ship ... 85
corridor (right panel). Coincident enhancements in the mixing ratios of NOy, NO and SO2 were found caused by a multitude of ship exhaust plumes aged between about 0.5 and 5 hours. In many cases measured concentration peaks are due to superposition of several ship plumes. For some of the exhaust plumes enhancements of the CO2 mixing ratios were also detected. An example is shown in the right panel of Figure 3. Observations in this multiple plume were used to infer emis-sion factors for NOx (see below).
-10 0 10 20
10
20
30
40
km n
orth
of 4
8°N
km east of 6.5°W
3
2
16
857
109
4
Clif
ford
MAE
RSK
Falcon
wind indicators(5 km on map -> 2.5 m/s)
Figure 1. Sampling strategy of the exhaust plume of the large container ship. Routing of the Falcon and con-tainer ship (left panel). Falcon encounters (solid circles) of the container ship plume are labelled from 1-10 (right panel). The wind direction and velocity are also indicated. Plumes from other nearby ships were also penetrated (open circles).
30 100 1000 100000.3
1
10
100
3
610
2
36
7 8
10
peak
hei
ght
plume age in s
CO2 (ppmv) NOy (ppbv) NO (ppbv)
~ t 1
41
5
2 76
910
83
0 500 1000 1500 20000.00
0.01
0.02
0.03
0.04
0.05
0.06
NO
y /
CO
2 [m
ol/m
ol]
plume age in s
6 10
3primary engineemission NOx/CO2
Figure 2. Observed peak concentrations of CO2, NOy, and NO for the container ship plume transects versus estimated plume age (left panel). Measured NOy/CO2 ratios of the plume encounters #3. #6, and #10. Also included is the initial emission NOx/CO2 ratio at the engine exit (right panel).
(15:00)15:30
16:0016:30
17:0017:30
18:00
7.5 7.0 6.5 6.0 5.5 5.0 4.5 4.0 3.547.5
48.0
48.5
49.0
49.5
50.0
50.5
Latit
ude
°N
Longitude °W
Falcon Clifford MAERSK
FalconContainer ship

86 SCHLAGER et al.: Aircraft-based Trace Gas Measurements in a Primary European Ship ...
Figure 3. Falcon transect through the ship corridor at the exit of the English Channel at a constant altitude of 200 m asl on 23 July 2004.
Figure 4. Time series of observed NOy, NO, SO2, and CO2 for the ship corridor transect (left panels). Ob-served concentration enhancements in the multiple plume sampled at about 51910 s (UTC) in the ship corri-dor (right planels).
SCHLAGER et al.: Aircraft-based Trace Gas Measurements in a Primary European Ship ... 87
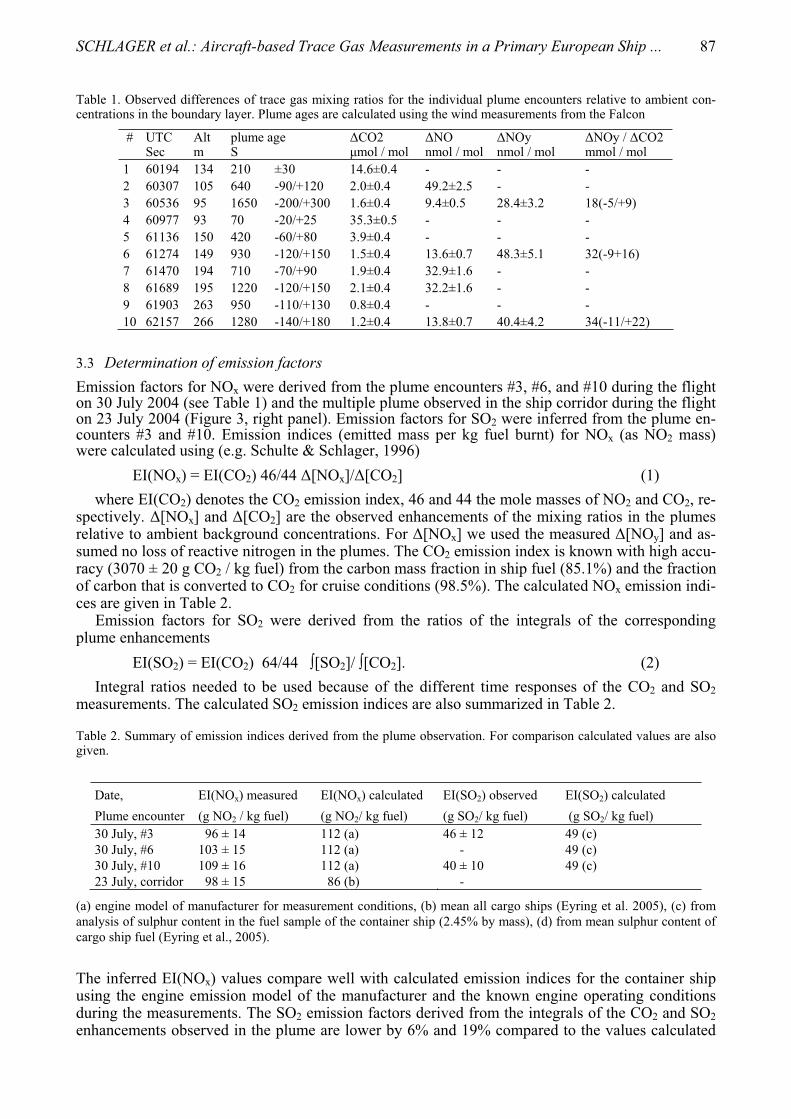
Table 1. Observed differences of trace gas mixing ratios for the individual plume encounters relative to ambient con-centrations in the boundary layer. Plume ages are calculated using the wind measurements from the Falcon
# UTC Alt plume age CO2 NO NOy NOy / CO2 Sec m S mol / mol nmol / mol nmol / mol mmol / mol 1 60194 134 210 ±30 14.6±0.4 - - - 2 60307 105 640 -90/+120 2.0±0.4 49.2±2.5 - - 3 60536 95 1650 -200/+300 1.6±0.4 9.4±0.5 28.4±3.2 18(-5/+9) 4 60977 93 70 -20/+25 35.3±0.5 - - - 5 61136 150 420 -60/+80 3.9±0.4 - - - 6 61274 149 930 -120/+150 1.5±0.4 13.6±0.7 48.3±5.1 32(-9+16) 7 61470 194 710 -70/+90 1.9±0.4 32.9±1.6 - - 8 61689 195 1220 -120/+150 2.1±0.4 32.2±1.6 - - 9 61903 263 950 -110/+130 0.8±0.4 - - - 10 62157 266 1280 -140/+180 1.2±0.4 13.8±0.7 40.4±4.2 34(-11/+22)
3.3 Determination of emission factorsEmission factors for NOx were derived from the plume encounters #3, #6, and #10 during the flight on 30 July 2004 (see Table 1) and the multiple plume observed in the ship corridor during the flight on 23 July 2004 (Figure 3, right panel). Emission factors for SO2 were inferred from the plume en-counters #3 and #10. Emission indices (emitted mass per kg fuel burnt) for NOx (as NO2 mass) were calculated using (e.g. Schulte & Schlager, 1996)
EI(NOx) = EI(CO2) 46/44 [NOx]/ [CO2] (1) where EI(CO2) denotes the CO2 emission index, 46 and 44 the mole masses of NO2 and CO2, re-
spectively. [NOx] and [CO2] are the observed enhancements of the mixing ratios in the plumes relative to ambient background concentrations. For [NOx] we used the measured [NOy] and as-sumed no loss of reactive nitrogen in the plumes. The CO2 emission index is known with high accu-racy (3070 ± 20 g CO2 / kg fuel) from the carbon mass fraction in ship fuel (85.1%) and the fraction of carbon that is converted to CO2 for cruise conditions (98.5%). The calculated NOx emission indi-ces are given in Table 2.
Emission factors for SO2 were derived from the ratios of the integrals of the corresponding plume enhancements
EI(SO2) = EI(CO2) 64/44 [SO2]/ [CO2]. (2) Integral ratios needed to be used because of the different time responses of the CO2 and SO2
measurements. The calculated SO2 emission indices are also summarized in Table 2.
Table 2. Summary of emission indices derived from the plume observation. For comparison calculated values are also given.
(a) engine model of manufacturer for measurement conditions, (b) mean all cargo ships (Eyring et al. 2005), (c) from analysis of sulphur content in the fuel sample of the container ship (2.45% by mass), (d) from mean sulphur content of cargo ship fuel (Eyring et al., 2005).
The inferred EI(NOx) values compare well with calculated emission indices for the container ship using the engine emission model of the manufacturer and the known engine operating conditions during the measurements. The SO2 emission factors derived from the integrals of the CO2 and SO2enhancements observed in the plume are lower by 6% and 19% compared to the values calculated
Date,Plume encounter
EI(NOx) measured (g NO2 / kg fuel)
EI(NOx) calculated (g NO2/ kg fuel)
EI(SO2) observed (g SO2/ kg fuel)
EI(SO2) calculated (g SO2/ kg fuel)
30 July, #3 96 ± 14 112 (a) 46 ± 12 49 (c) 30 July, #6 103 ± 15 112 (a) - 49 (c) 30 July, #10 109 ± 16 112 (a) 40 ± 10 49 (c) 23 July, corridor 98 ± 15 86 (b) -
88 SCHLAGER et al.: Aircraft-based Trace Gas Measurements in a Primary European Ship ...
from the known sulphur content in the fuel burnt by the container ship. Considering the estimated errors, however, the emissions factors are still consistent with the values derived from the analysis of the sulphur in the fuel.
4 CONCUSIONS
The measurements in the exhaust trail of a designated source ship and in the ship corridor revealed that aircraft-based observations in ship plumes are possible for plume ages up to about 5 hours. The inferred emission factors for NOx are consistent with reported mean values for the fleet of large container ships. Observed SO2 enhancements in the plumes relative to the CO2 enhancements as a dilution tracer are smaller than calculated values from the known sulphur content in the fuel but still agree within error limits. In order to study SO2 losses in the exhaust plumes further measurements with higher accuracy and for larger plume ages are needed. During the flight transects in the ship corridor very inhomogeneous concentration field were found for trace gasses related to ship emis-sions due to multiple aged plumes. Next year a large aircraft campaign on ship emission will be per-formed in the frame of the EC project QUANTIFY with an extended set of instruments.
REFERENCES
Capaldo, K., J.J. Corbett, P. Kasibhatla, S.N. Pandis, 1999: Effects of ship emissions on sulphur cycling and radiative climate forcing over the ocean, Nature 400, 743-746.
Corbett, J.J., and P.S. Fischbeck, 1997: Emissions from ships, Science 278, 3723-3731. Chen, G., et al. 2005: An investigation of the chemistry of ship emission plumes during ITCT 2002, J. Geo-
phys. Res. 110, doi:10.1029/2004JD005236. Davis, D.D., G. Grodzzinsky, P. Kasibhatla, J. Crawford, G. Chen, S. Liu, A. Bancy, D. Thornton, H. Guan,
S. Sabdholm, 2001: Impact of ship emissions on marine boundary layer NOx and SO2 distributions over the Pacific Basin, Geophys. Res. Lett. 28(2), 235-238.
Eyring, V., H.W. Köhler, J. van Aardenne, A. Lauer, 2005: Emissions from international shipping: 1. The last 50 years, J. Geophys. Res. 110, doi:10.1029/2004JD005619.
Endresen, O., et al., 2003: Emissions from international sea transportation and environmental impact, J. Geophys. Res. 108, doi: 10.1029/2002JD002898.
Fischer, H., et al., 2002: Synoptic tracer gradients in the upper troposphere and lower stratosphere over cen-tral Canada during the Stratosphere-Troposphere Experiment by Aircraft Measurements 1998 summer campaign, J. Geophys. Res. 107, doi:10.1029/200JD000312.
Glasow, V., M. Lawrence, R. Sander, P.J. Crutzen, 2003: Modeling the chemical effects of ship exhaust in the cloud-free marine boundary layer, Atmos Phys. & Chem, Vol 3, 233-250.
Kasibhatla, P., et al., 2000: Do emissions from ships have a significant impact on concentrations of nitrogen oxides in the marine boundary layer? Geophys. Res. Lett. 27, 2229-2232.
Lawrence, M.G., P.J. Crutzen, 1999: Influence of NOx emissions from ships on tropospheric photochemistry and climate, Nature 402, 167-170.
Schlager, H., P.Konopka, P. Schulte, U. Schumann, H. Ziereis, F. Arnold, M. Klemm, D. Hagen, P. White-field, J. Ovarlez, 1997: In situ observations of air traffic emission signatures in the North Atlantic flight corridor, J. Geophys. Res. 102, 10739-10750.
Schulte, P. and H. Schlager, 1996: In-flight measurements of cruise altitude nitric oxide emission indices of commercial jet aircraft, Geophys. Res. Lett. 23, 165-168.
Song, C.H., G. Chen, S.R. Hanna, J. Crawford, D.D. Davis, 2003: Dipersion and chemical evolution of ship plumes in the marine boundary layer: Investigation of O3/NOy/HOx chemistry, J. Geophys. Res. 108, doi: 10.1029/2002JD002216.
Speidel, M, R. Nau, F. Arnold, H. Schlager, A. Stohl, 2006: Aircraft-based atmospheric sulfur dioxide meas-urements during ITOP 2004, J. Geophys. Res. (in preparation).
Wiliams, E., B. Lerner, P. Quinn, T. Bates, 2005: Measurements of gas and particle emissions from commer-cial marine vessels, American Geophysical Union, Fall Meeting 2005, Abstract A51E-0130.
Ziereis, H., H. Schlager, P. Schulte, I. Köhler, R. Marquardt, C. Feigl, 1999: In situ measurements of the NOx distribution and variability over the eastern North Atlantic, J. Geophys. Res. 104, 16,021-16,032.

Proceedings of the TAC-Conference, June 26 to 29, 2006, Oxford, UK 89
Airport Emission Studies of Gaseous and Particulate Emissions
S.C. Herndon, E.C. Wood, M.J. Northway, T.B. Onasch, P.E. Yelvington, R.C. Miake-Lye*
Aerodyne Research, Inc., 45 Manning Road, Billerica, MA 01821 USA W. Berk Knighton Department of Chemistry, Montana State University, Bozeman, MT 59717, USA
Keywords: Airport, runway, NOx, CO, formaldehyde, particles, gaseous, hydrocarbon, emissions
ABSTRACT: Dedicated tests to measure the emissions from aircraft engines are costly due to high fuel and equipment costs, require specialized probes and support structures, and are generally logis-tically complex. On the other hand, in-service aircraft are routinely being operated using normal procedures at any active airport. Several recent studies have used the transport of prevailing winds to carry the airplane emissions to a suite of sensitive, fast time response measurement instruments. By identifying individual aircraft tail numbers, the measured emissions can be tied to the specific engines being operated, without interfering with airport operations. A description of such airport tests and the type of results obtained from advected plume studies using a suite of measurement in-struments are presented. Distinct differences in emission quantities can be discerned for differing aircraft types, especially notable in particle property signatures of older versus newer airplanes.
1 MEASURING IN-SERVICE AIRCRAFT EMISSIONS AT AIRPORTS
While dedicated engine tests are very useful for obtained detailed emissions measurements at pre-cisely defined engine operation conditions, making measurements of in-service airplanes as they carry our their routine operations has several significant advantages. The measurement of aircraft engine plumes advected by the wind to strategically placed instruments allows data during actual operation to be obtained with no cost or burden on the normal operations of the airplanes or airport. Not only are the planes being operated as they are normally but the emissions are also captured at downwind locations in ways that account for the mixing, dilution, and emission evolution that occur as the emissions are processed in the atmosphere.
In order to make such advected plume emission measurements, the instrumentation must be sen-sitive enough to measure the diluted species concentrations and must have sufficient time resolution to capture a reliable signal during the time while the plume concentrations are elevated. Positioning the instrumentation must be planned based on the prevailing wind direction and an understanding of where the emissions are released from the airplane during the various aircraft operational modes. In tests to date, measurements during idle, taxi, take-off, and landing have all been obtained.
Several advected plume airport emission measurements have been made in the past several years (Herndon et al., 2004, 2005, 2006, ARB 2006). Most recently in August 2005, the JETS/APEX2 se-ries of tests were performed at Oakland International Airport by a consortium of measurement teams, with significant support and interaction with the Port of Oakland and Southwest Airlines, supported by the California Air Resources Board, NASA, FAA, EPA, and DoD. Both dedicated en-gines tests (not discussed here) and advected plume studies were performed. The latter were carried out by The University of Missouri, Rolla’s Center of Excellence on PM Reduction Research, and included personnel from UMR, Aerodyne, and NASA. Figure 1 indicates the general arrangement used for advected plume studies in that series of measurements. The prevailing winds were at a shallow angle to the axis of the primary runway, which allowed a measurement site to be identified
* Corresponding author: R.C. Miake-Lye, Aerodyne Research, Inc., 45 Manning Road, Billerica, MA 01821 USA. Email: [email protected]

90 HERNDON et al.: Airport Emission Studies of Gaseous and Particulate Emissions
that would allow plumes to be captured for airplanes taxiing to the runway, for idling prior to take-off, during take-off itself, and for airplanes landing on that same runway.
Figure 1. Measurements were made at the Oakland International Airport in JETS/APEX2. Dedicated engine tests (not presented here) were performed in the Ground Run-up Enclosure (GRE) with support of Southwest Airlines and the Port of Oakland. Runway tests on advected plumes as reported here were performed at the southeast end of the primary runway.
By recording the aircraft identifying tail number, specific airframe and engine information for the emitting aircraft could be obtained. The wind direction and speed, in concert with video recordings of the upwind field of view, were used to unambiguously identify the timing and source of any in-dividual plume. Each arriving plume was measured by fast time response instruments to record both gaseous and particle emissions from the subject aircraft. The measured emissions include NOx, CO, several hydrocarbon species, and a variety of particle parameters. Particle measurements by Aero-dyne include black carbon (using Multi-Angle Absorption Photometry, MAAP), particle number (using a Condensation Particle Counter, CPC), and non-refractory aerosol composition and size (us-ing an Aerosol Mass Spectrometer, AMS).
2 EI ANALYSIS BASED ON TIME RESOLVED CONCENTRATION MEASUREMENTS
Advected aircraft engine plumes are swept by the measurement station, lasting seconds to minutes with varying concentration histories that depend on the plume dilution and how the plume is trans-ported past the sampling probe. In order to determine the relationship between the measured species and the emissions performance of the engine, Emission Indices (EIs) are determined. These are cal-culated using the correlation between any individual measurement and the CO2 concentration measured for the sample exhaust sample. CO2 provides a direct indication of the amount of fuel consumed in generating those emissions, where ideal combustion can be assumed or correction can be applied to account for combustion inefficiencies, usually very small for aircraft gas turbine en-gines. Thus by plotting the species of interest versus CO2, EIs can be obtained from the slope of their correlation, independent of the dilution history or plume structure.

HERNDON et al.: Airport Emission Studies of Gaseous and Particulate Emissions 91
Figure 2 demonstrates the basis of determining EIs for gaseous species in a plume. The top panel includes time series for CO2, CO, NO2, and NO, which are all put on the same time basis to gener-ate the correlations in the bottom panel. Linear fits to each of the concentration histories provide EIs for the pronounced peak in the emissions curves. Some of the scatter in the correlation plots at lower CO2 values can be attributed to overlap of an idle plume (at 11:55:300) overlapping with the more pronounced take-off plume. This type of analysis allows such interference to be identified and removed during data processing. In addition, such correlative analysis also automatically accounts for varying background levels in all species of interest as long at that variation is slow compared to the plume passage times.
Figure 2. EIs are determined by plotting the species of interest against CO2, and using the slope of the linear fit to calculate an EI. The species and CO2 must both be analyzed on the same time basis, accounting for dif-ferent instrument response times and any time shifts due to instrument or line delays.
Similar analysis is performed on the particle data. Figure 3 shows correlations for both MAAP (black carbon mass) and CPC data (particle number), for two overlapping plumes. While the dis-tinct nature of the two events (full versus open symbols) is more apparent in the CPC data, the MAAP fit would also be affected if that bimodal nature of the combination of two plumes were not properly taken into account. Such overlapping plumes were not very frequent during JETS/APEX2, since Oakland is a smaller hub that primarily uses a single runway. However, examination of the data in this manner is important to exclude such interferences when they occur and also to be sure that a linear correlation is obtained, indicating that time shifts and instrument effects are properly included and a reliable EI has been obtained.

92 HERNDON et al.: Airport Emission Studies of Gaseous and Particulate Emissions
Figure 3. Particle parameter EIs are obtained from plots versus CO2, here showing a two-plume event. The bimodal nature is most obvious in the CPC data (open versus closed symbols), but even the MAAP data would be affected if the entire data set were fit as a single plume event.
3 RESULTS
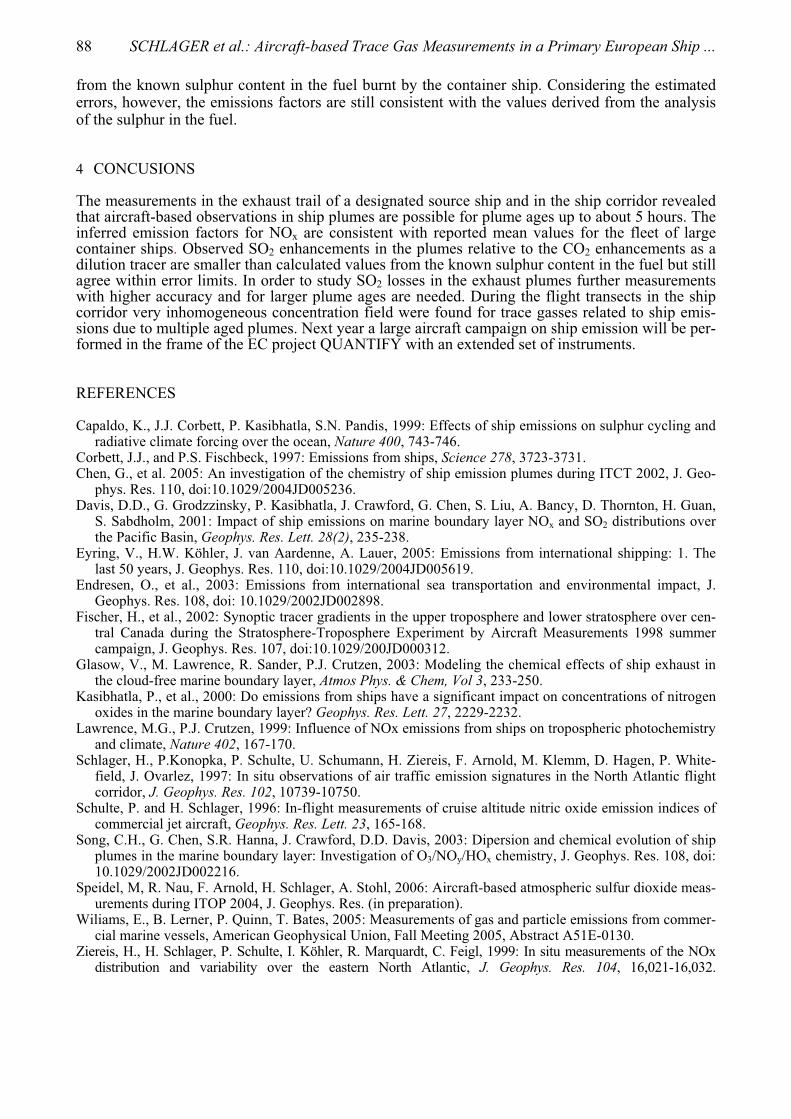
Figure 4 shows a time series that includes both an idle plume and a take-off plume. The idle plume (left event) is enhanced in CO, formaldehyde, and ethylene relative to the take-off plume (right event), in both cases accounting for CO2 levels. Also of interest is that most of the NOx is present as NO2 in the idle plume, while more NOx is present as NO in the take-off plume.
HERNDON et al.: Airport Emission Studies of Gaseous and Particulate Emissions 93
Figure 4. Time traces for gaseous species are presented for both an idle plume event (4:18:00 to 4:19:30) and a take-off plume event (4:20:00 to 4:21:00). The composition is enhanced in HCs for idle and the NO2/NOratio is significant higher (shifted to NO2) for idle conditions.
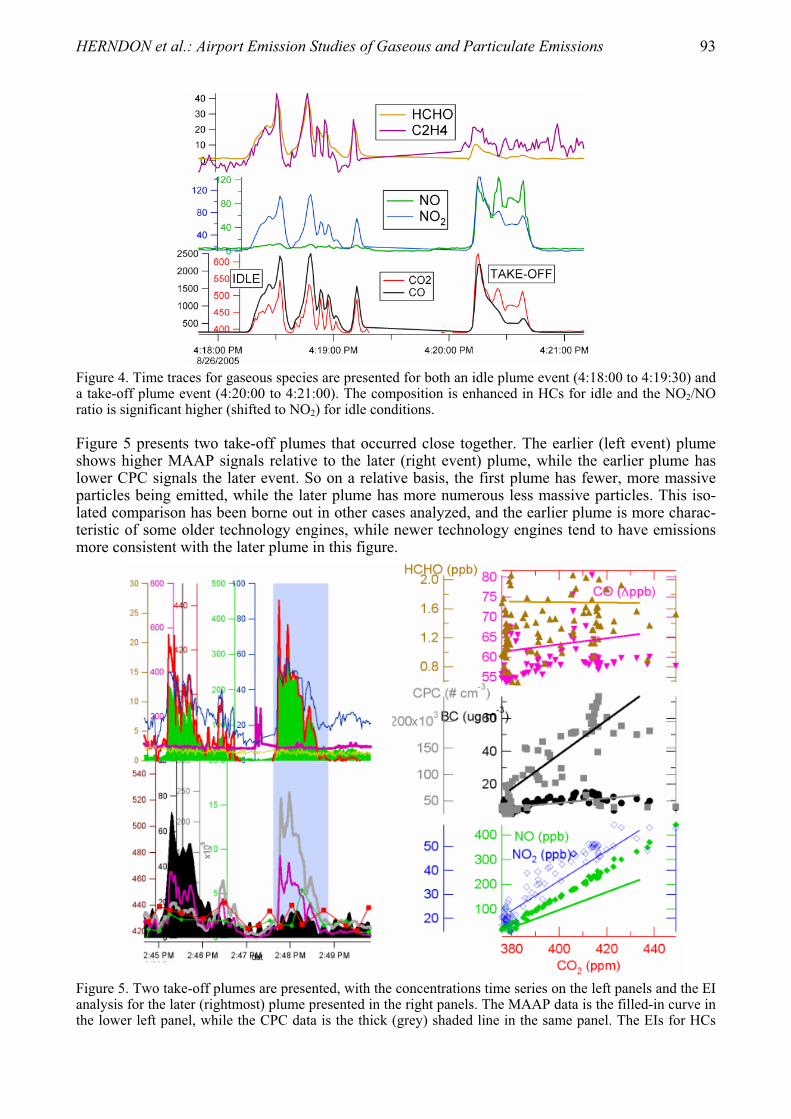
Figure 5 presents two take-off plumes that occurred close together. The earlier (left event) plume shows higher MAAP signals relative to the later (right event) plume, while the earlier plume has lower CPC signals the later event. So on a relative basis, the first plume has fewer, more massive particles being emitted, while the later plume has more numerous less massive particles. This iso-lated comparison has been borne out in other cases analyzed, and the earlier plume is more charac-teristic of some older technology engines, while newer technology engines tend to have emissions more consistent with the later plume in this figure.
Figure 5. Two take-off plumes are presented, with the concentrations time series on the left panels and the EI analysis for the later (rightmost) plume presented in the right panels. The MAAP data is the filled-in curve in the lower left panel, while the CPC data is the thick (grey) shaded line in the same panel. The EIs for HCs

94 HERNDON et al.: Airport Emission Studies of Gaseous and Particulate Emissions
are very small for these take-off plumes, while NOx and particle EIs are significant and different for each plume. The top curves in the left panel show several gaseous species.
4 CONCLUSIONS AND NEXT STEPS
A comprehensive emissions suite has been effectively employed in non-interfering runway studies and individual engine/airframe combinations have been identified for the specific emissions events that were captured. Multiple analyses are possible using the EIs that have been obtained using cor-relation between the species of interest and the measured CO2 concentration in the sampled exhaust. Because the airframe/engine combination was determined, through the subject aircraft’s tail num-ber, the emissions values can be compared to the ICAO databank. Further, individual signatures for particular engine types may be determined, and statistical information on the emissions perform-ance for specific engine/airframes and on averages, variation, and correlation of emissions with maintenance history may all be possible with sufficient airport emissions data.
ACKNOWLEDGMENTS
Sponsorship of NASA, CARB, FAA and the UMR Center of Excellence for Aerospace Particulate Emission Reduction Research is gratefully acknowledged. Support and interaction with the various mission team members, including airports, airlines (notably Port of Oakland and Southwest Airlines for JETS/APEX2 results) and other research teams contributed greatly to the overall missions’ suc-cesses.
REFERENCES
ARB, 2006 The Development of Exhaust Speciation Profiles for Commercial Jet Engines, Final report in press.
Herndon, S.C., J.H. Shorter, M.S. Zahniser, D.D. Nelson, J.T. Jayne, R.C. Brown, R.C. Miake-Lye, I.A Waitz, P. Silva, T. Lanni, K.L. Demerjian, and C.E. Kolb, 2004: NO and NO2 emission ratios measured from in-use commercial aircraft during taxi and takeoff, Environ. Sci. Technol. 38, 6078-6084.
Herndon, S.C., T.B. Onasch, B.P. Frank, L.C. Marr, J.T. Jayne, M.R. Canagaratna, J. Grygas, T. Lanni, B.E. Anderson, D.R. Worsnop, and R.C. Miake-Lye, 2005: Particulate emissions from in-use commercial air-craft, Aerosol. Sci. Technol. 39, 799-809.
Herndon, S.C., T. Rogers, E.J. Dunlea, J.T. Jayne, R.C. Miake-Lye, and B. Knighton, 2006: Hydrocarbon emissions from in-use commercial aircraft during airport operation, Environ. Sci. Technol. 40, 4406-4413.
Proceedings of the TAC-Conference, June 26 to 29, 2006, Oxford, UK 95
PM Emissions from Advected Aircraft Plumes at the Oakland International Airport
P.D. Whitefield*, P. Lobo, D.E. Hagen University of Missouri – Rolla Center of Excellence for Aerospace Particulate Emissions Reduction Research, Rolla, MO, USA
Keywords: Aircraft, PM emissions, plumes, Oakland
ABSTRACT: At an airport study conducted at the Oakland International Airport (OAK) in August 2005, aircraft PM emissions data was gathered during a twelve hour period of normal daylight taxi and run- way operations. The prevailing wind was from the W/NW and the sampling location was situated downwind of the eastern end of the runway at OAK. The location selected for sampling the advected plumes was unique in the sense that it provided an opportunity to measure emissions as aircraft taxied to departure, departed, and landed on the single runway. Real-time PM and emission gas measurements, provided emission factors, size distributions and chemistry for over 300 aircraft under normal operating conditions. Aircraft tail numbers were also recorded for identification of the airframe and engine. This paper discusses the physical characteristics of the PM detected for the most common aircraft type operating at OAK, the B737.
1 INTRODUCTION
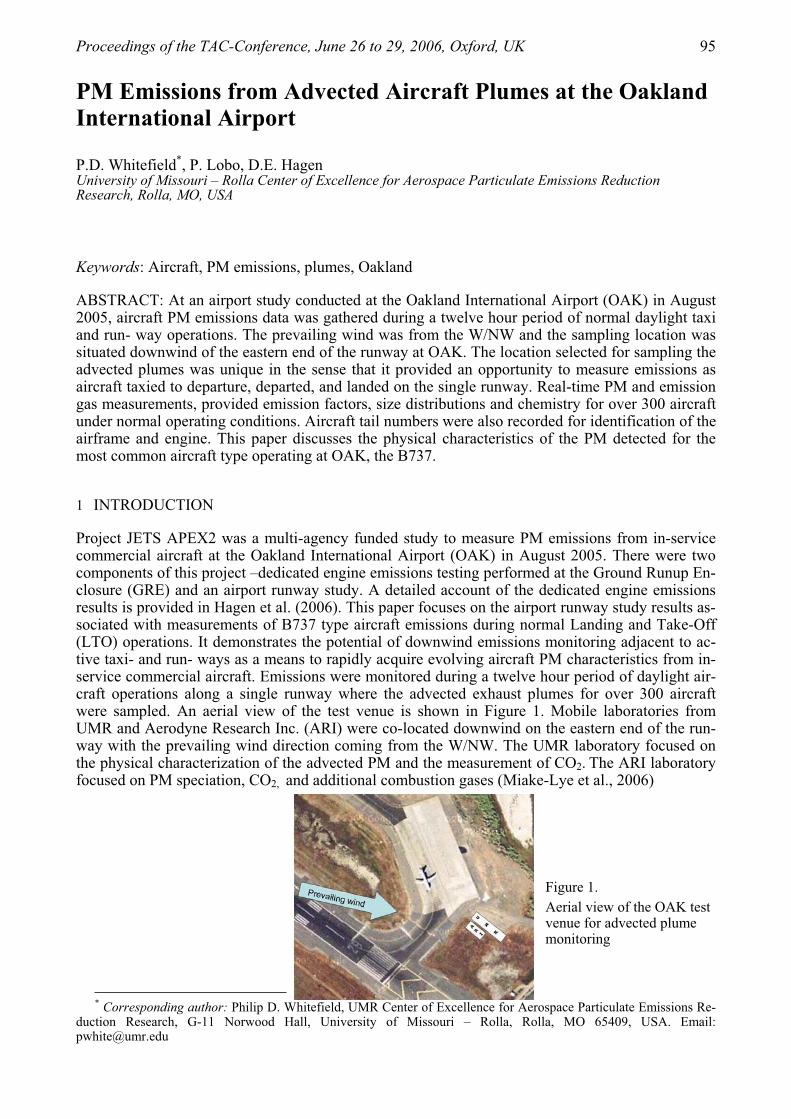
Project JETS APEX2 was a multi-agency funded study to measure PM emissions from in-service commercial aircraft at the Oakland International Airport (OAK) in August 2005. There were two components of this project –dedicated engine emissions testing performed at the Ground Runup En-closure (GRE) and an airport runway study. A detailed account of the dedicated engine emissions results is provided in Hagen et al. (2006). This paper focuses on the airport runway study results as-sociated with measurements of B737 type aircraft emissions during normal Landing and Take-Off (LTO) operations. It demonstrates the potential of downwind emissions monitoring adjacent to ac-tive taxi- and run- ways as a means to rapidly acquire evolving aircraft PM characteristics from in-service commercial aircraft. Emissions were monitored during a twelve hour period of daylight air-craft operations along a single runway where the advected exhaust plumes for over 300 aircraft were sampled. An aerial view of the test venue is shown in Figure 1. Mobile laboratories from UMR and Aerodyne Research Inc. (ARI) were co-located downwind on the eastern end of the run-way with the prevailing wind direction coming from the W/NW. The UMR laboratory focused on the physical characterization of the advected PM and the measurement of CO2. The ARI laboratory focused on PM speciation, CO2, and additional combustion gases (Miake-Lye et al., 2006)
Figure 1.Aerial view of the OAK test venue for advected plume monitoring
* Corresponding author: Philip D. Whitefield, UMR Center of Excellence for Aerospace Particulate Emissions Re-duction Research, G-11 Norwood Hall, University of Missouri – Rolla, Rolla, MO 65409, USA. Email: [email protected]

96 WHITEFIELD et al.: PM Emissions from Advected Aircraft Plumes at the Oakland Int. Airport
2 INSTRUMENTATION SUITE
UMR has developed a state-of-the-art mobile diagnostic facility and a sophisticated sampling meth-odology for nanometre scale PM optimized for jet engine exhaust characterization (Schmid et al., 2004; Lobo et al. 2006). The instrumentation consists of a stat-of-the-art fast particulate spectrome-ter (Cambustion DMS500) to gather real–time size distribution information and total concentration of engine exhaust PM; a differential mobility analyzer (DMA) (TSI model 3071), a more traditional tool for particle size measurement, sacrificing speed for greater sensitivity when compared to the DMS500; Condensation Particle Counters (CPCs) (TSI models 3022 and 3025 ) to measure total number concentration; a fast response carbon dioxide (CO2 ) detector (Sable Systems model CA-2A) to monitor sample dilution and establish emission factors; and a weather station to monitor the ambient conditions of temperature, relative humidity, pressure, and wind speed and direction.
3 RUNWAY STUDY RESULTS
A total of 300 aircraft landings and departures were detected and monitored during the period from 7am – 7pm on Friday, August 26, 2005. The distribution of landings and departures as a function of time is presented in Figure 2a. Aircraft tail numbers and operational status (i.e. taxi, takeoff, and landing) were acquired through visual observation including video recordings. Aircraft specific air-frame and engine data were obtained by correlating these tail numbers with a Federal Aviation Ad-ministration (FAA) database. Figure 2b. illustrates the distribution of aircraft types operating at OAK on that day. 15 different airframe types were operating, of which approximately 63% of the aircraft were B737 type. The analysis in this paper will be limited to B737 airframes only.
Figure 2a and 2b. Distributions of aircraft activity as a function of time (2a) and airframe (2b)
WHITEFIELD et al.: PM Emissions from Advected Aircraft Plumes at the Oakland Int. Airport 97
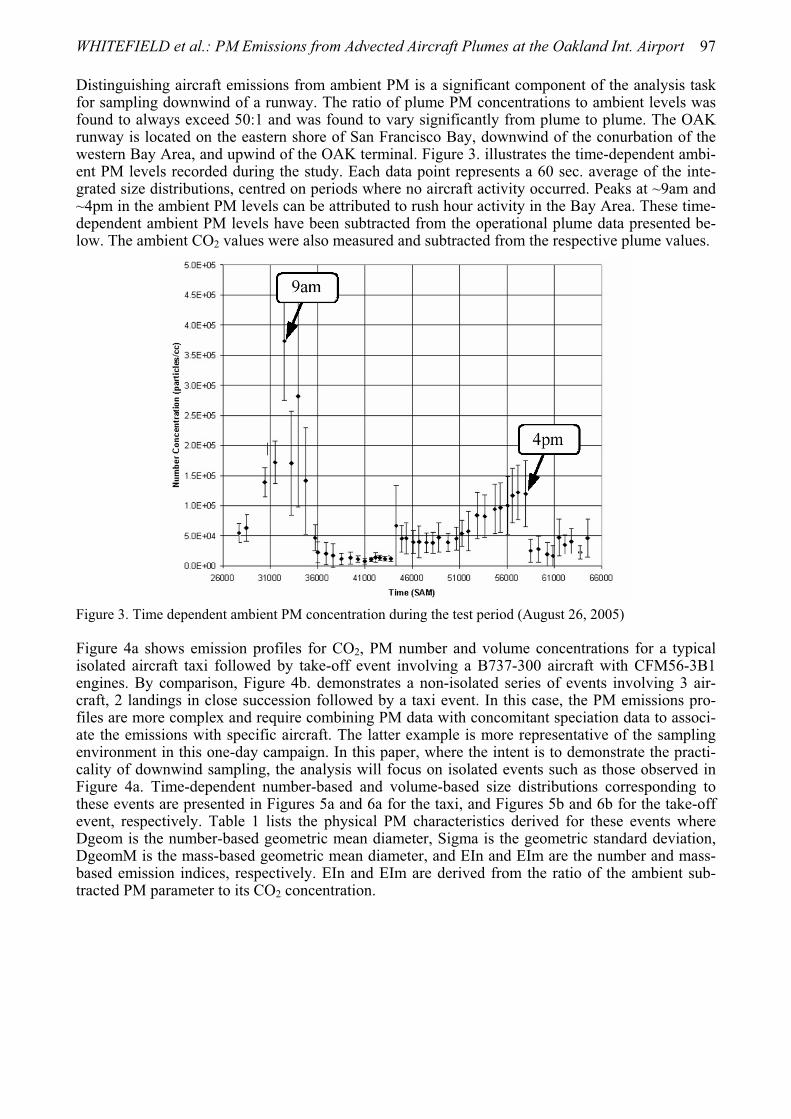
Distinguishing aircraft emissions from ambient PM is a significant component of the analysis task for sampling downwind of a runway. The ratio of plume PM concentrations to ambient levels was found to always exceed 50:1 and was found to vary significantly from plume to plume. The OAK runway is located on the eastern shore of San Francisco Bay, downwind of the conurbation of the western Bay Area, and upwind of the OAK terminal. Figure 3. illustrates the time-dependent ambi-ent PM levels recorded during the study. Each data point represents a 60 sec. average of the inte-grated size distributions, centred on periods where no aircraft activity occurred. Peaks at ~9am and ~4pm in the ambient PM levels can be attributed to rush hour activity in the Bay Area. These time-dependent ambient PM levels have been subtracted from the operational plume data presented be-low. The ambient CO2 values were also measured and subtracted from the respective plume values.
Figure 3. Time dependent ambient PM concentration during the test period (August 26, 2005)
Figure 4a shows emission profiles for CO2, PM number and volume concentrations for a typical isolated aircraft taxi followed by take-off event involving a B737-300 aircraft with CFM56-3B1 engines. By comparison, Figure 4b. demonstrates a non-isolated series of events involving 3 air-craft, 2 landings in close succession followed by a taxi event. In this case, the PM emissions pro-files are more complex and require combining PM data with concomitant speciation data to associ-ate the emissions with specific aircraft. The latter example is more representative of the sampling environment in this one-day campaign. In this paper, where the intent is to demonstrate the practi-cality of downwind sampling, the analysis will focus on isolated events such as those observed in Figure 4a. Time-dependent number-based and volume-based size distributions corresponding to these events are presented in Figures 5a and 6a for the taxi, and Figures 5b and 6b for the take-off event, respectively. Table 1 lists the physical PM characteristics derived for these events where Dgeom is the number-based geometric mean diameter, Sigma is the geometric standard deviation, DgeomM is the mass-based geometric mean diameter, and EIn and EIm are the number and mass-based emission indices, respectively. EIn and EIm are derived from the ratio of the ambient sub-tracted PM parameter to its CO2 concentration.

98 WHITEFIELD et al.: PM Emissions from Advected Aircraft Plumes at the Oakland Int. Airport
Figure 4a and 4b. Emissions profiles (CO2, PM-number, PM-volume) for the taxi and take-off of plumes for one aircraft (4a), and for two landings and one taxi event occurring in rapid succession (4b)
Figure 5a and 5b. Time dependent number-based size distributions for the events shown in Figure 4a
WHITEFIELD et al.: PM Emissions from Advected Aircraft Plumes at the Oakland Int. Airport 99
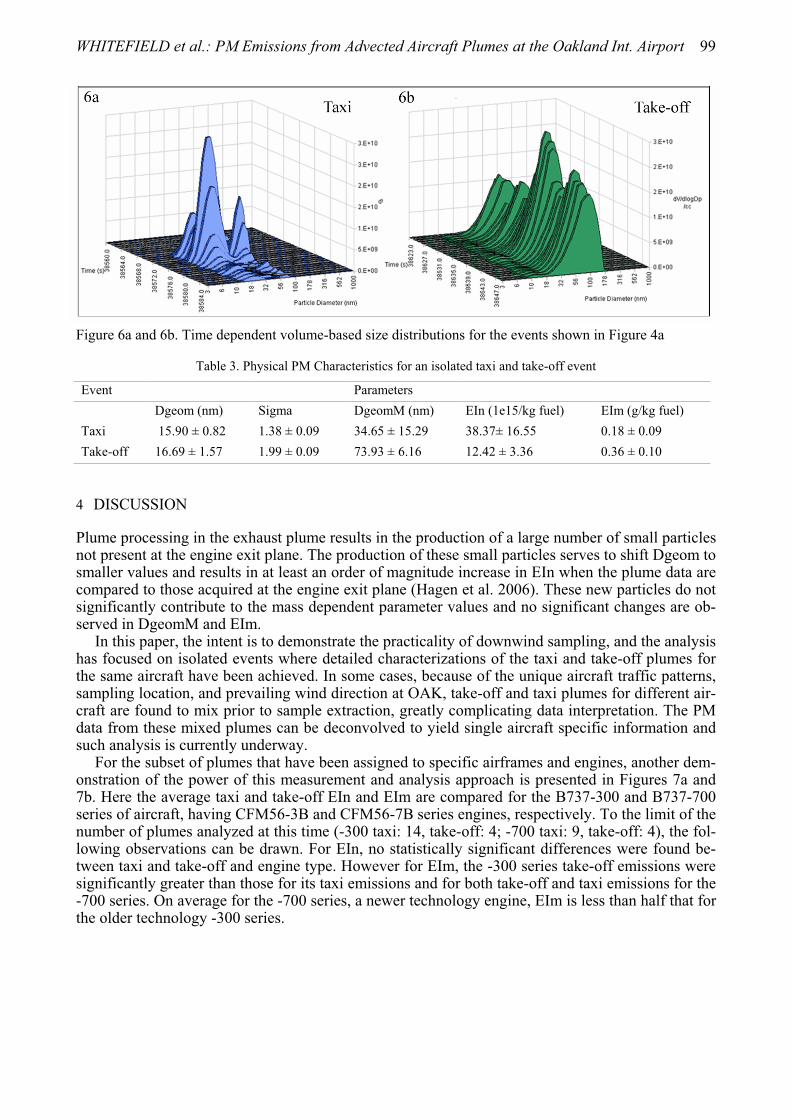
Figure 6a and 6b. Time dependent volume-based size distributions for the events shown in Figure 4a
Table 3. Physical PM Characteristics for an isolated taxi and take-off event
Event Parameters Dgeom (nm) Sigma DgeomM (nm) EIn (1e15/kg fuel) EIm (g/kg fuel) Taxi 15.90 ± 0.82 1.38 ± 0.09 34.65 ± 15.29 38.37± 16.55 0.18 ± 0.09 Take-off 16.69 ± 1.57 1.99 ± 0.09 73.93 ± 6.16 12.42 ± 3.36 0.36 ± 0.10
4 DISCUSSION
Plume processing in the exhaust plume results in the production of a large number of small particles not present at the engine exit plane. The production of these small particles serves to shift Dgeom to smaller values and results in at least an order of magnitude increase in EIn when the plume data are compared to those acquired at the engine exit plane (Hagen et al. 2006). These new particles do not significantly contribute to the mass dependent parameter values and no significant changes are ob-served in DgeomM and EIm.
In this paper, the intent is to demonstrate the practicality of downwind sampling, and the analysis has focused on isolated events where detailed characterizations of the taxi and take-off plumes for the same aircraft have been achieved. In some cases, because of the unique aircraft traffic patterns, sampling location, and prevailing wind direction at OAK, take-off and taxi plumes for different air-craft are found to mix prior to sample extraction, greatly complicating data interpretation. The PM data from these mixed plumes can be deconvolved to yield single aircraft specific information and such analysis is currently underway.
For the subset of plumes that have been assigned to specific airframes and engines, another dem-onstration of the power of this measurement and analysis approach is presented in Figures 7a and 7b. Here the average taxi and take-off EIn and EIm are compared for the B737-300 and B737-700 series of aircraft, having CFM56-3B and CFM56-7B series engines, respectively. To the limit of the number of plumes analyzed at this time (-300 taxi: 14, take-off: 4; -700 taxi: 9, take-off: 4), the fol-lowing observations can be drawn. For EIn, no statistically significant differences were found be-tween taxi and take-off and engine type. However for EIm, the -300 series take-off emissions were significantly greater than those for its taxi emissions and for both take-off and taxi emissions for the -700 series. On average for the -700 series, a newer technology engine, EIm is less than half that for the older technology -300 series.

100 WHITEFIELD et al.: PM Emissions from Advected Aircraft Plumes at the Oakland Int. Airport
Figure 7a and 7b. Averaged taxi and take-off EIns (7a) and EIms (7b) for B737-300 and B737-700 aircraft monitored
5 CONCLUSION
The work described in this paper clearly demonstrates the potential of downwind emissions moni-toring adjacent to active taxi- and run- ways as a means to rapidly acquire detailed and aircraft spe-cific information related to the evolving plumes advected from in-service commercial aircraft under normal operational conditions.
ACKNOWLEGEMENTS
The authors would like to acknowledge the sponsorship of California Air Resources Board, Na-tional Aeronautics and Space Administration, Federal Aviation Administration and the UMR Cen-ter of Excellence for Aerospace Particulate Emission Reduction Research throughout the work de-scribed in this paper.
REFERENCES
Hagen, D., Lobo, P., and Whitefield, P. (2006). “Physical Characterization of PM emissions from In-Service Commercial Gas Turbine Engines – Projects APEX and JETS APEX2”. 2006 TAC Conf Proc.
Lobo, P., Hagen, D.E., and Whitefield, P.D. (2006). Physical characterization of aerosol emissions from a Commercial Gas Turbine Engine – Project APEX. submitted to the Journal of Propulsion and Power.
Miake-Lye, R.C., Herndon, S.C., Knighton, W.B., Onasch, T.B., Jayne, J.T., Northway, M.J., and Wood, E.C. (2006). “Airport Emission Studies of Gaseous and Particulate Emissions”. 2006 TAC Conf Proc.
Schmid, O., Hagen, D., Whitefield, P., Trueblood, M., Rutter, A., and Lilenfeld, H. (2004). “Methodology for particle characterization in the exhaust flow of gas turbine engines”, Aerosol Sci. & Technol.,38:1108-1122.
Proceedings of the TAC-Conference, June 26 to 29, 2006, Oxford, UK 101
Water- H2 SO4- soot interaction in aircraft plume
O.B. Popovicheva*, N.M. Persiantseva,Institute of Nuclear Physics, Moscow State University, Moscow, Russia
A.M Starik Central Institute of Aviation Motors, Moscow, Russia
N.K. Shonija Chemical Department, Moscow State University, Moscow, Russia
Keywords: Aircraft exhaust soot, Soot properties, Water uptake, CCN
ABSTRACT: This report presents the review of results obtained from 1) laboratory studies of water uptake by original aircraft –generated soot at the conditions of cooling and saturated plume, 2) modeling studies of H2SO4 accumulation on the surface of exhaust soot particles due to coagulation with sulfate aerosols and H2SO4/H2O heterogeneous nucleation, and 3) laboratory studies of H2SO4chemical processing of soot particles toward their hygroscopicity.
1 INTRODUCTION
A major source of uncertainties in assessing of aircraft impact on climate change is the emission of aerosols which may induce significant perturbations in cloudiness and the Earth’s radiation balance. Aviation-produced soot aerosols are suspected to enhance the contrail and cirrus cloud formation (Schumann et al., 2002; Hendricks et al., 2005). Analysis of ice residuals in contrails (Petzold et al., 1998) and the properties of ice-nucleating aerosols from aircraft plume (Chen et al., 1998) exhibits that soot particles facilitate the contrail formation. Optical observations of an internal mixture of ice-BC aerosols in the plume (Kuhn et al., 1998) directly confirm theoretical model predictions showing (Kärcher et al., 1996) that the exhaust soot particles can serve as cloud condensation nuclei (CCN). The quantification of this impact has been advanced but the state of scientific understanding is still poor, mainly because of the lack of explanations for a number of observations such as 1)why the supersaturation with respect to water is needed for visible contrail formation (Kärcher et al. (1998), 2) is it true that ~ 1/3 proportion of exhaust soot particles (but not all) acts as ice nuclei in contrails (Schroder et al., 1998), and 3) why the changes in the value of Fuel Sulfur Content (FSC) have a small impact on the contrail formation threshold (Schumann et al., 2002).
The main reason for this disadvantage is insufficient studies of the water uptake and ice nucleat-ing ability of exhaust soot aerosols. The lack of experimental data on hydroscopic properties of soot particles produced by aircraft engines led some investigators (Kärcher et al., 1996; Gleitsmann and Zellner, 1998) to assumption about hydrophobic nature of the surface of engine-generated soot par-ticles. Various activation pathways were proposed to facilitate the ice particle formation on a hy-drophobic soot particle surface (Kärcher et al., 1996, 1998). Numerical modeling demonstrated that coagulation of homogeneously nucleated sulfate aerosols with soot particles, binary H2SO4/H2Oheterogeneous nucleation, and direct deposition of sulfuric acid molecules may have a pronounced effect on the activation of soot particles by creating a liquid solution coating on their surface. How-ever, no visible difference in the appearance of contrail was found at low and normal FSC (Schu-mann et al., 1996). Moreover, there is no any explanation of the existence of the fraction of exhaust soot particles acting as ice nuclei in contrails (Schroder et al., 1998). This is why it is more reason-able to assume the initial heterogeneities of emitted soot particles in respect to their ability to up-take water molecules and to consider the ways for natural water condensation on the hydrophilic fraction of soot particles.
* Corresponding author: Olga B. Popovicheva, Institute of Nuclear Physics, Moscow State University, 199 992, Moscow, Russia. Email: [email protected]
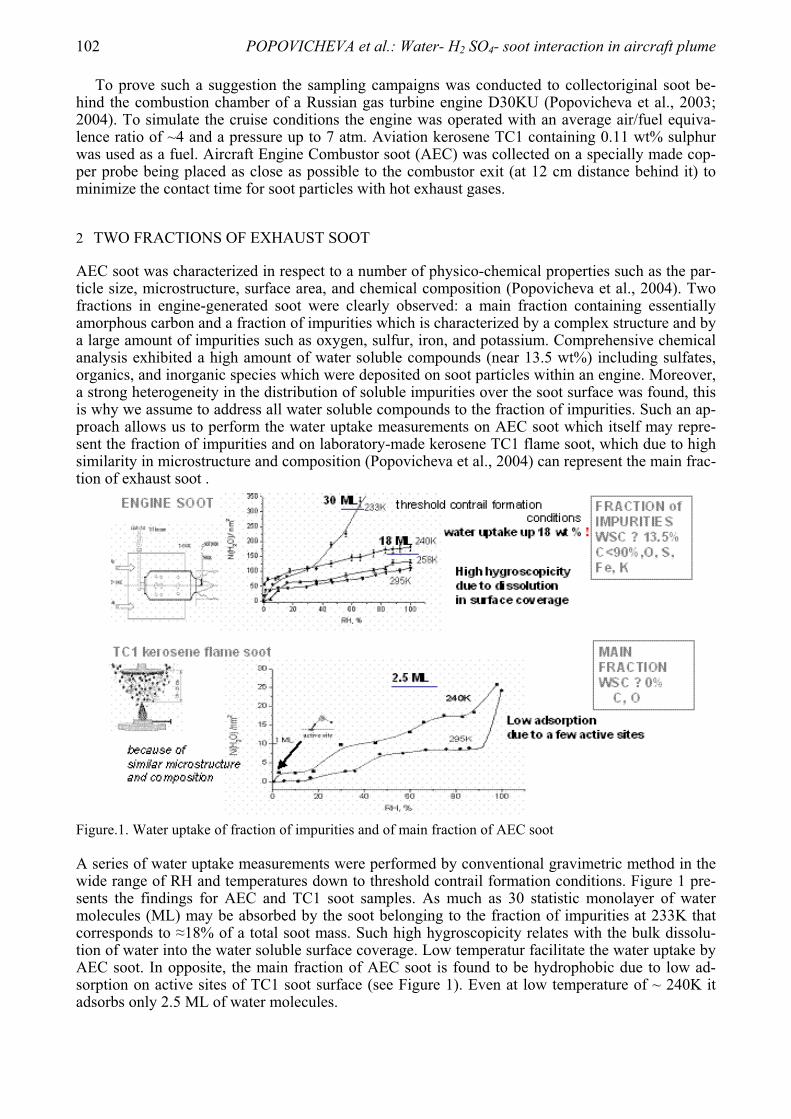
102 POPOVICHEVA et al.: Water- H2 SO4- soot interaction in aircraft plume
To prove such a suggestion the sampling campaigns was conducted to collectoriginal soot be-hind the combustion chamber of a Russian gas turbine engine D30KU (Popovicheva et al., 2003; 2004). To simulate the cruise conditions the engine was operated with an average air/fuel equiva-lence ratio of ~4 and a pressure up to 7 atm. Aviation kerosene TC1 containing 0.11 wt% sulphur was used as a fuel. Aircraft Engine Combustor soot (AEC) was collected on a specially made cop-per probe being placed as close as possible to the combustor exit (at 12 cm distance behind it) to minimize the contact time for soot particles with hot exhaust gases.
2 TWO FRACTIONS OF EXHAUST SOOT
AEC soot was characterized in respect to a number of physico-chemical properties such as the par-ticle size, microstructure, surface area, and chemical composition (Popovicheva et al., 2004). Two fractions in engine-generated soot were clearly observed: a main fraction containing essentially amorphous carbon and a fraction of impurities which is characterized by a complex structure and by a large amount of impurities such as oxygen, sulfur, iron, and potassium. Comprehensive chemical analysis exhibited a high amount of water soluble compounds (near 13.5 wt%) including sulfates, organics, and inorganic species which were deposited on soot particles within an engine. Moreover, a strong heterogeneity in the distribution of soluble impurities over the soot surface was found, this is why we assume to address all water soluble compounds to the fraction of impurities. Such an ap-proach allows us to perform the water uptake measurements on AEC soot which itself may repre-sent the fraction of impurities and on laboratory-made kerosene TC1 flame soot, which due to high similarity in microstructure and composition (Popovicheva et al., 2004) can represent the main frac-tion of exhaust soot .
Figure.1. Water uptake of fraction of impurities and of main fraction of AEC soot
A series of water uptake measurements were performed by conventional gravimetric method in the wide range of RH and temperatures down to threshold contrail formation conditions. Figure 1 pre-sents the findings for AEC and TC1 soot samples. As much as 30 statistic monolayer of water molecules (ML) may be absorbed by the soot belonging to the fraction of impurities at 233K that corresponds to 18% of a total soot mass. Such high hygroscopicity relates with the bulk dissolu-tion of water into the water soluble surface coverage. Low temperatur facilitate the water uptake by AEC soot. In opposite, the main fraction of AEC soot is found to be hydrophobic due to low ad-sorption on active sites of TC1 soot surface (see Figure 1). Even at low temperature of ~ 240K it adsorbs only 2.5 ML of water molecules.

POPOVICHEVA et al.: Water- H2 SO4- soot interaction in aircraft plume 103
3 UPDATE MODEL OF WATER-SOOT INTERACTION
The concept of separation of emitted soot particles into two fractions: fraction of impurities with high hygroscopicity and main fraction with low water uptake ability allow us to build the update model for interaction of water molecules with soot particles in aircraft plume presented in Scheme 1.
Scheme 1. Update model of water –soot interaction in aircraft plume.
Water molecule uptake by the fraction of impurities leads to formation of the liquid solution on the soot surface that is a prerequisite for the CCN formation at the reaching the conditions of water va-por supersaturation in the cooling plume. The following freezing of solution coverage facilitates the ice nucleation on this fraction of exhaust soot particles in the condensation - freezing mode. How-ever, the soot particles of the main fraction are likely to be remained inactivated due to low water molecule uptake and can not act as CCN if they do not contain some hygroscopic gaseous com-pounds (like a sulfuric acid), which may be accumulated on the soot surface due to gas- to –surface interaction. To address the question arising how H2SO4 activation for hydrophobic soot particles may be effective due to plume proceeding, the additional theoretical and experimental studies have been carried out.
4 MODEL OF H2SO4 – SOOT INTERACTION
A quasi-one dimensional model (Starik et al., 2004) for a B-747 aircraft plume at cruise was used with emission parameters described in Savel’ev et al., 1999. At RH>50% in the ambient atmos-phere the threshold contrail formation conditions are reached at 100-200 m distance from the nozzle exit when the aircraft plume is cooled down to temperatures of ~ 240-233 . Chemical transforma-tion of 70 gaseous species, binary H2O/H2SO4 homogeneous nucleation, condensation growth of sulfate aerosols, their coagulation with soot particles, and heterogeneous nucleation of H2O and H2SO4 on the soot particle surface were addressed. Measurements of the contact angle, , of a sulfu-ric acid droplet on TC1 soot surface were accompanied the theoretical studies to provide the pa-rameters needed for the classical theory of heterogeneous nucleation. The variation of for sulfuric acid with weight persent, wt% ,can be approximated by the expression
320 %%% wtDwtCwtB ,

104 POPOVICHEVA et al.: Water- H2 SO4- soot interaction in aircraft plume
where 0 is the water droplet contact angle, 0=67.67 B, C, D are coefficients: B=0.068, C=0.018, D=3.6·10-4. We did not take into account the direct deposition of gaseous H2SO4 on soot particle surface in our model because our additional experiments have shown the negligible amount of sul-furic acid molecules adsorbed on TC1 soot at the H2SO4 concentration of ~1012 cm-3 in the young plume. It was found that the amount of sulfuric acid accumulated on the unit area of the soot particle sur-face due to both heterogeneous binary H2O/H2SO4 nucleation and coagulation of soot particles with sulfate aerosols strongly depends on the particle radius. The evolution of the total amount of sulfu-ric acid accumulated on the surface of the whole ensemble of exhaust soot particles, t
4SO2H, along
the plume for medium and high FSC is shown in Figure 2. The size distribution of soot particles was assumed to be lognormal with median radius of 25 nm and geometric standard deviation of 1.56. The total concentration of soot particles at the engine exit was assumed to be equal 4 106 cm-3. The maximum value of t
4SO2H at high FSC at the contrail formation threshold corresponds to
~0.2 wt% of the soot mass if we take into account the surface area of~30 m2/g for the whole ensem-ble of exhaust soot particles (Popovicheva et al., 2004). A simple close-packed sphere model for H2SO4 molecules, assuming its effective molecular cross-section of 0.246 nm2, gives one static monolayer 4 H2SO4 molecules per nm2. With this assumption, we estimate a maximum H2SO4coverage of 0.1 ML for soot particles due to sulfur-induced processing in the young plume.
Figure.2. Evolution of the total amount of H2SO4 accumulated on the surface of exhaust soot particles along the plume for medium and high FSC. Ns=4 106 cm-3.
5 EXPERIMENTAL SIMULATIONS
The TC1 soot treatment conditions were chosen to provide an amount of H2SO4 on the surface close to t
4SO2H 0.2 wt%. It was accomplished by the gaseous H2SO4 deposition at T= 413K for 3
h. The isotherms of the water adsorption on TC1 soot modified by H2SO4 at T= 295K and 240K are shown in Figure 3. At 80% RH treated soot adsorbs water by a factor of 3 larger than untreated soot increasing its mass up to 3.2%. One sees that treated soot with 0.2 wt% of H2SO4 can uptake 8 ML of water molecules at the threshold conditions of the contrail formation.

POPOVICHEVA et al.: Water- H2 SO4- soot interaction in aircraft plume 105
Figure 3. Amount of adsorbed water molecules per surface unit of original TC1 soot (crosses) for T=295K; TC1 soot with maximum value of H2SO4 coverage (~0.2 wt%) for T=295K (triangles) and for T=240K (dia-monds).
6 DISCUSSIONS AND CONCLUSION
Treatment of TC1 soot by sulfuric acid (0.2 wt% of H2SO4) increases the original amount of SO42-
by three orders of magnitude. However, it is still much smaller than original one on AEC soot (~ 3.5 wt%). AEC soot exhibits a much higher hydroscopicity than TC1 soot modified by H2SO4 in the whole RH range (see Fig.1). Therefore, we conclude that the hydrophilic fraction of engine-generated soot does not require any water activation; its own original amount of sulfates is much larger than the maximal amount of H2SO4 which may be accumulated from the gaseous and particu-late aircraft exhaust. In opposite, the hydrophobic fraction of engine soot is sensitive to surface-adsorbed acid and may be activated by the sulfur- induced processing.
Our results make it possible to clarify the key question, which had raised in observations: how soot particles could acquire a liquid soluble coating under plume conditions to act as CCN. When the plume reaches water vapor supersaturation, the most hydrophilic fraction of engine – generated soot particles will be activated firstly. If assigning all water soluble (~ 13.5 wt%) measured in AEC soot to the fraction of impurities we should report that this fraction will uptake water constituting of 18% of its mass. It is a fine prerequisite for the CCN formation on such soot particles at water su-persaturations. Therefore, we may apply the classical Koehler theory to estimate the critical super-saturation, Sw, needed for CCN activation on the fraction of impurities for engine – generated soot particles. We calculated Sw 0.08% for soot particles of 80 nm diameter. Such a small value of Sw is definitely reached in the plume. Therefore, we may reasonably conclude about the CCN formation on the hydrophilic fraction of engine soot particles. Since strong evidence is found by in-situ obser-vations (Schröder et al., 1998), which showed that ~ 1/3 of exhaust soot particles must be involved in the contrail formation, we believe that this results from the hydrophilic fraction of impurities. Af-ter initial liquid stage in the cooled plume, ice nucleation should occur in a condensation-freezing mode.
The same process would require much higher Sw for the activation of the hydrophobic main frac-tion of engine-generated soot particles, which originally is assumed being not containing water soluble coverage. It may acquire near 0.2 wt% of H2SO4 at high FSC in the exhaust plume.

106 POPOVICHEVA et al.: Water- H2 SO4- soot interaction in aircraft plume
Howewer, such a small value of H2SO4 is not enough for CCN activation following the Koehler theory. It is unclear whether this is enough to allow the growth of water droplets in order to over-come the Kelvin barrier. With the assumption that the main fraction of engine soot particles be-comes wettable due to H2SO4 processing the Kelvin theory makes it possible to estimate the water supersaturations needed for the CCN formation on such particles. At 235K we find Sw 8% and 3% for particles of 40 and 100 nm diameters, respectively. Hence, whether such particles participate in contrail formation depends on water supersaturations attained in the plume at given ambient condi-tions. Therefore, the principal role in the contrail formation belongs to the fraction of impurities which may induce the CCN formation due to original presence of water soluble organic and inor-ganic compounds on the soot surface.
ACKNOWLEDGMENTS
This research was funded by the grants of Council of President of Russian Federation for support of Young Russian scientist and Leading Scientific School SS-9330.2006.8 and SS-7101.2006.02. The authors thank Prof. J.Suzanne, Dr.D.Ferry and Dr. B. Demirdjian (CRMC-N/CNRS, Marseille) for long-time cooperation in this field.
REFERENCES
Chen et al., Chen, Y.L., Kreidenweis, S.M., McInnes, L.M., Rogers, D.C., and DeMott, P.J., 1998: Single particle analyses of ice nucleating aerosols in the upper troposphere and lower stratosphere, GeophysicalResearch Letters 25, 1391-1394.
Hendricks J., Karcher B., U.Lohmann, and M.Ponater, 2005: Do aircraft black carbon emissions affect cirrus clouds on global scale? Geophysical Research Letters, 32, L12814,doi:10.1029/2005GL022740.
Gleitsmann, G. and Zellner R., 1998: A modeling study of the formation of cloud condensation nuclei in the jet regime of aircraft plumes, Journal of Geophysical Research 103, 19543-19555
Kärcher, B., Peter, T., Biermann, U.M., and Schumann, U., 1996: The initial composition of jet condensation trails, Journal of Atmospheric Science 53, 3066-3083.
Kärcher, B., Busen, R., Petzold, A., Schröder, F., Schumann, U., and Jensen, E.J., 1998: Physicochemistry of aircraft-generated liquid aerosols, soot, and ice particles - 2. Comparison with observations and sensitivity studies, Journal of Geophysical Research 103, 17129-17147.
Kuhn, M., Petzold, A., Baumgardner, D., and Schröder, F., 1998: Particle composition of a young condensa-tion trail and of upper tropospheric aerosol, Geophysical Research Letters 25, 2679-2682.
Petzold, A., Strom, J., Ohlsson, S., and Schröder, F., 1998a: Elemental composition and morphology of ice-crystal residual particles in cirrus clouds and contrails, Atmospheric Research 49, 21-34.
Popovicheva O.B., Persiantseva N.M., Shonia N.K., Zubareva N.A., Starik A.M., Secundov A.N., Usenko D.A., Zakharov V.M., Suzanne J., Ferry D., and B. Demirjian, 2003: Aircraft engine soot :characteristic properties as CCN in upper troposphere. Combustion and atmospheric pollution. Torus Press, RF, 444-449.
Popovicheva, O.B., Persiantseva, N.M., Lukhovitskaya, E.E., Shonija, N.K., Zubareva, N.A., Demirdjian, B., Ferry, D., and Suzanne, J., 2004: Aircraft engine soot as contrail nuclei, Geophysical Research Letters 31,Art. No. L11104.
Savel'ev, A.M.; Starik, A.M.; Titova, N.S., 1999: Investigation of the dynamics of formation of environmen-tally harmful gases in elements of gas turbine engine, High Temperature 37, 3, 470-478.
Schröder, F., Kärcher, B., Petzold, A., Baumann, R., Busen, R., Hoell, C., and Schumann, U., 1998: Ul-trafine aerosol particles in aircraft plumes: In situ observations, Geophysical Research Letters 25, 2789-2792.
Schumann U., Arnold F., Busen R., et al. 2002: Influence of fuel sulfur on the composition of aircraft ex-haust plume: The experiments sulfur 1-7, Journal of Geophysical Research, 107, D15,10.1029/2001JD00813.
Starik, A.M.; Savel'ev, A.M.; Titova, N.S.; Loukhovitskaya, E.E.; Schumann, U., 2004: Effect of aerosol precursors from gas turbine engines on the volatile sulfate aerosol and ion clusters formation in aircraft plumes, Phys.Chem.Chem.Phys. 6, 3426-3436.

Proceedings of the TAC-Conference, June 26 to 29, 2006, Oxford, UK 107
Numerical simulation of aircraft plumes using a mesoscale code
R. Paugam*, R. Paoli, D. Cariolle, B. Cuenot CERFACS France
Keywords: contrail, mesoscale, numerical simulation
ABSTRACT: This study describes high-resolution three-dimensional simulations of an aircraft ex-haust plume and represents a first step towards the simulation of a complete contrail evolution in an aircraft wake. The baseline configuration used for the simulations is an aircraft vortex pair descend-ing in a stratified atmosphere. The numerical tool is the Météo-France meteorological code MesoNH used in its LES version. Focus is laid on the three-dimensional vortex dynamics and the effects of stratification on the development of vortex instabilities as well as on the dispersion of (passive) exhaust species in the atmosphere. Comparisons with previous works on the subject are provided. A first study of the coupling process between vortex dynamics and ice microphysics is also presented for a simple two-dimensional contrail simulation. The extension to full three-dimensional dynamics/ice microphysics coupling and its application to mesoscale simulations of contrails are finally discussed.
1 INTRODUCTION
Condensation trails (“contrails”) are the thin clouds which are commonly visible as white streaks behind aircrafts in otherwise clear sky. Due to the rapid growth of the commercial aircraft traffic, aircraft emissions became an important subject of academic research and practical interest because of their potential environmental impact as indicated in the Intergovernmental Panel on Climate Change (IPCC) Penner et al. (1999). It is known for example that for suitable atmospheric conditions, contrails trigger the formation of cirrus clouds, thus altering the radiative balance of the atmos-phere. Furthermore, NOx emissions perturb the Earth chemical cycle, resulting in the production or destruction of ozone according to the local thermodynamic conditions, while emissions of CO2 and H2O contribute to greenhouse effect.
This work is part of a research effort made in the Aviation & Environment Team at Cerfacs in the framework of the European project QUANTIFY (http://www.pa.op.dlr.de/quantify). The main objective is to develop a modelling and computational strategy that allows one to simulate the air-craft plume evolution up to some hours after the release of exhausts, and to provide parameterisa-tions to Global Circulation Models (GCM).
Simulations of aircraft plumes have been mostly carried out in the literature using LES formula-tions, see e.g. Gerz et al. (1999), and Lewellen et al. (2001), and focused on one specific stage (vortex regime) of the plume evolution. The originality of our research is to simulate a complete contrail evolution since the beginning of the vortex regime to the scales of GCM (i.e. a few hours from emission time). The dynamical, microphysical and chemical processes are then solved by coupling a LES model (MesoNH-LES) for the early plume stages, with an atmospheric mesoscale model (MesoNH) for late dispersion and diffusion regimes, see Lafore et al. (1998).
A brief description of contrail physics is presented in section 2, an overview of the computa-tional strategy is given in section 3. The MesoNH code is described in section 4. Section 5 reports the first results of the wake dynamics vortex simulations. Section 6 shows the first implementation of a dedicated microphysical scheme for aircraft plume. Conclusions are given in Section 7.
* Corresponding author: Ronan Paugam, CERFACS 42 avenue Gaspard Coriolis 31057 TOULOUSE cedex 01 FRANCE. Email: [email protected]

108 PAUGAM et al.: Numerical simulation of aircraft plumes using a mesoscale code
2 THE EVOLUTION OF AN AIRCRAFT PLUME
The evolution of an aircraft plume in the atmosphere includes several physical phenomena such as jet, vortex dynamics, and atmospheric turbulence which have different characteristic scales. This makes its modelling and simulation a challenging task in atmospheric science. According to Gerz et al. (1998), Lewellen et al. (2001), and Sussmann et al. (1999), the evolution of a plume can be qualita-tively described in four successive regimes.
In the jet regime, the two counter rotating vortices are formed around the wing tips, while hot exhaust released form the engines are trapped around vortex cores. (Typically for a B747, the vor-tices are initially separated by 50 m, and the cores are about 5 m wide). This regime ends after 20 seconds when the peak absolute temperature Tmax gets to a minimum and the peak concentration cmax of an inert gas (e.g. CO2) attains some asymptotic steady value. During the next minute (vortex regime), the vortices move downward by mutual induction. The exhaust is then entrained by the vortices and propagates down from flight level to 150 to 250 m. As the primary wake falls down in a stratified environment, it leaves back a vertical curtain which forms a secondary wake at the flight level, Spalart(1996). A significant part of exhaust (around 30 per cent according to Gerz et al. (1998)) is then detrained from the primary wake, and experiences different microphysical and chemical processes. The vortex regime ends after the collapse of the two vortex, typically by a long-wave sinusoidal instability Crow(1970). The time scale of instability is mainly controlled by the atmospheric turbulence, and the vortex regime persists until 80 s. (120 s.) for calm (weak turbu-lent) atmosphere conditions. During this regime temperature Tmax increases by adiabatic heating of the exhaust in the sinking vortex, and the concentration cmax remains almost constant. Actually a maximum of exhaust is still caught in the vortex cores. Note that during this phase, the formation of a visible secondary wake (ice particle formation) is controlled by the relative humidity with respect to ice RHi of the surrounding atmosphere, see Sussmann et al. (1999). If RHi < 100 %, no visible secondary wake appears, if RHi 100 %, a gap forms between the two wakes, and finally if RHi >> 100 %, a plume of ice particles persists. In the following dispersion regime the vortices break up and generate turbulence, which is later dissipated to background level where the dynamics is con-trolled by positive buoyancy acquired from hot exhaust and ambient stratification. The temperature Tmax and the concentration cmax decrease due to mixing with the atmosphere, whereas the entrain-ment rate )ln( maxcdtd increases (this parameter is a measure of the plume expansion rate which is valid for both the primary and the secondary wake). Then the plume expands and mixes in the atmosphere within one or two Brunt Väsäilä frequency, typically until a contrail age of 600 or 1200 s. Then the diffusion regime starts where no aircraft induced motion exists anymore, and the plume is only controlled by interaction with the atmosphere. Shear and stratification act on the plume up to a complete mixing, basically within 2 to 12 hours. For suitable conditions, the plume can reach a cross stream extension of 1 x 4 km respectively in the vertical and horizontal direction, see Dürbeck et al. (1996).
Hence, the evolution of a contrail is characterized by different lengths scale, from centimeter -to-meters in the jet and vortex regimes, to tens of meters in the diffusion regime. The dispersion re-gime is a transition phase between these two main regimes of the contrail lifetime, where dynamical scales change from wake-controlled scales to the atmospheric scales.
3 DESCRIPTION OF THE NUMERICAL CODE
The MesoNH Atmospheric Simulation System is a joint effort of Centre National de Recherches Météorologiques (Météo-France) and Laboratoire d'Aérologie (CNRS. The detailed scientific documentation of the code is available at http://www.aero.obs-mip.fr/mesonh/index2.html, see also Lafore et al. (1998). It is a non-hydrostatic mesoscale atmospheric model with a horizontal resolu-tion ranging from 1 m to 1 km, allowing simultaneously up to 8 nested models to run. The basic prognostic variables are the velocity field (u,v,w) and the potential temperature . According to the required resolution, the code can run in real mesoscale mode where all scales of turbulence are pa-rameterized; or in a LES mode typical of small-scale simulations meaning that the transported tur-bulent kinetic energy (TKE) is used to model the sub-grid scale fluxes (to that end a homogeneous resolution of less than teen meters is needed), see Cuxart et al. (2000).

PAUGAM et al.: Numerical simulation of aircraft plumes using a mesoscale code 109
Scalar transport is obtained via a second order centred finite difference scheme for both advec-tion and diffusion operators, and is coupled to a chemical kinetics module to treat species chemical reactions.
A complex cloud microphysics module is also available for both warm and cold cloud, carrying up to seven water mixing ration, according to the different physical transformations: vapor, cloud liquid water, rain water, cloud ice, snow, graupel, and hail. For example, warm liquid clouds are mainly involved in marine stratocumulus (see Sandu et al. (2005)) and ship track simulations. To that end, the code has its own radiative scheme although it could in principle use other external scheme as well. Furthermore, a dry aerosol module, based on a lognormal representation of size dis-tribution, has been recently implemented in the code, Tulet et al. (2005).
The code MesoNH has been installed at CERFACS and validated on the Cray supercomputer for tri-dimensional test cases such as contrails and marine boundary layer simulations.
4 OVERVIEW OF A COMPLETE SIMULATION
As explained in Sec. 2, the vortex regime is of primary importance for the simulation of an aircraft plume because of the strong impact that it has on the evolution of the wake. The main dynamical processes of interest in this regime are the Crow instability and the induced secondary wake (see section 2). To the authors’ knowledge, no simulations of the late dispersion and the diffusion re-gime have been investigated with realistic initial conditions from the vortex regime. The originality of our work is the simulation of the complete plume evolution where chemical and microphysical processes from both primary and secondary wake are solved up to the diffusion regime. To that end, an integrated simulation strategy has been developed (see the sketch in Fig. 1) to resolve all rele-vant dynamical and chemical scales of the aircraft plume, from the near-field wake to the mesoscales representative of grid boxes of global models (i.e. a few hundred kilometers).
Small-scale simulations using accurate high order LES code see Paoli et al. (2004), provide the initial wind field, the particles distributions and the aircraft-generated turbulence from the earlier jet regime. Then these fields are filtered and interpolated on a coarser mesh to start the simulations of the vortex regime. Then simulations start with MesoNH in its LES version with a resolution of 1 meter over the cross sectional plan. The resolution is then reduced and the domain enlarged accord-ingly. Interpolation and filtering are applied at each swap from one domain to the larger one.
The switch from the LES version of MesoNH to its “standard” mesoscale version is imposed when the resolution is coarser than teens of meters, implying that the horizontal turbulent fluxes are assumed to be homogeneous. When starting the mesoscale simulation, a stretched mesh is used in the vertical direction from the ground to the tropopause, with maximum resolution at the aircraft al-titude. Such a grid should then allow one to account for radiation in a dedicated following study.

110 PAUGAM et al.: Numerical simulation of aircraft plumes using a mesoscale code
Figure 1: Sketch of the computational strategy adopted to swap from small-scale to mesoscale simulations. Note that the numerical box is advected by the aircraft velocity so that cyclic boundary conditions are ap-plied in the axial direction.
5 THE FIRST RESULTS OF WAKE VORTEX SIMULATIONS
This section details the first step of the integrated approach presented above, i.e. the simulation of the vortex regime which corresponds to a wake lifetime of 20 s. up to 100 s. Note that in the follow-ing, the starting time of ours simulations (t=0) corresponds to a plume age of 20 seconds. The main physical processes occurring during the vortex regime are the break up of the vortices by the Crow instability and the formation of the so called secondary wake (see section 2). In order to well re-solve the break up of the vortices, the simulation is integrated over 125 s.
To validate the MesoNH code in simulation of vortex, we first used analytical initial conditions of the beginning of the vortex regime based on the work by Gerz et al. (1999). They consist of two counter rotating vortices corresponding to a B747 flying at cruise altitude (11,000 m.) in an ambient stratified atmosphere. The vortices are initially separated by b0 = 47 m., the cores are 5.8 m. wide, and an initial circulation of 0 = 600 m.2s.-1. The computational domain of the simulation is 400 x 256 x 525 m., in flight (x), cross (y), and vertical (z) directions, respectively (with 1 x 1x 8 m. reso-lution). For numerical stability of MesoNH, a time step of 25 msec. is required. A preliminary grid-independence analysis in 2D simulations shows that after a time of 50 seconds the vortices reach the same altitude for 1 m. or 2 m. resolution, and that the formation of the secondary wake is almost of the same amplitude (see left panel of Fig. 2). Tough peak value of the vertical velocity exhibits a weak grid dependence (see right panel of Fig. 2), the 1 m. resolution in the cross-section has been chosen for compromise between accuracy and CPU time.
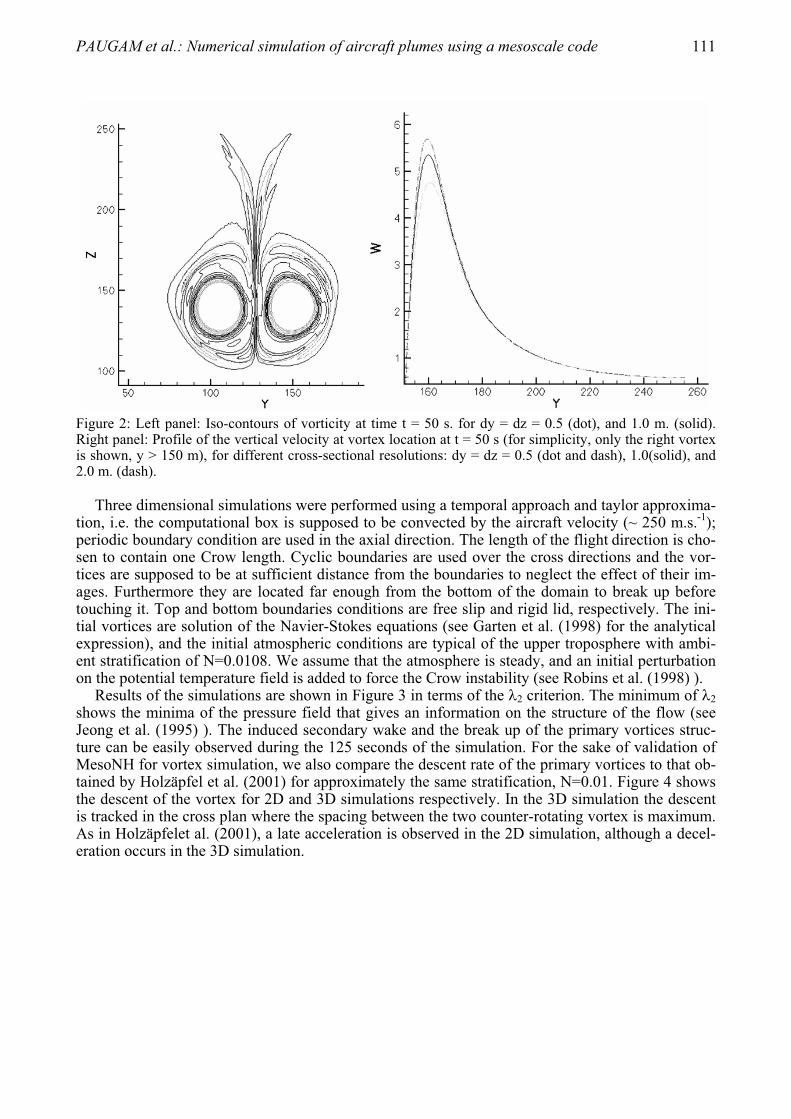
PAUGAM et al.: Numerical simulation of aircraft plumes using a mesoscale code 111
Figure 2: Left panel: Iso-contours of vorticity at time t = 50 s. for dy = dz = 0.5 (dot), and 1.0 m. (solid). Right panel: Profile of the vertical velocity at vortex location at t = 50 s (for simplicity, only the right vortex is shown, y > 150 m), for different cross-sectional resolutions: dy = dz = 0.5 (dot and dash), 1.0(solid), and 2.0 m. (dash).
Three dimensional simulations were performed using a temporal approach and taylor approxima-tion, i.e. the computational box is supposed to be convected by the aircraft velocity (~ 250 m.s.-1);periodic boundary condition are used in the axial direction. The length of the flight direction is cho-sen to contain one Crow length. Cyclic boundaries are used over the cross directions and the vor-tices are supposed to be at sufficient distance from the boundaries to neglect the effect of their im-ages. Furthermore they are located far enough from the bottom of the domain to break up before touching it. Top and bottom boundaries conditions are free slip and rigid lid, respectively. The ini-tial vortices are solution of the Navier-Stokes equations (see Garten et al. (1998) for the analytical expression), and the initial atmospheric conditions are typical of the upper troposphere with ambi-ent stratification of N=0.0108. We assume that the atmosphere is steady, and an initial perturbation on the potential temperature field is added to force the Crow instability (see Robins et al. (1998) ).
Results of the simulations are shown in Figure 3 in terms of the 2 criterion. The minimum of 2shows the minima of the pressure field that gives an information on the structure of the flow (see Jeong et al. (1995) ). The induced secondary wake and the break up of the primary vortices struc-ture can be easily observed during the 125 seconds of the simulation. For the sake of validation of MesoNH for vortex simulation, we also compare the descent rate of the primary vortices to that ob-tained by Holzäpfel et al. (2001) for approximately the same stratification, N=0.01. Figure 4 shows the descent of the vortex for 2D and 3D simulations respectively. In the 3D simulation the descent is tracked in the cross plan where the spacing between the two counter-rotating vortex is maximum. As in Holzäpfelet al. (2001), a late acceleration is observed in the 2D simulation, although a decel-eration occurs in the 3D simulation.

112 PAUGAM et al.: Numerical simulation of aircraft plumes using a mesoscale code
Figure 3: Perspective view of the iso-surface 2 = - 0.003 identifying the vortex structure at t = 0, 30, 60, 90, and 125 s
Figure 4: Plot of the vertical position of the vortices in 2D (left) and 3D (right) simulations. The points corre-spond to the numerical simulations, while dashed lines indicate the uniform vortex descent in a non stratified environment, i.e. with constant velocity v = v0 = 0/2 b0.

PAUGAM et al.: Numerical simulation of aircraft plumes using a mesoscale code 113
6 A SIMPLE MICROPHYSICAL SCHEME
So far we have described the dynamics of the vortex evolution. This section presents the first 2D simulation of the microphysical processes obtained by integrating the simplified ice growth model by Kärcher(1996) in MesoNH. Ice crystal is the only class of particles present, and microphysics re-duces to condensation / evaporation. Neither coagulation nor sedimentation is presently accounted. The condensation growth law is given by Kärcher(1996),
rSrGDr
dtd I)( (1)
where r is the mean radius, SI is the ice supersaturation, D stands for the molecular vapour diffusiv-ity and G (r) is a model function. A bulk approach was first investigated as in Lewellen et al. (2001),where the number of particles, the ice mixing ratio and the vapor mixing ration are transported. This yields to the following set of equations,
0
3)(4 3/13/2
particles
Iw
ice
IwSiw
air
particlesI
Ndtd
rdtdr
dtd
rrrrGDN
rdtd
(2)
where rI is the ice mixing ratio, rw the vapor mixing ratio, rwSi the vapor mixing ratio at ice satura-tion, Nparticles the number density of particles, ice the density of ice, and air the density of the dry air. The mean radius r is obtained by the definition of the ice mixing ratio,
air
iceparticlesI
Nrr
3
34
(3)
The results of a 2D simulation using this microphysical scheme are shown in Figure 5 for the super-saturation field. The initial background conditions for SI are deduced from the scenario 2 of Suss-mann et al. (1999). This corresponds to a weak supersaturation at the flight level and a subsaturated air 200 meters below. Note that initially, the supersaturation is not balanced with the temperature perturbation induced by the vortices. For simplicity, tangent hyperbolic distribution of particles are inserted inside the core vortices with a maximum of number density max
particlesN = 2.8 e+9 and a corre-sponding mean radius rmax = 1.e-6 m. These values are extrapolated from exhaust values using a di-lution factor to account for the expansion of the plume in the jet and vortex regime. Not that we as-sume that all the ice particles are formed during the jet regime.
From Figure 5, we observe at a t =12 s. the formation of subsaturated air at the bottom of the vortices, and their final wrapping around them at t =70 s. This is due to the adiabatic compression of the primary wake during its descent in the stratified fluid. Mean radius contour plots are shown in Figure 6. As initially the particles are trapped inside the vortices, and since the simulations are two-dimensional so that vortex instabilities cannot develop, there is no break up of the vortices and particles stay trapped inside the cores. Then the system gets to an equilibrium state where vapor reaches saturation conditions.
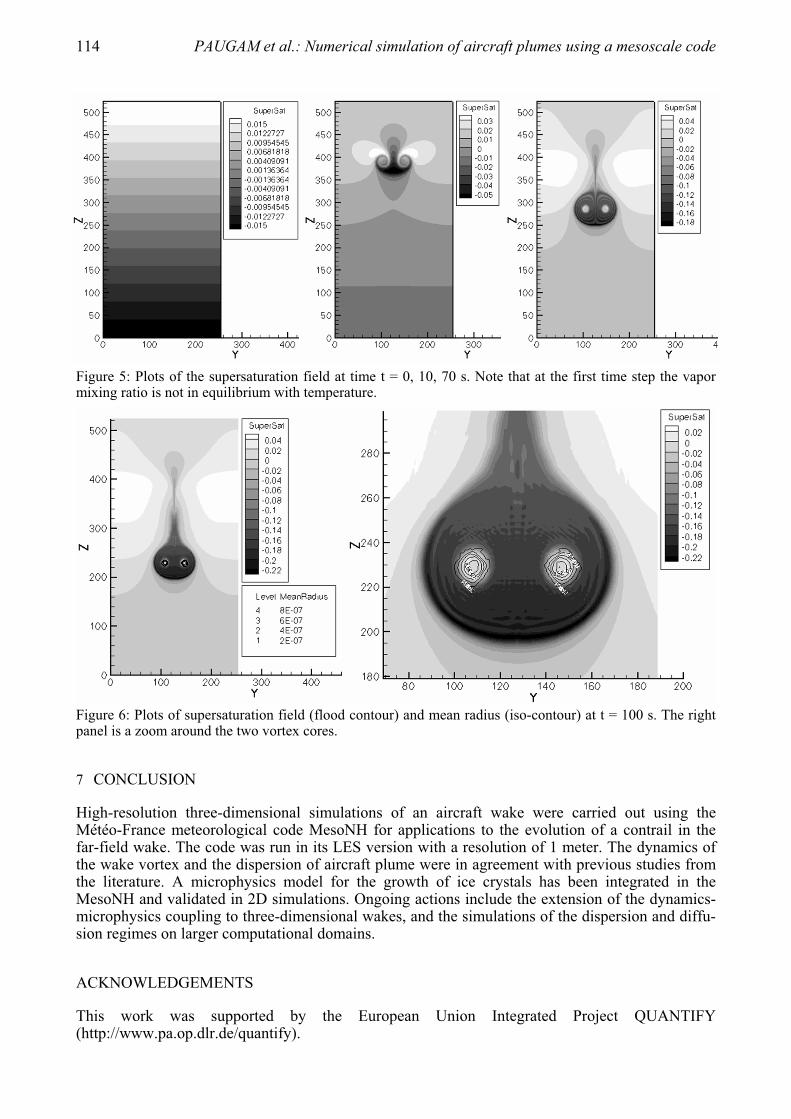
114 PAUGAM et al.: Numerical simulation of aircraft plumes using a mesoscale code
Figure 5: Plots of the supersaturation field at time t = 0, 10, 70 s. Note that at the first time step the vapor mixing ratio is not in equilibrium with temperature.
Figure 6: Plots of supersaturation field (flood contour) and mean radius (iso-contour) at t = 100 s. The right panel is a zoom around the two vortex cores.
7 CONCLUSION
High-resolution three-dimensional simulations of an aircraft wake were carried out using the Météo-France meteorological code MesoNH for applications to the evolution of a contrail in the far-field wake. The code was run in its LES version with a resolution of 1 meter. The dynamics of the wake vortex and the dispersion of aircraft plume were in agreement with previous studies from the literature. A microphysics model for the growth of ice crystals has been integrated in the MesoNH and validated in 2D simulations. Ongoing actions include the extension of the dynamics-microphysics coupling to three-dimensional wakes, and the simulations of the dispersion and diffu-sion regimes on larger computational domains.
ACKNOWLEDGEMENTS
This work was supported by the European Union Integrated Project QUANTIFY (http://www.pa.op.dlr.de/quantify).

PAUGAM et al.: Numerical simulation of aircraft plumes using a mesoscale code 115
REFERENCES
Crow, S. C., 1970: Stability Theory for a Pair of Trailing Vortices. AIAA Journal, Vol. 8 no. 12, 2172-2179 Cuxart, J., P. Bougeault, and J.-L. Redelsperger, 2000: A turbulence scheme for mesoscale and large-eddy
simulations. Q.J.R. Meteorol. Soc., Vol. 126, pp. 1-30 Dürbeck, T. and T. Gerz, 1996: Dispersion of aircraft exhaust in the free atmosphere. J. Geophys. Res. Vol.
101 no. D20, pp. 26,007-26,015 Garten, J.F., S. Arendt , D. C. Fritts, and J. Werne, 1998: Direct numerical simulations of the Crow instabil-
ity and subsequent vortex reconnection in a stratied fluid. J. Fluid Mech. Vol. 361, pp. 189-236Gerz, T., T. Dürbeck, and P. Konopka, 1998: Transport and effective diffusion of aircraft emission. J. Geo-
phys. Res. Vol. 103 no. D20, pp. 25,905-25,913 Gerz, T., and F. Hozapfel, 1999: Wing Tip Vortices, Turbulence, and the Distribution of Emissions. AIAA
Journal vol. 37, pp. 1270-1276 Holzäpfel, T., T. Gerz, and R. Baumann, 2001: The turbulent decay of vortex pairs in stably stratified envi-
ronment. Aerosp. Sci. Technol. Vol. 5, pp. 95-108 Jeong, J., and F. Hussain, 1995: On the identification of a vortex. J. Fuid Mech. Vol. 285, pp. 69-94 Kärcher, B., 1996: The initial Composition of the Jest Condensation Trails. J. Atmos. Sci. Vol. 53, pp. 3066-
3082Lafore, J.-P., J. Stein, N. Asencio, P. Bougeault, V. Ducrocq, J. Duron, C. Fischer, P. Héreil, P. Mascart,
V. Masson, J.-P. Pinty, J.-L. Redelsperger, E. Richard, and J. Vilà-Guerau de Arellano, 1998. The MesoNH Atmospheric Simulation System. Part I: adiabatic formulation and control simulations. Scien-tific objectives and experimental design, Ann. Geophys. Vol. 16, 90-109
Lewellen, D.C., and W.S. Lewellen, 2001: The Effect of Aircraft Wake Dynamics on Contrails Develop-ment. J. Atmos. Sci. Vol. 58, pp. 390-406
Paoli, R., J. Hélie and T. Poinsot, 2004: Contrails formation in aircraft wake. J. Fluid Mech. Vol. 502, pp. 361-373
Penner J. E., 1999: Aviation and the Global Atmosphere, Cambridge University Press. Robins, R. E., and D. P. Delisi, 1998: Numerical Simulation of Three-Dimensional Trailing Vortex Evolu-
tion in Stratified Fluid. AIAA Journal Vol. 36, pp. 981-985 Sandu, I, P. Tulet, and J.-L. Bringuier, 2005: Parametrisation of the Cloud Droplet Single Albedo Based on
Aerosol Chemical Composition for LES modelling of boundary layer clouds. Geophys. Res. Lett. Vol. 32, L19814
Spalart, P. R., 1996: On the motion of laminar wing wakes in a stratified fluid. J. Fluid Mech. Vol. 327, pp. 139-160
Sussmann, R., and K. Gierens, 1999: Lidar and numerical studies on the different evolution of vortex pair and secondary wake in a young contrails. J. Gesophys. Res. Vol. 104, no D2, pp. 2131-2142
Tulet, P., V. Crassier, F. Cousin, K. Suhre, and R. Rosset, 2005 : ORILAM, a three-moment lognormal aero-sol scheme for mesoscale atmospheric model : Online coulping into the MesoNH-C model and validation on the Escompte campaign. J Geophys. Res. Vol. 110, D18201
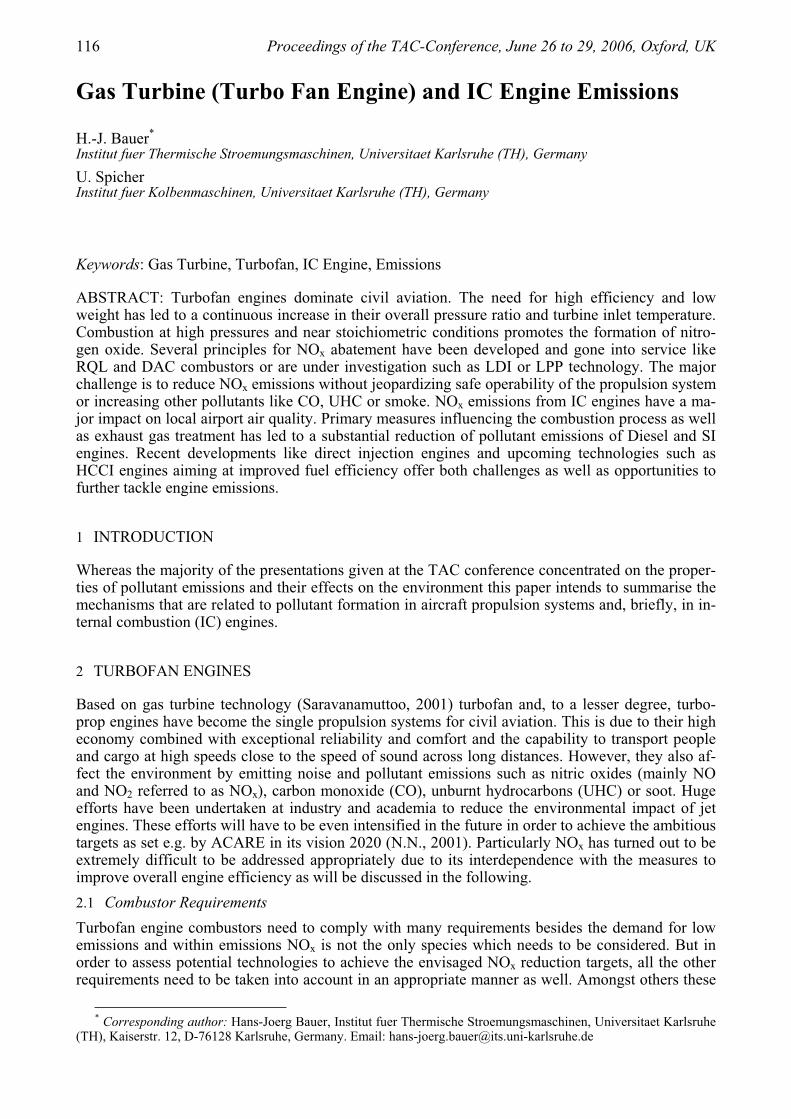
116 Proceedings of the TAC-Conference, June 26 to 29, 2006, Oxford, UK
Gas Turbine (Turbo Fan Engine) and IC Engine Emissions
H.-J. Bauer*
Institut fuer Thermische Stroemungsmaschinen, Universitaet Karlsruhe (TH), Germany U. Spicher Institut fuer Kolbenmaschinen, Universitaet Karlsruhe (TH), Germany
Keywords: Gas Turbine, Turbofan, IC Engine, Emissions
ABSTRACT: Turbofan engines dominate civil aviation. The need for high efficiency and low weight has led to a continuous increase in their overall pressure ratio and turbine inlet temperature. Combustion at high pressures and near stoichiometric conditions promotes the formation of nitro-gen oxide. Several principles for NOx abatement have been developed and gone into service like RQL and DAC combustors or are under investigation such as LDI or LPP technology. The major challenge is to reduce NOx emissions without jeopardizing safe operability of the propulsion system or increasing other pollutants like CO, UHC or smoke. NOx emissions from IC engines have a ma-jor impact on local airport air quality. Primary measures influencing the combustion process as well as exhaust gas treatment has led to a substantial reduction of pollutant emissions of Diesel and SI engines. Recent developments like direct injection engines and upcoming technologies such as HCCI engines aiming at improved fuel efficiency offer both challenges as well as opportunities to further tackle engine emissions.
1 INTRODUCTION
Whereas the majority of the presentations given at the TAC conference concentrated on the proper-ties of pollutant emissions and their effects on the environment this paper intends to summarise the mechanisms that are related to pollutant formation in aircraft propulsion systems and, briefly, in in-ternal combustion (IC) engines.
2 TURBOFAN ENGINES
Based on gas turbine technology (Saravanamuttoo, 2001) turbofan and, to a lesser degree, turbo-prop engines have become the single propulsion systems for civil aviation. This is due to their high economy combined with exceptional reliability and comfort and the capability to transport people and cargo at high speeds close to the speed of sound across long distances. However, they also af-fect the environment by emitting noise and pollutant emissions such as nitric oxides (mainly NO and NO2 referred to as NOx), carbon monoxide (CO), unburnt hydrocarbons (UHC) or soot. Huge efforts have been undertaken at industry and academia to reduce the environmental impact of jet engines. These efforts will have to be even intensified in the future in order to achieve the ambitious targets as set e.g. by ACARE in its vision 2020 (N.N., 2001). Particularly NOx has turned out to be extremely difficult to be addressed appropriately due to its interdependence with the measures to improve overall engine efficiency as will be discussed in the following. 2.1 Combustor Requirements Turbofan engine combustors need to comply with many requirements besides the demand for low emissions and within emissions NOx is not the only species which needs to be considered. But in order to assess potential technologies to achieve the envisaged NOx reduction targets, all the other requirements need to be taken into account in an appropriate manner as well. Amongst others these
* Corresponding author: Hans-Joerg Bauer, Institut fuer Thermische Stroemungsmaschinen, Universitaet Karlsruhe
(TH), Kaiserstr. 12, D-76128 Karlsruhe, Germany. Email: [email protected]

BAUER and SPICHER: Gas Turbine (Turbo Fan Engine) and IC Engine Emissions 117
requirements comprise safe operability (Ground and altitude ignition and pull away capability, weak extinction capability - particularly during slam deceleration of the engine at inclement weather conditions - as well as the suppression of any significant thermo-acoustic pressure oscilla-tion), compatibility (with the engine cycle in terms of pressure, temperature, overall air-fuel ratio and capacity, with the mechanical and aerothermal compressor and turbine interfaces, with the em-ployed fuel and with the weight and size requirement of the engine), economy (development and unit costs, fuel consumption in terms of pressure loss and combustion efficiency, maintainability and reparability and life) and emissions (besides NOx: CO, UHC, Smoke and even H2O and CO2).From all requirements safe operability has the highest priority! 2.2 Gas Turbine Combustion – Joule-Brayton Cycle Turbofan Engines work according to the thermodynamic Joule-Brayton cycle (Saravanamuttoo, 2001), i.e. air is compressed in a compressor. Heat is added to the compressed air by means of con-tinuously burning fuel at constant pressure. The hot gases are then expanded in a turbine, which drives the compressor. Due to the divergence of the isobars in the enthalpy entropy diagram more work can be gained in the expansion process of the hot gases than is needed for the compression of the air. Hence a stationary gas turbine expands the hot gases in the turbine to ambient pressure and uses the excess work to drive an electric generator.
Figure 1: Gas Turbine and jet Engine Set-Up
The Turbo Jet Engine, which was the first jet engine used for aircraft propulsion expands the hot gases in the turbine to drive the compressor only. The remnant enthalpy is then used to expand and accelerate the hot gases in a nozzle and generate a thrust force accordibg to the momentum princi-ple. As will be shown later this is not the most efficient way to generate thrust. Therefore, modern Turbofan Engines as depicted in Figure 2 use the energy gained in the expansion process to drive a so-called fan and split the air afterwards into a bypass flow, which amounts to up 80 % of the over-all air mass flow and beyond and a core mass flow (Rolls-Royce, 2005). The fan is driven by a low pressure turbine through a separate shaft, which also drives an optional low pressure compressor. Bypass air and the hot gases are expanded either in separate thrust nozzles as indicated in Figure 1 or are mixed in a forced mixer as shown in Figure 2 and then jointly enter a common thrust nozzle.
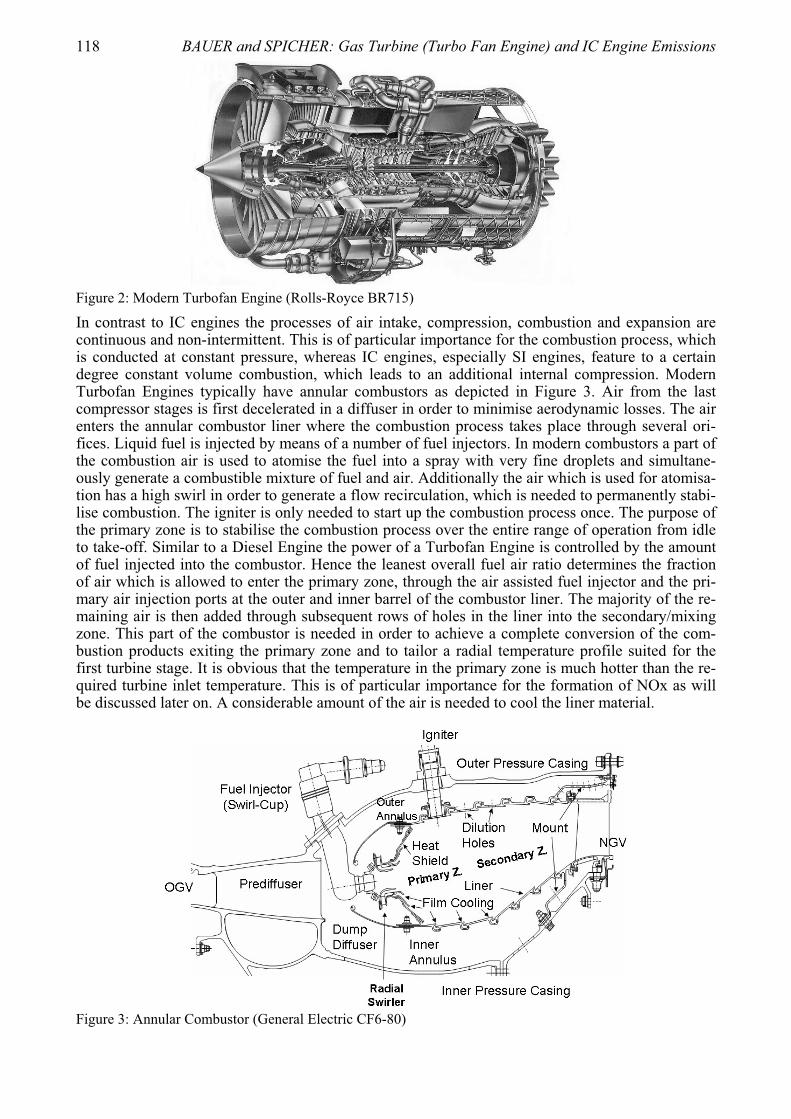
118 BAUER and SPICHER: Gas Turbine (Turbo Fan Engine) and IC Engine Emissions
Figure 2: Modern Turbofan Engine (Rolls-Royce BR715)
In contrast to IC engines the processes of air intake, compression, combustion and expansion are continuous and non-intermittent. This is of particular importance for the combustion process, which is conducted at constant pressure, whereas IC engines, especially SI engines, feature to a certain degree constant volume combustion, which leads to an additional internal compression. Modern Turbofan Engines typically have annular combustors as depicted in Figure 3. Air from the last compressor stages is first decelerated in a diffuser in order to minimise aerodynamic losses. The air enters the annular combustor liner where the combustion process takes place through several ori-fices. Liquid fuel is injected by means of a number of fuel injectors. In modern combustors a part of the combustion air is used to atomise the fuel into a spray with very fine droplets and simultane-ously generate a combustible mixture of fuel and air. Additionally the air which is used for atomisa-tion has a high swirl in order to generate a flow recirculation, which is needed to permanently stabi-lise combustion. The igniter is only needed to start up the combustion process once. The purpose of the primary zone is to stabilise the combustion process over the entire range of operation from idle to take-off. Similar to a Diesel Engine the power of a Turbofan Engine is controlled by the amount of fuel injected into the combustor. Hence the leanest overall fuel air ratio determines the fraction of air which is allowed to enter the primary zone, through the air assisted fuel injector and the pri-mary air injection ports at the outer and inner barrel of the combustor liner. The majority of the re-maining air is then added through subsequent rows of holes in the liner into the secondary/mixing zone. This part of the combustor is needed in order to achieve a complete conversion of the com-bustion products exiting the primary zone and to tailor a radial temperature profile suited for the first turbine stage. It is obvious that the temperature in the primary zone is much hotter than the re-quired turbine inlet temperature. This is of particular importance for the formation of NOx as will be discussed later on. A considerable amount of the air is needed to cool the liner material.
Figure 3: Annular Combustor (General Electric CF6-80)

BAUER and SPICHER: Gas Turbine (Turbo Fan Engine) and IC Engine Emissions 119
In the ideal Joule-Brayton Cycle, compression and expansion are isentropic processes. In real en-gines polytropic compression and expansion is encountered and additional losses, e.g. a loss in total pressure during combustion, have to be accounted for as well. For the ideal process the thermal ef-ficiency, i.e. the net power output related to the added heat, is solely depending on the overall pres-sure ratio (OPR) according to
1
1
2
i
pp
11 (1)
where p1 and p2 are the pressures prior to and after compression, respectively, and is the isen-tropic coefficient. In real engines thermal efficiency increases for a given pressure ratio with in-creasing turbine inlet temperature T3 and there is an optimal pressure ratio for a given turbine entry temperature, as indicated in Figure 4. The strong impact of the pressure ratio on thermal efficiency has led to a continuous rise in overall pressure ratio over the last decades, see Figure 5.
Figure 4: Specific Work and Thermal Efficiency of the Joule-Brayton Cycle
Figure 5: Past, Current and Future OPRs
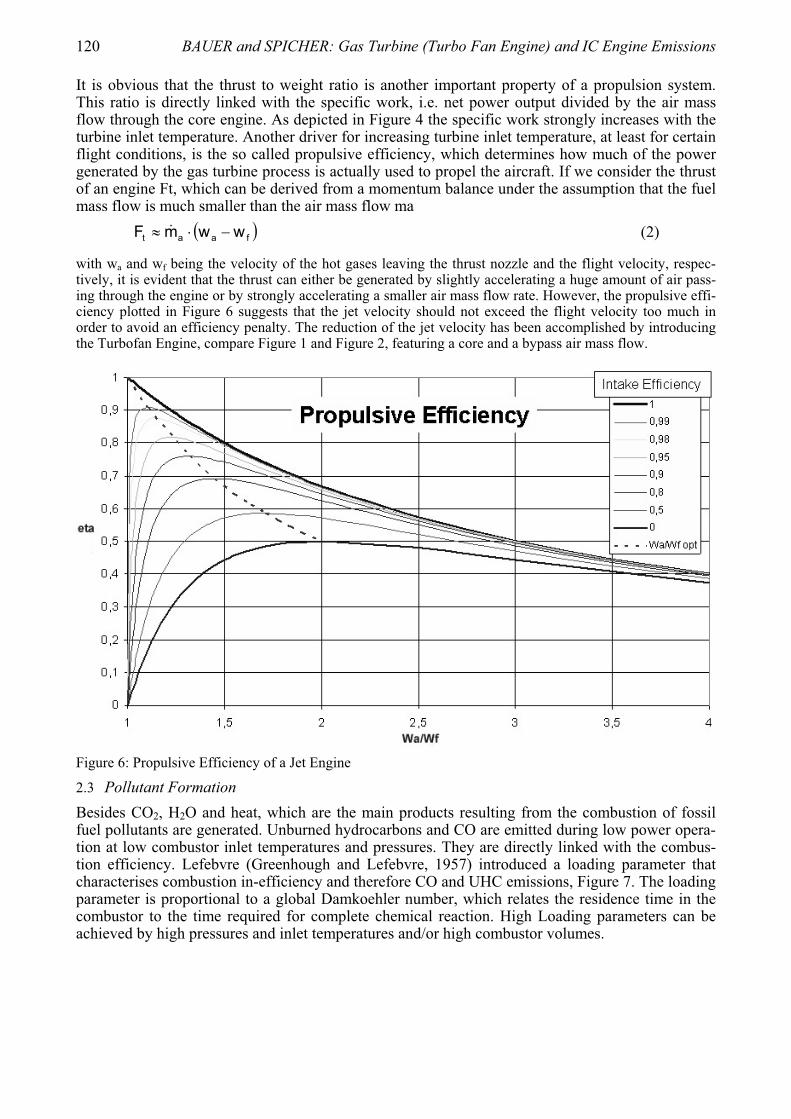
120 BAUER and SPICHER: Gas Turbine (Turbo Fan Engine) and IC Engine Emissions
It is obvious that the thrust to weight ratio is another important property of a propulsion system. This ratio is directly linked with the specific work, i.e. net power output divided by the air mass flow through the core engine. As depicted in Figure 4 the specific work strongly increases with the turbine inlet temperature. Another driver for increasing turbine inlet temperature, at least for certain flight conditions, is the so called propulsive efficiency, which determines how much of the power generated by the gas turbine process is actually used to propel the aircraft. If we consider the thrust of an engine Ft, which can be derived from a momentum balance under the assumption that the fuel mass flow is much smaller than the air mass flow ma
faat wwmF (2)
with wa and wf being the velocity of the hot gases leaving the thrust nozzle and the flight velocity, respec-tively, it is evident that the thrust can either be generated by slightly accelerating a huge amount of air pass-ing through the engine or by strongly accelerating a smaller air mass flow rate. However, the propulsive effi-ciency plotted in Figure 6 suggests that the jet velocity should not exceed the flight velocity too much in order to avoid an efficiency penalty. The reduction of the jet velocity has been accomplished by introducing the Turbofan Engine, compare Figure 1 and Figure 2, featuring a core and a bypass air mass flow.
Figure 6: Propulsive Efficiency of a Jet Engine
2.3 Pollutant Formation Besides CO2, H2O and heat, which are the main products resulting from the combustion of fossil fuel pollutants are generated. Unburned hydrocarbons and CO are emitted during low power opera-tion at low combustor inlet temperatures and pressures. They are directly linked with the combus-tion efficiency. Lefebvre (Greenhough and Lefebvre, 1957) introduced a loading parameter that characterises combustion in-efficiency and therefore CO and UHC emissions, Figure 7. The loading parameter is proportional to a global Damkoehler number, which relates the residence time in the combustor to the time required for complete chemical reaction. High Loading parameters can be achieved by high pressures and inlet temperatures and/or high combustor volumes.
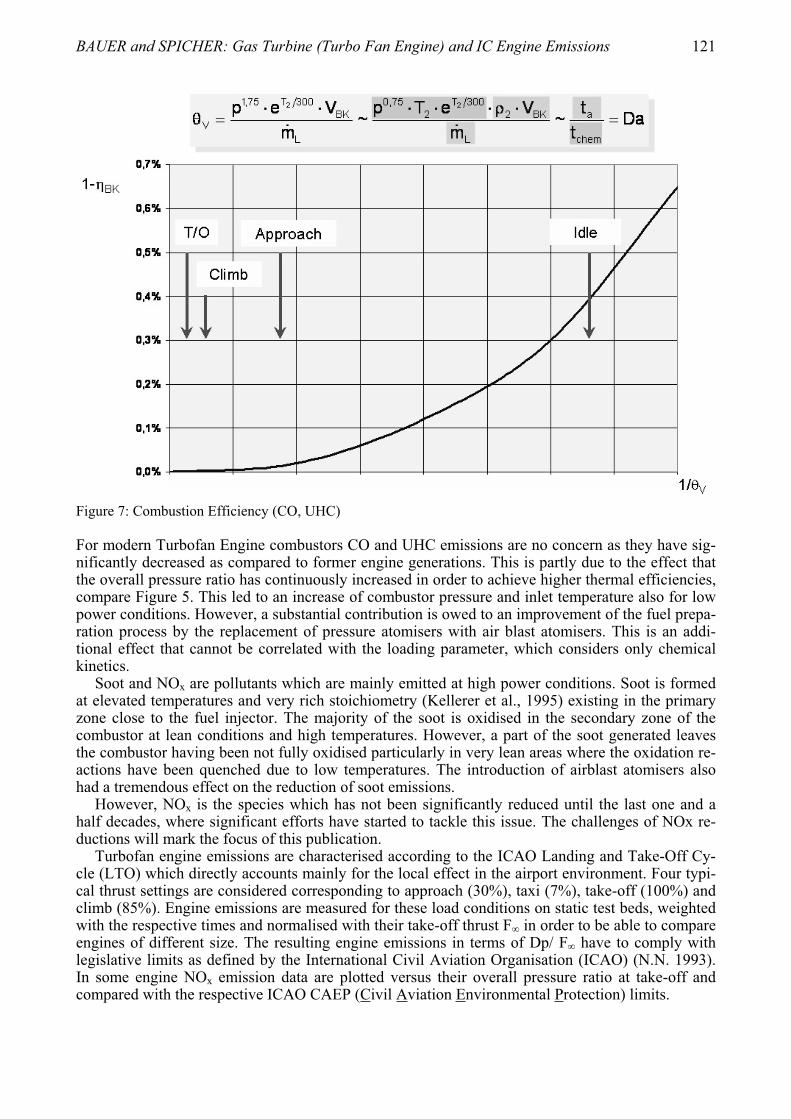
BAUER and SPICHER: Gas Turbine (Turbo Fan Engine) and IC Engine Emissions 121
Figure 7: Combustion Efficiency (CO, UHC)
For modern Turbofan Engine combustors CO and UHC emissions are no concern as they have sig-nificantly decreased as compared to former engine generations. This is partly due to the effect that the overall pressure ratio has continuously increased in order to achieve higher thermal efficiencies, compare Figure 5. This led to an increase of combustor pressure and inlet temperature also for low power conditions. However, a substantial contribution is owed to an improvement of the fuel prepa-ration process by the replacement of pressure atomisers with air blast atomisers. This is an addi-tional effect that cannot be correlated with the loading parameter, which considers only chemical kinetics.
Soot and NOx are pollutants which are mainly emitted at high power conditions. Soot is formed at elevated temperatures and very rich stoichiometry (Kellerer et al., 1995) existing in the primary zone close to the fuel injector. The majority of the soot is oxidised in the secondary zone of the combustor at lean conditions and high temperatures. However, a part of the soot generated leaves the combustor having been not fully oxidised particularly in very lean areas where the oxidation re-actions have been quenched due to low temperatures. The introduction of airblast atomisers also had a tremendous effect on the reduction of soot emissions.
However, NOx is the species which has not been significantly reduced until the last one and a half decades, where significant efforts have started to tackle this issue. The challenges of NOx re-ductions will mark the focus of this publication.
Turbofan engine emissions are characterised according to the ICAO Landing and Take-Off Cy-cle (LTO) which directly accounts mainly for the local effect in the airport environment. Four typi-cal thrust settings are considered corresponding to approach (30%), taxi (7%), take-off (100%) and climb (85%). Engine emissions are measured for these load conditions on static test beds, weighted with the respective times and normalised with their take-off thrust F in order to be able to compare engines of different size. The resulting engine emissions in terms of Dp/ F have to comply with legislative limits as defined by the International Civil Aviation Organisation (ICAO) (N.N. 1993). In some engine NOx emission data are plotted versus their overall pressure ratio at take-off and compared with the respective ICAO CAEP (Civil Aviation Environmental Protection) limits.
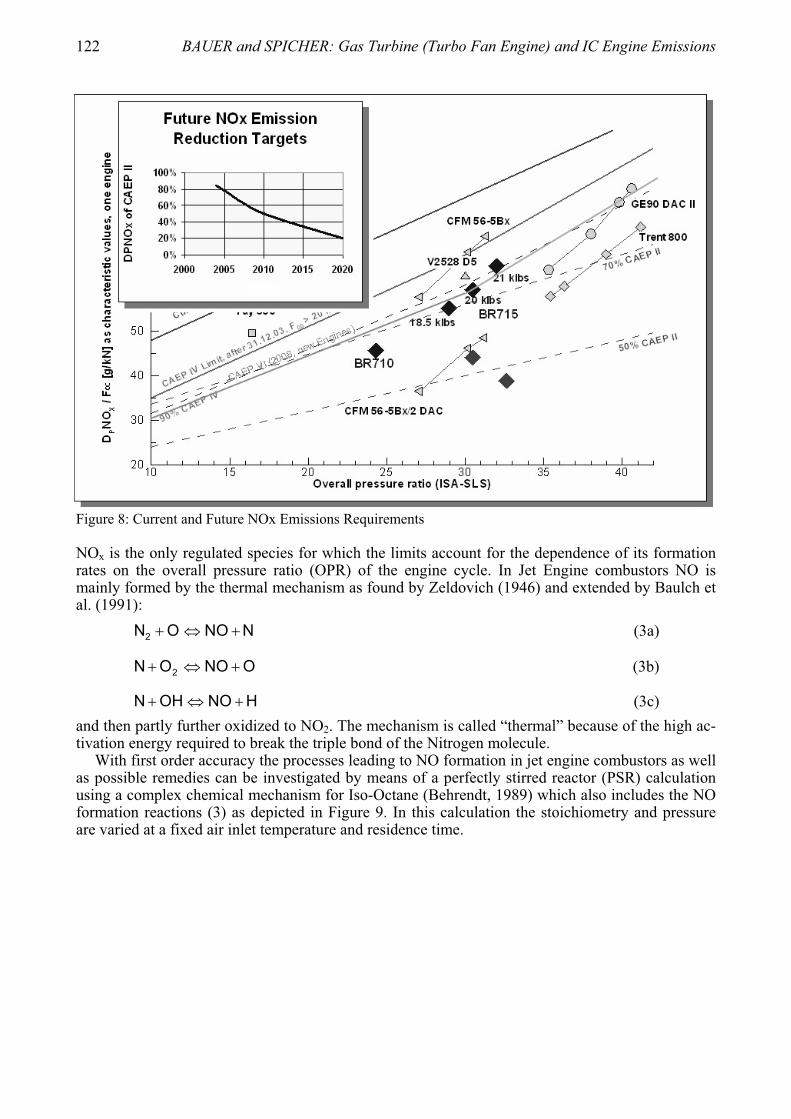
122 BAUER and SPICHER: Gas Turbine (Turbo Fan Engine) and IC Engine Emissions
Figure 8: Current and Future NOx Emissions Requirements
NOx is the only regulated species for which the limits account for the dependence of its formation rates on the overall pressure ratio (OPR) of the engine cycle. In Jet Engine combustors NO is mainly formed by the thermal mechanism as found by Zeldovich (1946) and extended by Baulch et al. (1991):
NNOON2 (3a)
ONOON 2 (3b)
HNOOHN (3c) and then partly further oxidized to NO2. The mechanism is called “thermal” because of the high ac-tivation energy required to break the triple bond of the Nitrogen molecule.
With first order accuracy the processes leading to NO formation in jet engine combustors as well as possible remedies can be investigated by means of a perfectly stirred reactor (PSR) calculation using a complex chemical mechanism for Iso-Octane (Behrendt, 1989) which also includes the NO formation reactions (3) as depicted in Figure 9. In this calculation the stoichiometry and pressure are varied at a fixed air inlet temperature and residence time.

BAUER and SPICHER: Gas Turbine (Turbo Fan Engine) and IC Engine Emissions 123
Figure 9: PSR Calculation: NO Formation and Possible Remedies
As expected the highest temperatures are encountered at conditions close to stoichiometric values, i.e. =1, with being the normalised air fuel ratio (AFR) or the inverse equivalence ratio . With an increase in pressure the maximum temperature increases as well due to the suppression of endo-thermic dissociation reactions. For a pressure of 30 bars the primary combustion reactions deter-mining the flame temperatures, being almost identical with the equilibrium values, are very fast. Due to the exponential dependence of the NO formation rate on temperature the pressure depend-ence of the amount of NO formed in the PSR is even more pronounced. It needs to be considered, that in gas turbines the combustor inlet temperature is linked with the overall pressure ratio through the polytropic nature of the compression process. Hence an increase in combustor pressure will ad-ditionally increase the combustor inlet temperature and lead to an even stronger increase in NO formation than obvious in this consideration.
Projecting the development of the past into the future it is very likely that the pressure ratios will continue to rise, maybe with reduced rates than so far. Hence any future reduction in NOx emission by x % relative to the CAEP II limit will result in a lower reduction in absolute numbers due to the slope of the limit and the tendency towards higher OPRs.
On the positive side it can be observed that NO formation is a significantly slower process than the mere combustion reactions. Even for an increased residence time of 10 ms the NO values are significantly lower than equilibrium at high pressures. Additionally NO formation is low at very rich and very lean conditions. Possible remedies are therefore to i) reduce the residence time in the combustor ii) stabilise combustion at very rich conditions and then switch to lean conditions by quickly adding a substantial amount of mixing air (RQL = Rich burn – Quick quench – Lean burn) or iii) burn the fuel at lean conditions. These possibilities will be briefly discussed in the following. 2.4 Low NOx Concepts 2.4.1 Rich Concepts Present aeroengine single annular combustors have achieved NOx reductions relative to earlier de-signs operating at the same thermodynamic parameters (P, T, AFR) using the RQL principle. Be-sides their characteristic to produce lower amounts of Nitrogen oxides than former combustor gen-erations, their generally rich primary zone has the advantage that combustion is very stable, even at
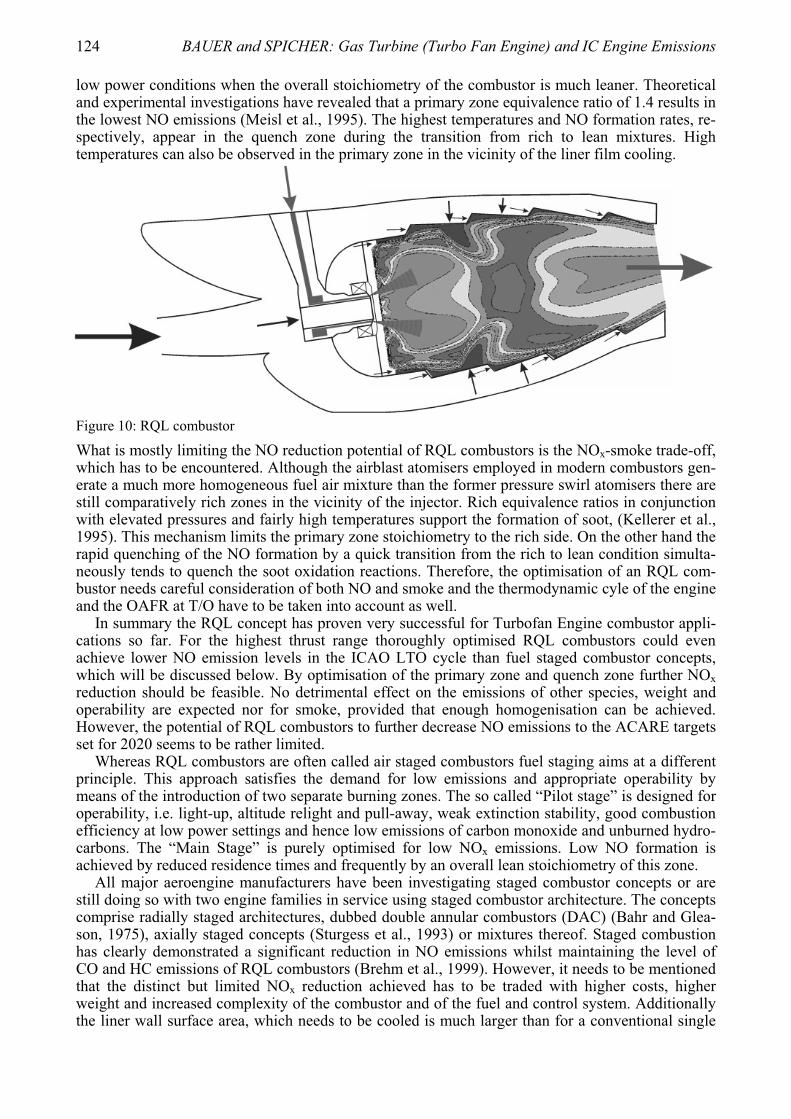
124 BAUER and SPICHER: Gas Turbine (Turbo Fan Engine) and IC Engine Emissions
low power conditions when the overall stoichiometry of the combustor is much leaner. Theoretical and experimental investigations have revealed that a primary zone equivalence ratio of 1.4 results in the lowest NO emissions (Meisl et al., 1995). The highest temperatures and NO formation rates, re-spectively, appear in the quench zone during the transition from rich to lean mixtures. High temperatures can also be observed in the primary zone in the vicinity of the liner film cooling.
Figure 10: RQL combustor
What is mostly limiting the NO reduction potential of RQL combustors is the NOx-smoke trade-off, which has to be encountered. Although the airblast atomisers employed in modern combustors gen-erate a much more homogeneous fuel air mixture than the former pressure swirl atomisers there are still comparatively rich zones in the vicinity of the injector. Rich equivalence ratios in conjunction with elevated pressures and fairly high temperatures support the formation of soot, (Kellerer et al., 1995). This mechanism limits the primary zone stoichiometry to the rich side. On the other hand the rapid quenching of the NO formation by a quick transition from the rich to lean condition simulta-neously tends to quench the soot oxidation reactions. Therefore, the optimisation of an RQL com-bustor needs careful consideration of both NO and smoke and the thermodynamic cyle of the engine and the OAFR at T/O have to be taken into account as well.
In summary the RQL concept has proven very successful for Turbofan Engine combustor appli-cations so far. For the highest thrust range thoroughly optimised RQL combustors could even achieve lower NO emission levels in the ICAO LTO cycle than fuel staged combustor concepts, which will be discussed below. By optimisation of the primary zone and quench zone further NOxreduction should be feasible. No detrimental effect on the emissions of other species, weight and operability are expected nor for smoke, provided that enough homogenisation can be achieved. However, the potential of RQL combustors to further decrease NO emissions to the ACARE targets set for 2020 seems to be rather limited.
Whereas RQL combustors are often called air staged combustors fuel staging aims at a different principle. This approach satisfies the demand for low emissions and appropriate operability by means of the introduction of two separate burning zones. The so called “Pilot stage” is designed for operability, i.e. light-up, altitude relight and pull-away, weak extinction stability, good combustion efficiency at low power settings and hence low emissions of carbon monoxide and unburned hydro-carbons. The “Main Stage” is purely optimised for low NOx emissions. Low NO formation is achieved by reduced residence times and frequently by an overall lean stoichiometry of this zone.
All major aeroengine manufacturers have been investigating staged combustor concepts or are still doing so with two engine families in service using staged combustor architecture. The concepts comprise radially staged architectures, dubbed double annular combustors (DAC) (Bahr and Glea-son, 1975), axially staged concepts (Sturgess et al., 1993) or mixtures thereof. Staged combustion has clearly demonstrated a significant reduction in NO emissions whilst maintaining the level of CO and HC emissions of RQL combustors (Brehm et al., 1999). However, it needs to be mentioned that the distinct but limited NOx reduction achieved has to be traded with higher costs, higher weight and increased complexity of the combustor and of the fuel and control system. Additionally the liner wall surface area, which needs to be cooled is much larger than for a conventional single

BAUER and SPICHER: Gas Turbine (Turbo Fan Engine) and IC Engine Emissions 125
annular combustor and requires more cooling effort and/or the use of more expensive materials. It is therefore unlikely that this concept will be further pursued.
2.4.2 Lean Concepts Reducing the combustion temperature can also been achieved by burning the fuel at overall lean conditions. Lean Direct Injection (LDI) is working according to this principle. Depending on the engine cycle at least 60% of the air needs to be directed through the injection system, see Figure 11. In order to avoid autoignition and flashback no/minor fuel/air mixing or fuel prevaporisation exter-nal to the combustor takes place. The challenge to achieve low combustion temperatures and hence low NO formation lies in the generation of a homogeneous lean mixture within the combustor but prior to combustion. Experimental investigations in model combustors working under engine like conditions have shown that low NOx values can be achieved, Figure 12 (Bauer, 2004). However, the leaner conditions for part load, idle and particularly transient engine operation require measures to establish stable combustion and limit the emissions of CO and UHC. Pilot diffusion flames and staging of the LDI injection systems are suited remedies.
Figure 11: LDI Injectors Featuring Radial Air Swirlers
Figure 12: NOx Emission Performance of LDI Systems

126 BAUER and SPICHER: Gas Turbine (Turbo Fan Engine) and IC Engine Emissions
However, pilot flames partially compromise the NOx reduction capabilities of LDI modules (Hassa et al., 2005). Close to the staging points CO emissions still can reach very high levels. Thermal management is required to avoid coking of residual fuel in those injectors which are switched off during staging. The injection systems are bulkier due to their higher air flow areas, therefore their stems tend to be thicker and heavier compared to present designs. Additional fuel lines and valves for staging purposes further add to weight and complexity.
Figure 13: Pilot Effect on NOx Emissions
Experience from the stationary gas turbine engines imply that thermoacoustic combustion oscilla-tions are likely to appear (Lieuwen and Yang, 2005). The related pressure oscillations impose a risk on combustor and engine integrity. If the inherent damping capability of the combustor (e.g. the liner cooling) is not sufficient to suppress the oscillations additional damping devices have to be employed (Macquisten et al. 2006), further adding to weight and complexity.
Partial or complete premixing and prevaporisation of fuel and air in the lean combustion regime (LPP, Lean Premixed Prevaporised Combustion) can lead to very low NOx levels, which has been successfully demonstrated on a laboratory scale for operational conditions corresponding to present mid size / large turbofan engines (Von der Bank, 2005). However, similar to the LDI concept stag-ing and piloting is required to achieve stability and low levels of CO / HC emissions considerably compromising the NOx reduction potential. The remarks concerning thermoacoustic oscillations, fuel coking, weight and complexity made for the LDI concept apply even more for LPP. Operability can be even more compromised by very short autoignition delay times for engines with an OPR > 40 (Cano-Wolff et al., 2001). For these applications the level of premixing and prevaporisation in a separate mixing device will have to be reduced in order to provide sufficient margin against autoig-nition. The potential remedy to externally prevaporise Kerosene (supercritical pressure) before in-

BAUER and SPICHER: Gas Turbine (Turbo Fan Engine) and IC Engine Emissions 127
jecting it into the mixing chamber needs to be investigated in order to better assess its applicability. Flashback into the premixing device either through the boundary layer (Schaefer et al., 2003) or by combustion induced vortex breakdown (Fritz et. al., 2004) is another concern.
The NOx emission reduction potential of LPP systems is very high, while CO and HC emissions are likely to be higher than present values. PM emissions from the pilot injector are expected. The challenge will be to simultaneously achieve low NOx levels and ensure save operability.
There are other concepts in discussion with either a very long term perspective like catalytic combustion (Griffin et al., 2004), FLOX® technology (Schuetz et al., 2005), alternative fuels e.g. hydrogen (Contreras et al., 1997) or liquified natural gas (LNG) or which address only local airport quality like water injection (Dagett, 2005). Another approach to reduce NOx by avoiding the OPR – NOx trade-off is the consideration of intercooled recuperative engine cycles (Broichhausen et al., 2000).
3 IC ENGINES
While IC engines only play a minor role in commercial aviation they have a major impact on local airport air quality due to their dominance in ground transportation. According to their different combustion principle spark ignition (SI) Engines and Diesel Engines have different levels of pollut-ants as indicated in Figure 14 for high load conditions. It is obvious that besides NOx SI engines emit considerable amounts of CO and moderate amounts of UHC whereas Diesel engines have high NOx and Soot emissions. It should also be mentioned that for part load conditions the raw NOxemissions of Diesel engines are considerably lower than for SI engines. As in jet engine combus-tors, formation of NOx primarily occurs via the Zeldovich mechanism in both SI and Diesel en-gines. The introduction of effective exhaust gas treatment as well as primary measures to control the combustion process has led to a significant reduction of all relevant species. New combustion technology is expected to further decrease the pollutant emissions from ground transportation in relative as well as in absolute numbers.
Figure 14: Raw emissions of SI and Diesel Engines
3.1 SI Engines For port injection engines working at stoichiometric conditions over the entire range of operation a three way catalyst can be used to effectively reduce NO to N2 and simultaneously oxidise CO and UHC to CO2 and H2O. In order to accomplish a high rate of NO conversion needs to be tightly controlled within a range of 0,99 < < 1,002 (Heywood, 1988), see Figure 15. This control is es-

128 BAUER and SPICHER: Gas Turbine (Turbo Fan Engine) and IC Engine Emissions
tablished by a probe measuring the oxygen content in the exhaust gases and a feedback loop to the engine management system controlling the amount of fuel injected.
Figure 15: Pollutant Formation in SI Engines (Port Injection) according to Merker et al. (2005)
The need to increase efficiency of SI engines has led to the development of gasoline direct injection engines (GDI) (Spicher et al., 2001). The homogeneous charge GDI engine still runs at = 1 like the port injection engines and uses a throttle valve to achieve the required power output. Fuel is in-jected during the intake stroke which allows a homogeneous mixing of fuel and air prior to combus-tion. The advantage of this system is thanks to the fuel evaporation within the cylinder, which re-duces the temperature and subsequently the susceptibility to knocking combustion. Hence, a higher compression ratio is possible yielding better efficiency and performance. For this type of engines the same exhaust gas treatment as for port injection engines is possible.
Figure 16: GDI Engines
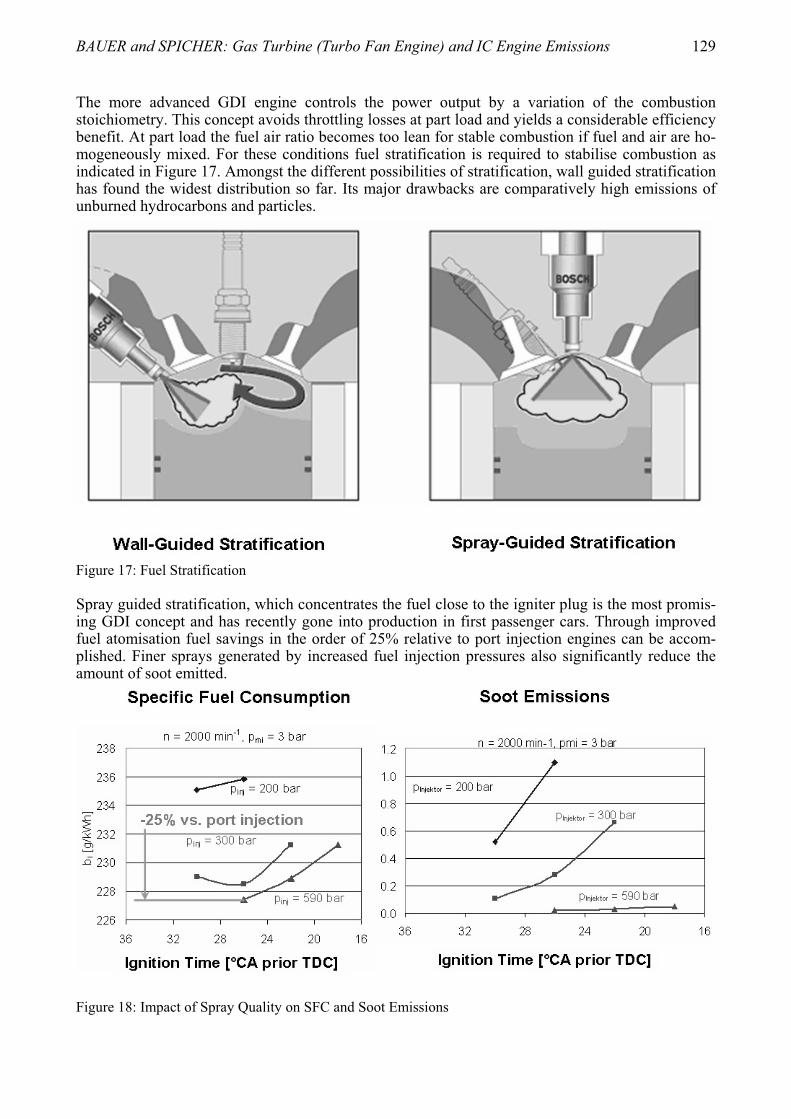
BAUER and SPICHER: Gas Turbine (Turbo Fan Engine) and IC Engine Emissions 129
The more advanced GDI engine controls the power output by a variation of the combustion stoichiometry. This concept avoids throttling losses at part load and yields a considerable efficiency benefit. At part load the fuel air ratio becomes too lean for stable combustion if fuel and air are ho-mogeneously mixed. For these conditions fuel stratification is required to stabilise combustion as indicated in Figure 17. Amongst the different possibilities of stratification, wall guided stratification has found the widest distribution so far. Its major drawbacks are comparatively high emissions of unburned hydrocarbons and particles.
Figure 17: Fuel Stratification
Spray guided stratification, which concentrates the fuel close to the igniter plug is the most promis-ing GDI concept and has recently gone into production in first passenger cars. Through improved fuel atomisation fuel savings in the order of 25% relative to port injection engines can be accom-plished. Finer sprays generated by increased fuel injection pressures also significantly reduce the amount of soot emitted.
Figure 18: Impact of Spray Quality on SFC and Soot Emissions

130 BAUER and SPICHER: Gas Turbine (Turbo Fan Engine) and IC Engine Emissions
NO emissions can either be addressed by means of storage catalysts, which need to be regenerated from time to time. Another principle is exhaust gas recirculation (EGR). Introduction of stratified EGR promises a reduction of NOx raw emissions by up to 99%. 3.2 Diesel Engines For Diesel Engines direct fuel injection has become state of the art. Power output is controlled by varying the combustion stoichiometry, with > 1.8. There are no throttling losses at part load, which partly accounts for their efficiency advantage over current SI engines. From an emissions point of view NOx and soot emissions at high power conditions are of major concern.
Figure 19: Pollutant Formation in Diesel Engines
There are many remedies to tackle these pollutants either by internal measures controlling the com-bustion process like improved fuel atomisation and injection timing and exhaust gas recirculation or by external exhaust gas cleaning. However, it is extremely challenging to accomplish low NOx and soot emissions and low fuel consumption at the same time. Filters which retain soot particles are presently introduced for new passenger cars and trucks. The filters have to be regenerated in time in order to avoid excessive pressure losses in the exhaust sys-tems. Regeneration is achieved, e.g. by periodically increasing the exhaust gas temperature to a level where soot can be completely converted into CO2.
Selective catalytic reduction of NOx is presently developed in order to comply with future emis-sions regulations. Trucks equipped with SCR systems are on the market since 2005. One approach is to inject urea into the hot exhaust gases which is thermally converted into ammonia in a first step. Subsequently the ammonia generated is used to reduce NO and NO2 into Nitrogen inside a catalyst (Mueller et al., 2003). 3.3 HCCIThe Homogeneous Charge Compression Ignition concept is presently investigated. It is intended to combine the advantages of Diesel and SI engines. It offers both high thermal efficiency and low emissions of NOx and soot particles (Assanis et al., 2003).
A HCCI engine uses a homogeneous lean mixture of fuel and air which is compressed until autoignition appears. Combustion is initiated at moderate temperatures of 800 to 1100 K. Due to the low temperature of the combustion process and the lean stoichiometry NO and particle formation is extremely low.
However, there are severe challenges to be faced such as control of the combustion process over a wide load range as well as the level of CO and HC emissions.

BAUER and SPICHER: Gas Turbine (Turbo Fan Engine) and IC Engine Emissions 131
4 CONCLUSIONS
Whereas CO and UHC emissions of Turbofan Engines have been substantially reduced in the past advances in reductions of NOx emissions have been partially compensated by the interdependence of NO formation and the engine pressure ratio. The latter has been increased in order to improve fuel efficiency. Amongst the different approaches the RQL concept has found the widest applica-tion and still holds some potential to further limit NO formation. However, the soot NOx trade-off has to be considered thoroughly. In order to achieve the ambitious ACARE NOx reduction targets set for the year 2020 a step change in combustion technology needs to be made. Lean concepts such as lean direct injection and lean premixed prevaporised combustion are the most promising con-cepts albeit their introduction has been prevented so far due to operability concerns. While LDI fea-tures the lower risk even for this concept fuel staging and piloting will be required to ensure safe operability. Rich pilot flames are expected to emit soot particles.
NOx emissions from IC engines have a major impact on local airport air quality. For Diesel en-gines also soot emissions are of concern. In contrast to jet engines not only internal measures but also exhaust gas treatment can be applied in order to reduce the environmental impact of IC en-gines. The superior fuel economy of gasoline direct injection engines needs yet to be fully explored. Improvement of fuel preparation additionally offers reductions in raw emissions for this concept. The HCCI technology simultaneously promises low NOx and soot emissions and outstanding effi-ciency provided that operability issues and CO and HC emissions will be adequately addressed.
REFERENCES
N.N., 2001: European Aeronautics: A Vision for 2020, Meeting society’s needs and winning global leader-ship. Office for Official Publications of European Communities, Luxembourg, ISBN 92-894-0559-7
N.N., 1993: ICAO Annex 16, International Standards and Recommended Practices, Environmental Protec-tion. Volume II, Aircraft Engine Emissions, 2nd ed. including Amendment 5 (Nov. 11, 2005)
Assanis, D.N., P.M. Najt, J.E. Dec, T.N. Asmus, F. Zhao, 2003: Homogeneous Charge Compression Ignition (HCCI) Engines. SAE 2003
Bahr, D.W. and C.C. Gleason, 1975: Experimental Clean Combustor Program Phase I Final Report. NASA CR-134732, June 1975
Bauer, H.-J., 2004: New Low Emission Strategies and Combustor Designs for Civil Aeroengine Applica-tions. Progress in Computational Fluid Dynamics. Volume 4, Nos. 3-5, pp 130-142
Baulch, D.L., C.J. Cobos, A.M. Cox, P. Frank, G. Haymann, T. Just, J.A. Kerr, T. Murrels, M.J. Pilling, J. Twe, R.W. Walker and J. Warnatz, 1991: Compilation of Rate Data for Combustion Modelling. Supple-ment I.J. Phys. Chem. Ref. Data. p. 847.
Behrendt, F. (1989): Simulation laminarer Gegenstromdiffusionsflammen unter Verwendung detaillierter Reaktionsmechanismen. PhD Theses, Universität Stuttgart.
Brehm, N., T. Schilling, H.-J. Bauer, G. Bittlinger, G. Kappler, L Rackwitz, A. Chatziapostolou, K.-J. Schmidt 1999: Development of an Annular Combustor with Axially Integrated Burning Zones and Dem-onstration in a BR700 Core Engine. 14th International Symposium on Airbreathing Engines, Florence, Italy, 5-10 Sept. 1999.
Broichhausen, K., H. Scheugenpflug, Ch. Mari, A. Barbot, 2000: CLEAN The European Initiative Towards Ultra Low Emissions Engines. ICAS 2000, Harrogate, UK, Aug 27 – Sept 1
Cano-Wolff, M., R. Koch, and S. Wittig, 2001: Experimental and Numerical Investigation of the Autoigni-tion of Fuel Sprays in Preheated Flows. 20. Deutscher Flammentag, VDI Berichte, Vol. 1629, pp. 301-306
Contreras, A., S. Yigit, K. Oezay and T.N. Veziroglu, 1997: Hydrogen as Aviation Fuel: A Comparison With Hydrocarbon Fuels. Int. J. Hydrogen Energy, Vol. 22, No. 10/11, pp. 1053-1060
Dagett, D., 2005: Water Injection Feasibility for Boeing 747 Aircraft. NASA/CR-2005-213656Fritz, J., M. Kroener, T. Sattelmayer, 2004: Flashback in a Swirl Burner With Cylindrical Premixing Zone,
ASME Journal of Engineering for Gas Turbines and Power, Vol. 126, Issue 2, pp. 276-283 Greenhough, V.W. and A.H. Lefebvre, 1957: Some Applications of Combustion Theory to Gas Turbine De-
velopment. Sixth Symposium (International) on Combustion, Reinhold, New York, pp. 858-869 Griffin, T., D. Winkler, M. Wolf, C. Appel, and J. Mantzaras, 2004: Staged catalytic combustion method for
the advanced zero emissions gas turbine power plant. ASME paper GT2004-54101

132 BAUER and SPICHER: Gas Turbine (Turbo Fan Engine) and IC Engine Emissions
Hassa, C., J. Heinze, L. Rackwitz, and T. Doerr, 2005: Validation Methodology for the Development for Low Emission Fuel Injectors for Aero-Engines. XVII International Symposium on Air Breathing Engines (ISABE), 4-9 September 2005, Munich, Germany
Heywood, J.B., 1988: Internal Combustion Engine Fundamentals. McGraw-Hill Inc. Kellerer, H., A. Mueller, H.-J. Bauer and S. Wittig, 1995: Soot Formation from Rich Hydrocarbon Oxidation
under Elevated Pressure Conditions. 20th International Symposium on Shock Waves, Pasadena, CA, USA, July 23 – 28
Lieuwen, T.C., V. Yang (Eds.), 2005: Combustion Instabilities in Gas Turbine Engines – Operational Ex-perience, Fundamental Mechanisms, and Modelling. AIAA, Volume 210, Progress in Astronautics and Aeronautics
Macquisten, M.A., A. Holt, M. Whiteman, A.J. Moran, and J. Rupp, 2006: Passive Damper LP Tests For Controlling Combustion Instability. ASME paper GT2006-90874, 51st ASME Turbo Expo, Barcelona, Spain, May 8-11
Meisl, J., H.-J. Bauer and S. Wittig 1995: NOx Emissions Reduction through Staged Combustion at Elevated Pressures. DGLR German Aerospace Congress, Bonn, 26.-29. September (German Language)
Merker, G.P., C. Schwarz, G. Stiesch, F. Otto, 2005: Simulating Combustion: Simulation of Combustion and Pollutant Formation for Engine-Development. Springer
Mueller, W., H. Oelschlegel, A. Schaefer, N. Hakim, K. Binder, 2003: Selective Catalytic Reduction – Europe’s NOx Reduction Technology. SAE paper 2003-01-2304
Rolls-Royce, 2005: The Jet Engine. ISBN 0 902121 2 35 Saravanamuttoo, H.I.H., G.F.C. Rogers, H. Cohen, 2001: Gas Turbine Theory. 5th edition, Prentice Hall Schaefer, O., R. Koch and S. Wittig, 2003: Flashback in Lean Premixed Prevaporized Combustion: Non-
swirling Turbulent Pipe Flow Study. ASME Journal of Engineering for Gas Turbines and Power, Vol. 125, pp. 670-676
Schuetz, H., R. Lueckerath, T. Kretschmer , B. Noll and M. Aigner, 2005: Complex chemistry simulation of FLOX® - 'Flameless Oxidation' – Combustion. 8th International Conference on Energy for a Clean Envi-ronment, Cleanair 2005, Lisbon, Portugal
Spicher, U., A. Koelmel, H. Kubach, G. Toepfer, 2001: Combustion in Spark Ignition Engines with Direct Injection. SAE paper 2001-01-0649
Sturgess, G., R. McKinney and S. Morford, 1993: Modification of Combustor Stoichiometry Distribution for Reduced NOx-Emissions from Aircraft Engines. Journal of Engineering for Gas Turbines and Power,Vol. 115, July 1993, pp. 570-580
Von der Bank, R., T. Doerr, M. Linne, A. Lindholm, and C. Guin, 2005: Investigations on Internally Staged LP(P) Kerosene Injection Systems. XVII International Symposium On Air Breathing Engines (ISABE), 4-9 September 2005, Munich, Germany
Zeldovich, Y.B., 1946: The Oxidation of Nitrogen in Combustion and Explosions. Acta Physicochim. USSR 21

Proceedings of the TAC-Conference, June 26 to 29, 2006, Oxford, UK 133
Aerosol Evolution from a busy Road in North-West England
B. Davison*
Environmental Science Department, Faculty of Science and Technology, Lancaster University, Lancaster, LA1 4YQ D. Whyatt Geography Department, Faculty of Science and Technology, Lancaster University LA1 4YB
C Boardman Department of Earth Sciences, The Open University, Walton Hall, Milton Keynes. MK7 6AA
Keywords: aerosol vehicle emissions, nano-particles, horizontal profile
ABSTRACT: Motor vehicle emissions are the most significant source of particulate matter (PM) in urban environments (Morawska et al., 1999). This study was undertaken to observe the evolution of aerosols from a busy road, concentrating specifically of the aerosol total number maximum and number size distribution. A Grimm Aerosol Technik (5.400) CPC and DMA 5.5-900 classifier was used to measure ultra-fine particles from 9.8 nm to 1.1 m at varying distances up to 100 m from the kerbside. Particles number concentration was observed to rise with increasing horizontal dis-tance from the road up to about 100 m. As this occurred the number of fine particle was seen to in-crease as numbers of larger particles declined. Under stable atmospheric conditions the highest par-ticles number density was found to occur at 40 m from the road (see Figure 1). These findings are discussed and suggested mechanisms considered.
1 INTRODUCTION
Air pollution is responsible for hundreds of thousands of premature deaths around the world each year. The control of atmospheric particulate matter (PM) through the National Air Quality Strategy (NAQS) only legislates for a small fraction of particulate matter, which leaves the majority of parti-cles within the atmosphere unregulated. Epidemiological data from air pollution studies has shown that particulate matter represents a significant risk to human health with prolonged exposure to at-mospheric PM particularly the unregulated fine and ultra fine particles (within the ranges of <1 and <0.1 m, respectively) having a detrimental effects on human health (Dockery et al., 1993; Laden et al., 2000).
In urban environments, motor vehicle emissions are the most significant source of PM. Schwartz et al. (1996) suggested fine and ultra fine particles emitted from combustion sources may pose a major health risk for humans as they are more readily transported deeper into the respiratory sys-tem.
This study was undertaken to observe the evolution of PM from a busy road, concentrating spe-cifically on the total number maximums and number size distributions.
2 OBSERVATIONS
Using a busy main road in north-west England with a prevailing wind direction originating from the nearby Irish Sea measurements were collected downwind at varying distance from the road side during crosswinds. Temperature, wind speed and traffic flow were also monitored during sampling. The sampling stations were not screened by vegetation or hedges from the section of road used. Such vegetation barriers are commonly used alongside roads in the UK to screen the road from
* Corresponding author: B. Davison, Environmental Science Department, Faculty of Science and Technology, Lancaster University, Lancaster, LA1 4YQ . Email: [email protected]

134 DAVISON et al.: Aerosol Evolution from a busy road in North-West England
0
500
1000
1500
2000
2500
3000
-20 0 20 40 60 80 100 120distance/m
tota
l par
ticle
s/cc
nearby dwellings and help cut down noise. This also has the effect of filtering gases and aerosols emitted from the vehicles. The road ran perpendicular to the prevailing wind which originated from a clean maritime sector. This site offers an ideal opportunity to study the emissions of road vehicles and their transformations with distance from the road source.
Sampling was conducted under westerly winds to avoid possible contamination from other sources. Sampling was undertaken from mid morning until mid afternoon (approximately 10am to 4pm local time) to maintain a constant traffic flow and avoid possible increases in flow due to rush hour. In general about 1200 vehicles an hour past the site with around 20% being diesel powered vehicles.
At each sampling site five sample spectra were collected using the aerosol equipment and these were averaged. Sampling took approximately 30 minutes per site. Downwind sites were located at 3, 6, 10, 15, 25, 40, 60 and 100 m from the road side. Measurements were also taken at a back-ground site 20 m upwind of the road. Results from this site were lower than those from the down-wind sites.
3 RESULTS
At each site total particle numbers were summed across the size range of the instrument. Figure 1 shows the total particle maximum occurred at a distance of approximately 40 m from the road side.
Particles numbers were summed over selected size bands. This and the aerosol size distribution data showed an increase in the number of ultra fine particle (<100nm) some distance from the road side as shown in Figure 2.
These findings are not easily explained by conventional aerosol dynamic and dispersion models and could not be reproduced using the ADMS road dispersion model. Such models tend to consider aerosols to behave in a simplified standard manner at ambient temperatures with a reduction in par-ticle number with distance travelled from the source due to dilution and deposition (Carruthers et al., 2003). Particle growth is assumed to occur due to condensation and coagulation processes.
Figure 1. Change in total particle number density with distance from the road showing the maximum in par-ticle numbers occurring at 40m.
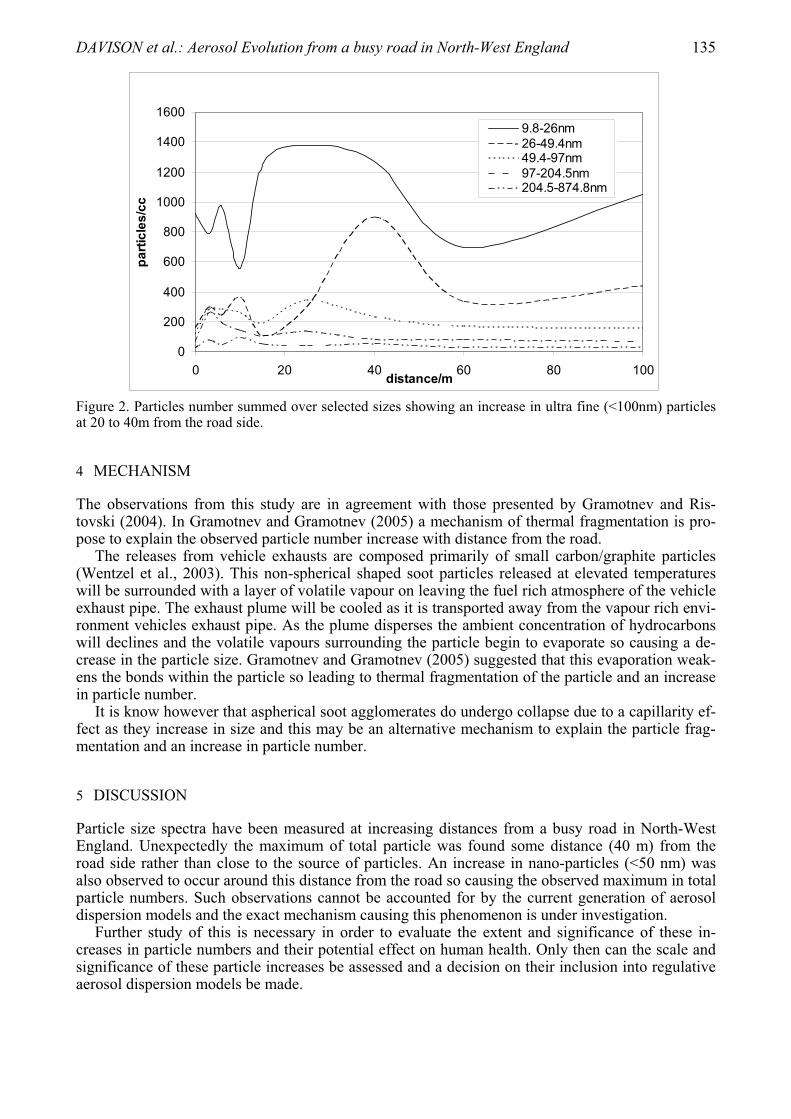
DAVISON et al.: Aerosol Evolution from a busy road in North-West England 135
0
200
400
600
800
1000
1200
1400
1600
0 20 40 60 80 100distance/m
parti
cles
/cc
9.8-26nm26-49.4nm49.4-97nm97-204.5nm204.5-874.8nm
Figure 2. Particles number summed over selected sizes showing an increase in ultra fine (<100nm) particles at 20 to 40m from the road side.
4 MECHANISM
The observations from this study are in agreement with those presented by Gramotnev and Ris-tovski (2004). In Gramotnev and Gramotnev (2005) a mechanism of thermal fragmentation is pro-pose to explain the observed particle number increase with distance from the road.
The releases from vehicle exhausts are composed primarily of small carbon/graphite particles (Wentzel et al., 2003). This non-spherical shaped soot particles released at elevated temperatures will be surrounded with a layer of volatile vapour on leaving the fuel rich atmosphere of the vehicle exhaust pipe. The exhaust plume will be cooled as it is transported away from the vapour rich envi-ronment vehicles exhaust pipe. As the plume disperses the ambient concentration of hydrocarbons will declines and the volatile vapours surrounding the particle begin to evaporate so causing a de-crease in the particle size. Gramotnev and Gramotnev (2005) suggested that this evaporation weak-ens the bonds within the particle so leading to thermal fragmentation of the particle and an increase in particle number.
It is know however that aspherical soot agglomerates do undergo collapse due to a capillarity ef-fect as they increase in size and this may be an alternative mechanism to explain the particle frag-mentation and an increase in particle number.
5 DISCUSSION
Particle size spectra have been measured at increasing distances from a busy road in North-West England. Unexpectedly the maximum of total particle was found some distance (40 m) from the road side rather than close to the source of particles. An increase in nano-particles (<50 nm) was also observed to occur around this distance from the road so causing the observed maximum in total particle numbers. Such observations cannot be accounted for by the current generation of aerosol dispersion models and the exact mechanism causing this phenomenon is under investigation.
Further study of this is necessary in order to evaluate the extent and significance of these in-creases in particle numbers and their potential effect on human health. Only then can the scale and significance of these particle increases be assessed and a decision on their inclusion into regulative aerosol dispersion models be made.

136 DAVISON et al.: Aerosol Evolution from a busy road in North-West England
REFERENCES
Carruthers, D., J. Blair, and K. Johnson, 2003 Comparison of ADMS-Urban, NETCEN and ERG Air Quality Predictions for London, DEFRA, Editor. Cambridge Environmental Research Consultants Ltd.
Dockery, D.W., A. Pope, X. Xu, J.D. Spengler, J.H. Ware, M.E. Fay, B.G. Ferris, F.E. Speizer, 1993: An as-sociation between air pollution and mortality in six US Cities. New England Journal of Medicine 329,1753–1759.
Gramotnev, D.K. and G. Gramotnev, 2005: A new mechanism of aerosol evolution near a busy road: frag-mentation of nanoparticles. Journal of Aerosol Science, 2005. 36(3), 323-340.
Gramotnev, G. and Z. Ristovski, 2004: Experimental investigation of ultra-fine particle size distribution near a busy road. Atmospheric Environment. 38(12), 1767-1776.
Laden F, L.M. Neas, D.W. Dockery, J. Schwartz, 2000: Association of fine particulate matter from different sources with daily mortality in six US cities. Environmental Health Perspectives 108, 941-947
Morawska, L., S. Thomas, D. Gilbert, C. Greenaway, E. Rijnders, 1999: A study of the horizontal and verti-cal profile of submicrometer particles in relation to a busy road. Atmospheric Environment 33, 1261–1274.
Schwartz, J., D.W. Dockery, L.M. Neas, 1996: Is daily mortality associated specifically with fine particles? Journal of the Air and Waste Management Association 46, 927–939.
Wentzel, M., H. Gorzawski, K-H. Naumann, H. Saathoff, and S. Weinbruch, 2003: Transmission electron microscopical and aerosol dynamical characterization of soot aerosols. Journal of Aerosol Science, 34,1347–1370.

Proceedings of the TAC-Conference, June 26 to 29, 2006, Oxford, UK 137
Investigation of road traffic and wood burning emissions in Switzerland using a mobile laboratory
S. Weimer*, C. Mohr, A.S.H. Prévôt Laboratory of Atmospheric Chemistry, PSI, Switzerland
M. Mohr Laboratory for internal combustion engines, EMPA Switzerland
Keywords: traffic emissions, wood burning, mobile laboratory
ABSTRACT: On occasion of the project Aerowood (Aerosols from wood burning versus other sources) the spatial and temporal variation of selected aerosol parameters were assessed for two val-leys in Southern Switzerland using a mobile laboratory. Results showed that the number concentra-tion for smaller particle diameter (< 30 nm) increased with the proximity to the highway whereas larger particles played the dominant role in villages.
1 INTRODUCTION
For the assessment and understanding of the atmospheric processes that involve aerosols, it is nec-essary to study more aerosol properties than just the particulate mass.
On the one hand number concentration measurements for example from traffic emissions are in addition to mass measurements very important since the small particles (< 30 nm) have an potential high health effect as well as larger particles but do not contribute a lot to mass emissions. Since the last years engine technology is being improved to remove larger particles (> 30 nm) more effi-ciently (Kittelson 1998). However, smaller particles are still being detected depending on various parameters such as dilution, weather conditions etc.
On the other hand sources as wood burning seem to play a role concerning mass emissions since wood burning is still commonly used for domestic heating during winter time in some alpine val-leys in Southern Switzerland. The goal of this study was to investigate the contribution of road traf-fic to wood burning emissions in two alpine valleys.
2 METHOD
2.1 The mobile laboratory An IVECO Turbo Daily Transporter was selected as a rolling platform for the measuring equip-ment. More information concerning the vehicle can be found in Bukowiecki et al. (2002).The in-struments inside the mobile laboratory included a Condensation Particle Counter (CPC), a Scanning Mobility Particle Sizer (SMPS), a Diffusion Charger (DC), a Fast Mobility Particle Sizer (FMPS) as well as a CO2 gas analyzer (Table 1).2.2 Measurement site In winter 2005/06 mobile measurements were performed in Roveredo in the Mesolcina Valley alongside the San Bernadino route and in the Riviera Valley alongside the San Gotthardo route. Both highways are the main transit route of the Swiss Alps. From November 30th 2005 until De-cember 14th 2005 specific routes were selected including highways, rural roads and residential areas in villages. Every trip was done at least three times. At defined points the engine of the mobile plat-
* Corresponding author: Silke Weimer, Dept. 137, EMPA, Ueberlandstrasse 129, CH-8600 Duebendorf, Switzer-
land. Email: [email protected]

138 WEIMER et al.: Investigation of road traffic and wood burning emissions in Switzerland …
form was turned of and stationary measurements were performed. Using the geographical informa-tion (GPS, Garmin IIplus) the data could be assigned to the specific area. Since the measurements were performed in winter time the average ambient temperature was around -5 °C.
Table 1: Instrumentation of the PSI mobile measurement laboratory
Parameter Instrument Time resolution Detection limit
number conc. > 10 nm CPC 3010 TSI 1 s 0.0001 cm3
size distribution 7 – 310 nm
SMPS; DMA,CPC 3010 TSI
2 min Not defined
active surface area DC / Matterengineering LQ1-DC
1 s 10 m2 cm-3
size distribution 5.6 – 560 nm
FMPS / TSI 1 s Not defined
CO2 CO2-Monitor (IR absorption),LI-COR
1 s 0.1 ppm
3 ROAD TRAFFIC VERSUS WOOD BURNING EMISSIONS IN AN ALPINE VALLEY
Compared to road traffic emissions which contribute to particulate matter on highways, roads and play an important role in villages as well, wood burning emissions contribute mainly in villages. For Roveredo, for example around 70 – 80 % of the households use wood for their heating system. In addition to these emissions atmospheric temperature inversions contribute to enhanced levels of particle concentrations throughout winter time in the Mesolcina valley. Almost no dilution takes place.
Average values for number and volume concentrations were calculated by assigning parts of the driven routes to “rural”, “highway” and “village”. Figure 1 shows two bar plots for the Mesolcina Valley. On the left hand side number concentration versus “Rural”, “Highw.” and “village” is pre-sented. The total concentration from FMPS measurements is indicated in black, total concentration for particle diameter larger than 10 nm is shown in white. Highest number concentrations are de-tected for highways whereas the lowest concentrations are measured for the village. Comparing to-tal concentration of FMPS and FMPS (> 10nm) demonstrates that the number concentration is dominated by small particle diameters mainly on the highway. On the right hand side one can ob-serve that the concentration for the volume is higher for the village compared to rural road and highway. It seems that mass emissions are higher in villages.
Figure 1. Bar plot for number concentration and volume concentration for rural road, highway and village in the Mesolcina Valley

WEIMER et al.: Investigation of road traffic and wood burning emissions in Switzerland … 139
Size distributions for number and volume concentrations in the Riviera Valley are shown in Figure 2 and 3, respectively. A distinctive mode is found at a particle diameter around 10 nm for the high-way. An additional mode is found at around 80 nm particle diameter and is seen for both the vil-lages and the highways. However, the volume size distribution in Figure 3 indicates a mode at around 150 nm particle diameter. The “village” volume size distribution exceeds the volume distri-bution for the highway.
Figure 2. Number size distribution for the Riviera Valley.
Figure 3. Volume size distribution for the Riviera Valley.
As stated above the aerosol number concentration is very high on the highway. This is due to heavy traffic emissions which favour nucleation if there is little surface area to absorb on for cold tem-peratures (Bukowiecki et al. 2003, Kreyling et al. 2003). With distance from the highway this nu-cleation mode disappears in the number size distribution and an accumulation mode dominates the volume size distribution while approaching villages.
140 WEIMER et al.: Investigation of road traffic and wood burning emissions in Switzerland …
4 CONCLUSION
Mobile measurements were performed during the Aerowood campaign in Southern Switzerland in winter 2005/06. The investigations demonstrated that wood burning in villages are more important for the aerosol mass emissions in these valleys than the road traffic emissions. But the road traffic emissions play the dominant role for the number concentration, especially for smaller particles around 10 nm.
REFERENCES
Bukowiecki N., J. Dommen, A.S.H. Prévôt, R.Richter, E. Weingartner, U. Baltensperger (2002): A mobile pollutant measurement laboratory – measuring gas phase and aerosol ambient concentrations with high spatial and temporal resolution. Atmospheric Environment 36, 5569 – 5579.
Bukowiecki, N., J. Dommen, A.S.H. Prévôt, E. Weingartner, and U. Baltensperger (2003): Fine and ultrafine particles in the Zuerich (Switzerland) area measured with a mobile laboratory: an assessment of the sea-sonal and regional variation throughout a year. Atmos. Chem. Phys., 3, 1477 – 1494.
Kittelson D., 1998: Engines and nanoparticles: a review. Journal of Aerosol Science 25, 575-588. Kreyling W.G., T. Tuch, A. Peters, M. Pitz, J. Heinrich, M. Stölzel, J. Cyrys, J. Heyder, H.E. Wichmann
(2993): Diverging lon-term trends in ambient urban particle mass and number concentrations associated with emission changes caused by the German unification. Atmospheric Environment 37, 3841 – 3848.


