Schools block national funding formula: technical note · National funding formula pupil-led unit...
52
Schools block national funding formula: technical note December 2016
-
Upload
truongdiep -
Category
Documents
-
view
217 -
download
1
Transcript of Schools block national funding formula: technical note · National funding formula pupil-led unit...

Schools block national funding formula: technical note
December 2016
2
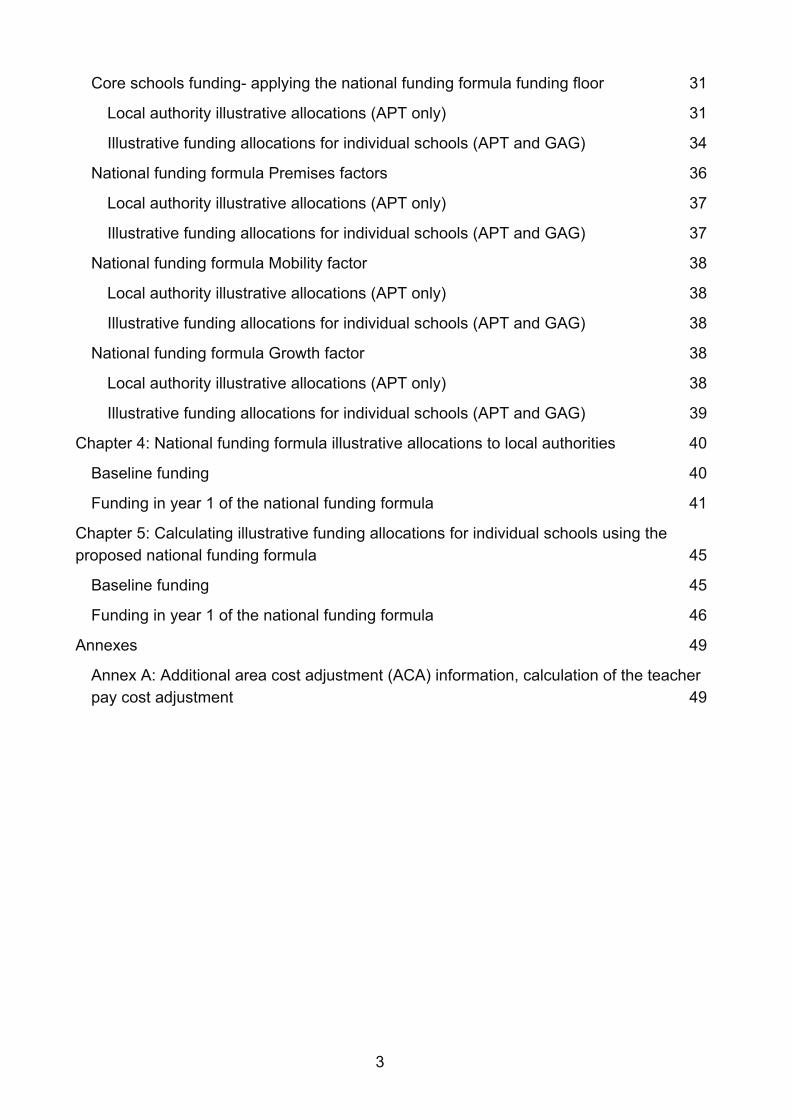
Contents Chapter 1: Introduction and overview 4
Introduction 4
Data and modelling approach 5
Total budget figures in the published illustrative schools block local authority allocations 6
Chapter 2: Establishing pupil counts and baseline funding for schools and local authorities 9
Core schools funding 9
LA illustrative allocations (APT only) 9
Illustrative funding allocations for individual schools (APT and GAG) 10
Premises factors 11
Local authority illustrative allocations (APT only) 11
Illustrative funding allocations for individual schools (APT and GAG) 11
Mobility factor 12
Local authority illustrative allocations (APT only) 12
Illustrative funding allocations for individual schools (APT and GAG) 12
Growth factor 12
Local authority illustrative allocations (APT only) 12
Illustrative funding allocations for individual schools (APT and GAG) 15
Summary of total schools block baseline 15
Local authority illustrative allocations (APT only) 15
Illustrative funding allocations for individual schools (APT and GAG) 16
Chapter 3: Calculating funding through the national funding formula factors 17
Core schools funding 17
Basic per pupil funding 18
Additional needs funding 19
Lump sum 27
Sparsity 27
Area cost adjustment (ACA) 29
National funding formula pupil-led unit of funding before applying the funding floor 30
National funding formula school-led unit of funding 30
3
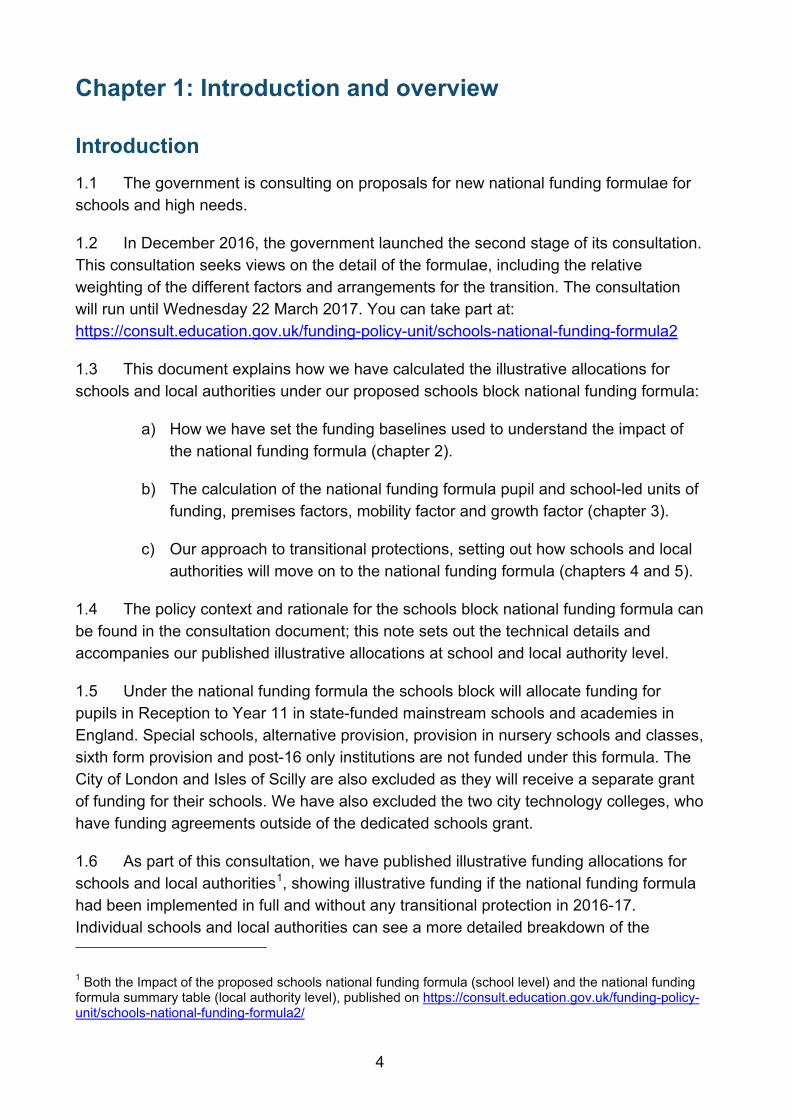
Core schools funding- applying the national funding formula funding floor 31
Local authority illustrative allocations (APT only) 31
Illustrative funding allocations for individual schools (APT and GAG) 34
National funding formula Premises factors 36
Local authority illustrative allocations (APT only) 37
Illustrative funding allocations for individual schools (APT and GAG) 37
National funding formula Mobility factor 38
Local authority illustrative allocations (APT only) 38
Illustrative funding allocations for individual schools (APT and GAG) 38
National funding formula Growth factor 38
Local authority illustrative allocations (APT only) 38
Illustrative funding allocations for individual schools (APT and GAG) 39
Chapter 4: National funding formula illustrative allocations to local authorities 40
Baseline funding 40
Funding in year 1 of the national funding formula 41
Chapter 5: Calculating illustrative funding allocations for individual schools using the proposed national funding formula 45
Baseline funding 45
Funding in year 1 of the national funding formula 46
Annexes 49
Annex A: Additional area cost adjustment (ACA) information, calculation of the teacher pay cost adjustment 49
4
Chapter 1: Introduction and overview
Introduction 1.1 The government is consulting on proposals for new national funding formulae for schools and high needs.
1.2 In December 2016, the government launched the second stage of its consultation. This consultation seeks views on the detail of the formulae, including the relative weighting of the different factors and arrangements for the transition. The consultation will run until Wednesday 22 March 2017. You can take part at: https://consult.education.gov.uk/funding-policy-unit/schools-national-funding-formula2
1.3 This document explains how we have calculated the illustrative allocations for schools and local authorities under our proposed schools block national funding formula:
a) How we have set the funding baselines used to understand the impact of the national funding formula (chapter 2).
b) The calculation of the national funding formula pupil and school-led units of funding, premises factors, mobility factor and growth factor (chapter 3).
c) Our approach to transitional protections, setting out how schools and local authorities will move on to the national funding formula (chapters 4 and 5).
1.4 The policy context and rationale for the schools block national funding formula can be found in the consultation document; this note sets out the technical details and accompanies our published illustrative allocations at school and local authority level.
1.5 Under the national funding formula the schools block will allocate funding for pupils in Reception to Year 11 in state-funded mainstream schools and academies in England. Special schools, alternative provision, provision in nursery schools and classes, sixth form provision and post-16 only institutions are not funded under this formula. The City of London and Isles of Scilly are also excluded as they will receive a separate grant of funding for their schools. We have also excluded the two city technology colleges, who have funding agreements outside of the dedicated schools grant.
1.6 As part of this consultation, we have published illustrative funding allocations for schools and local authorities1, showing illustrative funding if the national funding formula had been implemented in full and without any transitional protection in 2016-17. Individual schools and local authorities can see a more detailed breakdown of the
1 Both the Impact of the proposed schools national funding formula (school level) and the national funding formula summary table (local authority level), published on https://consult.education.gov.uk/funding-policy-unit/schools-national-funding-formula2/
5
formula calculation and underpinning characteristics data via COLLECT. Pupil characteristics data and the underlying national funding formula calculations for individual schools have not been published, due to data confidentiality restrictions. Subject to approval, school-level national funding formula illustrative funding calculations and the aggregate data underpinning them are available for use by any organisation or person who, for the purpose of promoting the education or well-being of children in England, is conducting research or analysis, producing statistics, or providing information, advice or guidance. To request access to this data, please email [email protected] with ‘NFF data access request’ in the subject line.
1.7 Please note that in the national funding formula data published in December 2016 we have not included allocations for new schools that are still filling up. The formula is based on schools having pupils in all year groups. We propose to take a tailored approach for new schools that are still filling up, to make sure they are funded fairly. These are maintained schools, free schools, or academies that the local authority has told us have opened within the last 7 years, and do not have pupils in all year groups yet. They receive high per-pupil funding in their first years because the lump sum inflates their per-pupil funding. As the school expands, their overall budget grows as well, but their per-pupil funding falls because the lump sum becomes a smaller part of their budget.
1.8 If we were to calculate illustrative end point national funding formula allocations for schools that are still filling up on the basis on which we have calculated them for all schools (i.e. using data about pupil numbers and funding baselines from 2016-17), we would not be funding these schools fairly. Instead we propose to take into account the fact that they have not yet filled all year groups. We propose to work out the baseline funding and eventual national funding formula allocations the school would receive if they had pupils in all year groups, and then apply the 3% funding floor where required. We need to confirm the data to support this calculation as part of the early phase of the consultation period. Data for these schools has therefore not been included in the national funding formula illustrative allocations – we will provide relevant schools with illustrations of their funding levels under the proposed national funding formula in January 2017, and publish these at the same time.
Data and modelling approach 1.9 To illustrate the impact of the proposed formula, our overall approach has been to model what would have happened to each school’s funding allocation if the national funding formula had been implemented in full and without transitional protections in 2016-17. We want schools and LAs to be able to compare the impact of the proposed formula directly to the funding they receive now. Future funding allocations will be adjusted to take into account changing pupil numbers and characteristics, so these illustrative allocations should not be taken as firm allocations for any particular year.
6
1.10 As part of the consultation we have published two sets of schools block illustrative figures, one at local authority level and one at school level2. The difference between these publications is the data used to illustrate the national funding formula impact. For the purposes of this consultation, we have used the pupil characteristics data provided to us by local authorities through the 2016-17 Authority Proforma Tool (APT). Funding baselines data for maintained schools also comes from the 2016-17 APT. Funding baselines data for academies is taken from their 2016/17 General Annual Grant (GAG). For maintained schools, these illustrations will not reflect any changes since March 2016. For academies, these illustrations will not reflect any changes since May 2016. If you have queries about the data or calculation for particular schools, or about the data we have used, please contact the department using the email address below, setting the subject as “NFF data query”: [email protected].
a) Illustrative local authority allocations - in the first year of the national funding formula in 2018-19, the formula will be used to calculate schools block allocations for each local authority. Local authorities will continue to set individual school budgets themselves in the first year. The local authority illustrative allocations that we have published are based on 2016-17 APT data and use October 2015 census pupil counts, to be consistent with the pupil counts used in allocations currently.
b) Illustrative impact on schools – we have used pupil numbers data from the 2016-17 APT for maintained schools and from the 2016/17 GAG for academies. These will be the same as the October 2015 census count for many schools but for some, such as academies funded initially on estimates, they may not be. Thus the total of the illustrative impact on schools will not match the total of the illustrative local authority allocations.
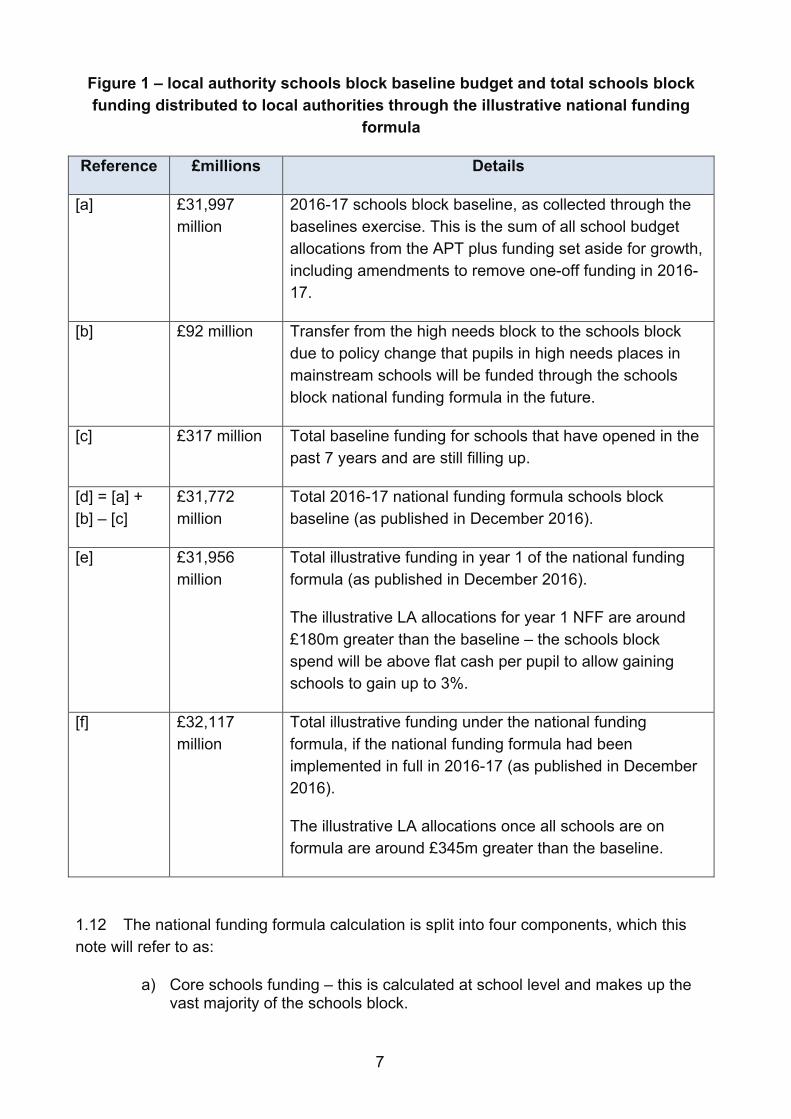
Total budget figures in the published illustrative schools block local authority allocations 1.11 We are making some technical adjustments to baselines - transferring some funding between the DSG blocks; and forecasting spend of around £200 million above flat cash per pupil in year 1 of the national funding formula. The published total schools block figures and illustrative total spend under the national funding formula do not therefore directly match published figures for 2016-17. Figure 1 below starts with the 2016-17 schools block baseline from the 2016-17 baselines exercise and shows the adjustments that have been made.
2 See footnote 1 for link to published tables.
7
Figure 1 – local authority schools block baseline budget and total schools block funding distributed to local authorities through the illustrative national funding
formula
Reference £millions Details
[a] £31,997 million
2016-17 schools block baseline, as collected through the baselines exercise. This is the sum of all school budget allocations from the APT plus funding set aside for growth, including amendments to remove one-off funding in 2016-17.
[b] £92 million Transfer from the high needs block to the schools block due to policy change that pupils in high needs places in mainstream schools will be funded through the schools block national funding formula in the future.
[c] £317 million Total baseline funding for schools that have opened in the past 7 years and are still filling up.
[d] = [a] + [b] – [c]
£31,772 million
Total 2016-17 national funding formula schools block baseline (as published in December 2016).
[e] £31,956 million
Total illustrative funding in year 1 of the national funding formula (as published in December 2016).
The illustrative LA allocations for year 1 NFF are around £180m greater than the baseline – the schools block spend will be above flat cash per pupil to allow gaining schools to gain up to 3%.
[f] £32,117 million
Total illustrative funding under the national funding formula, if the national funding formula had been implemented in full in 2016-17 (as published in December 2016).
The illustrative LA allocations once all schools are on formula are around £345m greater than the baseline.
1.12 The national funding formula calculation is split into four components, which this note will refer to as:
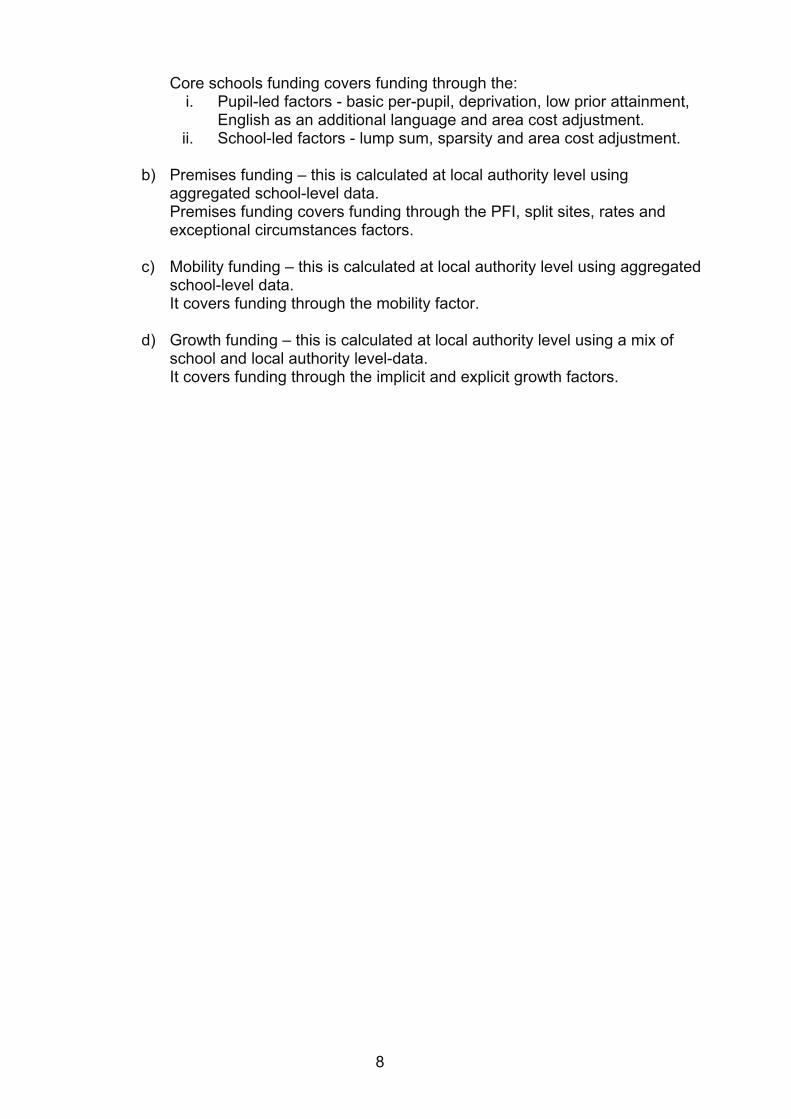
a) Core schools funding – this is calculated at school level and makes up the vast majority of the schools block.
8
Core schools funding covers funding through the: i. Pupil-led factors - basic per-pupil, deprivation, low prior attainment,
English as an additional language and area cost adjustment. ii. School-led factors - lump sum, sparsity and area cost adjustment.
b) Premises funding – this is calculated at local authority level using
aggregated school-level data. Premises funding covers funding through the PFI, split sites, rates and exceptional circumstances factors.
c) Mobility funding – this is calculated at local authority level using aggregated
school-level data. It covers funding through the mobility factor.
d) Growth funding – this is calculated at local authority level using a mix of
school and local authority level-data. It covers funding through the implicit and explicit growth factors.
9
Chapter 2: Establishing pupil counts and baseline funding for schools and local authorities 2.1 In order to illustrate the impact of the proposed national funding formula, we compare the funding schools/local authorities received in 2016-17 to their illustrative national funding formula funding if the formula was implemented in full in 2016-17 without any transitional protections. So that we are comparing like with like, we make a number of technical adjustments to 2016-17 (or 2016/17) baselines to take into account changes we are making to the funding system as part of the national funding formula. These are explained in detail below.
2.2 The difference between the local authority and school level baselines is the data sources used. For local authority illustrative allocations baselines we have used data from the 2016-17 APT and for the illustrative funding allocations for individual schools we have used either data from the 2016-17 APT, (for local authority maintained schools), or the 2016/17 GAG statements (for academies).
Core schools funding 2.3 We use the funding schools received in 2016-17 to set the baseline pupil count and baseline funding for the core schools component of the national funding formula.
LA illustrative allocations (APT only)
2.4 To calculate the baseline core schools funding for local authority illustrative allocations at a school level we use baselines as recorded on the local authority 2016-17 APT.
APT adjusted pupil count
a) For each school we use the total 2016-17 number on roll (NOR) from the APT.
b) If the school has a special unit or resourced provision we add back the pupils in high needs places that have been deducted from the APT 2016-17 NOR. This is because, as explained above, we are proposing that pupils in high needs places in mainstream schools will be funded through the schools national funding formula in future rather than exclusively through the high needs block.
c) Then we deduct any reception uplift pupils that were recorded on the APT 2016-17 NOR as we will no longer be using the reception uplift once the national funding formula has been introduced. Any school that receives funding for the reception uplift in the baseline year will have this funding protected through the funding floor and transitional protection.
10
APT adjusted baseline funding
a) For each school, the starting point here is the total 2016-17 school block funding from the APT, including any minimum funding guarantee (MFG) funding.
b) If the school has a special unit or resourced provision we uplift the baseline pupil-led funding (funding that is affected by changes to the total number of pupils) in line with the number of pupils in high needs places we are adding back in to the baseline pupil count. We do this by rerunning the APT without excluding high needs places.
c) We then make an adjustment for any one-off funding or funding for the previous year. Again this data comes from either the 2016-17 APT or additional information local authorities provided as part of the 2016-17 baselines exercise.
2.5 There are a few further steps when aggregating up to local authority level. These are described below in chapter 2.
Illustrative funding allocations for individual schools (APT and GAG)
2.6 To show the illustrative impact on schools we use baselines as recorded on the local authority 2016-17 APT for local authority maintained schools and through a school's 2016/17 GAG for academies.
Adjusted pupil count
2.7 For local authority maintained schools this is the same as the APT adjusted pupil count used for the local authority illustrative allocations, as explained above.
2.8 For academies:
a) We take the total 2016/17 NOR from the GAG.
b) If the school has a special unit or resourced places we add back the pupils in high needs places that have been deducted from the GAG 2016/17 NOR.
c) Then we deduct any reception uplift pupils that were recorded on the GAG 2016/17 NOR as we will no longer be using the reception uplift once the national funding formula has been introduced. Any school that receives funding for the reception uplift in the baseline year will have this funding protected through the funding floor and transitional protection.
11
Adjusted baseline funding
2.9 For local authority maintained schools this is the same as the APT adjusted baseline funding used for the local authority illustrative allocations, as explained above.
2.10 For academies:
a) We take the total 2016/17 schools budget share (SBS) and MFG funding from the GAG.
b) If the school has a special unit or resourced places we uplift the baseline pupil-led funding in line with the number of pupils in high needs places we are adding back in to the baseline pupil count
c) We then make an adjustment for any one-off funding or funding for the previous year. Again this data comes from either the 2016-17 APT or through additional information local authorities provided as part of the baselines exercise.
Premises factors
Local authority illustrative allocations (APT only)
2.11 The premises baseline for the local authority level illustrative allocations is the total funding each local authority allocated through each premises factor as recorded on the 2016-17 APT3:
a) PFI
b) Split-sites
c) Rates
d) Exceptional circumstances
Illustrative funding allocations for individual schools (APT and GAG)
2.12 The premises baseline for the illustrative impact on schools is the total funding each school received through the premises factors:
3 There is one exception for Lancashire where we also add in PFI funding for a post-16 only institution that the local authority will still be responsible for funding.
12
a) For local authority maintained schools this is equal to the total PFI, split-sites, rates and exceptional circumstances funding recorded on the 2016-17 APT.
b) For academies this is equal to the total PFI, split-sites and exceptional circumstances funding recorded on their 2016/17 GAG.
Mobility factor
Local authority illustrative allocations (APT only)
2.13 To set the mobility baseline for the local authority illustrative allocations we:
a) Take the funding the local authority allocated to each school through the mobility factor, as recorded on the 2016-17 APT.
b) Uplift this amount in line with pupils in high needs places for any schools with special units or resourced provision.
c) Aggregate to calculate a total amount for the local authority as a whole.
Illustrative funding allocations for individual schools (APT and GAG)
2.14 For local authority maintained schools this is the same as the school level baseline funding used to calculate the local authority illustrative allocations mobility baseline, as explained above.
2.15 For academies:
a) We take the funding allocated to each school through the mobility factor, as recorded on the 2016/17 GAG.
b) Then uplift this amount in line with pupils in high needs places for any schools with special units or resourced provision.
Growth factor
Local authority illustrative allocations (APT only)
2.16 Local authorities allocate funding to schools to reflect growth in pupil numbers in two ways in their 2016-17 APT:
a) Explicitly through the falling rolls and growth funds.
b) Implicitly by adjusting the schools block pupil count used to allocate formula funding in the APT.
13
2.17 To set the growth baseline for each local authority we calculate the funding allocated through both of these methods.
Explicit growth
2.18 To set the explicit growth baseline we use local authority level data:
a) Take the total funding allocated to the falling rolls and growth fund, as recorded on the 2016-17 APT.
b) Adjust for any one-off funding or funding that has come from outside the dedicated schools grant (DSG), as advised by local authorities in the 2016-17 baselines exercise4
Implicit growth
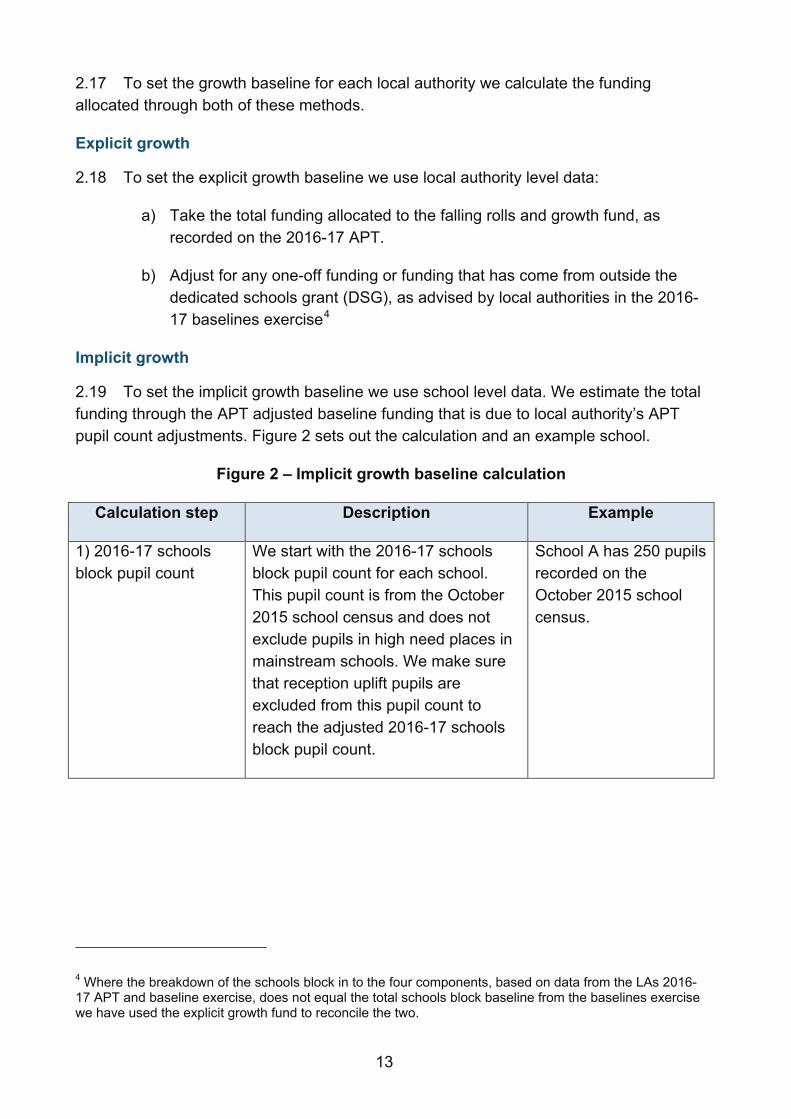
2.19 To set the implicit growth baseline we use school level data. We estimate the total funding through the APT adjusted baseline funding that is due to local authority’s APT pupil count adjustments. Figure 2 sets out the calculation and an example school.
Figure 2 – Implicit growth baseline calculation
Calculation step Description Example
1) 2016-17 schools block pupil count
We start with the 2016-17 schools block pupil count for each school. This pupil count is from the October 2015 school census and does not exclude pupils in high need places in mainstream schools. We make sure that reception uplift pupils are excluded from this pupil count to reach the adjusted 2016-17 schools block pupil count.
School A has 250 pupils recorded on the October 2015 school census.
4 Where the breakdown of the schools block in to the four components, based on data from the LAs 2016-17 APT and baseline exercise, does not equal the total schools block baseline from the baselines exercise we have used the explicit growth fund to reconcile the two.
14
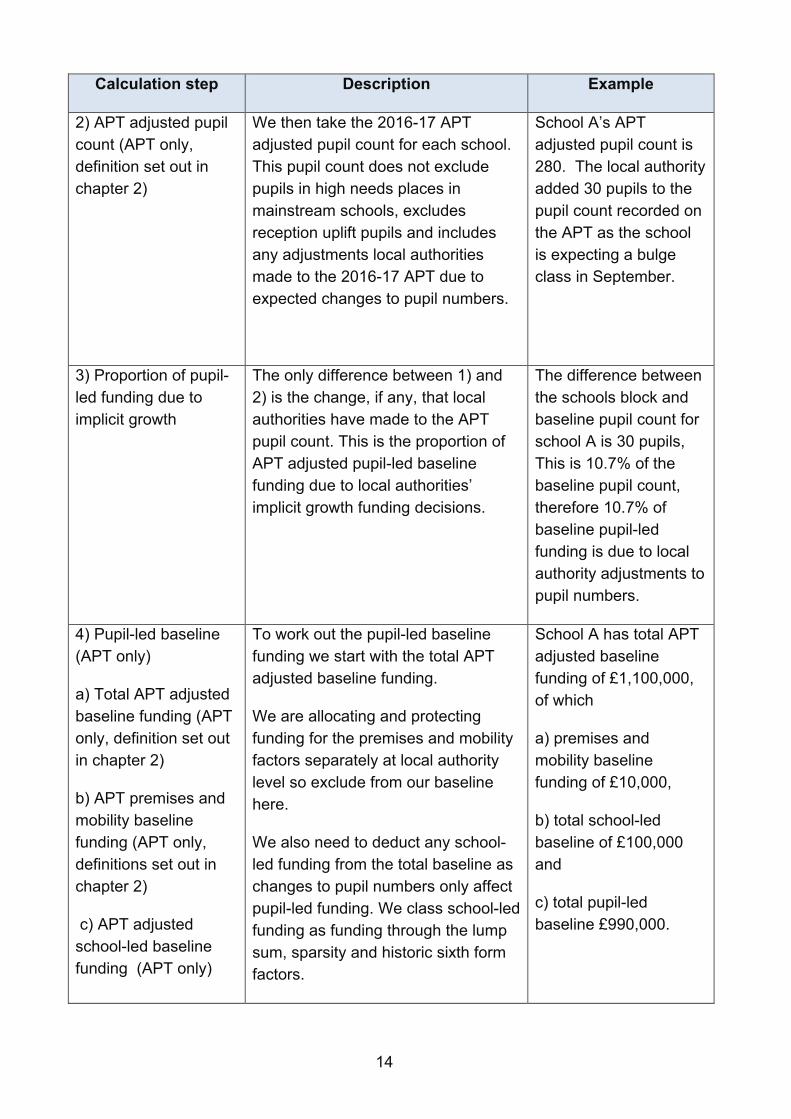
Calculation step Description Example
2) APT adjusted pupil count (APT only, definition set out in chapter 2)
We then take the 2016-17 APT adjusted pupil count for each school. This pupil count does not exclude pupils in high needs places in mainstream schools, excludes reception uplift pupils and includes any adjustments local authorities made to the 2016-17 APT due to expected changes to pupil numbers.
School A’s APT adjusted pupil count is 280. The local authority added 30 pupils to the pupil count recorded on the APT as the school is expecting a bulge class in September.
3) Proportion of pupil-led funding due to implicit growth
The only difference between 1) and 2) is the change, if any, that local authorities have made to the APT pupil count. This is the proportion of APT adjusted pupil-led baseline funding due to local authorities’ implicit growth funding decisions.
The difference between the schools block and baseline pupil count for school A is 30 pupils, This is 10.7% of the baseline pupil count, therefore 10.7% of baseline pupil-led funding is due to local authority adjustments to pupil numbers.
4) Pupil-led baseline (APT only)
a) Total APT adjusted baseline funding (APT only, definition set out in chapter 2)
b) APT premises and mobility baseline funding (APT only, definitions set out in chapter 2)
c) APT adjusted school-led baseline funding (APT only)
To work out the pupil-led baseline funding we start with the total APT adjusted baseline funding.
We are allocating and protecting funding for the premises and mobility factors separately at local authority level so exclude from our baseline here.
We also need to deduct any school-led funding from the total baseline as changes to pupil numbers only affect pupil-led funding. We class school-led funding as funding through the lump sum, sparsity and historic sixth form factors.
School A has total APT adjusted baseline funding of £1,100,000, of which
a) premises and mobility baseline funding of £10,000,
b) total school-led baseline of £100,000 and
c) total pupil-led baseline £990,000.
15
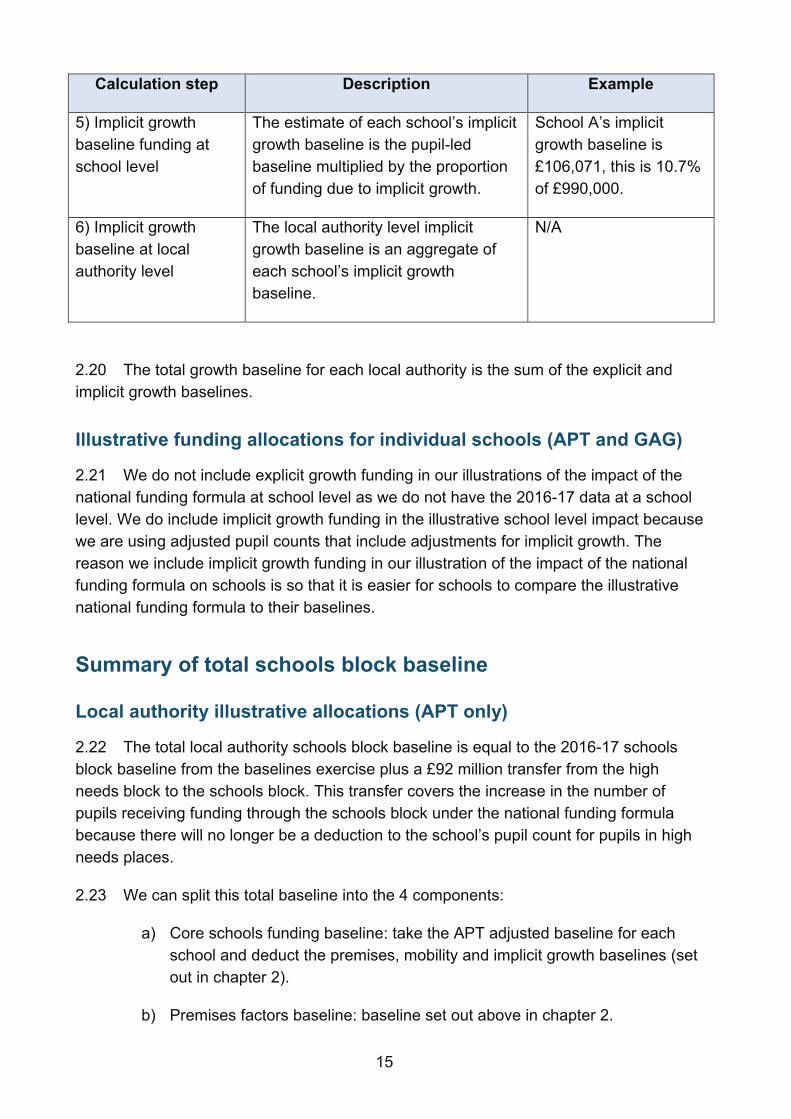
Calculation step Description Example
5) Implicit growth baseline funding at school level
The estimate of each school’s implicit growth baseline is the pupil-led baseline multiplied by the proportion of funding due to implicit growth.
School A’s implicit growth baseline is £106,071, this is 10.7% of £990,000.
6) Implicit growth baseline at local authority level
The local authority level implicit growth baseline is an aggregate of each school’s implicit growth baseline.
N/A
2.20 The total growth baseline for each local authority is the sum of the explicit and implicit growth baselines.
Illustrative funding allocations for individual schools (APT and GAG)
2.21 We do not include explicit growth funding in our illustrations of the impact of the national funding formula at school level as we do not have the 2016-17 data at a school level. We do include implicit growth funding in the illustrative school level impact because we are using adjusted pupil counts that include adjustments for implicit growth. The reason we include implicit growth funding in our illustration of the impact of the national funding formula on schools is so that it is easier for schools to compare the illustrative national funding formula to their baselines.
Summary of total schools block baseline
Local authority illustrative allocations (APT only)
2.22 The total local authority schools block baseline is equal to the 2016-17 schools block baseline from the baselines exercise plus a £92 million transfer from the high needs block to the schools block. This transfer covers the increase in the number of pupils receiving funding through the schools block under the national funding formula because there will no longer be a deduction to the school’s pupil count for pupils in high needs places.
2.23 We can split this total baseline into the 4 components:
a) Core schools funding baseline: take the APT adjusted baseline for each school and deduct the premises, mobility and implicit growth baselines (set out in chapter 2).
b) Premises factors baseline: baseline set out above in chapter 2.
16
c) Mobility factor baseline: baseline as set out above in chapter 2.
d) Growth factor baseline: baseline as set out above in chapter 2.
2.24 Our published illustrative allocations in December 2016 exclude any new schools that are still filling up and do not have pupils in all year groups yet (as defined in chapter 1) from each local authority’s core schools funding baseline. We will update these illustrative allocations in January 2017 to include these schools.
Illustrative funding allocations for individual schools (APT and GAG)
2.25 The total baseline funding for each school is equal to the adjusted funding baseline – either the APT adjusted or the academy allocations adjusted baseline set out in chapter 2. This includes funding through the:
a) Core schools funding factors
b) Premises factors
c) Mobility factor
d) Implicit growth factor
17
Chapter 3: Calculating funding through the national funding formula factors 3.1 We set out the calculation of each component of the schools block national funding formula below. We use pupil and school characteristics data from the 2016-17 APT data to calculate the national funding formula pupil-led and school-led units of funding. For the other components we use either data from the APT or GAG, as in the baselines approach, depending on whether we are calculating local authority illustrative allocations or the illustrative impact on schools.
Core schools funding 3.2 Core schools funding covers funding through the national funding formula pupil-led and school-led factors. Through the core schools funding calculation we produce a national funding formula pupil-led unit of funding (£ per pupil) and national funding formula school-led unit of funding (£ per school) for each eligible school.
3.3 The national funding formula pupil-led unit of funding covers funding for the school through the basic per pupil, deprivation, low prior attainment and English as an additional language (EAL) factors. The area cost adjustment (ACA) is also applied to uplift funding in line with local area costs. Each school’s pupil-led unit of funding is calculated using characteristics data from the 2016-17 APT. The national funding formula pupil-led unit of funding is equal to:
a) the total funding through all pupil-led factors;
b) uplifted in line with ACA; and
c) divided by the APT adjusted pupil count.
3.4 The national funding formula school-led unit of funding covers funding for the school through the lump sum and sparsity factors. The ACA is also applied to uplift funding in line with local area costs. Each school’s school-led funding is calculated using characteristics data from the 2016-17 APT. The national funding formula school-led unit of funding is equal to:
a) the total funding through all school-led factors;
b) uplifted in line with ACA.
18
Basic per pupil funding
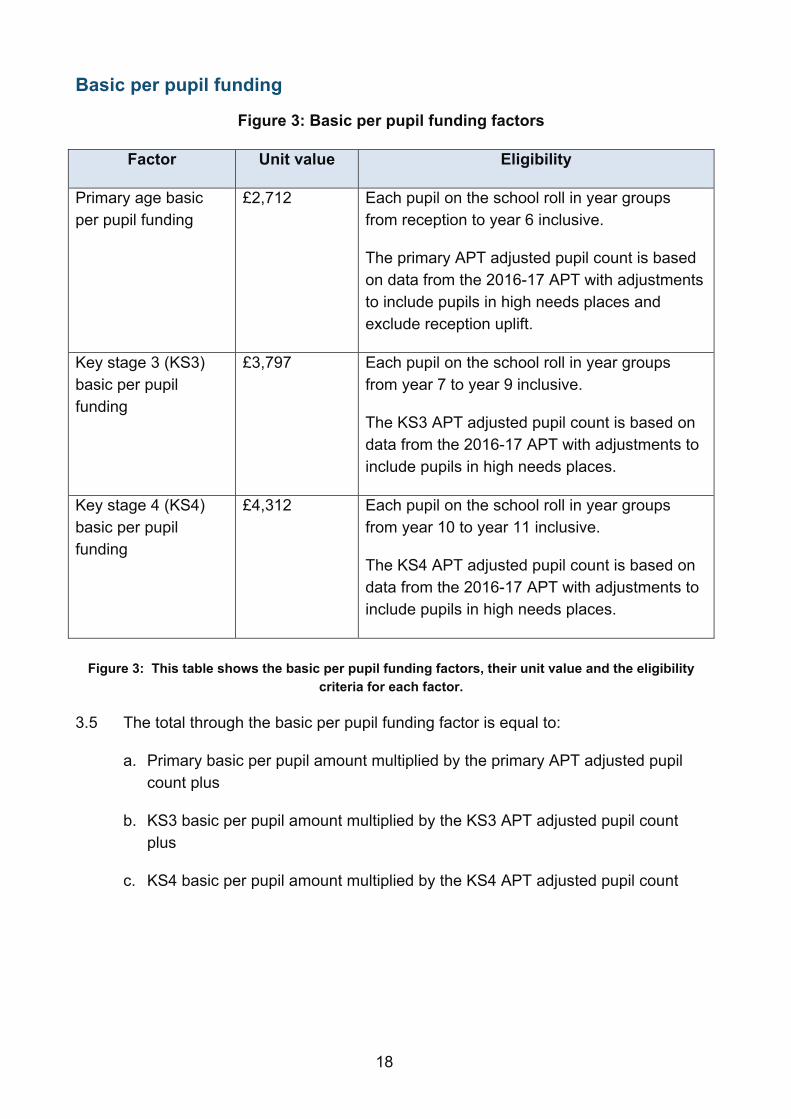
Figure 3: Basic per pupil funding factors
Factor Unit value Eligibility
Primary age basic per pupil funding
£2,712 Each pupil on the school roll in year groups from reception to year 6 inclusive.
The primary APT adjusted pupil count is based on data from the 2016-17 APT with adjustments to include pupils in high needs places and exclude reception uplift.
Key stage 3 (KS3) basic per pupil funding
£3,797 Each pupil on the school roll in year groups from year 7 to year 9 inclusive.
The KS3 APT adjusted pupil count is based on data from the 2016-17 APT with adjustments to include pupils in high needs places.
Key stage 4 (KS4) basic per pupil funding
£4,312 Each pupil on the school roll in year groups from year 10 to year 11 inclusive.
The KS4 APT adjusted pupil count is based on data from the 2016-17 APT with adjustments to include pupils in high needs places.
Figure 3: This table shows the basic per pupil funding factors, their unit value and the eligibility
criteria for each factor.
3.5 The total through the basic per pupil funding factor is equal to:
a. Primary basic per pupil amount multiplied by the primary APT adjusted pupil count plus
b. KS3 basic per pupil amount multiplied by the KS3 APT adjusted pupil count plus
c. KS4 basic per pupil amount multiplied by the KS4 APT adjusted pupil count
19
Additional needs funding
3.6 The additional needs factors allocate funding to schools on the basis of the number of pupils who have particular characteristics. For each factor, schools receive a unit of funding per eligible pupil. The number of eligible pupils is worked out by calculating the proportion of pupils in the school who are eligible for each factor5, and then applying this proportion to the APT adjusted pupil count. This step is necessary to ensure the changes to the pupil number from the unit change and reception change feeds through into the various proxy factors.
3.7 The proportion of pupils eligible for each factor only takes account of pupils for whom we have data. We assume that pupils with missing characteristics data are eligible at the same rate as all other pupils. This is the same methodology as local authorities currently use to allocate funding to schools. E.g.
a. School B has 400 pupils but only 360 have valid data returns for free school meal (FSM) eligibility.
b. Of the 360 pupils with valid FSM data, 90 are claiming FSM. Therefore the proportion of pupils eligible for funding through the FSM factor is 25% (90 divided by 360).
c. The total number of eligible pupils is calculated by multiplying the total pupil count, 400, by the school’s proportion of FSM eligible pupils, 25%. Therefore School B receives funding through the FSM factor for 100 pupils.
3.8 The additional needs factors are additive so pupils attract funding for all qualifying factors.
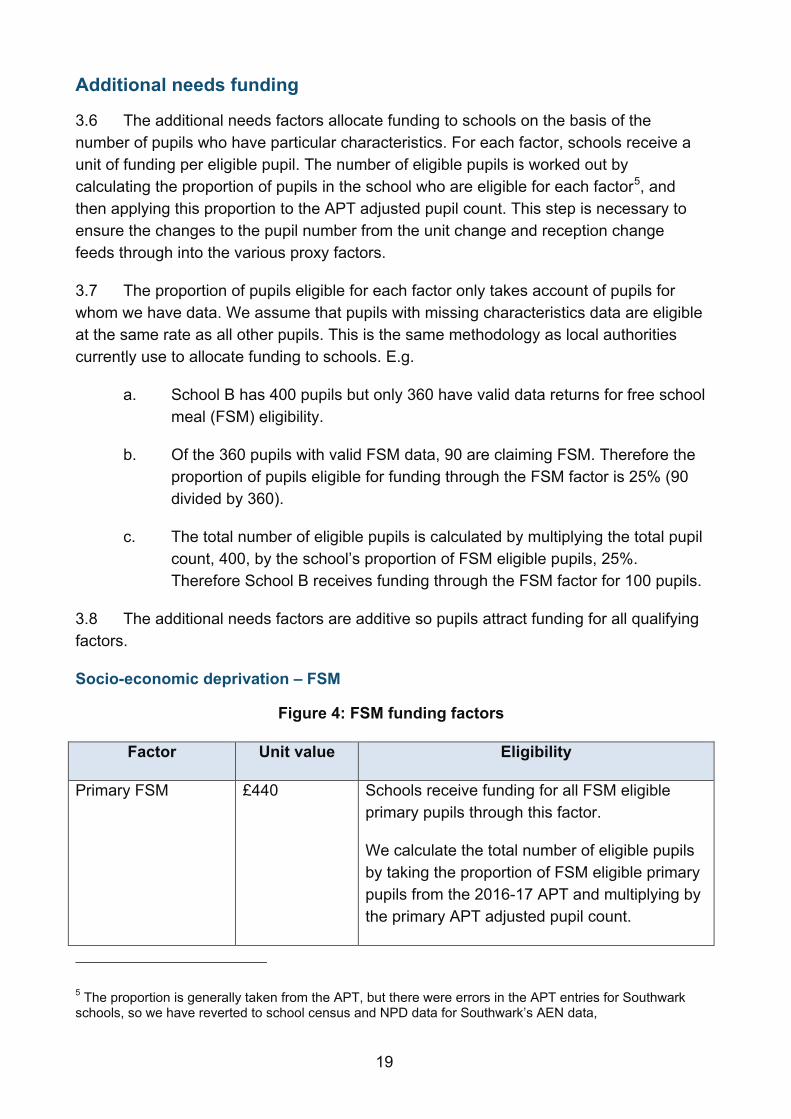
Socio-economic deprivation – FSM
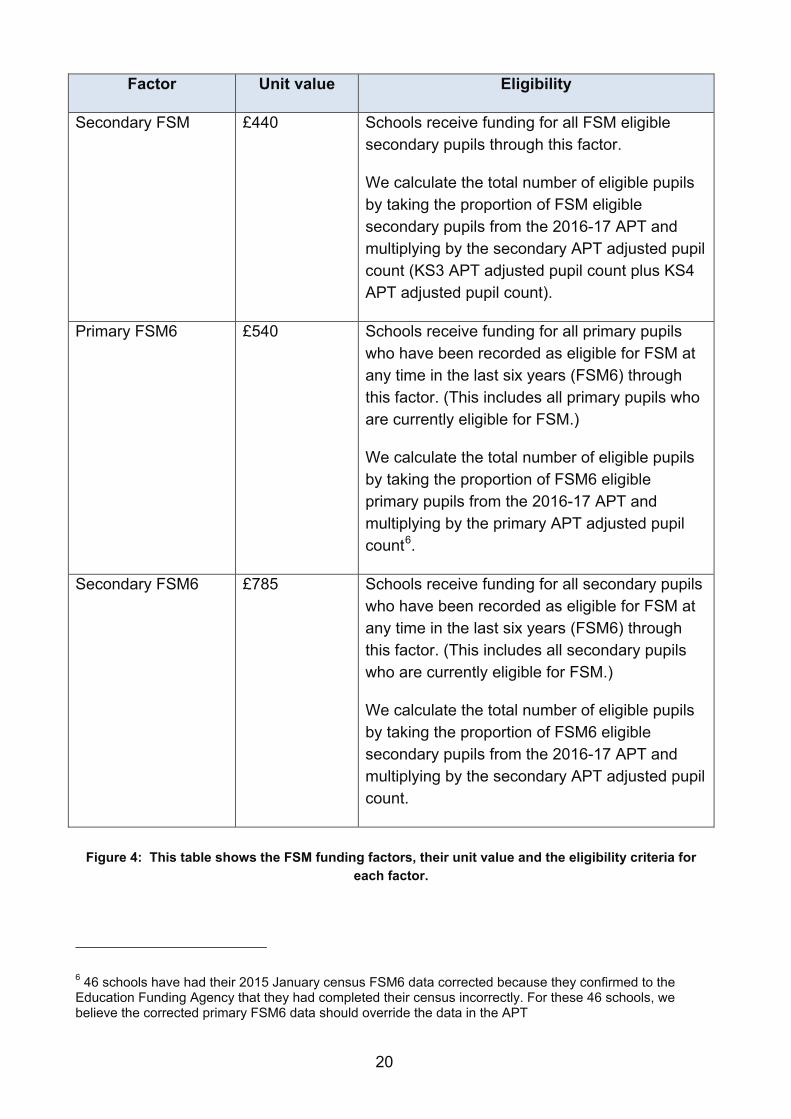
Figure 4: FSM funding factors
Factor Unit value Eligibility
Primary FSM £440 Schools receive funding for all FSM eligible primary pupils through this factor.
We calculate the total number of eligible pupils by taking the proportion of FSM eligible primary pupils from the 2016-17 APT and multiplying by the primary APT adjusted pupil count.
5 The proportion is generally taken from the APT, but there were errors in the APT entries for Southwark schools, so we have reverted to school census and NPD data for Southwark’s AEN data,
20
Factor Unit value Eligibility
Secondary FSM £440 Schools receive funding for all FSM eligible secondary pupils through this factor.
We calculate the total number of eligible pupils by taking the proportion of FSM eligible secondary pupils from the 2016-17 APT and multiplying by the secondary APT adjusted pupil count (KS3 APT adjusted pupil count plus KS4 APT adjusted pupil count).
Primary FSM6 £540 Schools receive funding for all primary pupils who have been recorded as eligible for FSM at any time in the last six years (FSM6) through this factor. (This includes all primary pupils who are currently eligible for FSM.)
We calculate the total number of eligible pupils by taking the proportion of FSM6 eligible primary pupils from the 2016-17 APT and multiplying by the primary APT adjusted pupil count6.
Secondary FSM6 £785 Schools receive funding for all secondary pupils who have been recorded as eligible for FSM at any time in the last six years (FSM6) through this factor. (This includes all secondary pupils who are currently eligible for FSM.)
We calculate the total number of eligible pupils by taking the proportion of FSM6 eligible secondary pupils from the 2016-17 APT and multiplying by the secondary APT adjusted pupil count.
Figure 4: This table shows the FSM funding factors, their unit value and the eligibility criteria for
each factor.
6 46 schools have had their 2015 January census FSM6 data corrected because they confirmed to the Education Funding Agency that they had completed their census incorrectly. For these 46 schools, we believe the corrected primary FSM6 data should override the data in the APT
21
Socio-economic deprivation – Area-level deprivation data: Income Deprivation Affecting Children Index (IDACI)7
3.9 The IDACI element of the deprivation factor is based on the IDACI dataset which is published by the Department for Communities and Local Government. IDACI is a relative measure of socio-economic deprivation: an IDACI ‘score’ is calculated for a lower super output area (LSOA, an area with about 1,500 residents) based on the characteristics of households in that area. The IDACI score of a given area doesn’t mean that every child living in that area has particular deprivation characteristics: it’s a measure of the likelihood that a child is in a household experiencing socio-economic deprivation.
3.10 The Department for Education has previously created a ‘banding’ methodology to enable the IDACI data to be used for school funding purposes. IDACI scores are grouped into seven bands, with each band representing an increase in the expected level of deprivation. We match IDACI data to pupils’ home postcode data recorded in the school census in order to find the IDACI score relevant to each pupil in a school. The amount of IDACI funding received by a school depends on the IDACI scores of each pupil.
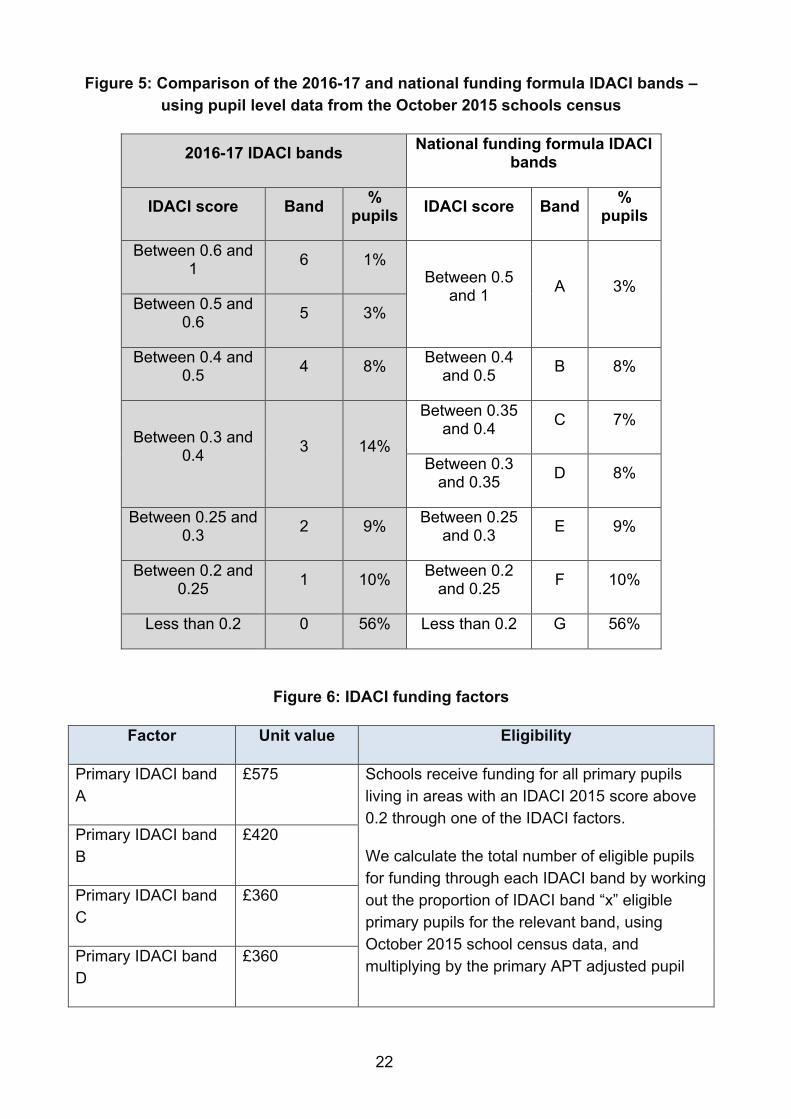
3.11 We have matched the 2015 IDACI data (the most recent update to the IDACI dataset) to pupil data from the October 2015 school census, on the basis of the LSOA of the pupil’s home address. We have updated our banding methodology and this will be used by local authorities to allocate schools block funding in 2017-18. This is to better reflect the latest IDACI data collected. The distribution of IDACI scores has changed between 2010 and 2015 - there are now fewer pupils living in the most deprived LSOAs. We group IDACI scores into new bands, and these have been designed so that we continue to target funding towards a similar proportion of pupils through the most deprived IDACI bands. The 2016-17 IDACI bands and the new national funding formula IDACI bands (to be used by local authorities to allocate funding through IDACI in 2017-18) are set out in figure 5.
7 Department for Communities and Local Government, ‘English indices of deprivation 2015’, September 2015
22
Figure 5: Comparison of the 2016-17 and national funding formula IDACI bands – using pupil level data from the October 2015 schools census
2016-17 IDACI bands National funding formula IDACI bands
IDACI score Band % pupils IDACI score Band %
pupils
Between 0.6 and 1 6 1%
Between 0.5 and 1 A 3%
Between 0.5 and 0.6 5 3%
Between 0.4 and 0.5 4 8% Between 0.4
and 0.5 B 8%
Between 0.3 and 0.4 3 14%
Between 0.35 and 0.4 C 7%
Between 0.3 and 0.35 D 8%
Between 0.25 and 0.3 2 9% Between 0.25
and 0.3 E 9%
Between 0.2 and 0.25 1 10% Between 0.2
and 0.25 F 10%
Less than 0.2 0 56% Less than 0.2 G 56%
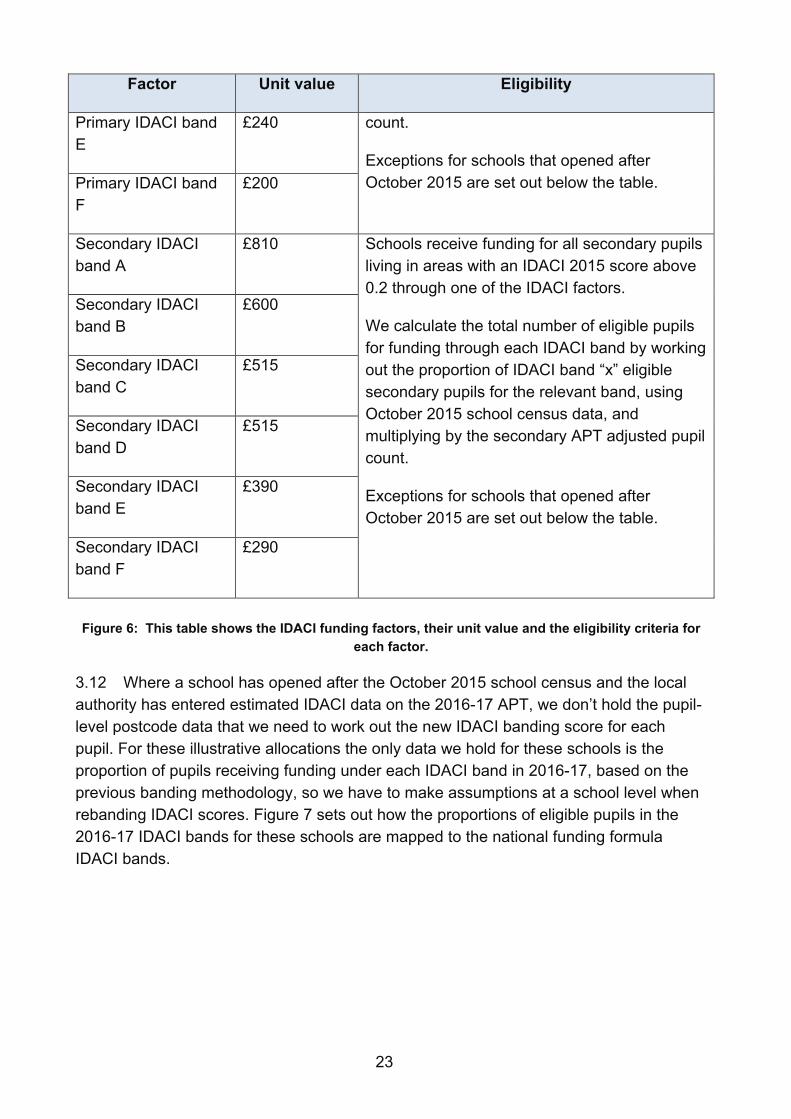
Figure 6: IDACI funding factors
Factor Unit value Eligibility
Primary IDACI band A
£575 Schools receive funding for all primary pupils living in areas with an IDACI 2015 score above 0.2 through one of the IDACI factors.
We calculate the total number of eligible pupils for funding through each IDACI band by working out the proportion of IDACI band “x” eligible primary pupils for the relevant band, using October 2015 school census data, and multiplying by the primary APT adjusted pupil
Primary IDACI band B
£420
Primary IDACI band C
£360
Primary IDACI band D
£360
23
Factor Unit value Eligibility
Primary IDACI band E
£240 count.
Exceptions for schools that opened after October 2015 are set out below the table. Primary IDACI band
F £200
Secondary IDACI band A
£810 Schools receive funding for all secondary pupils living in areas with an IDACI 2015 score above 0.2 through one of the IDACI factors.
We calculate the total number of eligible pupils for funding through each IDACI band by working out the proportion of IDACI band “x” eligible secondary pupils for the relevant band, using October 2015 school census data, and multiplying by the secondary APT adjusted pupil count.
Exceptions for schools that opened after October 2015 are set out below the table.
Secondary IDACI band B
£600
Secondary IDACI band C
£515
Secondary IDACI band D
£515
Secondary IDACI band E
£390
Secondary IDACI band F
£290
Figure 6: This table shows the IDACI funding factors, their unit value and the eligibility criteria for
each factor.
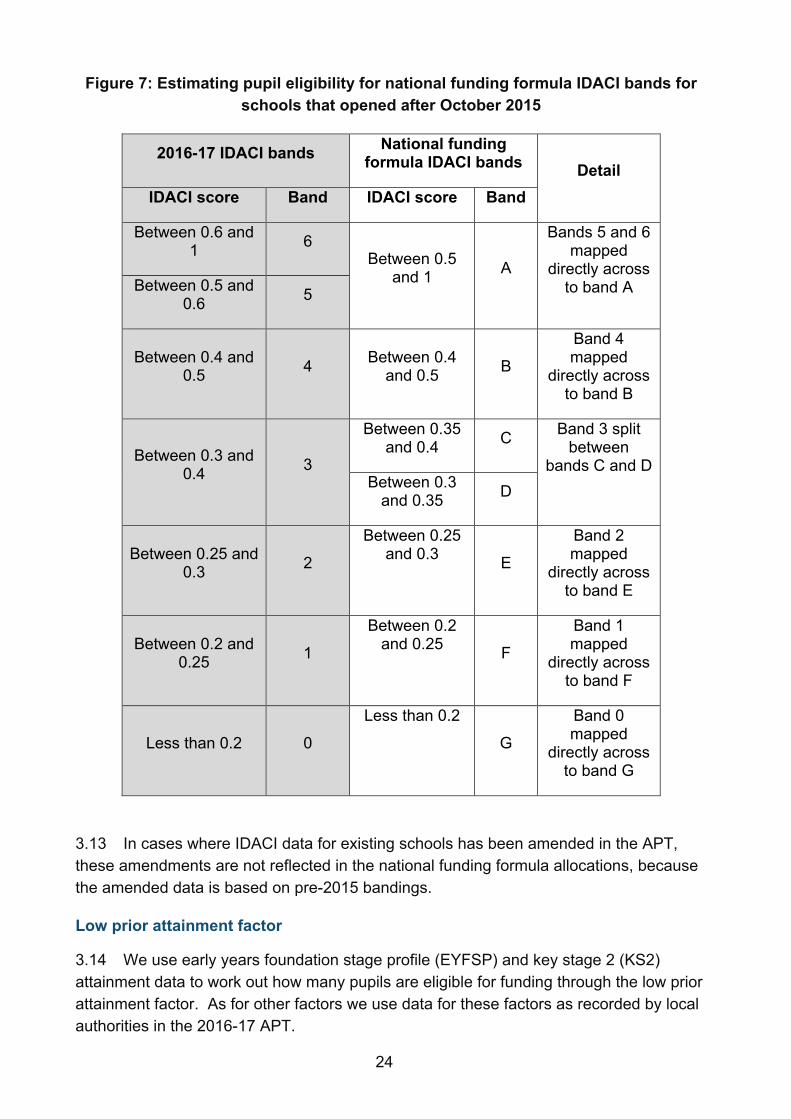
3.12 Where a school has opened after the October 2015 school census and the local authority has entered estimated IDACI data on the 2016-17 APT, we don’t hold the pupil-level postcode data that we need to work out the new IDACI banding score for each pupil. For these illustrative allocations the only data we hold for these schools is the proportion of pupils receiving funding under each IDACI band in 2016-17, based on the previous banding methodology, so we have to make assumptions at a school level when rebanding IDACI scores. Figure 7 sets out how the proportions of eligible pupils in the 2016-17 IDACI bands for these schools are mapped to the national funding formula IDACI bands.
24
Figure 7: Estimating pupil eligibility for national funding formula IDACI bands for schools that opened after October 2015
2016-17 IDACI bands National funding formula IDACI bands Detail
IDACI score Band IDACI score Band
Between 0.6 and 1 6
Between 0.5 and 1 A
Bands 5 and 6 mapped
directly across to band A Between 0.5 and
0.6 5
Between 0.4 and 0.5 4 Between 0.4
and 0.5 B
Band 4 mapped
directly across to band B
Between 0.3 and 0.4 3
Between 0.35 and 0.4 C Band 3 split
between bands C and D
Between 0.3 and 0.35 D
Between 0.25 and 0.3 2
Between 0.25 and 0.3 E
Band 2 mapped
directly across to band E
Between 0.2 and 0.25 1
Between 0.2 and 0.25 F
Band 1 mapped
directly across to band F
Less than 0.2 0
Less than 0.2
G
Band 0 mapped
directly across to band G
3.13 In cases where IDACI data for existing schools has been amended in the APT, these amendments are not reflected in the national funding formula allocations, because the amended data is based on pre-2015 bandings.
Low prior attainment factor
3.14 We use early years foundation stage profile (EYFSP) and key stage 2 (KS2) attainment data to work out how many pupils are eligible for funding through the low prior attainment factor. As for other factors we use data for these factors as recorded by local authorities in the 2016-17 APT.
25
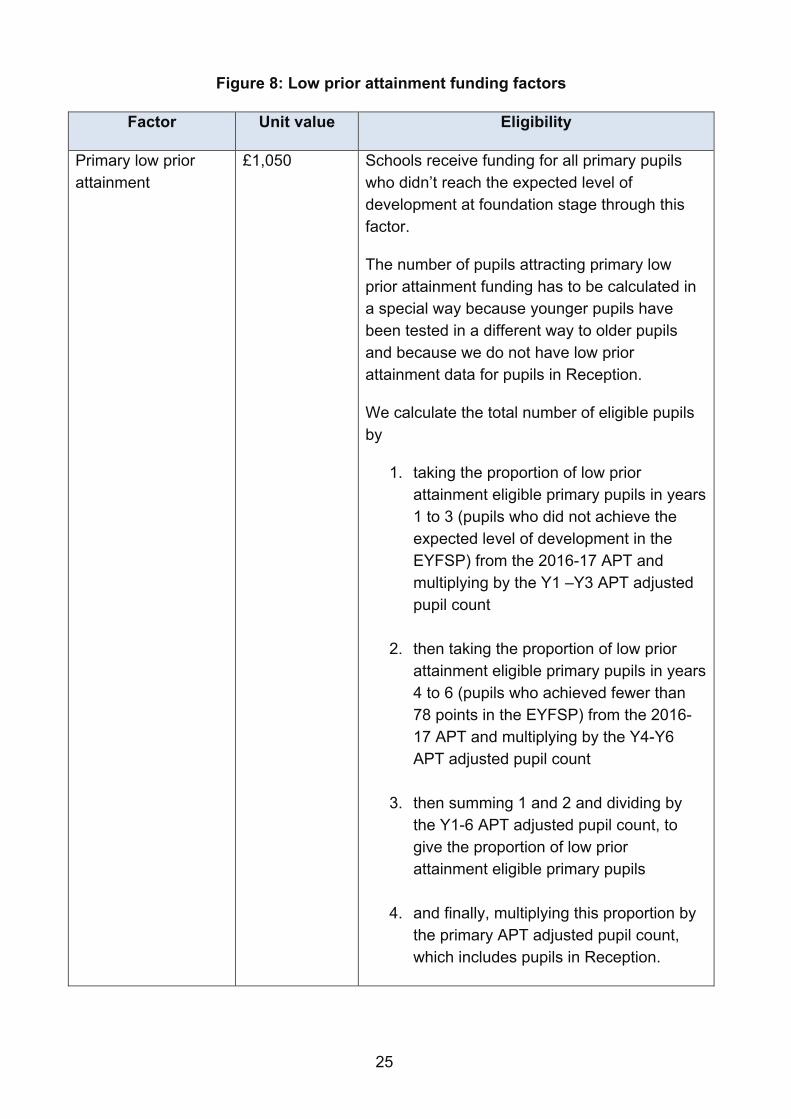
Figure 8: Low prior attainment funding factors
Factor Unit value Eligibility
Primary low prior attainment
£1,050 Schools receive funding for all primary pupils who didn’t reach the expected level of development at foundation stage through this factor.
The number of pupils attracting primary low prior attainment funding has to be calculated in a special way because younger pupils have been tested in a different way to older pupils and because we do not have low prior attainment data for pupils in Reception.
We calculate the total number of eligible pupils by
1. taking the proportion of low prior attainment eligible primary pupils in years 1 to 3 (pupils who did not achieve the expected level of development in the EYFSP) from the 2016-17 APT and multiplying by the Y1 –Y3 APT adjusted pupil count
2. then taking the proportion of low prior attainment eligible primary pupils in years 4 to 6 (pupils who achieved fewer than 78 points in the EYFSP) from the 2016-17 APT and multiplying by the Y4-Y6 APT adjusted pupil count
3. then summing 1 and 2 and dividing by the Y1-6 APT adjusted pupil count, to give the proportion of low prior attainment eligible primary pupils
4. and finally, multiplying this proportion by the primary APT adjusted pupil count, which includes pupils in Reception.
26
Factor Unit value Eligibility
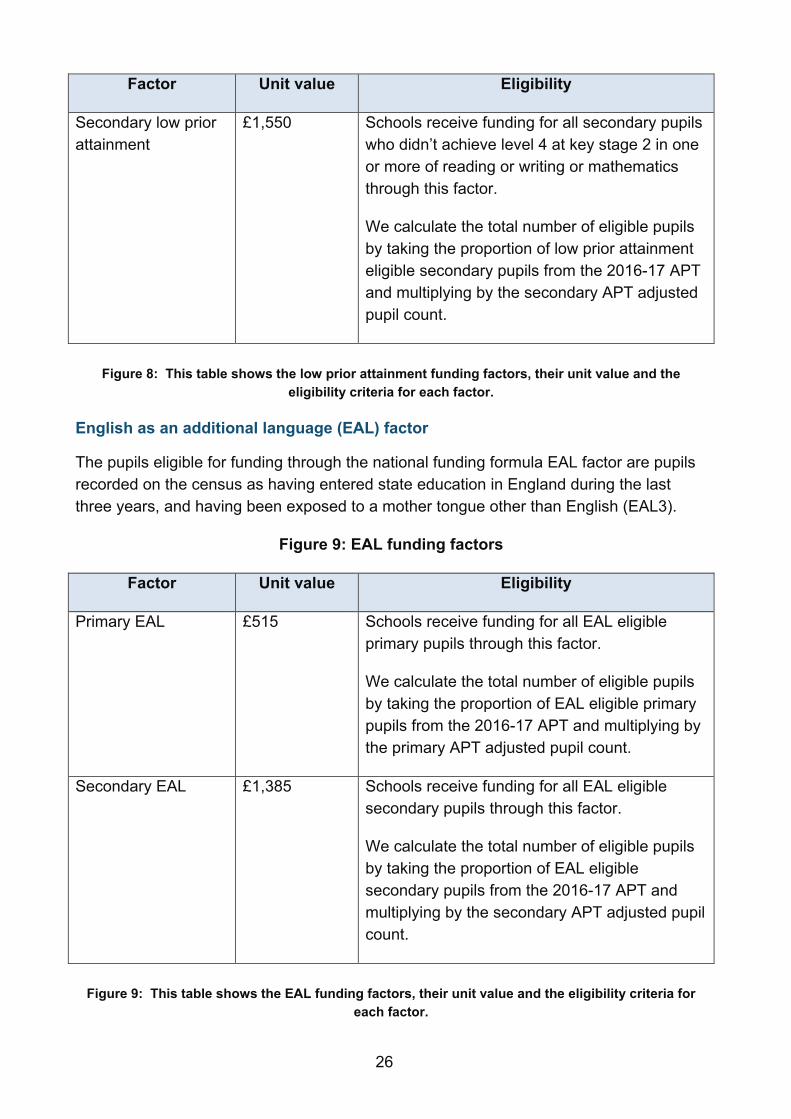
Secondary low prior attainment
£1,550 Schools receive funding for all secondary pupils who didn’t achieve level 4 at key stage 2 in one or more of reading or writing or mathematics through this factor.
We calculate the total number of eligible pupils by taking the proportion of low prior attainment eligible secondary pupils from the 2016-17 APT and multiplying by the secondary APT adjusted pupil count.
Figure 8: This table shows the low prior attainment funding factors, their unit value and the
eligibility criteria for each factor.
English as an additional language (EAL) factor
The pupils eligible for funding through the national funding formula EAL factor are pupils recorded on the census as having entered state education in England during the last three years, and having been exposed to a mother tongue other than English (EAL3).
Figure 9: EAL funding factors
Factor Unit value Eligibility
Primary EAL £515 Schools receive funding for all EAL eligible primary pupils through this factor.
We calculate the total number of eligible pupils by taking the proportion of EAL eligible primary pupils from the 2016-17 APT and multiplying by the primary APT adjusted pupil count.
Secondary EAL £1,385 Schools receive funding for all EAL eligible secondary pupils through this factor.
We calculate the total number of eligible pupils by taking the proportion of EAL eligible secondary pupils from the 2016-17 APT and multiplying by the secondary APT adjusted pupil count.
Figure 9: This table shows the EAL funding factors, their unit value and the eligibility criteria for
each factor.
27
Lump sum
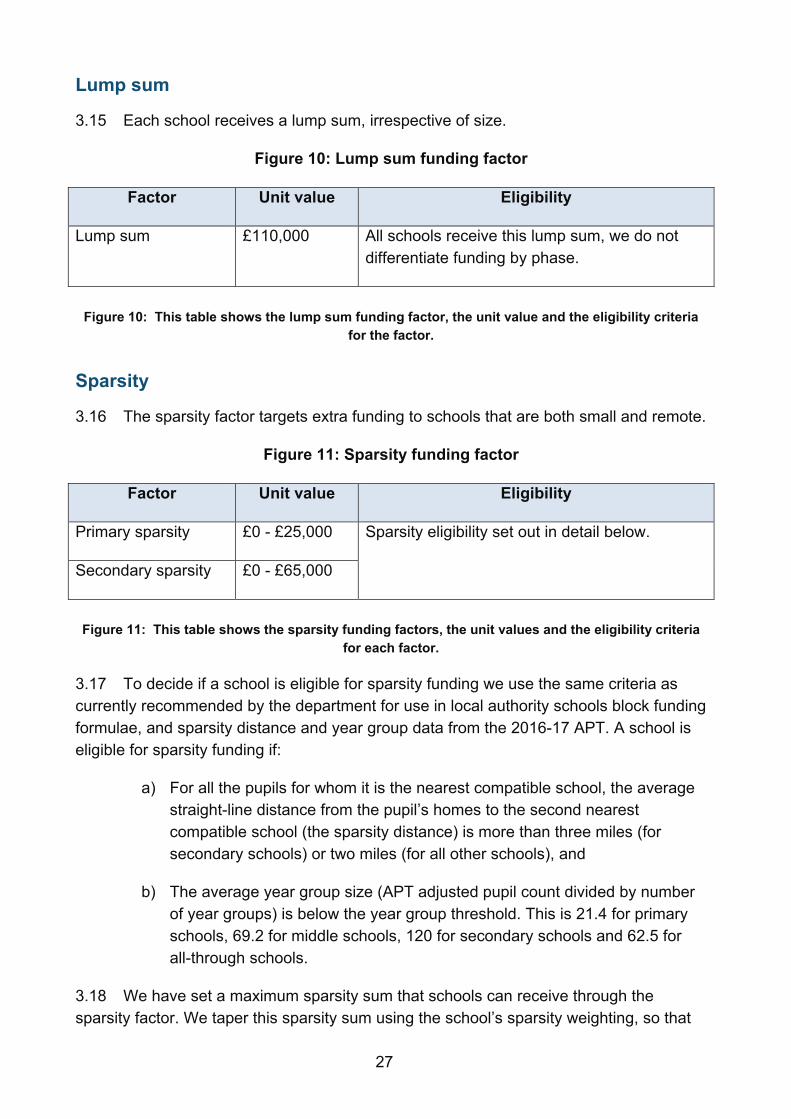
3.15 Each school receives a lump sum, irrespective of size.
Figure 10: Lump sum funding factor
Factor Unit value Eligibility
Lump sum £110,000 All schools receive this lump sum, we do not differentiate funding by phase.
Figure 10: This table shows the lump sum funding factor, the unit value and the eligibility criteria
for the factor.
Sparsity
3.16 The sparsity factor targets extra funding to schools that are both small and remote.
Figure 11: Sparsity funding factor
Factor Unit value Eligibility
Primary sparsity £0 - £25,000 Sparsity eligibility set out in detail below.
Secondary sparsity £0 - £65,000
Figure 11: This table shows the sparsity funding factors, the unit values and the eligibility criteria
for each factor.
3.17 To decide if a school is eligible for sparsity funding we use the same criteria as currently recommended by the department for use in local authority schools block funding formulae, and sparsity distance and year group data from the 2016-17 APT. A school is eligible for sparsity funding if:
a) For all the pupils for whom it is the nearest compatible school, the average straight-line distance from the pupil’s homes to the second nearest compatible school (the sparsity distance) is more than three miles (for secondary schools) or two miles (for all other schools), and
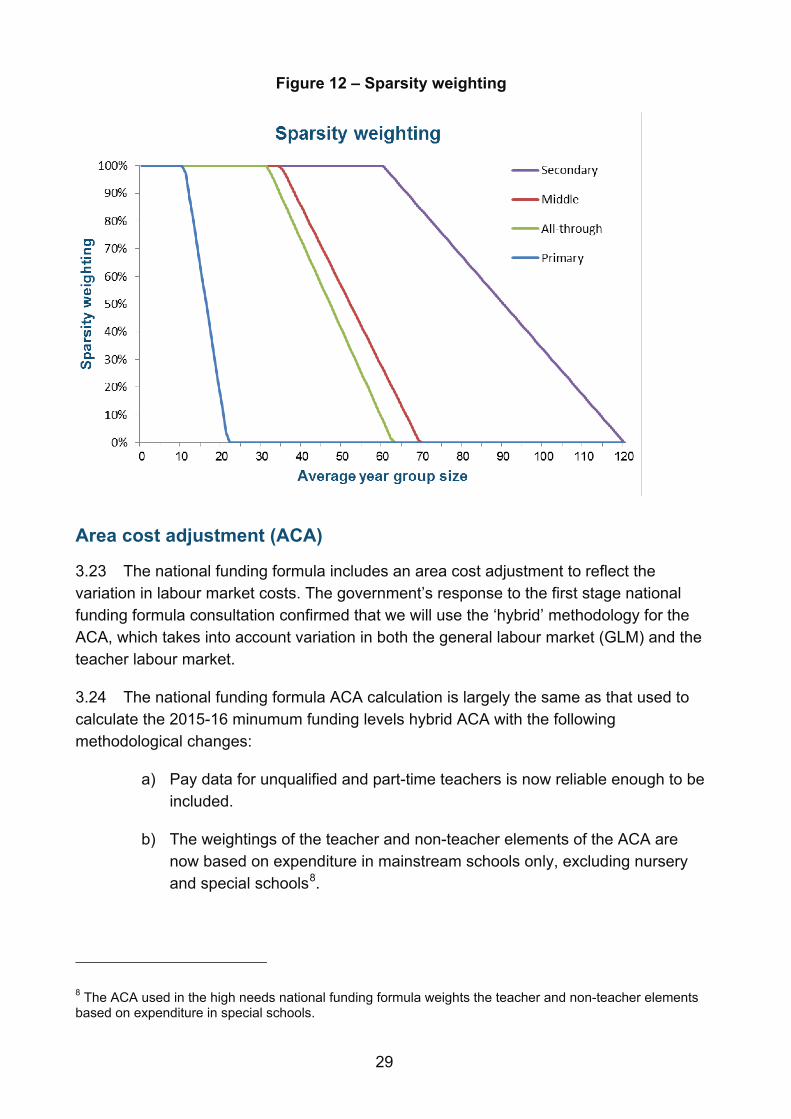
b) The average year group size (APT adjusted pupil count divided by number of year groups) is below the year group threshold. This is 21.4 for primary schools, 69.2 for middle schools, 120 for secondary schools and 62.5 for all-through schools.
3.18 We have set a maximum sparsity sum that schools can receive through the sparsity factor. We taper this sparsity sum using the school’s sparsity weighting, so that
28
as the average year group size approaches the threshold sparsity funding decreases. Sparse schools with a greater number of pupils receive less funding than smaller sparse schools.
Sparsity weighting
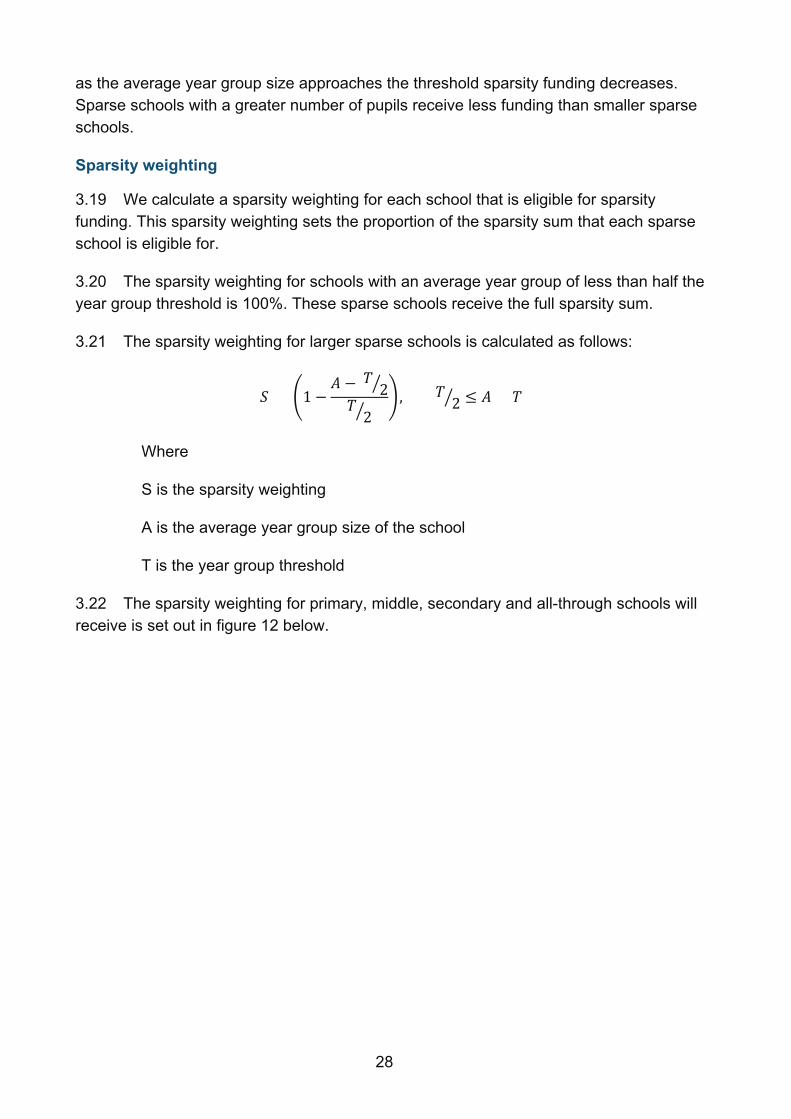
3.19 We calculate a sparsity weighting for each school that is eligible for sparsity funding. This sparsity weighting sets the proportion of the sparsity sum that each sparse school is eligible for.
3.20 The sparsity weighting for schools with an average year group of less than half the year group threshold is 100%. These sparse schools receive the full sparsity sum.
3.21 The sparsity weighting for larger sparse schools is calculated as follows:
𝑆 = �1 −𝐴 − 𝑇 2�𝑇
2�� , 𝑇 2� ≤ 𝐴 < 𝑇
Where
S is the sparsity weighting
A is the average year group size of the school
T is the year group threshold
3.22 The sparsity weighting for primary, middle, secondary and all-through schools will receive is set out in figure 12 below.
29
Figure 12 – Sparsity weighting
Area cost adjustment (ACA)
3.23 The national funding formula includes an area cost adjustment to reflect the variation in labour market costs. The government’s response to the first stage national funding formula consultation confirmed that we will use the ‘hybrid’ methodology for the ACA, which takes into account variation in both the general labour market (GLM) and the teacher labour market.
3.24 The national funding formula ACA calculation is largely the same as that used to calculate the 2015-16 minumum funding levels hybrid ACA with the following methodological changes:
a) Pay data for unqualified and part-time teachers is now reliable enough to be included.
b) The weightings of the teacher and non-teacher elements of the ACA are now based on expenditure in mainstream schools only, excluding nursery and special schools8.
8 The ACA used in the high needs national funding formula weights the teacher and non-teacher elements based on expenditure in special schools.
30
c) Expenditure data for academies is included in the calculation of the teacher and non-teacher weightings.
3.25 The national funding formula ACA is a combination of:
a) The teacher pay cost adjustment, an element to reflect the differences in the basic pay ranges between the four regional pay bands for teachers9 and
b) The general labour market cost adjustment, an element to reflect geographical variation in wage costs for non-teaching staff.
3.26 The national funding formula ACA is calculated for each district by:
a) Weighting the relevant teachers specific cost adjustment in line with the national proportion of spend on teaching staff.
b) Weighting the relevant GLM labour cost adjustment in line with the national proportion of spend on non-teaching staff.
National funding formula pupil-led unit of funding before applying the funding floor
3.27 We calculate the national funding formula pupil-led unit of funding (pre funding floor) for each school by:
a) Adding together the total funding through each pupil-led factor (basic per pupil, deprivation, low prior attainment and EAL).
b) Uplifting in line with the school’s ACA.
c) Dividing by the schools total APT adjusted pupil count.
National funding formula school-led unit of funding
3.28 We calculate the national funding formula school-led unit of funding for each school by:
a) Adding together the total funding through each school-led factor (lump sum and sparsity).
b) Uplifting in line with the school’s ACA.
9 For more information on the calculation of the teacher pay cost adjustment please see Annex A.
31
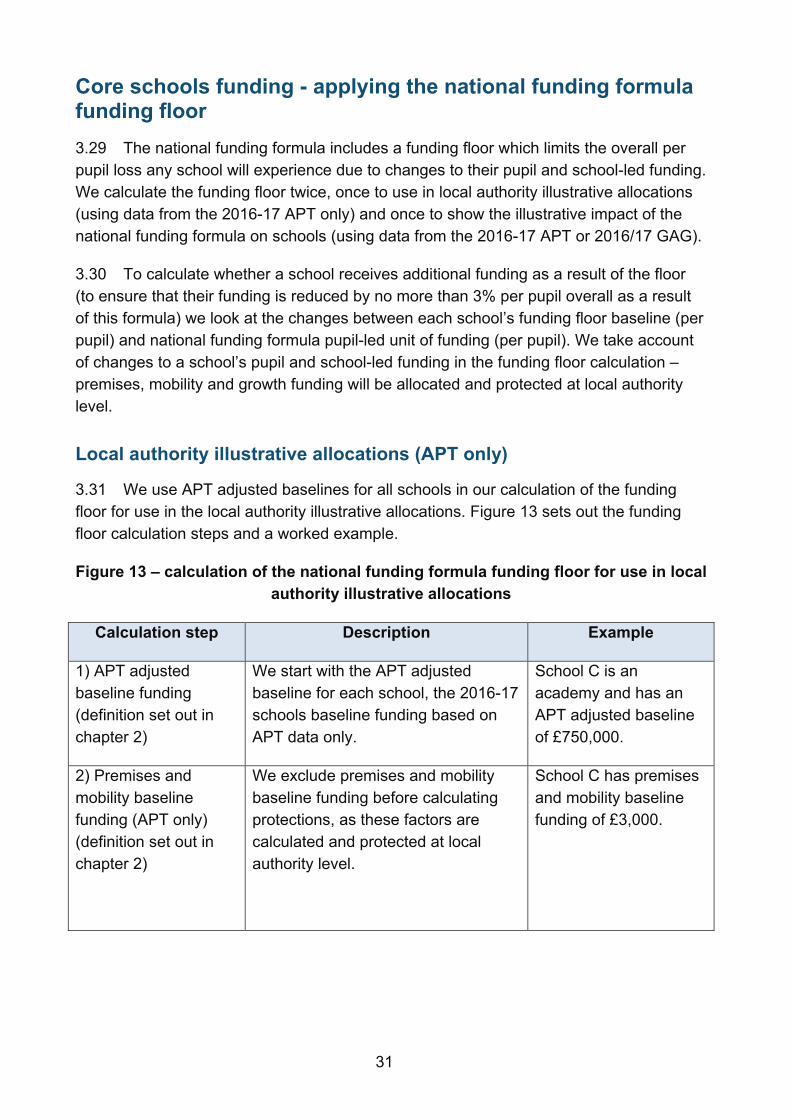
Core schools funding - applying the national funding formula funding floor 3.29 The national funding formula includes a funding floor which limits the overall per pupil loss any school will experience due to changes to their pupil and school-led funding. We calculate the funding floor twice, once to use in local authority illustrative allocations (using data from the 2016-17 APT only) and once to show the illustrative impact of the national funding formula on schools (using data from the 2016-17 APT or 2016/17 GAG).
3.30 To calculate whether a school receives additional funding as a result of the floor (to ensure that their funding is reduced by no more than 3% per pupil overall as a result of this formula) we look at the changes between each school’s funding floor baseline (per pupil) and national funding formula pupil-led unit of funding (per pupil). We take account of changes to a school’s pupil and school-led funding in the funding floor calculation – premises, mobility and growth funding will be allocated and protected at local authority level.
Local authority illustrative allocations (APT only)
3.31 We use APT adjusted baselines for all schools in our calculation of the funding floor for use in the local authority illustrative allocations. Figure 13 sets out the funding floor calculation steps and a worked example.
Figure 13 – calculation of the national funding formula funding floor for use in local authority illustrative allocations
Calculation step Description Example
1) APT adjusted baseline funding (definition set out in chapter 2)
We start with the APT adjusted baseline for each school, the 2016-17 schools baseline funding based on APT data only.
School C is an academy and has an APT adjusted baseline of £750,000.
2) Premises and mobility baseline funding (APT only) (definition set out in chapter 2)
We exclude premises and mobility baseline funding before calculating protections, as these factors are calculated and protected at local authority level.
School C has premises and mobility baseline funding of £3,000.
32
Calculation step Description Example
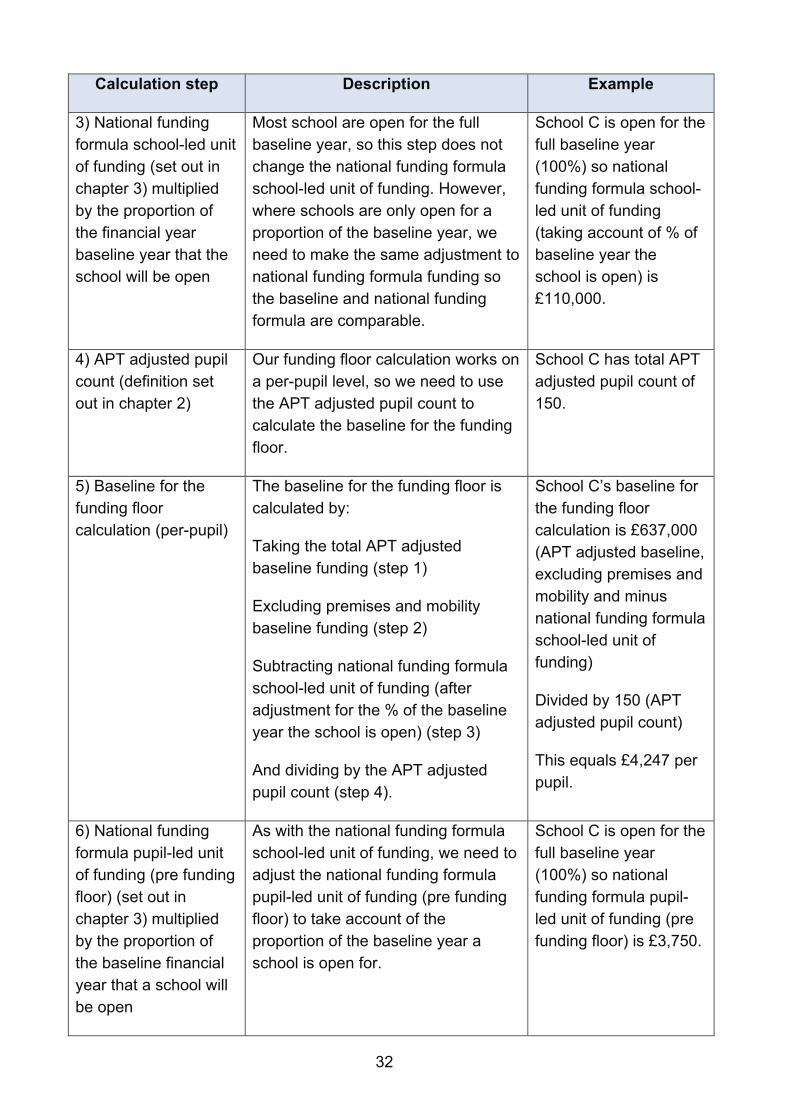
3) National funding formula school-led unit of funding (set out in chapter 3) multiplied by the proportion of the financial year baseline year that the school will be open
Most school are open for the full baseline year, so this step does not change the national funding formula school-led unit of funding. However, where schools are only open for a proportion of the baseline year, we need to make the same adjustment to national funding formula funding so the baseline and national funding formula are comparable.
School C is open for the full baseline year (100%) so national funding formula school-led unit of funding (taking account of % of baseline year the school is open) is £110,000.
4) APT adjusted pupil count (definition set out in chapter 2)
Our funding floor calculation works on a per-pupil level, so we need to use the APT adjusted pupil count to calculate the baseline for the funding floor.
School C has total APT adjusted pupil count of 150.
5) Baseline for the funding floor calculation (per-pupil)
The baseline for the funding floor is calculated by:
Taking the total APT adjusted baseline funding (step 1)
Excluding premises and mobility baseline funding (step 2)
Subtracting national funding formula school-led unit of funding (after adjustment for the % of the baseline year the school is open) (step 3)
And dividing by the APT adjusted pupil count (step 4).
School C’s baseline for the funding floor calculation is £637,000 (APT adjusted baseline, excluding premises and mobility and minus national funding formula school-led unit of funding)
Divided by 150 (APT adjusted pupil count)
This equals £4,247 per pupil.
6) National funding formula pupil-led unit of funding (pre funding floor) (set out in chapter 3) multiplied by the proportion of the baseline financial year that a school will be open
As with the national funding formula school-led unit of funding, we need to adjust the national funding formula pupil-led unit of funding (pre funding floor) to take account of the proportion of the baseline year a school is open for.
School C is open for the full baseline year (100%) so national funding formula pupil-led unit of funding (pre funding floor) is £3,750.
33
Calculation step Description Example
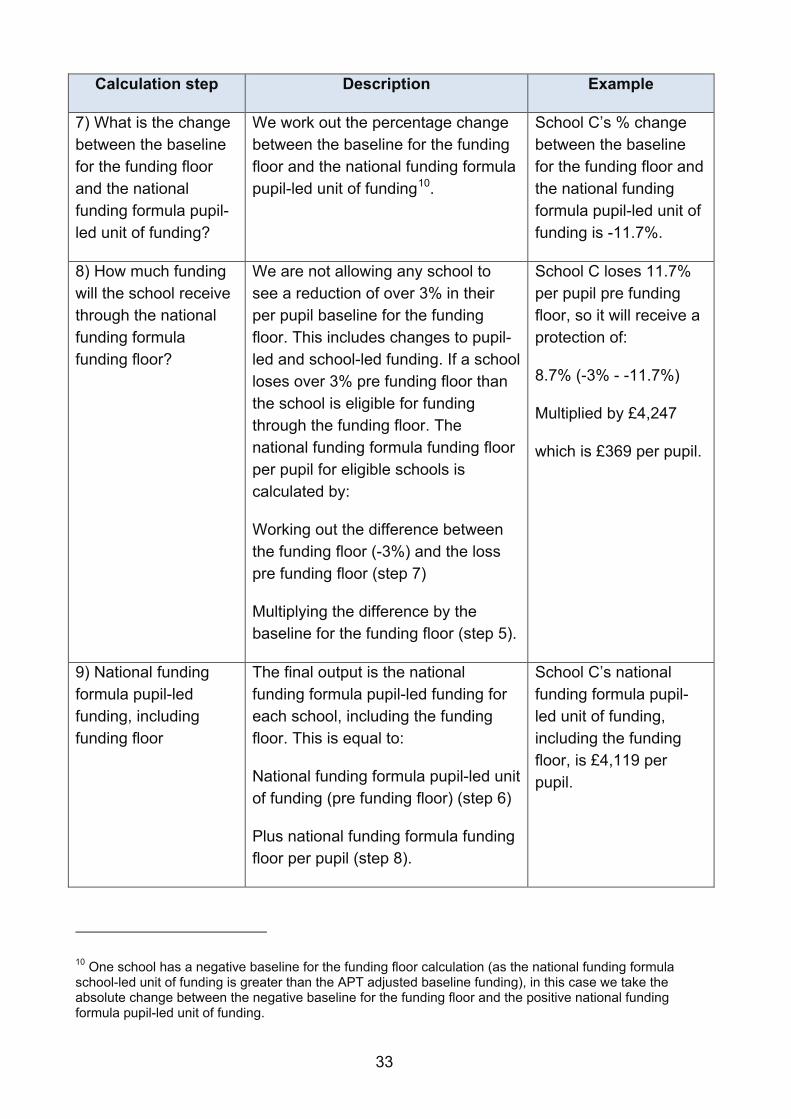
7) What is the change between the baseline for the funding floor and the national funding formula pupil-led unit of funding?
We work out the percentage change between the baseline for the funding floor and the national funding formula pupil-led unit of funding10.
School C’s % change between the baseline for the funding floor and the national funding formula pupil-led unit of funding is -11.7%.
8) How much funding will the school receive through the national funding formula funding floor?
We are not allowing any school to see a reduction of over 3% in their per pupil baseline for the funding floor. This includes changes to pupil-led and school-led funding. If a school loses over 3% pre funding floor than the school is eligible for funding through the funding floor. The national funding formula funding floor per pupil for eligible schools is calculated by:
Working out the difference between the funding floor (-3%) and the loss pre funding floor (step 7)
Multiplying the difference by the baseline for the funding floor (step 5).
School C loses 11.7% per pupil pre funding floor, so it will receive a protection of:
8.7% (-3% - -11.7%)
Multiplied by £4,247
which is £369 per pupil.
9) National funding formula pupil-led funding, including funding floor
The final output is the national funding formula pupil-led funding for each school, including the funding floor. This is equal to:
National funding formula pupil-led unit of funding (pre funding floor) (step 6)
Plus national funding formula funding floor per pupil (step 8).
School C’s national funding formula pupil-led unit of funding, including the funding floor, is £4,119 per pupil.
10 One school has a negative baseline for the funding floor calculation (as the national funding formula school-led unit of funding is greater than the APT adjusted baseline funding), in this case we take the absolute change between the negative baseline for the funding floor and the positive national funding formula pupil-led unit of funding.
34
Illustrative funding allocations for individual schools (APT and GAG)
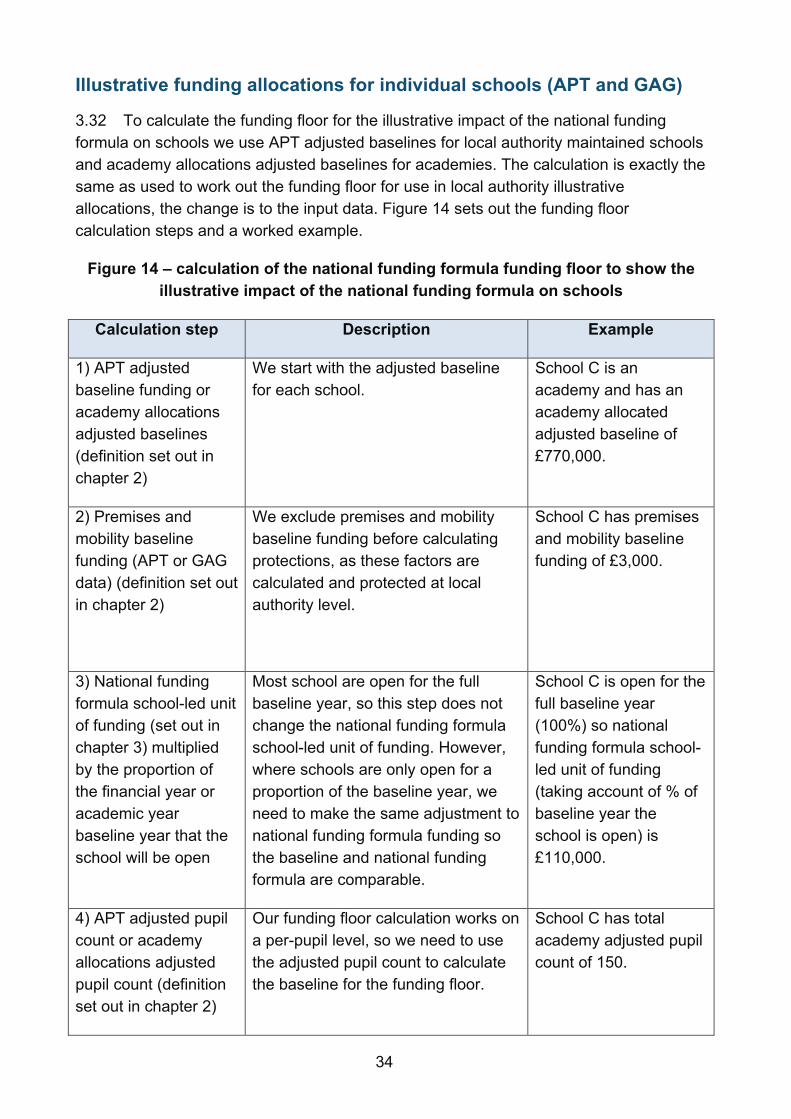
3.32 To calculate the funding floor for the illustrative impact of the national funding formula on schools we use APT adjusted baselines for local authority maintained schools and academy allocations adjusted baselines for academies. The calculation is exactly the same as used to work out the funding floor for use in local authority illustrative allocations, the change is to the input data. Figure 14 sets out the funding floor calculation steps and a worked example.
Figure 14 – calculation of the national funding formula funding floor to show the illustrative impact of the national funding formula on schools
Calculation step Description Example
1) APT adjusted baseline funding or academy allocations adjusted baselines (definition set out in chapter 2)
We start with the adjusted baseline for each school.
School C is an academy and has an academy allocated adjusted baseline of £770,000.
2) Premises and mobility baseline funding (APT or GAG data) (definition set out in chapter 2)
We exclude premises and mobility baseline funding before calculating protections, as these factors are calculated and protected at local authority level.
School C has premises and mobility baseline funding of £3,000.
3) National funding formula school-led unit of funding (set out in chapter 3) multiplied by the proportion of the financial year or academic year baseline year that the school will be open
Most school are open for the full baseline year, so this step does not change the national funding formula school-led unit of funding. However, where schools are only open for a proportion of the baseline year, we need to make the same adjustment to national funding formula funding so the baseline and national funding formula are comparable.
School C is open for the full baseline year (100%) so national funding formula school-led unit of funding (taking account of % of baseline year the school is open) is £110,000.
4) APT adjusted pupil count or academy allocations adjusted pupil count (definition set out in chapter 2)
Our funding floor calculation works on a per-pupil level, so we need to use the adjusted pupil count to calculate the baseline for the funding floor.
School C has total academy adjusted pupil count of 150.
35
Calculation step Description Example
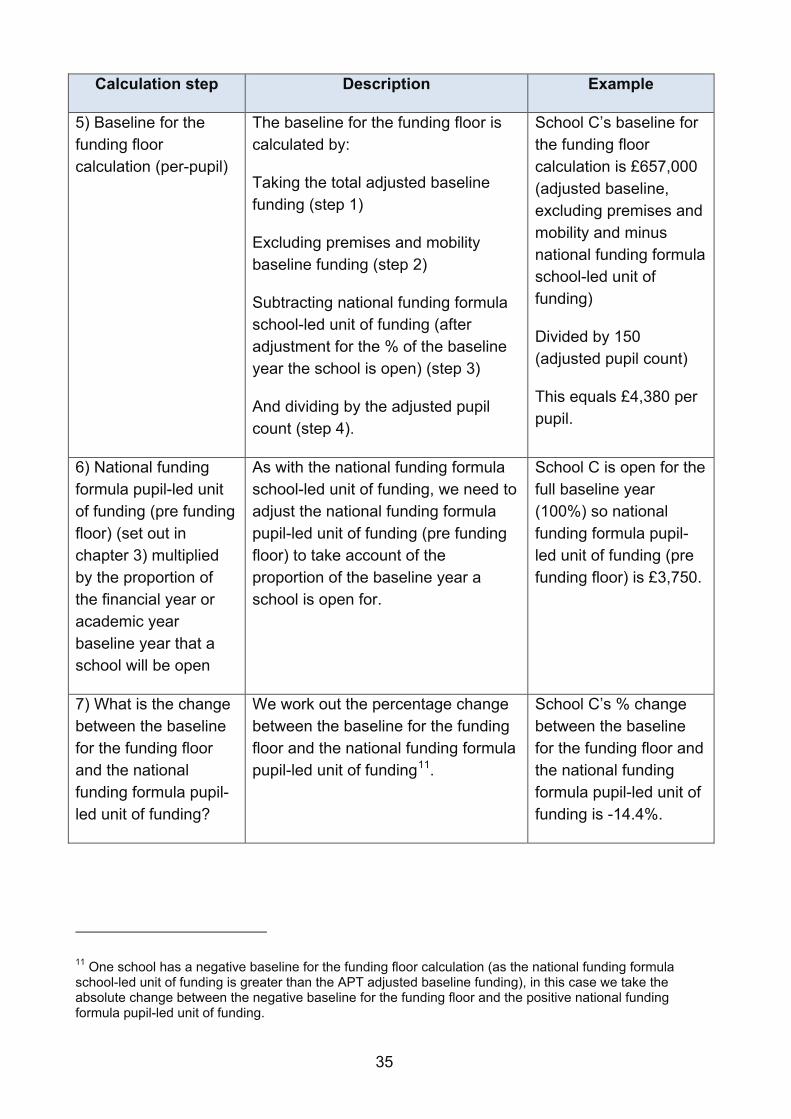
5) Baseline for the funding floor calculation (per-pupil)
The baseline for the funding floor is calculated by:
Taking the total adjusted baseline funding (step 1)
Excluding premises and mobility baseline funding (step 2)
Subtracting national funding formula school-led unit of funding (after adjustment for the % of the baseline year the school is open) (step 3)
And dividing by the adjusted pupil count (step 4).
School C’s baseline for the funding floor calculation is £657,000 (adjusted baseline, excluding premises and mobility and minus national funding formula school-led unit of funding)
Divided by 150 (adjusted pupil count)
This equals £4,380 per pupil.
6) National funding formula pupil-led unit of funding (pre funding floor) (set out in chapter 3) multiplied by the proportion of the financial year or academic year baseline year that a school will be open
As with the national funding formula school-led unit of funding, we need to adjust the national funding formula pupil-led unit of funding (pre funding floor) to take account of the proportion of the baseline year a school is open for.
School C is open for the full baseline year (100%) so national funding formula pupil-led unit of funding (pre funding floor) is £3,750.
7) What is the change between the baseline for the funding floor and the national funding formula pupil-led unit of funding?
We work out the percentage change between the baseline for the funding floor and the national funding formula pupil-led unit of funding11.
School C’s % change between the baseline for the funding floor and the national funding formula pupil-led unit of funding is -14.4%.
11 One school has a negative baseline for the funding floor calculation (as the national funding formula school-led unit of funding is greater than the APT adjusted baseline funding), in this case we take the absolute change between the negative baseline for the funding floor and the positive national funding formula pupil-led unit of funding.
36
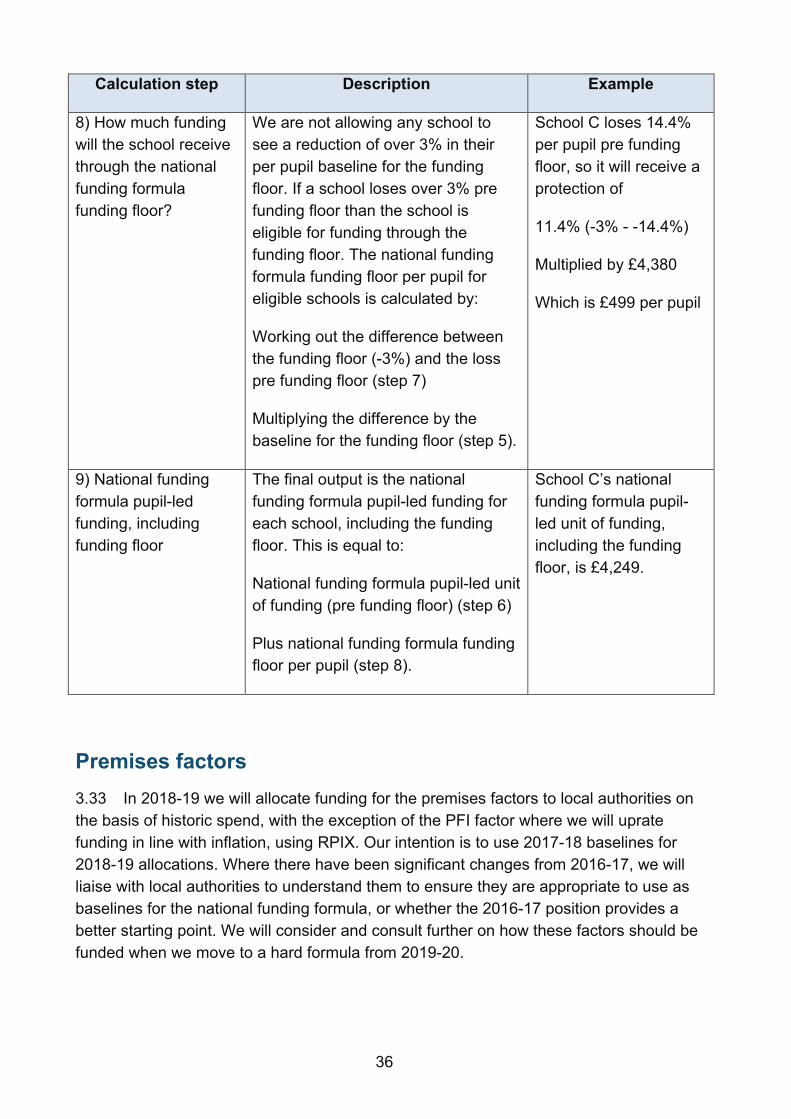
Calculation step Description Example
8) How much funding will the school receive through the national funding formula funding floor?
We are not allowing any school to see a reduction of over 3% in their per pupil baseline for the funding floor. If a school loses over 3% pre funding floor than the school is eligible for funding through the funding floor. The national funding formula funding floor per pupil for eligible schools is calculated by:
Working out the difference between the funding floor (-3%) and the loss pre funding floor (step 7)
Multiplying the difference by the baseline for the funding floor (step 5).
School C loses 14.4% per pupil pre funding floor, so it will receive a protection of
11.4% (-3% - -14.4%)
Multiplied by £4,380
Which is £499 per pupil
9) National funding formula pupil-led funding, including funding floor
The final output is the national funding formula pupil-led funding for each school, including the funding floor. This is equal to:
National funding formula pupil-led unit of funding (pre funding floor) (step 6)
Plus national funding formula funding floor per pupil (step 8).
School C’s national funding formula pupil-led unit of funding, including the funding floor, is £4,249.
Premises factors 3.33 In 2018-19 we will allocate funding for the premises factors to local authorities on the basis of historic spend, with the exception of the PFI factor where we will uprate funding in line with inflation, using RPIX. Our intention is to use 2017-18 baselines for 2018-19 allocations. Where there have been significant changes from 2016-17, we will liaise with local authorities to understand them to ensure they are appropriate to use as baselines for the national funding formula, or whether the 2016-17 position provides a better starting point. We will consider and consult further on how these factors should be funded when we move to a hard formula from 2019-20.
37
Local authority illustrative allocations (APT only)
3.34 For the local authority illustrative allocations we calculate and protect premises funding on a local authority level. There are three steps to the calculation:
a) We take the PFI premises factor baseline, as recorded on the 2016-17 APT12 and uplift in line with RPIX growth from April 2015 to April 2016 then
b) We take the premises factor baselines for all other factors (split-sites, rates, exceptional circumstances 1-6) and finally
c) Add the total through PFI and other factors together to give the national funding formula funding through the premises factors.
Illustrative funding allocations for individual schools (APT and GAG)
3.35 To show the illustrative impact of the national funding formula at a school level we have calculated national funding formula premises funding using 2016-17 APT data (for local authority maintained schools) and 2016/17 GAG data (for academies).
3.36 For local authority maintained schools we:
a) Take the PFI premises factor baseline, as recorded on the 2016-17 APT and uplift in line with RPIX growth from April 2015 to April 2016; then
b) Take the premises factor baselines for all other factors (split-sites, rates, exceptional circumstances 1-6); and
c) Add the total through PFI and other factors together to give the national funding formula funding through the premises factors.
d) If funding through the factors is negative (as some schools have negative premises factor baselines) we set the national funding formula premises factor to £0.
3.37 For academies we:
a) Take the PFI premises factor baseline, as recorded on the 2016/17 GAG and uplift in line with RPIX growth from April 2015 to April 2016; then
b) We take the premises factor baselines for all other factors (split-sites, exceptional circumstances 1-6); and
12 Including the additional post-16 PFI funding for Lancashire.
38
c) Add the total through PFI and other factors together to give the national funding formula funding through the premises factors.
d) If funding through the factors is negative (as some schools have negative premises factor baselines) we set the national funding formula premises factor to £0.
Mobility factor 3.38 In 2018-19 we will allocate funding for the mobility factor on the basis of historic spend. We want to work with stakeholders to explore options for an improved mobility factor from 2019-20, and we are seeking suggestions through this consultation.
Local authority illustrative allocations (APT only)
3.39 For local authority illustrative allocations the national funding formula mobility factor is equal to the mobility factor baseline (details set out in chapter 2).
Illustrative funding allocations for individual schools (APT and GAG)
3.40 To show the illustrative impact of the national funding formula at a school level the national funding formula mobility factor is equal to the mobility factor baseline (details set out in chapter 2).
Growth factor 3.41 The national funding formula will include a growth factor, so that it is responsive to significant changes to pupil numbers that are not recognised by lagged funding. In 2018-19 we will allocate funding for growth to local authorities on the basis of historic spend in line with our approach to the premises and mobility factors. The way we calculate historic spend for growth, however, is slightly different to other premises factors. In addition to the explicit funds for growth and falling rolls that local authorities can top-slice from their DSG, authorities often recognise growth by making adjustments to their schools’ data to reflect the number of pupils they expect to arrive at individual schools. We have added this ‘implicit’ growth to each authority’s explicit spend to determine their total growth funding in 2018-19. The stage 2 consultation sets out our proposals for a longer term approach to funding the growth factor, using lagged growth data.
Local authority illustrative allocations (APT only)
3.42 For local authority illustrative allocations the national funding formula growth factor is equal to the growth factor baseline (details set out in chapter 2).
39
Illustrative funding allocations for individual schools (APT and GAG)
3.43 We do not illustrate the impact of the national funding formula on explicit growth funding at a school level. We illustrate the impact of the national funding formula on implicit growth by using the adjusted pupil count (which includes local authority adjustments for growth as set out in chapter 2) to calculate the total funding under the national funding formula for each school.
40
Chapter 4: National funding formula illustrative allocations to local authorities 4.1 As part of the consultation we have published the illustrative impact of the national funding formula on local authorities – these illustrations set out baseline funding, the illustrative impact of the impact once formula has been fully implemented and the illustrative impact of the national funding formula in year 1.
Baseline funding 4.2 The baseline funding for each local authority is based on data captured in the 2016-17 APT and baselines exercise and is split in to four components, details are set out in chapter 2.
Funding under the national funding formula, if the national funding formula had been implemented in full in 2016-17
4.3 To calculate the total illustrative funding once all schools in all local authorities are on formula we take the formula output for each component and add together:
a) Core schools funding – calculated at a school level.
For each school we:
i. Take the national funding formula pupil-led funding, including funding floor (based on APT data only, details set out in Figure 13) and multiply by the schools block census count as recorded in October 201513. We use the October 2015 schools block census count as we allocate core schools funding to local authorities based on lagged pupil numbers. Funding for growth will be allocated separately under the national funding formula.
ii. Add the national funding formula school-led funding (details set out in chapter 3) to give a core schools funding total for each school.
Then for each local authority we aggregate up all the school level totals to calculate the total core schools funding for each local authority.
b) Premises funding – calculated at local authority level.
13 For schools that were not open in October 2015 we use the APT adjusted pupil count, as set out in chapter 2
41
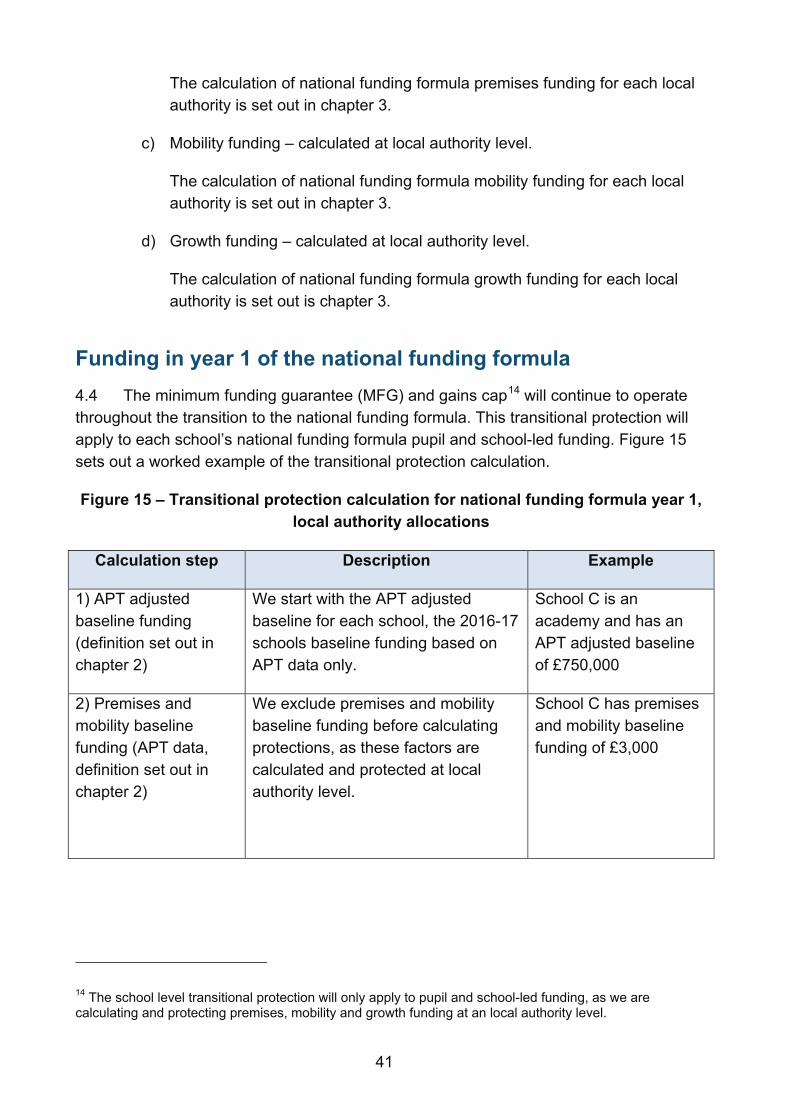
The calculation of national funding formula premises funding for each local authority is set out in chapter 3.
c) Mobility funding – calculated at local authority level.
The calculation of national funding formula mobility funding for each local authority is set out in chapter 3.
d) Growth funding – calculated at local authority level.
The calculation of national funding formula growth funding for each local authority is set out is chapter 3.
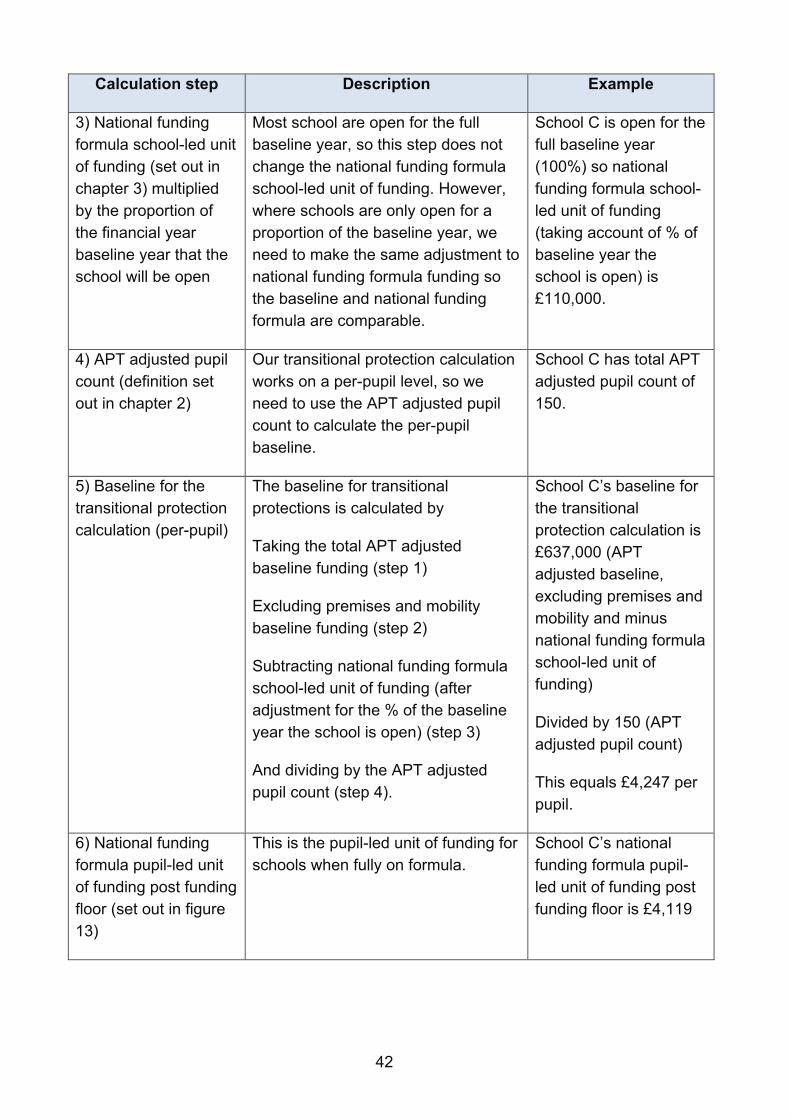
Funding in year 1 of the national funding formula 4.4 The minimum funding guarantee (MFG) and gains cap14 will continue to operate throughout the transition to the national funding formula. This transitional protection will apply to each school’s national funding formula pupil and school-led funding. Figure 15 sets out a worked example of the transitional protection calculation.
Figure 15 – Transitional protection calculation for national funding formula year 1, local authority allocations
Calculation step Description Example
1) APT adjusted baseline funding (definition set out in chapter 2)
We start with the APT adjusted baseline for each school, the 2016-17 schools baseline funding based on APT data only.
School C is an academy and has an APT adjusted baseline of £750,000
2) Premises and mobility baseline funding (APT data, definition set out in chapter 2)
We exclude premises and mobility baseline funding before calculating protections, as these factors are calculated and protected at local authority level.
School C has premises and mobility baseline funding of £3,000
14 The school level transitional protection will only apply to pupil and school-led funding, as we are calculating and protecting premises, mobility and growth funding at an local authority level.
42
Calculation step Description Example
3) National funding formula school-led unit of funding (set out in chapter 3) multiplied by the proportion of the financial year baseline year that the school will be open
Most school are open for the full baseline year, so this step does not change the national funding formula school-led unit of funding. However, where schools are only open for a proportion of the baseline year, we need to make the same adjustment to national funding formula funding so the baseline and national funding formula are comparable.
School C is open for the full baseline year (100%) so national funding formula school-led unit of funding (taking account of % of baseline year the school is open) is £110,000.
4) APT adjusted pupil count (definition set out in chapter 2)
Our transitional protection calculation works on a per-pupil level, so we need to use the APT adjusted pupil count to calculate the per-pupil baseline.
School C has total APT adjusted pupil count of 150.
5) Baseline for the transitional protection calculation (per-pupil)
The baseline for transitional protections is calculated by
Taking the total APT adjusted baseline funding (step 1)
Excluding premises and mobility baseline funding (step 2)
Subtracting national funding formula school-led unit of funding (after adjustment for the % of the baseline year the school is open) (step 3)
And dividing by the APT adjusted pupil count (step 4).
School C’s baseline for the transitional protection calculation is £637,000 (APT adjusted baseline, excluding premises and mobility and minus national funding formula school-led unit of funding)
Divided by 150 (APT adjusted pupil count)
This equals £4,247 per pupil.
6) National funding formula pupil-led unit of funding post funding floor (set out in figure 13)
This is the pupil-led unit of funding for schools when fully on formula.
School C’s national funding formula pupil-led unit of funding post funding floor is £4,119
43
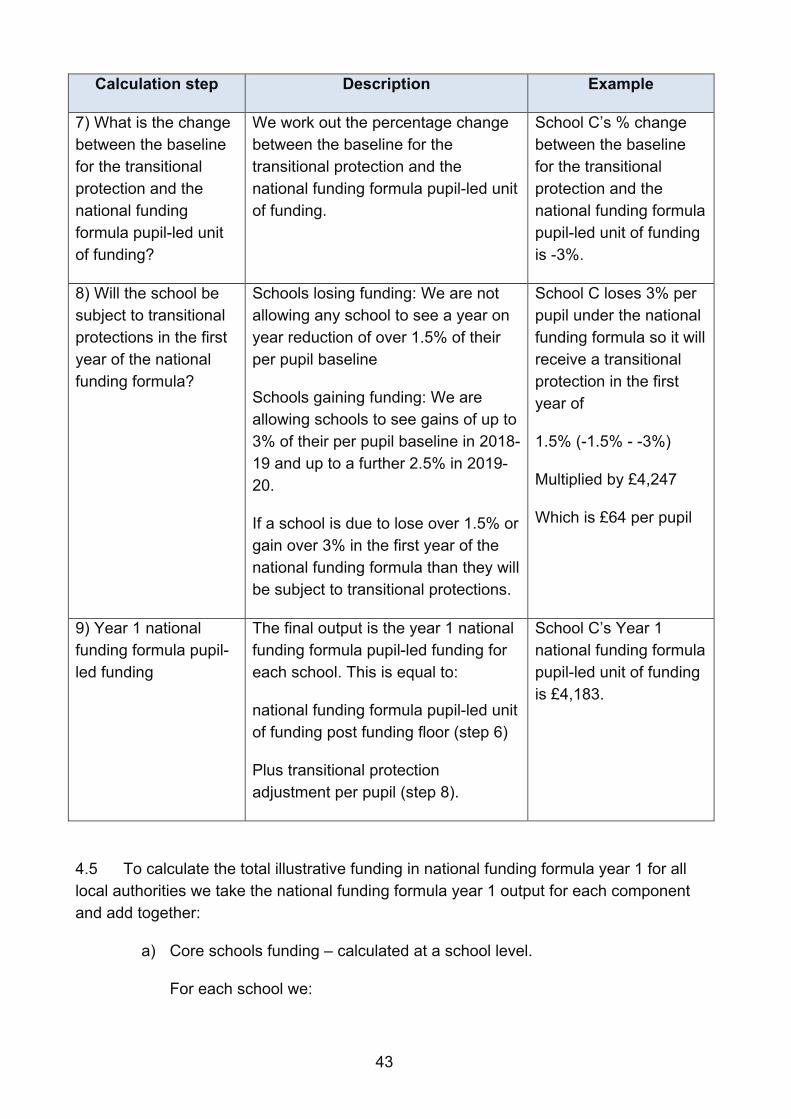
Calculation step Description Example
7) What is the change between the baseline for the transitional protection and the national funding formula pupil-led unit of funding?
We work out the percentage change between the baseline for the transitional protection and the national funding formula pupil-led unit of funding.
School C’s % change between the baseline for the transitional protection and the national funding formula pupil-led unit of funding is -3%.
8) Will the school be subject to transitional protections in the first year of the national funding formula?
Schools losing funding: We are not allowing any school to see a year on year reduction of over 1.5% of their per pupil baseline
Schools gaining funding: We are allowing schools to see gains of up to 3% of their per pupil baseline in 2018-19 and up to a further 2.5% in 2019-20.
If a school is due to lose over 1.5% or gain over 3% in the first year of the national funding formula than they will be subject to transitional protections.
School C loses 3% per pupil under the national funding formula so it will receive a transitional protection in the first year of
1.5% (-1.5% - -3%)
Multiplied by £4,247
Which is £64 per pupil
9) Year 1 national funding formula pupil-led funding
The final output is the year 1 national funding formula pupil-led funding for each school. This is equal to:
national funding formula pupil-led unit of funding post funding floor (step 6)
Plus transitional protection adjustment per pupil (step 8).
School C’s Year 1 national funding formula pupil-led unit of funding is £4,183.
4.5 To calculate the total illustrative funding in national funding formula year 1 for all local authorities we take the national funding formula year 1 output for each component and add together:
a) Core schools funding – calculated at a school level.
For each school we:
44
i. Take the year 1 national funding formula pupil-led funding (based on APT data only and set out in figure 15) and multiply by the schools block census count as recorded in October 201515. We use the October 2015 schools block census count as we allocate core schools funding to local authorities based on lagged pupil numbers. Funding for growth will be allocated separately under the national funding formula.
ii. Add the national funding formula school-led funding to give a core schools funding total for each school (details set out in chapter 3).
Then for each local authority we aggregate up all the school level totals to calculate the total core schools funding for each local authority.
b) Premises funding – calculated at local authority level.
The calculation of national funding formula premises funding for each local authority is set out in chapter 3.
c) Mobility funding – calculated at local authority level.
The calculation of national funding formula mobility funding for each local authority is set out in chapter 3.
d) Growth funding – calculated at local authority level.
The calculation of national funding formula growth funding for each local authority is set out in chapter 3.
15 For schools that were not open in October 2015 we use the APT adjusted pupil count, as set out in chapter 2
45
Chapter 5: Calculating illustrative funding allocations for individual schools using the proposed national funding formula 5.1 As part of the consultation we have also published illustrative national funding formula funding allocations for individual schools – these illustrations set out baseline funding, the illustrative impact of the impact once formula has been fully implemented and the illustrative impact of the national funding formula in year 1.
5.2 In order to illustrate the impact of the proposed national funding formula, we compare the funding schools received in 2016-17 (or 2016/17) to their illustrative national funding formula funding if the formula was implemented in full in 2016-17 (or 2016/17) without any transitional protections. So that we are comparing like with like, we make a number of technical adjustments to 2016-17 (or 2016/17) baselines to take into account changes we are making to the funding system as part of the national funding formula.
Baseline funding 5.3 The baseline funding for each school is either the APT adjusted baseline (for local authority maintained schools) or the academy allocations adjusted baseline (for academies), set out in chapter 2.
Funding under the national funding formula, if the national funding formula had been implemented in full in 2016-17
5.4 To calculate the total illustrative funding once all schools are on the national funding formula we:
a) Take the national funding formula pupil-led funding, post funding floor (set out in figure 14), and multiply by the adjusted pupil count (APT adjusted for local authority maintained schools and academy allocations adjusted for academies);
b) Add the national funding formula school-led funding (details set out in chapter 3);
c) Add the national funding formula premises factors (details set out in chapter 3, based on APT data for local authority maintained schools and GAG data for academies);
d) Add the national funding formula mobility factor (details set out in chapter 3, based on APT data for local authority maintained schools and GAG data for academies).
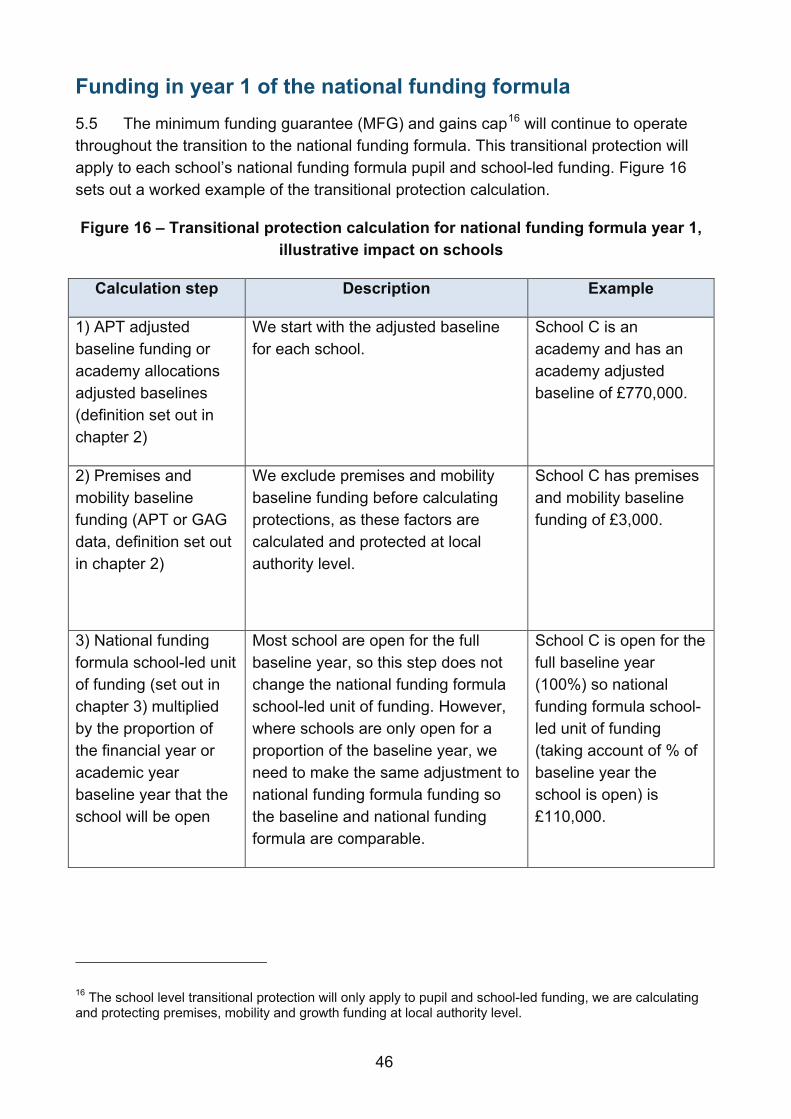
46
Funding in year 1 of the national funding formula 5.5 The minimum funding guarantee (MFG) and gains cap16 will continue to operate throughout the transition to the national funding formula. This transitional protection will apply to each school’s national funding formula pupil and school-led funding. Figure 16 sets out a worked example of the transitional protection calculation.
Figure 16 – Transitional protection calculation for national funding formula year 1, illustrative impact on schools
Calculation step Description Example
1) APT adjusted baseline funding or academy allocations adjusted baselines (definition set out in chapter 2)
We start with the adjusted baseline for each school.
School C is an academy and has an academy adjusted baseline of £770,000.
2) Premises and mobility baseline funding (APT or GAG data, definition set out in chapter 2)
We exclude premises and mobility baseline funding before calculating protections, as these factors are calculated and protected at local authority level.
School C has premises and mobility baseline funding of £3,000.
3) National funding formula school-led unit of funding (set out in chapter 3) multiplied by the proportion of the financial year or academic year baseline year that the school will be open
Most school are open for the full baseline year, so this step does not change the national funding formula school-led unit of funding. However, where schools are only open for a proportion of the baseline year, we need to make the same adjustment to national funding formula funding so the baseline and national funding formula are comparable.
School C is open for the full baseline year (100%) so national funding formula school-led unit of funding (taking account of % of baseline year the school is open) is £110,000.
16 The school level transitional protection will only apply to pupil and school-led funding, we are calculating and protecting premises, mobility and growth funding at local authority level.
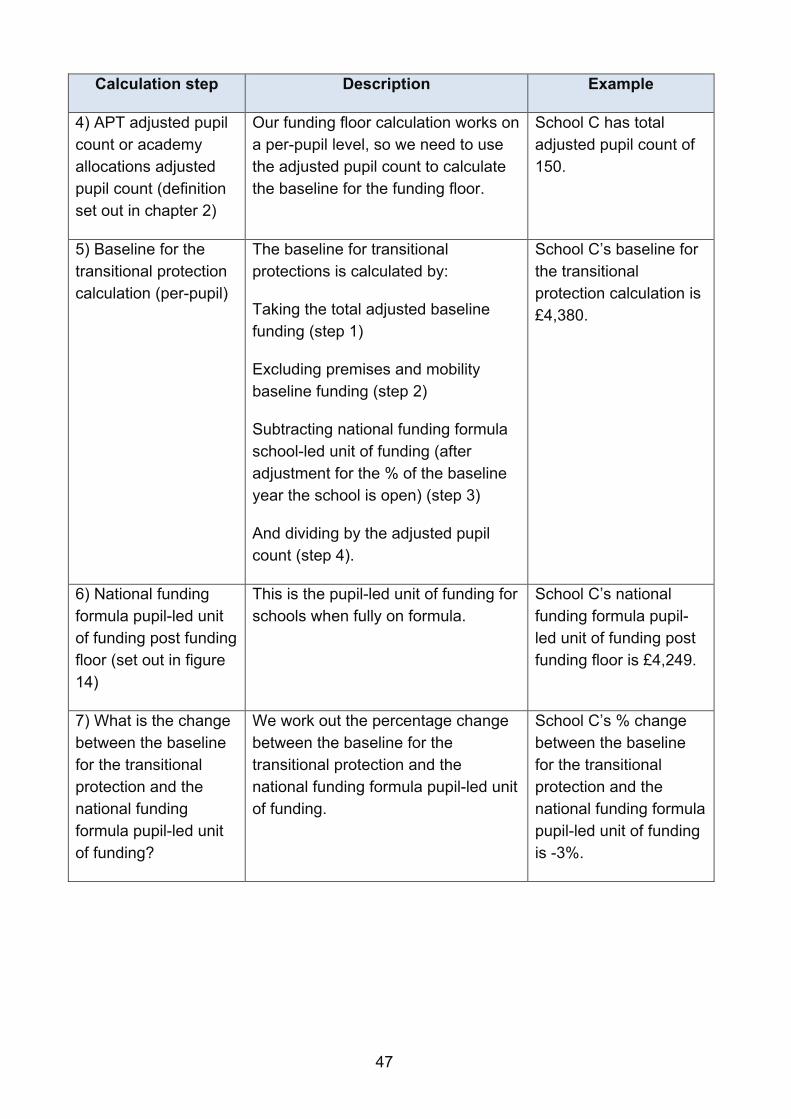
47
Calculation step Description Example
4) APT adjusted pupil count or academy allocations adjusted pupil count (definition set out in chapter 2)
Our funding floor calculation works on a per-pupil level, so we need to use the adjusted pupil count to calculate the baseline for the funding floor.
School C has total adjusted pupil count of 150.
5) Baseline for the transitional protection calculation (per-pupil)
The baseline for transitional protections is calculated by:
Taking the total adjusted baseline funding (step 1)
Excluding premises and mobility baseline funding (step 2)
Subtracting national funding formula school-led unit of funding (after adjustment for the % of the baseline year the school is open) (step 3)
And dividing by the adjusted pupil count (step 4).
School C’s baseline for the transitional protection calculation is £4,380.
6) National funding formula pupil-led unit of funding post funding floor (set out in figure 14)
This is the pupil-led unit of funding for schools when fully on formula.
School C’s national funding formula pupil-led unit of funding post funding floor is £4,249.
7) What is the change between the baseline for the transitional protection and the national funding formula pupil-led unit of funding?
We work out the percentage change between the baseline for the transitional protection and the national funding formula pupil-led unit of funding.
School C’s % change between the baseline for the transitional protection and the national funding formula pupil-led unit of funding is -3%.
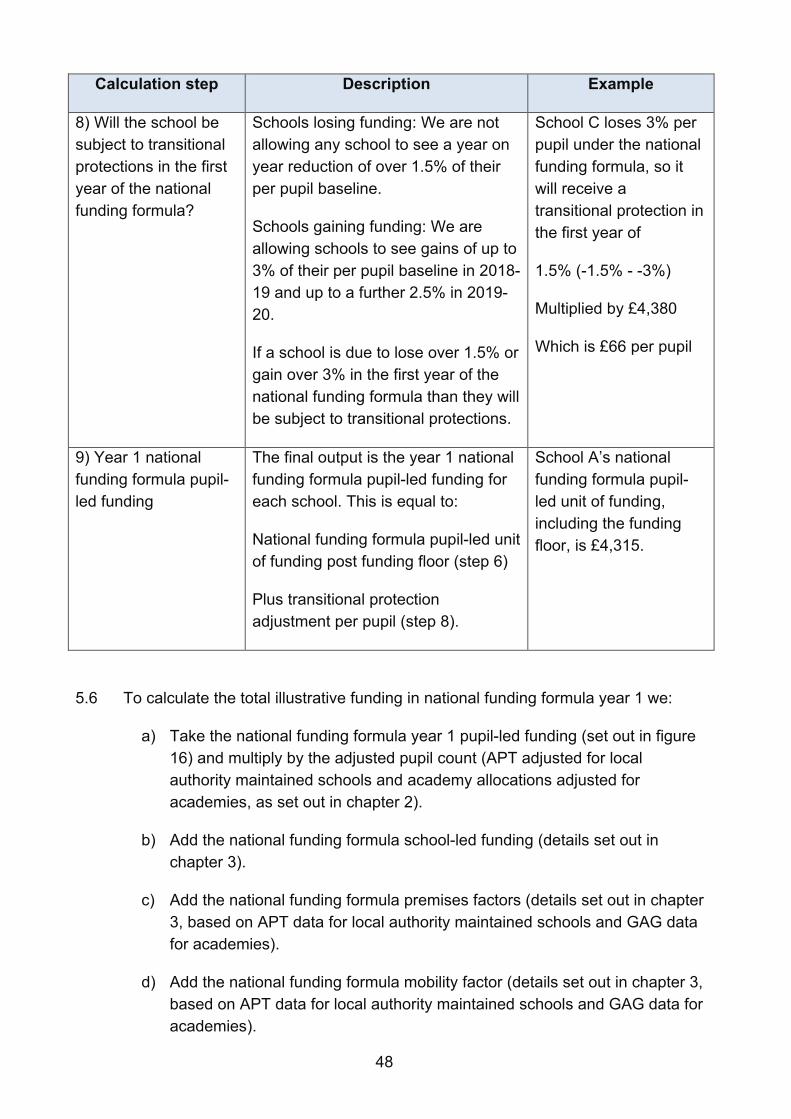
48
Calculation step Description Example
8) Will the school be subject to transitional protections in the first year of the national funding formula?
Schools losing funding: We are not allowing any school to see a year on year reduction of over 1.5% of their per pupil baseline.
Schools gaining funding: We are allowing schools to see gains of up to 3% of their per pupil baseline in 2018-19 and up to a further 2.5% in 2019-20.
If a school is due to lose over 1.5% or gain over 3% in the first year of the national funding formula than they will be subject to transitional protections.
School C loses 3% per pupil under the national funding formula, so it will receive a transitional protection in the first year of
1.5% (-1.5% - -3%)
Multiplied by £4,380
Which is £66 per pupil
9) Year 1 national funding formula pupil-led funding
The final output is the year 1 national funding formula pupil-led funding for each school. This is equal to:
National funding formula pupil-led unit of funding post funding floor (step 6)
Plus transitional protection adjustment per pupil (step 8).
School A’s national funding formula pupil-led unit of funding, including the funding floor, is £4,315.
5.6 To calculate the total illustrative funding in national funding formula year 1 we:
a) Take the national funding formula year 1 pupil-led funding (set out in figure 16) and multiply by the adjusted pupil count (APT adjusted for local authority maintained schools and academy allocations adjusted for academies, as set out in chapter 2).
b) Add the national funding formula school-led funding (details set out in chapter 3).
c) Add the national funding formula premises factors (details set out in chapter 3, based on APT data for local authority maintained schools and GAG data for academies).
d) Add the national funding formula mobility factor (details set out in chapter 3, based on APT data for local authority maintained schools and GAG data for academies).
49
Annexes
Annex A: Additional area cost adjustment (ACA) information, calculation of the teacher pay cost adjustment A.1 The methodology for the teacher pay element of the national funding formula ACA is designed to bring out the differences in pay ranges between the four regional pay bands (Inner London, Outer London, Fringe and Rest of England), but not to reflect any regional differences in distribution along the pay ranges. We do not want the teacher pay cost adjustment to reflect regional differences in staffing choices, we only want it to reflect the differences in pay ranges between the four regional pay bands. E.g. If in Inner London there are fewer teachers in the leadership grade compared to the national average we do not want this to skew the teacher pay cost adjustment.
A.2 The notional average salary for each pay band is calculated by transforming the basic pay of each teacher in England from the teacher’s actual pay band to the pay band in question and then taking the mean. This method means that we reflect the national distribution along the pay ranges in the teacher pay cost adjustment, rather than regional distributions.
A.3 The basic pay is the gross salary minus allowances (allowances are classified into teaching and learning responsibilities, special educational needs, recruitment and retention and other).
A.4 The calculation used to transform the basic pay of each teacher in England from the teacher’s actual pay band to the pay band in question is set out in an example below. This transformation is repeated for all teachers and all regional pay bands. E.g. The transformation to Inner London notional basic pay for a teacher who is actually in, say, the Rest of England, is calculated as follows:
a) First, calculate the difference between the actual basic pay for the teacher and the bottom of the teacher’s actual pay range (the Rest of England range in this case) for this teacher’s grade (leadership, leading practitioner, upper pay range, main pay range or unqualified teacher). The pay ranges are as defined in the School Teachers’ Pay and Conditions Document (STPCD) for the relevant year (e.g. STPCD 2015 if November 2015 salaries are used).
b) Then calculate the difference between the top and bottom of the Inner London pay range for this teacher’s grade and divide by the difference between the top and bottom of the teacher’s actual pay range (the Rest of England in this case). This gives an uplift which is used to convert the teacher’s actual basic pay to their Inner London notional basic pay.
50
c) Apply the uplift calculated in step b to the distance from the bottom of the pay range to the teacher’s actual basic pay, calculated in step a.
d) Add the figure calculated in step c to the bottom of the pay range for Inner London for this teacher’s grade. This gives the Inner London notional pay for this teacher.
A.5 The following groups of staff are included in our calculation of the ACA teachers’ pay cost adjustment:
a) Qualified and unqualified teachers
b) Full-time and part-time teachers
c) Classroom teachers and leaders
d) Teachers in primary, secondary and special schools.
A.6 The following groups of staff are not included in our calculation of the ACA teachers’ pay cost adjustment:
a) Centrally employed teachers
b) Supply teachers
c) Teachers with incomplete or unreliable pay data
A.7 The following caveats apply:
a) Data is collected in the School Workforce Census in early November each year, at a time when not all schools have held pay determination meetings for their teachers. This means that salaries of some teachers reflect the previous academic year.
b) Approximately 1-2% of schools do not provide School Workforce Census data each year.
A.8 The teachers’ specific cost adjustment (SCA) for each regional pay band is calculated by dividing the mean notional basic pay for that pay band by the mean notional basic pay for the Rest of England pay band.
A.9 The non-teacher pay element of the national funding formula ACA is based on the general labour market specific labour cost adjustment calculated by the Department for Communities and Local Government for 2013-14.
A.10 The teacher and non-teaching staff elements of the national funding formula ACA are weighted in proportion to actual expenditure on teaching and non-teaching staff in primary and secondary schools.
51
A.11 The national teacher proportion is the total expenditure on teachers divided by total expenditure on teachers, non-teaching staff and non-pay combined. The non-teaching staff proportion is total expenditure on non-teaching staff divided by total expenditure on teachers, non-teaching staff and non-pay combined.
52
© Crown copyright 2016
This publication (not including logos) is licensed under the terms of the Open Government Licence v3.0 except where otherwise stated. Where we have identified any third party copyright information you will need to obtain permission from the copyright holders concerned.
To view this licence: visit www.nationalarchives.gov.uk/doc/open-government-licence/version/3 email [email protected] write to Information Policy Team, The National Archives, Kew, London, TW9 4DU
About this publication: enquiries www.education.gov.uk/contactus download www.gov.uk/government/publications
Reference: DFE-00366-2016
Follow us on Twitter: @educationgovuk
Like us on Facebook: facebook.com/educationgovuk